Embed Size (px)
Citation preview
better together... we deliver
annual financial statements 30 June 2013
cont
ents
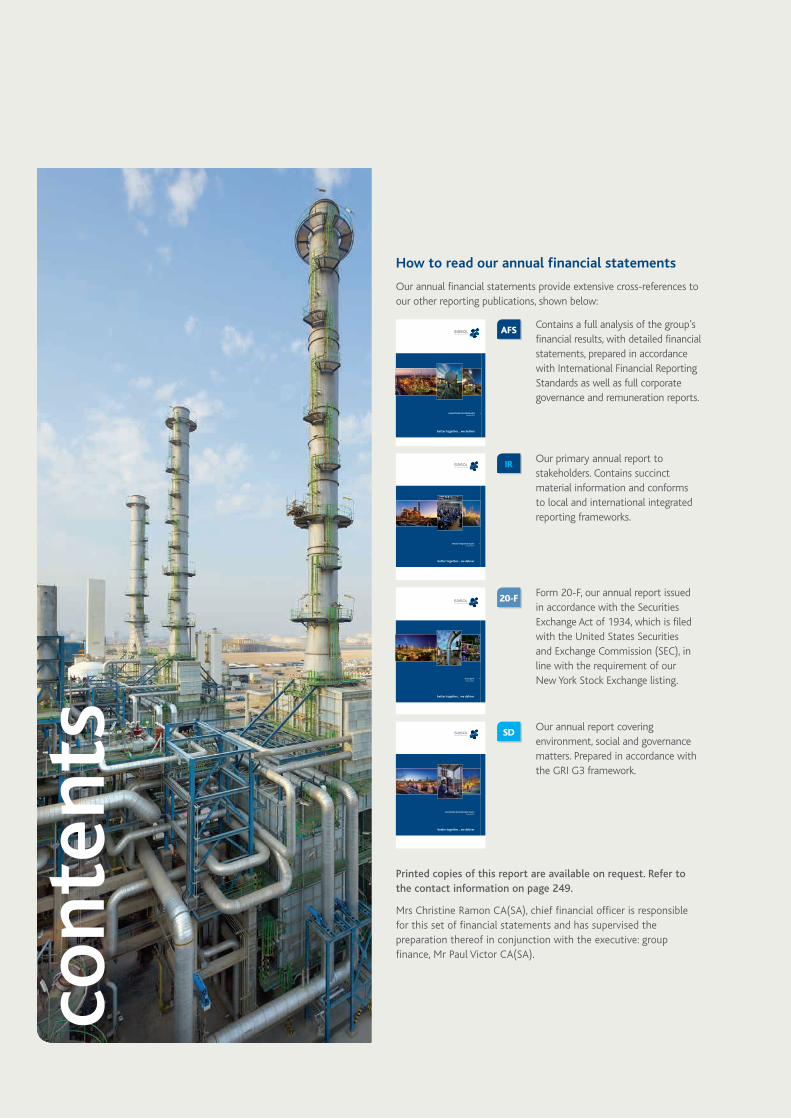
Our annual financial statements provide extensive cross-references to our other reporting publications, shown below:
Form 20-F, our annual report issued in accordance with the Securities Exchange Act of 1934, which is filed with the United States Securities and Exchange Commission (SEC), in line with the requirement of our New York Stock Exchange listing.
20-F
Contains a full analysis of the group’s financial results, with detailed financial statements, prepared in accordance with International Financial Reporting Standards as well as full corporate governance and remuneration reports.
AFS
SD Our annual report covering environment, social and governance matters. Prepared in accordance with the GRI G3 framework.
IR Our primary annual report to stakeholders. Contains succinct material information and conforms to local and international integrated reporting frameworks.
How to read our annual financial statements
Printed copies of this report are available on request. Refer to the contact information on page 249.
Mrs Christine Ramon CA(SA), chief financial officer is responsible for this set of financial statements and has supervised the preparation thereof in conjunction with the executive: group finance, Mr Paul Victor CA(SA).
Sasol annual integrated report 30 June 2013
IR
better together... we deliver
annual integrated report 30 June 2013
20mm
Sasol annual financial statements 30 June 2013
www.sasol.com better together... we deliver
annual financial statements 30 June 2013
AFS
23mm
www.sasol.com better together... we deliver
Form 20-F 30 June 2013
Form 20-F 30 June 2013
20-F
Sasol sustainable development report 30 June 2013
better together... we deliver
sustainable development report 30 June 2013
Saso
l Lim
ited
com
pany
note
s to
the
fina
ncia
l sta
tem
ents
Saso
l Lim
ited
grou
p co
nsol
idat
ed fi
nanc
ial s
tate
men
tsSa
sol o
verv
iew
1
01
2 Chief financial officer’s review
27 Corporate governance
38 Eleven year financial performance
40 Key performance indicators
46 Value added statement
47 Monetary exchanges with governments
48 Audit committee report
51 Approval of the financial statements
51 Certificate of the company secretary
52 Report of the independent auditor
53 Shareholders’ information
53 Share ownership
55 Directors’ report
57 Remuneration report
80 Accounting policies and financial reporting terms
98 Statement of financial position
100 Income statement
100 Statement of comprehensive income
102 Statement of financial position (US dollar convenience translation)
103 Income statement (US dollar convenience translation)
104 Statement of changes in equity
106 Statement of cash flows
108 Business segment information
114 Geographic information
117 Changes to comparative information
117 Non-current assets
134 Current assets
140 Non-current liabilities
161 Current liabilities
164 Results of operations
176 Equity structure
197 Liquidity and capital resources
203 Other disclosures
233 Statement of financial position
233 Income statement
234 Statement of comprehensive income
234 Statement of changes in equity
235 Statement of cash flows
236 Notes to the financial statements
246 Interest in significant operating subsidiaries and incorporated joint ventures
249 Contact information
Sasol overview
02Sasol Limited group consolidated financial statements
03Notes to the financial statements
04Sasol Limited company
Christine Ramon, chief financial officer
better together... means delivering on our financial priorities
chief financial officer’s review
2
Saso
l ann
ual fi
nanc
ial s
tate
men
ts 2
013
AFS
Saso
l Lim
ited
com
pany
note
s to
the
fina
ncia
l sta
tem
ents
Saso
l Lim
ited
grou
p co
nsol
idat
ed fi
nanc
ial s
tate
men
tsSa
sol o
verv
iew
3
1 Introduction
The 2013 financial year has been challenging, yet rewarding. Sasol has delivered strong results, underpinned by the continued focus on operational efficiencies, delivering better than expected volumes from Sasol Synfuels. Cost containment and margin improvement remain challenging, especially in light of the pressures in the South African environment and the continued volatile macroeconomic environment. During the year, we refined our strategy ensuring that we continue to nurture and grow our foundation businesses and making progress on our growth projects. These actions position Sasol well to deliver on its stakeholder value proposition – being a growing company with a strong pipeline of growth projects, supported by talented, high performing employees around the world, and underpinned by a strong financial position. We have also been able to contribute significantly to the South African economy, through the payment of direct and indirect taxes, as well as to the socio-economic upliftment of the areas in which we operate, by contributing to our communities and undertaking environmental initiatives. Refer to our annual integrated report and sustainable development report for further details on these aspects.
This review is intended to provide our stakeholders with further insight into the financial performance and position of the group. Our primary financial focus is on managing our margins, cash, gearing and return on equity, within the context of the environment in which we operate. Stakeholders are advised to read this review in conjunction with the consolidated annual financial statements presented on pages 55 to 248.
2 Key financial risks and uncertainties affecting our performance
The world is still recovering from the global economic crisis of 2008. While growth in more mature economies is picking up, it is at a slower than expected pace. Economic issues persist in a number of regions: the European financial crisis deepened in the 2012 calendar year, in the United States (US), recovery has been weak coupled with the ‘fiscal cliff’, and in Asia, the economies are still grappling with the effects of natural disasters. However, energy consumption in emerging markets continues to increase on the back of long-term economic growth prospects. This bodes well for commodity prices, but we continue to see significant oil and gas price and commodity volatility.
In order to appreciate the impact of these events on our business, it is important to understand those factors that affect the delivery of our results.
a. Current economic climate and its impact on Sasol Sasol operates in a number of countries across the globe including Sub-Saharan Africa, Europe, the Asia-Pacific region, North
America and the Middle East. As such, developments in the global economy have a significant impact on our business.
During the 2012 calendar year, the global economic recovery evolved largely in line with our expectations. Economic growth remained fragile and unbalanced, with emerging markets generally outperforming the advanced economies. According to the International Monetary Fund’s (IMF) July 2013 World Economic Outlook update, emerging market and developing economies grew by 4,9% in the 2012 calendar year, while gross domestic product (GDP) growth in the advanced economies managed only 1,2% over the same period. Overall, the global economy grew by 3,1% in the 2012 calendar year, down from the previous calendar year’s 3,9% growth.
From early in the 2012 calendar year, three main downside growth risks dominated the global outlook, but most of these risks receded as the year progressed. The risk of a euro area break-up and the knock-on effects that it may have had on the global economy eased, following remarks from the European Central Bank (ECB) president that he would ‘do whatever it takes’ to preserve the currency union. A second risk related to fears that policymakers in the US would not reach a compromise on tax
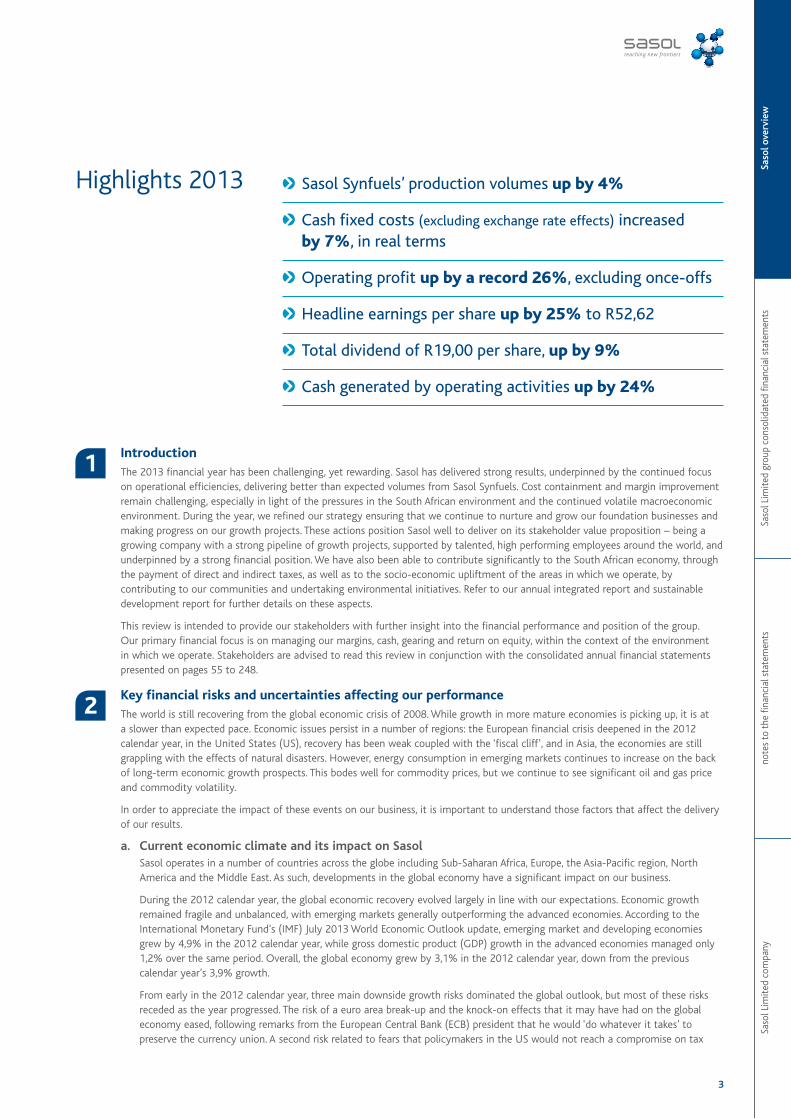
Sasol Synfuels’ production volumes up by 4%
Cash fixed costs (excluding exchange rate effects) increased by 7%, in real terms
Operating profit up by a record 26%, excluding once-offs
Headline earnings per share up by 25% to R52,62
Total dividend of R19,00 per share, up by 9%
Cash generated by operating activities up by 24%
Highlights 2013
4
Saso
l ann
ual fi
nanc
ial s
tate
men
ts 2
013
AFS
Sasol Limited group
and expenditure adjustments, which faded as policymakers avoided the ‘fiscal cliff’ early in the 2013 calendar year. The third risk related to Chinese economic growth that slowed in the first half of the 2012 calendar year, raising the probability of a so-called economic ‘hard landing’. However, towards the end of that year, growth picked up and the probability of a ‘hard landing’ scenario decreased.
While some of last year’s downside growth risks to the global economic recovery have faded, they have not disappeared and a new risk has emerged. Following weaker-than-expected Chinese macroeconomic indicator releases during the first half of the 2013 calendar year and comments from policymakers on anticipated growth rates, market fears of a potential ‘hard landing’ are resurfacing. Recently, the Federal Reserve in the US has hinted at a gradual withdrawal of quantitative easing (QE) should the economy recover in line with expectations. While it is not clear what the potential impact or long term unintended consequences of QE will be, mention of an end to QE has already contributed to financial market volatility and questions being raised on the impact of potential capital flow reversals on emerging market economic prospects.
Bearing these downside global economic growth risks in mind, it is anticipated that the economic recovery will remain fragile and unbalanced. Sasol expects that global economic growth in the 2013 calendar year will be similar to the approximate 3% growth recorded in the previous year, with growth rising only modestly in the 2014 calendar year.
Considering the perceived fragile state of the global economy and the uncertainties still facing the global economy, it is expected that commodity price and financial market volatility will continue for the foreseeable future.
Country specific factors in brief
South Africa Labour unrest, lower commodity prices, electricity supply constraints, low consumer and business confidence, and lacklustre foreign demand conditions all weighed on South Africa’s economic performance in the 2012 calendar year and into the 2013 calendar year, Real GDP growth slowed from 3,5% in the 2011 calendar year to 2,5% in the 2012 calendar year. After reaching a relatively low 4,9% year-on-year in July 2012, consumer price inflation rose gradually to 5,9% in April 2013 before easing back to 5,5% in June 2013. With little evidence of demand-driven inflation, concerns over weak domestic economic growth prospects and ongoing problems in the euro zone, the Reserve Bank decided to cut the policy rate to 5,0% in July 2012, taking it to its lowest level since the early-1980s. More recently, the Monetary Policy Committee decided to keep the policy interest rate at 5,0% in the face of challenging economic conditions.
Looking forward, South Africa’s economic prospects remain challenging, where we expect GDP to remain below-trend in the 2013 and 2014 calendar years, as labour market uncertainties, a slowdown in household consumption expenditure growth, potential electricity supply constraints, a substantial current account deficit funding requirement and relatively high cost increases continue to weigh on the country’s growth prospects.
United States The US economy grew at a modest 2,2% in the 2012 calendar year as global growth concerns and relatively sluggish domestic demand conditions weighed on growth. During the course of the year, fears of the country hitting the so-called ‘fiscal cliff’ in the early part of the 2013 calendar year lingered, but consumers proved resilient as the housing market strengthened, consumer confidence improved and the unemployment rate declined. The so-called ‘fiscal cliff’ was sidestepped as policymakers reached a compromise on tax and spending reforms. Despite this compromise, these policies are likely to weigh on economic activity in the 2013 calendar year. As the impacts of these policies start to wane from the 2014 calendar year, and should the consumer and housing market recovery prove as durable as we expect, GDP growth is likely to improve modestly.
Meanwhile, from the middle of the 2013 calendar year, there has been an increased focus on the timing of the step-down in QE and the potential end to the programme in the 2014 calendar year. It is believed that markets will remain focused on this for the remainder of the 2013 calendar year and into the 2014 calendar year, with the ebb-and-flow of information likely to contribute to financial and commodity market volatility.
Canada Economic growth in Canada slowed to 1,7% in the 2012 calendar year from 2,5% a year earlier, reflecting slower real income growth, fiscal restraint, a relatively weak external environment and a strong currency that restrained export growth. Despite the slower economic growth, employment prospects remained positive as the unemployment rate fell from 7,5% in January 2012 to 7,1% in June 2013. Consumer price inflation fell to 1,5% in the 2012 calendar year from 2,9% in the prior year on the back of subdued core consumer price inflation and as food and petrol prices rose at a slower rate.
It is believed that fiscal restraint and relatively slow growth in household spending will continue to weigh on Canada’s growth prospects in the 2013 calendar year. However, as the global and US economy continues to recover gradually into the 2014 calendar year, Canada’s economic fortunes should show some improvement.
chief financial officer’s review continued
Saso
l Lim
ited
com
pany
note
s to
the
fina
ncia
l sta
tem
ents
Saso
l Lim
ited
grou
p co
nsol
idat
ed fi
nanc
ial s
tate
men
tsSa
sol o
verv
iew
5
Country specific factors in brief
Euro zone Following modest growth of 1,5% in the 2011 calendar year, the euro zone economy contracted 0,6% in the 2012 calendar year. The ongoing process of financial and non-financial sector balance sheet deleveraging, low and declining levels of business and consumer confidence for most of the year, high and rising unemployment, fiscal consolidation, and lingering fears over a potential euro area break-up, contributed to the poor performance of the region’s economy. However, the risk of an imminent euro area break-up reduced significantly following assurances from the president of the ECB. Since then, financial market conditions have stabilised and indicators in the early part of the 2013 calendar year point to a less negative economic environment. However, it is believed that the region’s economy will see another full year decline in economic activity, before posting anaemic economic growth in the 2014 calendar year.
Consumer inflation eased from 2,7% in the 2011 calendar year to 2,5% in the 2012 calendar year, which is still above the ECBs medium-term inflation target of 2%. The above-target inflation stemmed mainly from energy price pressures and indirect tax increases owing to ongoing fiscal consolidation. It is believed that significant excess capacity exists in the region’s economy, which should help keep inflationary pressures at bay. This, together with a generally poor growth outlook, is likely to see interest rates remain at very low levels for an extended period.
China Chinese GDP growth continued to slow in the 2012 calendar year, averaging 7,8% from the previous year’s 9,3%. While weak external demand conditions had a negative impact on Chinese net-exports, government infrastructure investment, accommodative financing conditions and consumption all helped support economic growth. It is believed that policymakers will push ahead with policies aimed at rebalancing the Chinese economy away from investment and export-led growth towards more consumption-driven economic growth. This process, and the Chinese authorities’ apparent comfort with slower, more sustainable growth rates indicate that GDP growth is likely to be around 7,0 – 7,5% in the 2013 and 2014 calendar years.
Consumer price inflation has been relatively subdued during the course of the 2012 and into 2013, reaching 2,7% year-on-year in June 2013. Following a number of years of significant investment resulting in excess capacity in the economy and little sign of food price inflationary pressures at present, it is anticipated that inflation is likely to remain muted over the next two years.
Middle East The economic fortunes of the Middle Eastern region are still being influenced by political and social transitions and accompanying tensions in many countries. World Bank estimates show that international sanctions and rocketing inflation contributed to a contraction in Iran’s economy, while civil conflict in Syria led to a significant fall in output during the 2012 calendar year. In contrast, an increase in Iraqi oil production saw relatively strong growth being sustained.
While some countries may benefit from slightly better growth prospects in the euro area and other parts of the world, it is believed that unpredictable socio-political developments will dictate the economic performance of the region for some time. Given these uncertainties, economic growth in the region is likely to remain relatively weak for the foreseeable future.
Sub-Saharan Africa According to IMF estimates, economic growth in the Sub-Saharan Africa region slowed to 4,9% in the 2012 calendar year from 5,4% the previous year. The still strong growth was supported by private consumption expenditure, investment and export growth, with the oil exporting countries having generally done better than those countries which have close trade ties to the euro area. Consumer inflation in the region weakened from 9,3% in the 2011 calendar year to about 9% in the 2012 calendar year, reflecting a slowdown in global food and energy price increases, the lagged effect of past monetary policy tightening in certain countries and better weather conditions in some parts of the region.
It is expected that relatively strong investment growth in certain sectors will lift the overall growth potential of the Sub-Saharan Africa region, which together with its significant mineral resources, makes for a promising and strong growth environment – albeit that this growth comes off a relatively low base.
6
Saso
l ann
ual fi
nanc
ial s
tate
men
ts 2
013
AFS
Sasol Limited group
In addition to the general macroeconomic environment, Sasol is also affected by the crude oil and natural gas prices, the exchange rate and chemical prices. These are discussed separately on pages 6 to 8.
In order to address the challenges that the global economic climate is presenting, we will continue to focus on those factors that remain within our control. This will ensure that we are best positioned to deliver shareholder value.
b. Volatile crude oil prices We are exposed to the volatility associated with the selling price of fuel marketed by Sasol Oil. This selling price is governed by
the basic fuel price (BFP), as regulated by the South African government. The key factors influencing the BFP include the crude oil price, rand/US dollar exchange rate and the refining margin typically earned by coastal refineries.
Due to the integrated nature of our operations, Sasol Synfuels uses a pricing mechanism for raw materials supplied to the South African chemical business, which matches the BFP. The price charged is the value that Sasol Synfuels could earn by converting these products to fuel and selling it at the BFP.
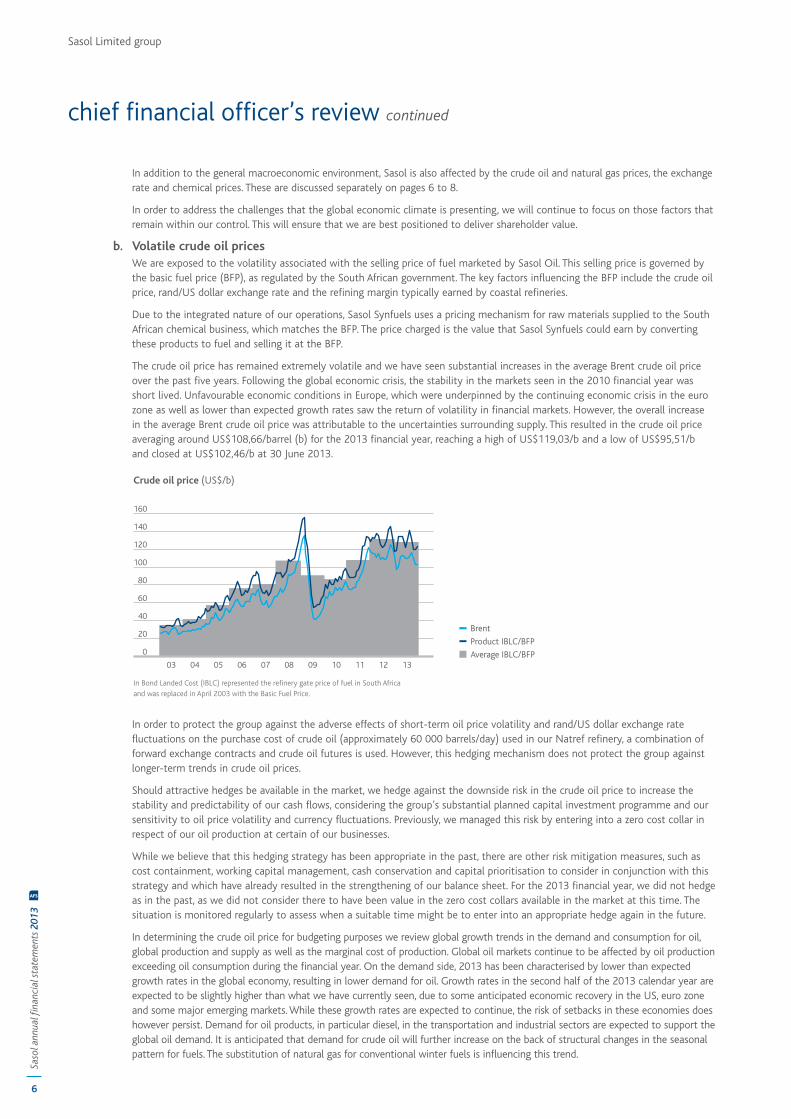
The crude oil price has remained extremely volatile and we have seen substantial increases in the average Brent crude oil price over the past five years. Following the global economic crisis, the stability in the markets seen in the 2010 financial year was short lived. Unfavourable economic conditions in Europe, which were underpinned by the continuing economic crisis in the euro zone as well as lower than expected growth rates saw the return of volatility in financial markets. However, the overall increase in the average Brent crude oil price was attributable to the uncertainties surrounding supply. This resulted in the crude oil price averaging around US$108,66/barrel (b) for the 2013 financial year, reaching a high of US$119,03/b and a low of US$95,51/b and closed at US$102,46/b at 30 June 2013.
In order to protect the group against the adverse effects of short-term oil price volatility and rand/US dollar exchange rate fluctuations on the purchase cost of crude oil (approximately 60 000 barrels/day) used in our Natref refinery, a combination of forward exchange contracts and crude oil futures is used. However, this hedging mechanism does not protect the group against longer-term trends in crude oil prices.
Should attractive hedges be available in the market, we hedge against the downside risk in the crude oil price to increase the stability and predictability of our cash flows, considering the group’s substantial planned capital investment programme and our sensitivity to oil price volatility and currency fluctuations. Previously, we managed this risk by entering into a zero cost collar in respect of our oil production at certain of our businesses.
While we believe that this hedging strategy has been appropriate in the past, there are other risk mitigation measures, such as cost containment, working capital management, cash conservation and capital prioritisation to consider in conjunction with this strategy and which have already resulted in the strengthening of our balance sheet. For the 2013 financial year, we did not hedge as in the past, as we did not consider there to have been value in the zero cost collars available in the market at this time. The situation is monitored regularly to assess when a suitable time might be to enter into an appropriate hedge again in the future.
In determining the crude oil price for budgeting purposes we review global growth trends in the demand and consumption for oil, global production and supply as well as the marginal cost of production. Global oil markets continue to be affected by oil production exceeding oil consumption during the financial year. On the demand side, 2013 has been characterised by lower than expected growth rates in the global economy, resulting in lower demand for oil. Growth rates in the second half of the 2013 calendar year are expected to be slightly higher than what we have currently seen, due to some anticipated economic recovery in the US, euro zone and some major emerging markets. While these growth rates are expected to continue, the risk of setbacks in these economies does however persist. Demand for oil products, in particular diesel, in the transportation and industrial sectors are expected to support the global oil demand. It is anticipated that demand for crude oil will further increase on the back of structural changes in the seasonal pattern for fuels. The substitution of natural gas for conventional winter fuels is influencing this trend.
chief financial officer’s review continued
Saso
l Lim
ited
com
pany
note
s to
the
fina
ncia
l sta
tem
ents
Saso
l Lim
ited
grou
p co
nsol
idat
ed fi
nanc
ial s
tate
men
tsSa
sol o
verv
iew
7
Oil supply from non-Organisation of the Petroleum Exporting Countries (OPEC) members has been the main contributor of global oil production and it is expected that this will continue in the near term. The US and Canada are the main drivers to non-OPEC supply growth. However, political, technical and weather-related issues, maintenance and decline rate developments contribute to the risk of both OPEC and non-OPEC supply. Political turmoil, including the Iranian oil export embargo, in the Middle East and Africa will weigh on their production. In the North Sea, field declines have been particularly pronounced and upcoming maintenance in the North Sea during August/September 2013 as well as hurricane season in the Gulf region will negatively impact non-OPEC supply. The increase in oil demand in the 2014 calendar year is anticipated to be less than the increase in oil production from non-OPEC members. OPEC members are expected to continue to produce around 30 million barrels per day for the 2014 calendar year. In a market with ample supply, there is a build-up of global crude inventories, in particular diesel for the start of the Northern Hemisphere’s driving season. These conditions are expected to persist into the latter half of the 2013 calendar year and into the 2014 calendar year, underpinned by lower demand.
Prices continue to remain volatile, attributable to poor economic indicators for Europe, China and the US. We continue to remain more cautious on the short-term outlook and believe that we could see prices stabilising in the medium-term due to balanced supply and demand dynamics. Our view is that in the next five years, crude oil prices will settle around US$110/b, however, in the longer term, we expect the crude oil price to increase. For budgeting and forecasting purposes, we estimate that for every US$1/b increase in the annual average crude oil price, group operating profit for the year will increase by approximately US$67 million (R610 million) during 2014. This estimate is off a base of US$108/b crude oil price and a rand/US dollar exchange rate of R9,05. It should be noted that in the volatile environment that we are currently experiencing, these sensitivities could be materially different depending on the crude oil price, exchange rates, product prices and volumes.
c. Exchange rates A large portion of our turnover and capital investments is significantly impacted by the rand/US dollar exchange rate. Some of
our fuel products are governed by the BFP, of which a significant variable is the rand/US dollar exchange rate. The BFP is revised at the beginning of each month based on the average exchange rate ruling for the preceding month. Our chemical products are commodity products whose prices are based largely on global commodity and benchmark prices quoted in US dollars.
As a result, the average exchange rate for the year has a significant impact on our turnover and operating profit. In order to protect our South African operations from the effects of exchange rate volatility, taking into account the weakening rand over the long-term, we hedge both our capital investments and foreign currency denominated imports in excess of US$50 000 per transaction by means of forward exchange contracts. Our group executive committee (GEC) sets intervention levels specifically to assess large forward cover amounts for long periods into the future, which have the potential to materially affect our financial position. These limits and our hedging policy are reviewed from time to time. This hedging strategy enables us to better predict cash flows and thus manage our working capital and debt more effectively. It is noted that we do not hedge foreign currency receipts.
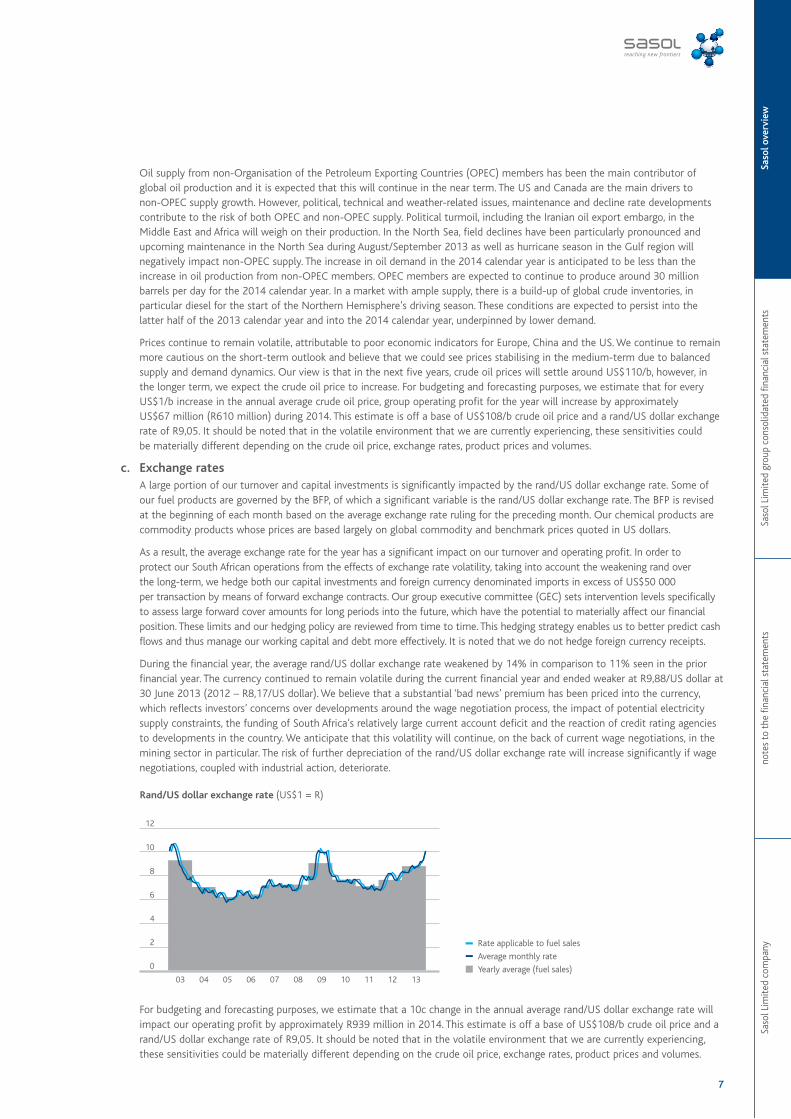
During the financial year, the average rand/US dollar exchange rate weakened by 14% in comparison to 11% seen in the prior financial year. The currency continued to remain volatile during the current financial year and ended weaker at R9,88/US dollar at 30 June 2013 (2012 – R8,17/US dollar). We believe that a substantial ‘bad news’ premium has been priced into the currency, which reflects investors’ concerns over developments around the wage negotiation process, the impact of potential electricity supply constraints, the funding of South Africa’s relatively large current account deficit and the reaction of credit rating agencies to developments in the country. We anticipate that this volatility will continue, on the back of current wage negotiations, in the mining sector in particular. The risk of further depreciation of the rand/US dollar exchange rate will increase significantly if wage negotiations, coupled with industrial action, deteriorate.
For budgeting and forecasting purposes, we estimate that a 10c change in the annual average rand/US dollar exchange rate will impact our operating profit by approximately R939 million in 2014. This estimate is off a base of US$108/b crude oil price and a rand/US dollar exchange rate of R9,05. It should be noted that in the volatile environment that we are currently experiencing, these sensitivities could be materially different depending on the crude oil price, exchange rates, product prices and volumes.
8
Saso
l ann
ual fi
nanc
ial s
tate
men
ts 2
013
AFS
Sasol Limited group
d. Expansion of natural gas offering According to the International Energy Outlook 2013, issued by the US Energy Information Administration (EIA) in July 2013,
fossil fuels will continue to supply almost 80% of the world’s energy use through to 2040. Natural gas is the fastest growing fossil fuel, with global natural gas consumption increasing by 1,7% per year. The EIA further indicated that increasing supplies of tight gas, shale gas and coalbed methane support the projected growth in worldwide natural gas consumption. The US ranks third as one of the countries which will account for the largest increases in natural gas production from 2010 to 2040. With this rapid growth of US production, coupled with mounting climate change pressure, the increasing use of natural gas as transportation fuel in the US and elsewhere, bodes well for Sasol’s growth aspirations in North America. Natural gas is an attractive fuel alternative in the industrial and electricity industries, because of its lower carbon intensity compared to coal and oil. The substitution of traditional fuels like oil-based diesel, for fuels derived from natural gas, provides a solid business case for our gas-to-liquids (GTL) investment proposition.
Our 2011 investment in the Canadian shale gas assets, situated in the Montney Basin, supports our strategy to deliver fuel alternatives in support of lowering our carbon dioxide (CO2) emissions. The strong growth outlook for natural gas, especially in the US, Canada and China, coupled with developments in technology, is making shale gas economical worldwide. However, new gas ventures involve risks – while our Canadian shale gas assets are not producing as planned, we do foresee that production will improve in the future once gas prices trigger further economic development, coupled with our final investment decision in respect of our 96 000 barrels per day GTL facility in the US. We anticipate that our shale gas assets will act as a natural price hedge for the feedstock of our GTL project, providing a cover on the price of gas of approximately two-thirds.
Current gas prices in North America remain depressed, however we have seen some improvement in the price over the financial year. The spot natural gas price for the US benchmark (Henry Hub) improved to US$3,57/million metric British thermal units (mmbtu) at 30 June 2013, compared to US$2,74/mmbtu at 30 June 2012.
e. The effect of chemical prices Our chemical products follow a typical demand cycle. Higher demand results in higher prices, until new production capacity is
introduced, at which point prices decrease. Over the longer term most commodity chemical prices tend to track crude oil based feedstock prices. At times of high prices for crude oil and intermediate products, profit margins benefit the feedstock producer. In times of high chemical prices and lower feedstock prices, profit margins shift to downstream activities. The strategy for our commodity chemicals businesses therefore is, wherever possible, to be invested in the value chain from raw materials to final products. The group has elected not to hedge its exposure to commodity chemical prices as this may partly negate the benefits of such integration into our primary feedstock streams.
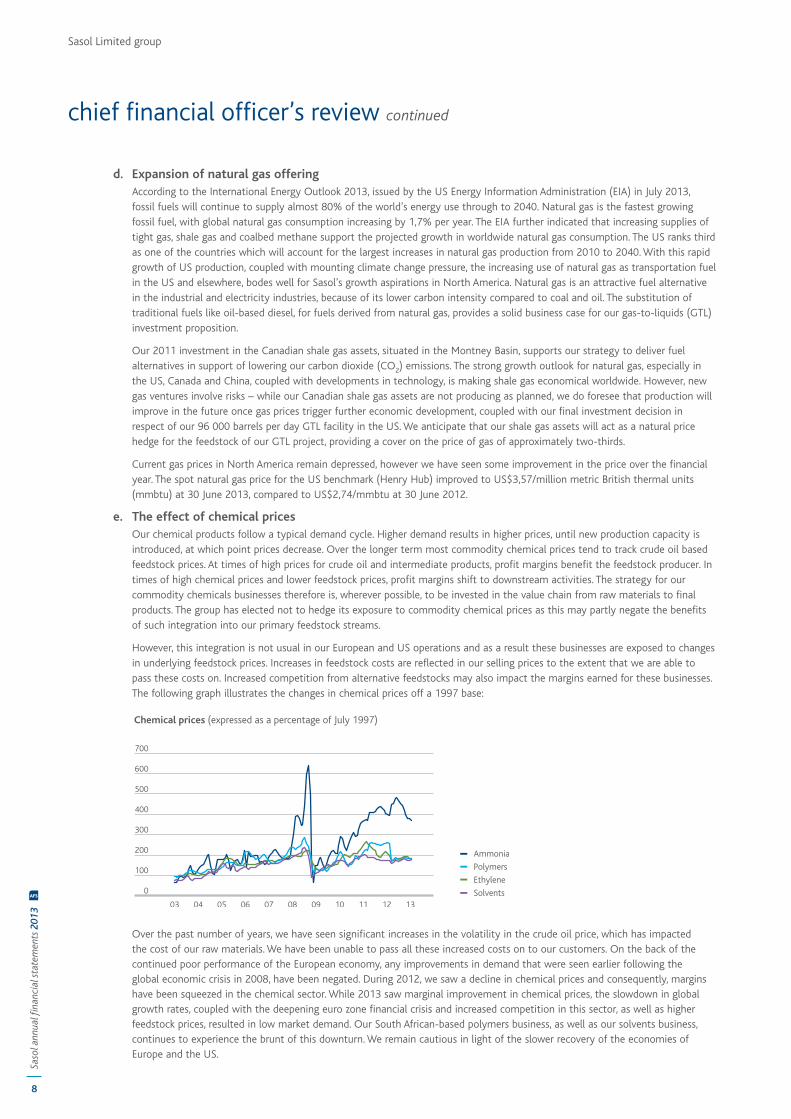
However, this integration is not usual in our European and US operations and as a result these businesses are exposed to changes in underlying feedstock prices. Increases in feedstock costs are reflected in our selling prices to the extent that we are able to pass these costs on. Increased competition from alternative feedstocks may also impact the margins earned for these businesses. The following graph illustrates the changes in chemical prices off a 1997 base:
Over the past number of years, we have seen significant increases in the volatility in the crude oil price, which has impacted the cost of our raw materials. We have been unable to pass all these increased costs on to our customers. On the back of the continued poor performance of the European economy, any improvements in demand that were seen earlier following the global economic crisis in 2008, have been negated. During 2012, we saw a decline in chemical prices and consequently, margins have been squeezed in the chemical sector. While 2013 saw marginal improvement in chemical prices, the slowdown in global growth rates, coupled with the deepening euro zone financial crisis and increased competition in this sector, as well as higher feedstock prices, resulted in low market demand. Our South African-based polymers business, as well as our solvents business, continues to experience the brunt of this downturn. We remain cautious in light of the slower recovery of the economies of Europe and the US.
chief financial officer’s review continued

Saso
l Lim
ited
com
pany
note
s to
the
fina
ncia
l sta
tem
ents
Saso
l Lim
ited
grou
p co
nsol
idat
ed fi
nanc
ial s
tate
men
tsSa
sol o
verv
iew
9
f. Delivering on capital projects Our industry is a long-term business in which most of our operations, including the gasification of coal and the manufacture
of synfuels and petrochemical products, are highly dependent upon the development and use of advanced technologies. The decisions affecting our business are made with a time horizon that is measured with a long-term view and span multiple and diverse business cycles. These decisions are in support of expanding and delivering on our growth aspirations in support of our creating shareholder value sustainably. To ensure that we capitalise on the right opportunities, it is an imperative that we focus on those opportunities in the right geographic regions and deliver on those projects within planned timelines. A number of our expansion projects are integrated across a number of our businesses, such as the development of our North American operations, and span a number of our chemical and international energy businesses. Understanding these opportunities provides clarity and is critical in allowing us to deliver on a vital portion of our growth aspirations.
We also need to ensure the stability and reliability of our foundation businesses and that we maintain our operations throughout the world. This requires capital investments to sustain our operations. We monitor our capital investment programme on a continuous basis to ensure that capital is employed effectively from the translation of our strategy into portfolios of delivered projects, which are beneficial to the long-term growth of the group.
Our capital investments are tested through a range of economic scenarios to ensure that risks are appropriately identified, evaluated and managed. This approach ensures that our technologies are developed, commercialised and integrated so that the competitiveness of our products, the continuity of our operations, our feedstock requirements, capacity and efficiency of our production is assured. Emphasis is placed on the selection of effective projects, whose execution will deliver maximum return and asset value for our stakeholders. In selecting these projects, reference is made to our hurdle rate, being 1,3 times the Sasol’s weighted average cost of capital (WACC). In determining our WACC rate, the methodology applied is consistent with global best practice and includes adjustments to take into account country specific risk. Industry differentiation has not been implemented in our WACC methodology due to the integrated nature of the Sasol group. The bond rates and country risk premiums were reviewed and due to the current global market volatility, there is uncertainty that these rates will be sustainable in the long term, therefore the WACC rates for the current year have remained unchanged. Refer to section 7 of this report for details on our capital allocation.
g. Impacts on our cost base Our sustainability and competitiveness depend on our ability to optimise our operating cost base. As we are unable to control
the market price at which the products we produce are sold, it is possible that if inflation in countries in which we operate should begin to increase, it may result in significantly higher future operational costs. Generally, we have seen that the rate of inflation in most major countries in which we operate has been relatively low in recent years. In South Africa, inflation has declined from its highs of 13,8% in August 2008 to lows of 3,2% in September 2010. The weakening rand/US dollar exchange rate remains the greatest impact on inflation. This together with potential labour and electricity cost increases in excess of the South African Reserve Bank (SARB) target range for inflation of 3% to 6%, adds further to inflation risk, placing further pressure on our operating costs. We anticipate that consumer price index (CPI) inflation in South Africa will remain within this range, with the 2013 average CPI inflation rate just within this range at 5,5%. Refer to point 5c for additional information.
We continued to maintain strict cost discipline across the group in 2013, and made further progress on our initiatives, that were implemented in previous years. These initiatives included our shared services structures, asset optimisation and a continued focus on our supply chain process seeking economies of scale in procurement. Part of these initiatives included the commissioning of a 140 megawatts electricity generation plant in Sasolburg, South Africa, during December 2012. This plant will assist with the reduction of our energy costs. We continue to leverage off efficiency and productivity improvements to counter the effects of increased cost trends. However, we realise that in order to move forward with our growth aspirations, further cost optimisation is required. To this end we have initiated a cost optimisation programme, refer to section 11 for additional information.
h. Impairments and reversals of impairments While in the past two years, we have seen signs of global economic recovery, risks including the euro zone crisis, US fiscal policy
and the Chinese ‘hard landing’, continue to persist. As a result, we reassessed the impairment reviews conducted previously on our cash generating units. Based on these assessments, for the year under review, we have evaluated whether the carrying value of our assets are recoverable. In assessing these economic valuations, current market conditions, our latest budgets and the life cycle of the various products are taken into consideration. While the actual outcomes may differ significantly from our forecasts, thus affecting our assessment of future cash flows, management has applied their judgement in making these assessments based on the best information available at the time. In addition, the outcomes have been tested against a range of economic scenarios particular to the circumstances of the business concerned. Further, where these outcomes have indicated that the previously recognised impairments should be reversed due to the economic recovery, management has tested these reversals to ensure that the circumstances indicated, are sustainable based on the current information available.
As a result, net impairments of R5 995 million have been recognised for the year ended 30 June 2013, primarily related to the divestiture of our investment in Arya Sasol Polymer Company (ASPC) and Sasol Wax’s FT wax expansion project. At 30 June 2013, the investment in ASPC is classified as a disposal group held-for-sale. The devaluation of the Iranian currency negatively impacted our earnings, coupled with the deteriorating Iranian environment and the accounting requirement to recognise operating profits which may not be recuperated through the divestiture process and disposal value. Accordingly, we recognised a partial impairment of R3 611 million at 30 June 2013. On 16 August 2013, we entered into a definitive sale and share purchase
10
Saso
l ann
ual fi
nanc
ial s
tate
men
ts 2
013
AFS
Sasol Limited group
agreement to dispose of our 50% interest in ASPC for a purchase consideration of R3 606 million (US$365 million). The purchase consideration is payable in cash for the net assets, dividends and shareholder loans. As a result of this transaction, Sasol has no ongoing investment in Iran. We are currently assessing the impact of the change in the official Iranian Rial exchange rate applicable from the 2014 financial year. This change may result in a loss on disposal of less than US$100 million. The FT wax expansion project is a highly-complex brownfield mega-project, being executed in a volatile macroeconomic and labour constrained environment, where construction delays and poor productivity are being experienced. Accordingly, some uncertainty on the schedule and costs remain. As a consequence, we reassessed the economics of the project and recognised a partial impairment of R2 033 million at 30 June 2013.
In addition, we recognised R442 million in respect of the write-off of an unsuccessful exploration well, Mupeji-1, in Mozambique.
With regards to those assets which we had previously impaired we reassessed those factors impacting the carrying value of these assets. In particular, we reviewed our participation in the Escravos gas-to-liquids (EGTL) project in Nigeria. In 2011, we recognised a partial impairment of our investment in EGTL of R123 million. Based on continuing uncertainties in the Nigerian environment as well as various project risks, the partial impairment has not been reversed in 2013. We further reviewed our Canadian shale gas assets which were partially impaired in 2012 by R964 million. The value in use is particularly sensitive to changes in the gas price, the estimated ultimate recovery factor as well as changes in drilling and completion costs. Based on our review of the shale gas assets, taking into account the development of the natural gas price and the development of the gas field, the partial impairment has not been reversed in 2013.
i. Credit management focus Although economies are showing signs of recovery, the effects of the global economic crisis continue to linger, especially in
Europe which faced a deepening financial crisis in 2012. As uncertain economic times persist, a significant burden is placed on our customers. Management can therefore not ignore the risk that this continues to present to the group. We remain focused on our credit management process to ensure that our exposure to those customers faced with the negative impacts of declining economies remains within acceptable limits. The exposure of our receivables is reviewed across the group, through a centrally co-ordinated credit committee, which undertakes an oversight role to ensure that our group-wide exposure is limited in these uncertain times. Credit management of the receivables remains the responsibility of the individual business units. This focused risk approach continues to stand us in good stead, resulting in insignificant bad debt write-offs in the current economic climate.
j. Net realisable value write downs in inventory The continued financial crisis in the euro zone as well as lower than expected global economic growth, have resulted in softer
demand in certain markets and in certain economies. We continue to take mitigating actions, where appropriate, to eliminate some of this volatility through decreasing production at certain of our plants, especially in Europe, however, our inventory holding across the group is at higher levels than those of the previous year. The weaker demand for product has been coupled with improved prices during the year. Lower average crude oil effects coupled with a weaker rand/US dollar exchange rate and the higher inventory levels, resulted in net realisable value write downs of R234 million during the financial year compared to R331 million in the previous financial year.
k. Delivering sustainable results Managing the social, economic and environmental impacts of our business in a sustainable manner is key to delivering long-term
success. It is also essential that we work on strengthening relationships with all of our key stakeholders. Strong relationships are crucial to delivering on our future aspirations – we need to be attuned to our customers, our business partners and the governments of the countries in which we operate. We also need to ensure that the way in which we carry out our business is sustainable in the longer term, and that this way of thinking is reflected in our daily activities. In addition to our focus on ‘zero harm’ as part of our approach towards safety, we face substantial challenges around climate change and other environmental impacts, including water usage at our South African operations.
In 2011, the South African government approved its National Climate Change Response White Paper, and followed this up by commissioning a greenhouse gas (GHG) mitigation potential study and by releasing a discussion document on carbon tax during 2013. The aim of these activities is to understand the opportunities and policies required to reduce the country’s GHG emissions, in line with the commitments made under the UN Framework Convention on Climate Change. We are continuing to engage with the government to allow a mutual understanding of the opportunities for GHG mitigation, and the impact of policies in this area on our business. We are continuing to seek solutions to the challenges of reducing our GHG emissions, particularly in South Africa. Any solutions also need to be acceptable to our investors and other stakeholders, while at the same time allowing us to contribute towards the economic development and energy security of the countries in which we operate.
Around 25% of Sasol’s emissions in South Africa arise from the generation of electricity, either directly in our own operations or indirectly from imported electricity. Our short-to-medium-term focus is on the generation of lower-carbon electricity from natural gas, which also allows us to assist in alleviating the electricity supply shortfall in South Africa. In December 2012, the R1,4 billion Sasolburg Gas Engine Power Plant started up, allowing us to generate 140 MW of electricity. This project was completed ahead of schedule, and below the initially approved budget. A similar project, Central Termica de Ressano Garcia has been established with Electricidade de Moçambique holding a 51% share and Sasol 49%, and is currently under construction in Mozambique, and scheduled for completion in the 2014 financial year.
chief financial officer’s review continued
Saso
l Lim
ited
com
pany
note
s to
the
fina
ncia
l sta
tem
ents
Saso
l Lim
ited
grou
p co
nsol
idat
ed fi
nanc
ial s
tate
men
tsSa
sol o
verv
iew
11
We are also investigating the opportunities for carbon capture and storage, as this forms part of the basket of options under consideration for our long-term GHG mitigation plans. As part of these plans, during 2011 we took up a 2,44% share in the CO2 Technology Centre Mongstad in Norway, which is a collaboration of energy industry players and the Norwegian state aimed at improving the understanding of and gaining operational experience of large-scale carbon capture processes. This facility started up during the year, and has allowed its owners to better understand the risks and opportunities associated with this technology.
l. Credit market risk and its impact on our debt profile Indications by the US Federal Reserve that it may start to reduce the amount of monthly bond purchases as part of its QE
programme prompted a sharp increase in bond yields globally. As a result, the cost of funding for corporates in the debt capital markets also increased sharply. A similar US dollar bond to that which the company issued in November 2012 is likely to attract a 100 basis points higher coupon today.
Conditions in the syndicated loan markets continue to improve, particularly for shorter-term tenures. It is, however, becoming increasingly clear that the new Basel 3 regulations will significantly hamper banks’ abilities to provide term funding over longer tenures, and the cost of long-term funding will become more expensive.
In anticipation of the significant planned capital investments and full project pipeline, our funding requirements are monitored on a continuous basis as part of our enterprise risk management activities and ensuring that appropriate levels of liquidity is maintained.
To this end, Sasol issued a US$1 billion corporate bond in November 2012. The bond, with a tenure of 10 years and a fixed coupon rate of 4,5% per annum, was oversubscribed by 3,47 times. The coupon rate is the lowest ever achieved by a South African non-state owned enterprise. This reflects the confidence that investors have in our company and in our ability to deliver value. This corporate bond provides long-term funding to balance the abundant short-term liquidity available to the group. The latter includes our R8 billion commercial paper programme, a revolving credit facility and several committed bank credit lines. Appropriate liquidity and committed funding facilities are also an essential part of retaining Sasol’s investment grade rating.
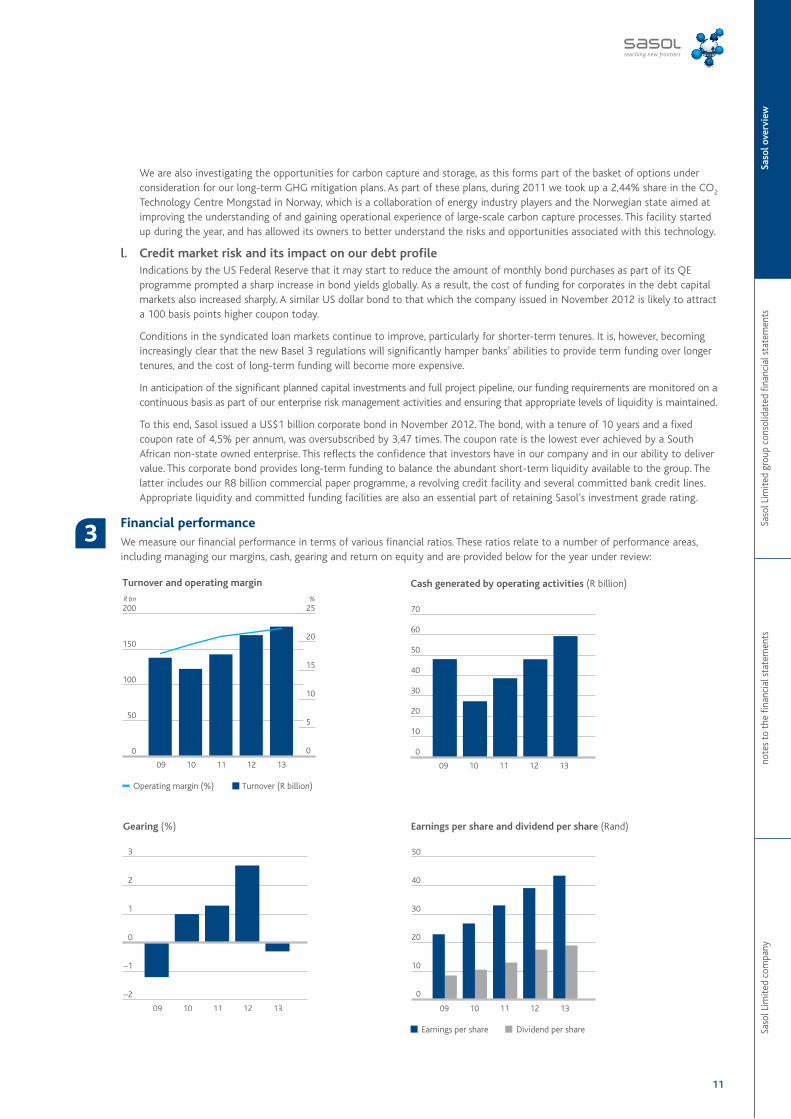
3 Financial performance
We measure our financial performance in terms of various financial ratios. These ratios relate to a number of performance areas, including managing our margins, cash, gearing and return on equity and are provided below for the year under review:
12
Saso
l ann
ual fi
nanc
ial s
tate
men
ts 2
013
AFS
Sasol Limited group
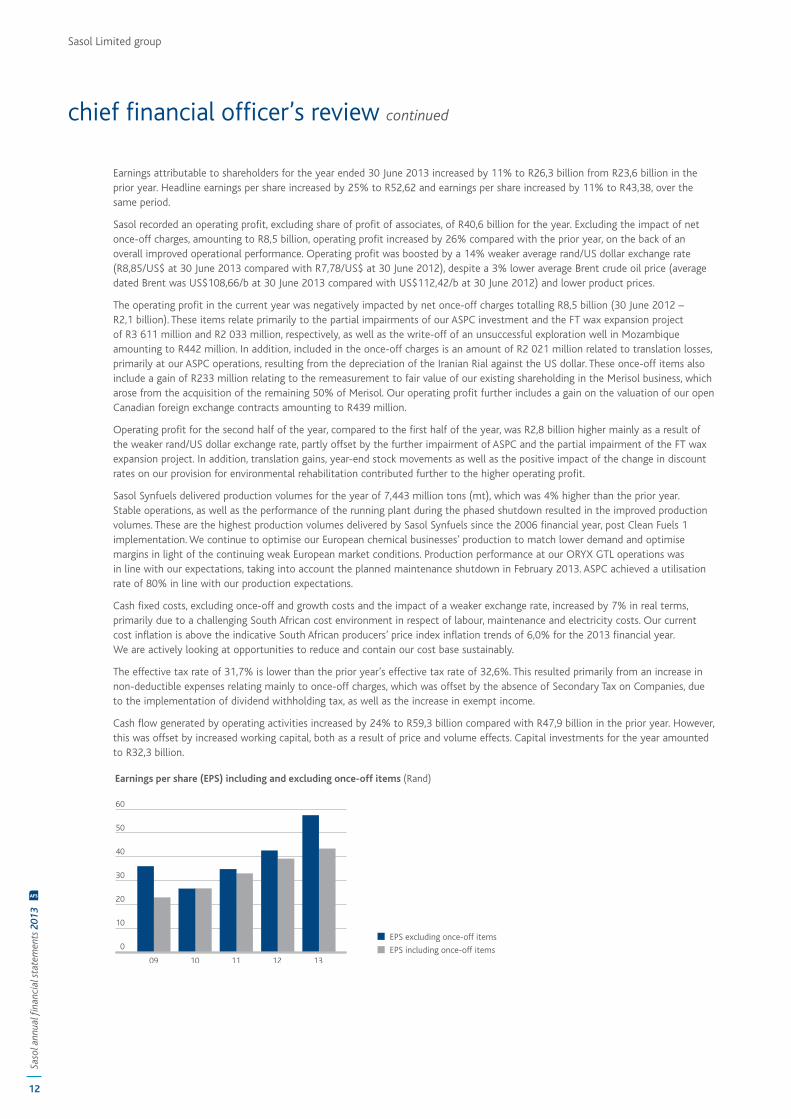
Earnings attributable to shareholders for the year ended 30 June 2013 increased by 11% to R26,3 billion from R23,6 billion in the prior year. Headline earnings per share increased by 25% to R52,62 and earnings per share increased by 11% to R43,38, over the same period.
Sasol recorded an operating profit, excluding share of profit of associates, of R40,6 billion for the year. Excluding the impact of net once-off charges, amounting to R8,5 billion, operating profit increased by 26% compared with the prior year, on the back of an overall improved operational performance. Operating profit was boosted by a 14% weaker average rand/US dollar exchange rate (R8,85/US$ at 30 June 2013 compared with R7,78/US$ at 30 June 2012), despite a 3% lower average Brent crude oil price (average dated Brent was US$108,66/b at 30 June 2013 compared with US$112,42/b at 30 June 2012) and lower product prices.
The operating profit in the current year was negatively impacted by net once-off charges totalling R8,5 billion (30 June 2012 – R2,1 billion). These items relate primarily to the partial impairments of our ASPC investment and the FT wax expansion project of R3 611 million and R2 033 million, respectively, as well as the write-off of an unsuccessful exploration well in Mozambique amounting to R442 million. In addition, included in the once-off charges is an amount of R2 021 million related to translation losses, primarily at our ASPC operations, resulting from the depreciation of the Iranian Rial against the US dollar. These once-off items also include a gain of R233 million relating to the remeasurement to fair value of our existing shareholding in the Merisol business, which arose from the acquisition of the remaining 50% of Merisol. Our operating profit further includes a gain on the valuation of our open Canadian foreign exchange contracts amounting to R439 million.
Operating profit for the second half of the year, compared to the first half of the year, was R2,8 billion higher mainly as a result of the weaker rand/US dollar exchange rate, partly offset by the further impairment of ASPC and the partial impairment of the FT wax expansion project. In addition, translation gains, year-end stock movements as well as the positive impact of the change in discount rates on our provision for environmental rehabilitation contributed further to the higher operating profit.
Sasol Synfuels delivered production volumes for the year of 7,443 million tons (mt), which was 4% higher than the prior year. Stable operations, as well as the performance of the running plant during the phased shutdown resulted in the improved production volumes. These are the highest production volumes delivered by Sasol Synfuels since the 2006 financial year, post Clean Fuels 1 implementation. We continue to optimise our European chemical businesses’ production to match lower demand and optimise margins in light of the continuing weak European market conditions. Production performance at our ORYX GTL operations was in line with our expectations, taking into account the planned maintenance shutdown in February 2013. ASPC achieved a utilisation rate of 80% in line with our production expectations.
Cash fixed costs, excluding once-off and growth costs and the impact of a weaker exchange rate, increased by 7% in real terms, primarily due to a challenging South African cost environment in respect of labour, maintenance and electricity costs. Our current cost inflation is above the indicative South African producers’ price index inflation trends of 6,0% for the 2013 financial year. We are actively looking at opportunities to reduce and contain our cost base sustainably.
The effective tax rate of 31,7% is lower than the prior year’s effective tax rate of 32,6%. This resulted primarily from an increase in non-deductible expenses relating mainly to once-off charges, which was offset by the absence of Secondary Tax on Companies, due to the implementation of dividend withholding tax, as well as the increase in exempt income.
Cash flow generated by operating activities increased by 24% to R59,3 billion compared with R47,9 billion in the prior year. However, this was offset by increased working capital, both as a result of price and volume effects. Capital investments for the year amounted to R32,3 billion.
chief financial officer’s review continued
Saso
l Lim
ited
com
pany
note
s to
the
fina
ncia
l sta
tem
ents
Saso
l Lim
ited
grou
p co
nsol
idat
ed fi
nanc
ial s
tate
men
tsSa
sol o
verv
iew
13
4 Effect of significant changes in accounting principles
During the 2013 financial year, we adopted three new accounting standards as set out in our accounting policies. These newly adopted standards did not significantly impact our financial results. In addition, we changed the presentation of our income statement for the 2013 financial year. In terms of International Financial Reporting Standards (IFRS), the income statement can be presented by nature or by function. With effect from 1 July 2012, the group changed the presentation of its income statement from a classification based on function to a classification based on nature. Sasol has elected to change its income statement presentation to better reflect how it effectively manages its business as well as align to peers. The comparative periods presented have been restated to comply with the income statement classification by nature. The change in the income statement presentation did not have an impact on turnover, operating profit or earnings per share. Refer to note 1 of the consolidated annual financial statements.
During the 2014 financial year, we will be adopting the consolidation suite of accounting standards, including IFRS 10 Consolidated Financial Statements, IFRS 11 Joint Arrangements and IFRS 12, Disclosure of Interests in Other Entities. The adoption of the consolidation suite of standards is not expected to have a significant impact on total assets, total liabilities, equity, earnings and earnings per share.
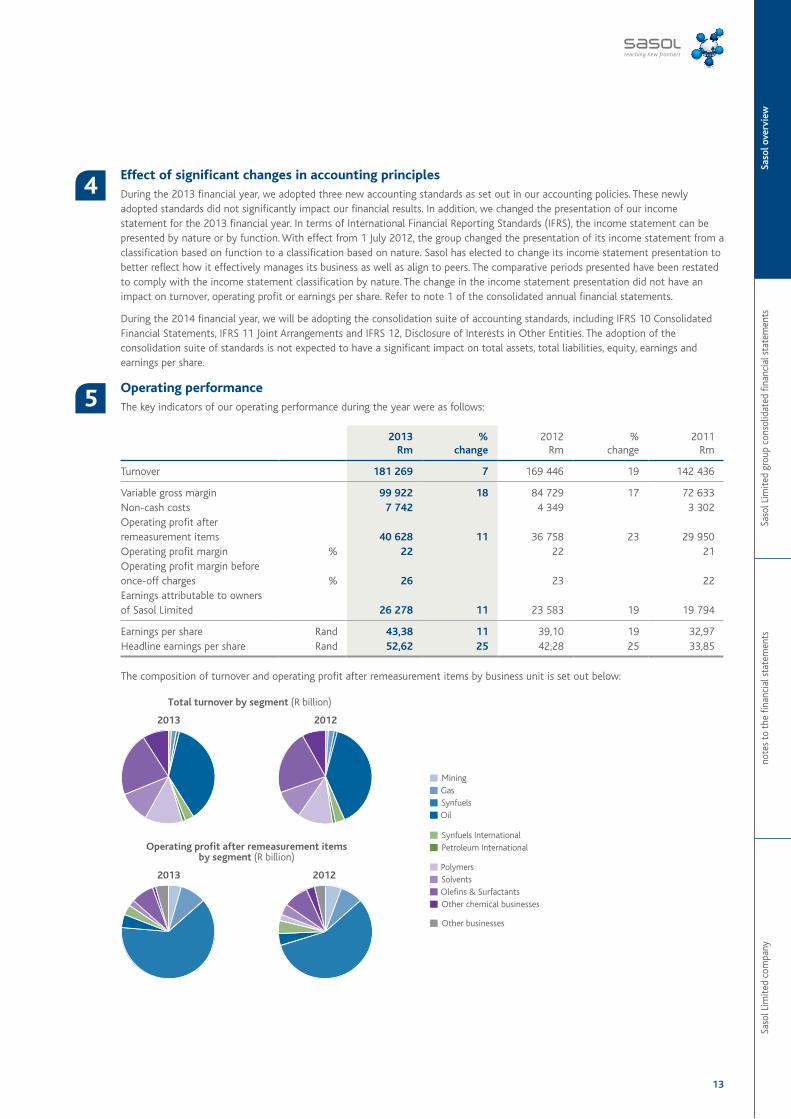
5 Operating performance
The key indicators of our operating performance during the year were as follows:
2013Rm
%change
2012Rm
%change
2011Rm
Turnover 181 269 7 169 446 19 142 436
Variable gross margin 99 922 18 84 729 17 72 633Non-cash costs 7 742 4 349 3 302Operating profit after remeasurement items 40 628 11 36 758 23 29 950Operating profit margin % 22 22 21Operating profit margin before once-off charges % 26 23 22Earnings attributable to owners of Sasol Limited 26 278 11 23 583 19 19 794
Earnings per share Rand 43,38 11 39,10 19 32,97Headline earnings per share Rand 52,62 25 42,28 25 33,85
The composition of turnover and operating profit after remeasurement items by business unit is set out below:
14
Saso
l ann
ual fi
nanc
ial s
tate
men
ts 2
013
AFS
Sasol Limited group
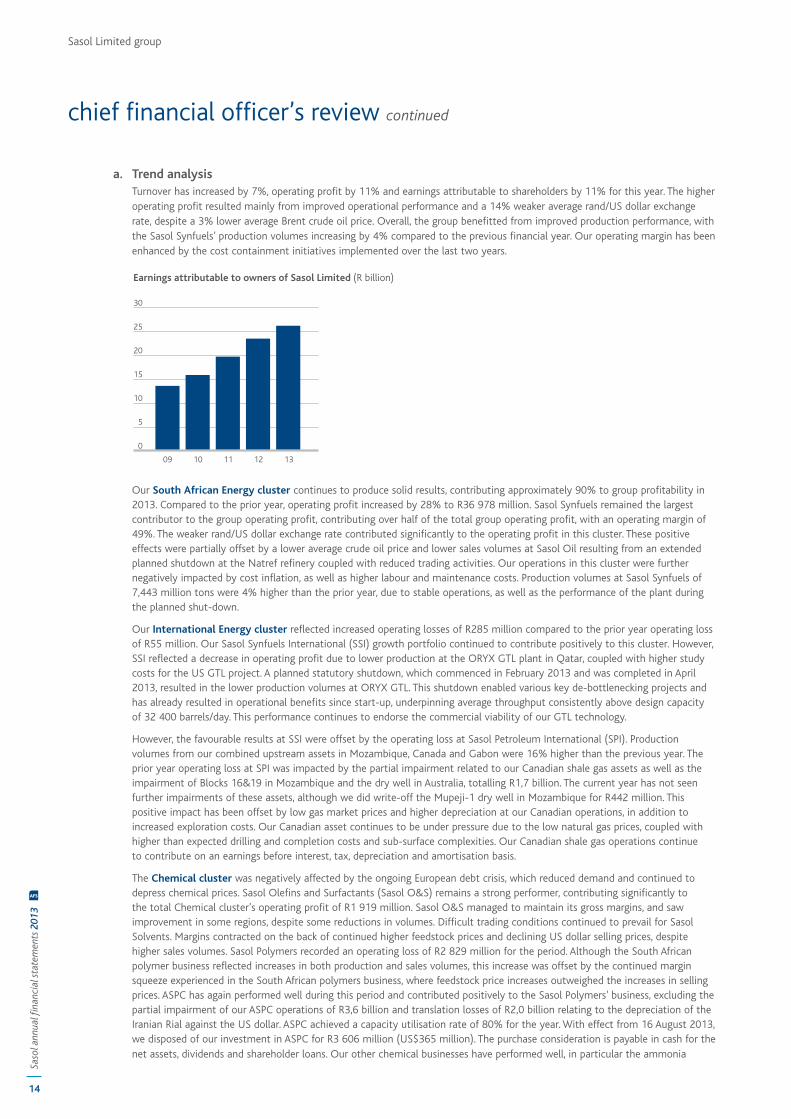
a. Trend analysis Turnover has increased by 7%, operating profit by 11% and earnings attributable to shareholders by 11% for this year. The higher
operating profit resulted mainly from improved operational performance and a 14% weaker average rand/US dollar exchange rate, despite a 3% lower average Brent crude oil price. Overall, the group benefitted from improved production performance, with the Sasol Synfuels’ production volumes increasing by 4% compared to the previous financial year. Our operating margin has been enhanced by the cost containment initiatives implemented over the last two years.
Our South African Energy cluster continues to produce solid results, contributing approximately 90% to group profitability in 2013. Compared to the prior year, operating profit increased by 28% to R36 978 million. Sasol Synfuels remained the largest contributor to the group operating profit, contributing over half of the total group operating profit, with an operating margin of 49%. The weaker rand/US dollar exchange rate contributed significantly to the operating profit in this cluster. These positive effects were partially offset by a lower average crude oil price and lower sales volumes at Sasol Oil resulting from an extended planned shutdown at the Natref refinery coupled with reduced trading activities. Our operations in this cluster were further negatively impacted by cost inflation, as well as higher labour and maintenance costs. Production volumes at Sasol Synfuels of 7,443 million tons were 4% higher than the prior year, due to stable operations, as well as the performance of the plant during the planned shut-down.
Our International Energy cluster reflected increased operating losses of R285 million compared to the prior year operating loss of R55 million. Our Sasol Synfuels International (SSI) growth portfolio continued to contribute positively to this cluster. However, SSI reflected a decrease in operating profit due to lower production at the ORYX GTL plant in Qatar, coupled with higher study costs for the US GTL project. A planned statutory shutdown, which commenced in February 2013 and was completed in April 2013, resulted in the lower production volumes at ORYX GTL. This shutdown enabled various key de-bottlenecking projects and has already resulted in operational benefits since start-up, underpinning average throughput consistently above design capacity of 32 400 barrels/day. This performance continues to endorse the commercial viability of our GTL technology.
However, the favourable results at SSI were offset by the operating loss at Sasol Petroleum International (SPI). Production volumes from our combined upstream assets in Mozambique, Canada and Gabon were 16% higher than the previous year. The prior year operating loss at SPI was impacted by the partial impairment related to our Canadian shale gas assets as well as the impairment of Blocks 16&19 in Mozambique and the dry well in Australia, totalling R1,7 billion. The current year has not seen further impairments of these assets, although we did write-off the Mupeji-1 dry well in Mozambique for R442 million. This positive impact has been offset by low gas market prices and higher depreciation at our Canadian operations, in addition to increased exploration costs. Our Canadian asset continues to be under pressure due to the low natural gas prices, coupled with higher than expected drilling and completion costs and sub-surface complexities. Our Canadian shale gas operations continue to contribute on an earnings before interest, tax, depreciation and amortisation basis.
The Chemical cluster was negatively affected by the ongoing European debt crisis, which reduced demand and continued to depress chemical prices. Sasol Olefins and Surfactants (Sasol O&S) remains a strong performer, contributing significantly to the total Chemical cluster’s operating profit of R1 919 million. Sasol O&S managed to maintain its gross margins, and saw improvement in some regions, despite some reductions in volumes. Difficult trading conditions continued to prevail for Sasol Solvents. Margins contracted on the back of continued higher feedstock prices and declining US dollar selling prices, despite higher sales volumes. Sasol Polymers recorded an operating loss of R2 829 million for the period. Although the South African polymer business reflected increases in both production and sales volumes, this increase was offset by the continued margin squeeze experienced in the South African polymers business, where feedstock price increases outweighed the increases in selling prices. ASPC has again performed well during this period and contributed positively to the Sasol Polymers’ business, excluding the partial impairment of our ASPC operations of R3,6 billion and translation losses of R2,0 billion relating to the depreciation of the Iranian Rial against the US dollar. ASPC achieved a capacity utilisation rate of 80% for the year. With effect from 16 August 2013, we disposed of our investment in ASPC for R3 606 million (US$365 million). The purchase consideration is payable in cash for the net assets, dividends and shareholder loans. Our other chemical businesses have performed well, in particular the ammonia
chief financial officer’s review continued
Saso
l Lim
ited
com
pany
note
s to
the
fina
ncia
l sta
tem
ents
Saso
l Lim
ited
grou
p co
nsol
idat
ed fi
nanc
ial s
tate
men
tsSa
sol o
verv
iew
15
business housed in Sasol Infrachem. Sasol Wax’s operating profit, excluding the partial impairment of the FT wax expansion project of R2,1 billion, increased by 106% compared to the prior year, on a similar basis.
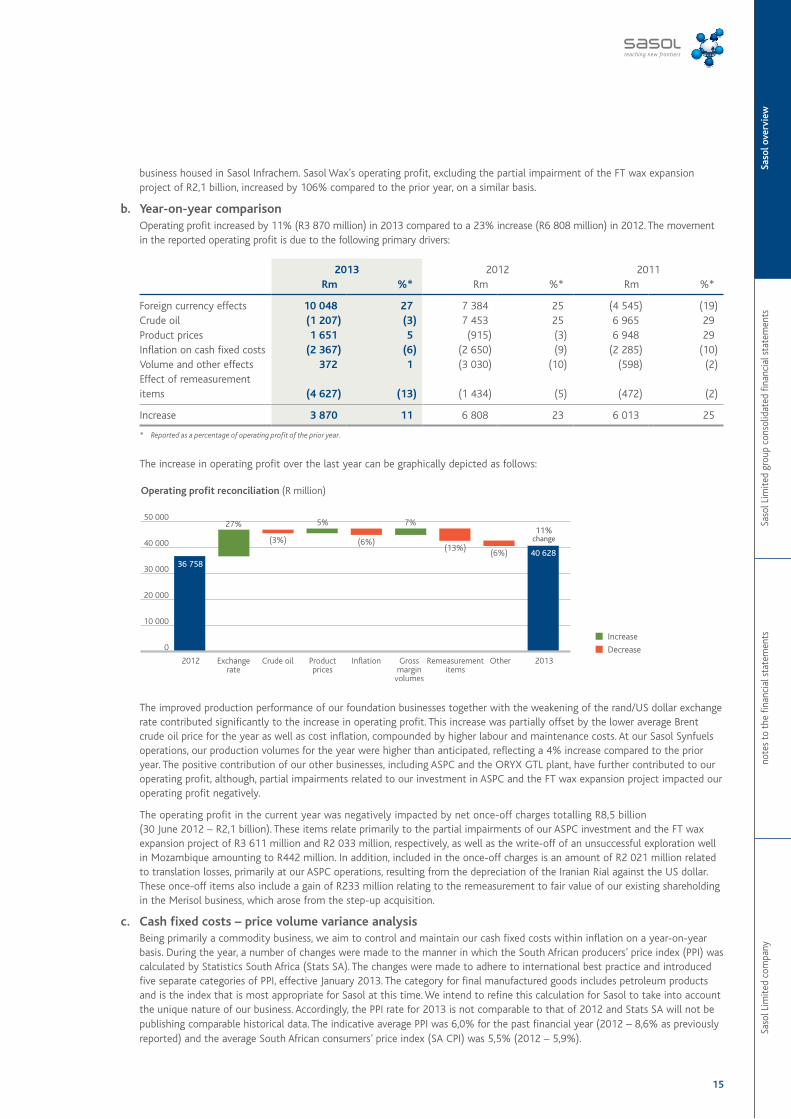
b. Year-on-year comparison Operating profit increased by 11% (R3 870 million) in 2013 compared to a 23% increase (R6 808 million) in 2012. The movement
in the reported operating profit is due to the following primary drivers:
2013 2012 2011Rm %* Rm %* Rm %*
Foreign currency effects 10 048 27 7 384 25 (4 545) (19)Crude oil (1 207) (3) 7 453 25 6 965 29Product prices 1 651 5 (915) (3) 6 948 29Inflation on cash fixed costs (2 367) (6) (2 650) (9) (2 285) (10)Volume and other effects 372 1 (3 030) (10) (598) (2)Effect of remeasurement items (4 627) (13) (1 434) (5) (472) (2)
Increase 3 870 11 6 808 23 6 013 25
* Reported as a percentage of operating profit of the prior year.
The increase in operating profit over the last year can be graphically depicted as follows:
The improved production performance of our foundation businesses together with the weakening of the rand/US dollar exchange rate contributed significantly to the increase in operating profit. This increase was partially offset by the lower average Brent crude oil price for the year as well as cost inflation, compounded by higher labour and maintenance costs. At our Sasol Synfuels operations, our production volumes for the year were higher than anticipated, reflecting a 4% increase compared to the prior year. The positive contribution of our other businesses, including ASPC and the ORYX GTL plant, have further contributed to our operating profit, although, partial impairments related to our investment in ASPC and the FT wax expansion project impacted our operating profit negatively.
The operating profit in the current year was negatively impacted by net once-off charges totalling R8,5 billion (30 June 2012 – R2,1 billion). These items relate primarily to the partial impairments of our ASPC investment and the FT wax expansion project of R3 611 million and R2 033 million, respectively, as well as the write-off of an unsuccessful exploration well in Mozambique amounting to R442 million. In addition, included in the once-off charges is an amount of R2 021 million related to translation losses, primarily at our ASPC operations, resulting from the depreciation of the Iranian Rial against the US dollar. These once-off items also include a gain of R233 million relating to the remeasurement to fair value of our existing shareholding in the Merisol business, which arose from the step-up acquisition.
c. Cash fixed costs – price volume variance analysis Being primarily a commodity business, we aim to control and maintain our cash fixed costs within inflation on a year-on-year
basis. During the year, a number of changes were made to the manner in which the South African producers’ price index (PPI) was calculated by Statistics South Africa (Stats SA). The changes were made to adhere to international best practice and introduced five separate categories of PPI, effective January 2013. The category for final manufactured goods includes petroleum products and is the index that is most appropriate for Sasol at this time. We intend to refine this calculation for Sasol to take into account the unique nature of our business. Accordingly, the PPI rate for 2013 is not comparable to that of 2012 and Stats SA will not be publishing comparable historical data. The indicative average PPI was 6,0% for the past financial year (2012 – 8,6% as previously reported) and the average South African consumers’ price index (SA CPI) was 5,5% (2012 – 5,9%).
16
Saso
l ann
ual fi
nanc
ial s
tate
men
ts 2
013
AFS
Sasol Limited group
The achievement of our objective may be negatively impacted by: • Expenditure on safety and plant maintenance; • Labour, electricity and other operating costs which escalate beyond inflation; • Costs incurred on growth initiatives and new projects; and • Currency effects.
2013Rm
%change
2012Rm
%change
2011Rm
Cash fixed costs 41 992 18 35 568 12 31 678
Current operations 40 159 34 799 31 765 Once-off items and growth initiatives 1 833 769 (87)
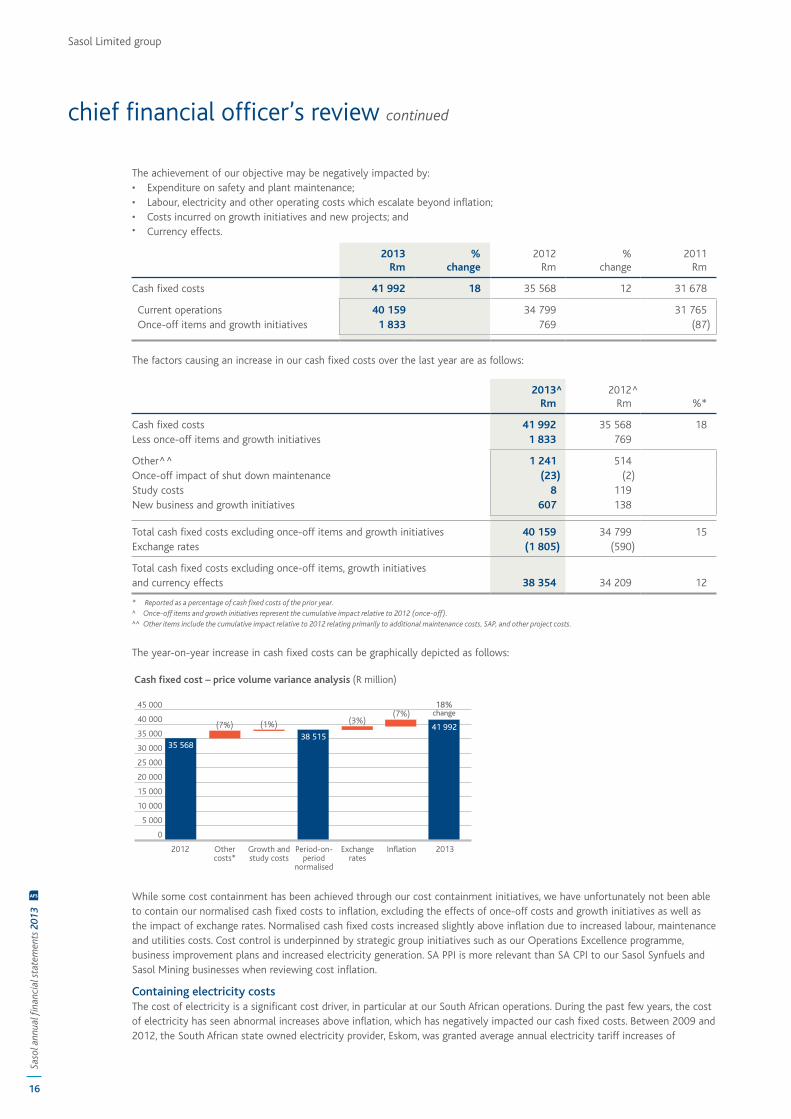
The factors causing an increase in our cash fixed costs over the last year are as follows:
2013^Rm
2012^Rm %*
Cash fixed costs 41 992 35 568 18Less once-off items and growth initiatives 1 833 769
Other^^ 1 241 514Once-off impact of shut down maintenance (23) (2)Study costs 8 119New business and growth initiatives 607 138
Total cash fixed costs excluding once-off items and growth initiatives 40 159 34 799 15Exchange rates (1 805) (590)
Total cash fixed costs excluding once-off items, growth initiatives and currency effects 38 354 34 209 12
* Reported as a percentage of cash fixed costs of the prior year.^ Once-off items and growth initiatives represent the cumulative impact relative to 2012 (once-off).^^ Other items include the cumulative impact relative to 2012 relating primarily to additional maintenance costs, SAP, and other project costs.
The year-on-year increase in cash fixed costs can be graphically depicted as follows:
While some cost containment has been achieved through our cost containment initiatives, we have unfortunately not been able to contain our normalised cash fixed costs to inflation, excluding the effects of once-off costs and growth initiatives as well as the impact of exchange rates. Normalised cash fixed costs increased slightly above inflation due to increased labour, maintenance and utilities costs. Cost control is underpinned by strategic group initiatives such as our Operations Excellence programme, business improvement plans and increased electricity generation. SA PPI is more relevant than SA CPI to our Sasol Synfuels and Sasol Mining businesses when reviewing cost inflation.
Containing electricity costs The cost of electricity is a significant cost driver, in particular at our South African operations. During the past few years, the cost
of electricity has seen abnormal increases above inflation, which has negatively impacted our cash fixed costs. Between 2009 and 2012, the South African state owned electricity provider, Eskom, was granted average annual electricity tariff increases of
chief financial officer’s review continued
Saso
l Lim
ited
com
pany
note
s to
the
fina
ncia
l sta
tem
ents
Saso
l Lim
ited
grou
p co
nsol
idat
ed fi
nanc
ial s
tate
men
tsSa
sol o
verv
iew
17
between 24,8% and 31,3%. In March 2012, the National Energy Regulator of South Africa (NERSA) announced that Eskom’s electricity tariffs will rise by about 16,0% in 2012/13 against an earlier published 26,0% increase. NERSA further confirmed in February 2013, that for the next five years commencing 2013/14, electricity increases would be contained to 8,0% per annum. These increases will continue to have a material adverse effect on our cash fixed costs in the future.
In order to contain the cost of electricity, we have continued to further our own electricity generation initiatives. In South Africa, we have the capacity to generate around 69% of our own electricity requirements. This was facilitated through the construction of the Sasolburg gas engine power plant. In addition, we have also installed power generation facilities at our German operations. We have been able to mitigate this risk to some extent by entering into a Power Purchase Agreement with Eskom following the construction of our power generation facility in Secunda in August 2011.
Managing our labour costs One of our most significant costs is labour. More than 60% of our employees are members of trade unions or works councils
covered by collective agreements entered into with these parties. In South Africa, we have concluded wage negotiations for 2014 for increases between 7,5% and 8,25%, of which increases in the different sectors are as follows: • Mining sector: An increase of 8,0%, effective 1 July 2013, with an additional service increment of 0,5%, effective
1 January 2014; • Chemicals sector: An increase of 7,5% effective 1 July 2013; and • Petroleum sector: A two year agreement was reached with an increase of 8,0%, effective 1 July 2012, and an increase,
effective 1 July 2013, of CPI plus 2,0%, with a guaranteed minimum of 7,0% and a capped maximum of 10,0%.
Our total employee costs, including share-based payment expenses, were R23,5 billion for the year compared to R19,5 billion in the previous year. The increase in labour costs is primarily due to average annual inflationary increases of 7%, increased share-based payment expenses related to the performance of the Sasol ordinary share price, an increase in employee benefit costs, an increase in employee numbers growth, as well as the effects of exchange rates. As part of our cost optimisation project, we are critically reviewing the operational and associated management structures in the group. We will be reviewing the impact on our functions in due course.
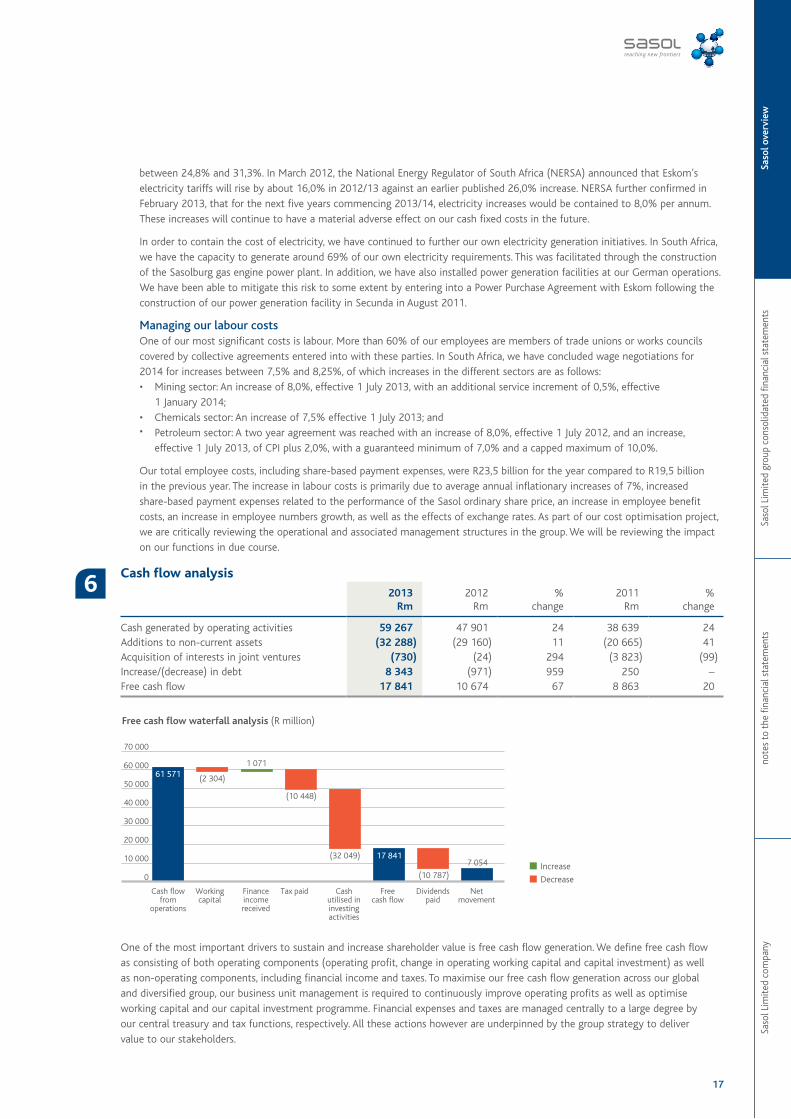
6 Cash flow analysis
2013Rm
2012Rm
%change
2011Rm
%change
Cash generated by operating activities 59 267 47 901 24 38 639 24Additions to non-current assets (32 288) (29 160) 11 (20 665) 41Acquisition of interests in joint ventures (730) (24) 294 (3 823) (99)Increase/(decrease) in debt 8 343 (971) 959 250 –Free cash flow 17 841 10 674 67 8 863 20
One of the most important drivers to sustain and increase shareholder value is free cash flow generation. We define free cash flow as consisting of both operating components (operating profit, change in operating working capital and capital investment) as well as non-operating components, including financial income and taxes. To maximise our free cash flow generation across our global and diversified group, our business unit management is required to continuously improve operating profits as well as optimise working capital and our capital investment programme. Financial expenses and taxes are managed centrally to a large degree by our central treasury and tax functions, respectively. All these actions however are underpinned by the group strategy to deliver value to our stakeholders.
18
Saso
l ann
ual fi
nanc
ial s
tate
men
ts 2
013
AFS
Sasol Limited group
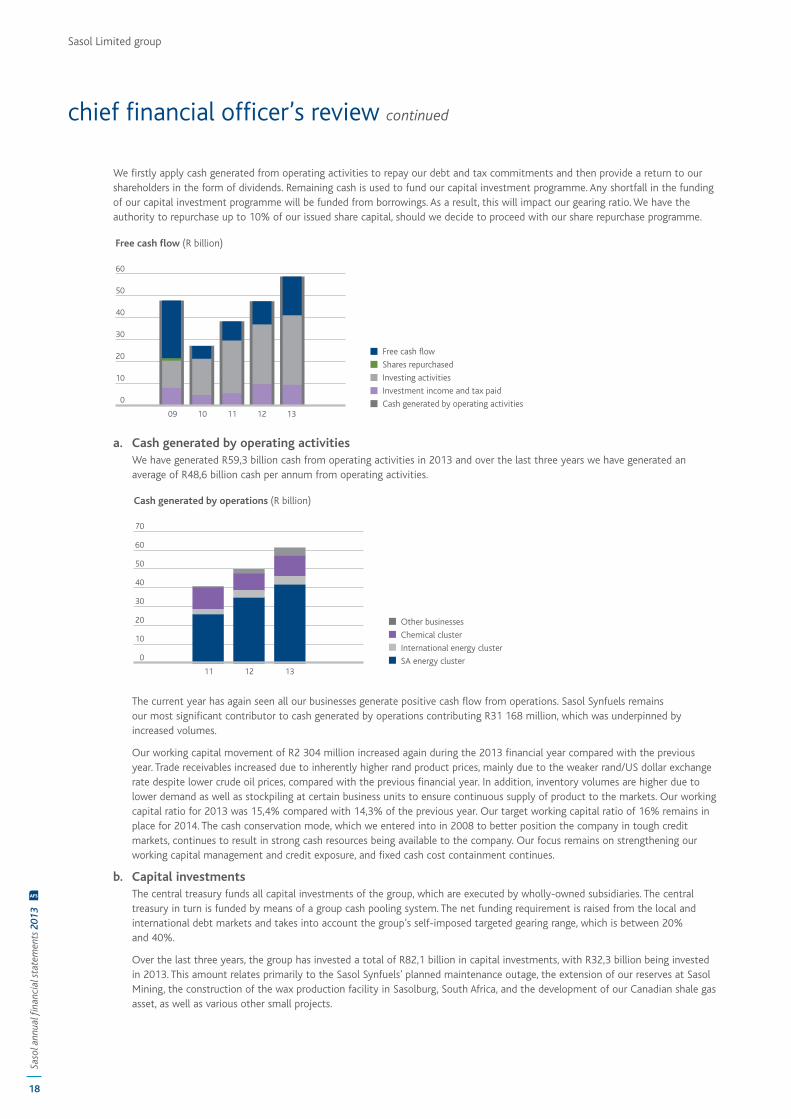
We firstly apply cash generated from operating activities to repay our debt and tax commitments and then provide a return to our shareholders in the form of dividends. Remaining cash is used to fund our capital investment programme. Any shortfall in the funding of our capital investment programme will be funded from borrowings. As a result, this will impact our gearing ratio. We have the authority to repurchase up to 10% of our issued share capital, should we decide to proceed with our share repurchase programme.
a. Cash generated by operating activities We have generated R59,3 billion cash from operating activities in 2013 and over the last three years we have generated an
average of R48,6 billion cash per annum from operating activities.
The current year has again seen all our businesses generate positive cash flow from operations. Sasol Synfuels remains our most significant contributor to cash generated by operations contributing R31 168 million, which was underpinned by increased volumes.
Our working capital movement of R2 304 million increased again during the 2013 financial year compared with the previous year. Trade receivables increased due to inherently higher rand product prices, mainly due to the weaker rand/US dollar exchange rate despite lower crude oil prices, compared with the previous financial year. In addition, inventory volumes are higher due to lower demand as well as stockpiling at certain business units to ensure continuous supply of product to the markets. Our working capital ratio for 2013 was 15,4% compared with 14,3% of the previous year. Our target working capital ratio of 16% remains in place for 2014. The cash conservation mode, which we entered into in 2008 to better position the company in tough credit markets, continues to result in strong cash resources being available to the company. Our focus remains on strengthening our working capital management and credit exposure, and fixed cash cost containment continues.
b. Capital investments The central treasury funds all capital investments of the group, which are executed by wholly-owned subsidiaries. The central
treasury in turn is funded by means of a group cash pooling system. The net funding requirement is raised from the local and international debt markets and takes into account the group’s self-imposed targeted gearing range, which is between 20% and 40%.
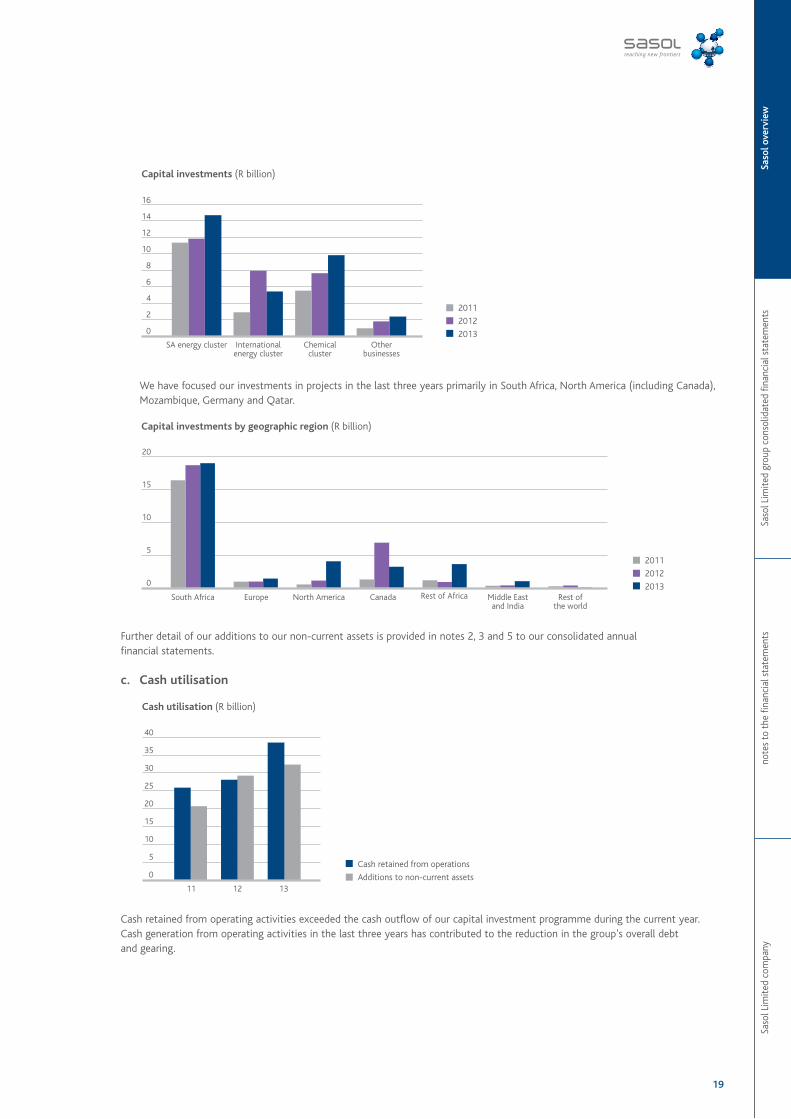
Over the last three years, the group has invested a total of R82,1 billion in capital investments, with R32,3 billion being invested in 2013. This amount relates primarily to the Sasol Synfuels’ planned maintenance outage, the extension of our reserves at Sasol Mining, the construction of the wax production facility in Sasolburg, South Africa, and the development of our Canadian shale gas asset, as well as various other small projects.
chief financial officer’s review continued
Saso
l Lim
ited
com
pany
note
s to
the
fina
ncia
l sta
tem
ents
Saso
l Lim
ited
grou
p co
nsol
idat
ed fi
nanc
ial s
tate
men
tsSa
sol o
verv
iew
19
We have focused our investments in projects in the last three years primarily in South Africa, North America (including Canada), Mozambique, Germany and Qatar.
Further detail of our additions to our non-current assets is provided in notes 2, 3 and 5 to our consolidated annual financial statements.
c. Cash utilisation
Cash retained from operating activities exceeded the cash outflow of our capital investment programme during the current year. Cash generation from operating activities in the last three years has contributed to the reduction in the group’s overall debt and gearing.
20
Saso
l ann
ual fi
nanc
ial s
tate
men
ts 2
013
AFS
Sasol Limited group
7 Capital investment programme
Our capital investments support the group’s strategic agenda in continuously nurturing and growing our existing asset base, while expanding and delivering on our growth aspirations both locally and internationally. We have a proven track record in respect of the strategic allocation of capital, which has delivered returns on invested capital consistently above our weighted average cost of capital (WACC), as well as our internal hurdle rates, with exception of 2009. In this year, the entire market was affected by the global economic crisis. This demonstrates our ability to sustainably grow long-term shareholder value.
a. A solid allocation process We have a solid process in place to ensure that we allocate capital optimally. All capital investment projects are rigorously
screened by various governance structures, which support the group executive committee and the Sasol Limited board. Capital investment projects are grouped into the following broad categories; namely growth projects and sustenance projects. Our growth projects are those which are proven to be economically justifiable and improve capacity efficiencies (including cost savings initiatives) as well as new business opportunities. Our sustenance projects comprise both mandatory, which are related to safety and compliance, and discretionary projects (including renewal and non-statutory maintenance). All projects are evaluated against prioritisation criteria and ranked with a focus on risks and returns. The prioritisation criteria include, inter alia, strategic alignment, competitive advantage, business robustness, financial returns, project risk and execution capability, project maturity and markets. Capital Excellence is a strategic group imperative with a focus to enhance project returns through project execution and robustness of key project assumptions.
The trend analysis for expenditure is illustrated below:
b. Meeting our hurdle rates In general, approximately 80% of all new capital investment projects are required to provide a targeted return of at least
1,3 times our WACC, which is currently 12,95% in South African rand terms and 8,00% to 11,20% in Europe and 8,00% in the US in US dollar terms. This rate of return does not apply to sustenance capital expenditure on existing operations, in particular environmental projects that are typically difficult to demonstrate economic viability.
c. Financing our capital investments We actively consider all alternatives to fund our capital investments. Internal funding options, such as the phasing or reduction of
capital expenditure and enhancing project economics through our Capital Excellence programme, as well as cost optimisation, are generally preferred to more expensive debt and equity funding. However, these internal alternatives include an element of risk and associated costs, for example, the potential loss of synergies following the phasing of a capital project. Given the scale of the capital requirements for our growth initiatives and potential impact on the group’s gearing and credit rating, we consider various funding alternatives, including specific project financing, export credit agency funding, bank loans as well as corporate and project bonds. Equity funding is expensive until projects are commissioned and therefore is not the preferred option to fund our capital projects. Where projects are executed in partnerships and in foreign jurisdictions, particularly those where an element of political risk exists, project finance is used as a development tool to mitigate such risk as well as geographic and concentration risk and to some extent, liquidity risk. This view is based on the principle that if an economically viable project has been developed using a sound project finance risk allocation approach, it is likely to be funded in the international markets.
Our growth aspirations have been prioritised as we steadily advance our growth strategy, in particular North America. Capital investment in this region will constitute a significant portion of our total capital expenditure over the next 10 years. Our gearing remains low currently and we have sufficient headroom in our balance sheet to fund our growth opportunities, grow dividends and provide a buffer against volatilities. Given that a large portion of our funding for our capital intensive growth plan will come from the offshore debt markets, we are acutely aware that we need to manage our gearing within our long-term targeted range. We expect that our gearing is likely to reach our targeted gearing range of 20% – 40% by 2015, but to return to within this
chief financial officer’s review continued
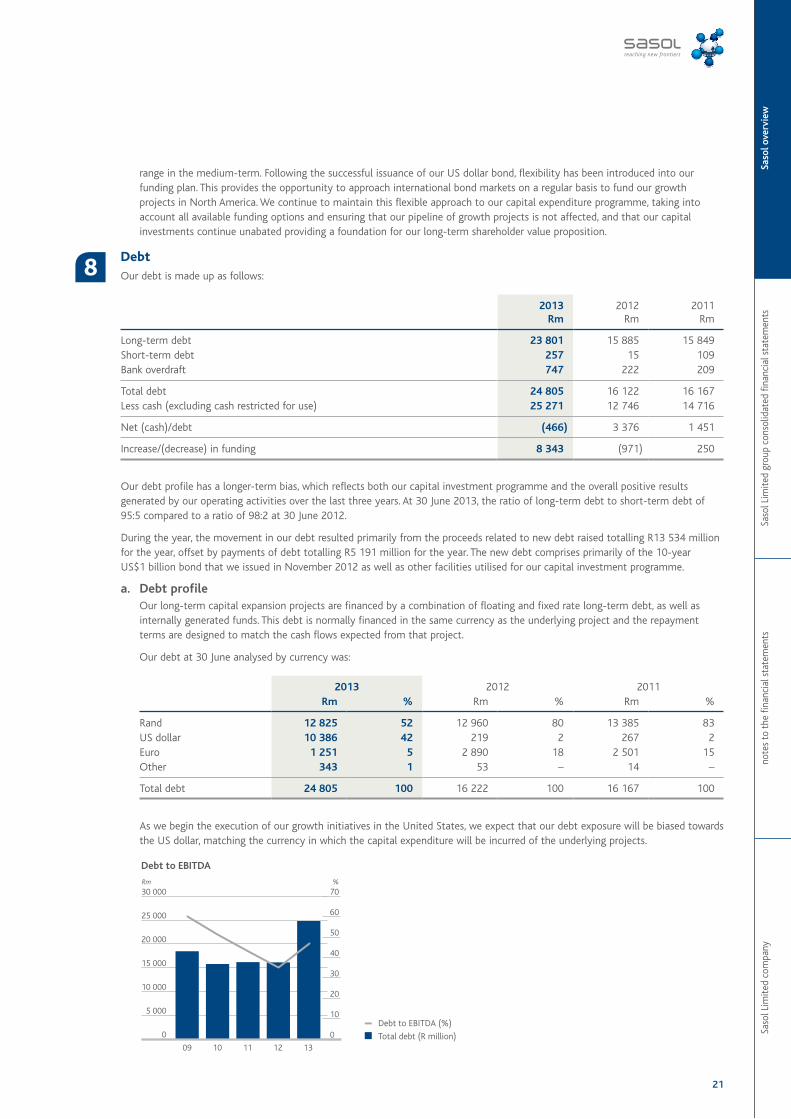
Saso
l Lim
ited
com
pany
note
s to
the
fina
ncia
l sta
tem
ents
Saso
l Lim
ited
grou
p co
nsol
idat
ed fi
nanc
ial s
tate
men
tsSa
sol o
verv
iew
21
range in the medium-term. Following the successful issuance of our US dollar bond, flexibility has been introduced into our funding plan. This provides the opportunity to approach international bond markets on a regular basis to fund our growth projects in North America. We continue to maintain this flexible approach to our capital expenditure programme, taking into account all available funding options and ensuring that our pipeline of growth projects is not affected, and that our capital investments continue unabated providing a foundation for our long-term shareholder value proposition.
8 Debt
Our debt is made up as follows:
2013Rm
2012Rm
2011Rm
Long-term debt 23 801 15 885 15 849Short-term debt 257 15 109Bank overdraft 747 222 209
Total debt 24 805 16 122 16 167Less cash (excluding cash restricted for use) 25 271 12 746 14 716
Net (cash)/debt (466) 3 376 1 451
Increase/(decrease) in funding 8 343 (971) 250
Our debt profile has a longer-term bias, which reflects both our capital investment programme and the overall positive results generated by our operating activities over the last three years. At 30 June 2013, the ratio of long-term debt to short-term debt of 95:5 compared to a ratio of 98:2 at 30 June 2012.
During the year, the movement in our debt resulted primarily from the proceeds related to new debt raised totalling R13 534 million for the year, offset by payments of debt totalling R5 191 million for the year. The new debt comprises primarily of the 10-year US$1 billion bond that we issued in November 2012 as well as other facilities utilised for our capital investment programme.
a. Debt profile Our long-term capital expansion projects are financed by a combination of floating and fixed rate long-term debt, as well as
internally generated funds. This debt is normally financed in the same currency as the underlying project and the repayment terms are designed to match the cash flows expected from that project.
Our debt at 30 June analysed by currency was:
2013 2012 2011Rm % Rm % Rm %
Rand 12 825 52 12 960 80 13 385 83US dollar 10 386 42 219 2 267 2Euro 1 251 5 2 890 18 2 501 15Other 343 1 53 – 14 –
Total debt 24 805 100 16 222 100 16 167 100
As we begin the execution of our growth initiatives in the United States, we expect that our debt exposure will be biased towards the US dollar, matching the currency in which the capital expenditure will be incurred of the underlying projects.
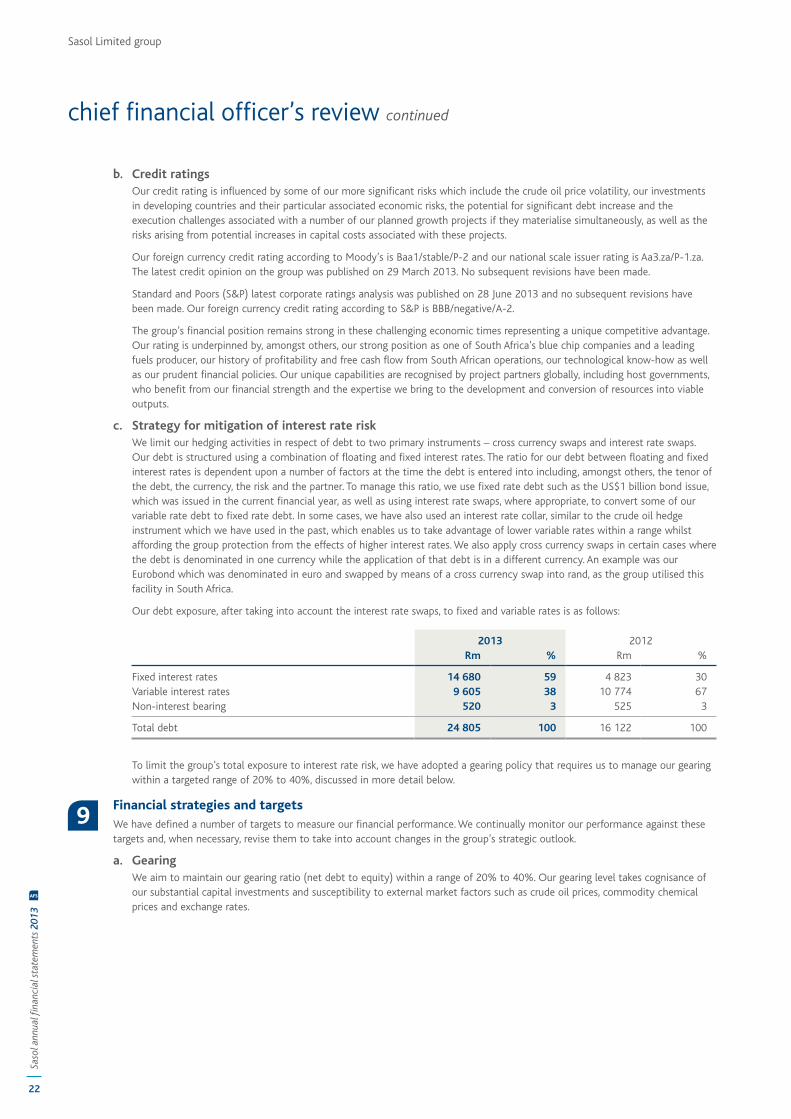
22
Saso
l ann
ual fi
nanc
ial s
tate
men
ts 2
013
AFS
Sasol Limited group
b. Credit ratings Our credit rating is influenced by some of our more significant risks which include the crude oil price volatility, our investments
in developing countries and their particular associated economic risks, the potential for significant debt increase and the execution challenges associated with a number of our planned growth projects if they materialise simultaneously, as well as the risks arising from potential increases in capital costs associated with these projects.
Our foreign currency credit rating according to Moody’s is Baa1/stable/P-2 and our national scale issuer rating is Aa3.za/P-1.za. The latest credit opinion on the group was published on 29 March 2013. No subsequent revisions have been made.
Standard and Poors (S&P) latest corporate ratings analysis was published on 28 June 2013 and no subsequent revisions have been made. Our foreign currency credit rating according to S&P is BBB/negative/A-2.
The group’s financial position remains strong in these challenging economic times representing a unique competitive advantage. Our rating is underpinned by, amongst others, our strong position as one of South Africa’s blue chip companies and a leading fuels producer, our history of profitability and free cash flow from South African operations, our technological know-how as well as our prudent financial policies. Our unique capabilities are recognised by project partners globally, including host governments, who benefit from our financial strength and the expertise we bring to the development and conversion of resources into viable outputs.
c. Strategy for mitigation of interest rate risk We limit our hedging activities in respect of debt to two primary instruments – cross currency swaps and interest rate swaps.
Our debt is structured using a combination of floating and fixed interest rates. The ratio for our debt between floating and fixed interest rates is dependent upon a number of factors at the time the debt is entered into including, amongst others, the tenor of the debt, the currency, the risk and the partner. To manage this ratio, we use fixed rate debt such as the US$1 billion bond issue, which was issued in the current financial year, as well as using interest rate swaps, where appropriate, to convert some of our variable rate debt to fixed rate debt. In some cases, we have also used an interest rate collar, similar to the crude oil hedge instrument which we have used in the past, which enables us to take advantage of lower variable rates within a range whilst affording the group protection from the effects of higher interest rates. We also apply cross currency swaps in certain cases where the debt is denominated in one currency while the application of that debt is in a different currency. An example was our Eurobond which was denominated in euro and swapped by means of a cross currency swap into rand, as the group utilised this facility in South Africa.
Our debt exposure, after taking into account the interest rate swaps, to fixed and variable rates is as follows:
2013 2012Rm % Rm %
Fixed interest rates 14 680 59 4 823 30Variable interest rates 9 605 38 10 774 67Non-interest bearing 520 3 525 3
Total debt 24 805 100 16 122 100
To limit the group’s total exposure to interest rate risk, we have adopted a gearing policy that requires us to manage our gearing within a targeted range of 20% to 40%, discussed in more detail below.
9 Financial strategies and targets
We have defined a number of targets to measure our financial performance. We continually monitor our performance against these targets and, when necessary, revise them to take into account changes in the group’s strategic outlook.
a. Gearing We aim to maintain our gearing ratio (net debt to equity) within a range of 20% to 40%. Our gearing level takes cognisance of
our substantial capital investments and susceptibility to external market factors such as crude oil prices, commodity chemical prices and exchange rates.
chief financial officer’s review continued
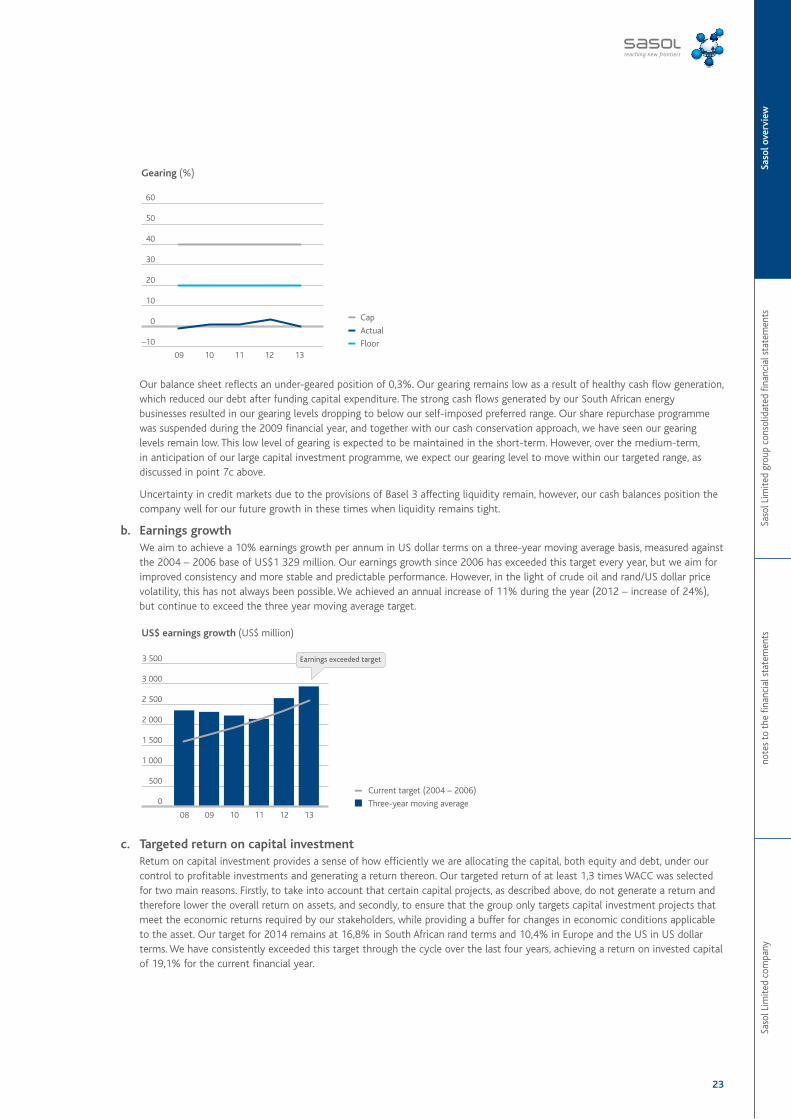
Saso
l Lim
ited
com
pany
note
s to
the
fina
ncia
l sta
tem
ents
Saso
l Lim
ited
grou
p co
nsol
idat
ed fi
nanc
ial s
tate
men
tsSa
sol o
verv
iew
23
Our balance sheet reflects an under-geared position of 0,3%. Our gearing remains low as a result of healthy cash flow generation, which reduced our debt after funding capital expenditure. The strong cash flows generated by our South African energy businesses resulted in our gearing levels dropping to below our self-imposed preferred range. Our share repurchase programme was suspended during the 2009 financial year, and together with our cash conservation approach, we have seen our gearing levels remain low. This low level of gearing is expected to be maintained in the short-term. However, over the medium-term, in anticipation of our large capital investment programme, we expect our gearing level to move within our targeted range, as discussed in point 7c above.
Uncertainty in credit markets due to the provisions of Basel 3 affecting liquidity remain, however, our cash balances position the company well for our future growth in these times when liquidity remains tight.
b. Earnings growth We aim to achieve a 10% earnings growth per annum in US dollar terms on a three-year moving average basis, measured against
the 2004 – 2006 base of US$1 329 million. Our earnings growth since 2006 has exceeded this target every year, but we aim for improved consistency and more stable and predictable performance. However, in the light of crude oil and rand/US dollar price volatility, this has not always been possible. We achieved an annual increase of 11% during the year (2012 – increase of 24%), but continue to exceed the three year moving average target.
c. Targeted return on capital investment Return on capital investment provides a sense of how efficiently we are allocating the capital, both equity and debt, under our
control to profitable investments and generating a return thereon. Our targeted return of at least 1,3 times WACC was selected for two main reasons. Firstly, to take into account that certain capital projects, as described above, do not generate a return and therefore lower the overall return on assets, and secondly, to ensure that the group only targets capital investment projects that meet the economic returns required by our stakeholders, while providing a buffer for changes in economic conditions applicable to the asset. Our target for 2014 remains at 16,8% in South African rand terms and 10,4% in Europe and the US in US dollar terms. We have consistently exceeded this target through the cycle over the last four years, achieving a return on invested capital of 19,1% for the current financial year.
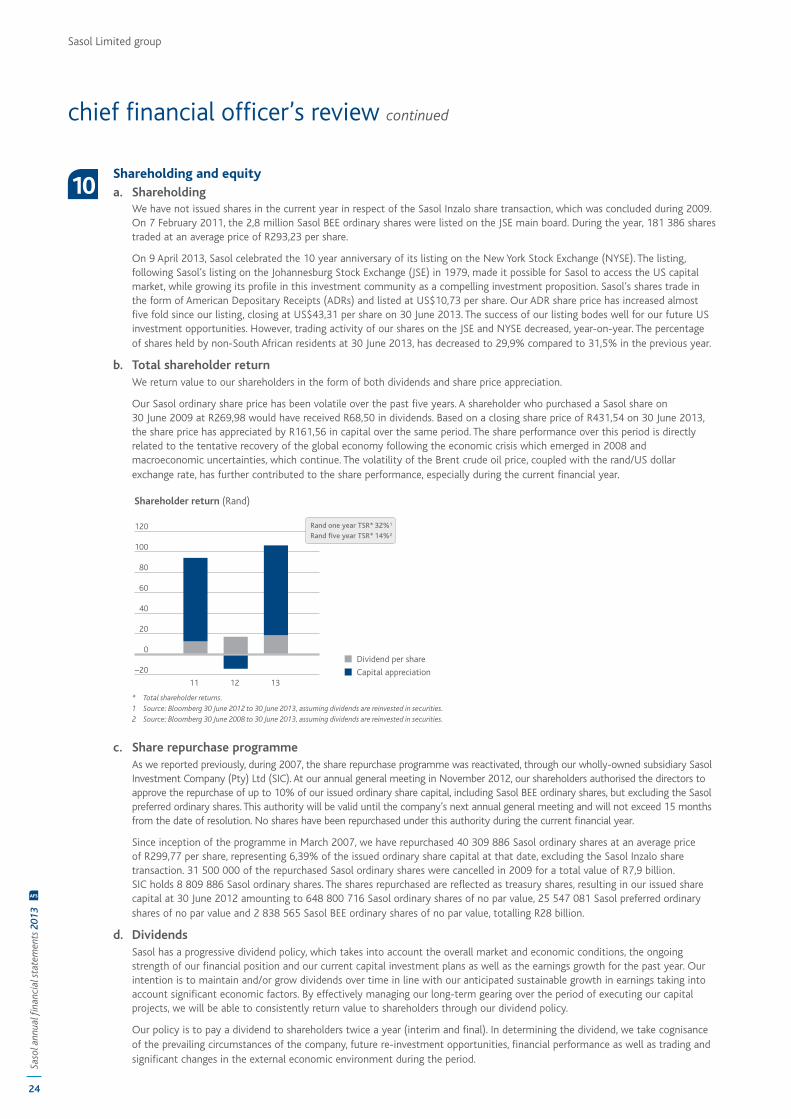
24
Saso
l ann
ual fi
nanc
ial s
tate
men
ts 2
013
AFS
Sasol Limited group
10 Shareholding and equity
a. Shareholding We have not issued shares in the current year in respect of the Sasol Inzalo share transaction, which was concluded during 2009.
On 7 February 2011, the 2,8 million Sasol BEE ordinary shares were listed on the JSE main board. During the year, 181 386 shares traded at an average price of R293,23 per share.
On 9 April 2013, Sasol celebrated the 10 year anniversary of its listing on the New York Stock Exchange (NYSE). The listing, following Sasol’s listing on the Johannesburg Stock Exchange (JSE) in 1979, made it possible for Sasol to access the US capital market, while growing its profile in this investment community as a compelling investment proposition. Sasol’s shares trade in the form of American Depositary Receipts (ADRs) and listed at US$10,73 per share. Our ADR share price has increased almost five fold since our listing, closing at US$43,31 per share on 30 June 2013. The success of our listing bodes well for our future US investment opportunities. However, trading activity of our shares on the JSE and NYSE decreased, year-on-year. The percentage of shares held by non-South African residents at 30 June 2013, has decreased to 29,9% compared to 31,5% in the previous year.
b. Total shareholder return We return value to our shareholders in the form of both dividends and share price appreciation.
Our Sasol ordinary share price has been volatile over the past five years. A shareholder who purchased a Sasol share on 30 June 2009 at R269,98 would have received R68,50 in dividends. Based on a closing share price of R431,54 on 30 June 2013, the share price has appreciated by R161,56 in capital over the same period. The share performance over this period is directly related to the tentative recovery of the global economy following the economic crisis which emerged in 2008 and macroeconomic uncertainties, which continue. The volatility of the Brent crude oil price, coupled with the rand/US dollar exchange rate, has further contributed to the share performance, especially during the current financial year.
* Total shareholder returns.1 Source: Bloomberg 30 June 2012 to 30 June 2013, assuming dividends are reinvested in securities.2 Source: Bloomberg 30 June 2008 to 30 June 2013, assuming dividends are reinvested in securities.
c. Share repurchase programme As we reported previously, during 2007, the share repurchase programme was reactivated, through our wholly-owned subsidiary Sasol
Investment Company (Pty) Ltd (SIC). At our annual general meeting in November 2012, our shareholders authorised the directors to approve the repurchase of up to 10% of our issued ordinary share capital, including Sasol BEE ordinary shares, but excluding the Sasol preferred ordinary shares. This authority will be valid until the company’s next annual general meeting and will not exceed 15 months from the date of resolution. No shares have been repurchased under this authority during the current financial year.
Since inception of the programme in March 2007, we have repurchased 40 309 886 Sasol ordinary shares at an average price of R299,77 per share, representing 6,39% of the issued ordinary share capital at that date, excluding the Sasol Inzalo share transaction. 31 500 000 of the repurchased Sasol ordinary shares were cancelled in 2009 for a total value of R7,9 billion. SIC holds 8 809 886 Sasol ordinary shares. The shares repurchased are reflected as treasury shares, resulting in our issued share capital at 30 June 2012 amounting to 648 800 716 Sasol ordinary shares of no par value, 25 547 081 Sasol preferred ordinary shares of no par value and 2 838 565 Sasol BEE ordinary shares of no par value, totalling R28 billion.
d. Dividends Sasol has a progressive dividend policy, which takes into account the overall market and economic conditions, the ongoing
strength of our financial position and our current capital investment plans as well as the earnings growth for the past year. Our intention is to maintain and/or grow dividends over time in line with our anticipated sustainable growth in earnings taking into account significant economic factors. By effectively managing our long-term gearing over the period of executing our capital projects, we will be able to consistently return value to shareholders through our dividend policy.
Our policy is to pay a dividend to shareholders twice a year (interim and final). In determining the dividend, we take cognisance of the prevailing circumstances of the company, future re-investment opportunities, financial performance as well as trading and significant changes in the external economic environment during the period.
chief financial officer’s review continued
Saso
l Lim
ited
com
pany
note
s to
the
fina
ncia
l sta
tem
ents
Saso
l Lim
ited
grou
p co
nsol
idat
ed fi
nanc
ial s
tate
men
tsSa
sol o
verv
iew
25
Our dividend for the year increased by 9% to R19,00 per share, which represents a dividend cover of 2,3 times, compared with R17,50 in 2012 and R13,00 in 2011. The growth in dividends demonstrates our commitment to a progressive dividend policy and to delivering value to shareholders.
11 Our financial priorities for the year ahead
Delivering on our top financial priorities for 2014 The past financial year has shown that Sasol is a company than can rise to challenges and achieve solid results at the same time.
The group-wide priorities for 2013 have remained constant for the year ahead, namely steadfast focus on improving safety, enhancing our operational performance, embedding a high performance culture and improving the way we work together as the Sasol team. Our chief executive officer, David Constable, has set out the top priorities for the group for 2014. These have taken into account the critical issues which need to be addressed in order to achieve our growth aspirations and build on the solid foundation that we have already created. But to go from strength to strength, we must get the fundamental operating performance right, ensuring that we have stability, reliability and maintainability of our operations throughout the world.
To be successful long into the future, we need to deliver on our strategic agenda and provide value to our shareholders and employees. In 2014, we will continue to focus on four key areas, which overlap the 2013 deliverables: improving safety performance, enhancing business performance, accelerating sustainable growth and driving a high performance culture. These areas will allow us to focus on what we need to do better in the coming financial year, working together as an aligned Sasol team globally. They of course come with challenges and financial implications, which we will manage in order to achieve our business objectives so that we are able to operate sustainably on a foundation of sound governance.
Cost optimisation programme Improving business performance means that we need to make Sasol fit for the future. Accordingly, we are taking decisive and
proactive measures to secure our long-term growth and competitiveness. Following a detailed diagnostic study to better understand the root cause of our growing costs, we have renewed our cost optimisation drive and are implementing urgent actions to address both cost and complexity in Sasol.
To this end, we are simplifying our group-wide operating model to ensure that we become a more effective, efficient and competitive organisation. Our new operating model will be structured along an upstream, operations and sales and marketing value chain, with the core building blocks comprising marketing businesses, regional operating hubs, and group functions. Further detailed work, including the assessment of risks and reporting requirements associated with the new operating model, is still underway on the new operating model to progress it towards an implementable solution.
Along with an overhaul of Sasol’s operating model and our business performance enhancement programme, key drivers have been identified which will provide the basis for our cost optimisation programme. These drivers are aimed at gaining efficiencies from the new simplified operating model, improving operational productivity, redesigning ‘fit-for-purpose’ group functions and reducing procurement costs. Through this cost optimisation programme, we expect to generate a sustainable annual savings of at least R3 billion over the next two to three years.
Enhancing service performance Ensuring that as a group we are able to enhance business performance, the finance function must provide consistent support across
the businesses enabling us to work towards a common goal. Supporting our cost optimisation programme requires that our systems and processes are simplified, standardised and effective. This further speaks to a common platform from which we can operate, where we have optimised processes and reduced the amount of bureaucracy.
We had previously indicated that the implementation of a common information technology platform for the finance function for global rollout was being evaluated in support of enhancing business performance. As part of this project, we sought ways to optimise various financial functions, including intersegment transactions and our shared services offering. The scope and objectives of this common technology platform were reviewed, given our cost optimisation project. It was concluded that the first component of this project would be to deliver a solution that is standardised across the chemical businesses in the Southern Africa region. The second component would be to create standardised procurement processes in the Southern Africa region, which would link to the aforementioned chemical businesses solution as well as being extended into other existing environments. This approach would provide significant reductions in capital expenditure and lower the risk profile of the project.
We evaluate our reporting systems on an ongoing basis to ensure that they are up to date, stable and able to provide the financial reporting information required to manage our business in the most effective manner.
Sustainable growth for shareholders The two key pillars of our strategy are to expand and deliver in our growth businesses and nurture and grow our foundation
businesses. These are aimed at delivering sustainable, long-term returns to our stakeholders. Our strategy encompasses finding the right opportunities in the right geographical area and delivering within the timelines. The allocation of the capital investment supporting our strategic aspirations, in particular in North America, is continually reviewed. We continue to focus on improving the group’s capital projects portfolio management to ensure that capital is allocated to achieve the strategically aligned projects, which deliver the highest return in order to maximise shareholder value.
26
Saso
l ann
ual fi
nanc
ial s
tate
men
ts 2
013
AFS
Sasol Limited group
Delivering shareholder value through our growth aspirations is only achievable through the successful execution of our projects. Changes in project scope, construction delays, labour productivity and contracting strategies, amongst others, have a significant impact on the cost of executing the project. Increased costs could result in the project not meeting our internal hurdle rate making the project no longer economically viable. This in turn could result in the recognition of potential impairments related to the project. In addition, the method of financing these projects to ensure that our balance sheet remains intact while providing the most effective financing structure is essential to project execution. It is an imperative that during the execution phase of the projects, financial risks associated therewith are managed and mitigated. We aim to improve the group’s internal rate of return on capital projects by reducing capital costs and optimising project execution.
Investing in high-performing individuals Our success and delivery on our strategic growth aspirations will not be attainable without the right financial talent, in the right roles
at the right time delivering results. In these turbulent economic conditions, we require employees of the highest technical and leadership capabilities in the finance function to support the business. Talented people are recruited from around the globe and through both formal and informal training programmes, they are developed through our talent management programmes into exceptional leaders, working in collaboration as one team across the organisation. We are committed to maintaining a diverse and transformed workforce, with high-performing individuals who are accountable. This will support the development and strengthening of our core competencies and build capabilities across the organisation. It is equally important that we acknowledge outstanding performance amongst our people.
Investing in and retaining our talent is one of the ways in which we are able to deliver outstanding performance and value to our shareholders as well as provide a sustainable source of competitive advantage.
12 Conclusion
Overall, in the global economy there is still volatility and some uncertainty as the effects of the global economic crisis are still being felt within developed economies. Although some economies are showing signs of improvement, issues persist, especially with the continuing European debt crisis and the US debt ceiling. While growth rates are expected to improve, they have been lower than anticipated in certain developed and emerging economies, like China and India. Crude oil prices have remained volatile during the past year and we expect that they will continue to be volatile in the near term, due to the weakening demand for oil in Europe as well as lower than expected growth. This is coupled with higher oil supply and geopolitical developments. Off this base, product prices are expected to be equally volatile. The rand/US dollar exchange rate remains the single biggest external factor impacting our profitability. Given the continuing uncertain macroeconomic conditions and our assumptions in respect of crude oil and product prices, as well as the stronger rand/US dollar exchange rate, we will continue to manage the business with diligence. The current volatility and uncertainty of global markets make it difficult to be more precise on the outlook for the year ahead.
We remain on track to deliver on our expectations for improved operational performance. On the back of our cost optimisation programme, we aim to progress cost optimisation initiatives and to contain normalised cash fixed costs within South African PPI inflation. The macroeconomic conditions continue to be volatile, impacting our assumptions in respect of improved crude oil and product prices, weaker refining margins as well as the weaker rand/US dollar exchange rate. We will continue to progress our attractive growth projects, underpinned by our focus on improving operational efficiencies and working capital improvements. We have realised cash fixed cost savings from our previous cost containment initiatives and have been able to deliver a robust financial performance. Our balance sheet remains strong and is again testament to this focused approach and our commitment to deliver value.
Our focus in the year ahead remains on factors within our control: volume growth, margin improvement and cost containment. These areas will be underpinned by our group-wide priorities for 2014 as discussed above. We firmly believe that the forthcoming year promises both exciting opportunities and challenges alike.
13 Thanks and acknowledgement
I would like to thank our financial team for their diligence and continued support during a demanding year. While this year had its highlights, we as a team have overcome the challenges presented to us, including the change in the income statement presentation and preparation for the change in the external auditor. Through the determination and integrity displayed by our financial personnel as well as an understanding of the economic and financial pressures that we have had to contend with, together we have been able to deliver quality financial information for our stakeholders, which reflects our objectives and values for long-term success.
Christine Ramonchief financial officer
6 September 2013
chief financial officer’s review continued
Saso
l Lim
ited
com
pany
note
s to
the
fina
ncia
l sta
tem
ents
Saso
l Lim
ited
grou
p co
nsol
idat
ed fi
nanc
ial s
tate
men
tsSa
sol o
verv
iew
27
corporate governance
delegation of authority to management in specified matters and those matters reserved for board decision-making.
The board charter sets out the practices and processes the board has adopted to discharge its responsibilities. A copy is available on the company’s website, www.sasol.com, together with the terms of reference of all board and statutory committees and the company’s MOI.
The board charter specifies: • the demarcation of roles, functions, responsibilities and powers of
the board, the shareholders, chairman, lead independent director, individual directors, company secretary, other officials and the executives of the company;
• the terms of reference of the board and statutory committees; • matters reserved for final decision-making or pre-approval by the
board; and • the policies and practices of the board on matters such as
corporate governance, directors’ dealings in the securities of the company, declarations of conflicts of interest, board meeting documentation, alternative dispute resolution, business rescue proceedings and procedures, and the nomination, appointment, induction, training and evaluation of directors and members of board committees.
Within the powers the MOI confers on it, the board has determined its main function and responsibility to be to add significant value to the company by: • retaining full and effective control over the company and
providing effective leadership in the best interests of the company;
• determining the strategies and strategic objectives of the company and ensuring that strategy, risk, performance and sustainability considerations are effectively integrated and appropriately balanced;
• determining and setting the tone of the company’s values, including principles of ethical business practice and the requirements of being a responsible corporate citizen;
• bringing independent, informed and effective judgement and leadership to bear on material decisions of the company and group companies, including material company and group policies, the group framework of delegated authorities, appointment and removal of the chief executive officer, approval of the appointment or removal of group executive committee members, capital expenditure transactions and consolidated group budgets and company budgets;
• satisfying itself that the company and group entities are governed effectively in accordance with corporate governance best practice, including risk management, legal compliance management, appropriate and relevant non-binding industry rules, codes and standards, and internal control systems to
− maximise sustainable returns; − safeguard the people, assets and reputation of the group; and − ensure compliance with applicable laws and regulations.
• monitoring implementation by group entities, board committees and executive management of the board’s strategies, decisions, values and policies through a structured approach to governance, reporting, risk management and information management (including information technology);
Governance frameworkSasol applies sound corporate governance structures and processes, which the board considers pivotal to delivering sustainable growth in the interests of all stakeholders. Sasol’s values-driven culture and code of ethics underpin its governance structures and processes, committing the company to high standards of business integrity and ethics in all its activities.
Governance structures and processes are reviewed regularly, and adapted to accommodate internal developments and reflect national and international best practice. The board considers corporate governance to be a priority and endeavours to go beyond minimum compliance where appropriate. The board will therefore consider all new non-statutory corporate governance concepts carefully and will implement them if they are deemed to be in Sasol’s best interests. The application of governance requirements should facilitate, not detract from, the directors’ ability to execute their statutory and fiduciary responsibilities, and their duty of care and skill.
The nomination, governance, social and ethics committee and the board continue to review and benchmark the group’s governance structures and processes to ensure they support effective and ethical leadership, good corporate citizenship and sustainability.
Sasol’s ordinary shares and Sasol BEE ordinary shares are listed on the Johannesburg Stock Exchange operated by the JSE Limited (JSE). Sasol is also listed on the New York Stock Exchange (NYSE) for the purpose of registering the company’s American Depositary Shares with the United States Securities and Exchange Commission (SEC). Accordingly, the company is subject to, and has implemented controls to provide reasonable assurance of its compliance with, all relevant requirements in respect of its listings. These include the South African Companies Act, no 71 of 2008 (the SA Companies Act) and the JSE Listings Requirements, and SEC, NYSE and US legal requirements such as the Sarbanes-Oxley Act of 2002 (SOX) in so far as they apply to foreign companies listed on the NYSE.
Sasol applies all the principles of the King Code of Governance Principles for South Africa (King III Code). In some areas the board is of the view that, while recommended practice is being applied, further enhancements will be made over time in line with its objective to continuously improve corporate governance practices. A statement that confirms Sasol’s application of each of the King III Code’s 75 principles is available on www.sasol.com. Sasol has compared its corporate governance practices to the requirements imposed on domestic US companies listed on the NYSE, and complies with these governance standards in most significant respects. The significant differences, which relate to the composition of the remuneration committee and the nomination, governance, social and ethics committee, are set out in Sasol’s annual report on Form 20-F filed with the SEC.
Board powers and proceduresThe company’s memorandum of incorporation (MOI) and the board charter assign responsibility for strategic direction and control of the company to the board. The board exercises this control by way of the company’s governance framework, which includes detailed reporting to the board and its committees and a system of assurances on internal controls. The board regularly reviews and approves the
Sasol Limited group
28
Saso
l ann
ual fi
nanc
ial s
tate
men
ts 2
013
AFS
board matters, their duties and other governance responsibilities as directors. The induction is tailored to each director’s specific needs. Directors are briefed on legal developments and changes in the risk and general business environment on an ongoing basis.
The nomination, governance, social and ethics committee facilitates the evaluation of the effectiveness and performance of the board, its committees and the individual directors annually. The chairman, through the nomination, governance, social and ethics committee and assisted by the company secretary, leads the evaluation process. An independent evaluation of the board and individual directors was conducted at the end of the 2012 financial year. A self-assessment, by way of individual questionnaires, was performed in the 2013 financial year. No major concerns were raised in respect of the functioning of the board or any of its committees. One of the questions that directors had to address specifically focused on the balance of power and authority on the board, and the role of the chairman in ensuring that all directors have equal opportunity to participate in decision-making.
The nomination, governance, social and ethics committee and the board specifically consider the directors’ other commitments, such as other directorships, to determine whether each director has sufficient time to discharge his or her duties effectively. The lead independent director is responsible for ensuring that the performance of the chairman is evaluated annually, which was done during the year under review.
In terms of the company’s MOI, one-third of directors must retire at every annual general meeting and are eligible for re-election.
The independence of directors is evaluated in terms of the board’s policy, which is based on the applicable corporate governance requirements. The nomination, governance, social and ethics committee and the board make this determination when a director is first appointed, annually or at any other time when a director’s circumstances change and warrant re-evaluation. The board has determined that all the non-executive directors, except Mrs TH Nyasulu, are independent in accordance with the King III Code and NYSE rules. Mrs TH Nyasulu has a 1,275% indirect interest in Sasol Oil (Pty) Ltd, a subsidiary of Sasol Limited, and is therefore not independent in terms of the King III Code. Prof JE Schrempp and Dr MSV Gantsho have been in office for more than 10 years, but their independence has been confirmed after taking into account, among other considerations, the extent to which the diversity of their views, skills and experience continue to enhance the board’s effectiveness. The board is of the view that all non-executive directors exercise independent judgement at all times. The company’s directors, executives and senior employees are prohibited from dealing in Sasol securities during certain prescribed periods. The company secretary regularly informs directors, executives and senior employees of insider trading legislation and advises them of closed periods. A report on directors’ dealings in the company’s shares is tabled at each board meeting and disclosed in terms of the applicable JSE and NYSE requirements.
Directors’ declarations of personal financial interests are tabled annually. Additional or amended declarations of interest are circulated at every board meeting and annually at the nomination, governance, social and ethics committee meeting for consideration and noting.
• ensuring the company has an effective and independent audit committee, remuneration committee, risk and safety, health and environment (SHE) committee and nomination, governance, social and ethics committee;
• ensuring there is an effective risk-based internal audit; • governing the disclosure control processes of the company,
including the integrity of the company’s annual integrated report and reporting on the effectiveness of the company’s system of internal controls;
• ensuring that it considers business rescue proceedings or other turnaround mechanisms as soon as the company is financially distressed as defined in the SA Companies Act;
• ensuring that disputes are resolved as effectively, efficiently and expeditiously as possible; and
• monitoring the relationship between management and stakeholders of the company.
The board is satisfied that it fulfilled these duties and obligations during the past financial year.
Composition of the board and appointment of directorsDirectors’ biographies appear in the ‘Our board of directors’ section of the annual integrated report.
In terms of the company’s MOI, the board shall consist of a maximum of 16 directors of whom up to five may be executive directors. The board has determined the size of the board to be 14 for the time being. As at 6 September 2013, there are 13 directors, of whom three are executive directors, namely Mr DE Constable (chief executive officer), Mrs KC Ramon (chief financial officer)1 and Ms VN Fakude. The majority of the directors are non-executive directors, namely Mrs TH Nyasulu (chairman)2, Prof JE Schrempp (lead independent director), Mr C Beggs, Mr HG Dijkgraaf, Dr MSV Gantsho3, Ms IN Mkhize, Mr ZM Mkhize, Mr MJN Njeke, Mr PJ Robertson and Mr S Westwell.
Non-executive directors are chosen for their corporate leadership skills, experience and expertise required to advance the strategic direction of the company. The nomination, governance, social and ethics committee and the board take into account diversity in gender and race, as well as in business, geographic and academic backgrounds, when appointments to the board are considered. The board ensures that it has the right balance of skills, experience, independence and business knowledge necessary to discharge its responsibilities, in keeping with the highest standards of governance. In the board’s assessment, all directors have the relevant knowledge, skills and experience to make a meaningful contribution to the business of the company.
As at 6 September 2013, 54% of the board were historically disadvantaged South Africans, including women, and 31% were women. Seven of the eight South African citizens on the board in this period were from historically disadvantaged groups.
The directors are entitled to seek independent professional advice concerning the company’s affairs at Sasol’s expense, and to gain access to any information they may require in discharging their duties as directors.
Newly appointed directors are inducted under the guidance of the company secretary. They are apprised of the company’s business,
corporate governance continued
1 Mrs KC Ramon resigned as director and chief financial officer on 9 September 2013. Mr P Victor was appointed director and acting chief financial officer with effect from 10 September 2013.2 Mrs TH Nyasulu resigned as chairman and director with effect from 22 November 2013.3 Dr MSV Gantsho was appointed as chairman with effect from 22 November 2013.
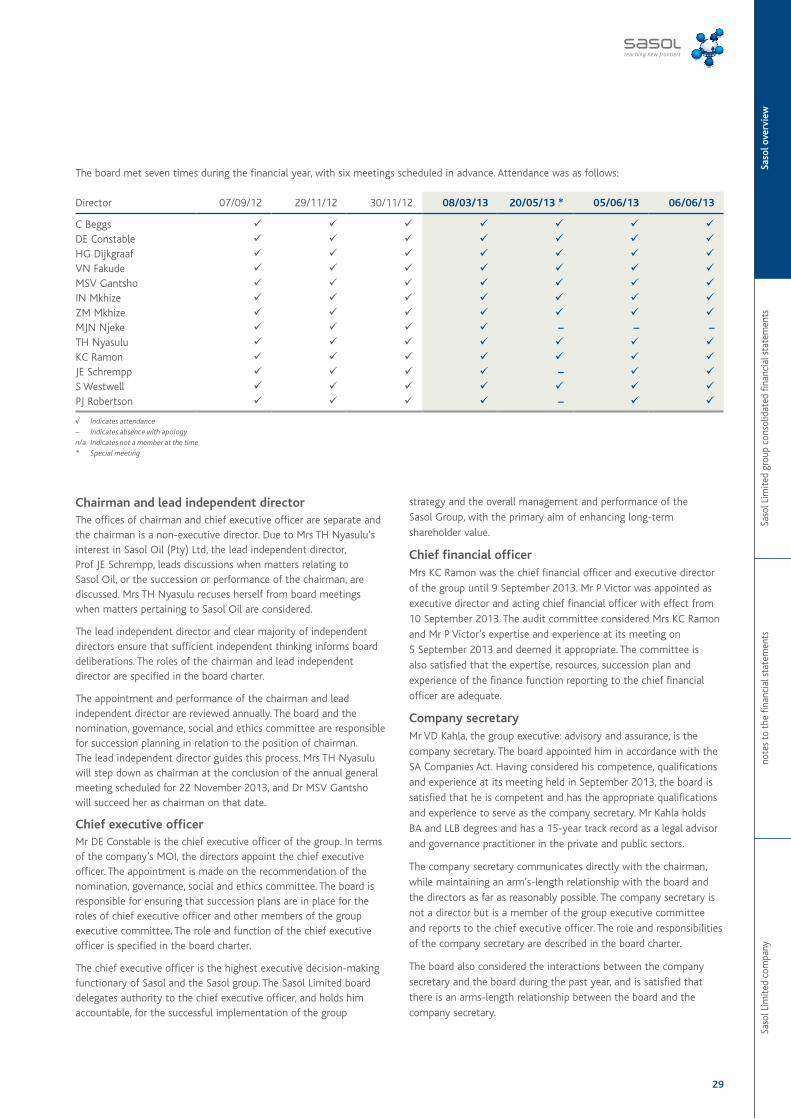
Saso
l Lim
ited
com
pany
note
s to
the
fina
ncia
l sta
tem
ents
Saso
l Lim
ited
grou
p co
nsol
idat
ed fi
nanc
ial s
tate
men
tsSa
sol o
verv
iew
29
strategy and the overall management and performance of the Sasol Group, with the primary aim of enhancing long-term shareholder value.
Chief financial officerMrs KC Ramon was the chief financial officer and executive director of the group until 9 September 2013. Mr P Victor was appointed as executive director and acting chief financial officer with effect from 10 September 2013. The audit committee considered Mrs KC Ramon and Mr P Victor’s expertise and experience at its meeting on 5 September 2013 and deemed it appropriate. The committee is also satisfied that the expertise, resources, succession plan and experience of the finance function reporting to the chief financial officer are adequate.
Company secretaryMr VD Kahla, the group executive: advisory and assurance, is the company secretary. The board appointed him in accordance with the SA Companies Act. Having considered his competence, qualifications and experience at its meeting held in September 2013, the board is satisfied that he is competent and has the appropriate qualifications and experience to serve as the company secretary. Mr Kahla holds BA and LLB degrees and has a 15-year track record as a legal advisor and governance practitioner in the private and public sectors.
The company secretary communicates directly with the chairman, while maintaining an arm’s-length relationship with the board and the directors as far as reasonably possible. The company secretary is not a director but is a member of the group executive committee and reports to the chief executive officer. The role and responsibilities of the company secretary are described in the board charter.
The board also considered the interactions between the company secretary and the board during the past year, and is satisfied that there is an arms-length relationship between the board and the company secretary.
The board met seven times during the financial year, with six meetings scheduled in advance. Attendance was as follows:
Director 07/09/12 29/11/12 30/11/12 08/03/13 20/05/13 * 05/06/13 06/06/13
C Beggs ü ü ü ü ü ü üDE Constable ü ü ü ü ü ü üHG Dijkgraaf ü ü ü ü ü ü üVN Fakude ü ü ü ü ü ü üMSV Gantsho ü ü ü ü ü ü üIN Mkhize ü ü ü ü ü ü üZM Mkhize ü ü ü ü ü ü üMJN Njeke ü ü ü ü – – –TH Nyasulu ü ü ü ü ü ü üKC Ramon ü ü ü ü ü ü üJE Schrempp ü ü ü ü – ü üS Westwell ü ü ü ü ü ü üPJ Robertson ü ü ü ü – ü ü
√ Indicates attendance– Indicates absence with apologyn/a Indicates not a member at the time* Special meeting
Chairman and lead independent directorThe offices of chairman and chief executive officer are separate and the chairman is a non-executive director. Due to Mrs TH Nyasulu’s interest in Sasol Oil (Pty) Ltd, the lead independent director, Prof JE Schrempp, leads discussions when matters relating to Sasol Oil, or the succession or performance of the chairman, are discussed. Mrs TH Nyasulu recuses herself from board meetings when matters pertaining to Sasol Oil are considered.
The lead independent director and clear majority of independent directors ensure that sufficient independent thinking informs board deliberations. The roles of the chairman and lead independent director are specified in the board charter.
The appointment and performance of the chairman and lead independent director are reviewed annually. The board and the nomination, governance, social and ethics committee are responsible for succession planning in relation to the position of chairman. The lead independent director guides this process. Mrs TH Nyasulu will step down as chairman at the conclusion of the annual general meeting scheduled for 22 November 2013, and Dr MSV Gantsho will succeed her as chairman on that date.
Chief executive officerMr DE Constable is the chief executive officer of the group. In terms of the company’s MOI, the directors appoint the chief executive officer. The appointment is made on the recommendation of the nomination, governance, social and ethics committee. The board is responsible for ensuring that succession plans are in place for the roles of chief executive officer and other members of the group executive committee. The role and function of the chief executive officer is specified in the board charter.
The chief executive officer is the highest executive decision-making functionary of Sasol and the Sasol group. The Sasol Limited board delegates authority to the chief executive officer, and holds him accountable, for the successful implementation of the group
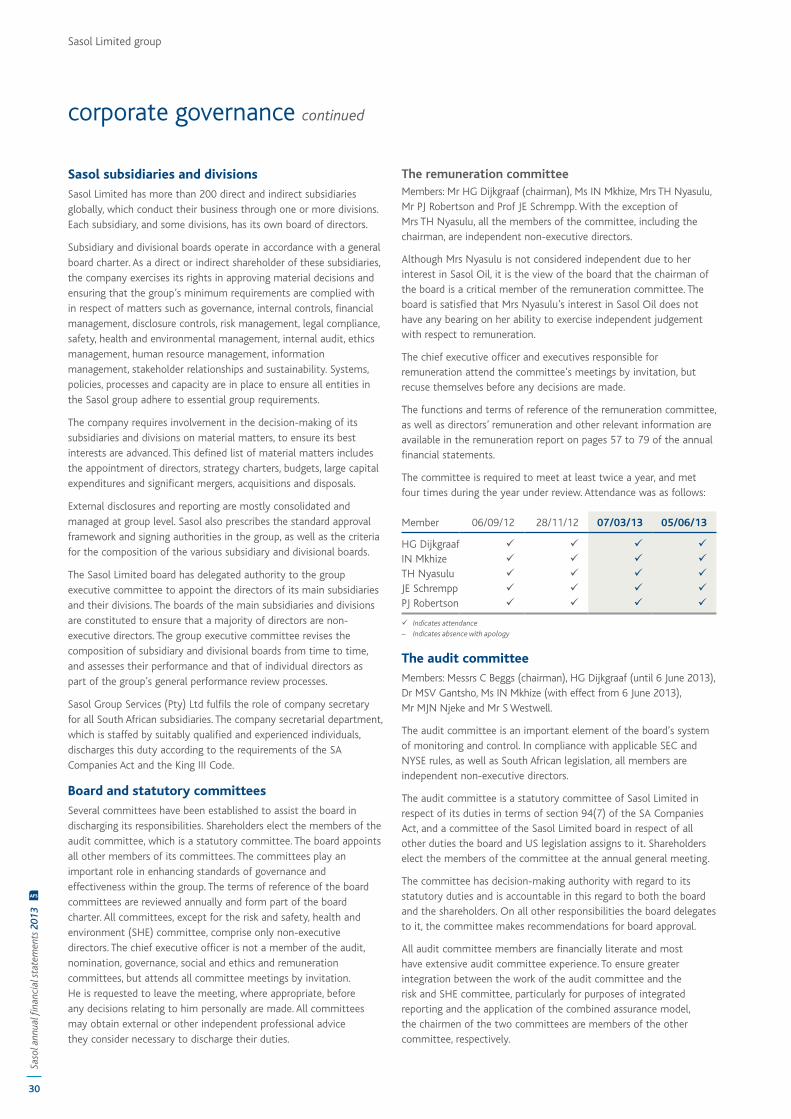
30
Saso
l ann
ual fi
nanc
ial s
tate
men
ts 2
013
AFS
Sasol Limited group
The remuneration committeeMembers: Mr HG Dijkgraaf (chairman), Ms IN Mkhize, Mrs TH Nyasulu, Mr PJ Robertson and Prof JE Schrempp. With the exception of Mrs TH Nyasulu, all the members of the committee, including the chairman, are independent non-executive directors.
Although Mrs Nyasulu is not considered independent due to her interest in Sasol Oil, it is the view of the board that the chairman of the board is a critical member of the remuneration committee. The board is satisfied that Mrs Nyasulu’s interest in Sasol Oil does not have any bearing on her ability to exercise independent judgement with respect to remuneration.
The chief executive officer and executives responsible for remuneration attend the committee’s meetings by invitation, but recuse themselves before any decisions are made.
The functions and terms of reference of the remuneration committee, as well as directors’ remuneration and other relevant information are available in the remuneration report on pages 57 to 79 of the annual financial statements.
The committee is required to meet at least twice a year, and met four times during the year under review. Attendance was as follows:
Member 06/09/12 28/11/12 07/03/13 05/06/13
HG Dijkgraaf ü ü ü üIN Mkhize ü ü ü üTH Nyasulu ü ü ü üJE Schrempp ü ü ü üPJ Robertson ü ü ü ü
ü Indicates attendance– Indicates absence with apology
The audit committeeMembers: Messrs C Beggs (chairman), HG Dijkgraaf (until 6 June 2013), Dr MSV Gantsho, Ms IN Mkhize (with effect from 6 June 2013), Mr MJN Njeke and Mr S Westwell.
The audit committee is an important element of the board’s system of monitoring and control. In compliance with applicable SEC and NYSE rules, as well as South African legislation, all members are independent non-executive directors.
The audit committee is a statutory committee of Sasol Limited in respect of its duties in terms of section 94(7) of the SA Companies Act, and a committee of the Sasol Limited board in respect of all other duties the board and US legislation assigns to it. Shareholders elect the members of the committee at the annual general meeting.
The committee has decision-making authority with regard to its statutory duties and is accountable in this regard to both the board and the shareholders. On all other responsibilities the board delegates to it, the committee makes recommendations for board approval.
All audit committee members are financially literate and most have extensive audit committee experience. To ensure greater integration between the work of the audit committee and the risk and SHE committee, particularly for purposes of integrated reporting and the application of the combined assurance model, the chairmen of the two committees are members of the other committee, respectively.
Sasol subsidiaries and divisions
Sasol Limited has more than 200 direct and indirect subsidiaries globally, which conduct their business through one or more divisions. Each subsidiary, and some divisions, has its own board of directors.
Subsidiary and divisional boards operate in accordance with a general board charter. As a direct or indirect shareholder of these subsidiaries, the company exercises its rights in approving material decisions and ensuring that the group’s minimum requirements are complied with in respect of matters such as governance, internal controls, financial management, disclosure controls, risk management, legal compliance, safety, health and environmental management, internal audit, ethics management, human resource management, information management, stakeholder relationships and sustainability. Systems, policies, processes and capacity are in place to ensure all entities in the Sasol group adhere to essential group requirements.
The company requires involvement in the decision-making of its subsidiaries and divisions on material matters, to ensure its best interests are advanced. This defined list of material matters includes the appointment of directors, strategy charters, budgets, large capital expenditures and significant mergers, acquisitions and disposals.
External disclosures and reporting are mostly consolidated and managed at group level. Sasol also prescribes the standard approval framework and signing authorities in the group, as well as the criteria for the composition of the various subsidiary and divisional boards.
The Sasol Limited board has delegated authority to the group executive committee to appoint the directors of its main subsidiaries and their divisions. The boards of the main subsidiaries and divisions are constituted to ensure that a majority of directors are non-executive directors. The group executive committee revises the composition of subsidiary and divisional boards from time to time, and assesses their performance and that of individual directors as part of the group’s general performance review processes.
Sasol Group Services (Pty) Ltd fulfils the role of company secretary for all South African subsidiaries. The company secretarial department, which is staffed by suitably qualified and experienced individuals, discharges this duty according to the requirements of the SA Companies Act and the King III Code.
Board and statutory committees
Several committees have been established to assist the board in discharging its responsibilities. Shareholders elect the members of the audit committee, which is a statutory committee. The board appoints all other members of its committees. The committees play an important role in enhancing standards of governance and effectiveness within the group. The terms of reference of the board committees are reviewed annually and form part of the board charter. All committees, except for the risk and safety, health and environment (SHE) committee, comprise only non-executive directors. The chief executive officer is not a member of the audit, nomination, governance, social and ethics and remuneration committees, but attends all committee meetings by invitation. He is requested to leave the meeting, where appropriate, before any decisions relating to him personally are made. All committees may obtain external or other independent professional advice they consider necessary to discharge their duties.
corporate governance continued
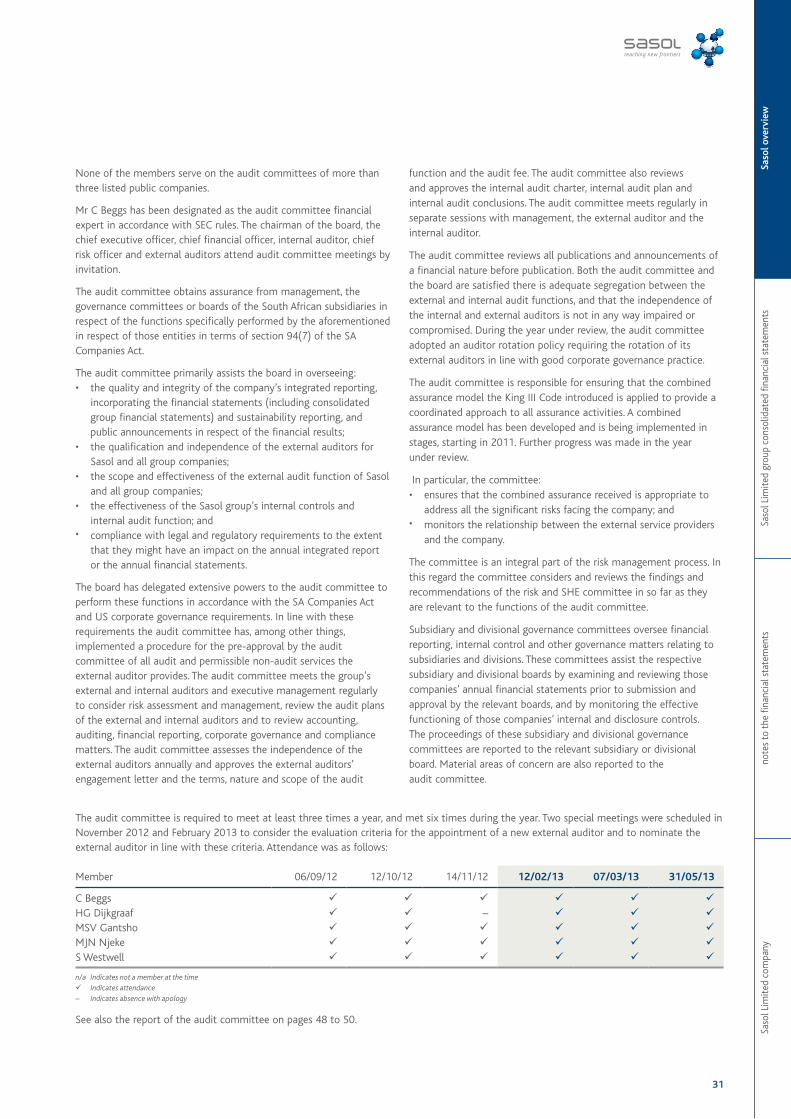
Saso
l Lim
ited
com
pany
note
s to
the
fina
ncia
l sta
tem
ents
Saso
l Lim
ited
grou
p co
nsol
idat
ed fi
nanc
ial s
tate
men
tsSa
sol o
verv
iew
31
function and the audit fee. The audit committee also reviews and approves the internal audit charter, internal audit plan and internal audit conclusions. The audit committee meets regularly in separate sessions with management, the external auditor and the internal auditor.
The audit committee reviews all publications and announcements of a financial nature before publication. Both the audit committee and the board are satisfied there is adequate segregation between the external and internal audit functions, and that the independence of the internal and external auditors is not in any way impaired or compromised. During the year under review, the audit committee adopted an auditor rotation policy requiring the rotation of its external auditors in line with good corporate governance practice.
The audit committee is responsible for ensuring that the combined assurance model the King III Code introduced is applied to provide a coordinated approach to all assurance activities. A combined assurance model has been developed and is being implemented in stages, starting in 2011. Further progress was made in the year under review.
In particular, the committee: • ensures that the combined assurance received is appropriate to
address all the significant risks facing the company; and • monitors the relationship between the external service providers
and the company.
The committee is an integral part of the risk management process. In this regard the committee considers and reviews the findings and recommendations of the risk and SHE committee in so far as they are relevant to the functions of the audit committee.
Subsidiary and divisional governance committees oversee financial reporting, internal control and other governance matters relating to subsidiaries and divisions. These committees assist the respective subsidiary and divisional boards by examining and reviewing those companies’ annual financial statements prior to submission and approval by the relevant boards, and by monitoring the effective functioning of those companies’ internal and disclosure controls. The proceedings of these subsidiary and divisional governance committees are reported to the relevant subsidiary or divisional board. Material areas of concern are also reported to the audit committee.
None of the members serve on the audit committees of more than three listed public companies.
Mr C Beggs has been designated as the audit committee financial expert in accordance with SEC rules. The chairman of the board, the chief executive officer, chief financial officer, internal auditor, chief risk officer and external auditors attend audit committee meetings by invitation.
The audit committee obtains assurance from management, the governance committees or boards of the South African subsidiaries in respect of the functions specifically performed by the aforementioned in respect of those entities in terms of section 94(7) of the SA Companies Act.
The audit committee primarily assists the board in overseeing: • the quality and integrity of the company’s integrated reporting,
incorporating the financial statements (including consolidated group financial statements) and sustainability reporting, and public announcements in respect of the financial results;
• the qualification and independence of the external auditors for Sasol and all group companies;
• the scope and effectiveness of the external audit function of Sasol and all group companies;
• the effectiveness of the Sasol group’s internal controls and internal audit function; and
• compliance with legal and regulatory requirements to the extent that they might have an impact on the annual integrated report or the annual financial statements.
The board has delegated extensive powers to the audit committee to perform these functions in accordance with the SA Companies Act and US corporate governance requirements. In line with these requirements the audit committee has, among other things, implemented a procedure for the pre-approval by the audit committee of all audit and permissible non-audit services the external auditor provides. The audit committee meets the group’s external and internal auditors and executive management regularly to consider risk assessment and management, review the audit plans of the external and internal auditors and to review accounting, auditing, financial reporting, corporate governance and compliance matters. The audit committee assesses the independence of the external auditors annually and approves the external auditors’ engagement letter and the terms, nature and scope of the audit
The audit committee is required to meet at least three times a year, and met six times during the year. Two special meetings were scheduled in November 2012 and February 2013 to consider the evaluation criteria for the appointment of a new external auditor and to nominate the external auditor in line with these criteria. Attendance was as follows:
Member 06/09/12 12/10/12 14/11/12 12/02/13 07/03/13 31/05/13
C Beggs ü ü ü ü ü üHG Dijkgraaf ü ü – ü ü üMSV Gantsho ü ü ü ü ü üMJN Njeke ü ü ü ü ü üS Westwell ü ü ü ü ü ü
n/a Indicates not a member at the timeü Indicates attendance– Indicates absence with apology
See also the report of the audit committee on pages 48 to 50.
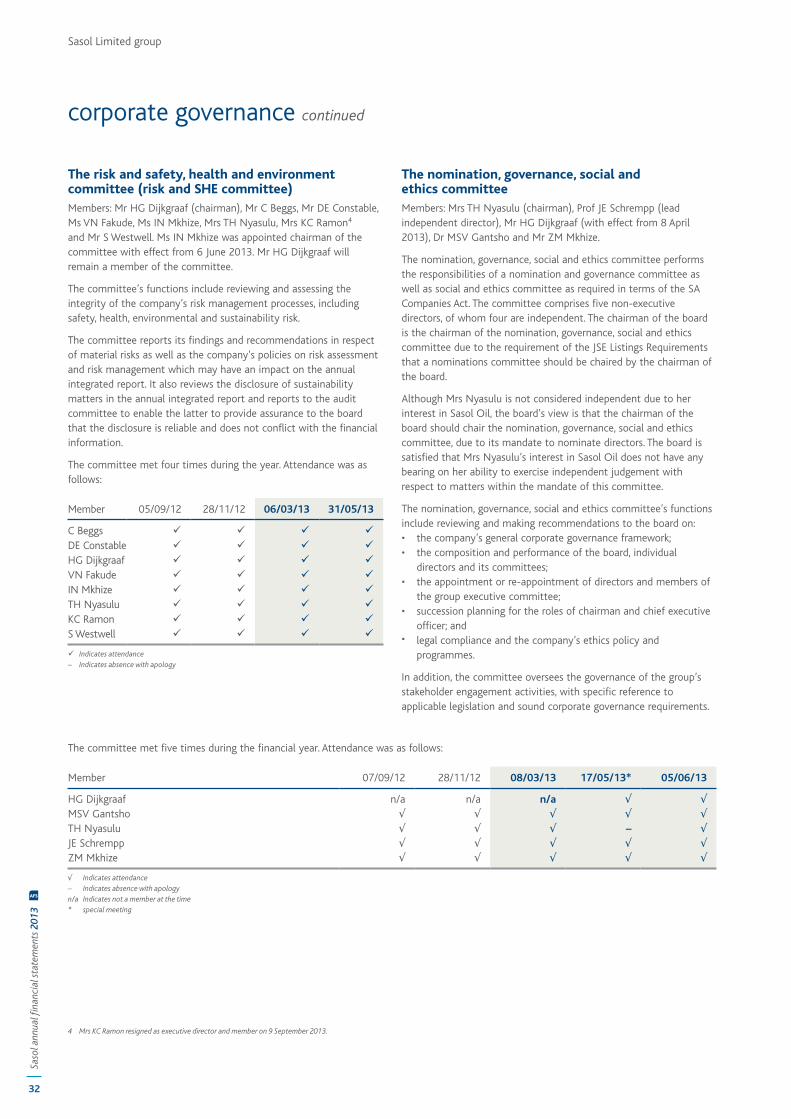
32
Saso
l ann
ual fi
nanc
ial s
tate
men
ts 2
013
AFS
Sasol Limited group
The nomination, governance, social and ethics committeeMembers: Mrs TH Nyasulu (chairman), Prof JE Schrempp (lead independent director), Mr HG Dijkgraaf (with effect from 8 April 2013), Dr MSV Gantsho and Mr ZM Mkhize.
The nomination, governance, social and ethics committee performs the responsibilities of a nomination and governance committee as well as social and ethics committee as required in terms of the SA Companies Act. The committee comprises five non-executive directors, of whom four are independent. The chairman of the board is the chairman of the nomination, governance, social and ethics committee due to the requirement of the JSE Listings Requirements that a nominations committee should be chaired by the chairman of the board.
Although Mrs Nyasulu is not considered independent due to her interest in Sasol Oil, the board’s view is that the chairman of the board should chair the nomination, governance, social and ethics committee, due to its mandate to nominate directors. The board is satisfied that Mrs Nyasulu’s interest in Sasol Oil does not have any bearing on her ability to exercise independent judgement with respect to matters within the mandate of this committee.
The nomination, governance, social and ethics committee’s functions include reviewing and making recommendations to the board on: • the company’s general corporate governance framework; • the composition and performance of the board, individual
directors and its committees; • the appointment or re-appointment of directors and members of
the group executive committee; • succession planning for the roles of chairman and chief executive
officer; and • legal compliance and the company’s ethics policy and
programmes.
In addition, the committee oversees the governance of the group’s stakeholder engagement activities, with specific reference to applicable legislation and sound corporate governance requirements.
The risk and safety, health and environment committee (risk and SHE committee)Members: Mr HG Dijkgraaf (chairman), Mr C Beggs, Mr DE Constable, Ms VN Fakude, Ms IN Mkhize, Mrs TH Nyasulu, Mrs KC Ramon4 and Mr S Westwell. Ms IN Mkhize was appointed chairman of the committee with effect from 6 June 2013. Mr HG Dijkgraaf will remain a member of the committee.
The committee’s functions include reviewing and assessing the integrity of the company’s risk management processes, including safety, health, environmental and sustainability risk.
The committee reports its findings and recommendations in respect of material risks as well as the company’s policies on risk assessment and risk management which may have an impact on the annual integrated report. It also reviews the disclosure of sustainability matters in the annual integrated report and reports to the audit committee to enable the latter to provide assurance to the board that the disclosure is reliable and does not conflict with the financial information.
The committee met four times during the year. Attendance was as follows:
Member 05/09/12 28/11/12 06/03/13 31/05/13
C Beggs ü ü ü üDE Constable ü ü ü üHG Dijkgraaf ü ü ü üVN Fakude ü ü ü üIN Mkhize ü ü ü üTH Nyasulu ü ü ü üKC Ramon ü ü ü üS Westwell ü ü ü ü
ü Indicates attendance– Indicates absence with apology
corporate governance continued
The committee met five times during the financial year. Attendance was as follows:
Member 07/09/12 28/11/12 08/03/13 17/05/13* 05/06/13
HG Dijkgraaf n/a n/a n/a √ √MSV Gantsho √ √ √ √ √TH Nyasulu √ √ √ – √JE Schrempp √ √ √ √ √ZM Mkhize √ √ √ √ √
√ Indicates attendance– Indicates absence with apologyn/a Indicates not a member at the time* special meeting
4 Mrs KC Ramon resigned as executive director and member on 9 September 2013.

Saso
l Lim
ited
com
pany
note
s to
the
fina
ncia
l sta
tem
ents
Saso
l Lim
ited
grou
p co
nsol
idat
ed fi
nanc
ial s
tate
men
tsSa
sol o
verv
iew
33
The group maintains a system of internal financial control that is designed to provide assurances on the maintenance of proper accounting records and the reliability of financial information used within the business and for publication. The system contains self-monitoring mechanisms, and actions are taken to correct deficiencies as they are identified.
The group began implementing a combined assurance approach in 2011 to assist in addressing the key risks facing the group. Management identifies and controls these risks by means of a risk framework determined by the risk and SHE committee, and the process is monitored and evaluated under the direction of internal audit.
The internal control and combined assurance system includes: • a documented organisational structure and reasonable division of
responsibility; • policies and procedures (including a code of conduct to foster a
strong ethical climate) which are communicated throughout the group; and
• mechanisms to ensure compliance.
Sasol, as a foreign private issuer on the NYSE, is subject to, and complies with, section 404 of the Sarbanes-Oxley Act, 2002 (SOX 404). More information is included in Sasol’s annual report on Form 20-F filed annually with the SEC and available on www.sasol.com.
The board reviewed the effectiveness of controls for the year ended 30 June 2013, principally through a process of management self-assessment, including formal confirmation from executive management. The board also considered reports from internal audit, the external auditor and the compliance and risk management functions.
Internal audit
The group has an internal audit function that covers its global operations. Internal audit is responsible for: • assisting the board and management in monitoring the adequacy
and effectiveness of combined assurance over the company’s risk management process;
• assisting the board and management in maintaining an effective internal control environment by evaluating those controls continuously, using a risk based approach, to determine whether they are adequately designed, operating efficiently and effectively, and to recommend improvements; and
• co-ordinating, combining and integrating the assurance various parties provide (such as line management, internal and external assurance providers) pursuant to the combined assurance model.
Internal controls reviewed consist of strategic, operating, financial reporting and compliance controls and encompass those relating to: • the information management environment; • the reliability and integrity of financial and operating information; • the safeguarding of assets, including fraud prevention; • the effective and efficient use of the company’s resources; and • the completeness and accuracy of matters reported in the annual
integrated report.
The committee’s work plan ensures all its statutory responsibilities are covered during the course of a calendar year. During the period under review, the committee: • considered the company’s compliance with the goals and
purposes of the 10 principles set out in the United Nations Global Compact;
• considered the company’s standing in terms of the goals and purposes of the OECD recommendations regarding corruption;
• received a report on Sasol’s progress under the Employment Equity Act, no 55 of 1998;
• noted Sasol’s standing in terms of the Broad-Based Black Economic Empowerment Act, no 53 of 2003;
• considered stakeholder relationship reports, including assessments of stakeholder relationship health and progress with the development of a stakeholder management strategy for each stakeholder category;
• considered a report on the company’s labour and employment activities, taking into account
− the laws and codes of best practice applicable in host countries in which the company operates,
− the International Labour Organisation’s protocol on decent work and working conditions, and
− the company’s employment relationships, and its contribution toward the educational development of its employees; and
• received a report on the company’s consumer relationships, including the company’s advertising and public relations, and compliance with consumer protection laws.
The board has delegated responsibility for all environmental, health and public safety matters, including the impact of the company’s activities and of its products or services, to the risk and SHE committee. Accordingly, the nomination, governance, social and ethics committee noted the reports in connection with those matters which were submitted to the risk and SHE committee.
Progress in the above areas is covered in greater detail in the sustainable development report available on www.sasol.com.
Group executive committee (GEC)Members: Mr DE Constable (chairman), Mr AM de Ruyter, Mr VD Kahla, Mr BE Klingenberg, Ms VN Fakude, Mr CF Rademan, Mr M Radebe, Mrs KC Ramon and Mr GJ Strauss5.
In terms of the revised group governance framework the board approved in March 2013, the GEC supports the chief executive officer in implementing the strategy and in managing the Sasol group. The chief executive officer is entitled to sub-delegate any of the powers delegated to him to the GEC, individual members of the GEC or other committees, forums or individuals within the Sasol group. The chief executive officer may sub-delegate all matters not specifically reserved for decision-making by the Sasol Limited board or its shareholders. The board appoints GEC members on the recommendation of the chief executive officer and the nomination, governance, social and ethics committee.
Internal control and combined assuranceThe directors are ultimately responsible for the group’s system of internal control, designed to identify, evaluate, manage and provide reasonable assurance against material misstatement and loss.
5 Retired with effect from 30 September 2013.
34
Saso
l ann
ual fi
nanc
ial s
tate
men
ts 2
013
AFS
Sasol Limited group
Risk managementThe board is responsible for risk management within the Sasol group in accordance with corporate governance requirements. The Sasol Limited board’s risk and SHE committee oversees Sasol’s risk management activities. The risk and SHE committee and the audit committee work closely to ensure that risk management complies with the relevant standards and that it is working effectively. Oversight of risk management at business and function level takes place through internal risk and governance committees, executive committees and the various boards of the businesses. Sasol has appointed a Chief Risk Officer who ensures that a comprehensive enterprise risk management process is in place.
The principal objectives of the group’s enterprise-wide risk management process are: • to ensure that the significant business risks to which Sasol is
exposed are systematically identified, assessed and managed to acceptable levels based on risk tolerance and appetite levels approved by the Sasol Limited board;
• to achieve an optimal risk-reward balance; and • to ensure that risk management is embedded in all decision-
making processes including planning, projects, business operations, investments, disposals and closures.
The following key principles guide Sasol’s enterprise-wide risk management process: • an understanding of risks as reflecting ‘uncertain future events
that could influence the achievement of business objectives (including any deviation from expected outcomes)’;
• a clear assignment of responsibilities and accountabilities; • a common enterprise-wide risk management framework; • a set of enabling risk management capabilities through
standardisation of risk processes, systems, risk training and measurement; and
• the integration of risk management activities within the company and across its value chains.
Sasol’s integrated risk management approach includes the determination and development of risk profiles at business, functional, process and project levels.
Top risks that impact the company’s ability to achieve its strategic objectives on a sustainable basis are managed at group level. Risks at business and functional level are considered in relation to achieving business strategies that are closely aligned to the Sasol group strategy. At process level, operational, project, financial and legal compliance risks are managed to mitigate the impact of Sasol’s operations on people, processes and the environment.
The group risk management strategy, policy, tone, competencies, and a risk management maturity assessment, which is used to track progress in risk compliance and performance, all support and enable Sasol’s risk management processes.
The company’s insurance services department, with the assistance of external consultants, undertakes regular risk control reviews of the company’s plants and operations using recognised international procedures and standards. It is Sasol’s policy to procure property damage, business interruption and liability insurance above acceptable deductible levels at acceptable commercial premiums and terms.
The annual audit plan is based on an assessment of risk areas internal audit and management identifies, as well as focus areas highlighted by the audit committee, GEC and management. The annual audit plan is updated as appropriate to ensure it remains responsive to changes in the business. A comprehensive report on internal audit findings is presented to the GEC and the audit committee quarterly. Follow-up audits are conducted in areas where major internal control weaknesses are found. The audit committee approved internal audit’s formal quality assurance and improvement plan and its risk-based audit plan for 2014.
Corporate governance best practice requires that the internal audit function reports directly to the audit committee, in terms of the audit committee’s mandate to: • evaluate the effectiveness of internal control; • review and approve the internal audit charter, internal audit plans
and internal audit conclusions about internal control; • review significant internal audit findings and the adequacy of
corrective action taken; • assess the performance of the internal audit function and the
adequacy of available internal audit resources; • review significant differences of opinion between management
and the internal audit function; and • consider the appointment, performance, dismissal or reassignment
of the head of internal audit.
The charter of the internal audit function gives the head of internal audit direct access to the chief executive officer, chief financial officer and the chairman of the audit committee. The head of internal audit reports administratively to the group executive responsible for advisory and assurance services.
The head of internal audit attends executive management meetings as and when required. Internal auditors may ask to attend an executive management meeting if required in the execution of their duties. The head of internal audit has unfettered access to board and committee minutes and submissions, and the risk registers of Sasol businesses and functions. Representatives of internal audit are invited to all governance committee meetings of subsidiaries and divisions of the Sasol group.
The internal audit function is required to undergo an independent quality review at least every four years. An international external audit firm conducted a quality assessment review of Sasol’s internal audit function during 2011 and concluded that the internal audit function generally conformed to the standards of the Institute of Internal Auditors. Recommendations to improve areas of weaknesses have been addressed. The next external quality assessment is planned for 2014.
Based on the review of the company’s systems of internal control and risk management in 2013, which included the design, implementation and effectiveness of internal financial control and was conducted by way of a formal management self-assessment process, and considering information and explanations provided by management and discussions with the external auditor on the results of the audit, the internal auditor concluded that the company’s system of internal control and risk management is effective and that the internal financial controls form a sound basis for the preparation of reliable financial statements.
corporate governance continued
Saso
l Lim
ited
com
pany
note
s to
the
fina
ncia
l sta
tem
ents
Saso
l Lim
ited
grou
p co
nsol
idat
ed fi
nanc
ial s
tate
men
tsSa
sol o
verv
iew
35
External auditors and internal audit perform assessments as part of their audit of IM and IT related controls. This includes, but is not limited to, SOX 404 controls. All IM and IT related audit findings are reported to the board and managed accordingly.
The IM risk management framework is aligned to the group risk management framework inclusive of disaster recovery measures. All technology solutions impacting financial reporting are part of the internal and external auditing scope.
Compliance with laws, rules, codes and standardsSasol policy requires all group companies and their directors and employees to comply with all applicable laws. Legal compliance systems and processes have been intensified during the year to mitigate the risk of non-compliance with the complex laws in the various jurisdictions in which group companies do business. The board and management have given particular attention to the risk of non-compliance with competition laws in the past four years. Specific areas of law have been identified as key group legal compliance risk areas and risk mitigation and control steps have been identified for each of these areas.
The board and its committees continue to monitor the implementation of the company’s legal compliance policy and the implementation of legal compliance processes closely.
The group legal compliance committee (GLCC), a sub-committee of the GEC, oversees the company’s legal compliance programme. The group executive: advisory and assurance chairs the GLCC, which comprises members of the GEC (including the chief executive officer) and is attended by relevant legal and compliance services employees. A legal compliance report is presented to the nomination, governance, social and ethics committee on a quarterly basis and, to the extent that legal and regulatory matters could have an impact on the financial statements, risk management or sustainability, reports are also presented to the risk and SHE committee, as well as the audit committee, as appropriate.
A framework to govern the management of tax throughout the group has been established. Approved by the board, the governance framework combines appropriately skilled resources, internal processes and internal and external controls to manage tax in line with the group strategy. The company strives to arrange its tax affairs in an efficient manner, while always in compliance with current laws in all jurisdictions in which it operates and taking into account financial and reputational risk. The company strives to maintain a cooperative relationship with tax authorities and to conduct all such dealings in an open and constructive manner.
Disclosure and sustainabilityThe disclosure committee is a sub-committee of the GEC and comprises a combination of GEC members and functional managers. It oversees compliance with the disclosure requirements of JSE, SEC and NYSE rules, among others. The disclosure controls and processes in place to comply with section 302 and 404 of the Sarbanes-Oxley Act, 2002 are subject to internal and external audit assessment. The company’s disclosure controls and procedures ensure the accurate and timely disclosure of information to shareholders, the financial community and the investor community that may have a material
Most significant risksThe most significant risks the group currently faces are: • viable superior or alternative technologies from competitors; • failure to address transformation, localisation, diversity and
cultural requirements in South Africa and other countries in which Sasol operates;
• not delivering on our gas-to-liquids strategic growth objectives; • not consistently achieving competitive capital project
performance; • non-compliance with applicable laws, regulations and standards; • a major safety, health or environmental incident or liability
occurring; • non-availability of sufficient management and technical skills; • major unplanned production interruptions along Sasol’s integrated
value chain; • climate change and related policies impacting Sasol’s growth
strategy and earnings; • macroeconomic factors impacting on Sasol’s ability to sustain the
business and deliver the growth strategy; and • increasing utility and infrastructure risk.
A senior group executive member is responsible for monitoring the management of each of these risks.
For more comprehensive disclosure of our material risks, please refer to the annual integrated report and Sasol’s 2013 annual report on Form 20-F filed with the SEC.
Information managementThe board is responsible for information technology (IT) governance. IT governance is systematic and based on CoBIT (control objectives for Information and related technologies) principles. Group management is accountable for the operational governance of information management (IM) governance, which includes IT, in the Sasol group. Decision-making structures have been defined and a reporting framework is in place. Additionally, best practice frameworks have been adopted, including ITIL (Information Technology Infrastructure Library) and ISO17799.
An IM charter has been developed and is managed through IM governance structures. The IM strategy is aligned to the Sasol business needs and sustainability objectives by taking into account the business focus areas. An IM governance committee has been established as a sub-committee of the GEC. The GEC member responsible for IM chairs the committee, which comprises GEC members, functional managers and the chief information officer. The committee oversees and provides executive direction in line with the group’s IM strategy, including IT investment, efficiency and effectiveness, ensuring an appropriate control environment over new and existing business processes and ensuring Sasol remains competitive in relation to technology.
The audit committee receives quarterly reports from the IM governance sub-committee, and assists the board in determining if the sub-committee is meeting its objectives, and accordingly complies with the requirements of the King III Code in regard to IT governance. The board receives reports and presentations on all significant IT matters and such matters are considered at the board’s strategy meetings.
36
Saso
l ann
ual fi
nanc
ial s
tate
men
ts 2
013
AFS
Sasol Limited group
management of ethics in the various Sasol businesses and functions. The group ethics office manages ethics through a comprehensive programme that includes an ethics strategy, identifying and prioritising ethics opportunities, assessing and mitigating ethics risks, applying effective governance structures, articulating a code of ethics with relevant guidelines and policies, institutionalising the code and policies in practice (e.g. by training, communication and integrating ethics into business matters), applying effective governance structures, detection and resolution of ethical violations, monitoring and reporting and the development of applicable tools and technologies for the effective management of Sasol’s ethics programme. The nominations, governance, social and ethics committee oversees the implementation of the ethics programme and reports to the board on ethics. An ethics forum discusses best practice and compliance requirements and considers and recommends amendments to the code and guide as required.
Sasol has been operating an independent ethics reporting telephone line through external service providers since 2002, which detects and resolves ethical violations. This confidential and anonymous ethics hotline provides an impartial facility for all stakeholders to anonymously report any ethics related matter, such as unfairness, disrespect, fraud, statutory malpractice and other crimes, unsafe behaviour, deviations from the procurement policy, financial and accounting reporting irregularities and other deviations from ethical behaviour. These calls are monitored and progress on their resolution is reported to business governance committees. The audit committee or nomination, governance, social and ethics committee receives progress updates on sensitive and potentially high-risk investigations with material outcomes. The nomination, governance, social and ethics committee is regularly updated on the ethics programme.
In addition to group-wide online ethics training, ethics has been included as a module in all formal Sasol leadership development programmes. This, together with ongoing communication on ethics, contributes to the continued upward trend of employees as well as external stakeholders using the ethics line to report unethical behaviour.
Stakeholder relationshipsSasol subscribes to the stakeholder management principles in the King III Code and is on track in implementing the required governance mechanisms.
A global stakeholder management strategy and a stakeholder engagement charter, relevant to all Sasol’s operations and all stakeholders, have been developed. The stakeholder engagement charter sets out the desired behaviours for all Sasol employees who engage stakeholders, and has been published as a public commitment to principled, value-based engagement.
Stakeholder engagement programmes facilitate the planning, coordination, and execution of stakeholder engagement more effectively. Sasol’s stakeholder landscape has been structured into ten distinct stakeholder categories, with specific stakeholders defined within each category. Distinct roles and responsibilities for stakeholder management have been defined and relationship owners for each stakeholder group have been appointed. Stakeholder relationship owners are accountable for Sasol’s relationship with that
effect on the value of Sasol securities or that may influence investment decisions.
The board oversees sustainability matters through the reports presented to it and its committees, notably the audit committee, risk and SHE committee and the nomination, governance, social and ethics committee. The audit committee is responsible for overseeing the provision of assurance over sustainability issues.
Worker participation and employment equityThe company has established participative structures on issues that affect employees directly and materially, and is committed to promoting equal opportunities and fair employment practices regardless of employees’ ethnic origin or gender. Several programmes have been implemented to ensure practical application of the group’s commitment to worker participation and employment equity, while maintaining the company’s high standards and statutory compliance. A group partnership forum has been in place in South Africa since 2009. Union representatives meet quarterly with management in this forum to discuss matters of mutual interest. Similar consultations take place through works councils in Germany.
During the financial year, increased focus was given to transformation, which is discussed in more detail in the sustainable development report.
In the spirit of ensuring diversity and inclusion across the group, and in support of Sasol’s commitment to the United Nations women’s empowerment principles, Sasol has implemented a global women empowerment strategy. This will entail developing the professional and leadership competencies of women through mentoring, networking and training.
Code of ethicsThe group’s code of ethics (the code) consists of four fundamental ethical principles – responsibility, honesty, fairness and respect. Guidelines, which provide more information on 15 ethical standards, support the code. The guidelines cover issues such as bribery and corruption, fraud, insider trading, legal compliance, conflicts of interests, human rights and discrimination. They include a commitment to conducting our business with due regard to the interests of all our stakeholders and the environment. The code requires compliance with all applicable laws and regulations as a minimum standard. In essence, the guidelines to the code of ethics outline Sasol’s approach to ethics management, which includes all the elements internationally recognised as best practice in ethics management. The code of ethics guides interactions with all stakeholders, including employees, suppliers and customers. Any amendment or waiver of the code as it relates to the chief executive officer or chief financial officer is posted on the Sasol ethics website within four business days of such an amendment or waiver. No such amendments or waivers have been posted or are anticipated.
The code of ethics has been communicated to all employees, suppliers, service providers and customers and is available on www.sasolethics.com.
A dedicated group ethics office manages the ethics programme and ethics officers have been appointed and trained to assist with the
corporate governance continued
Saso
l Lim
ited
com
pany
note
s to
the
fina
ncia
l sta
tem
ents
Saso
l Lim
ited
grou
p co
nsol
idat
ed fi
nanc
ial s
tate
men
tsSa
sol o
verv
iew
37
individual or group. The relationship owner conducts regular reviews of the relationship, with input from other Sasol functions that regularly interact with the stakeholder. These reviews enable structured and insightful quarterly stakeholder reporting to the nomination, governance, social and ethics committee. The reports provide the board with the necessary information to enable it to take the legitimate interests and expectations of stakeholders into account in its decision-making.
In addition to the self-assessment of stakeholder relationship health, as described above, regular stakeholder research is conducted as an independent measure of any gap between Sasol’s performance and stakeholder perceptions. This enables constructive stakeholder engagement, enabling the company to respond to verified stakeholder issues and concerns.
The chief executive officer, the chief financial officer and investor relations function conduct regular presentations on the group’s performance and strategy to analysts, institutional investors and the media in South Africa, North America and Europe. The company’s investor relations function maintains regular contact with the investment community and analysts. Through the group communication function, cordial and open relationships with local and international media are also maintained with a strong focus on proactive reputation management. To ensure the company communicates with its smaller shareholders and those stakeholders who lack access to the electronic media, the company publishes and reports on details of its corporate actions and performance (including its interim and final results) in the main South African daily newspapers. The company publishes its latest financial, operational and historical information, including its annual reports, on www.sasol.com. Sasol invites all shareholders to attend its annual general meeting and also facilitates participation by way of focused proxy solicitation. Electronic participation is available for participation in shareholders meetings.
Sasol strives to resolve disputes with its stakeholders effectively and expeditiously. The company investigates and implements alternative resolution mechanisms where possible, before instituting litigation.
Sasol considers and responds to all requests for access to records it receives in terms of the Promotion of Access to Information Act, 2000. Appropriate engagement with requesting parties is ensured without compromising Sasol’s rights with respect to the information.
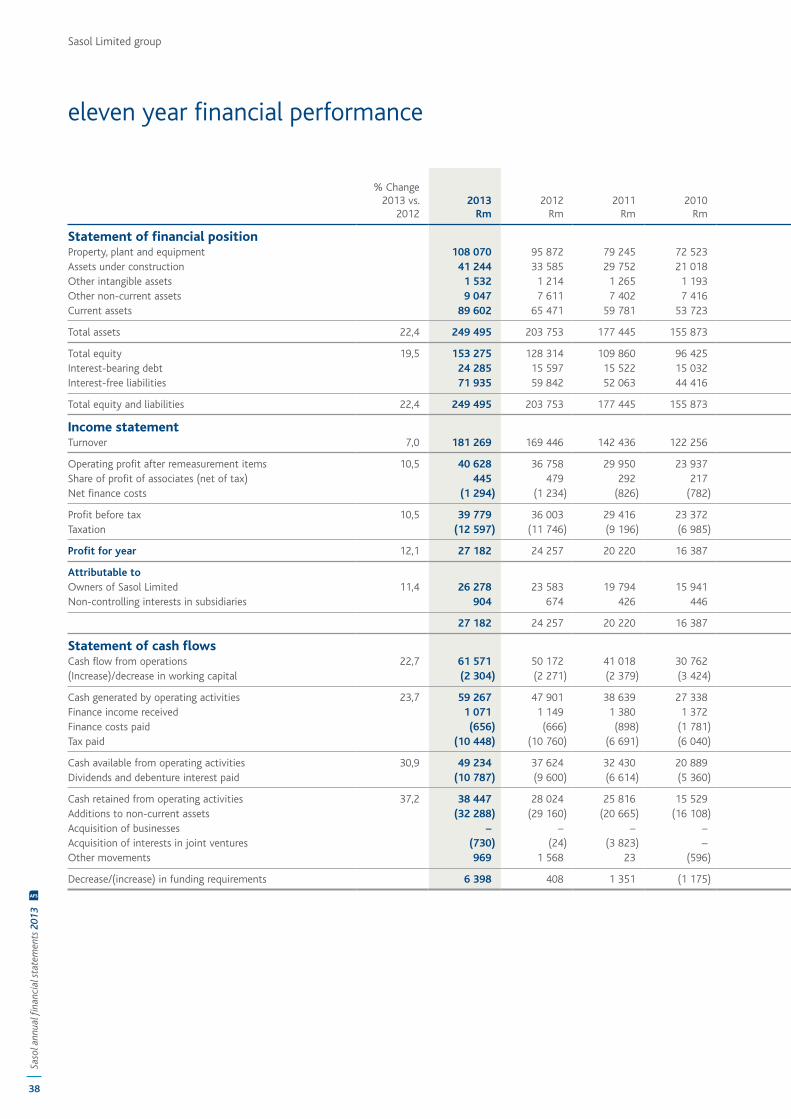
Sasol Limited group
38
Saso
l ann
ual fi
nanc
ial s
tate
men
ts 2
013
AFS
eleven year financial performance
% Change2013 vs.
20122013
Rm 2012
Rm2011
Rm2010
Rm2009
Rm2008
Rm2007
Rm2006
Rm2005
Rm2004
Rm2003
Rm
Compound annualgrowth rate %
5 years 10 years
Statement of financial positionProperty, plant and equipment 108 070 95 872 79 245 72 523 70 370 66 273 50 611 39 929 39 618 38 003 30 574 10,3 13,5 Assets under construction 41 244 33 585 29 752 21 018 14 496 11 693 24 611 23 176 18 088 9 811 12 213 Other intangible assets 1 532 1 214 1 265 1 193 1 068 964 629 775 1 053 1 280 1 627 Other non-current assets 9 047 7 611 7 402 7 416 6 920 6 359 4 839 3 235 3 324 2 386 2 108 Current assets 89 602 65 471 59 781 53 723 53 011 54 833 38 375 36 043 26 095 21 866 23 097
Total assets 22,4 249 495 203 753 177 445 155 873 145 865 140 122 119 065 103 158 88 178 73 346 69 619 12,2 13,6
Total equity 19,5 153 275 128 314 109 860 96 425 86 217 78 995 63 269 52 984 44 006 35 400 33 818 14,2 16,3 Interest-bearing debt 24 285 15 597 15 522 15 032 17 814 19 455 18 925 17 884 18 745 16 308 14 277 Interest-free liabilities 71 935 59 842 52 063 44 416 41 834 41 672 36 871 32 290 25 427 21 638 21 524
Total equity and liabilities 22,4 249 495 203 753 177 445 155 873 145 865 140 122 119 065 103 158 88 178 73 346 69 619 12,2 13,6
Income statementTurnover 7,0 181 269 169 446 142 436 122 256 137 836 129 943 98 127 82 395 69 239 60 151 64 555 6,9 10,9
Operating profit after remeasurement items 10,5 40 628 36 758 29 950 23 937 24 666 33 816 25 621 17 212 14 386 9 168 11 767 3,7 13,2 Share of profit of associates (net of tax) 445 479 292 217 270 254 405 134 184 117 60 Net finance costs (1 294) (1 234) (826) (782) (741) (413) (323) (230) (438) (249) (58)
Profit before tax 10,5 39 779 36 003 29 416 23 372 24 195 33 657 25 703 17 116 14 132 9 036 11 769 3,4 13,0 Taxation (12 597) (11 746) (9 196) (6 985) (10 480) (10 129) (8 153) (6 534) (4 573) (3 175) (4 007)
Profit for year 12,1 27 182 24 257 20 220 16 387 13 715 23 528 17 550 10 582 9 559 5 861 7 762 2,9 13,4
Attributable toOwners of Sasol Limited 11,4 26 278 23 583 19 794 15 941 13 648 22 417 17 030 10 406 9 449 5 795 7 674 3,2 13,1 Non-controlling interests in subsidiaries 904 674 426 446 67 1 111 520 176 110 66 88
27 182 24 257 20 220 16 387 13 715 23 528 17 550 10 582 9 559 5 861 7 762
Statement of cash flowsCash flow from operations 22,7 61 571 50 172 41 018 30 762 37 194 42 558 28 618 28 284 21 081 14 859 15 986 7,7 14,4 (Increase)/decrease in working capital (2 304) (2 271) (2 379) (3 424) 10 993 (7 818) (186) (3 749) (2 179) 292 11
Cash generated by operating activities 23,7 59 267 47 901 38 639 27 338 48 187 34 740 28 432 24 535 18 902 15 151 15 997 11,3 14,0 Finance income received 1 071 1 149 1 380 1 372 2 264 957 1 059 444 169 230 178 Finance costs paid (656) (666) (898) (1 781) (2 168) (2 405) (1 816) (1 745) (1 523) (1 384) (1 286)Tax paid (10 448) (10 760) (6 691) (6 040) (10 252) (9 572) (7 251) (5 389) (3 753) (3 963) (5 527)
Cash available from operating activities 30,9 49 234 37 624 32 430 20 889 38 031 23 720 20 424 17 845 13 795 10 034 9 362 15,7 18,1 Dividends and debenture interest paid (10 787) (9 600) (6 614) (5 360) (7 193) (5 766) (4 613) (3 660) (2 856) (2 745) (2 835)
Cash retained from operating activities 37,2 38 447 28 024 25 816 15 529 30 838 17 954 15 811 14 185 10 939 7 289 6 527 16,5 19,4 Additions to non-current assets (32 288) (29 160) (20 665) (16 108) (15 672) (10 855) (12 045) (13 296) (12 616) (11 418) (10 968)Acquisition of businesses – – – – (30) (431) (285) (147) – (555) (155)Acquisition of interests in joint ventures (730) (24) (3 823) – – – – – – – –Other movements 969 1 568 23 (596) 3 184 442 1 785 1 160 299 1 085 402
Decrease/(increase) in funding requirements 6 398 408 1 351 (1 175) 18 320 7 110 5 266 1 902 (1 378) (3 599) (4 194)
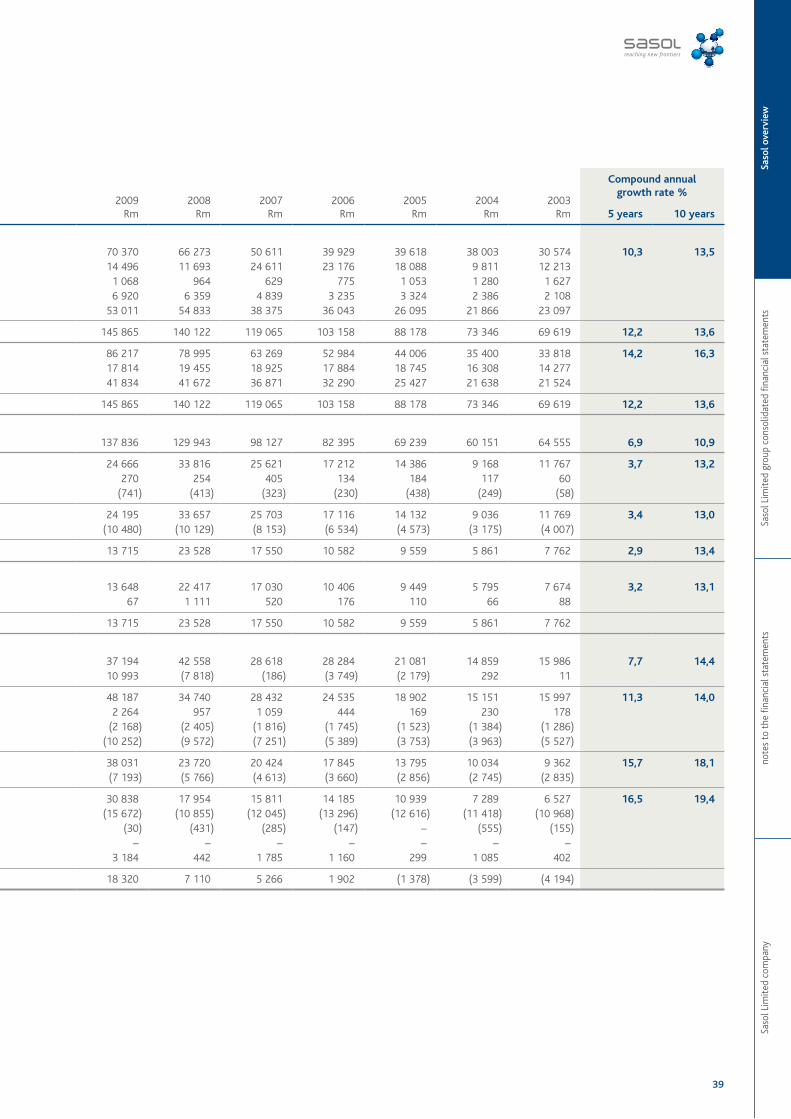
Saso
l Lim
ited
com
pany
note
s to
the
fina
ncia
l sta
tem
ents
Saso
l Lim
ited
grou
p co
nsol
idat
ed fi
nanc
ial s
tate
men
tsSa
sol o
verv
iew
39
% Change2013 vs.
20122013
Rm 2012
Rm2011
Rm2010
Rm2009
Rm2008
Rm2007
Rm2006
Rm2005
Rm2004
Rm2003
Rm
Compound annualgrowth rate %
5 years 10 years
Statement of financial positionProperty, plant and equipment 108 070 95 872 79 245 72 523 70 370 66 273 50 611 39 929 39 618 38 003 30 574 10,3 13,5 Assets under construction 41 244 33 585 29 752 21 018 14 496 11 693 24 611 23 176 18 088 9 811 12 213 Other intangible assets 1 532 1 214 1 265 1 193 1 068 964 629 775 1 053 1 280 1 627 Other non-current assets 9 047 7 611 7 402 7 416 6 920 6 359 4 839 3 235 3 324 2 386 2 108 Current assets 89 602 65 471 59 781 53 723 53 011 54 833 38 375 36 043 26 095 21 866 23 097
Total assets 22,4 249 495 203 753 177 445 155 873 145 865 140 122 119 065 103 158 88 178 73 346 69 619 12,2 13,6
Total equity 19,5 153 275 128 314 109 860 96 425 86 217 78 995 63 269 52 984 44 006 35 400 33 818 14,2 16,3 Interest-bearing debt 24 285 15 597 15 522 15 032 17 814 19 455 18 925 17 884 18 745 16 308 14 277 Interest-free liabilities 71 935 59 842 52 063 44 416 41 834 41 672 36 871 32 290 25 427 21 638 21 524
Total equity and liabilities 22,4 249 495 203 753 177 445 155 873 145 865 140 122 119 065 103 158 88 178 73 346 69 619 12,2 13,6
Income statementTurnover 7,0 181 269 169 446 142 436 122 256 137 836 129 943 98 127 82 395 69 239 60 151 64 555 6,9 10,9
Operating profit after remeasurement items 10,5 40 628 36 758 29 950 23 937 24 666 33 816 25 621 17 212 14 386 9 168 11 767 3,7 13,2 Share of profit of associates (net of tax) 445 479 292 217 270 254 405 134 184 117 60 Net finance costs (1 294) (1 234) (826) (782) (741) (413) (323) (230) (438) (249) (58)
Profit before tax 10,5 39 779 36 003 29 416 23 372 24 195 33 657 25 703 17 116 14 132 9 036 11 769 3,4 13,0 Taxation (12 597) (11 746) (9 196) (6 985) (10 480) (10 129) (8 153) (6 534) (4 573) (3 175) (4 007)
Profit for year 12,1 27 182 24 257 20 220 16 387 13 715 23 528 17 550 10 582 9 559 5 861 7 762 2,9 13,4
Attributable toOwners of Sasol Limited 11,4 26 278 23 583 19 794 15 941 13 648 22 417 17 030 10 406 9 449 5 795 7 674 3,2 13,1 Non-controlling interests in subsidiaries 904 674 426 446 67 1 111 520 176 110 66 88
27 182 24 257 20 220 16 387 13 715 23 528 17 550 10 582 9 559 5 861 7 762
Statement of cash flowsCash flow from operations 22,7 61 571 50 172 41 018 30 762 37 194 42 558 28 618 28 284 21 081 14 859 15 986 7,7 14,4 (Increase)/decrease in working capital (2 304) (2 271) (2 379) (3 424) 10 993 (7 818) (186) (3 749) (2 179) 292 11
Cash generated by operating activities 23,7 59 267 47 901 38 639 27 338 48 187 34 740 28 432 24 535 18 902 15 151 15 997 11,3 14,0 Finance income received 1 071 1 149 1 380 1 372 2 264 957 1 059 444 169 230 178 Finance costs paid (656) (666) (898) (1 781) (2 168) (2 405) (1 816) (1 745) (1 523) (1 384) (1 286)Tax paid (10 448) (10 760) (6 691) (6 040) (10 252) (9 572) (7 251) (5 389) (3 753) (3 963) (5 527)
Cash available from operating activities 30,9 49 234 37 624 32 430 20 889 38 031 23 720 20 424 17 845 13 795 10 034 9 362 15,7 18,1 Dividends and debenture interest paid (10 787) (9 600) (6 614) (5 360) (7 193) (5 766) (4 613) (3 660) (2 856) (2 745) (2 835)
Cash retained from operating activities 37,2 38 447 28 024 25 816 15 529 30 838 17 954 15 811 14 185 10 939 7 289 6 527 16,5 19,4 Additions to non-current assets (32 288) (29 160) (20 665) (16 108) (15 672) (10 855) (12 045) (13 296) (12 616) (11 418) (10 968)Acquisition of businesses – – – – (30) (431) (285) (147) – (555) (155)Acquisition of interests in joint ventures (730) (24) (3 823) – – – – – – – –Other movements 969 1 568 23 (596) 3 184 442 1 785 1 160 299 1 085 402
Decrease/(increase) in funding requirements 6 398 408 1 351 (1 175) 18 320 7 110 5 266 1 902 (1 378) (3 599) (4 194)

40
Saso
l ann
ual fi
nanc
ial s
tate
men
ts 2
013
AFS
Sasol Limited group
Targetrange# 2013 2012 2011 2010 2009 2008 2007 2006 2005 2004
Liquidity Measures the group’s ability to meet its maturing obligations and unexpected cash needs in the short term
Current ratioCurrent assetsCurrent liabilities
– :1 2,5 2,1 2,2 2,3 2,0 2,0 1,6 1,7 1,4 1,2
Quick ratioCurrent assets – inventoriesCurrent liabilities
– :1 1,8 1,5 1,5 1,6 1,5 1,3 1,0 1,0 0,9 0,8
Cash ratio Cash and cash equivalentsCurrent liabilities – bank overdraft
– :1 0,9 0,6 0,7 0,7 0,8 0,2 0,3 0,2 0,2 0,1
Debt leverage Measures the group’s ability to meet capital and interest payments over the long term
Total liabilities to shareholders’ equityNon-current liabilities + current liabilities Shareholders’ equity
– % 64,3 60,2 63,1 63,3 71,1 79,9 90,6 95,4 101,0 108,3
Total borrowings to shareholders’ equityLong-term debt + short-term debt + bank overdraft (total borrowings)Shareholders’ equity
– % 16,6 12,9 15,1 16,8 22,0 26,3 31,7 34,7 42,8 46,7
Net borrowings to shareholders’ equity (gearing)Total borrowings – cash Shareholders’ equity
– % 20 – 40 (0,3) 2,7 1,4 1,0 (1,2) 20,5 22,0 28,0 37,1 40,8
Debt coverage Cash generated by operating activitiesTotal borrowings
– times 2,4 3,0 2,4 1,7 2,6 1,7 1,5 1,3 1,0 0,9
Finance costs coverNet profit before finance costs and taxationFinance costs paid
– times 63,7 57,1 34,8 14,3 12,3 14,5 14,8 10,1 9,7 6,8
Profitability Measures the financial performance of the group
Return on shareholders’ equityAttributable earningsAverage shareholders’ equity
– % 19,1 20,3 19,7 17,9 17,0 32,5 29,8 21,6 24,0 16,9
Return on total assetsNet profit before finance costs and taxationAverage non-current assets + average current assets
– % 18,4 20,0 18,7 16,9 18,7 26,9 24,2 18,5 18,2 13,3
Return on total operating assetsNet profit before finance costs and taxationAverage non-current operating assets + average current assets
– % 22,1 23,9 22,1 19,1 20,7 31,2 30,8 23,6 22,0 15,7
Return on net assetsNet profit before finance costs and taxation Average total assets – average total liabilities
– % 29,7 31,9 30,3 27,8 32,4 48,9 46,2 36,5 37,1 27,4
Gross profit margin %Turnover – variable cost – cost of stockTurnover
– % 55,0 50,0 50,9 51,6 47,5 51,9 51,2 53,5
Operating profit marginOperating profitTurnover
– % 22,4 21,7 21,0 19,6 17,9 26,0 26,1 20,9 20,8 15,2
# The targeted performance ratios and the actual results achieved are discussed in the chief financial officer’s review on page 2.
key performance indicators
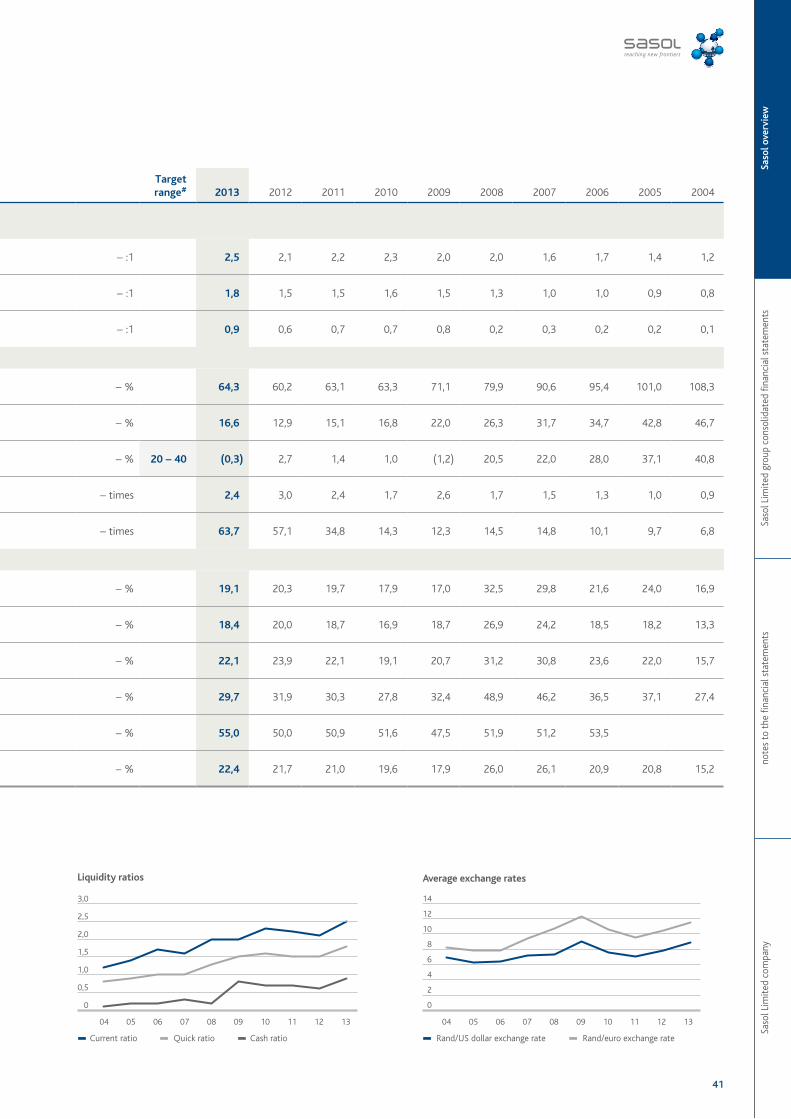
Saso
l Lim
ited
com
pany
note
s to
the
fina
ncia
l sta
tem
ents
Saso
l Lim
ited
grou
p co
nsol
idat
ed fi
nanc
ial s
tate
men
tsSa
sol o
verv
iew
41
Targetrange# 2013 2012 2011 2010 2009 2008 2007 2006 2005 2004
Liquidity Measures the group’s ability to meet its maturing obligations and unexpected cash needs in the short term
Current ratioCurrent assetsCurrent liabilities
– :1 2,5 2,1 2,2 2,3 2,0 2,0 1,6 1,7 1,4 1,2
Quick ratioCurrent assets – inventoriesCurrent liabilities
– :1 1,8 1,5 1,5 1,6 1,5 1,3 1,0 1,0 0,9 0,8
Cash ratio Cash and cash equivalentsCurrent liabilities – bank overdraft
– :1 0,9 0,6 0,7 0,7 0,8 0,2 0,3 0,2 0,2 0,1
Debt leverage Measures the group’s ability to meet capital and interest payments over the long term
Total liabilities to shareholders’ equityNon-current liabilities + current liabilities Shareholders’ equity
– % 64,3 60,2 63,1 63,3 71,1 79,9 90,6 95,4 101,0 108,3
Total borrowings to shareholders’ equityLong-term debt + short-term debt + bank overdraft (total borrowings)Shareholders’ equity
– % 16,6 12,9 15,1 16,8 22,0 26,3 31,7 34,7 42,8 46,7
Net borrowings to shareholders’ equity (gearing)Total borrowings – cash Shareholders’ equity
– % 20 – 40 (0,3) 2,7 1,4 1,0 (1,2) 20,5 22,0 28,0 37,1 40,8
Debt coverage Cash generated by operating activitiesTotal borrowings
– times 2,4 3,0 2,4 1,7 2,6 1,7 1,5 1,3 1,0 0,9
Finance costs coverNet profit before finance costs and taxationFinance costs paid
– times 63,7 57,1 34,8 14,3 12,3 14,5 14,8 10,1 9,7 6,8
Profitability Measures the financial performance of the group
Return on shareholders’ equityAttributable earningsAverage shareholders’ equity
– % 19,1 20,3 19,7 17,9 17,0 32,5 29,8 21,6 24,0 16,9
Return on total assetsNet profit before finance costs and taxationAverage non-current assets + average current assets
– % 18,4 20,0 18,7 16,9 18,7 26,9 24,2 18,5 18,2 13,3
Return on total operating assetsNet profit before finance costs and taxationAverage non-current operating assets + average current assets
– % 22,1 23,9 22,1 19,1 20,7 31,2 30,8 23,6 22,0 15,7
Return on net assetsNet profit before finance costs and taxation Average total assets – average total liabilities
– % 29,7 31,9 30,3 27,8 32,4 48,9 46,2 36,5 37,1 27,4
Gross profit margin %Turnover – variable cost – cost of stockTurnover
– % 55,0 50,0 50,9 51,6 47,5 51,9 51,2 53,5
Operating profit marginOperating profitTurnover
– % 22,4 21,7 21,0 19,6 17,9 26,0 26,1 20,9 20,8 15,2
# The targeted performance ratios and the actual results achieved are discussed in the chief financial officer’s review on page 2.
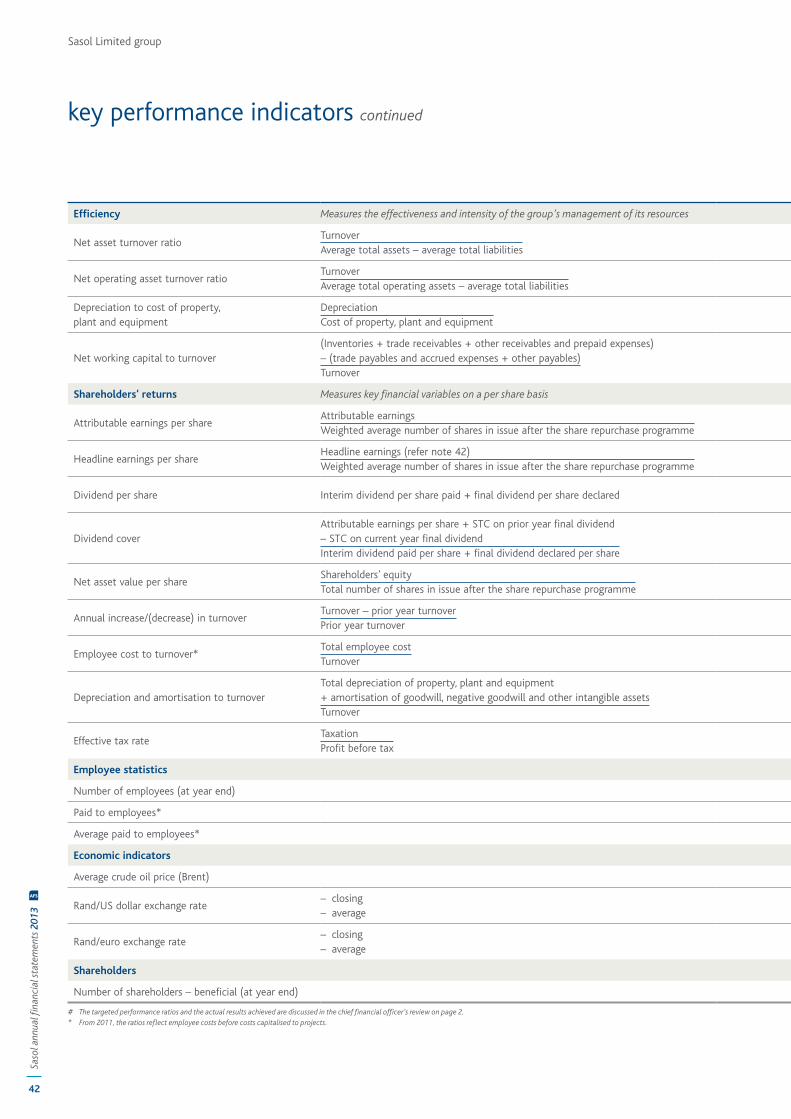
42
Saso
l ann
ual fi
nanc
ial s
tate
men
ts 2
013
AFS
Sasol Limited group
Targetrange# 2013 2012 2011 2010 2009 2008 2007 2006 2005 2004
Efficiency Measures the effectiveness and intensity of the group’s management of its resources
Net asset turnover ratioTurnoverAverage total assets – average total liabilities
– times 1,3 1,4 1,4 1,3 1,7 1,8 1,7 1,7 1,7 1,7
Net operating asset turnover ratioTurnoverAverage total operating assets – average total liabilities
– times 1,8 1,9 1,8 1,7 2,0 2,5 2,9 3,0 2,7 2,5
Depreciation to cost of property, plant and equipment
DepreciationCost of property, plant and equipment
– % 6,0 5,5 5,0 4,9 4,7 4,1 3,8 4,5 4,8 5,8
Net working capital to turnover(Inventories + trade receivables + other receivables and prepaid expenses) – (trade payables and accrued expenses + other payables)Turnover
– % 16,0 15,4 14,3 14,4 15,3 11,2 21,4 18,5 20,2 18,2 17,8
Shareholders’ returns Measures key financial variables on a per share basis
Attributable earnings per shareAttributable earningsWeighted average number of shares in issue after the share repurchase programme
– SA rand– US dollar
43,384,90
39,105,02
32,974,71
26,683,51
22,902,53
37,305,11
27,353,80
16,782,62
15,392,48
9,501,38
Headline earnings per shareHeadline earnings (refer note 42)Weighted average number of shares in issue after the share repurchase programme
– SA rand– US dollar
52,625,95
42,285,43
33,854,83
26,573,50
25,422,81
38,095,22
25,373,52
22,983,59
17,292,78
9,101,32
Dividend per share Interim dividend per share paid + final dividend per share declared– SA rand
– US dollar19,00
1,9217,50
2,1413,00
1,9210,50
1,378,501,10
13,001,65
9,001,27
7,101,01
5,400,84
4,500,71
Dividend coverAttributable earnings per share + STC on prior year final dividend – STC on current year final dividend Interim dividend paid per share + final dividend declared per share
– times Progressive 2,30 2,30 2,50 2,50 2,70 2,80 3,00 2,30 2,90 2,11
Net asset value per shareShareholders’ equity Total number of shares in issue after the share repurchase programme
– SA rand 247,19 208,27 178,89 157,63 141,14 128,44 100,55 84,45 70,94 57,31
Annual increase/(decrease) in turnover Turnover – prior year turnover Prior year turnover
– % 6,98 18,96 16,51 (11,30) 6,10 32,40 19,10 19,00 15,10 (6,80)
Employee cost to turnover*Total employee costTurnover
– % 13,81 12,11 13,27 14,35 12,70 11,10 11,90 11,60 12,70 14,80
Depreciation and amortisation to turnoverTotal depreciation of property, plant and equipment + amortisation of goodwill, negative goodwill and other intangible assetsTurnover
– % 6,6 5,7 5,2 5,5 4,5 4,0 4,1 5,2 5,9 8,3
Effective tax rateTaxationProfit before tax
– % 31,7 32,6 31,3 29,9 43,3 30,1 31,7 38,2 32,4 35,1
Employee statistics
Number of employees (at year end) – number 35 471 34 916 33 708 33 054 33 164 33 928 31 860 31 460 30 004 30 910
Paid to employees* – R million 25 038 20 520 18 907 17 546 17 532 14 443 11 695 9 551 8 782 8 877
Average paid to employees* – R thousand 706 588 561 531 529 426 367 304 293 287
Economic indicators
Average crude oil price (Brent) – US$/bbl 108,66 112,42 96,48 74,37 68,14 95,51 63,95 62,45 46,17 31,30
Rand/US dollar exchange rate – closing– average
– :1– :1
9,888,85
8,177,78
6,777,01
7,677,59
7,739,04
7,837,30
7,047,20
7,176,41
6,676,21
6,216,88
Rand/euro exchange rate – closing– average
– :1– :1
12,8511,46
10,3410,42
9,829,54
9,3910,55
10,8412,31
12,3410,77
9,539,40
9,177,80
8,077,89
7,578,19
Shareholders
Number of shareholders – beneficial (at year end) – number 85 780 75 180 70 021 67 885 56 873 52 580 42 591 40 336 35 315 36 496
# The targeted performance ratios and the actual results achieved are discussed in the chief financial officer’s review on page 2.* From 2011, the ratios reflect employee costs before costs capitalised to projects.
key performance indicators continued
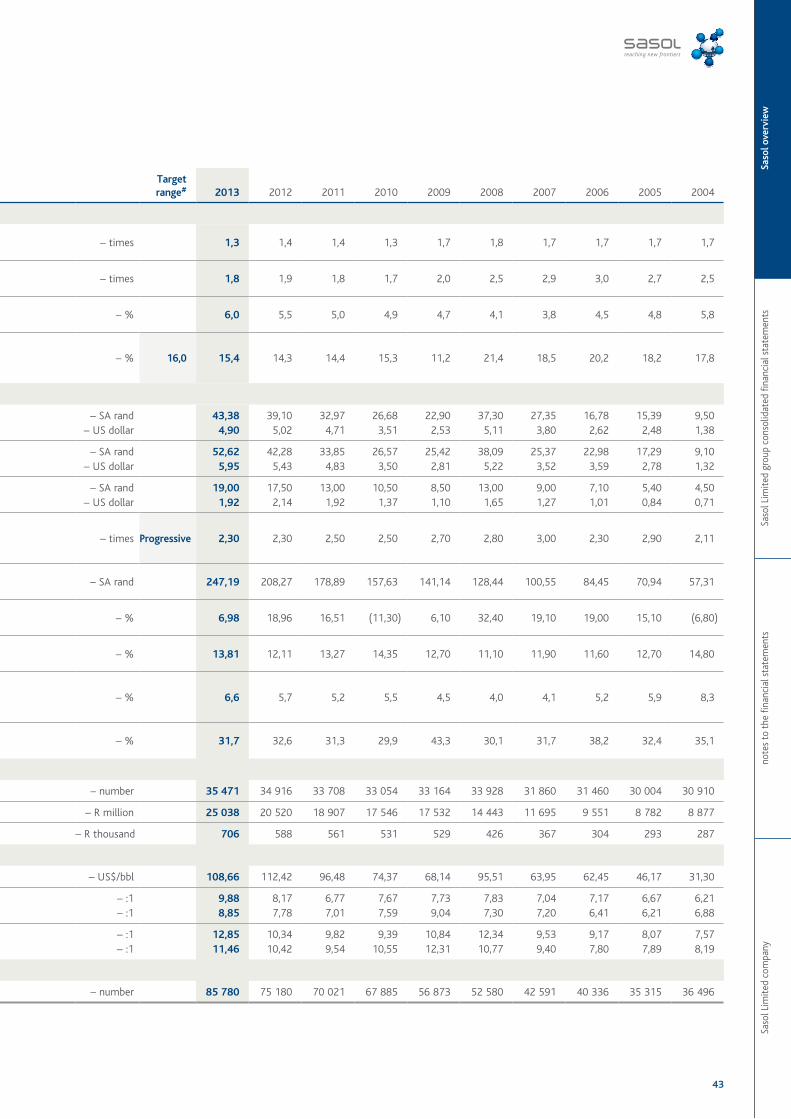
Saso
l Lim
ited
com
pany
note
s to
the
fina
ncia
l sta
tem
ents
Saso
l Lim
ited
grou
p co
nsol
idat
ed fi
nanc
ial s
tate
men
tsSa
sol o
verv
iew
43
Targetrange# 2013 2012 2011 2010 2009 2008 2007 2006 2005 2004
Efficiency Measures the effectiveness and intensity of the group’s management of its resources
Net asset turnover ratioTurnoverAverage total assets – average total liabilities
– times 1,3 1,4 1,4 1,3 1,7 1,8 1,7 1,7 1,7 1,7
Net operating asset turnover ratioTurnoverAverage total operating assets – average total liabilities
– times 1,8 1,9 1,8 1,7 2,0 2,5 2,9 3,0 2,7 2,5
Depreciation to cost of property, plant and equipment
DepreciationCost of property, plant and equipment
– % 6,0 5,5 5,0 4,9 4,7 4,1 3,8 4,5 4,8 5,8
Net working capital to turnover(Inventories + trade receivables + other receivables and prepaid expenses) – (trade payables and accrued expenses + other payables)Turnover
– % 16,0 15,4 14,3 14,4 15,3 11,2 21,4 18,5 20,2 18,2 17,8
Shareholders’ returns Measures key financial variables on a per share basis
Attributable earnings per shareAttributable earningsWeighted average number of shares in issue after the share repurchase programme
– SA rand– US dollar
43,384,90
39,105,02
32,974,71
26,683,51
22,902,53
37,305,11
27,353,80
16,782,62
15,392,48
9,501,38
Headline earnings per shareHeadline earnings (refer note 42)Weighted average number of shares in issue after the share repurchase programme
– SA rand– US dollar
52,625,95
42,285,43
33,854,83
26,573,50
25,422,81
38,095,22
25,373,52
22,983,59
17,292,78
9,101,32
Dividend per share Interim dividend per share paid + final dividend per share declared– SA rand
– US dollar19,00
1,9217,50
2,1413,00
1,9210,50
1,378,501,10
13,001,65
9,001,27
7,101,01
5,400,84
4,500,71
Dividend coverAttributable earnings per share + STC on prior year final dividend – STC on current year final dividend Interim dividend paid per share + final dividend declared per share
– times Progressive 2,30 2,30 2,50 2,50 2,70 2,80 3,00 2,30 2,90 2,11
Net asset value per shareShareholders’ equity Total number of shares in issue after the share repurchase programme
– SA rand 247,19 208,27 178,89 157,63 141,14 128,44 100,55 84,45 70,94 57,31
Annual increase/(decrease) in turnover Turnover – prior year turnover Prior year turnover
– % 6,98 18,96 16,51 (11,30) 6,10 32,40 19,10 19,00 15,10 (6,80)
Employee cost to turnover*Total employee costTurnover
– % 13,81 12,11 13,27 14,35 12,70 11,10 11,90 11,60 12,70 14,80
Depreciation and amortisation to turnoverTotal depreciation of property, plant and equipment + amortisation of goodwill, negative goodwill and other intangible assetsTurnover
– % 6,6 5,7 5,2 5,5 4,5 4,0 4,1 5,2 5,9 8,3
Effective tax rateTaxationProfit before tax
– % 31,7 32,6 31,3 29,9 43,3 30,1 31,7 38,2 32,4 35,1
Employee statistics
Number of employees (at year end) – number 35 471 34 916 33 708 33 054 33 164 33 928 31 860 31 460 30 004 30 910
Paid to employees* – R million 25 038 20 520 18 907 17 546 17 532 14 443 11 695 9 551 8 782 8 877
Average paid to employees* – R thousand 706 588 561 531 529 426 367 304 293 287
Economic indicators
Average crude oil price (Brent) – US$/bbl 108,66 112,42 96,48 74,37 68,14 95,51 63,95 62,45 46,17 31,30
Rand/US dollar exchange rate – closing– average
– :1– :1
9,888,85
8,177,78
6,777,01
7,677,59
7,739,04
7,837,30
7,047,20
7,176,41
6,676,21
6,216,88
Rand/euro exchange rate – closing– average
– :1– :1
12,8511,46
10,3410,42
9,829,54
9,3910,55
10,8412,31
12,3410,77
9,539,40
9,177,80
8,077,89
7,578,19
Shareholders
Number of shareholders – beneficial (at year end) – number 85 780 75 180 70 021 67 885 56 873 52 580 42 591 40 336 35 315 36 496
# The targeted performance ratios and the actual results achieved are discussed in the chief financial officer’s review on page 2.* From 2011, the ratios reflect employee costs before costs capitalised to projects.
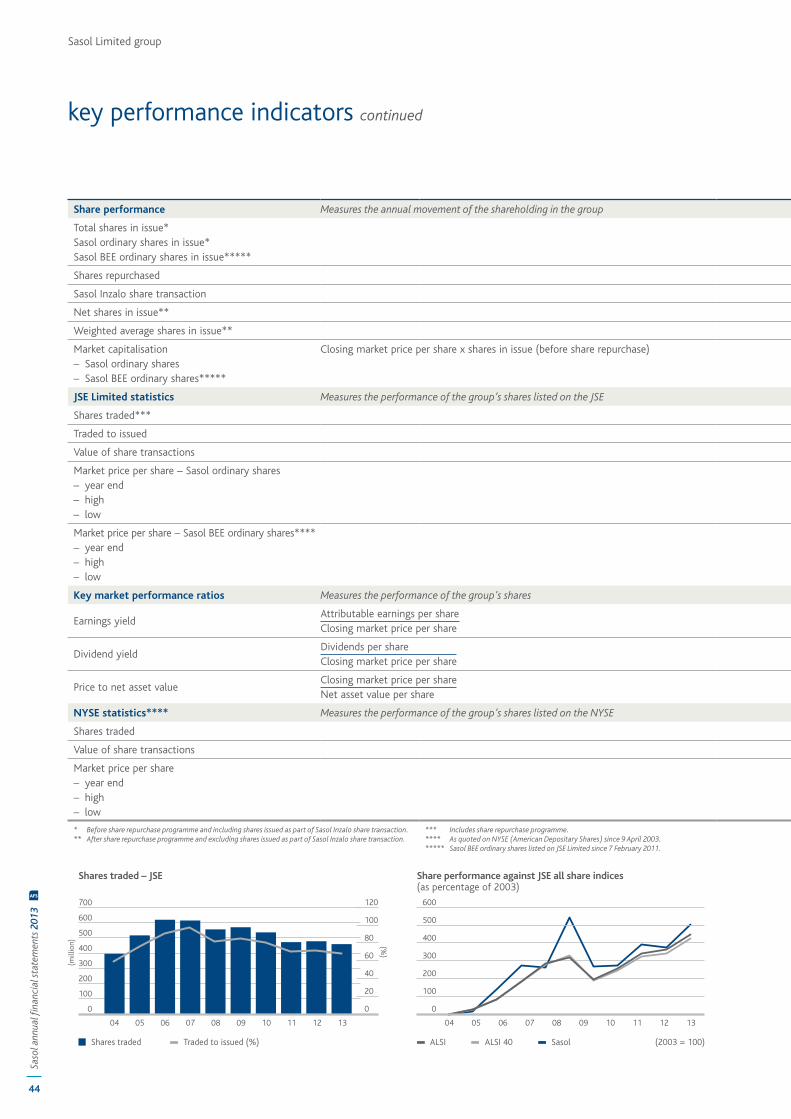
44
Saso
l ann
ual fi
nanc
ial s
tate
men
ts 2
013
AFS
Sasol Limited group
Targetrange 2013 2012 2011 2010 2009 2008 2007 2006 2005 2004
Share performance Measures the annual movement of the shareholding in the group
Total shares in issue*Sasol ordinary shares in issue*Sasol BEE ordinary shares in issue*****
– million– million– million
677,2648,8
2,8
673,2644,8
2,8
671,0642,6
2,8
667,7639,3
665,9637,5
676,7667,7
627,7627,7
683,0683,0
676,9676,9
671,3671,3
Shares repurchased – million 8,8 8,8 8,8 8,8 8,8 37,1 14,9 60,1 60,1 60,1
Sasol Inzalo share transaction – million 63,1 63,1 63,1 63,1 63,1 44,2
Net shares in issue** – million 605,3 601,3 599,1 595,8 594,0 595,4 612,8 622,9 616,8 611,2
Weighted average shares in issue** – million 605,7 603,2 600,4 597,6 596,1 601,0 622,6 620,0 613,8 610,0
Market capitalisation– Sasol ordinary shares– Sasol BEE ordinary shares*****
Closing market price per share x shares in issue (before share repurchase)– R million– R million
279 983871
220 788686
228 749742
175 548 172 111
307 579
166 968
187 825
122 384
64 512
JSE Limited statistics Measures the performance of the group’s shares listed on the JSE
Shares traded*** – million 458,4 477,4 471,9 535,5 568,5 555,0 612,6 617,5 515,5 395,5
Traded to issued – % 67,7 70,9 70,3 80,2 85,4 82,0 97,6 90,4 76,2 58,9
Value of share transactions – R million 176 314 172 385 161 455 154 687 171 651 198 348 151 088 141 206 67 930 36 941
Market price per share – Sasol ordinary shares – year end– high– low
– Rand– Rand– Rand
431,54452,96336,00
342,40409,99303,45
355,98403,55270,03
274,60318,00255,56
269,98454,00221,00
461,00514,00259,49
266,00278,49215,00
275,00279,00183,00
180,80181,50103,40
96,10111,50
75,10
Market price per share – Sasol BEE ordinary shares**** – year end– high– low
– Rand– Rand– Rand
311,00340,00245,02
245,01295,02167,21
265,00310,00260,00
Key market performance ratios Measures the performance of the group’s shares
Earnings yieldAttributable earnings per shareClosing market price per share
– % 10,05 11,42 9,26 9,72 8,48 8,09 10,28 6,10 8,51 9,89
Dividend yieldDividends per shareClosing market price per share
– % 4,40 5,11 3,65 3,82 3,15 2,82 3,38 2,58 2,99 4,68
Price to net asset valueClosing market price per shareNet asset value per share
– :1 1,75 1,64 1,99 1,74 1,91 3,59 2,65 3,26 2,55 1,68
NYSE statistics**** Measures the performance of the group’s shares listed on the NYSE
Shares traded – million 50,5 60,7 69,9 90,0 209,0 174,6 147,9 107,2 65,9 16,7
Value of share transactions – US$ million 2 184 2 810 3 373 3 417 7 101 8 665 5 034 3 856 1 467 239
Market price per share– year end– high– low
– US$– US$– US$
43,3147,9239,94
42,4554,2240,01
52,8960,3934,89
35,2743,6831,15
34,8257,9519,23
38,4066,0935,66
37,5437,5432,20
38,6446,1027,30
26,9828,7715,75
15,7316,5010,35
* Before share repurchase programme and including shares issued as part of Sasol Inzalo share transaction.** After share repurchase programme and excluding shares issued as part of Sasol Inzalo share transaction.
*** Includes share repurchase programme.**** As quoted on NYSE (American Depositary Shares) since 9 April 2003.***** Sasol BEE ordinary shares listed on JSE Limited since 7 February 2011.
key performance indicators continued
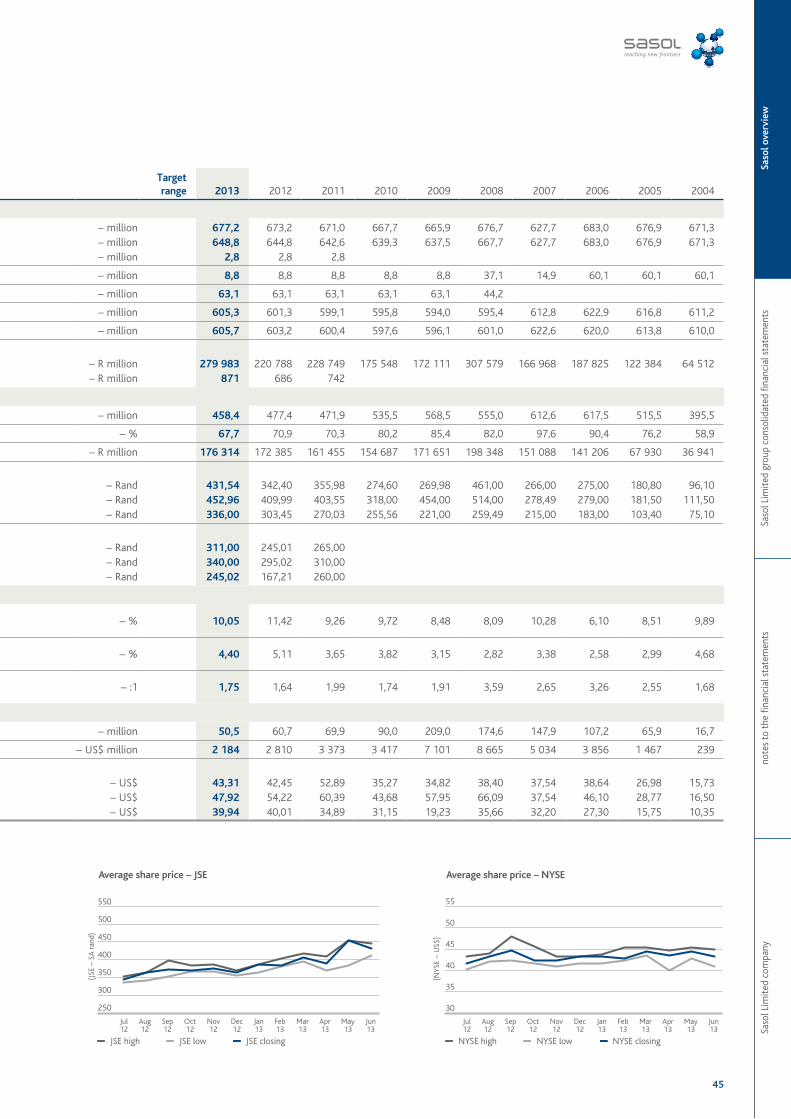
Saso
l Lim
ited
com
pany
note
s to
the
fina
ncia
l sta
tem
ents
Saso
l Lim
ited
grou
p co
nsol
idat
ed fi
nanc
ial s
tate
men
tsSa
sol o
verv
iew
45
Targetrange 2013 2012 2011 2010 2009 2008 2007 2006 2005 2004
Share performance Measures the annual movement of the shareholding in the group
Total shares in issue*Sasol ordinary shares in issue*Sasol BEE ordinary shares in issue*****
– million– million– million
677,2648,8
2,8
673,2644,8
2,8
671,0642,6
2,8
667,7639,3
665,9637,5
676,7667,7
627,7627,7
683,0683,0
676,9676,9
671,3671,3
Shares repurchased – million 8,8 8,8 8,8 8,8 8,8 37,1 14,9 60,1 60,1 60,1
Sasol Inzalo share transaction – million 63,1 63,1 63,1 63,1 63,1 44,2
Net shares in issue** – million 605,3 601,3 599,1 595,8 594,0 595,4 612,8 622,9 616,8 611,2
Weighted average shares in issue** – million 605,7 603,2 600,4 597,6 596,1 601,0 622,6 620,0 613,8 610,0
Market capitalisation– Sasol ordinary shares– Sasol BEE ordinary shares*****
Closing market price per share x shares in issue (before share repurchase)– R million– R million
279 983871
220 788686
228 749742
175 548 172 111
307 579
166 968
187 825
122 384
64 512
JSE Limited statistics Measures the performance of the group’s shares listed on the JSE
Shares traded*** – million 458,4 477,4 471,9 535,5 568,5 555,0 612,6 617,5 515,5 395,5
Traded to issued – % 67,7 70,9 70,3 80,2 85,4 82,0 97,6 90,4 76,2 58,9
Value of share transactions – R million 176 314 172 385 161 455 154 687 171 651 198 348 151 088 141 206 67 930 36 941
Market price per share – Sasol ordinary shares – year end– high– low
– Rand– Rand– Rand
431,54452,96336,00
342,40409,99303,45
355,98403,55270,03
274,60318,00255,56
269,98454,00221,00
461,00514,00259,49
266,00278,49215,00
275,00279,00183,00
180,80181,50103,40
96,10111,50
75,10
Market price per share – Sasol BEE ordinary shares**** – year end– high– low
– Rand– Rand– Rand
311,00340,00245,02
245,01295,02167,21
265,00310,00260,00
Key market performance ratios Measures the performance of the group’s shares
Earnings yieldAttributable earnings per shareClosing market price per share
– % 10,05 11,42 9,26 9,72 8,48 8,09 10,28 6,10 8,51 9,89
Dividend yieldDividends per shareClosing market price per share
– % 4,40 5,11 3,65 3,82 3,15 2,82 3,38 2,58 2,99 4,68
Price to net asset valueClosing market price per shareNet asset value per share
– :1 1,75 1,64 1,99 1,74 1,91 3,59 2,65 3,26 2,55 1,68
NYSE statistics**** Measures the performance of the group’s shares listed on the NYSE
Shares traded – million 50,5 60,7 69,9 90,0 209,0 174,6 147,9 107,2 65,9 16,7
Value of share transactions – US$ million 2 184 2 810 3 373 3 417 7 101 8 665 5 034 3 856 1 467 239
Market price per share– year end– high– low
– US$– US$– US$
43,3147,9239,94
42,4554,2240,01
52,8960,3934,89
35,2743,6831,15
34,8257,9519,23
38,4066,0935,66
37,5437,5432,20
38,6446,1027,30
26,9828,7715,75
15,7316,5010,35
* Before share repurchase programme and including shares issued as part of Sasol Inzalo share transaction.** After share repurchase programme and excluding shares issued as part of Sasol Inzalo share transaction.
*** Includes share repurchase programme.**** As quoted on NYSE (American Depositary Shares) since 9 April 2003.***** Sasol BEE ordinary shares listed on JSE Limited since 7 February 2011.
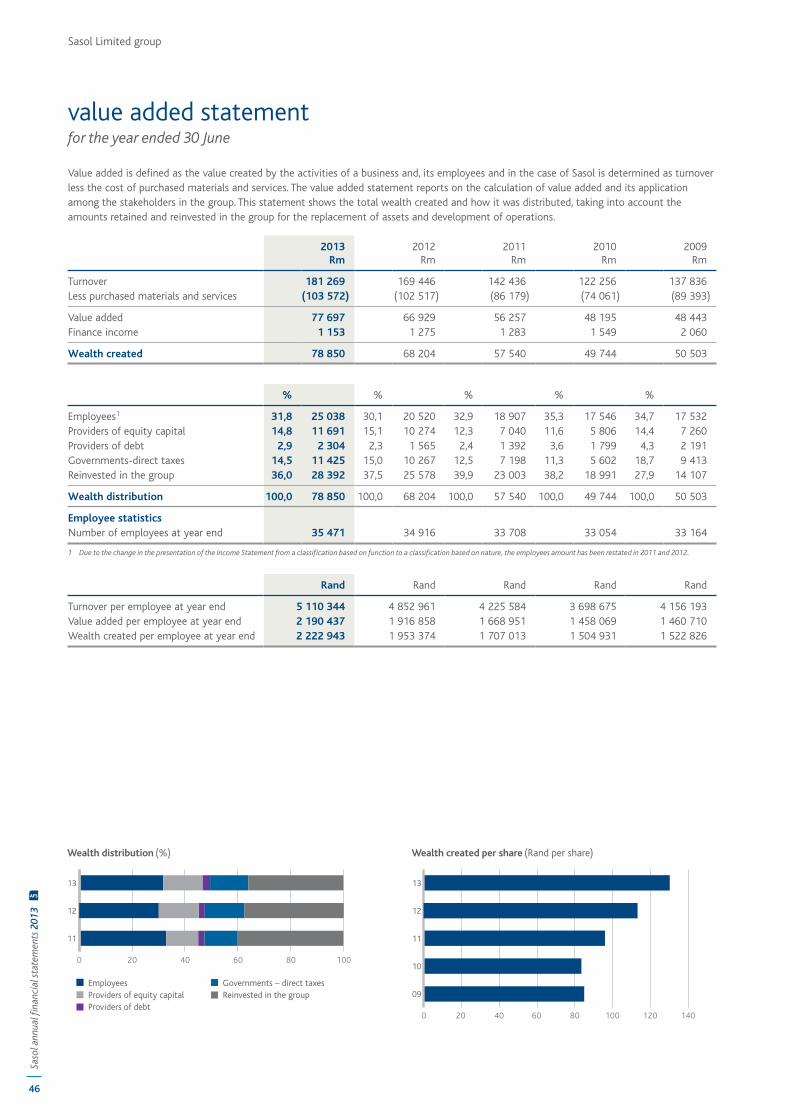
Sasol Limited group
46
Saso
l ann
ual fi
nanc
ial s
tate
men
ts 2
013
AFS
Value added is defined as the value created by the activities of a business and, its employees and in the case of Sasol is determined as turnover less the cost of purchased materials and services. The value added statement reports on the calculation of value added and its application among the stakeholders in the group. This statement shows the total wealth created and how it was distributed, taking into account the amounts retained and reinvested in the group for the replacement of assets and development of operations.
2013Rm
2012Rm
2011Rm
2010Rm
2009Rm
Turnover 181 269 169 446 142 436 122 256 137 836 Less purchased materials and services (103 572) (102 517) (86 179) (74 061) (89 393)
Value added 77 697 66 929 56 257 48 195 48 443 Finance income 1 153 1 275 1 283 1 549 2 060
Wealth created 78 850 68 204 57 540 49 744 50 503
% % % % %
Employees1 31,8 25 038 30,1 20 520 32,9 18 907 35,3 17 546 34,7 17 532 Providers of equity capital 14,8 11 691 15,1 10 274 12,3 7 040 11,6 5 806 14,4 7 260 Providers of debt 2,9 2 304 2,3 1 565 2,4 1 392 3,6 1 799 4,3 2 191 Governments-direct taxes 14,5 11 425 15,0 10 267 12,5 7 198 11,3 5 602 18,7 9 413 Reinvested in the group 36,0 28 392 37,5 25 578 39,9 23 003 38,2 18 991 27,9 14 107
Wealth distribution 100,0 78 850 100,0 68 204 100,0 57 540 100,0 49 744 100,0 50 503
Employee statisticsNumber of employees at year end 35 471 34 916 33 708 33 054 33 164
1 Due to the change in the presentation of the Income Statement from a classification based on function to a classification based on nature, the employees amount has been restated in 2011 and 2012.
Rand Rand Rand Rand Rand
Turnover per employee at year end 5 110 344 4 852 961 4 225 584 3 698 675 4 156 193 Value added per employee at year end 2 190 437 1 916 858 1 668 951 1 458 069 1 460 710 Wealth created per employee at year end 2 222 943 1 953 374 1 707 013 1 504 931 1 522 826
value added statementfor the year ended 30 June
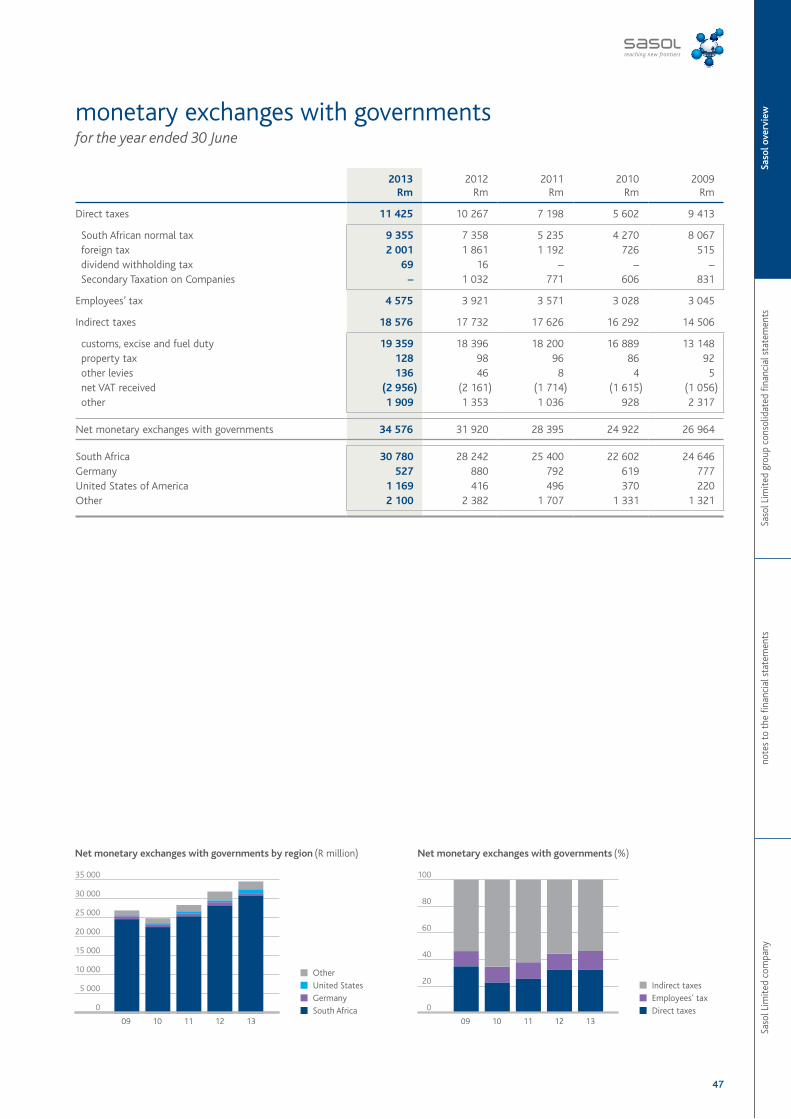
Saso
l Lim
ited
com
pany
note
s to
the
fina
ncia
l sta
tem
ents
Saso
l Lim
ited
grou
p co
nsol
idat
ed fi
nanc
ial s
tate
men
tsSa
sol o
verv
iew
47
2013Rm
2012Rm
2011Rm
2010Rm
2009Rm
Direct taxes 11 425 10 267 7 198 5 602 9 413
South African normal tax 9 355 7 358 5 235 4 270 8 067 foreign tax 2 001 1 861 1 192 726 515 dividend withholding tax 69 16 – – – Secondary Taxation on Companies – 1 032 771 606 831
Employees’ tax 4 575 3 921 3 571 3 028 3 045
Indirect taxes 18 576 17 732 17 626 16 292 14 506
customs, excise and fuel duty 19 359 18 396 18 200 16 889 13 148 property tax 128 98 96 86 92 other levies 136 46 8 4 5 net VAT received (2 956) (2 161) (1 714) (1 615) (1 056) other 1 909 1 353 1 036 928 2 317
Net monetary exchanges with governments 34 576 31 920 28 395 24 922 26 964
South Africa 30 780 28 242 25 400 22 602 24 646 Germany 527 880 792 619 777 United States of America 1 169 416 496 370 220 Other 2 100 2 382 1 707 1 331 1 321
monetary exchanges with governmentsfor the year ended 30 June
Sasol Limited group
48
Saso
l ann
ual fi
nanc
ial s
tate
men
ts 2
013
AFS
The audit committee (the committee) is pleased to present this report in respect of the 2013 financial year to the shareholders of Sasol Limited.
This report has been prepared based on the requirements of the South African Companies Act, 71 of 2008 (the SA Companies Act), as amended, the King Code of Governance Principles for South Africa 2009 (King III), the JSE Listings Requirements and other applicable regulatory requirements.
Composition and meetingsIn compliance with applicable US Securities and Exchange Commission (SEC) and New York Stock Exchange (NYSE) rules, as well as South African legislation, all members are independent non-executive directors.
Information on the membership and composition of the audit committee, its terms of reference and its procedures are set out in the 2013 Corporate Governance report on pages 27 to 37.
Statutory duties and functionsThe committee is constituted as a statutory committee of Sasol Limited in line with the SA Companies Act and a committee of the Sasol Limited board in respect of all other duties assigned to it by the board and United States (US) legislation.
The committee has decision-making authority with regard to its statutory duties and is accountable in this regard to both the board and the shareholders.
The committee fulfilled all of its statutory duties as required by section 94(7)(1) of the SA Companies Act.
On all resolutions delegated to it by the board outside of the statutory duties, the committee makes recommendations to the board for approval. The committee also acts as the audit committee for all South African companies within the Sasol group.
Duties assigned by the boardThe board annually reviews and approves the terms of reference for the committee in terms of which responsibilities of the committee include assisting the board in overseeing: • the quality and integrity of Sasol Limited’s integrated reporting, incorporating the financial statements (including consolidated group
financial statements), sustainability reporting and public announcements in respect of the financial results; • the qualification and independence of the external auditors for Sasol Limited and all group companies; • the scope and effectiveness of the external audit function for Sasol Limited and all group companies; • the effectiveness of the group's internal controls and internal audit function; and • compliance with legal and regulatory requirements to the extent that it might have an impact on financial statements.
In line with the above mentioned responsibilities, the committee performed the following functions:
In respect of the interim and annual financial statements: • confirmed the going concern as the basis of preparation of the interim and annual financial statements; • reviewed the interim financial results and annual financial statements, prior to submission to and approval by the board, satisfied itself that
they fairly present the consolidated and separate results of operations, cash flows, and the financial position of Sasol Limited and comply, in all material respects, with the relevant provisions of the SA Companies Act, International Financial Reporting Standards (IFRS) and Interpretations of IFRS standards as issued by the International Accounting Standards Board;
• considered accounting treatments, significant unusual transactions and accounting judgments; • reviewed the accounting policies, practices and internal controls of the company and is satisfied that they are appropriate, adequate and
comply in all respects with the relevant provisions of the SA Companies Act and IFRS and Interpretations of those standards as issued by the International Accounting Standards Board;
• reviewed the external auditor's audit report; • reviewed any significant legal and tax matters and considered any concerns identified that could have a material impact on the financial
statements; • reviewed the solvency and liquidity tests undertaken for specific transactions and dividend declarations; • considered and made recommendations to the board on the interim and final dividends paid to shareholders; • met separately with management, external and internal audit; and • considered the effectiveness of the group's disclosure controls and procedures.
The committee has established a process to deal with any concerns or complaints relating to accounting practices, internal audit, auditing or content of the company's financial statements and internal financial controls. The committee confirmed that no significant concerns or complaints were raised during the financial year under review.
audit committee report
49
Saso
l Lim
ited
com
pany
note
s to
the
fina
ncia
l sta
tem
ents
Saso
l Lim
ited
gro
up c
onso
lidat
ed fi
nanc
ial s
tate
men
tsSa
sol o
verv
iew
In respect of the scope and effectiveness of the external audit function: • nominated KPMG Inc. as the external auditor for the financial year ended 30 June 2013; • nominated the external auditor and the individual auditor for each of the South African subsidiaries of the company; • ensured that the appointment of the external auditors complied with the SA Companies Act, JSE and all other applicable legal and
regulatory requirements; • reviewed and approved the external audit plan, the budgeted and final fee for the reporting period and the terms of engagement of the
external auditors; • reviewed the external audit and evaluated the quality of the external audit process and concluded it to be satisfactory; • considered whether any reportable irregularities were identified and reported by the external auditors in terms of the Auditing Profession
Act, 2005, and determined that there were none; • reviewed the external auditor's report and obtained assurances from the external auditor that adequate accounting records were being
maintained; • reviewed the findings and recommendations of the external auditors and confirmed that no unresolved issues of concern exist between the
group and the external auditors in relation to the group or any of its business units and subsidiaries; • approved the implementation of an auditor rotation policy; and • in terms of section 61 of the SA Companies Act, recommended to the shareholders for consideration at the next annual general meeting the
appointment of PricewaterhouseCoopers Inc. (PwC) as external auditors for the financial year ending 30 June 2014. The change of auditor was made pursuant to best corporate governance practice and not as a result of KPMG Inc.’s resignation, dismissal or declination to stand for re-election.
In respect of internal control and assurance function, including internal audit and forensic audit: • considered the reports of the internal and external auditors on the group's systems of internal control including financial controls, business
risk management and maintenance of effective internal control systems. Significant issues raised and the adequacy of corrective action in response thereto were reviewed;
• approved the assurance services charter and annual internal audit plan, including combined assurance, and evaluated the independence, effectiveness and performance of the internal audit function and compliance with its charter; and
• assessed the adequacy of the performance of the internal audit function and the adequacy of the available internal audit resources and found them to be satisfactory.
The audit committee is satisfied that there is adequate segregation between the external and internal audit functions and that the independence of the internal and external auditors is not in any way impaired or compromised.
In respect of legal and regulatory compliance requirements to the extent that it may have an impact on the financial statements: • reviewed with management, and to the extent deemed necessary, internal and/or external counsel, legal matters that could have a material
impact on the group; • reviewed with the company's internal counsel the adequacy and effectiveness of the group's procedures to ensure compliance with financial,
legal and regulatory responsibilities; and • monitored complaints received through the group's ethics line, including complaints or concerns regarding accounting matters, internal
audit, internal accounting controls, contents of the financial statements, potential violations of the law and questionable accounting or auditing matters.
In respect of the co-ordination of assurance activities • reviewed the plans and outputs of the external and internal auditors and concluded that these were adequate to address all significant
financial risks facing the business.
In respect of risk management and information technology: • reviewed the group's policies on risk assessment and risk management, including fraud risks and information technology risks as they pertain
to financial reporting and the going concern assessment, and found them to be sound; and considered and reviewed the findings and recommendations of the risk and SHE committee, as well as a report from the information management governance subcommittee.
In respect of sustainability issues contained in the sustainable development report: • monitored the process of sustainability reporting; • considered the findings and recommendations of the disclosure committee and the risk and safety, health and environment
(SHE) committee; • received the necessary assurance that material disclosures are reliable and do not conflict with the financial information; • recommended to the risk and SHE committee the appointment of Environmental Resources Management Southern Africa (Pty) Ltd to
provide assurance on sustainability matters contained in the report; and • considered the assurance provider's findings, made appropriate enquiries from management and, through this process, received the
necessary assurances that material disclosures are reliable and do not conflict with the financial information.
The committee had oversight of integrated reporting, having regard to all factors and risks that may impact on the integrity of the annual integrated report and considered and reviewed the findings and recommendations of the disclosure committee and the risk and SHE committee insofar as they related to the annual integrated report.
50
Saso
l ann
ual fi
nanc
ial s
tate
men
ts 2
013
AFS
Sasol Limited group
audit committee report continued
Internal controlsThe company has designed such internal controls over financial reporting to provide reasonable assurance regarding the reliability of financial reporting and the preparation of financial statements for external purposes in accordance with generally accepted accounting practices.
The committee is of the opinion that there were no material breakdowns in internal control, including financial controls, business risk management and maintenance of effective material control systems during the 2013 financial year.
Independence of the external auditorsThe committee reviewed and assessed the independence of the external auditor and is satisfied that KPMG Inc. is independent of the group based on amongst others, the following reasons: • representations made by KPMG Inc. to the committee, including an annual written statement confirming that their independence has not
been impaired; • the auditor does not, except as external auditor, or in rendering of permitted non-audit services, receive any direct or indirect remuneration
or other benefit from the company or any other company within the group; • the auditor's independence was not impaired by any consultancy, advisory or other work undertaken by the auditor for the company or any
previous appointment as auditor of the company or any other company within the group; • assurance obtained that no member of the external audit team was hired by the company or any other company within the group in a
financial reporting oversight role during the year under review; and • the criteria specified for independence by the Independent Regulatory Board for Auditors and international regulatory bodies.
Regulatory requirementsPursuant to the provisions of the JSE, the committee: • satisfied itself of the appropriateness of the expertise and experience of the chief financial officer, Mrs KC Ramon and of the acting chief
financial officer, Mr P Victor; • satisfied itself that KPMG Inc., as well as the individual auditor determined by KPMG Inc. to be responsible for performing the functions of
auditor, were duly accredited as such on the JSE's list of auditors; and • satisfied itself that PwC, as well as the individual auditor determined by PwC to be responsible for performing the functions of auditor, were
duly accredited as such on the JSE's list of auditors.
Other corporate governance requirementsPursuant to the King Ill Code, and based on specific procedures performed by the independent auditors, the committee satisfied itself with the expertise, resources, successions and experience of the company's finance and taxation functions and concluded that these were appropriate.
ConclusionThe committee is satisfied that it has complied with all its statutory and other responsibilities and having had regard to all material risks and factors that may impact on the integrity of the integrated annual report and the annual financial statements following review, we recommend the integrated annual report and the annual financial statements of Sasol Limited for the year ended 30 June 2013 for approval to the board of directors.
On behalf of the audit committee
Colin Beggschairman
5 September 2013
51
Saso
l Lim
ited
com
pany
note
s to
the
fina
ncia
l sta
tem
ents
Saso
l Lim
ited
gro
up c
onso
lidat
ed fi
nanc
ial s
tate
men
tsSa
sol o
verv
iew
throughout the group and all employees are required to maintain the highest ethical standards in ensuring the group’s business is conducted in a manner that in all reasonable circumstances is above reproach. The focus of risk management in the group is on identifying, assessing, managing and monitoring all known forms of risk across the group. While operating risk cannot be fully eliminated, the group endeavours to minimise it by ensuring that appropriate infrastructure, controls, systems and ethical behaviour are applied and managed within predetermined procedures and constraints.
The directors are of the opinion, based on the information and explanations given by management and the internal auditors that the system of internal control provides reasonable assurance that the financial records may be relied on for the preparation of the consolidated annual financial statements. However, any system of internal financial control can provide only reasonable, and not absolute, assurance against material misstatement or loss. The directors have reviewed the group’s forecast financial performance for the year to 30 June 2014 as well as the longer term budget and, in the light of this review and the current financial position, they are satisfied that the group and the company has or has access to adequate resources to continue as a going concern for the foreseeable future.
The consolidated annual financial statements, set out on pages 55 to 232, and company annual financial statements, set out on pages 233 to 248, which have been prepared on the going concern basis, were approved by the board of directors on 6 September 2013 and were signed on their behalf by:
Hixonia Nyasulu David E. Constable Christine Ramonchairman chief executive officer chief financial officer
6 September 2013
The directors are required by the South African Companies Act to maintain adequate accounting records and are responsible for the content and integrity of the annual financial statements and related financial information included in this report. It is their responsibility to ensure that the annual financial statements fairly present the financial position of the group and Sasol Limited (company) as at the end of the financial year and the results of their operations and cash flows for the financial year, in conformity with International Financial Reporting Standards and Interpretations of those standards, as issued by the International Accounting Standards Board, the SAICA Financial Reporting Guides as issued by the Accounting Practices Committee and Financial Pronouncements as issued by the Financial Reporting Standards Council and the South African Companies Act, 71 of 2008. The group’s external auditors are engaged to express an independent opinion on the consolidated annual financial statements and the annual financial statements of the company. In addition, the directors are responsible for preparing the directors’ report.
The annual financial statements are prepared in accordance with International Financial Reporting Standards as issued by the International Accounting Standards Board and applicable legislation and incorporate disclosure in line with the accounting policies of the group. The annual financial statements are based upon appropriate accounting policies consistently applied throughout the group and supported by reasonable and prudent judgements and estimates. The directors acknowledge that they are ultimately responsible for the system of internal financial control established by the group and place considerable importance on maintaining a strong control environment.
To enable the directors to meet these responsibilities, the board sets standards for internal control aimed at reducing the risk of error or loss in a cost-effective manner. The standards include the proper delegation of responsibilities within a clearly defined framework, effective accounting procedures and adequate segregation of duties to ensure an acceptable level of risk. These controls are monitored
In my capacity as the company secretary, I hereby confirm, in terms of the South African Companies Act, 71 of 2008, that for the year ended 30 June 2013 Sasol Limited has lodged with the Registrar of Companies all such returns as are required of a public company in terms of the South African Companies Act, 71 of 2008, and that all such returns are, to the best of my knowledge and belief, true, correct and up to date.
Vuyo Kahla
6 September 2013
approval of the financial statements
certificate of the company secretary
Sasol Limited group
52
Saso
l ann
ual fi
nanc
ial s
tate
men
ts 2
013
AFS
We believe that the audit evidence we have obtained is sufficient and appropriate to provide a basis for our audit opinion.
OpinionIn our opinion, these financial statements present fairly, in all material respects, the consolidated and separate financial position of Sasol Limited at 30 June 2013, and its consolidated and separate financial performance and consolidated and separate cash flows for the year then ended in accordance with International Financial Reporting Standards, as issued by the International Accounting Standards Board, and the requirements of the Companies Act of South Africa.
Other reports required by the Companies Act of South AfricaAs part of our audit of the financial statements for the year ended 30 June 2013, we have read the directors’ report, the audit committee report and the certificate of the company secretary for the purpose of identifying whether there are material inconsistencies between these reports and the audited financial statements. These reports are the responsibility of the respective preparers. Based on reading these reports we have not identified material inconsistencies between these reports and the audited financial statements. However, we have not audited these reports and accordingly do not express an opinion on these reports.
KPMG Inc.Registered Auditor
Per CH BassonChartered Accountant (SA)Registered AuditorDirector
6 September 2013
85 Empire RoadParktown2193
To the shareholders of Sasol LimitedWe have audited the consolidated and separate financial statements of Sasol Limited, which comprise the statements of financial position at 30 June 2013, and the income statements, the statements of comprehensive income, changes in equity and cash flows for the year then ended, and the notes to the financial statements which include a summary of significant accounting policies and other explanatory notes, as set out on pages 57 to 248.
Directors’ responsibility for the financial statementsThe company’s directors are responsible for the preparation and fair presentation of these financial statements in accordance with International Financial Reporting Standards, as issued by the International Accounting Standards Board, and the requirements of the Companies Act of South Africa, and for such internal control as the directors determine is necessary to enable the preparation of financial statements that are free from material misstatement, whether due to fraud or error.
Auditor’s responsibilityOur responsibility is to express an opinion on these financial statements based on our audit. We conducted our audit in accordance with International Standards on Auditing. Those standards require that we comply with ethical requirements and plan and perform the audit to obtain reasonable assurance whether the financial statements are free from material misstatement.
An audit involves performing procedures to obtain audit evidence about the amounts and disclosures in the financial statements. The procedures selected depend on the auditor’s judgement, including the assessment of the risks of material misstatement of the financial statements, whether due to fraud or error. In making those risk assessments, the auditor considers internal control relevant to the entity’s preparation and fair presentation of the financial statements in order to design audit procedures that are appropriate in the circumstances, but not for the purpose of expressing an opinion on the effectiveness of the entity’s internal control. An audit also includes evaluating the appropriateness of accounting policies used and the reasonableness of accounting estimates made by management, as well as evaluating the overall presentation of the financial statements.
report of the independent auditor
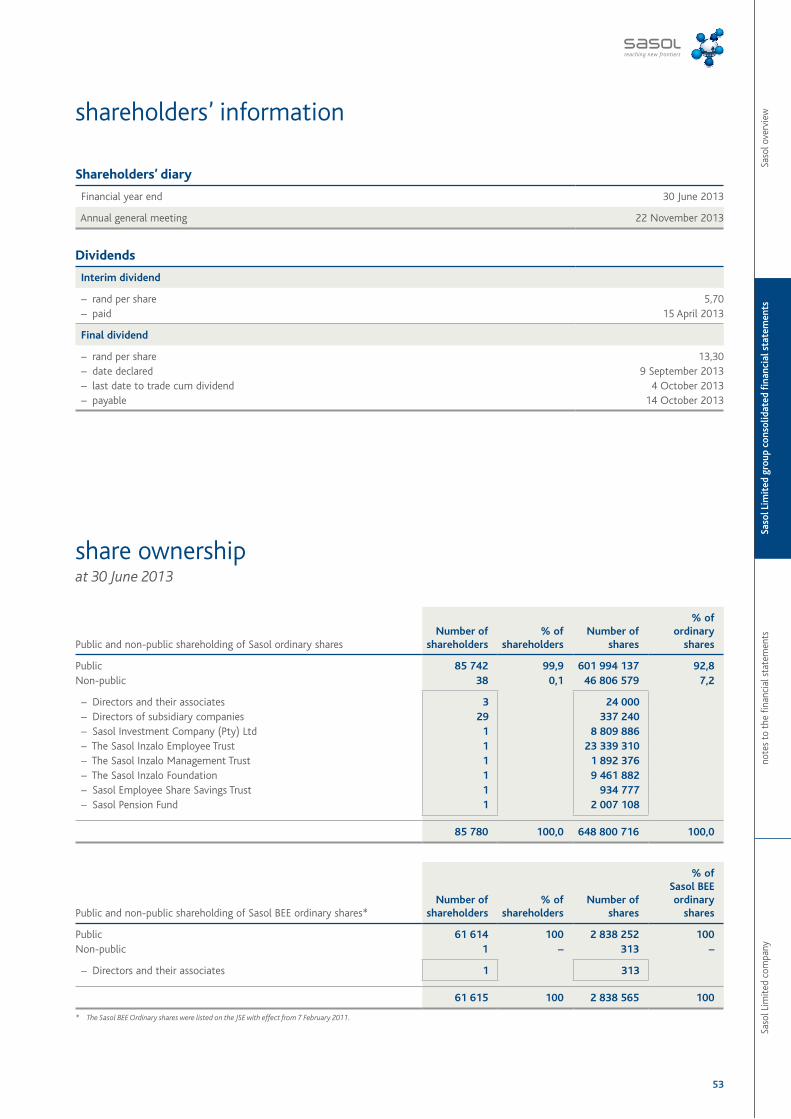
Saso
l Lim
ited
com
pany
note
s to
the
fina
ncia
l sta
tem
ents
Saso
l Lim
ited
gro
up c
onso
lidat
ed fi
nanc
ial s
tate
men
tsSa
sol o
verv
iew
53
Shareholders’ diary
Financial year end 30 June 2013
Annual general meeting 22 November 2013
Dividends
Interim dividend
– rand per share – paid
5,7015 April 2013
Final dividend
– rand per share – date declared – last date to trade cum dividend – payable
13,309 September 2013
4 October 201314 October 2013
shareholders’ information
Public and non-public shareholding of Sasol ordinary sharesNumber of
shareholders% of
shareholders Number of
shares
% ofordinary
shares
Public 85 742 99,9 601 994 137 92,8 Non-public 38 0,1 46 806 579 7,2
– Directors and their associates 3 24 000 – Directors of subsidiary companies 29 337 240 – Sasol Investment Company (Pty) Ltd 1 8 809 886 – The Sasol Inzalo Employee Trust 1 23 339 310 – The Sasol Inzalo Management Trust 1 1 892 376 – The Sasol Inzalo Foundation 1 9 461 882 – Sasol Employee Share Savings Trust 1 934 777 – Sasol Pension Fund 1 2 007 108
85 780 100,0 648 800 716 100,0
Public and non-public shareholding of Sasol BEE ordinary shares*Number of
shareholders % of
shareholders Number of
shares
% ofSasol BEE ordinary
shares
Public 61 614 100 2 838 252 100 Non-public 1 – 313 –
– Directors and their associates 1 313
61 615 100 2 838 565 100
* The Sasol BEE Ordinary shares were listed on the JSE with effect from 7 February 2011.
share ownershipat 30 June 2013
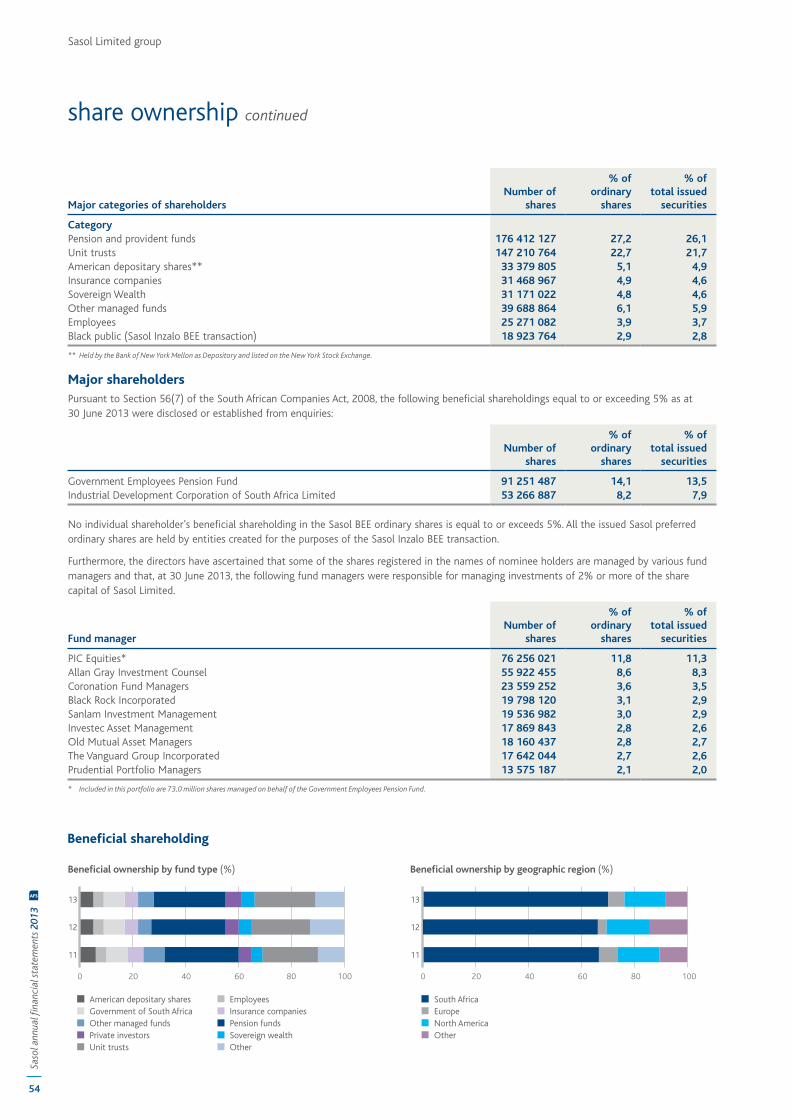
54
Saso
l ann
ual fi
nanc
ial s
tate
men
ts 2
013
AFS
Sasol Limited group
Major categories of shareholdersNumber of
shares
% ofordinary
shares
% oftotal issued
securities
CategoryPension and provident funds 176 412 127 27,2 26,1 Unit trusts 147 210 764 22,7 21,7 American depositary shares** 33 379 805 5,1 4,9 Insurance companies 31 468 967 4,9 4,6 Sovereign Wealth 31 171 022 4,8 4,6 Other managed funds 39 688 864 6,1 5,9 Employees 25 271 082 3,9 3,7 Black public (Sasol Inzalo BEE transaction) 18 923 764 2,9 2,8
** Held by the Bank of New York Mellon as Depository and listed on the New York Stock Exchange.
Major shareholdersPursuant to Section 56(7) of the South African Companies Act, 2008, the following beneficial shareholdings equal to or exceeding 5% as at 30 June 2013 were disclosed or established from enquiries:
Number of shares
% ofordinary
shares
% of total issued
securities
Government Employees Pension Fund 91 251 487 14,1 13,5 Industrial Development Corporation of South Africa Limited 53 266 887 8,2 7,9
No individual shareholder’s beneficial shareholding in the Sasol BEE ordinary shares is equal to or exceeds 5%. All the issued Sasol preferred ordinary shares are held by entities created for the purposes of the Sasol Inzalo BEE transaction.
Furthermore, the directors have ascertained that some of the shares registered in the names of nominee holders are managed by various fund managers and that, at 30 June 2013, the following fund managers were responsible for managing investments of 2% or more of the share capital of Sasol Limited.
Fund managerNumber of
shares
% ofordinary
shares
% of total issued
securities
PIC Equities* 76 256 021 11,8 11,3 Allan Gray Investment Counsel 55 922 455 8,6 8,3 Coronation Fund Managers 23 559 252 3,6 3,5 Black Rock Incorporated 19 798 120 3,1 2,9 Sanlam Investment Management 19 536 982 3,0 2,9 Investec Asset Management 17 869 843 2,8 2,6 Old Mutual Asset Managers 18 160 437 2,8 2,7 The Vanguard Group Incorporated 17 642 044 2,7 2,6 Prudential Portfolio Managers 13 575 187 2,1 2,0
* Included in this portfolio are 73,0 million shares managed on behalf of the Government Employees Pension Fund.
share ownership continued
Beneficial shareholding
55
Saso
l Lim
ited
com
pany
note
s to
the
fina
ncia
l sta
tem
ents
Saso
l Lim
ited
gro
up c
onso
lidat
ed fi
nanc
ial s
tate
men
tsSa
sol o
verv
iew
Sasol BEE ordinary sharesOn 7 February 2011, 2,8 million Sasol BEE ordinary shares were listed on the BEE segment of the JSE’s main board. This listing provides the holders of Sasol’s BEE ordinary shares access to a trading facility in a regulated market in line with the company’s commitment to broad-based shareholder development.
Share repurchase programmeNo shares were repurchased during the year. We repurchased a total of 40 309 886 ordinary shares at a weighted average price of R299,77 per share between 2007 and October 2008. 31 500 000 ordinary shares of the repurchased shares were cancelled during 2009 for a total value of R7,9 billion, whereupon they were restored to authorised share capital. 8 809 886 ordinary shares are still held by Sasol Investment Company (Pty) Ltd, a wholly owned subsidiary.
Shareholders’ equity has been reduced by the cost of these ordinary shares. No dividends are paid outside the group in respect of these ordinary shares.
At the annual general meeting of 25 November 2012, shareholders granted the authority to the Sasol directors to authorise a repurchase of up to 10% of Sasol’s ordinary issued shares and/or Sasol BEE ordinary shares. No shares were repurchased during the year.
Shares held in reserveThe 495 194 138 authorised but unissued ordinary shares of the company continue to be held in reserve.
Note 44 provides further details regarding the share capital of Sasol Limited.
American depositary sharesAt 30 June 2013, the company had in issue through The Bank of New York Mellon as depositary bank, and listed on the NYSE, 33 379 805 (2012 – 34 078 261) American depositary shares (ADS). Each ADS represents one ordinary share.
Sasol Share Incentive SchemeIn terms of the Sasol Share Incentive Scheme, 2 619 500 shares (2012 – 6 605 600 shares) are under the control of the directors for purposes of enabling Sasol Limited to allot shares and to grant options in respect of ordinary shares to present employees, including executive directors of Sasol Limited, its subsidiaries and employees seconded to joint ventures. Following the introduction of the Sasol Share Appreciation Rights Scheme (SAR scheme), no further options will be granted in terms of the Sasol Share Incentive Scheme. Unimplemented share options will not be affected by the SAR Scheme. Note 44 and 45.1 provides further details regarding the Sasol Share Incentive Scheme.
Sasol Share Appreciation Rights SchemeIn March 2007, the group introduced the SAR scheme. This scheme replaces the Sasol Share Incentive Scheme. The SAR scheme allows certain senior employees to earn a long-term cash incentive calculated with reference to the increase in the Sasol ordinary share price between the offer date of the share appreciation rights to vesting and exercise of such rights. No shares are issued in terms of this scheme and all amounts payable in terms of the scheme are
(Company registration number 1979/003231/06)
The directors have pleasure in presenting their report for the year ended 30 June 2013.
Nature of businessSasol Limited, the holding company of the group, is incorporated and domiciled in the Republic of South Africa and was listed on the Johannesburg Stock Exchange (JSE) on 31 October 1979 and on the New York Stock Exchange (NYSE) on 9 April 2003.
Sasol is based mainly in South Africa and has global operations. The company consists of a group of companies focused on integrated energy and chemicals. Sasol adds value to coal and natural oil and gas reserves, using these feedstocks to produce liquid fuels, fuel components and chemicals through our proprietary processes.
Sasol mines coal in South Africa and produces natural gas and condensate in Mozambique, oil in Gabon and shale gas in Canada. Sasol continues to advance its upstream oil and gas activities in West and Southern Africa, the Asia Pacific region and Canada. In South Africa, Sasol refines imported crude oil and sells liquid fuels through a retail network of 410 Sasol- and Exel service stations, which include six integrated energy centres, and supplies gas to industrial customers. The group also supplies fuels to other licensed wholesalers in the region.
Sasol has chemical manufacturing and marketing operations in South Africa, Europe, Asia and the Americas.
Through Sasol Synfuels International (SSI), Sasol is focused on commercialising its gas-to-liquids (GTL) technology internationally.
The nature of the businesses of the significant operating subsidiaries and incorporated joint ventures is set out on pages 246 to 248.
Financial resultsProfit attributable to shareholders of R26 278 million for the year was 11% higher (2012 – 19% higher) than the R23 583 million of the previous year. Earnings per share, after taking into account the share buyback programme, increased by 11% (2012 – increase of 19%) from R39,10 per share to R43,38 per share.
Subsidiaries, joint ventures and associatesSubsidiariesIn April 2013, Sasol Oil disposed of its bitumen business, operated by Tosas (Pty) Ltd, for a purchase price consideration of R116 million.
Joint venturesIn December 2012, Sasol acquired the remaining 50% shareholding in Merisol for a purchase consideration of R730 million (US$85 million).
Share capitalNew shares issuedNote 44 provides further details regarding the share capital of Sasol Limited. No additional shares were issued during the year as part of the Sasol Inzalo share transaction.
A further 3 975 500 shares were issued during the year in terms of the Sasol Share Incentive Scheme.
directors’ report
56
Saso
l ann
ual fi
nanc
ial s
tate
men
ts 2
013
AFS
Sasol Limited group
AuditorsKPMG Inc. continued in office as auditor of Sasol Limited and its subsidiaries for the duration of the financial year until 30 June 2013. At the annual general meeting of 22 November 2013, shareholders will be requested to appoint PricewaterhouseCoopers Inc. as auditor of Sasol Limited and to note that Mr P Hough will be the individual responsible for performing the functions of auditor, following the audit committee’s decision to nominate the firm PricewaterhouseCoopers Inc. as its independent auditor for the financial year commencing 1 July 2013.
Subsequent eventsThe following non-adjusting events occurred subsequent to 30 June 2013: • On 2 July 2013, Sasol Gas disposed of its 49% share in Spring
Lights Gas for a purchase consideration of R474 million. • On 16 August 2013, we entered into a definitive sale and
purchase agreement to dispose of our 50% interest in Arya Sasol Polymer Company for a purchase consideration of R3 606 million (US$365 million). As a result of this transaction, Sasol has no ongoing investment in Iran.
SecretaryThe company secretary of Sasol Limited is Mr VD Kahla. His business and postal addresses appear on the inside back cover.
Special resolutionsThe following subsidiaries of Sasol Limited passed special resolutions after the date of the previous directors’ report, in terms of which memorandums of incorporation were adopted to harmonise the contents thereof with the Companies Act no 71 of 2008 which included, in some instances, converting the share capital from par value to no par value shares: • Sasol Chemical Industries Limited • Sasol Chemical Holdings International (Pty) Ltd • Sasol Holdings (USA) (Pty) Ltd • Sasol Investment Company (Pty) Ltd • Sasol Group Services (Pty) Ltd • Sasol Financing (Pty) Ltd • Sasol Mafutha (Pty) Ltd • Sasol Synfuels Holdings (Pty) Ltd • Sasol New Energy Holdings (Pty) Ltd • Sasol Technology (Pty) Ltd • Sasol Acrylates (South Africa) (Pty) Ltd • Sasol Acrylates (Pty) Ltd • Sasol Synfuels (Pty) Ltd • Sasol Petroleum Holdings (Pty) Ltd • Sasol Petroleum International (Pty) Ltd • Sasol Cobalt Catalyst Manufacturing (Pty) Ltd • Sasol Synfuels International (Pty) Ltd • Sasol Gas Limited • Sasol Gas Holdings (Pty) Ltd • Sasol Mafutha Mining (Pty) Ltd
settled in cash. Note 45.4.1 provides further details regarding the Sasol Share Appreciation Rights Scheme.
In 2012, Share appreciation rights with corporate performance targets were introduced for those senior employees who participate in the Sasol Medium-term Incentive Scheme (MTI scheme). No shares are issued in terms of this scheme and all amounts payable in terms of the scheme are settled in cash. Note 45.4.2 provides further details regarding the SAR scheme with performance targets.
Sasol Medium-term Incentive SchemeIn September 2009, the group introduced the MTI scheme. This scheme provides qualifying employees who participate in the SAR scheme with the opportunity of receiving cash incentive payments based on the value of the Sasol ordinary share. The MTI scheme incentive amount is linked to certain corporate performance targets. No shares are issued in terms of this scheme and all amounts payable in terms of the scheme are settled in cash. Note 45.5 provides further details regarding the Sasol Medium-term Incentive Scheme.
Sasol Inzalo Employee Trust and Sasol Inzalo Management Trust (Inzalo Share Scheme)In terms of the Inzalo Share Scheme, 23 339 310 and 1 892 376 shares were allotted to The Sasol Inzalo Employee Trust and The Sasol Inzalo Management Trust, respectively. The shares are held for the purposes of enabling Sasol Limited to grant rights in respect of ordinary shares to present and future employees below managerial level and Sasol black managers and black executives in terms of the Sasol Inzalo share transaction. Note 45.2 provides further details regarding the Inzalo Share Scheme.
DividendsAn interim dividend of R5,70 per ordinary share (2012 – R5,70 per ordinary share) was paid on 15 April 2013. A final dividend in respect of the year ended 30 June 2013 of R13,30 per ordinary share (2012 – R11,80 per ordinary share) was declared on 9 September 2013.
The total dividend for the year amounted to R19,00 per ordinary share (2012 – R17,50 per share).
The estimated total cash flow of the final dividend of R13,30 per share, payable on 14 October 2013 is R8 216 million.
The board of directors is satisfied that the liquidity and solvency of the company, as well as capital remaining after payment of the final dividend is sufficient to support the current operations and to facilitate future development of the business.
DirectorsThe composition of the board of directors is set out in the section ‘Our board’ of the annual integrated report. The remuneration and fees of Sasol Limited’s directors are set out on pages 57 to 79 of this report.
directors’ report continued
57
Saso
l Lim
ited
com
pany
note
s to
the
fina
ncia
l sta
tem
ents
Saso
l Lim
ited
gro
up c
onso
lidat
ed fi
nanc
ial s
tate
men
tsSa
sol o
verv
iew
Dear shareholderOn behalf of the Sasol Limited board (the board), the remuneration committee (the committee) is pleased to present you with Sasol’s remuneration policy and remuneration outcomes for the 2013 financial year (FY13).
The committee is committed to applying independent and objective oversight of all aspects of employee remuneration. The committee’s fundamental task is to ensure that the remuneration policy and practices enable the execution of Sasol’s business strategy, attract, motivate and retain talented employees and align the interests of shareholders and executives.
In the year under review, inter alia, the committee: • Amended the short-term incentive scheme to enhance the alignment with core business performance drivers and for top management,
with individual performance; • Rebalanced the mix of the long-term incentive scheme to place more emphasis on share rights as a result of which for the 2014 financial
year (FY14), long-term incentives will solely be delivered via the Medium-Term Incentive Scheme; • Increased further the portion of long-term incentive awards with a performance requirement; • Focused on the incentivisation for major capital project performance for those individuals with responsibility for these projects; • Developed a directional view on further developments in Sasol’s remuneration policy. During FY14, a detailed review of policy and
practices will be undertaken with a view to enhancing alignment with market practice and good governance and reducing complexity; • Appointed New Bridge Street, an Aon Hewitt company, as its independent advisers.
The committee continuously seeks to enhance transparency of reporting and the lay-out of this report reflects this aim.
The committee solicits your support for Sasol’s remuneration policy.
Henk Dijkgraaf (chairman)Imogen Mkhize Hixonia NyasuluJürgen Schrempp Peter Robertson
remuneration report
Sasol Limited group
58
Saso
l ann
ual fi
nanc
ial s
tate
men
ts 2
013
AFS
IntroductionWith the aim of enhancing transparency, this remuneration report is split into three sections covering the following matters:1. Remuneration governance and the role of the committee2. Sasol’s remuneration policy for FY13, changes for FY14 and beyond3. Remuneration outcomes for FY13.
Section 1: remuneration governanceThe remuneration committee has functioned as a committee of the Sasol Limited board since 1989. The committee was established to ensure that remuneration arrangements support the strategic aims of the business and enable the recruitment, motivation and retention of executives and employees at all levels, while complying with all requirements of law and regulation.
The remuneration of the non-executive directors is subject to shareholder approval. The Sasol Limited board makes relevant proposals to shareholders upon recommendation by management.
The terms of reference of the committee is reviewed annually by the board and is available on the company’s website at www.sasol.com.
The members of the committee for the year under review were: • Mr HG Dijkgraaf (chairman) • Ms IN Mkhize • Mrs TH Nyasulu • Mr PJ Robertson • Prof JE Schrempp
Mrs TH Nyasulu is the only member of the committee who is not categorised as an independent director (refer to the corporate governance report).
In line with international best practice, the committee has appointed independent external advisors from New Bridge Street, based in London, to assist the committee. New Bridge Street is a signatory to the UK Remuneration Consultants' Code of Conduct. Vasdex & Associates are used to provide specific advice and services as required and requested by management and the company regularly participates in several external remuneration surveys to inform benchmarking exercises.
The committee met four times during the year. Attendance is reported in the corporate governance report.
All remuneration principles and practices stated in the King Code of Governance Principles for South Africa 2009 (King III Code) are applied, with the exception of one practice relating to the non-executive directors’ fee structure, see page 70.
Key definitionsFor clarity, the following terms are used in this report: • The term group executive committee (GEC) refers to the executive committee, which is responsible for the design and execution of the
organisation’s strategy and long-term business plans. The members of the GEC, at 30 June 2013, included the chief executive officer, two executive directors, two senior group executives and four group executives. All members of the GEC are viewed as prescribed officers within the meaning of the Companies Act, no 71 of 2008, as amended (the Act);
• Top management is defined as the top two levels of the organisation and aligns with the disclosure required under the Employment Equity Act. Top management includes members of the GEC and other executives; and
• Senior management is defined as the top four levels in the organisation.
The following table provides a breakdown of the number of people in categories, included in this report:
Group
Number ofemployees
at 30 June 2013
GEC(includes chief executive officer, executive directors and prescribed officers) 9
Top management(top 2 levels of the organisation, including the GEC) 97
Senior management(top 4 levels of the organisation, including top management) 1 886
remuneration report continued
59
Saso
l Lim
ited
com
pany
note
s to
the
fina
ncia
l sta
tem
ents
Saso
l Lim
ited
gro
up c
onso
lidat
ed fi
nanc
ial s
tate
men
tsSa
sol o
verv
iew
Section 2: remuneration policyThe committee reviews the remuneration policy each year to ensure that the remuneration framework remains effective in supporting the achievement of the company’s business objectives, remains in line with best practice, and fairly rewards individuals for their contribution to the business, having regard to the size and complexity of the group’s operations and the need to attract, motivate and retain employees of the highest calibre.
Sasol’s remuneration policy strives to reward corporate and individual performance through an appropriate balance of fixed pay and both short- and long-term variable components. The policy is designed to incentivise employees to meet the company’s key objectives, such that a significant portion of total remuneration is performance related, based on a mixture of internal and external targets linked to key corporate performance indicators. These must be measurable, understandable and acceptable to both executives and shareholders. The committee considers that the targets set for the different elements of performance related remuneration are both appropriate and demanding in the context of the business environment and the challenges with which the group is faced as well as complying with the provisions of the King III Code.
The key components and drivers of Sasol’s executive remuneration structure which applies to all members of senior management are set out in the table below:
Remuneration component Strategic intent and drivers
Basic salary • Attraction and retention of key employees • Internal and external equity • Rewarding individual performance
Benefits • External market competitiveness • Integrated approach towards wellness driving employee effectiveness and engagement
Allowances • Compliance with legislative, negotiated and contractual commitments
Short-term incentive (STI) plan (<12 months)
Alignment with group/business unit/functional performance in terms of: • Financial targets • Employment equity (South African employees only) • Safety performance (against leading and lagging targets) • Reward performance against targets set at group, business unit and individual levels including targets
for major capital projects
Long-term incentive schemes comprising: • Sasol Medium-term
Incentive (MTI) Scheme • Sasol Share Appreciation
Rights (SAR) scheme
• Attraction and retention of senior employees with the majority of the awards linked to corporate performance targets
• Exceptionally performing employees in the top 20% per level, receive an additional individual reward on the basis of personal performance
• Direct alignment with shareholders’ interests by linking the level of rewards to the achievement of corporate performance targets where units can be forfeited if targets are not met
• For FY14, only MTI rights under the Medium-term Incentive Scheme will be awarded. The sole use of these incentives ensures alignment with shareholders and a link to the share price whilst avoiding the highly geared reward that can be delivered via share appreciation rights
Sasol has a global expatriation policy that is comparable with what is used by most global organisations. This policy is reviewed regularly and governs expatriate assignments. Remuneration practices in countries other than South Africa are based on the principles of Sasol’s remuneration policy taking into account local requirements.
In FY14, the committee will undertake a detailed review of the remuneration policy and practices with a view to reducing complexity and enhancing market alignment. This may include, inter alia, a review of the existing short- and long-term incentive framework and weighting between the two, investigating the merits of replacing cash based long-term incentive awards by equity, introducing minimum shareholding requirements for senior executives and streamlining the retention mechanism.
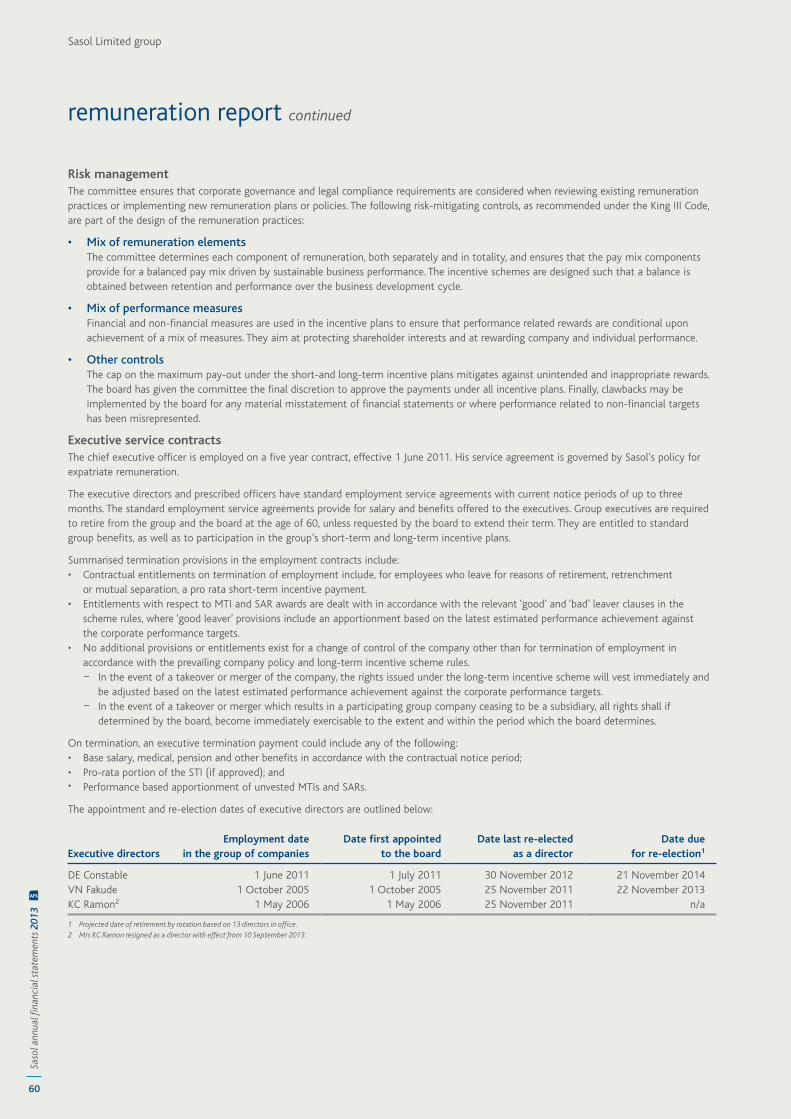
60
Saso
l ann
ual fi
nanc
ial s
tate
men
ts 2
013
AFS
Sasol Limited group
Risk managementThe committee ensures that corporate governance and legal compliance requirements are considered when reviewing existing remuneration practices or implementing new remuneration plans or policies. The following risk-mitigating controls, as recommended under the King III Code, are part of the design of the remuneration practices:
• Mixofremunerationelements The committee determines each component of remuneration, both separately and in totality, and ensures that the pay mix components
provide for a balanced pay mix driven by sustainable business performance. The incentive schemes are designed such that a balance is obtained between retention and performance over the business development cycle.
• Mixofperformancemeasures Financial and non-financial measures are used in the incentive plans to ensure that performance related rewards are conditional upon
achievement of a mix of measures. They aim at protecting shareholder interests and at rewarding company and individual performance.
• Othercontrols The cap on the maximum pay-out under the short-and long-term incentive plans mitigates against unintended and inappropriate rewards.
The board has given the committee the final discretion to approve the payments under all incentive plans. Finally, clawbacks may be implemented by the board for any material misstatement of financial statements or where performance related to non-financial targets has been misrepresented.
Executive service contractsThe chief executive officer is employed on a five year contract, effective 1 June 2011. His service agreement is governed by Sasol’s policy for expatriate remuneration.
The executive directors and prescribed officers have standard employment service agreements with current notice periods of up to three months. The standard employment service agreements provide for salary and benefits offered to the executives. Group executives are required to retire from the group and the board at the age of 60, unless requested by the board to extend their term. They are entitled to standard group benefits, as well as to participation in the group’s short-term and long-term incentive plans.
Summarised termination provisions in the employment contracts include: • Contractual entitlements on termination of employment include, for employees who leave for reasons of retirement, retrenchment
or mutual separation, a pro rata short-term incentive payment. • Entitlements with respect to MTI and SAR awards are dealt with in accordance with the relevant ‘good’ and ‘bad’ leaver clauses in the
scheme rules, where ‘good leaver’ provisions include an apportionment based on the latest estimated performance achievement against the corporate performance targets.
• No additional provisions or entitlements exist for a change of control of the company other than for termination of employment in accordance with the prevailing company policy and long-term incentive scheme rules.
− In the event of a takeover or merger of the company, the rights issued under the long-term incentive scheme will vest immediately and be adjusted based on the latest estimated performance achievement against the corporate performance targets.
− In the event of a takeover or merger which results in a participating group company ceasing to be a subsidiary, all rights shall if determined by the board, become immediately exercisable to the extent and within the period which the board determines.
On termination, an executive termination payment could include any of the following: • Base salary, medical, pension and other benefits in accordance with the contractual notice period; • Pro-rata portion of the STI (if approved); and • Performance based apportionment of unvested MTIs and SARs.
The appointment and re-election dates of executive directors are outlined below:
Executive directorsEmployment date
in the group of companiesDate first appointed
to the boardDate last re-elected
as a directorDate due
for re-election1
DE Constable 1 June 2011 1 July 2011 30 November 2012 21 November 2014VN Fakude 1 October 2005 1 October 2005 25 November 2011 22 November 2013KC Ramon2 1 May 2006 1 May 2006 25 November 2011 n/a
1 Projected date of retirement by rotation based on 13 directors in office.2 Mrs KC Ramon resigned as a director with effect from 10 September 2013.
remuneration report continued
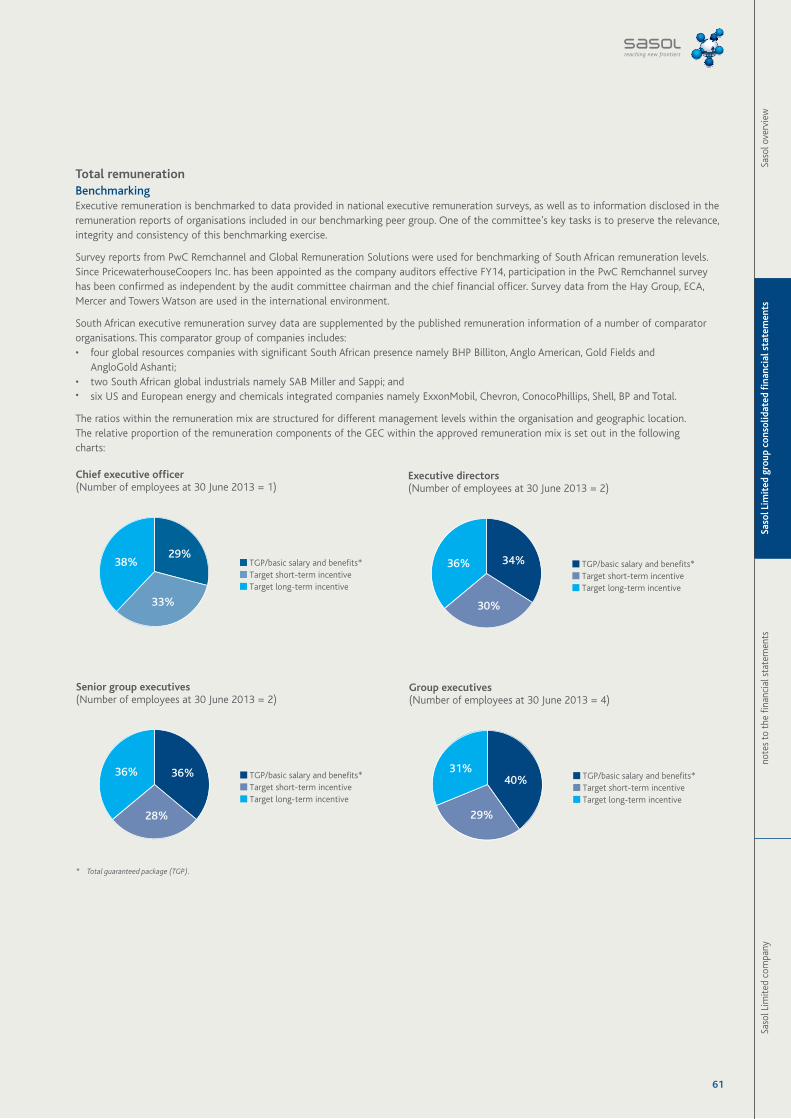
61
Saso
l Lim
ited
com
pany
note
s to
the
fina
ncia
l sta
tem
ents
Saso
l Lim
ited
gro
up c
onso
lidat
ed fi
nanc
ial s
tate
men
tsSa
sol o
verv
iew
Total remunerationBenchmarkingExecutive remuneration is benchmarked to data provided in national executive remuneration surveys, as well as to information disclosed in the remuneration reports of organisations included in our benchmarking peer group. One of the committee’s key tasks is to preserve the relevance, integrity and consistency of this benchmarking exercise.
Survey reports from PwC Remchannel and Global Remuneration Solutions were used for benchmarking of South African remuneration levels. Since PricewaterhouseCoopers Inc. has been appointed as the company auditors effective FY14, participation in the PwC Remchannel survey has been confirmed as independent by the audit committee chairman and the chief financial officer. Survey data from the Hay Group, ECA, Mercer and Towers Watson are used in the international environment.
South African executive remuneration survey data are supplemented by the published remuneration information of a number of comparator organisations. This comparator group of companies includes: • four global resources companies with significant South African presence namely BHP Billiton, Anglo American, Gold Fields and
AngloGold Ashanti; • two South African global industrials namely SAB Miller and Sappi; and • six US and European energy and chemicals integrated companies namely ExxonMobil, Chevron, ConocoPhillips, Shell, BP and Total.
The ratios within the remuneration mix are structured for different management levels within the organisation and geographic location. The relative proportion of the remuneration components of the GEC within the approved remuneration mix is set out in the following charts:
* Total guaranteed package (TGP).
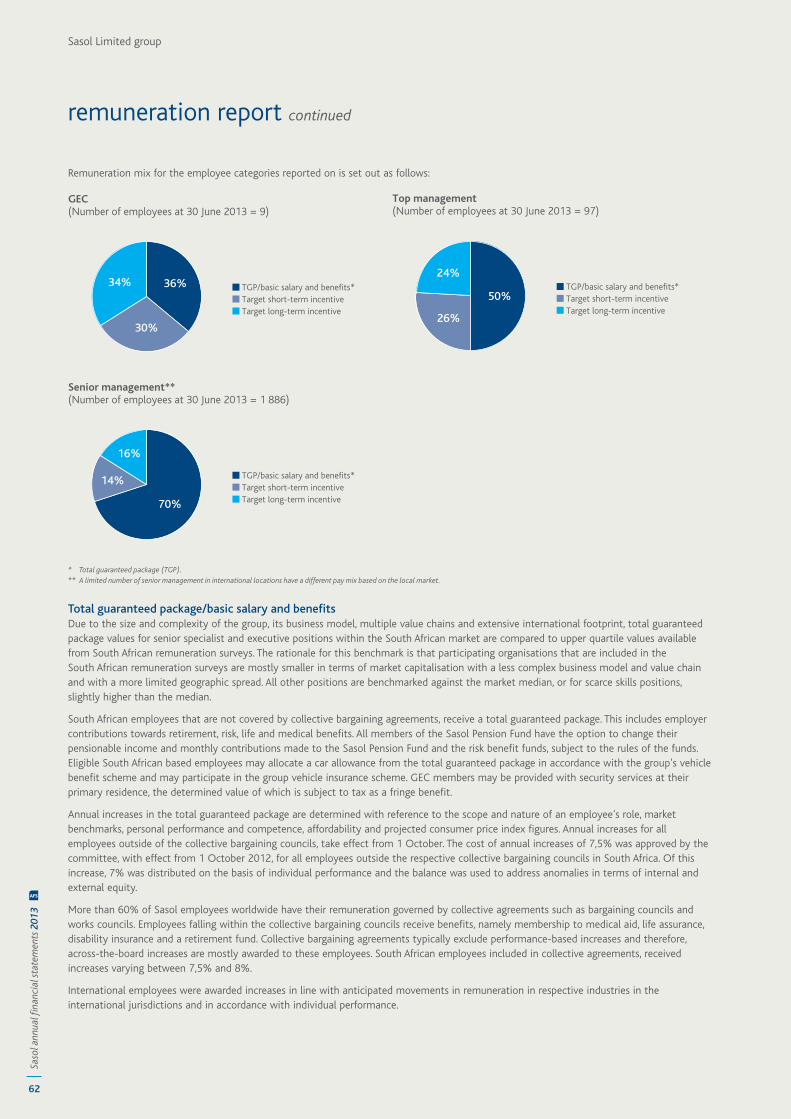
62
Saso
l ann
ual fi
nanc
ial s
tate
men
ts 2
013
AFS
Sasol Limited group
Remuneration mix for the employee categories reported on is set out as follows:
* Total guaranteed package (TGP).** A limited number of senior management in international locations have a different pay mix based on the local market.
Total guaranteed package/basic salary and benefitsDue to the size and complexity of the group, its business model, multiple value chains and extensive international footprint, total guaranteed package values for senior specialist and executive positions within the South African market are compared to upper quartile values available from South African remuneration surveys. The rationale for this benchmark is that participating organisations that are included in the South African remuneration surveys are mostly smaller in terms of market capitalisation with a less complex business model and value chain and with a more limited geographic spread. All other positions are benchmarked against the market median, or for scarce skills positions, slightly higher than the median.
South African employees that are not covered by collective bargaining agreements, receive a total guaranteed package. This includes employer contributions towards retirement, risk, life and medical benefits. All members of the Sasol Pension Fund have the option to change their pensionable income and monthly contributions made to the Sasol Pension Fund and the risk benefit funds, subject to the rules of the funds. Eligible South African based employees may allocate a car allowance from the total guaranteed package in accordance with the group’s vehicle benefit scheme and may participate in the group vehicle insurance scheme. GEC members may be provided with security services at their primary residence, the determined value of which is subject to tax as a fringe benefit.
Annual increases in the total guaranteed package are determined with reference to the scope and nature of an employee’s role, market benchmarks, personal performance and competence, affordability and projected consumer price index figures. Annual increases for all employees outside of the collective bargaining councils, take effect from 1 October. The cost of annual increases of 7,5% was approved by the committee, with effect from 1 October 2012, for all employees outside the respective collective bargaining councils in South Africa. Of this increase, 7% was distributed on the basis of individual performance and the balance was used to address anomalies in terms of internal and external equity.
More than 60% of Sasol employees worldwide have their remuneration governed by collective agreements such as bargaining councils and works councils. Employees falling within the collective bargaining councils receive benefits, namely membership to medical aid, life assurance, disability insurance and a retirement fund. Collective bargaining agreements typically exclude performance-based increases and therefore, across-the-board increases are mostly awarded to these employees. South African employees included in collective agreements, received increases varying between 7,5% and 8%.
International employees were awarded increases in line with anticipated movements in remuneration in respective industries in the international jurisdictions and in accordance with individual performance.
remuneration report continued
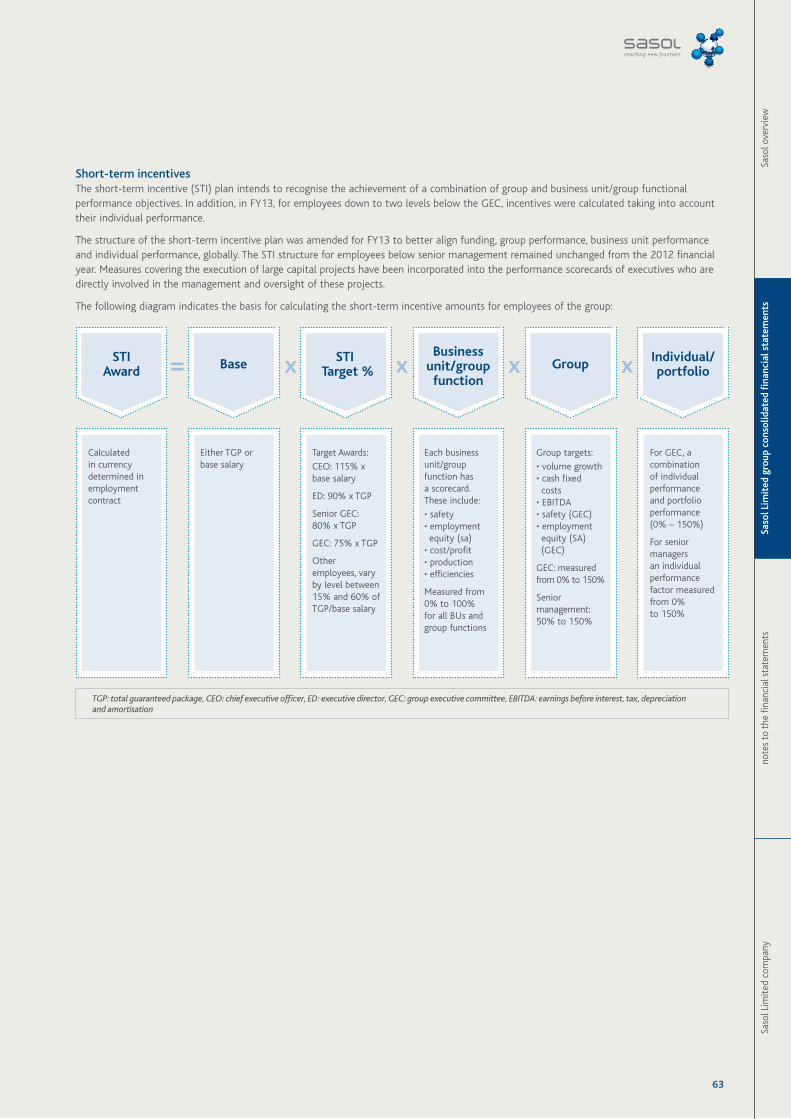
63
Saso
l Lim
ited
com
pany
note
s to
the
fina
ncia
l sta
tem
ents
Saso
l Lim
ited
gro
up c
onso
lidat
ed fi
nanc
ial s
tate
men
tsSa
sol o
verv
iew
Short-term incentivesThe short-term incentive (STI) plan intends to recognise the achievement of a combination of group and business unit/group functional performance objectives. In addition, in FY13, for employees down to two levels below the GEC, incentives were calculated taking into account their individual performance.
The structure of the short-term incentive plan was amended for FY13 to better align funding, group performance, business unit performance and individual performance, globally. The STI structure for employees below senior management remained unchanged from the 2012 financial year. Measures covering the execution of large capital projects have been incorporated into the performance scorecards of executives who are directly involved in the management and oversight of these projects.
The following diagram indicates the basis for calculating the short-term incentive amounts for employees of the group:
Calculated in currency determined in employment contract
Either TGP or base salary
Target Awards:
CEO: 115% x base salary
ED: 90% x TGP
Senior GEC: 80% x TGP
GEC: 75% x TGP
Other employees, vary by level between 15% and 60% of TGP/base salary
Each business unit/group function has a scorecard. These include:
• safety • employment equity (sa) • cost/profit • production • efficiencies
Measured from 0% to 100% for all BUs and group functions
Group targets:
• volume growth • cash fixed costs • EBITDA • safety (GEC) • employment equity (SA) (GEC)
GEC: measured from 0% to 150%
Senior management: 50% to 150%
For GEC, a combination of individual performance and portfolio performance (0% – 150%)
For senior managers an individual performance factor measured from 0% to 150%
Base STI Target %
Business unit/group
function
Individual/portfolioGroupSTI
Award =
TGP: total guaranteed package, CEO: chief executive officer, ED: executive director, GEC: group executive committee, EBITDA: earnings before interest, tax, depreciation and amortisation
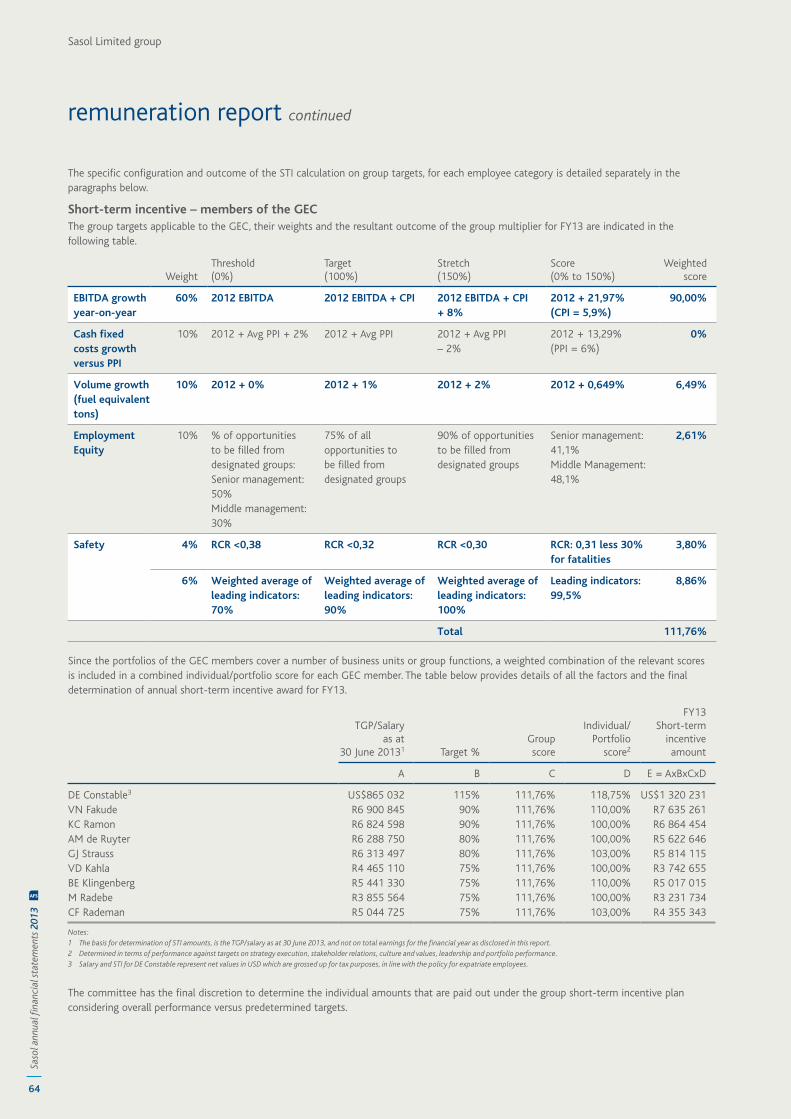
64
Saso
l ann
ual fi
nanc
ial s
tate
men
ts 2
013
AFS
Sasol Limited group
The specific configuration and outcome of the STI calculation on group targets, for each employee category is detailed separately in the paragraphs below.
Short-term incentive – members of the GECThe group targets applicable to the GEC, their weights and the resultant outcome of the group multiplier for FY13 are indicated in the following table.
WeightThreshold(0%)
Target(100%)
Stretch(150%)
Score(0% to 150%)
Weightedscore
EBITDA growth year-on-year
60% 2012 EBITDA 2012 EBITDA + CPI 2012 EBITDA + CPI + 8%
2012 + 21,97%(CPI = 5,9%)
90,00%
Cash fixed costs growth versus PPI
10% 2012 + Avg PPI + 2% 2012 + Avg PPI 2012 + Avg PPI – 2%
2012 + 13,29% (PPI = 6%)
0%
Volume growth (fuel equivalent tons)
10% 2012 + 0% 2012 + 1% 2012 + 2% 2012 + 0,649% 6,49%
Employment Equity
10% % of opportunities to be filled from designated groups: Senior management: 50% Middle management: 30%
75% of all opportunities to be filled from designated groups
90% of opportunities to be filled from designated groups
Senior management: 41,1%Middle Management: 48,1%
2,61%
Safety 4% RCR <0,38 RCR <0,32 RCR <0,30 RCR: 0,31 less 30% for fatalities
3,80%
6% Weighted average of leading indicators: 70%
Weighted average of leading indicators: 90%
Weighted average of leading indicators: 100%
Leading indicators: 99,5%
8,86%
Total 111,76%
Since the portfolios of the GEC members cover a number of business units or group functions, a weighted combination of the relevant scores is included in a combined individual/portfolio score for each GEC member. The table below provides details of all the factors and the final determination of annual short-term incentive award for FY13.
TGP/Salaryas at
30 June 20131 Target %Groupscore
Individual/Portfolio
score2
FY13Short-term
incentiveamount
A B C D E = AxBxCxD
DE Constable3 US$865 032 115% 111,76% 118,75% US$1 320 231VN Fakude R6 900 845 90% 111,76% 110,00% R7 635 261KC Ramon R6 824 598 90% 111,76% 100,00% R6 864 454AM de Ruyter R6 288 750 80% 111,76% 100,00% R5 622 646GJ Strauss R6 313 497 80% 111,76% 103,00% R5 814 115VD Kahla R4 465 110 75% 111,76% 100,00% R3 742 655BE Klingenberg R5 441 330 75% 111,76% 110,00% R5 017 015M Radebe R3 855 564 75% 111,76% 100,00% R3 231 734CF Rademan R5 044 725 75% 111,76% 103,00% R4 355 343
Notes:1 The basis for determination of STI amounts, is the TGP/salary as at 30 June 2013, and not on total earnings for the financial year as disclosed in this report.2 Determined in terms of performance against targets on strategy execution, stakeholder relations, culture and values, leadership and portfolio performance.3 Salary and STI for DE Constable represent net values in USD which are grossed up for tax purposes, in line with the policy for expatriate employees.
The committee has the final discretion to determine the individual amounts that are paid out under the group short-term incentive plan considering overall performance versus predetermined targets.
remuneration report continued
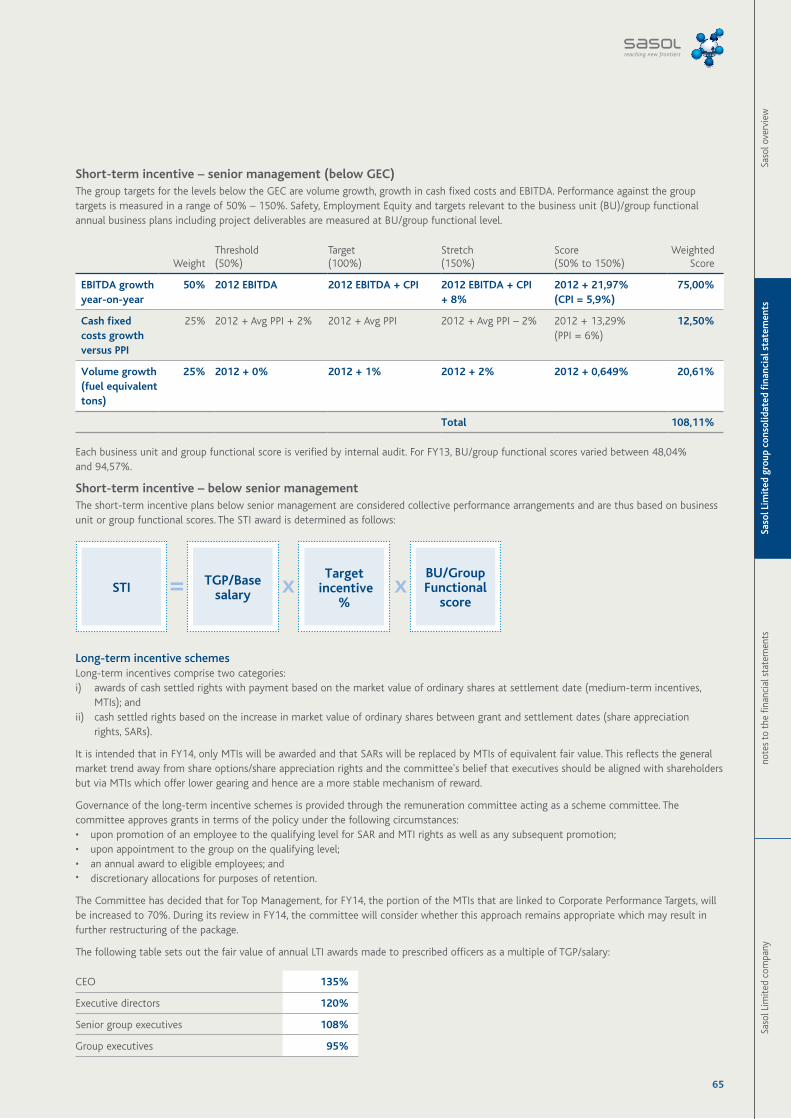
65
Saso
l Lim
ited
com
pany
note
s to
the
fina
ncia
l sta
tem
ents
Saso
l Lim
ited
gro
up c
onso
lidat
ed fi
nanc
ial s
tate
men
tsSa
sol o
verv
iew
Short-term incentive – senior management (below GEC)The group targets for the levels below the GEC are volume growth, growth in cash fixed costs and EBITDA. Performance against the group targets is measured in a range of 50% – 150%. Safety, Employment Equity and targets relevant to the business unit (BU)/group functional annual business plans including project deliverables are measured at BU/group functional level.
WeightThreshold(50%)
Target(100%)
Stretch(150%)
Score(50% to 150%)
WeightedScore
EBITDA growth year-on-year
50% 2012 EBITDA 2012 EBITDA + CPI 2012 EBITDA + CPI + 8%
2012 + 21,97%(CPI = 5,9%)
75,00%
Cash fixed costs growth versus PPI
25% 2012 + Avg PPI + 2% 2012 + Avg PPI 2012 + Avg PPI – 2% 2012 + 13,29%(PPI = 6%)
12,50%
Volume growth (fuel equivalent tons)
25% 2012 + 0% 2012 + 1% 2012 + 2% 2012 + 0,649% 20,61%
Total 108,11%
Each business unit and group functional score is verified by internal audit. For FY13, BU/group functional scores varied between 48,04% and 94,57%.
Short-term incentive – below senior managementThe short-term incentive plans below senior management are considered collective performance arrangements and are thus based on business unit or group functional scores. The STI award is determined as follows:
STI TGP/Base salary
Target incentive
%
BU/Group Functional
score=
Long-term incentive schemesLong-term incentives comprise two categories:i) awards of cash settled rights with payment based on the market value of ordinary shares at settlement date (medium-term incentives,
MTIs); andii) cash settled rights based on the increase in market value of ordinary shares between grant and settlement dates (share appreciation
rights, SARs).
It is intended that in FY14, only MTIs will be awarded and that SARs will be replaced by MTIs of equivalent fair value. This reflects the general market trend away from share options/share appreciation rights and the committee's belief that executives should be aligned with shareholders but via MTIs which offer lower gearing and hence are a more stable mechanism of reward.
Governance of the long-term incentive schemes is provided through the remuneration committee acting as a scheme committee. The committee approves grants in terms of the policy under the following circumstances: • upon promotion of an employee to the qualifying level for SAR and MTI rights as well as any subsequent promotion; • upon appointment to the group on the qualifying level; • an annual award to eligible employees; and • discretionary allocations for purposes of retention.
The Committee has decided that for Top Management, for FY14, the portion of the MTIs that are linked to Corporate Performance Targets, will be increased to 70%. During its review in FY14, the committee will consider whether this approach remains appropriate which may result in further restructuring of the package.
The following table sets out the fair value of annual LTI awards made to prescribed officers as a multiple of TGP/salary:
CEO 135%
Executive directors 120%
Senior group executives 108%
Group executives 95%
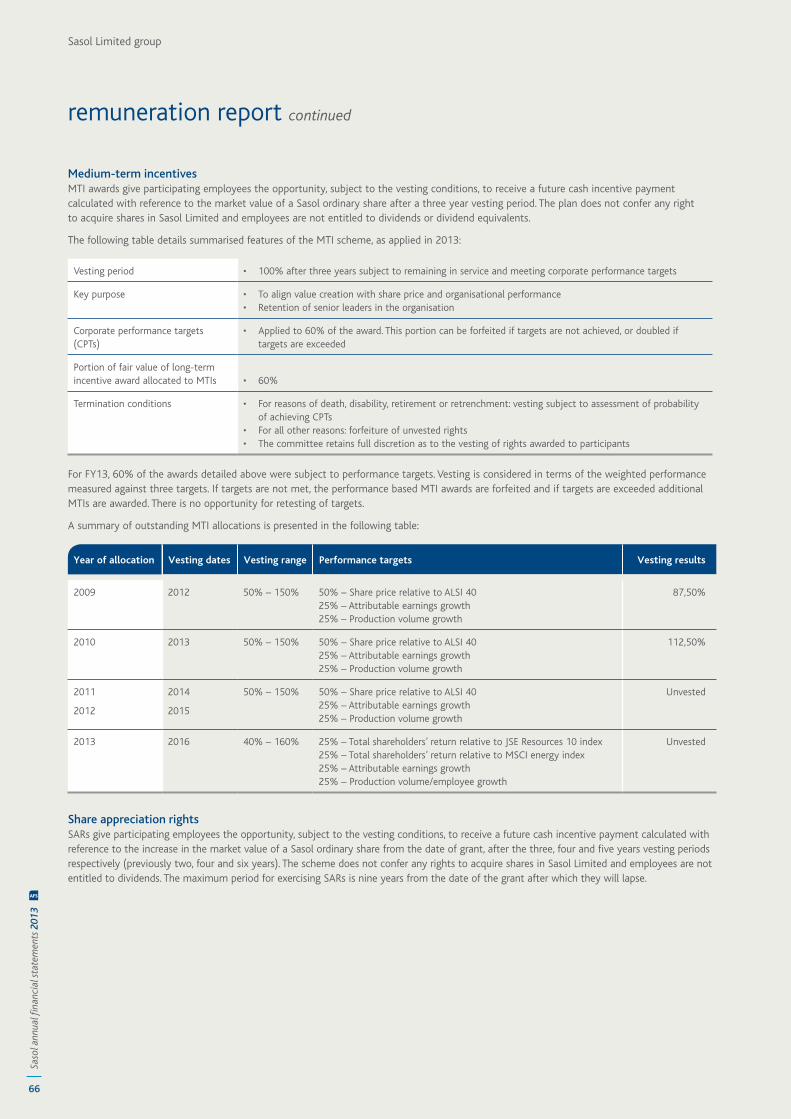
66
Saso
l ann
ual fi
nanc
ial s
tate
men
ts 2
013
AFS
Sasol Limited group
Medium-term incentivesMTI awards give participating employees the opportunity, subject to the vesting conditions, to receive a future cash incentive payment calculated with reference to the market value of a Sasol ordinary share after a three year vesting period. The plan does not confer any right to acquire shares in Sasol Limited and employees are not entitled to dividends or dividend equivalents.
The following table details summarised features of the MTI scheme, as applied in 2013:
Vesting period • 100% after three years subject to remaining in service and meeting corporate performance targets
Key purpose • To align value creation with share price and organisational performance • Retention of senior leaders in the organisation
Corporate performance targets (CPTs)
• Applied to 60% of the award. This portion can be forfeited if targets are not achieved, or doubled if targets are exceeded
Portion of fair value of long-term incentive award allocated to MTIs • 60%
Termination conditions • For reasons of death, disability, retirement or retrenchment: vesting subject to assessment of probability of achieving CPTs
• For all other reasons: forfeiture of unvested rights • The committee retains full discretion as to the vesting of rights awarded to participants
For FY13, 60% of the awards detailed above were subject to performance targets. Vesting is considered in terms of the weighted performance measured against three targets. If targets are not met, the performance based MTI awards are forfeited and if targets are exceeded additional MTIs are awarded. There is no opportunity for retesting of targets.
A summary of outstanding MTI allocations is presented in the following table:
Year of allocation Vesting dates Vesting range Performance targets Vesting results
2009 2012 50% – 150% 50% – Share price relative to ALSI 4025% – Attributable earnings growth25% – Production volume growth
87,50%
2010 2013 50% – 150% 50% – Share price relative to ALSI 4025% – Attributable earnings growth25% – Production volume growth
112,50%
2011
2012
2014
2015
50% – 150% 50% – Share price relative to ALSI 4025% – Attributable earnings growth25% – Production volume growth
Unvested
2013 2016 40% – 160% 25% – Total shareholders’ return relative to JSE Resources 10 index25% – Total shareholders’ return relative to MSCI energy index25% – Attributable earnings growth25% – Production volume/employee growth
Unvested
Share appreciation rightsSARs give participating employees the opportunity, subject to the vesting conditions, to receive a future cash incentive payment calculated with reference to the increase in the market value of a Sasol ordinary share from the date of grant, after the three, four and five years vesting periods respectively (previously two, four and six years). The scheme does not confer any rights to acquire shares in Sasol Limited and employees are not entitled to dividends. The maximum period for exercising SARs is nine years from the date of the grant after which they will lapse.
remuneration report continued
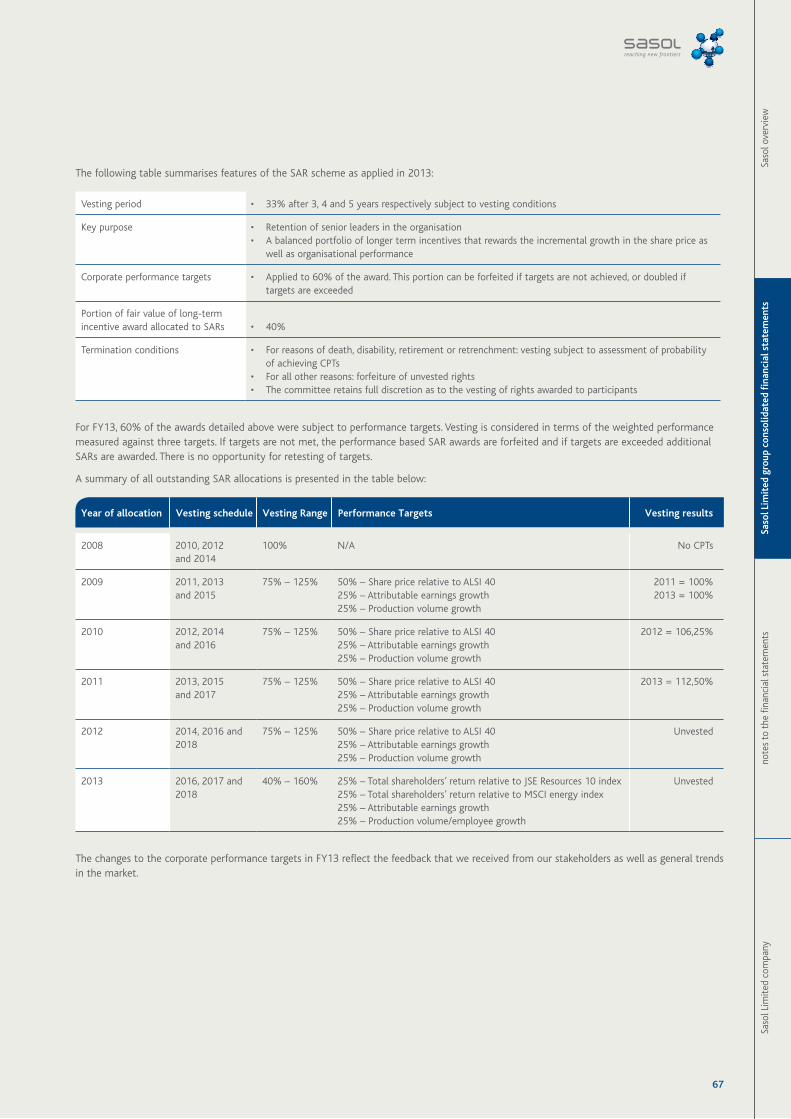
67
Saso
l Lim
ited
com
pany
note
s to
the
fina
ncia
l sta
tem
ents
Saso
l Lim
ited
gro
up c
onso
lidat
ed fi
nanc
ial s
tate
men
tsSa
sol o
verv
iew
The following table summarises features of the SAR scheme as applied in 2013:
Vesting period • 33% after 3, 4 and 5 years respectively subject to vesting conditions
Key purpose • Retention of senior leaders in the organisation • A balanced portfolio of longer term incentives that rewards the incremental growth in the share price as
well as organisational performance
Corporate performance targets • Applied to 60% of the award. This portion can be forfeited if targets are not achieved, or doubled if targets are exceeded
Portion of fair value of long-term incentive award allocated to SARs • 40%
Termination conditions • For reasons of death, disability, retirement or retrenchment: vesting subject to assessment of probability of achieving CPTs
• For all other reasons: forfeiture of unvested rights • The committee retains full discretion as to the vesting of rights awarded to participants
For FY13, 60% of the awards detailed above were subject to performance targets. Vesting is considered in terms of the weighted performance measured against three targets. If targets are not met, the performance based SAR awards are forfeited and if targets are exceeded additional SARs are awarded. There is no opportunity for retesting of targets.
A summary of all outstanding SAR allocations is presented in the table below:
Year of allocation Vesting schedule Vesting Range Performance Targets Vesting results
2008 2010, 2012 and 2014
100% N/A No CPTs
2009 2011, 2013 and 2015
75% – 125% 50% – Share price relative to ALSI 4025% – Attributable earnings growth25% – Production volume growth
2011 = 100%2013 = 100%
2010 2012, 2014 and 2016
75% – 125% 50% – Share price relative to ALSI 4025% – Attributable earnings growth25% – Production volume growth
2012 = 106,25%
2011 2013, 2015 and 2017
75% – 125% 50% – Share price relative to ALSI 4025% – Attributable earnings growth25% – Production volume growth
2013 = 112,50%
2012 2014, 2016 and 2018
75% – 125% 50% – Share price relative to ALSI 4025% – Attributable earnings growth25% – Production volume growth
Unvested
2013 2016, 2017 and 2018
40% – 160% 25% – Total shareholders’ return relative to JSE Resources 10 index25% – Total shareholders’ return relative to MSCI energy index25% – Attributable earnings growth25% – Production volume/employee growth
Unvested
The changes to the corporate performance targets in FY13 reflect the feedback that we received from our stakeholders as well as general trends in the market.
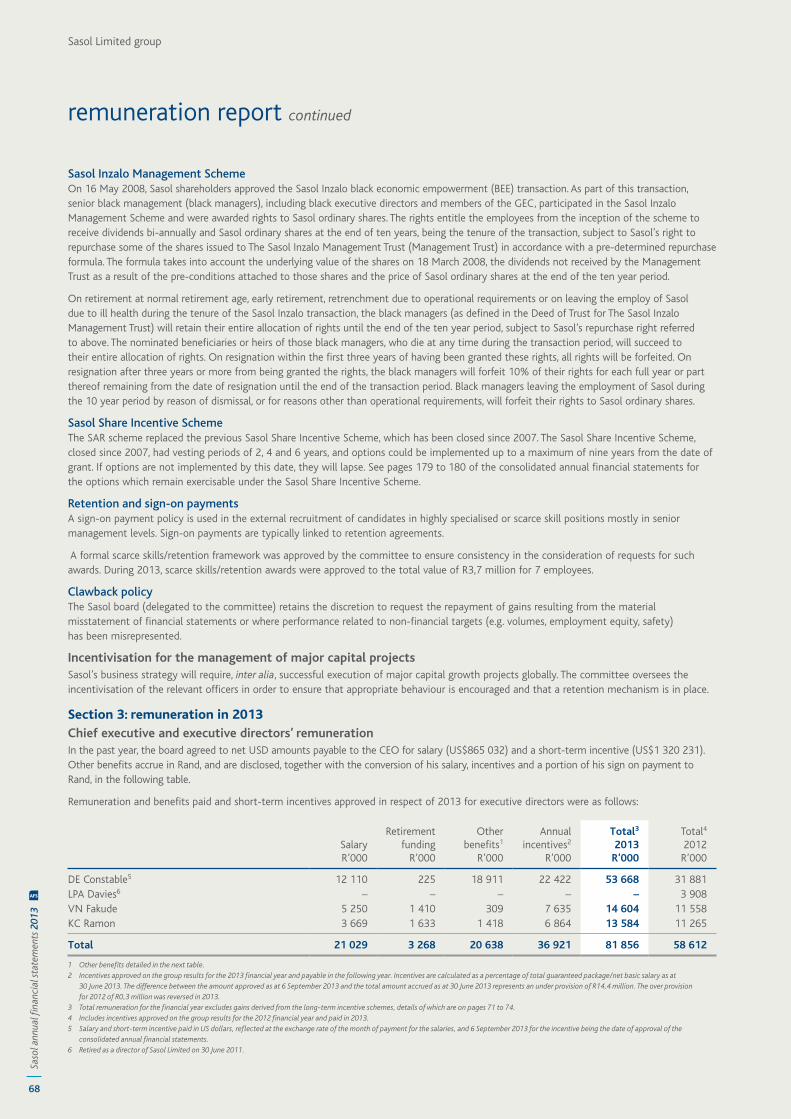
68
Saso
l ann
ual fi
nanc
ial s
tate
men
ts 2
013
AFS
Sasol Limited group
Sasol Inzalo Management SchemeOn 16 May 2008, Sasol shareholders approved the Sasol Inzalo black economic empowerment (BEE) transaction. As part of this transaction, senior black management (black managers), including black executive directors and members of the GEC, participated in the Sasol Inzalo Management Scheme and were awarded rights to Sasol ordinary shares. The rights entitle the employees from the inception of the scheme to receive dividends bi-annually and Sasol ordinary shares at the end of ten years, being the tenure of the transaction, subject to Sasol’s right to repurchase some of the shares issued to The Sasol Inzalo Management Trust (Management Trust) in accordance with a pre-determined repurchase formula. The formula takes into account the underlying value of the shares on 18 March 2008, the dividends not received by the Management Trust as a result of the pre-conditions attached to those shares and the price of Sasol ordinary shares at the end of the ten year period.
On retirement at normal retirement age, early retirement, retrenchment due to operational requirements or on leaving the employ of Sasol due to ill health during the tenure of the Sasol Inzalo transaction, the black managers (as defined in the Deed of Trust for The Sasol Inzalo Management Trust) will retain their entire allocation of rights until the end of the ten year period, subject to Sasol’s repurchase right referred to above. The nominated beneficiaries or heirs of those black managers, who die at any time during the transaction period, will succeed to their entire allocation of rights. On resignation within the first three years of having been granted these rights, all rights will be forfeited. On resignation after three years or more from being granted the rights, the black managers will forfeit 10% of their rights for each full year or part thereof remaining from the date of resignation until the end of the transaction period. Black managers leaving the employment of Sasol during the 10 year period by reason of dismissal, or for reasons other than operational requirements, will forfeit their rights to Sasol ordinary shares.
Sasol Share Incentive SchemeThe SAR scheme replaced the previous Sasol Share Incentive Scheme, which has been closed since 2007. The Sasol Share Incentive Scheme, closed since 2007, had vesting periods of 2, 4 and 6 years, and options could be implemented up to a maximum of nine years from the date of grant. If options are not implemented by this date, they will lapse. See pages 179 to 180 of the consolidated annual financial statements for the options which remain exercisable under the Sasol Share Incentive Scheme.
Retention and sign-on paymentsA sign-on payment policy is used in the external recruitment of candidates in highly specialised or scarce skill positions mostly in senior management levels. Sign-on payments are typically linked to retention agreements.
A formal scarce skills/retention framework was approved by the committee to ensure consistency in the consideration of requests for such awards. During 2013, scarce skills/retention awards were approved to the total value of R3,7 million for 7 employees.
Clawback policyThe Sasol board (delegated to the committee) retains the discretion to request the repayment of gains resulting from the material misstatement of financial statements or where performance related to non-financial targets (e.g. volumes, employment equity, safety) has been misrepresented.
Incentivisation for the management of major capital projectsSasol’s business strategy will require, inter alia, successful execution of major capital growth projects globally. The committee oversees the incentivisation of the relevant officers in order to ensure that appropriate behaviour is encouraged and that a retention mechanism is in place.
Section 3: remuneration in 2013Chief executive and executive directors’ remunerationIn the past year, the board agreed to net USD amounts payable to the CEO for salary (US$865 032) and a short-term incentive (US$1 320 231). Other benefits accrue in Rand, and are disclosed, together with the conversion of his salary, incentives and a portion of his sign on payment to Rand, in the following table.
Remuneration and benefits paid and short-term incentives approved in respect of 2013 for executive directors were as follows:
SalaryR’000
Retirement funding
R’000
Otherbenefits1
R’000
Annual incentives2
R’000
Total3
2013R’000
Total4
2012R’000
DE Constable5 12 110 225 18 911 22 422 53 668 31 881LPA Davies6 – – – – – 3 908VN Fakude 5 250 1 410 309 7 635 14 604 11 558KC Ramon 3 669 1 633 1 418 6 864 13 584 11 265
Total 21 029 3 268 20 638 36 921 81 856 58 612
1 Other benefits detailed in the next table. 2 Incentives approved on the group results for the 2013 financial year and payable in the following year. Incentives are calculated as a percentage of total guaranteed package/net basic salary as at
30 June 2013. The difference between the amount approved as at 6 September 2013 and the total amount accrued as at 30 June 2013 represents an under provision of R14,4 million. The over provision for 2012 of R0,3 million was reversed in 2013.
3 Total remuneration for the financial year excludes gains derived from the long-term incentive schemes, details of which are on pages 71 to 74. 4 Includes incentives approved on the group results for the 2012 financial year and paid in 2013.5 Salary and short-term incentive paid in US dollars, reflected at the exchange rate of the month of payment for the salaries, and 6 September 2013 for the incentive being the date of approval of the
consolidated annual financial statements. 6 Retired as a director of Sasol Limited on 30 June 2011.
remuneration report continued
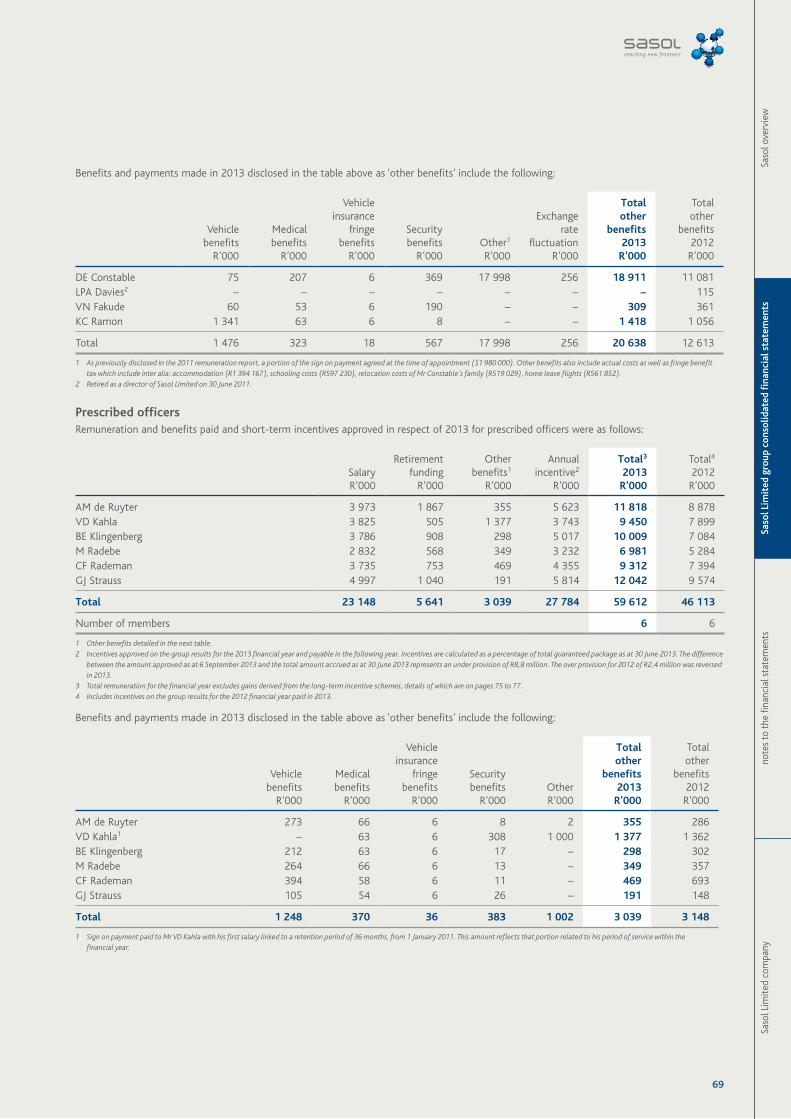
69
Saso
l Lim
ited
com
pany
note
s to
the
fina
ncia
l sta
tem
ents
Saso
l Lim
ited
gro
up c
onso
lidat
ed fi
nanc
ial s
tate
men
tsSa
sol o
verv
iew
Benefits and payments made in 2013 disclosed in the table above as ‘other benefits’ include the following:
Vehiclebenefits
R’000
Medicalbenefits
R’000
Vehicleinsurance
fringebenefits
R’000
Securitybenefits
R’000 Other1
R’000
Exchangerate
fluctuationR’000
Totalother
benefits2013
R’000
Totalother
benefits2012
R’000
DE Constable 75 207 6 369 17 998 256 18 911 11 081LPA Davies2 – – – – – – – 115VN Fakude 60 53 6 190 – – 309 361KC Ramon 1 341 63 6 8 – – 1 418 1 056
Total 1 476 323 18 567 17 998 256 20 638 12 613
1 As previously disclosed in the 2011 remuneration report, a portion of the sign on payment agreed at the time of appointment ($1 980 000). Other benefits also include actual costs as well as fringe benefit tax which include inter alia: accommodation (R1 394 167), schooling costs (R597 230), relocation costs of Mr Constable’s family (R519 029), home leave flights (R561 852).
2 Retired as a director of Sasol Limited on 30 June 2011.
Prescribed officersRemuneration and benefits paid and short-term incentives approved in respect of 2013 for prescribed officers were as follows:
SalaryR’000
Retirement funding
R’000
Otherbenefits1
R’000
Annual incentive2
R’000
Total3
2013R’000
Total4
2012R’000
AM de Ruyter 3 973 1 867 355 5 623 11 818 8 878 VD Kahla 3 825 505 1 377 3 743 9 450 7 899 BE Klingenberg 3 786 908 298 5 017 10 009 7 084 M Radebe 2 832 568 349 3 232 6 981 5 284 CF Rademan 3 735 753 469 4 355 9 312 7 394 GJ Strauss 4 997 1 040 191 5 814 12 042 9 574
Total 23 148 5 641 3 039 27 784 59 612 46 113
Number of members 6 6
1 Other benefits detailed in the next table. 2 Incentives approved on the group results for the 2013 financial year and payable in the following year. Incentives are calculated as a percentage of total guaranteed package as at 30 June 2013. The difference
between the amount approved as at 6 September 2013 and the total amount accrued as at 30 June 2013 represents an under provision of R8,8 million. The over provision for 2012 of R2,4 million was reversed in 2013.
3 Total remuneration for the financial year excludes gains derived from the long-term incentive schemes, details of which are on pages 75 to 77.4 Includes incentives on the group results for the 2012 financial year paid in 2013.
Benefits and payments made in 2013 disclosed in the table above as ‘other benefits’ include the following:
Vehicle benefits
R’000
Medical benefits
R’000
Vehicle insurance
fringebenefits
R’000
Security benefits
R’000 OtherR’000
Totalother
benefits2013
R’000
Totalother
benefits2012
R’000
AM de Ruyter 273 66 6 8 2 355 286VD Kahla1 – 63 6 308 1 000 1 377 1 362BE Klingenberg 212 63 6 17 – 298 302M Radebe 264 66 6 13 – 349 357CF Rademan 394 58 6 11 – 469 693GJ Strauss 105 54 6 26 – 191 148
Total 1 248 370 36 383 1 002 3 039 3 148
1 Sign on payment paid to Mr VD Kahla with his first salary linked to a retention period of 36 months, from 1 January 2011. This amount reflects that portion related to his period of service within the financial year.
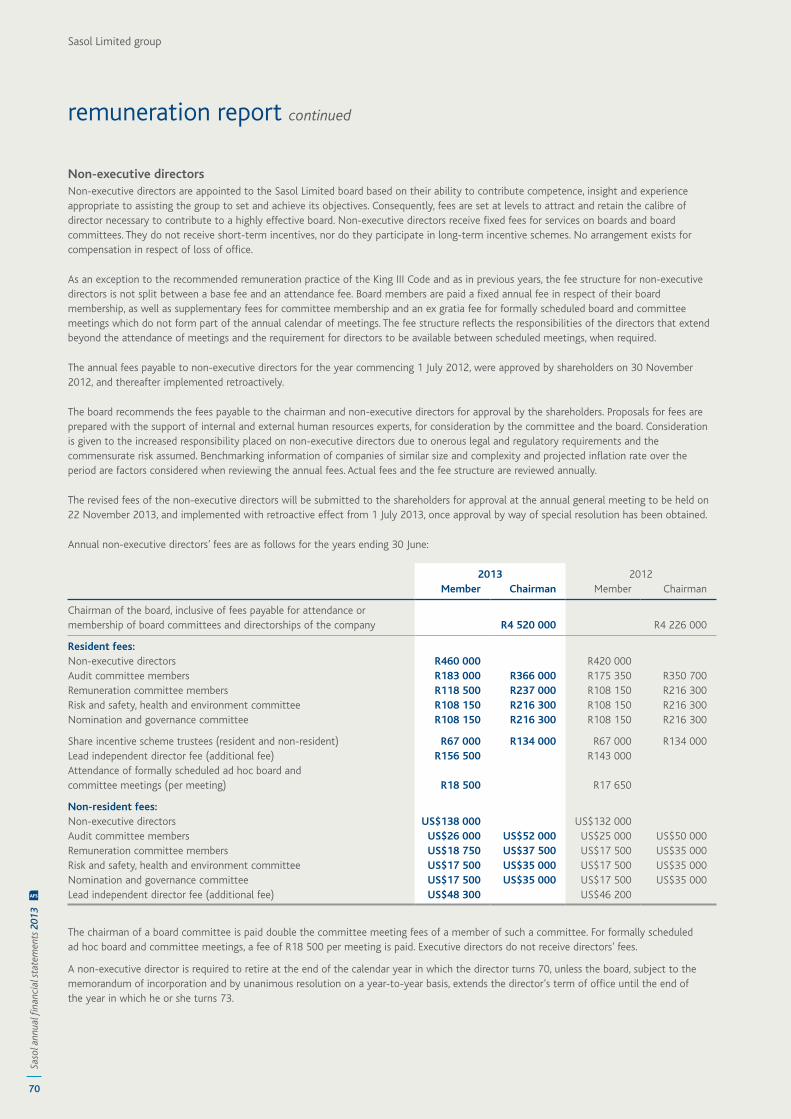
70
Saso
l ann
ual fi
nanc
ial s
tate
men
ts 2
013
AFS
Sasol Limited group
Non-executive directorsNon-executive directors are appointed to the Sasol Limited board based on their ability to contribute competence, insight and experience appropriate to assisting the group to set and achieve its objectives. Consequently, fees are set at levels to attract and retain the calibre of director necessary to contribute to a highly effective board. Non-executive directors receive fixed fees for services on boards and board committees. They do not receive short-term incentives, nor do they participate in long-term incentive schemes. No arrangement exists for compensation in respect of loss of office.
As an exception to the recommended remuneration practice of the King III Code and as in previous years, the fee structure for non-executive directors is not split between a base fee and an attendance fee. Board members are paid a fixed annual fee in respect of their board membership, as well as supplementary fees for committee membership and an ex gratia fee for formally scheduled board and committee meetings which do not form part of the annual calendar of meetings. The fee structure reflects the responsibilities of the directors that extend beyond the attendance of meetings and the requirement for directors to be available between scheduled meetings, when required.
The annual fees payable to non-executive directors for the year commencing 1 July 2012, were approved by shareholders on 30 November 2012, and thereafter implemented retroactively.
The board recommends the fees payable to the chairman and non-executive directors for approval by the shareholders. Proposals for fees are prepared with the support of internal and external human resources experts, for consideration by the committee and the board. Consideration is given to the increased responsibility placed on non-executive directors due to onerous legal and regulatory requirements and the commensurate risk assumed. Benchmarking information of companies of similar size and complexity and projected inflation rate over the period are factors considered when reviewing the annual fees. Actual fees and the fee structure are reviewed annually.
The revised fees of the non-executive directors will be submitted to the shareholders for approval at the annual general meeting to be held on 22 November 2013, and implemented with retroactive effect from 1 July 2013, once approval by way of special resolution has been obtained.
Annual non-executive directors’ fees are as follows for the years ending 30 June:
2013 2012Member Chairman Member Chairman
Chairman of the board, inclusive of fees payable for attendance or membership of board committees and directorships of the company R4 520 000 R4 226 000
Resident fees:Non-executive directors R460 000 R420 000Audit committee members R183 000 R366 000 R175 350 R350 700Remuneration committee members R118 500 R237 000 R108 150 R216 300Risk and safety, health and environment committee R108 150 R216 300 R108 150 R216 300Nomination and governance committee R108 150 R216 300 R108 150 R216 300
Share incentive scheme trustees (resident and non-resident) R67 000 R134 000 R67 000 R134 000Lead independent director fee (additional fee) R156 500 R143 000Attendance of formally scheduled ad hoc board and committee meetings (per meeting) R18 500 R17 650
Non-resident fees:Non-executive directors US$138 000 US$132 000Audit committee members US$26 000 US$52 000 US$25 000 US$50 000Remuneration committee members US$18 750 US$37 500 US$17 500 US$35 000Risk and safety, health and environment committee US$17 500 US$35 000 US$17 500 US$35 000Nomination and governance committee US$17 500 US$35 000 US$17 500 US$35 000Lead independent director fee (additional fee) US$48 300 US$46 200
The chairman of a board committee is paid double the committee meeting fees of a member of such a committee. For formally scheduled ad hoc board and committee meetings, a fee of R18 500 per meeting is paid. Executive directors do not receive directors’ fees.
A non-executive director is required to retire at the end of the calendar year in which the director turns 70, unless the board, subject to the memorandum of incorporation and by unanimous resolution on a year-to-year basis, extends the director’s term of office until the end of the year in which he or she turns 73.
remuneration report continued
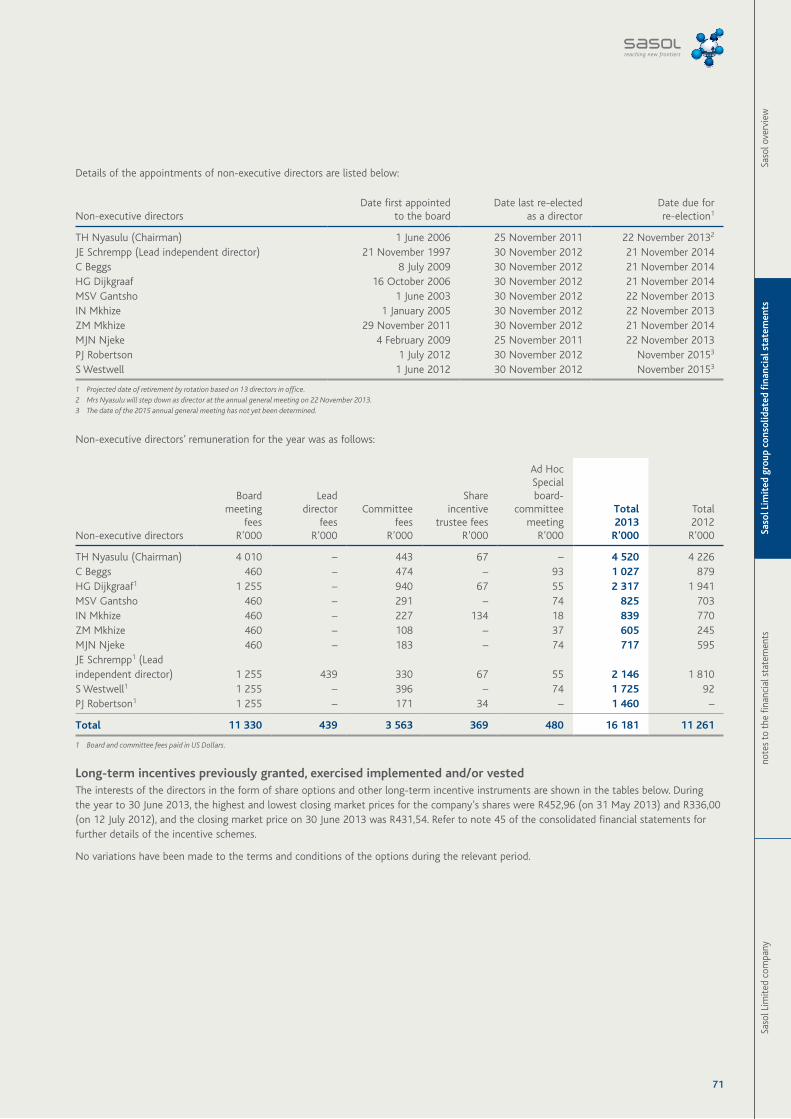
71
Saso
l Lim
ited
com
pany
note
s to
the
fina
ncia
l sta
tem
ents
Saso
l Lim
ited
gro
up c
onso
lidat
ed fi
nanc
ial s
tate
men
tsSa
sol o
verv
iew
Details of the appointments of non-executive directors are listed below:
Non-executive directorsDate first appointed
to the boardDate last re-elected
as a directorDate due forre-election1
TH Nyasulu (Chairman) 1 June 2006 25 November 2011 22 November 20132
JE Schrempp (Lead independent director) 21 November 1997 30 November 2012 21 November 2014 C Beggs 8 July 2009 30 November 2012 21 November 2014HG Dijkgraaf 16 October 2006 30 November 2012 21 November 2014 MSV Gantsho 1 June 2003 30 November 2012 22 November 2013IN Mkhize 1 January 2005 30 November 2012 22 November 2013 ZM Mkhize 29 November 2011 30 November 2012 21 November 2014 MJN Njeke 4 February 2009 25 November 2011 22 November 2013PJ Robertson 1 July 2012 30 November 2012 November 20153 S Westwell 1 June 2012 30 November 2012 November 20153
1 Projected date of retirement by rotation based on 13 directors in office.2 Mrs Nyasulu will step down as director at the annual general meeting on 22 November 2013.3 The date of the 2015 annual general meeting has not yet been determined.
Non-executive directors’ remuneration for the year was as follows:
Non-executive directors
Boardmeeting
feesR’000
Leaddirector
feesR’000
Committeefees
R’000
Shareincentive
trustee feesR’000
Ad HocSpecialboard-
committeemeeting
R’000
Total2013
R’000
Total2012
R’000
TH Nyasulu (Chairman) 4 010 – 443 67 – 4 520 4 226C Beggs 460 – 474 – 93 1 027 879HG Dijkgraaf1 1 255 – 940 67 55 2 317 1 941MSV Gantsho 460 – 291 – 74 825 703IN Mkhize 460 – 227 134 18 839 770ZM Mkhize 460 – 108 – 37 605 245MJN Njeke 460 – 183 – 74 717 595JE Schrempp1 (Lead independent director) 1 255 439 330 67 55 2 146 1 810S Westwell1 1 255 – 396 – 74 1 725 92PJ Robertson1 1 255 – 171 34 – 1 460 –
Total 11 330 439 3 563 369 480 16 181 11 261
1 Board and committee fees paid in US Dollars.
Long-term incentives previously granted, exercised implemented and/or vestedThe interests of the directors in the form of share options and other long-term incentive instruments are shown in the tables below. During the year to 30 June 2013, the highest and lowest closing market prices for the company’s shares were R452,96 (on 31 May 2013) and R336,00 (on 12 July 2012), and the closing market price on 30 June 2013 was R431,54. Refer to note 45 of the consolidated financial statements for further details of the incentive schemes.
No variations have been made to the terms and conditions of the options during the relevant period.
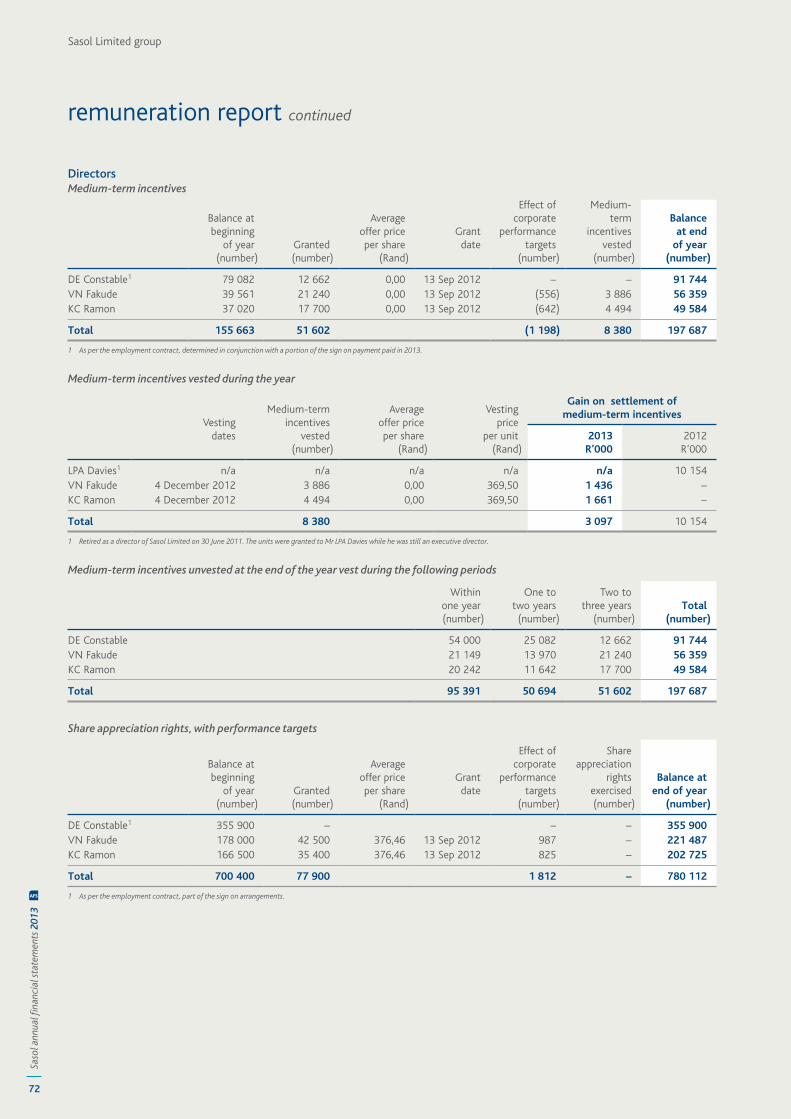
72
Saso
l ann
ual fi
nanc
ial s
tate
men
ts 2
013
AFS
Sasol Limited group
DirectorsMedium-term incentives
Balance atbeginning
of year(number)
Granted(number)
Averageoffer priceper share
(Rand)
Grantdate
Effect ofcorporate
performancetargets
(number)
Medium-term
incentivesvested
(number)
Balanceat end
of year(number)
DE Constable1 79 082 12 662 0,00 13 Sep 2012 – – 91 744 VN Fakude 39 561 21 240 0,00 13 Sep 2012 (556) 3 886 56 359KC Ramon 37 020 17 700 0,00 13 Sep 2012 (642) 4 494 49 584
Total 155 663 51 602 (1 198) 8 380 197 687
1 As per the employment contract, determined in conjunction with a portion of the sign on payment paid in 2013.
Medium-term incentives vested during the year
Vestingdates
Medium-term incentives
vested(number)
Averageoffer priceper share
(Rand)
Vestingprice
per unit(Rand)
Gain on settlement ofmedium-term incentives
2013R’000
2012R’000
LPA Davies1 n/a n/a n/a n/a n/a 10 154VN Fakude 4 December 2012 3 886 0,00 369,50 1 436 –KC Ramon 4 December 2012 4 494 0,00 369,50 1 661 –
Total 8 380 3 097 10 154
1 Retired as a director of Sasol Limited on 30 June 2011. The units were granted to Mr LPA Davies while he was still an executive director.
Medium-term incentives unvested at the end of the year vest during the following periods
Withinone year(number)
One totwo years
(number)
Two tothree years
(number)Total
(number)
DE Constable 54 000 25 082 12 662 91 744 VN Fakude 21 149 13 970 21 240 56 359 KC Ramon 20 242 11 642 17 700 49 584
Total 95 391 50 694 51 602 197 687
Share appreciation rights, with performance targets
Balance at beginning
of year(number)
Granted(number)
Averageoffer priceper share
(Rand)
Grantdate
Effect of corporate
performancetargets
(number)
Shareappreciation
rightsexercised(number)
Balance atend of year
(number)
DE Constable1 355 900 – – – 355 900VN Fakude 178 000 42 500 376,46 13 Sep 2012 987 – 221 487KC Ramon 166 500 35 400 376,46 13 Sep 2012 825 – 202 725
Total 700 400 77 900 1 812 – 780 112
1 As per the employment contract, part of the sign on arrangements.
remuneration report continued
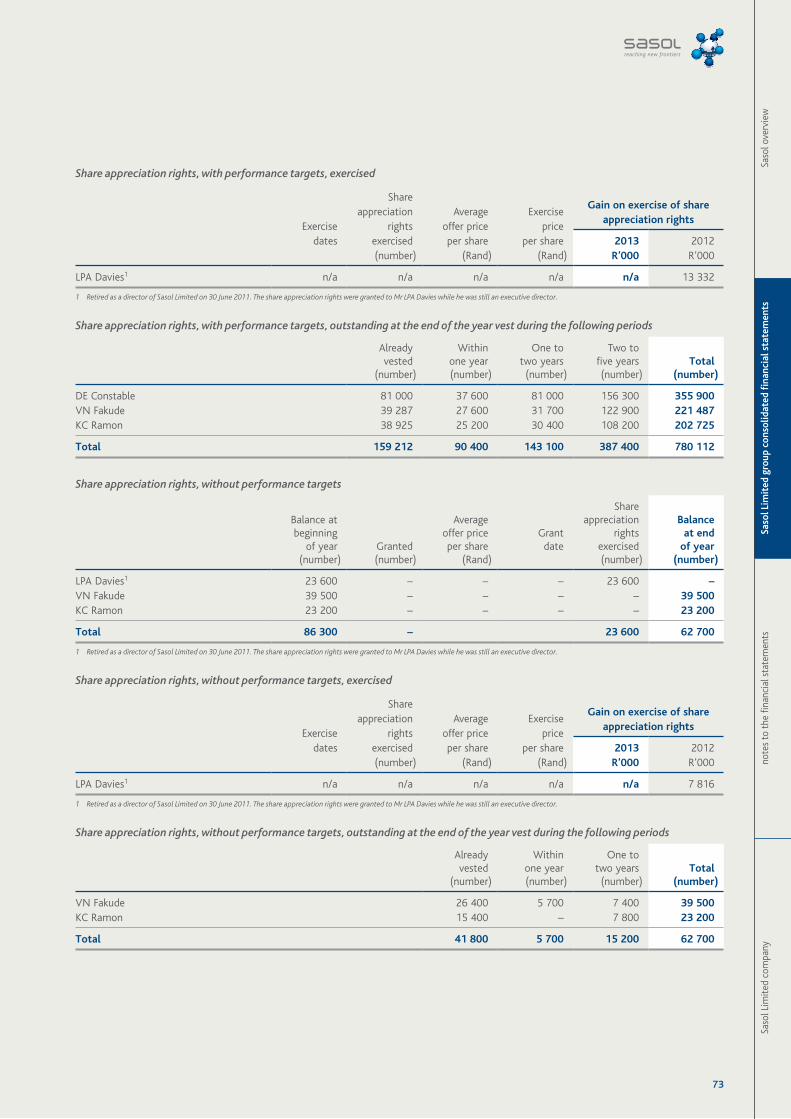
73
Saso
l Lim
ited
com
pany
note
s to
the
fina
ncia
l sta
tem
ents
Saso
l Lim
ited
gro
up c
onso
lidat
ed fi
nanc
ial s
tate
men
tsSa
sol o
verv
iew
Share appreciation rights, with performance targets, exercised
Exercisedates
Shareappreciation
rightsexercised(number)
Averageoffer priceper share
(Rand)
Exerciseprice
per share(Rand)
Gain on exercise of share appreciation rights
2013R’000
2012R’000
LPA Davies1 n/a n/a n/a n/a n/a 13 332
1 Retired as a director of Sasol Limited on 30 June 2011. The share appreciation rights were granted to Mr LPA Davies while he was still an executive director.
Share appreciation rights, with performance targets, outstanding at the end of the year vest during the following periods
Alreadyvested
(number)
Withinone year(number)
One totwo years
(number)
Two tofive years(number)
Total(number)
DE Constable 81 000 37 600 81 000 156 300 355 900 VN Fakude 39 287 27 600 31 700 122 900 221 487 KC Ramon 38 925 25 200 30 400 108 200 202 725
Total 159 212 90 400 143 100 387 400 780 112
Share appreciation rights, without performance targets
Balance atbeginning
of year(number)
Granted(number)
Averageoffer priceper share
(Rand)
Grantdate
Shareappreciation
rightsexercised(number)
Balanceat end
of year(number)
LPA Davies1 23 600 – – – 23 600 –VN Fakude 39 500 – – – – 39 500 KC Ramon 23 200 – – – – 23 200
Total 86 300 – 23 600 62 700
1 Retired as a director of Sasol Limited on 30 June 2011. The share appreciation rights were granted to Mr LPA Davies while he was still an executive director.
Share appreciation rights, without performance targets, exercised
Exercisedates
Shareappreciation
rightsexercised(number)
Averageoffer priceper share
(Rand)
Exerciseprice
per share(Rand)
Gain on exercise of share appreciation rights
2013R’000
2012R’000
LPA Davies1 n/a n/a n/a n/a n/a 7 816
1 Retired as a director of Sasol Limited on 30 June 2011. The share appreciation rights were granted to Mr LPA Davies while he was still an executive director.
Share appreciation rights, without performance targets, outstanding at the end of the year vest during the following periods
Alreadyvested
(number)
Withinone year(number)
One totwo years
(number)Total
(number)
VN Fakude 26 400 5 700 7 400 39 500 KC Ramon 15 400 – 7 800 23 200
Total 41 800 5 700 15 200 62 700
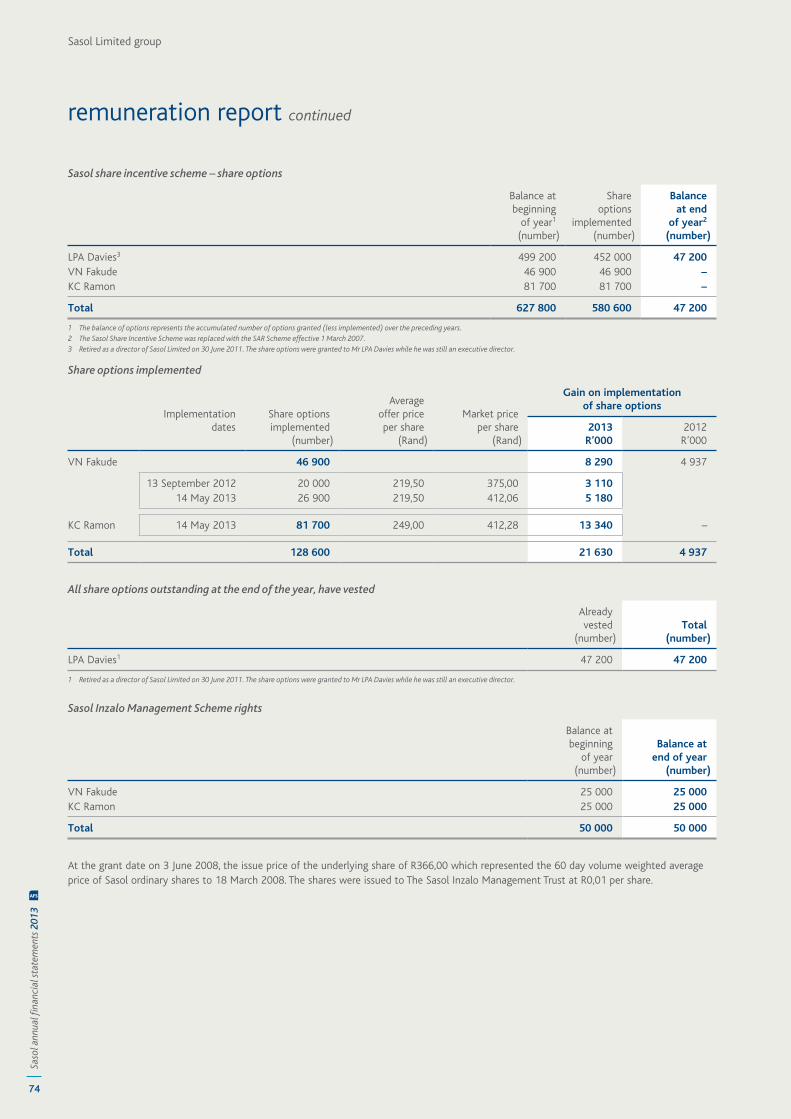
74
Saso
l ann
ual fi
nanc
ial s
tate
men
ts 2
013
AFS
Sasol Limited group
Sasol share incentive scheme – share options
Balance atbeginning
of year1
(number)
Shareoptions
implemented(number)
Balanceat end
of year2
(number)
LPA Davies3 499 200 452 000 47 200VN Fakude 46 900 46 900 –KC Ramon 81 700 81 700 –
Total 627 800 580 600 47 200
1 The balance of options represents the accumulated number of options granted (less implemented) over the preceding years.2 The Sasol Share Incentive Scheme was replaced with the SAR Scheme effective 1 March 2007.3 Retired as a director of Sasol Limited on 30 June 2011. The share options were granted to Mr LPA Davies while he was still an executive director.
Share options implemented
Implementationdates
Share optionsimplemented
(number)
Averageoffer priceper share
(Rand)
Market priceper share
(Rand)
Gain on implementationof share options
2013R’000
2012R’000
VN Fakude 46 900 8 290 4 937
13 September 2012 20 000 219,50 375,00 3 110 14 May 2013 26 900 219,50 412,06 5 180
KC Ramon 14 May 2013 81 700 249,00 412,28 13 340 –
Total 128 600 21 630 4 937
All share options outstanding at the end of the year, have vested
Alreadyvested
(number)Total
(number)
LPA Davies1 47 200 47 200
1 Retired as a director of Sasol Limited on 30 June 2011. The share options were granted to Mr LPA Davies while he was still an executive director.
Sasol Inzalo Management Scheme rights
Balance atbeginning
of year(number)
Balance atend of year
(number)
VN Fakude 25 000 25 000 KC Ramon 25 000 25 000
Total 50 000 50 000
At the grant date on 3 June 2008, the issue price of the underlying share of R366,00 which represented the 60 day volume weighted average price of Sasol ordinary shares to 18 March 2008. The shares were issued to The Sasol Inzalo Management Trust at R0,01 per share.
remuneration report continued
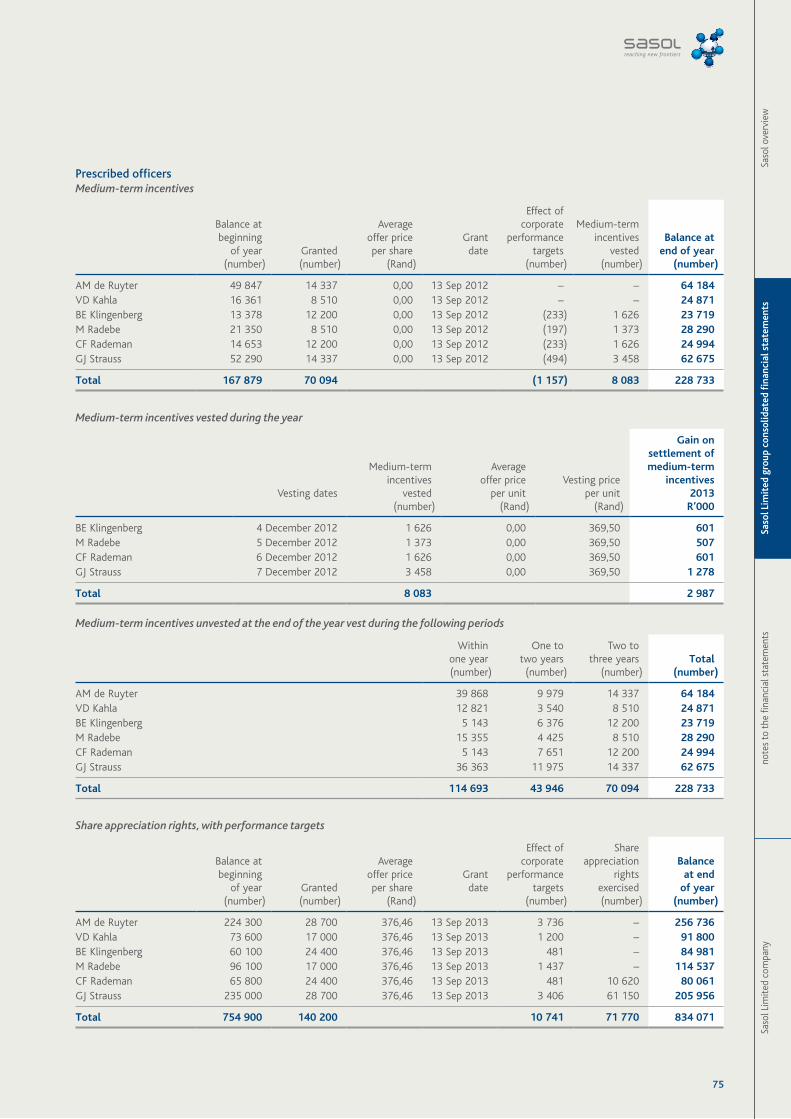
75
Saso
l Lim
ited
com
pany
note
s to
the
fina
ncia
l sta
tem
ents
Saso
l Lim
ited
gro
up c
onso
lidat
ed fi
nanc
ial s
tate
men
tsSa
sol o
verv
iew
Prescribed officersMedium-term incentives
Balance atbeginning
of year(number)
Granted(number)
Averageoffer priceper share
(Rand)
Grantdate
Effect ofcorporate
performancetargets
(number)
Medium-term incentives
vested(number)
Balance atend of year
(number)
AM de Ruyter 49 847 14 337 0,00 13 Sep 2012 – – 64 184 VD Kahla 16 361 8 510 0,00 13 Sep 2012 – – 24 871 BE Klingenberg 13 378 12 200 0,00 13 Sep 2012 (233) 1 626 23 719 M Radebe 21 350 8 510 0,00 13 Sep 2012 (197) 1 373 28 290 CF Rademan 14 653 12 200 0,00 13 Sep 2012 (233) 1 626 24 994 GJ Strauss 52 290 14 337 0,00 13 Sep 2012 (494) 3 458 62 675
Total 167 879 70 094 (1 157) 8 083 228 733
Medium-term incentives vested during the year
Vesting dates
Medium-termincentives
vested(number)
Averageoffer price
per unit(Rand)
Vesting priceper unit
(Rand)
Gain onsettlement ofmedium-term
incentives2013
R’000
BE Klingenberg 4 December 2012 1 626 0,00 369,50 601 M Radebe 5 December 2012 1 373 0,00 369,50 507 CF Rademan 6 December 2012 1 626 0,00 369,50 601 GJ Strauss 7 December 2012 3 458 0,00 369,50 1 278
Total 8 083 2 987
Medium-term incentives unvested at the end of the year vest during the following periods
Withinone year(number)
One totwo years
(number)
Two tothree years
(number) Total
(number)
AM de Ruyter 39 868 9 979 14 337 64 184 VD Kahla 12 821 3 540 8 510 24 871 BE Klingenberg 5 143 6 376 12 200 23 719 M Radebe 15 355 4 425 8 510 28 290 CF Rademan 5 143 7 651 12 200 24 994 GJ Strauss 36 363 11 975 14 337 62 675
Total 114 693 43 946 70 094 228 733
Share appreciation rights, with performance targets
Balance at beginning
of year(number)
Granted(number)
Averageoffer priceper share
(Rand)
Grantdate
Effect ofcorporate
performancetargets
(number)
Shareappreciation
rightsexercised(number)
Balanceat end
of year(number)
AM de Ruyter 224 300 28 700 376,46 13 Sep 2013 3 736 – 256 736 VD Kahla 73 600 17 000 376,46 13 Sep 2013 1 200 – 91 800 BE Klingenberg 60 100 24 400 376,46 13 Sep 2013 481 – 84 981 M Radebe 96 100 17 000 376,46 13 Sep 2013 1 437 – 114 537 CF Rademan 65 800 24 400 376,46 13 Sep 2013 481 10 620 80 061 GJ Strauss 235 000 28 700 376,46 13 Sep 2013 3 406 61 150 205 956
Total 754 900 140 200 10 741 71 770 834 071
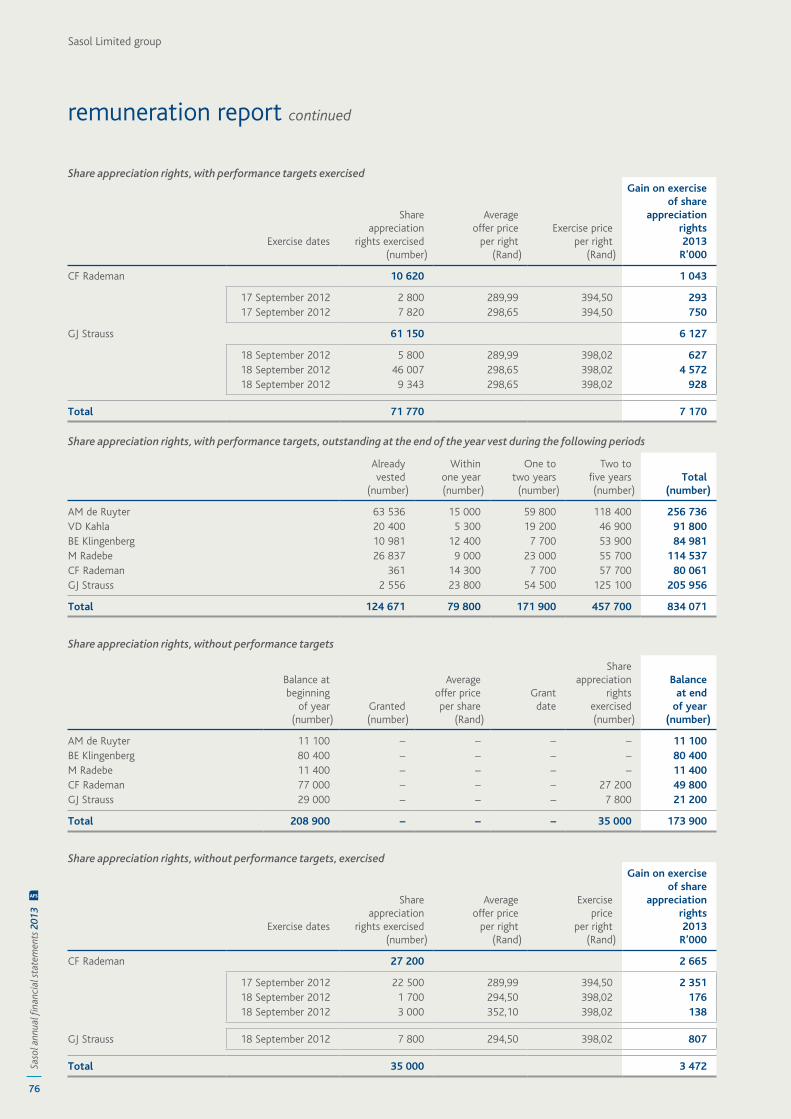
76
Saso
l ann
ual fi
nanc
ial s
tate
men
ts 2
013
AFS
Sasol Limited group
Share appreciation rights, with performance targets exercised
Exercise dates
Shareappreciation
rights exercised(number)
Averageoffer price
per right(Rand)
Exercise priceper right
(Rand)
Gain on exerciseof share
appreciationrights2013
R’000
CF Rademan 10 620 1 043
17 September 2012 2 800 289,99 394,50 293 17 September 2012 7 820 298,65 394,50 750
GJ Strauss 61 150 6 127
18 September 2012 5 800 289,99 398,02 62718 September 2012 46 007 298,65 398,02 4 57218 September 2012 9 343 298,65 398,02 928
Total 71 770 7 170
Share appreciation rights, with performance targets, outstanding at the end of the year vest during the following periods
Alreadyvested
(number)
Withinone year(number)
One totwo years
(number)
Two tofive years(number)
Total(number)
AM de Ruyter 63 536 15 000 59 800 118 400 256 736 VD Kahla 20 400 5 300 19 200 46 900 91 800 BE Klingenberg 10 981 12 400 7 700 53 900 84 981 M Radebe 26 837 9 000 23 000 55 700 114 537 CF Rademan 361 14 300 7 700 57 700 80 061 GJ Strauss 2 556 23 800 54 500 125 100 205 956
Total 124 671 79 800 171 900 457 700 834 071
Share appreciation rights, without performance targets
Balance atbeginning
of year(number)
Granted(number)
Averageoffer priceper share
(Rand)
Grantdate
Shareappreciation
rightsexercised(number)
Balanceat end
of year(number)
AM de Ruyter 11 100 – – – – 11 100 BE Klingenberg 80 400 – – – – 80 400 M Radebe 11 400 – – – – 11 400 CF Rademan 77 000 – – – 27 200 49 800 GJ Strauss 29 000 – – – 7 800 21 200
Total 208 900 – – – 35 000 173 900
Share appreciation rights, without performance targets, exercised
Exercise dates
Shareappreciation
rights exercised(number)
Averageoffer price
per right(Rand)
Exerciseprice
per right(Rand)
Gain on exerciseof share
appreciationrights2013
R’000
CF Rademan 27 200 2 665
17 September 2012 22 500 289,99 394,50 2 35118 September 2012 1 700 294,50 398,02 176 18 September 2012 3 000 352,10 398,02 138
GJ Strauss 18 September 2012 7 800 294,50 398,02 807
Total 35 000 3 472
remuneration report continued
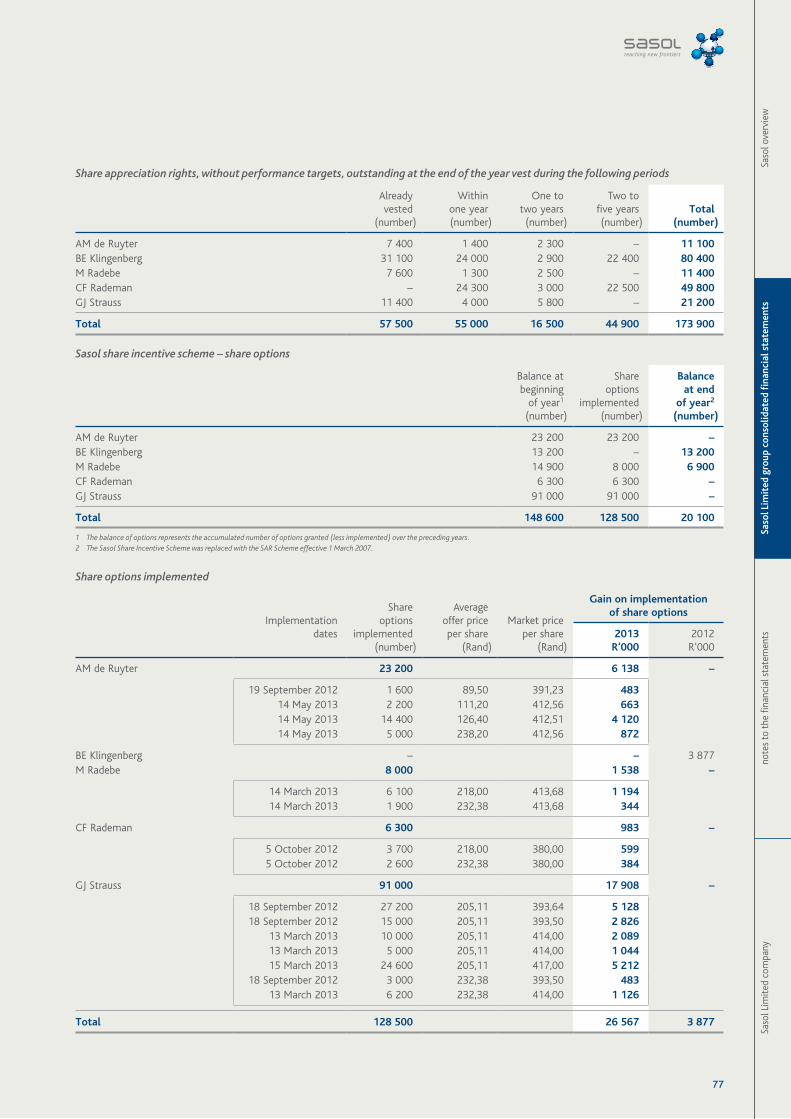
77
Saso
l Lim
ited
com
pany
note
s to
the
fina
ncia
l sta
tem
ents
Saso
l Lim
ited
gro
up c
onso
lidat
ed fi
nanc
ial s
tate
men
tsSa
sol o
verv
iew
Share appreciation rights, without performance targets, outstanding at the end of the year vest during the following periods
Alreadyvested
(number)
Withinone year(number)
One totwo years
(number)
Two tofive years(number)
Total(number)
AM de Ruyter 7 400 1 400 2 300 – 11 100 BE Klingenberg 31 100 24 000 2 900 22 400 80 400 M Radebe 7 600 1 300 2 500 – 11 400 CF Rademan – 24 300 3 000 22 500 49 800 GJ Strauss 11 400 4 000 5 800 – 21 200
Total 57 500 55 000 16 500 44 900 173 900
Sasol share incentive scheme – share options
Balance atbeginning
of year1
(number)
Shareoptions
implemented(number)
Balanceat end
of year2
(number)
AM de Ruyter 23 200 23 200 –BE Klingenberg 13 200 – 13 200 M Radebe 14 900 8 000 6 900 CF Rademan 6 300 6 300 –GJ Strauss 91 000 91 000 –
Total 148 600 128 500 20 100
1 The balance of options represents the accumulated number of options granted (less implemented) over the preceding years.2 The Sasol Share Incentive Scheme was replaced with the SAR Scheme effective 1 March 2007.
Share options implemented
Implementationdates
Shareoptions
implemented(number)
Averageoffer priceper share
(Rand)
Market priceper share
(Rand)
Gain on implementation of share options
2013R’000
2012R’000
AM de Ruyter 23 200 6 138 –
19 September 2012 1 600 89,50 391,23 483 14 May 2013 2 200 111,20 412,56 663 14 May 2013 14 400 126,40 412,51 4 120 14 May 2013 5 000 238,20 412,56 872
BE Klingenberg – – 3 877 M Radebe 8 000 1 538 –
14 March 2013 6 100 218,00 413,68 1 194 14 March 2013 1 900 232,38 413,68 344
CF Rademan 6 300 983 –
5 October 2012 3 700 218,00 380,00 599 5 October 2012 2 600 232,38 380,00 384
GJ Strauss 91 000 17 908 –
18 September 2012 27 200 205,11 393,64 5 128 18 September 2012 15 000 205,11 393,50 2 826
13 March 2013 10 000 205,11 414,00 2 089 13 March 2013 5 000 205,11 414,00 1 044 15 March 2013 24 600 205,11 417,00 5 212
18 September 2012 3 000 232,38 393,50 483 13 March 2013 6 200 232,38 414,00 1 126
Total 128 500 26 567 3 877
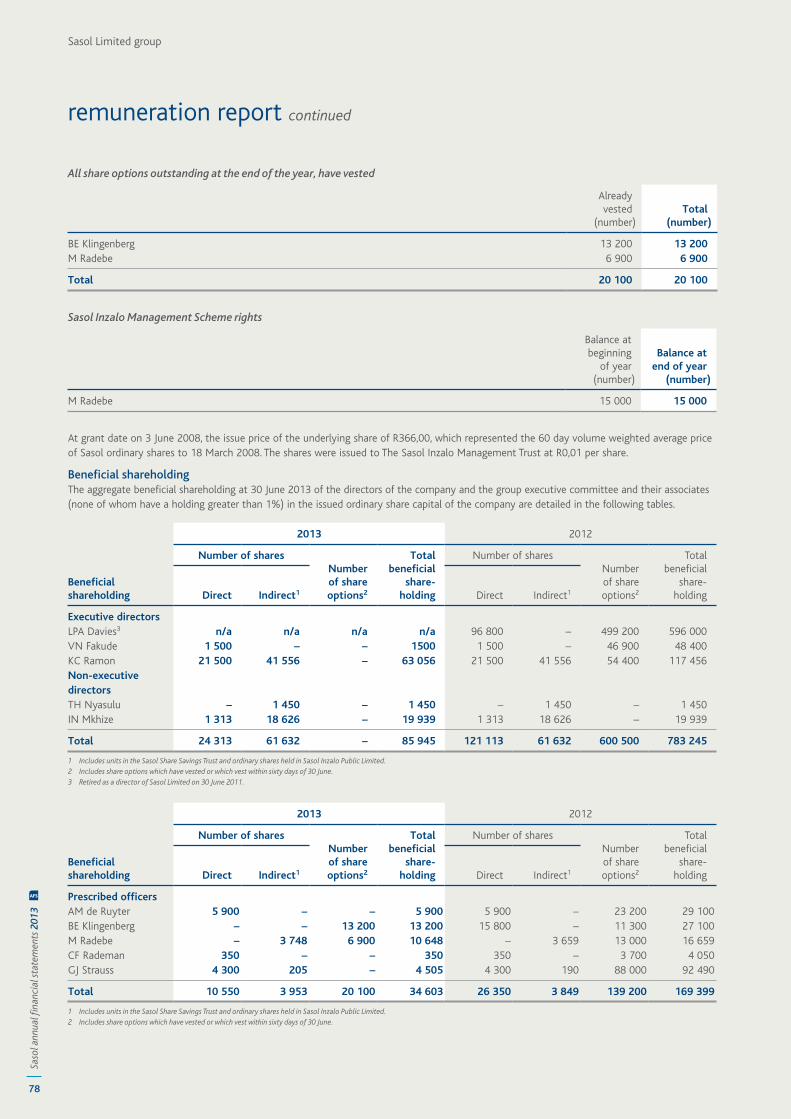
78
Saso
l ann
ual fi
nanc
ial s
tate
men
ts 2
013
AFS
Sasol Limited group
All share options outstanding at the end of the year, have vested
Alreadyvested
(number) Total
(number)
BE Klingenberg 13 200 13 200 M Radebe 6 900 6 900
Total 20 100 20 100
Sasol Inzalo Management Scheme rights
Balance atbeginning
of year(number)
Balance atend of year
(number)
M Radebe 15 000 15 000
At grant date on 3 June 2008, the issue price of the underlying share of R366,00, which represented the 60 day volume weighted average price of Sasol ordinary shares to 18 March 2008. The shares were issued to The Sasol Inzalo Management Trust at R0,01 per share.
Beneficial shareholdingThe aggregate beneficial shareholding at 30 June 2013 of the directors of the company and the group executive committee and their associates (none of whom have a holding greater than 1%) in the issued ordinary share capital of the company are detailed in the following tables.
Beneficial shareholding
2013 2012
Number of sharesNumberof share
options2
Totalbeneficial
share-holding
Number of sharesNumber of share
options2
Totalbeneficial
share-holdingDirect Indirect1 Direct Indirect1
Executive directorsLPA Davies3 n/a n/a n/a n/a 96 800 – 499 200 596 000VN Fakude 1 500 – – 1500 1 500 – 46 900 48 400KC Ramon 21 500 41 556 – 63 056 21 500 41 556 54 400 117 456Non-executive directorsTH Nyasulu – 1 450 – 1 450 – 1 450 – 1 450IN Mkhize 1 313 18 626 – 19 939 1 313 18 626 – 19 939
Total 24 313 61 632 – 85 945 121 113 61 632 600 500 783 245
1 Includes units in the Sasol Share Savings Trust and ordinary shares held in Sasol Inzalo Public Limited.2 Includes share options which have vested or which vest within sixty days of 30 June.3 Retired as a director of Sasol Limited on 30 June 2011.
Beneficial shareholding
2013 2012
Number of sharesNumberof share
options2
Totalbeneficial
share-holding
Number of sharesNumber of share
options2
Totalbeneficial
share-holdingDirect Indirect1 Direct Indirect1
Prescribed officersAM de Ruyter 5 900 – – 5 900 5 900 – 23 200 29 100BE Klingenberg – – 13 200 13 200 15 800 – 11 300 27 100M Radebe – 3 748 6 900 10 648 – 3 659 13 000 16 659CF Rademan 350 – – 350 350 – 3 700 4 050GJ Strauss 4 300 205 – 4 505 4 300 190 88 000 92 490
Total 10 550 3 953 20 100 34 603 26 350 3 849 139 200 169 399
1 Includes units in the Sasol Share Savings Trust and ordinary shares held in Sasol Inzalo Public Limited.2 Includes share options which have vested or which vest within sixty days of 30 June.
remuneration report continued
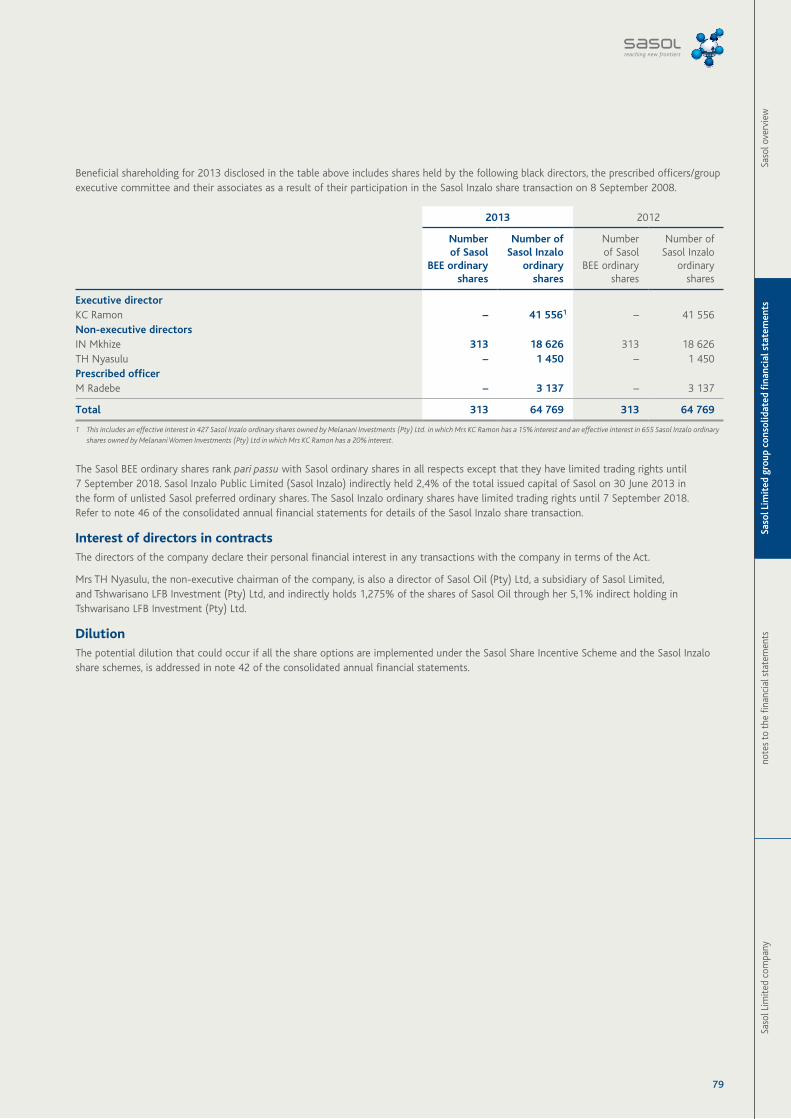
79
Saso
l Lim
ited
com
pany
note
s to
the
fina
ncia
l sta
tem
ents
Saso
l Lim
ited
gro
up c
onso
lidat
ed fi
nanc
ial s
tate
men
tsSa
sol o
verv
iew
Beneficial shareholding for 2013 disclosed in the table above includes shares held by the following black directors, the prescribed officers/group executive committee and their associates as a result of their participation in the Sasol Inzalo share transaction on 8 September 2008.
2013 2012
Numberof Sasol
BEE ordinaryshares
Number ofSasol Inzalo
ordinaryshares
Numberof Sasol
BEE ordinaryshares
Number ofSasol Inzalo
ordinaryshares
Executive directorKC Ramon – 41 5561 – 41 556Non-executive directorsIN Mkhize 313 18 626 313 18 626TH Nyasulu – 1 450 – 1 450Prescribed officerM Radebe – 3 137 – 3 137
Total 313 64 769 313 64 769
1 This includes an effective interest in 427 Sasol Inzalo ordinary shares owned by Melanani Investments (Pty) Ltd. in which Mrs KC Ramon has a 15% interest and an effective interest in 655 Sasol Inzalo ordinary shares owned by Melanani Women Investments (Pty) Ltd in which Mrs KC Ramon has a 20% interest.
The Sasol BEE ordinary shares rank pari passu with Sasol ordinary shares in all respects except that they have limited trading rights until 7 September 2018. Sasol Inzalo Public Limited (Sasol Inzalo) indirectly held 2,4% of the total issued capital of Sasol on 30 June 2013 in the form of unlisted Sasol preferred ordinary shares. The Sasol Inzalo ordinary shares have limited trading rights until 7 September 2018. Refer to note 46 of the consolidated annual financial statements for details of the Sasol Inzalo share transaction.
Interest of directors in contractsThe directors of the company declare their personal financial interest in any transactions with the company in terms of the Act.
Mrs TH Nyasulu, the non-executive chairman of the company, is also a director of Sasol Oil (Pty) Ltd, a subsidiary of Sasol Limited, and Tshwarisano LFB Investment (Pty) Ltd, and indirectly holds 1,275% of the shares of Sasol Oil through her 5,1% indirect holding in Tshwarisano LFB Investment (Pty) Ltd.
DilutionThe potential dilution that could occur if all the share options are implemented under the Sasol Share Incentive Scheme and the Sasol Inzalo share schemes, is addressed in note 42 of the consolidated annual financial statements.
Sasol Limited group
80
Saso
l ann
ual fi
nanc
ial s
tate
men
ts 2
013
AFS
Sasol Limited is the holding company of the Sasol group (the group) and is domiciled in the Republic of South Africa. The following principal accounting policies were applied by the group for the financial year ended 30 June 2013. Except as otherwise disclosed, these policies are consistent in all material respects with those applied in previous years.
Financial reporting termsThese definitions of financial reporting terms are provided to ensure clarity of meaning as certain terms may not always have the same meaning or interpretation in all countries.
Group structures
Associate An entity, other than a subsidiary or joint venture, in which the group, holding a material long-term interest, has significant influence, but no control or joint control, over financial and operating policies.
Business unit An operation engaged in providing similar goods or services that are different to those provided by other operations.
The primary business units are:
South African energy cluster■ Sasol Mining■ Sasol Gas■ Sasol Synfuels■ Sasol Oil■ Other
International energy cluster■ Sasol Synfuels International■ Sasol Petroleum International
Chemical cluster■ Sasol Polymers■ Sasol Solvents■ Sasol Olefins & Surfactants■ Other chemical businesses including: ■ Sasol Wax ■ Sasol Nitro ■ Merisol ■ Sasol Infrachem
Classified as ‘other businesses’ in the segment report:■ Sasol Technology■ Sasol Financing■ Corporate head office functions■ Alternative energy businesses
In the notes to the financial statements, where items classified as ‘other businesses’ or ‘other chemical businesses’ are material, the amounts attributable to these businesses have been specified.
Company A legal business entity registered in terms of the applicable legislation of that country.
Entity Sasol Limited, a subsidiary, joint venture, associate or special purpose entity.
Foreign operation An entity whose activities are based or conducted in a country or currency other than those of the reporting entity (Sasol Limited).
Group The group comprises Sasol Limited, its subsidiaries and its interest in joint ventures, associates and special purpose entities.
Joint venture An economic activity over which the group exercises joint control established under a contractual arrangement.
Operation A component of the group: • that represents a separate major line of business or geographical area of operation; and • is distinguished separately for financial and operating purposes.
Subsidiary Any entity over which the group has the power to exercise control.
Special purpose entity An entity established to accomplish a narrow and well defined objective, including the facilitation of the group’s black economic empowerment transactions, and where the group receives the majority of the benefits related to the operations and net assets of the entity, is exposed to the majority of the risks incident to the entity’s activities and retains the majority of the residual or ownership risks related to the entity or its assets.
accounting policies and financial reporting terms
Saso
l Lim
ited
com
pany
note
s to
the
fina
ncia
l sta
tem
ents
Saso
l Lim
ited
gro
up c
onso
lidat
ed fi
nanc
ial s
tate
men
tsSa
sol o
verv
iew
81
General accounting terms
Acquisition date The date on which control in subsidiaries, special purpose entities, joint control in joint ventures and significant influence in associates commences.
Assets under construction A non-current asset which includes expenditure capitalised for work in progress in respect of activities to develop, expand or enhance items of property, plant and equipment, other intangible assets and exploration assets.
Business An integrated set of activities and assets capable of being conducted and managed for the purpose of providing a return in the form of dividends, lower costs or other economic benefits directly to investors or other owners, members or participants.
Cash generating unit The smallest identifiable group of assets which can generate cash inflows independently from other assets or groups of assets.
Commissioning date The date that an item of property, plant and equipment, whether acquired or constructed, is brought into use.
Consolidated group financial statements
The financial results of the group which comprise the financial results of Sasol Limited and its subsidiaries, special purpose entities, the proportionate interest in the financial results of joint ventures and its interest in associates.
Construction contract A contract specifically negotiated with a third party for the construction of an asset or a combination of assets that are closely interrelated or interdependent in terms of their design, technology and function or their ultimate purpose or use.
Control The ability, directly or indirectly, to govern the financial and operating policies of an entity so as to obtain benefits from its activities. When assessing the ability to control an entity, the existence and effect of potential voting rights that are presently exercisable or convertible are taken into account.
Corporate assets Assets, other than goodwill, that contribute to the future cash flows of both the cash generating unit under review as well as other cash generating units.
Discontinued operation An operation that represents a major line of business or geographical area of business that, pursuant to a single plan, has either been disposed of or is classified as an operation held for sale.
Discount rate The rate used for purposes of determining discounted cash flows defined as the yield on AAA credit rated bonds (for entities outside South Africa) and relevant South African Government bonds (for South African entities) that have maturity dates approximating the term of the related cash flows. This pre-tax interest rate reflects the current market assessment of the time value of money. To the extent that, in determining the cash flows, the risks specific to the asset or liability are taken into account in determining those cash flows, they are not included in determining the discount rate.
Disposal date The date on which control in subsidiaries, special purpose entities, joint control in joint ventures and significant influence in associates ceases.
Exploration assets Capitalised expenditure relating to the exploration for and evaluation of mineral resources (coal, oil and gas).
Fair value The price that would be received to sell an asset or paid to transfer a liability in an orderly transaction between market participants at the measurement date.
Financial results Comprise the financial position (assets, liabilities and equity), results of operations (revenue and expenses) and cash flows of an entity and of the group.
Functional currency The currency of the primary economic environment in which an entity operates.
Long-term A period longer than 12 months from the reporting date.
Market participants Buyers and sellers in an open market who are independent, knowledgeable and willing to exchange an asset or settle a liability in an arm’s length transaction.
Mineral assets Capitalised expenditure relating to producing coal, oil and gas properties, including development costs and previously capitalised exploration assets.
Other comprehensive income
Comprises items of income and expense (including reclassification adjustments) that are not recognised in the income statement and includes the effect of translation of foreign operations, cash flow hedges, remeasurements of defined benefit plans, available-for-sale financial assets and changes in revaluation reserves.
Presentation currency The currency in which financial results of an entity are presented.
82
Saso
l ann
ual fi
nanc
ial s
tate
men
ts 2
013
AFS
Sasol Limited group
General accounting terms
Qualifying asset An asset that necessarily takes a substantial period (normally in excess of 12 months) of time to get ready for its intended use.
Recoverable amount The amount that reflects the greater of the fair value less costs to sell and value in use that can be attributed to an asset as a result of its ongoing use by the entity. In determining the value in use, expected future cash flows are discounted to their present values using a discount rate.
Related party Parties are considered to be related if one party directly or indirectly has the ability to control or jointly control the other party or exercise significant influence over the other party or is a member of the key management of the reporting entity (Sasol Limited).
Revenue Comprises turnover, dividends received and interest received.
Share-based payment A transaction in which an entity issues equity instruments, share options or incurs a liability to pay cash based on the price of the entity’s equity instruments to another party as compensation for goods received or services rendered.
Significant influence The ability, directly or indirectly, to participate in, but not exercise control over, the financial and operating policy decisions of an entity so as to obtain economic benefit from its activities.
Turnover Comprises revenue generated by operating activities and includes sales of products, services rendered, licence fees and royalties, net of indirect taxes, rebates and trade discounts.
Remeasurement items Comprises of items of income and expense recognised in the income statement that do not relate to the normal operating activities of the reporting entity and includes the impairment of non-current assets, profit or loss on disposal of non-current assets including businesses and investments, and scrapping of assets.
Financial instrument terms
Available-for-sale financial asset
A financial asset that has been designated as available-for-sale or a financial asset other than those classified as loans and receivables, financial assets at fair value through profit or loss, held-to-maturity investments or derivative instruments.
An investment intended to be held for an indefinite period of time, which may be sold in response to needs for liquidity or changes in interest rates, is classified as a non-current available-for-sale financial asset.
Cash and cash equivalents Comprise cash on hand, cash restricted for use, bank overdraft, demand deposits and other short-term highly liquid investments with a maturity period of three months or less at date of purchase.
Cash flow hedge A hedge of the exposure to variability in cash flows that is attributable to a particular risk associated with a recognised asset or liability or a forecasted transaction.
Cash restricted for use Cash and cash equivalent balances which are not available for general use by the group, including amounts held in escrow, trust or other separate bank accounts.
Derivative instrument A financial instrument: • whose value changes in response to movements in a specified interest rate, commodity price, foreign exchange rate
or similar variable; • that requires minimal initial net investment; and • whose terms require or permit settlement at a future date.
Effective interest rate The derived rate that discounts the expected future cash flows to the current net carrying amount of the financial asset or financial liability.
Equity instrument Any financial instrument (including investments) that evidences a residual interest in the assets of an enterprise after deducting all of its liabilities.
Financial asset Cash or cash equivalents, a contractual right to receive cash, an equity instrument or a contractual right to exchange a financial instrument under favourable conditions.
accounting policies and financial reporting terms continued
83
Saso
l Lim
ited
com
pany
note
s to
the
fina
ncia
l sta
tem
ents
Saso
l Lim
ited
gro
up c
onso
lidat
ed fi
nanc
ial s
tate
men
tsSa
sol o
verv
iew
Financial instrument terms
Financial liability A contractual obligation to pay cash or transfer other benefits or an obligation to exchange a financial instrument under unfavourable conditions. This includes debt.
Financial guarantee A contract that requires the issuer to make specified payments to reimburse the holder for a loss it incurs because a specified debtor fails to make payment when due in accordance with the original or modified terms of the debt instrument.
Financial assets at fair value through profit or loss
A financial asset with no fixed or determinable repayments, that the group manages based on its fair value at each reporting period.
Held-to-maturity investment
A financial asset with a fixed maturity and fixed or determinable future payments, that management has the positive intent and ability to hold to maturity. Such a financial asset is classified as a non-current asset, except when it has a maturity within 12 months from the reporting date, in which case it is classified as a current asset.
Loans and receivables A financial asset with fixed or determinable repayments that are not quoted in an active market, other than: • a derivative instrument; • financial assets at fair value through profit or loss; or • an available-for-sale financial asset.
Monetary asset An asset which will be settled in a fixed or determinable amount of money.
Monetary liability A liability which will be settled in a fixed or determinable amount of money.
Transaction date The date an entity commits itself to purchase or sell a financial instrument.
Statement of complianceThe annual financial statements are prepared in compliance with International Financial Reporting Standards (IFRS) and Interpretations of those standards, as issued by the International Accounting Standards Board, the SAICA Financial Reporting Guides as issued by the Accounting Practices Committee and the Financial Reporting Pronouncements as issued by the Financial Reporting Standards Council and the South African Companies Act, 71 of 2008, as amended. The annual financial statements were approved for issue by the board of directors on 6 September 2013 and are subject to approval by the Annual General Meeting of shareholders on 22 November 2013.
During the current financial year, the following new accounting standards, interpretations and amendments to published accounting standards were adopted prior to their effective dates:
Standard Nature of the change Date publishedImpact on financial position or performance
IAS 36 (Amendment), Impairment of assets: Recoverable Amount Disclosures for Non-Financial Assets
Amendment 29 May 2013 No impact
IAS 39 (Amendment), Financial Instruments: Recognition and Measurement: Novation of Derivatives and Continuation of Hedge Accounting
Amendment 27 June 2013 No impact
IFRIC 21, Levies New interpretation 20 May 2013 No impact
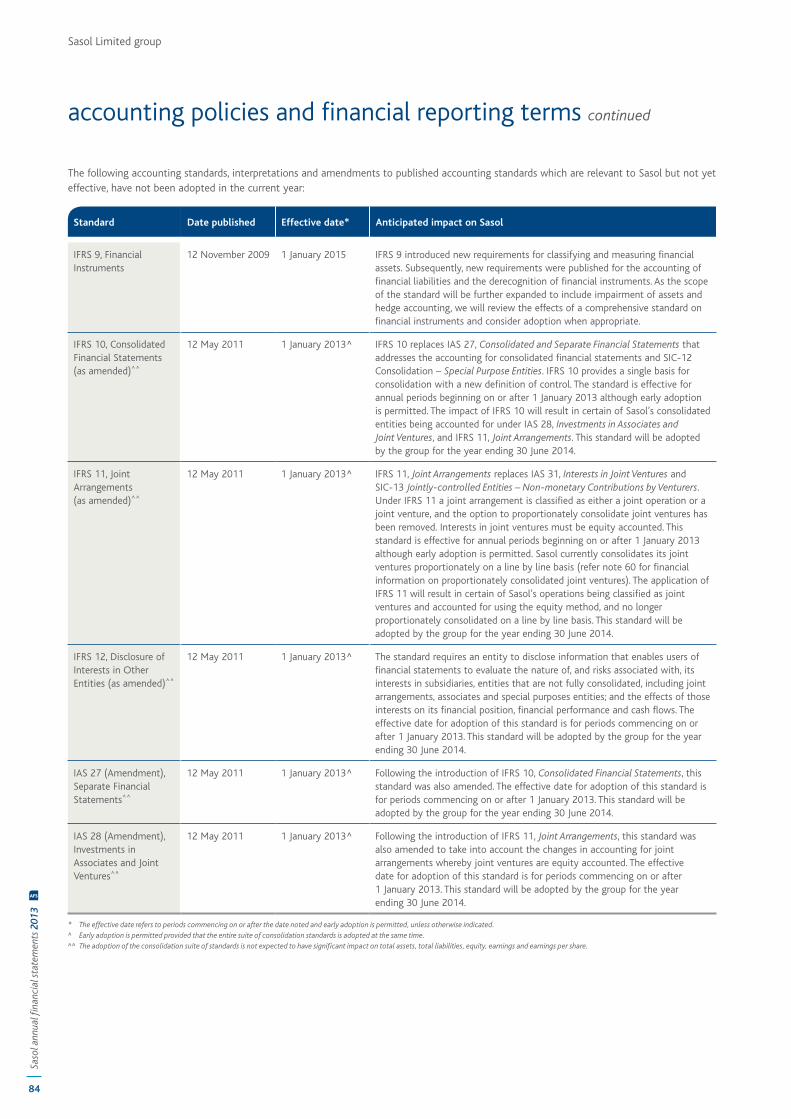
84
Saso
l ann
ual fi
nanc
ial s
tate
men
ts 2
013
AFS
Sasol Limited group
The following accounting standards, interpretations and amendments to published accounting standards which are relevant to Sasol but not yet effective, have not been adopted in the current year:
Standard Date published Effective date* Anticipated impact on Sasol
IFRS 9, Financial Instruments
12 November 2009 1 January 2015 IFRS 9 introduced new requirements for classifying and measuring financial assets. Subsequently, new requirements were published for the accounting of financial liabilities and the derecognition of financial instruments. As the scope of the standard will be further expanded to include impairment of assets and hedge accounting, we will review the effects of a comprehensive standard on financial instruments and consider adoption when appropriate.
IFRS 10, Consolidated Financial Statements (as amended)^^
12 May 2011 1 January 2013^ IFRS 10 replaces IAS 27, Consolidated and Separate Financial Statements that addresses the accounting for consolidated financial statements and SIC-12 Consolidation – Special Purpose Entities. IFRS 10 provides a single basis for consolidation with a new definition of control. The standard is effective for annual periods beginning on or after 1 January 2013 although early adoption is permitted. The impact of IFRS 10 will result in certain of Sasol’s consolidated entities being accounted for under IAS 28, Investments in Associates and Joint Ventures, and IFRS 11, Joint Arrangements. This standard will be adopted by the group for the year ending 30 June 2014.
IFRS 11, Joint Arrangements (as amended)^^
12 May 2011 1 January 2013^ IFRS 11, Joint Arrangements replaces IAS 31, Interests in Joint Ventures and SIC-13 Jointly-controlled Entities – Non-monetary Contributions by Venturers.Under IFRS 11 a joint arrangement is classified as either a joint operation or a joint venture, and the option to proportionately consolidate joint ventures has been removed. Interests in joint ventures must be equity accounted. This standard is effective for annual periods beginning on or after 1 January 2013 although early adoption is permitted. Sasol currently consolidates its joint ventures proportionately on a line by line basis (refer note 60 for financial information on proportionately consolidated joint ventures). The application of IFRS 11 will result in certain of Sasol’s operations being classified as joint ventures and accounted for using the equity method, and no longer proportionately consolidated on a line by line basis. This standard will be adopted by the group for the year ending 30 June 2014.
IFRS 12, Disclosure of Interests in Other Entities (as amended)^^
12 May 2011 1 January 2013^ The standard requires an entity to disclose information that enables users of financial statements to evaluate the nature of, and risks associated with, its interests in subsidiaries, entities that are not fully consolidated, including joint arrangements, associates and special purposes entities; and the effects of those interests on its financial position, financial performance and cash flows. The effective date for adoption of this standard is for periods commencing on or after 1 January 2013. This standard will be adopted by the group for the year ending 30 June 2014.
IAS 27 (Amendment), Separate Financial Statements^^
12 May 2011 1 January 2013^ Following the introduction of IFRS 10, Consolidated Financial Statements, this standard was also amended. The effective date for adoption of this standard is for periods commencing on or after 1 January 2013. This standard will be adopted by the group for the year ending 30 June 2014.
IAS 28 (Amendment), Investments in Associates and Joint Ventures^^
12 May 2011 1 January 2013^ Following the introduction of IFRS 11, Joint Arrangements, this standard was also amended to take into account the changes in accounting for joint arrangements whereby joint ventures are equity accounted. The effective date for adoption of this standard is for periods commencing on or after 1 January 2013. This standard will be adopted by the group for the year ending 30 June 2014.
* The effective date refers to periods commencing on or after the date noted and early adoption is permitted, unless otherwise indicated.^ Early adoption is permitted provided that the entire suite of consolidation standards is adopted at the same time.^^ The adoption of the consolidation suite of standards is not expected to have significant impact on total assets, total liabilities, equity, earnings and earnings per share.
accounting policies and financial reporting terms continued
85
Saso
l Lim
ited
com
pany
note
s to
the
fina
ncia
l sta
tem
ents
Saso
l Lim
ited
gro
up c
onso
lidat
ed fi
nanc
ial s
tate
men
tsSa
sol o
verv
iew
Principal accounting policies
Basis of preparation of financial resultsThe financial statements are prepared using the historic cost convention except that, as set out in the accounting policies below, certain items, including derivative instruments, liabilities for cash-settled share-based payment schemes, financial assets at fair value through profit or loss and available-for-sale financial assets, are stated at fair value.
The financial statements are prepared on the going concern basis.
Except as otherwise disclosed, these accounting policies are consistent with those applied in previous years.
These accounting policies are consistently applied throughout the group.
Basis of consolidation of financial resultsThe consolidated financial statements reflect the financial results of the group. All financial results are consolidated with similar items on a line by line basis except for investments in associates, which are included in the group’s results as set out below.
Inter-company transactions, balances and unrealised gains and losses between entities are eliminated on consolidation. To the extent that a loss on a transaction provides evidence of a reduction in the net realisable value of current assets or an impairment loss of a non-current asset, that loss is charged to the income statement.
In respect of associates, unrealised gains and losses are eliminated to the extent of the group’s interest in these entities. Unrealised gains and losses arising from transactions with associates are eliminated against the investment in the associate.
Subsidiaries The financial results of subsidiaries are consolidated into the group’s results from acquisition date until disposal date. The existence of potential voting rights that are currently exercisable or convertible are also considered when assessing whether the group controls another entity.
Special purpose entities The financial results of special purpose entities (SPE) are consolidated into the group’s results from the date that the group controls the SPE until the date that control ceases. Control is based on an evaluation of the substance of the SPE’s relationship with the group and the SPE’s risks and rewards.
Joint ventures The proportionate share of the financial results of joint ventures are consolidated into the group’s results from acquisition date until disposal date.
Joint ventures whose financial year ends are within three months of 30 June are included in the consolidated financial statements using their most recently audited financial results. Adjustments are made to the joint ventures’ financial results for material transactions and events in the intervening period.
Associates The financial results of associates are included in the group’s results according to the equity method from acquisition date until the disposal date.
Under this method, investments in associates are recognised initially at cost. Subsequent to the acquisition date, the group’s share of profits or losses of associates is charged to the income statement as equity accounted earnings and its share of movements in equity reserves is recognised as other comprehensive income. All cumulative post-acquisition movements in the equity of associates are adjusted against the cost of the investment. When the group’s share of losses in associates equals or exceeds its interest in those associates, the carrying amount of the investment is reduced to zero, and the group does not recognise further losses, unless the group has incurred a legal or constructive obligation or made payments on behalf of those associates.
Goodwill relating to associates forms part of the carrying amount of those associates.
The total carrying amount of each associate is evaluated annually, as a single asset, for impairment or when conditions indicate that a decline in fair value below the carrying amount is other than temporary. If impaired, the carrying amount of the group’s share of the underlying assets of associates is written down to its estimated recoverable amount in accordance with the accounting policy on impairment and charged to the income statement. A previously recognised impairment loss will be reversed, insofar as estimates change as a result of an event occurring after the impairment loss was recognised.
Associates whose financial year ends are within three months of 30 June are included in the consolidated financial statements using their most recently audited financial results. Adjustments are made to the associates’ financial results for material transactions and events in the intervening period.
Foreign currency translationItems included in the financial results of each entity are measured using the functional currency of that entity. The consolidated financial results are presented in rand, which is Sasol Limited’s functional and presentation currency, rounded to the nearest million.
Foreign currency transactions Income and expenditure transactions are translated into the functional currency of the entity at the rate of exchange ruling at the transaction date. To the extent that transactions occur regularly throughout the year, they are translated at the average rate of exchange for the year since this approximates the actual exchange rates at which those transactions occurred.
Monetary assets and liabilities are translated into the functional currency of the entity at the rate of exchange ruling at the reporting date. Foreign exchange gains and losses resulting from the translation and settlement of monetary assets and liabilities are recognised in the income statement, except when they relate to cash flow hedging activities in which case these gains and losses are recognised as other comprehensive income and are included in the cash flow hedge accounting reserve.
Foreign operations The financial results of all entities that have a functional currency different from the presentation currency of their parent entity are translated into the presentation currency. Income and expenditure transactions of foreign operations are translated at
86
Saso
l ann
ual fi
nanc
ial s
tate
men
ts 2
013
AFS
Sasol Limited group
the average rate of exchange for the year except for significant individual transactions which are translated at the exchange rate ruling at that date. All assets and liabilities, including fair value adjustments and goodwill arising on acquisition, are translated at the rate of exchange ruling at the reporting date. Differences arising on translation are recognised as other comprehensive income and are included in the foreign currency translation reserve.
When the settlement of a monetary item, arising from a receivable or from a payable to a foreign operation, is neither planned nor likely in the foreseeable future, foreign exchange gains and losses arising from such a monetary item are considered to form part of a net investment in a foreign operation and are recognised in other comprehensive income, and are included in the foreign currency translation reserve.
On consolidation, differences arising from the translation of the net investment in a foreign operation are recognised as other comprehensive income and are included in the foreign currency translation reserve.
On disposal of all of the operation, the proportionate share of the related cumulative gains and losses previously recognised in the foreign currency translation reserve through the statement of comprehensive income are included in determining the profit or loss on disposal of that operation recognised in the income statement as part of the gain or loss on the disposal. When the group disposes of only part of its interest in a subsidiary that includes a foreign operation while retaining control, the relevant portion of the cumulative foreign currency translation reserve is reattributed to non-controlling interests. When the group disposes of only part of its investment in an associate or joint venture that includes a foreign operation while retaining significant influence or joint control, the relevant portion of the cumulative foreign currency translation reserve is reclassified to the income statement.
Property, plant and equipmentProperty, plant and equipment is stated at cost less accumulated depreciation and impairment losses. Land is not depreciated.
The cost of self-constructed assets includes expenditure on materials, direct labour and an allocated proportion of project overheads. Cost also includes the estimated costs of dismantling and removing the assets and site rehabilitation costs to the extent that they relate to the construction of the asset as well as gains or losses on qualifying cash flow hedges attributable to that asset. Costs capitalised for work in progress in respect of activities to develop, expand or enhance items of property, plant and equipment are classified as part of assets under construction.
Finance expenses in respect of general borrowings are capitalised on against qualifying assets as part of assets under construction.
When plant and equipment comprises major components with different useful lives, these components are accounted for as separate items. Expenditure incurred to replace or modify a significant component of plant is capitalised and any remaining carrying amount of the component replaced is written off in the income statement. All other expenditure is charged to the income statement.
Property, plant and equipment, other than mineral assets, is depreciated to its estimated residual value on a straight-line basis over its expected useful life. Mineral assets are depreciated in accordance with the policy set out below on exploration, evaluation and development. The depreciation methods, estimated remaining useful lives and residual values are reviewed at least annually. The estimation of the useful lives of property, plant and equipment is based on historic performance as well as expectations about future use and therefore requires a significant degree of judgement to be applied by management. The following depreciation rates, based on the estimated useful lives of the respective assets, were applied:
Buildings and improvements % 2 – 5
Retail convenience centres % 3 – 5
Plant % 4 – 5
Equipment % 10 – 33
Vehicles % 20 – 33
Mineral assets Life of related reserve base
The carrying amount of property, plant and equipment will be derecognised on disposal or when no future economic benefits are expected from its use. Gains and losses on disposal of an item of property, plant and equipment are determined by comparing the proceeds from disposal with the carrying amount of the property, plant and equipment and are recognised in the income statement.
Exploration, evaluation and developmentOil and gas The successful efforts method is used to account for natural oil and gas exploration, evaluation and development activities.
Expenditures relating to dry exploratory wells are charged to the income statement when the well is identified as being dry and the costs of carrying and retaining undeveloped properties are charged to the income statement as incurred.
Property and licence acquisition costs as well as development cost, including expenditure incurred to drill and equip development wells on proved properties, are capitalised as part of assets under construction and transferred to mineral assets in property, plant and equipment when the assets begin producing.
On completion of an exploratory well or exploratory-type stratigraphic test well, the entity will be able to determine if there are oil or gas resources. The classification of resources as proved reserves depends on whether development of the property is economically feasible and recoverable in the future, under existing economic and operating conditions, and if any major capital expenditure to develop the property as a result of sufficient quantities of additional proved reserves being identified is justifiable, approved and recoverable.
The cost of exploratory wells through which potential proved reserves may be or have been discovered, and the associated exploration costs are capitalised as exploration and evaluation assets in assets under construction. These costs remain capitalised pending the evaluation of results and the determination of whether there are proved
accounting policies and financial reporting terms continued
87
Saso
l Lim
ited
com
pany
note
s to
the
fina
ncia
l sta
tem
ents
Saso
l Lim
ited
gro
up c
onso
lidat
ed fi
nanc
ial s
tate
men
tsSa
sol o
verv
iew
Business combinationsThe acquisition method is used when a business is acquired.
A business may comprise an entity, group of entities or an
unincorporated operation including its operating assets and
associated liabilities.
On acquisition date, fair values are attributed to the identifiable
assets, liabilities and contingent liabilities. A non-controlling interest
at acquisition date is measured at fair value or at its proportionate
interest in the fair value of the net identifiable assets of the entity
acquired on a transaction by transaction basis, including that
component of the non-controlling interest which has a present
ownership interest.
Fair values of all identifiable assets and liabilities included in the
business combination are determined by reference to market values
of those or similar items, where available, or by discounting expected
future cash flows using the discount rate to present values.
When an acquisition is achieved in stages (step acquisition), the
identifiable assets and liabilities are recognised at their full fair value
when control is obtained, and any adjustment to fair values related
to these assets and liabilities previously held as an equity interest is
recognised in the income statement.
When there is a change in the interest in a subsidiary after control is
obtained, that does not result in a loss in control, the difference
between the fair value of the consideration transferred and the
amount by which the non-controlling interest is adjusted is
recognised directly in the statement of changes in equity.
The consideration transferred is the fair value of the group’s
contribution to the business combination in the form of assets
transferred, shares issued, liabilities assumed or contingent
consideration at the acquisition date. Any contingent consideration
payable is recognised at fair value at the acquisition date. If the
contingent consideration is classified as equity, it is not remeasured
and settlement is accounted for within equity. Otherwise, subsequent
changes to the fair value of the contingent consideration are
recognised in the income statement. Transaction costs directly
attributable to the acquisition are charged to the income statement.
On acquisition date, goodwill is recognised when the consideration
transferred and the recognised amount of non-controlling interests
exceeds the fair value of the net identifiable assets of the entity
acquired. Acquisitions of non-controlling interests are accounted for
as transactions with owners in their capacity as owners and therefore
no goodwill is recognised as a result of these transactions. The
adjustments to non-controlling interest are based on a proportionate
amount of the net assets of the subsidiary. Goodwill is tested at each
reporting date for impairment.
To the extent that the fair value of the net identifiable assets
of the entity acquired exceeds the consideration transferred and
the recognised amount of non-controlling interests, the excess,
or bargain purchase gain, is recognised in the income statement
on acquisition date.
reserves. At each reporting date, exploration and evaluation assets are assessed for impairment. The following conditions must be met for these exploration costs to remain capitalised: • Sufficient progress is being made in assessing the oil and gas
resources, including assessing the economic and operating viability with regards to developing the property.
• It has been determined that sufficient oil and gas resources or reserves exist which are economically viable based on a range of technical and commercial considerations to justify the capital expenditure required for the completion of the well as a producing well, either individually or in conjunction with other wells.
Progress in this regard is reassessed at each reporting date and is subject to technical, commercial and management review to ensure sufficient justification for the continued capitalisation of such qualifying exploration and evaluation expenditure as an exploration and evaluation asset as part of assets under construction. If both of the above conditions are not met or if information is obtained that raises substantial doubt about the economic or operating viability, the costs are charged to the income statement.
Exploratory wells and exploratory-type stratigraphic test wells can remain suspended on the statement of financial position for several years while additional activity including studies, appraisal, drilling and/or seismic work on the potential oil and gas field is performed or while the optimum development plans and timing are established in the absence of impairment indicators.
Depreciation of mineral assets on producing oil and gas properties is based on the units-of-production method calculated using estimated proved developed reserves. Depreciation of property acquisition costs, capitalised as part of mineral assets in property, plant and equipment, is based on the units-of-production method calculated using estimated proved reserves.
Coal mining Coal mining exploration and evaluation expenditure is charged to the income statement until completion of a final feasibility study supporting proved and probable coal reserves. Expenditure incurred subsequent to proved and probable coal reserves being identified is capitalised as exploration assets in assets under construction.
Expenditure on producing mines or development properties is capitalised when excavation or drilling is incurred to extend reserves or further delineate existing proved and probable coal reserves. All development expenditure incurred after the commencement of production is capitalised to the extent that it gives rise to probable future economic benefits.
Life-of-mine coal assets are depreciated using the units-of-production method. A unit is considered to be produced once it has been removed from underground and taken to the surface, passed the bunker and has been transported by conveyor over the scale of the shaft head. The calculation is based on proved and probable reserves assigned to that specific mine (accessible reserves) or complex which benefits from the utilisation of those assets. Inaccessible reserves are excluded from the calculation. Other coal mining assets are depreciated on the straight-line method over their estimated useful lives.
88
Saso
l ann
ual fi
nanc
ial s
tate
men
ts 2
013
AFS
Sasol Limited group
The profit or loss realised on disposal or termination of an entity is calculated after taking into account the carrying amount of any related goodwill.
Other intangible assetsIntangible assets, other than goodwill (refer policy above on business combinations), are stated at cost less accumulated amortisation and impairment losses.
These intangible assets are recognised if it is probable that future economic benefits will flow to the entity from the intangible assets and the costs of the intangible assets can be reliably measured.
Intangible assets with finite useful lives are amortised on a straight-line basis over their estimated useful lives. The amortisation methods and estimated remaining useful lives are reviewed at least annually. The estimation of the useful lives of other intangible assets is based on historic performance as well as expectations about future use and therefore requires a significant degree of judgement to be applied by management. The following amortisation rates, based on the estimated useful lives of the respective assets were applied:
Software % 17 – 33
Patents and trademarks % 20
Other intangible assets % 6 – 33
Intangible assets with indefinite useful lives are not amortised but are tested at each reporting date for impairment. The assessment that the estimated useful lives of these assets are indefinite is reviewed at least annually.
Research and development Research expenditure relating to gaining new technical knowledge and understanding is charged to the income statement when incurred.
Development expenditure relating to the production of new or substantially improved products or processes is capitalised if the costs can be measured reliably, the products or processes are technically and commercially feasible, future economic benefits are probable, and the group intends to and has sufficient resources to complete development and to use or sell the asset. All remaining development expenditure is charged to the income statement.
Cost includes expenditure on materials, direct labour and an allocated proportion of project overheads.
Software Purchased software and the direct costs associated with the customisation and installation thereof are capitalised.
Expenditure on internally-developed software is capitalised if it meets the criteria for capitalising development expenditure.
Other software development expenditure is charged to the income statement when incurred.
Patents and trademarks Expenditure on purchased patents and trademarks is capitalised. Expenditure incurred to extend the term of the patents or trademarks is capitalised. All other expenditure is charged to the income statement when incurred.
Emission rights Emission rights (allowances) received from a
government or a government agency and expenditure incurred on
purchasing allowances are capitalised as indefinite life intangible
assets at the quoted market price on acquisition date and are
subject to an annual impairment test.
Non-current asset or disposal group held for saleA non-current asset or disposal group (a business grouping of assets
and their related liabilities) is designated as held for sale when its
carrying amount will be recovered principally through a sale
transaction rather than through continuing use. The classification as
held for sale of a non-current asset or disposal group occurs when it
is available for immediate sale in its present condition and the sale is
highly probable. A sale is considered highly probable if management
is committed to a plan to sell the non-current asset or disposal
group, an active divestiture programme has been initiated, the
non-current asset or disposal group is marketed at a price reasonable
to its fair value and the disposal will be completed within one year
from classification.
Where a disposal group held for sale will result in the loss of control
or joint control of a subsidiary or joint venture, all the assets and
liabilities of that subsidiary or joint venture are classified as held for
sale, regardless of whether a non-controlling interest in the former
subsidiary or joint venture is to be retained after the sale.
Proportionate consolidation ceases from the date a joint venture is
classified as held for sale.
Upon classification of a non-current asset or disposal group as held
for sale it is reviewed for impairment. The impairment loss charged to
the income statement is the excess of the carrying amount of the
non-current asset or disposal group over its expected fair value less
costs to sell.
No depreciation or amortisation is provided on non-current assets
from the date they are classified as held for sale. In addition, equity
accounting of equity-accounted investees ceases once classified as
held for sale or distribution.
If a non-current asset or disposal group is classified as held for sale,
but the criteria for classification as held for sale are no longer met,
the disclosure of such non-current asset or disposal group as held for
sale is ceased.
On ceasing such classification, the non-current assets are reflected at
the lower of:
• the carrying amount before classification as held for sale
adjusted for any depreciation or amortisation that would have
been recognised had the assets not been classified as held for
sale; or • the recoverable amount at the date the classification as held for
sale ceases. The recoverable amount is the amount at which the
asset would have been recognised after the allocation of any
impairment loss arising on the cash generating unit as determined
in accordance with the group’s policy on impairment of
non-financial assets.
accounting policies and financial reporting terms continued
89
Saso
l Lim
ited
com
pany
note
s to
the
fina
ncia
l sta
tem
ents
Saso
l Lim
ited
gro
up c
onso
lidat
ed fi
nanc
ial s
tate
men
tsSa
sol o
verv
iew
Financial assetsThe group classifies its financial assets into the following categories:
• held-to-maturity financial assets;
• loans and receivables;
• available-for-sale financial assets;
• financial assets at fair value through profit or loss; and • derivative instruments (set out below).
The classification is dependent on the purpose for which the financial
asset is acquired. Management determines the classification of its
financial assets at the time of the initial recognition and re-evaluates
such designation at least at each reporting date, except for those
financial assets at fair value through profit or loss, where this
designation is made on initial recognition and is irrevocable.
Financial assets held for trading are classified at fair value through
profit or loss. The group manages these investments and makes
purchase and sale decisions based on their fair value. Attributable
transaction costs are recognised in the income statement as incurred.
Financial assets at fair value through profit or loss are stated initially
at transaction date at fair value and subsequent changes therein,
which takes into account any dividend or interest income, are
charged to the income statement.
Financial assets are recognised on transaction date when the group
becomes a party to the contracts and thus obtains rights to receive
economic benefits and are derecognised when these rights expire or
are transferred.
Financial assets, with the exception of those held at fair value
through profit or loss, are stated initially on transaction date at fair
value including transaction costs. Held-to-maturity financial assets
and loans and receivables are subsequently stated at amortised cost
using the effective interest rate method, less impairment losses.
Available-for-sale financial assets are subsequently stated at fair value
at the reporting date.
Unrealised gains and losses arising from revaluation of available-for-
sale financial assets are recognised as other comprehensive income
and included in the investment fair value reserve. On disposal or
impairment of available-for-sale financial assets, cumulative
unrealised gains and losses previously recognised in other
comprehensive income are included respectively in determining the
profit or loss on disposal of, or impairment charge relating to, that
financial asset, which is recognised in the income statement.
The fair values of financial assets are based on quoted market prices
or amounts derived using a discounted cash flow model. Fair values
for unlisted equity securities are estimated using valuation
techniques reflecting the specific economic circumstances of the
investee which would affect the market value of those securities.
Equity investments for which fair values cannot be measured reliably
are recognised at cost less impairment losses.
Premiums or discounts arising from the difference between the fair
value of a financial asset and the amount receivable at maturity date
are charged to the income statement based on the effective interest
rate method.
Any adjustments required to be made on reclassification are
recognised in the income statement on reclassification, and included
in income from continuing operations.
Where the disposal group was also classified as a discontinued
operation, the subsequent classification as held for use also requires
that the discontinued operation be included in continuing operations.
Comparative information relating to the classification as a
discontinued operation is restated accordingly.
Impairment of non-financial assetsThe group’s non-financial assets, other than inventories and deferred
tax assets, are reviewed at each reporting date or whenever events or
changes in circumstances indicate that the carrying amount may not
be recoverable, to determine whether there is any indication of
impairment. An impairment test is performed on all goodwill,
intangible assets not yet in use and intangible assets with indefinite
useful lives at each reporting date.
The impairment loss charged to the income statement is the excess
of the carrying amount over the recoverable amount.
Recoverable amounts are estimated for individual assets or, where an
individual asset cannot generate cash inflows independently, the
recoverable amount is determined for the larger cash-generating unit
to which the asset belongs. The group’s corporate assets do not
generate separate cash inflows. If there is an indication that a
corporate asset may be impaired, then the recoverable amount is
determined for the cash-generating unit to which the corporate asset
belongs. For the purposes of goodwill impairment testing, cash-
generating units to which goodwill has been allocated are aggregated
so that the level at which impairment is tested reflects the lowest
level at which goodwill is monitored internally.
Impairment losses recognised in respect of a cash-generating unit
are first allocated to reduce the carrying amount of the goodwill
allocated to the unit and then to reduce the carrying amounts
of the other assets in the unit on a pro-rata basis relative to their
carrying amounts.
With the exception of goodwill, a previously recognised impairment
loss will be reversed insofar as estimates change as a result of an
event occurring after the impairment loss was recognised. An
impairment loss is reversed only to the extent that the asset’s
carrying amount does not exceed the carrying amount that would
have been determined had no impairment loss been recognised. A
reversal of an impairment loss is recognised in the income statement.
Exploration assets are tested for impairment when development of
the property commences or whenever facts and circumstances
indicate impairment. An impairment loss is recognised for the
amount by which the exploration assets’ carrying amount exceeds
their recoverable amount. For the purpose of assessing impairment,
the relevant exploration assets are included in the existing cash-
generating units of producing properties that are located in the same
geographic region.
90
Saso
l ann
ual fi
nanc
ial s
tate
men
ts 2
013
AFS
Sasol Limited group
An assessment is performed at each reporting date to determine
whether objective evidence exists that a financial asset is impaired.
Objective evidence that financial instruments are impaired includes
indications of a debtor or group of debtors experiencing significant
financial difficulty, default or delinquency of payments, the
probability of a debtor entering bankruptcy, or other observable data
indicating a measurable decrease in estimated future cash flows, such
as economic conditions that correlate with defaults. An impairment
loss in respect of a financial asset measured at amortised cost is
calculated as the difference between its carrying amount and the
present value of the estimated future cash flows discounted at the
asset’s original effective interest rate. Where a financial asset has a
variable interest rate, an impairment loss is calculated as the
difference between the carrying amount and the present value of the
estimated future cash flows discounted at the asset’s current
effective interest rate. Impairment losses are charged to the income
statement and are included in the allowance against loans and
receivables. When a subsequent event causes the impairment loss to
decrease, the impairment loss is reversed in the income statement.
Loans and receivables, together with the associated allowance, are
written off when there is no realistic prospect of future recovery. In
the case of available-for-sale financial assets, a significant or
prolonged decline in the fair value of the asset below its cost is
considered an indicator of impairment. If any such evidence exists,
the cumulative loss is removed as other comprehensive income from
the investment fair value reserve and recognised in the income
statement. Impairment losses charged to the income statement on
available-for-sale financial assets are not reversed.
Financial assets and liabilities are offset and the net amount
presented when the group has a current legal enforceable right to
offset the amounts and intends either to settle on a net basis or to
realise the asset and settle the liability simultaneously.
Financial liabilitiesFinancial liabilities are recognised on the transaction date when the
group becomes a party to a contract and thus has a contractual
obligation and are derecognised when these contractual obligations
are discharged, cancelled or expired.
Financial liabilities are stated initially on the transaction date at fair
value including transaction costs. Subsequently, they are stated at
amortised cost using the effective interest rate method.
Financial assets and liabilities are offset and the net amount
presented when the group has a current legal enforceable right to
offset the amounts and intends either to settle on a net basis or to
realise the asset and settle the liability simultaneously.
Derivative financial instruments and hedging activitiesAll derivative financial instruments are initially recognised at fair
value and are subsequently stated at fair value at the reporting date.
Attributable transaction costs are recognised in the income
statement when incurred. Resulting gains or losses on derivative
instruments, excluding designated and effective hedging instruments,
are recognised in the income statement.
The group is exposed to market risks from changes in interest rates,
foreign exchange rates and commodity prices. The group uses
derivative instruments to hedge its exposure to these risks. To the
extent that a derivative instrument has a maturity period of longer
than one year, the fair value of these instruments will be reflected as
a non-current asset or liability.
The group’s criteria for a derivative instrument to be designated as a
hedging instrument at the inception of the transaction require that:
• the hedge transaction is expected to be highly effective in
achieving offsetting changes in fair value or cash flows
attributable to the hedged risk;
• the effectiveness of the hedge can be reliably measured
throughout the duration of the hedge;
• there is adequate documentation of the hedging relationship at
the inception of the hedge; and • for cash flow hedges, the forecast transaction that is the subject
of the hedge must be highly probable.
Where a derivative instrument is designated as a cash flow hedge of
an asset, liability or highly probable forecast transaction that could
affect the income statement, the effective part of any gain or loss
arising on the derivative instrument is recognised as other
comprehensive income and is classified as a cash flow hedge
accounting reserve until the underlying transaction occurs. The
ineffective part of any gain or loss is recognised in the income
statement. If the hedging instrument no longer meets the criteria
for cash flow hedge accounting, expires or is sold, terminated,
exercised, or the designation is revoked, then hedge accounting is
discontinued prospectively.
If the forecast transaction results in the recognition of a non-financial
asset or non-financial liability, the associated gain or loss is transferred
from the cash flow hedge accounting reserve, as other comprehensive
income, to the underlying asset or liability on the transaction date. If
the forecast transaction is no longer expected to occur, then the
cumulative balance in other comprehensive income is recognised
immediately in the income statement as reclassification adjustments.
Other cash flow hedge gains or losses are recognised in the income
statement at the same time as the hedged transaction occurs.
When derivative instruments, including forward exchange contracts,
are entered into as fair value hedges, no hedge accounting is
applied. All gains and losses on fair value hedges are recognised
in the income statement.
InventoriesInventories are stated at the lower of cost and net realisable value.
Cost includes expenditure incurred in acquiring, manufacturing and
transporting the inventory to its present location. Manufacturing
costs include an allocated portion of production overheads which are
directly attributable to the cost of manufacturing such inventory. The
allocation is determined based on the greater of normal production
capacity and actual production. The costs attributable to any
inefficiencies in the production process are charged to the income
statement as incurred.
accounting policies and financial reporting terms continued

91
Saso
l Lim
ited
com
pany
note
s to
the
fina
ncia
l sta
tem
ents
Saso
l Lim
ited
gro
up c
onso
lidat
ed fi
nanc
ial s
tate
men
tsSa
sol o
verv
iew
an unconditional right to defer settlement of the liability for at least 12 months after the reporting date. Debt is derecognised when the obligation in the contract is discharged, cancelled or has expired. Premiums or discounts arising from the difference between the fair value of debt raised and the amount repayable at maturity date are charged to the income statement as finance expenses based on the effective interest rate method.
LeasesFinance leases Leases where the group assumes substantially all the benefits and risks of ownership, are classified as finance leases. Finance leases are capitalised as property, plant and equipment at the lower of fair value or the present value of the minimum lease payments at the inception of the lease with an equivalent amount being stated as a finance lease liability as part of debt.
The capitalised amount is depreciated over the shorter of the lease term and asset’s useful life unless it is reasonably certain that the group will obtain ownership by the end of the lease term. Lease payments are allocated between capital repayments and finance expenses using the effective interest rate method.
Operating leases Leases of assets under which all the risks and benefits of ownership are effectively retained by the lessor are classified as operating leases. Lease payments under an operating lease are charged to the income statement over the lease term on a straight-line basis unless another basis is more representative of the pattern of use.
The land and the buildings elements of a lease are considered separately for the purpose of lease classification as a finance or an operating lease.
ProvisionsA provision is recognised when the group has a present legal or constructive obligation arising from a past event that will probably be settled, and a reliable estimate of the amount can be made.
Long-term provisions are determined by discounting the expected future cash flows to their present value. The increase in discounted long-term provisions as a result of the passage of time is recognised as a finance expense in the income statement.
Environmental rehabilitation provisions Estimated long-term environmental provisions, comprising pollution control, rehabilitation and mine closure, are based on the group’s environmental policy taking into account current technological, environmental and regulatory requirements. The provision for rehabilitation is recognised as and when the environmental liability arises. To the extent that the obligations relate to the construction of an asset, they are capitalised as part of the cost of those assets. The effect of subsequent changes to assumptions in estimating an obligation for which the provision was recognised as part of the cost of the asset is adjusted against the asset. Any subsequent changes to an obligation which did not relate to the initial construction of a related asset are charged to the income statement.
Decommissioning costs of plant and equipment The estimated present value of future decommissioning costs, taking into account current environmental and regulatory requirements, is capitalised as
Cost is determined as follows:
Crude oil and other raw materials First-in-first-out valuation method (FIFO)
Process, maintenance and other materials
Weighted average purchase price
Work-in-progress Manufacturing costs incurred
Manufactured products including consignment inventory
Manufacturing costs according to FIFO
Net realisable value is the estimated selling price in the ordinary course of business, less the cost of completion and selling expenses.
Trade and other receivablesTrade and other receivables are recognised initially at fair value and subsequently stated at amortised cost using the effective interest rate method, less impairment losses. An impairment loss is recognised when it is probable that an entity will not be able to collect all amounts due according to the original terms of the receivable. The amount of the impairment loss is charged to the income statement.
Cash and cash equivalentsCash and cash equivalents are stated at carrying amount which is deemed to be fair value. Bank overdrafts are offset against cash and cash equivalents in the statement of cash flows.
Cash restricted for useCash which is subject to restrictions on its use is stated separately at carrying amount in the statement of financial position.
Share capitalIssued share capital is stated in the statement of changes in equity at the amount of the proceeds received less directly attributable issue costs.
Share repurchase programmeWhen Sasol Limited’s shares are repurchased by a subsidiary, the amount of consideration paid, including directly attributable costs, is recognised as a deduction from shareholders’ equity. Repurchased shares are classified as treasury shares and are disclosed as a deduction from total equity. Where such shares are subsequently reissued, any consideration received is included in the statement of changes in equity. The resultant gain or loss on the transaction is transferred to or from retained earnings.
Preference sharesPreference shares are classified as liabilities if they are redeemable on a specific date or at the option of the shareholders, or if dividend payments are not discretionary. Dividends thereon are charged to the income statement as a finance expense based on the effective interest rate method.
DebtDebt, which constitutes a financial liability, includes short-term and long-term debt. Debt is initially recognised at fair value, net of transaction costs incurred and is subsequently stated at amortised cost. Debt is classified as short-term unless the borrowing entity has
92
Saso
l ann
ual fi
nanc
ial s
tate
men
ts 2
013
AFS
Sasol Limited group
part of property, plant and equipment, to the extent that they relate
to the construction of the asset, and the related provisions are raised.
These estimates are reviewed at least annually. The effect of
subsequent changes to assumptions in estimating an obligation for
which the provision was recognised as part of the cost of the asset is
adjusted against the asset. Any subsequent changes to an obligation
which did not relate to the initial construction of a related asset are
charged to the income statement.
Ongoing rehabilitation expenditure Such expenditure is charged to
the income statement.
Employee benefitsEmployee benefits Remuneration of employees is charged to the
income statement. Short-term employee benefits are those that are
expected to be settled completely within 12 months after the end of
the reporting period in which the services have been rendered.
Short-term employee benefit obligations are measured on an
undiscounted basis and are charged to the income statement as the
related service is provided. Long-term employee benefits are those
benefits that are expected to be settled more than 12 months after
the end of the reporting period, in which the services have been
rendered and are discounted to their present value. An accrual is
recognised for accumulated leave, incentive bonuses and other
employee benefits when the group has a present legal or constructive
obligation as a result of past service provided by the employee, and a
reliable estimate of the amount can be made.
Pension benefits The group operates or contributes to defined
contribution pension plans and defined benefit pension plans for its
employees in certain of the countries in which it operates. These
plans are generally funded through payments to trustee-administered
funds as determined by annual actuarial calculations.
Defined contribution pension plans Such plans are plans under
which the group pays fixed contributions into a separate legal entity
and has no legal or constructive obligation to pay further amounts.
Contributions to defined contribution pension plans are charged to
the income statement as an employee expense in the period in which
related services are rendered by the employee. Contributions that are
expected to be wholly settled more than 12 months after the end of
the reporting period, in which the employee renders the service, are
discounted to their present value.
Defined benefit pension plans The group’s net obligation in respect
of defined benefit pension plans is actuarially calculated separately
for each plan by deducting the fair value of plan assets from the
gross obligation for post-retirement benefits. The gross obligation is
determined by estimating the future benefit attributable to
employees in return for services rendered to date.
This future benefit is discounted to determine its present value, using
discount rates based on government bonds, that have maturity dates
approximating the terms of the group’s obligations and which are
denominated in the currency in which the benefits are expected to
be paid. Independent actuaries perform this calculation annually
using the projected unit credit method.
Past service costs are charged to the income statement at the earlier of the following dates: • when the plan amendment or curtailment occurs; and • when the group recognises related restructuring costs or
termination benefits.
Actuarial gains and losses arising from experience adjustments and changes to actuarial assumptions, the return on plan assets (excluding amounts included in net interest on the defined benefit liability (asset)) and any changes in the effect of the asset ceiling (excluding amounts included in net interest on the defined benefit liability (asset)) are recognised in other comprehensive income in the period in which they arise.
Where the plan assets exceed the gross obligation, the asset recognised is limited to the lower of the surplus in the defined benefit plan and the asset ceiling determined using a discount rate, representing the present value of any future refunds from the plan or reductions in future contributions to the plan.
Surpluses and deficits in the various plans are not offset.
Defined benefit post-retirement healthcare benefits The group provides post-retirement healthcare benefits to certain of its retirees. The entitlement of these benefits is usually based on the employee remaining in service up to retirement age and the completion of a minimum service period. The expected costs of these benefits are accrued on a systematic basis over the expected remaining period of employment, using the accounting methodology described in respect of defined benefit pension plans above. Independent actuaries perform the calculation of this obligation annually.
Share-based payments The group has equity-settled and cash-settled share-based compensation plans. The equity-settled schemes allow certain employees the option to acquire ordinary shares in Sasol Limited over a prescribed period. Such equity-settled share-based payments are measured at fair value at the date of the grant. The fair value determined at the grant date of the equity-settled share-based payments is charged as employee costs, with a corresponding increase in equity, on a straight-line basis over the period that the employees become unconditionally entitled to the options, based on management’s estimate of the shares that will vest and adjusted for the effect of non market-based vesting conditions. These share options are not subsequently revalued.
The cash-settled schemes allow certain senior employees the right to participate in the performance of the Sasol Limited share price, in return for services rendered, through the payment of cash incentives which are based on the market price of the Sasol Limited share. These rights are recognised as a liability at fair value, at each reporting date, in the statement of financial position until the date of settlement. The fair value of these rights is determined at each reporting date and the unrecognised cost is amortised to the income statement as employee costs over the period that the employees provide services to the company.
Fair value is measured using the Black-Scholes, Binomial tree and Monte-Carlo option pricing models where applicable. The expected life used in the models has been adjusted, based on management’s best estimate, for the effects of non-transferability, exercise
accounting policies and financial reporting terms continued
93
Saso
l Lim
ited
com
pany
note
s to
the
fina
ncia
l sta
tem
ents
Saso
l Lim
ited
gro
up c
onso
lidat
ed fi
nanc
ial s
tate
men
tsSa
sol o
verv
iew
nor taxable profit is affected on acquisition; and • investments in subsidiaries to the extent they will probably
not reverse in the foreseeable future.
The provision for deferred tax is calculated using enacted or substantively enacted tax rates at the reporting date that are expected to apply when the asset is realised or liability settled. A deferred tax asset is recognised to the extent that it is probable that future taxable profits will be available against which the deferred tax asset can be realised.
The provision of deferred tax assets and liabilities reflects the tax consequences that would follow from the expected recovery or settlement of the carrying amount of its assets and liabilities.
Deferred tax assets and liabilities are offset when the related income taxes are levied by the same taxation authority, there is a legally enforceable right to offset and there is an intention to settle the balances on a net basis.
Dividend withholding tax Dividend withholding tax is payable at a rate of 15% on dividends distributed to shareholders. This tax is not attributable to the company paying the dividend but is collected by the company and paid to the tax authorities on behalf of the shareholder. On receipt of a dividend, the dividend withholding tax is recognised as part of the current tax charge in the income statement in the period in which the dividend is received.
Trade and other payablesTrade and other payables are initially recognised at fair value and subsequently stated at amortised cost.
RevenueRevenue is recognised at the fair value of the consideration received or receivable net of indirect taxes, rebates and trade discounts and consists primarily of the sale of products, services rendered, licence fees, royalties, dividends received and interest received.
Revenue is recognised when the following criteria are met: • evidence of an arrangement exists; • delivery has occurred or services have been rendered and the
significant risks and rewards of ownership have been transferred to the purchaser;
• transaction costs can be reliably measured; • the selling price is fixed or determinable; and • collectability is reasonably assured.
The timing of revenue recognition is as follows. Revenue from: • the sale of products is recognised when the group no longer
retains continuing managerial involvement associated with ownership or effective control;
• services rendered is based on the stage of completion of the transaction, based on the proportion that costs incurred to date bear to the total cost of the project;
• licence fees and royalties is recognised on an accrual basis; • dividends received is recognised when the right to receive
payment is established; and • interest received is recognised on a time proportion basis using
the effective interest rate method.
restrictions and behavioural considerations such as volatility, dividend yield and the vesting period. The fair value takes into account the terms and conditions on which these incentives are granted and the extent to which the employees have rendered service to the reporting date.
Termination benefits Termination benefits are recognised as a liability when the group is demonstrably committed, without realistic possibility of withdrawal, to a formal detailed plan to either terminate employment before normal retirement date, or to provide termination benefits as a result of an offer made to encourage voluntary redundancy. In the case of an offer to encourage voluntary redundancy, the termination benefits are measured based on the number of employees expected to accept the offer. Benefits that are expected to be wholly settled more than 12 months after the end of the reporting period are discounted to their present value.
Deferred incomeIncentives received are recognised on a systematic basis in the income statement over the periods necessary to match them with the related costs which they are intended to compensate. Incentives related to non-current assets are stated on the statement of financial position as deferred income and are charged to the income statement on a basis representative of the pattern of use of the asset to which the incentive relates.
Revenue received prior to delivery occurring or the service being rendered is stated on the statement of financial position as deferred income and is recognised in the income statement when the revenue recognition criteria, detailed below, are met.
Black economic empowerment (BEE) transactionsTo the extent that an entity grants shares or share options in a BEE transaction and the fair value of the cash and other assets received is less than the fair value of the shares or share options granted, such difference is charged to the income statement in the period in which the transaction becomes effective. Where the BEE transaction includes service conditions the difference will be charged to the income statement over the period of these service conditions. A restriction on the transfer of the shares or share options is taken into account in determining the fair value of the share or share option.
TaxationThe income tax charge is determined based on net income before tax for the year and includes deferred tax and dividend withholding tax.
Current tax The current tax charge is the calculated tax payable on the taxable income for the year using enacted or substantively enacted tax rates and any adjustments to tax payable in respect of prior years.
Deferred tax Deferred tax is provided for using the liability method, on all temporary differences between the carrying amount of assets and liabilities for accounting purposes and the amounts used for tax purposes and on any tax losses. No deferred tax is provided on temporary differences relating to: • the initial recognition of goodwill; • the initial recognition (other than in a business combination)
of an asset or liability to the extent that neither accounting
94
Saso
l ann
ual fi
nanc
ial s
tate
men
ts 2
013
AFS
Sasol Limited group
The group enters into exchange agreements with the same
counterparties for the purchase and sale of inventory that are entered
into in contemplation of one another. When the items exchanged are
similar in nature, these transactions are combined and accounted for
as a single exchange transaction. The exchange is recognised at the
carrying amount of the inventory transferred.
Further descriptions of the recognition of revenue for the various
reporting segments are included under the accounting policy on
segmental reporting.
Construction contractsWhen the outcome of a construction contract can be estimated
reliably, contract revenue and contract costs associated with that
construction contract are recognised as revenue and expenses,
respectively, by reference to the stage of completion of the contract
activity at the reporting date. The stage of completion is generally
based on physical progress, man-hours or costs incurred, based on
the appropriate method for the type of contract.
To the extent that the outcome of a construction contract cannot be
reliably measured, revenue is recognised only to the extent that
contract costs incurred are likely to be recovered.
Any expected loss on a construction contract is charged immediately
to the income statement.
Contract costs relating to future activity on a contract are recognised
as an asset provided it is likely that they will be recovered.
Finance expensesFinance expenses are capitalised against qualifying assets as part of
property, plant and equipment.
Such finance expenses are capitalised over the period during which
the qualifying asset is being acquired or constructed and borrowings
have been incurred. Capitalisation ceases when construction is
interrupted for an extended period or when the qualifying asset is
substantially complete. Further finance expenses are charged to the
income statement.
Where funds are borrowed specifically for the purpose of acquiring or
constructing a qualifying asset, the amount of finance expenses
eligible for capitalisation on that asset is the actual finance expenses
incurred on the borrowing during the period less any investment
income on the temporary investment of those borrowings.
Where funds are made available from general borrowings and
used for the purpose of acquiring or constructing qualifying assets,
the amount of finance expenses eligible for capitalisation is
determined by applying a capitalisation rate to the expenditures
on these assets. The capitalisation rate is the weighted average
of the interest rates applicable to the borrowings of the group
that are outstanding during the period, other than borrowings
made specifically for the purpose of obtaining qualifying assets.
The amount of finance expenses capitalised will not exceed the
amount of borrowing costs incurred.
Dividends payableDividends payable and the related taxation thereon are recognised as
a liability in the period in which they are declared.
Segment informationReporting segmentsThe group has nine main reportable segments that comprise the
structure used by the group executive committee (GEC) to make key
operating decisions and assess performance. The group’s reportable
segments are operating segments that are differentiated by the
activities that each undertakes and the products they manufacture
and market (referred to as business segments). Each business utilises
different technology, manufacturing and marketing strategies.
The group evaluates the performance of its reportable segments
based on operating profit after remeasurement items. The group
accounts for inter-segment sales and transfers as if the sales and
transfers were entered into under the same terms and conditions as
would have been entered into in a market related transaction.
The financial information of the group’s reportable segments is
reported to the GEC for purposes of making decisions about
allocating resources to the segment and assessing its performance.
The group has formed significant joint ventures to promote Sasol
technology and products internationally. The group is promoting and
marketing its gas-to-liquids (GTL) technology for converting remote
or flared natural gas into new-generation, low-emission GTL diesel,
GTL naphtha and other products. It is envisaged that Sasol Synfuels
International (SSI) through the recent development of the GTL plants
in Qatar and Nigeria will contribute to the growing of a global GTL
business in the future.
Whilst Sasol Petroleum International (SPI), like SSI, does not meet the
quantitative criteria for disclosure as a separate segment, it is
expected to become a significant contributor to the group’s
performance in future years as the upstream supplier of resources
for the group’s GTL activities.
Consequently, the GEC has chosen to include SSI and SPI as
reportable operating segments even though SSI and SPI do
not meet any of the quantitative thresholds as the GEC believes
that such information would be useful to the users of the
financial statements.
South African energy clusterSasol MiningSasol Mining’s activities include the mining and supply of coal
to other segments including Sasol Synfuels, other entities and
to third parties.
Sasol Mining sells coal under both long-term and short-term
contracts at a price determinable from the agreements. Turnover
is recognised upon delivery of the coal to the customer, which,
in accordance with the related contract terms is the point at
which the title and risks and rewards of ownership pass to the
customer, prices are fixed or determinable and collectability is
reasonably assured.
accounting policies and financial reporting terms continued
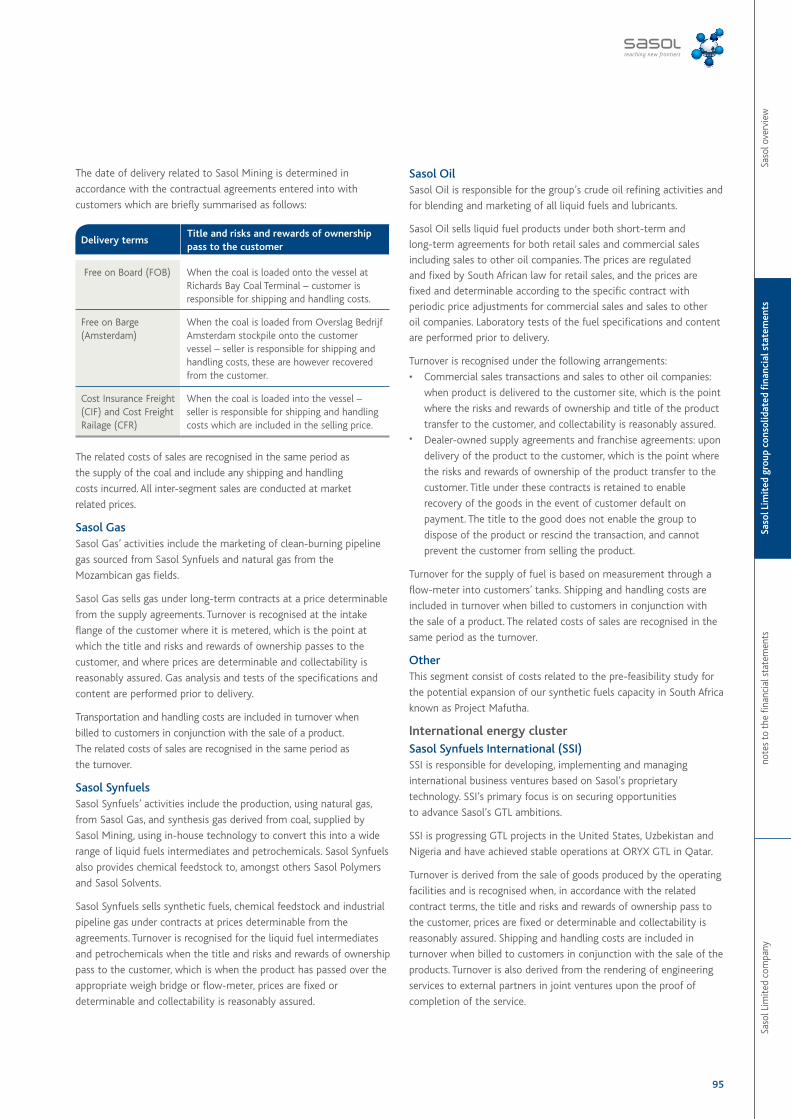
95
Saso
l Lim
ited
com
pany
note
s to
the
fina
ncia
l sta
tem
ents
Saso
l Lim
ited
gro
up c
onso
lidat
ed fi
nanc
ial s
tate
men
tsSa
sol o
verv
iew
SasolOilSasol Oil is responsible for the group’s crude oil refining activities and
for blending and marketing of all liquid fuels and lubricants.
Sasol Oil sells liquid fuel products under both short-term and
long-term agreements for both retail sales and commercial sales
including sales to other oil companies. The prices are regulated
and fixed by South African law for retail sales, and the prices are
fixed and determinable according to the specific contract with
periodic price adjustments for commercial sales and sales to other
oil companies. Laboratory tests of the fuel specifications and content
are performed prior to delivery.
Turnover is recognised under the following arrangements:
• Commercial sales transactions and sales to other oil companies:
when product is delivered to the customer site, which is the point
where the risks and rewards of ownership and title of the product
transfer to the customer, and collectability is reasonably assured. • Dealer-owned supply agreements and franchise agreements: upon
delivery of the product to the customer, which is the point where
the risks and rewards of ownership of the product transfer to the
customer. Title under these contracts is retained to enable
recovery of the goods in the event of customer default on
payment. The title to the good does not enable the group to
dispose of the product or rescind the transaction, and cannot
prevent the customer from selling the product.
Turnover for the supply of fuel is based on measurement through a
flow-meter into customers’ tanks. Shipping and handling costs are
included in turnover when billed to customers in conjunction with
the sale of a product. The related costs of sales are recognised in the
same period as the turnover.
OtherThis segment consist of costs related to the pre-feasibility study for
the potential expansion of our synthetic fuels capacity in South Africa
known as Project Mafutha.
International energy clusterSasol Synfuels International (SSI)SSI is responsible for developing, implementing and managing
international business ventures based on Sasol’s proprietary
technology. SSI’s primary focus is on securing opportunities
to advance Sasol’s GTL ambitions.
SSI is progressing GTL projects in the United States, Uzbekistan and
Nigeria and have achieved stable operations at ORYX GTL in Qatar.
Turnover is derived from the sale of goods produced by the operating
facilities and is recognised when, in accordance with the related
contract terms, the title and risks and rewards of ownership pass to
the customer, prices are fixed or determinable and collectability is
reasonably assured. Shipping and handling costs are included in
turnover when billed to customers in conjunction with the sale of the
products. Turnover is also derived from the rendering of engineering
services to external partners in joint ventures upon the proof of
completion of the service.
The date of delivery related to Sasol Mining is determined in
accordance with the contractual agreements entered into with
customers which are briefly summarised as follows:
Delivery termsTitle and risks and rewards of ownership pass to the customer
Free on Board (FOB) When the coal is loaded onto the vessel at Richards Bay Coal Terminal – customer is responsible for shipping and handling costs.
Free on Barge (Amsterdam)
When the coal is loaded from Overslag Bedrijf Amsterdam stockpile onto the customer vessel – seller is responsible for shipping and handling costs, these are however recovered from the customer.
Cost Insurance Freight (CIF) and Cost Freight Railage (CFR)
When the coal is loaded into the vessel – seller is responsible for shipping and handling costs which are included in the selling price.
The related costs of sales are recognised in the same period as
the supply of the coal and include any shipping and handling
costs incurred. All inter-segment sales are conducted at market
related prices.
Sasol GasSasol Gas’ activities include the marketing of clean-burning pipeline
gas sourced from Sasol Synfuels and natural gas from the
Mozambican gas fields.
Sasol Gas sells gas under long-term contracts at a price determinable
from the supply agreements. Turnover is recognised at the intake
flange of the customer where it is metered, which is the point at
which the title and risks and rewards of ownership passes to the
customer, and where prices are determinable and collectability is
reasonably assured. Gas analysis and tests of the specifications and
content are performed prior to delivery.
Transportation and handling costs are included in turnover when
billed to customers in conjunction with the sale of a product.
The related costs of sales are recognised in the same period as
the turnover.
Sasol SynfuelsSasol Synfuels’ activities include the production, using natural gas,
from Sasol Gas, and synthesis gas derived from coal, supplied by
Sasol Mining, using in-house technology to convert this into a wide
range of liquid fuels intermediates and petrochemicals. Sasol Synfuels
also provides chemical feedstock to, amongst others Sasol Polymers
and Sasol Solvents.
Sasol Synfuels sells synthetic fuels, chemical feedstock and industrial
pipeline gas under contracts at prices determinable from the
agreements. Turnover is recognised for the liquid fuel intermediates
and petrochemicals when the title and risks and rewards of ownership
pass to the customer, which is when the product has passed over the
appropriate weigh bridge or flow-meter, prices are fixed or
determinable and collectability is reasonably assured.
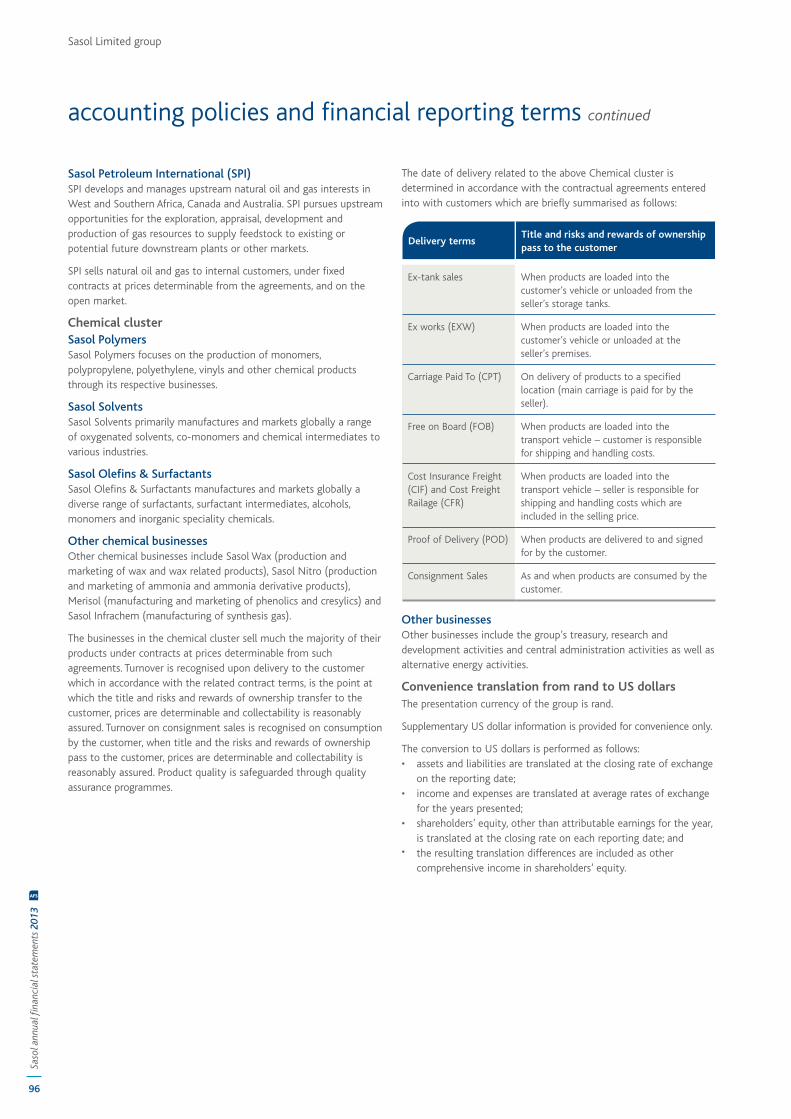
Sasol Limited group
96
Saso
l ann
ual fi
nanc
ial s
tate
men
ts 2
013
AFS
accounting policies and financial reporting terms continued
Sasol Petroleum International (SPI)SPI develops and manages upstream natural oil and gas interests in West and Southern Africa, Canada and Australia. SPI pursues upstream opportunities for the exploration, appraisal, development and production of gas resources to supply feedstock to existing or potential future downstream plants or other markets.
SPI sells natural oil and gas to internal customers, under fixed contracts at prices determinable from the agreements, and on the open market.
Chemical clusterSasol PolymersSasol Polymers focuses on the production of monomers, polypropylene, polyethylene, vinyls and other chemical products through its respective businesses.
Sasol SolventsSasol Solvents primarily manufactures and markets globally a range of oxygenated solvents, co-monomers and chemical intermediates to various industries.
SasolOlefins&SurfactantsSasol Olefins & Surfactants manufactures and markets globally a diverse range of surfactants, surfactant intermediates, alcohols, monomers and inorganic speciality chemicals.
OtherchemicalbusinessesOther chemical businesses include Sasol Wax (production and marketing of wax and wax related products), Sasol Nitro (production and marketing of ammonia and ammonia derivative products), Merisol (manufacturing and marketing of phenolics and cresylics) and Sasol Infrachem (manufacturing of synthesis gas).
The businesses in the chemical cluster sell much the majority of their products under contracts at prices determinable from such agreements. Turnover is recognised upon delivery to the customer which in accordance with the related contract terms, is the point at which the title and risks and rewards of ownership transfer to the customer, prices are determinable and collectability is reasonably assured. Turnover on consignment sales is recognised on consumption by the customer, when title and the risks and rewards of ownership pass to the customer, prices are determinable and collectability is reasonably assured. Product quality is safeguarded through quality assurance programmes.
The date of delivery related to the above Chemical cluster is determined in accordance with the contractual agreements entered into with customers which are briefly summarised as follows:
Delivery termsTitle and risks and rewards of ownership pass to the customer
Ex-tank sales When products are loaded into the customer’s vehicle or unloaded from the seller’s storage tanks.
Ex works (EXW) When products are loaded into the customer’s vehicle or unloaded at the seller’s premises.
Carriage Paid To (CPT) On delivery of products to a specified location (main carriage is paid for by the seller).
Free on Board (FOB) When products are loaded into the transport vehicle – customer is responsible for shipping and handling costs.
Cost Insurance Freight (CIF) and Cost Freight Railage (CFR)
When products are loaded into the transport vehicle – seller is responsible for shipping and handling costs which are included in the selling price.
Proof of Delivery (POD) When products are delivered to and signed for by the customer.
Consignment Sales As and when products are consumed by the customer.
OtherbusinessesOther businesses include the group’s treasury, research and development activities and central administration activities as well as alternative energy activities.
Convenience translation from rand to US dollarsThe presentation currency of the group is rand.
Supplementary US dollar information is provided for convenience only.
The conversion to US dollars is performed as follows: • assets and liabilities are translated at the closing rate of exchange
on the reporting date; • income and expenses are translated at average rates of exchange
for the years presented; • shareholders’ equity, other than attributable earnings for the year,
is translated at the closing rate on each reporting date; and • the resulting translation differences are included as other
comprehensive income in shareholders’ equity.
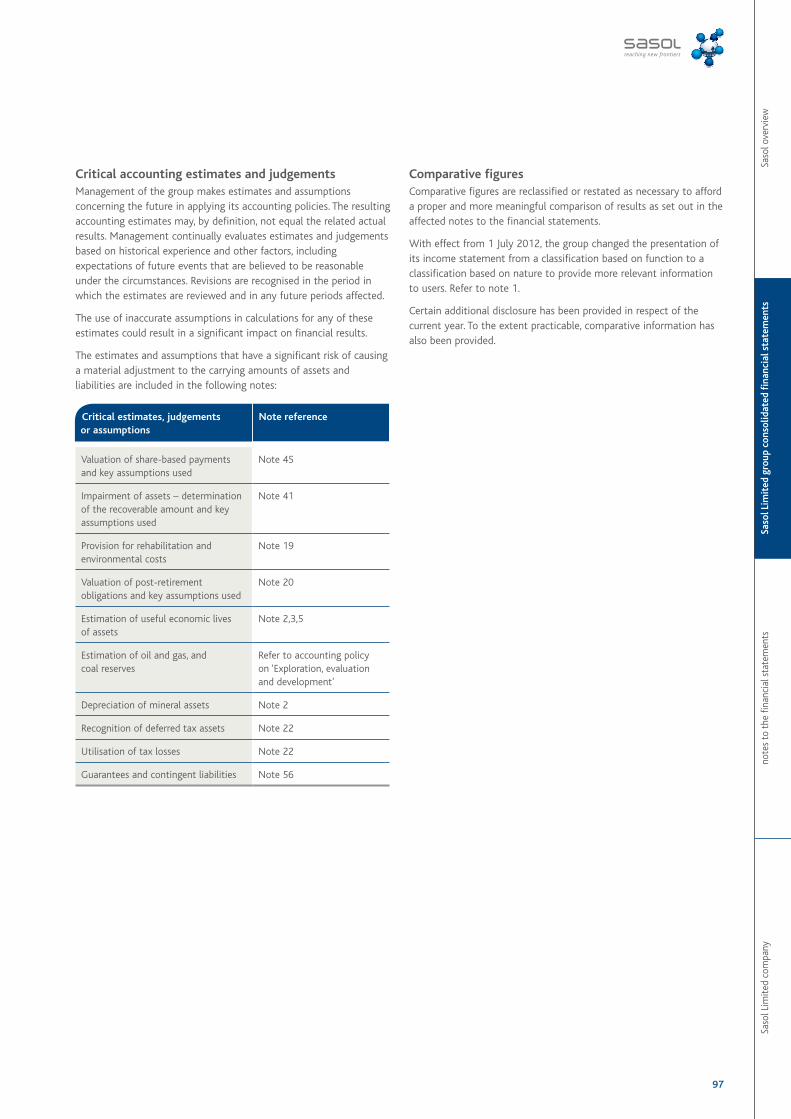
97
Saso
l Lim
ited
com
pany
note
s to
the
fina
ncia
l sta
tem
ents
Saso
l Lim
ited
gro
up c
onso
lidat
ed fi
nanc
ial s
tate
men
tsSa
sol o
verv
iew
Critical accounting estimates and judgementsManagement of the group makes estimates and assumptions concerning the future in applying its accounting policies. The resulting accounting estimates may, by definition, not equal the related actual results. Management continually evaluates estimates and judgements based on historical experience and other factors, including expectations of future events that are believed to be reasonable under the circumstances. Revisions are recognised in the period in which the estimates are reviewed and in any future periods affected.
The use of inaccurate assumptions in calculations for any of these estimates could result in a significant impact on financial results.
The estimates and assumptions that have a significant risk of causing a material adjustment to the carrying amounts of assets and liabilities are included in the following notes:
Critical estimates, judgements or assumptions
Note reference
Valuation of share-based payments and key assumptions used
Note 45
Impairment of assets – determination of the recoverable amount and key assumptions used
Note 41
Provision for rehabilitation and environmental costs
Note 19
Valuation of post-retirement obligations and key assumptions used
Note 20
Estimation of useful economic lives of assets
Note 2,3,5
Estimation of oil and gas, and coal reserves
Refer to accounting policy on ‘Exploration, evaluation and development’
Depreciation of mineral assets Note 2
Recognition of deferred tax assets Note 22
Utilisation of tax losses Note 22
Guarantees and contingent liabilities Note 56
Comparative figuresComparative figures are reclassified or restated as necessary to afford a proper and more meaningful comparison of results as set out in the affected notes to the financial statements.
With effect from 1 July 2012, the group changed the presentation of its income statement from a classification based on function to a classification based on nature to provide more relevant information to users. Refer to note 1.
Certain additional disclosure has been provided in respect of the current year. To the extent practicable, comparative information has also been provided.
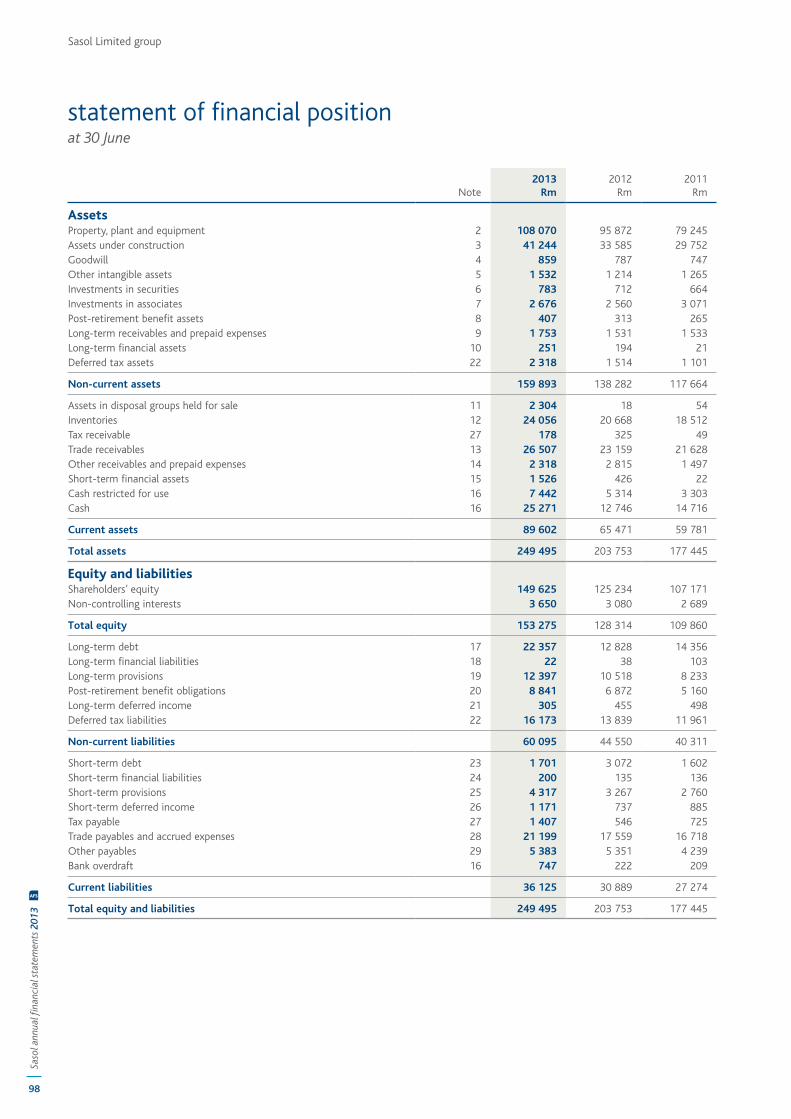
Sasol Limited group
98
Saso
l ann
ual fi
nanc
ial s
tate
men
ts 2
013
AFS
statement of financial positionat 30 June
Note 2013
Rm2012
Rm2011
Rm
AssetsProperty, plant and equipment 2 108 070 95 872 79 245 Assets under construction 3 41 244 33 585 29 752 Goodwill 4 859 787 747 Other intangible assets 5 1 532 1 214 1 265 Investments in securities 6 783 712 664 Investments in associates 7 2 676 2 560 3 071 Post-retirement benefit assets 8 407 313 265 Long-term receivables and prepaid expenses 9 1 753 1 531 1 533 Long-term financial assets 10 251 194 21 Deferred tax assets 22 2 318 1 514 1 101
Non-current assets 159 893 138 282 117 664
Assets in disposal groups held for sale 11 2 304 18 54 Inventories 12 24 056 20 668 18 512 Tax receivable 27 178 325 49 Trade receivables 13 26 507 23 159 21 628 Other receivables and prepaid expenses 14 2 318 2 815 1 497 Short-term financial assets 15 1 526 426 22 Cash restricted for use 16 7 442 5 314 3 303 Cash 16 25 271 12 746 14 716
Current assets 89 602 65 471 59 781
Total assets 249 495 203 753 177 445
Equity and liabilitiesShareholders’ equity 149 625 125 234 107 171 Non-controlling interests 3 650 3 080 2 689
Total equity 153 275 128 314 109 860
Long-term debt 17 22 357 12 828 14 356 Long-term financial liabilities 18 22 38 103 Long-term provisions 19 12 397 10 518 8 233 Post-retirement benefit obligations 20 8 841 6 872 5 160 Long-term deferred income 21 305 455 498 Deferred tax liabilities 22 16 173 13 839 11 961
Non-current liabilities 60 095 44 550 40 311
Short-term debt 23 1 701 3 072 1 602 Short-term financial liabilities 24 200 135 136 Short-term provisions 25 4 317 3 267 2 760 Short-term deferred income 26 1 171 737 885 Tax payable 27 1 407 546 725 Trade payables and accrued expenses 28 21 199 17 559 16 718 Other payables 29 5 383 5 351 4 239 Bank overdraft 16 747 222 209
Current liabilities 36 125 30 889 27 274
Total equity and liabilities 249 495 203 753 177 445
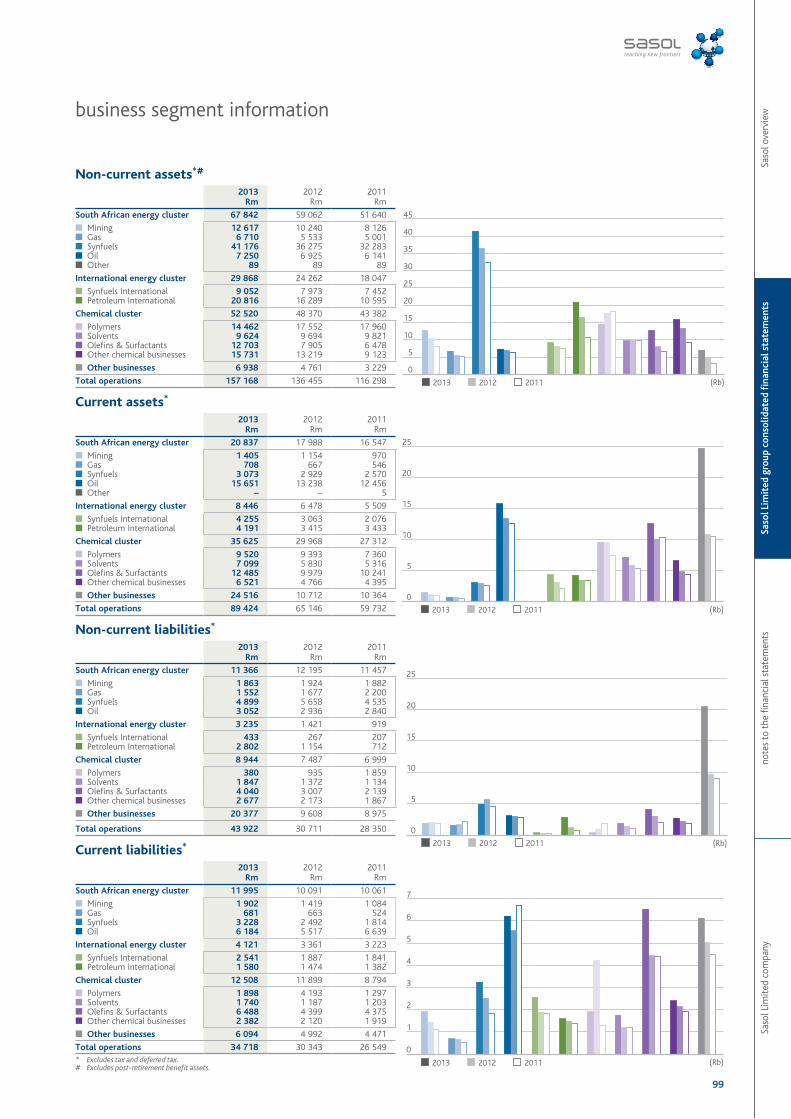
Saso
l Lim
ited
com
pany
note
s to
the
fina
ncia
l sta
tem
ents
Saso
l Lim
ited
gro
up c
onso
lidat
ed fi
nanc
ial s
tate
men
tsSa
sol o
verv
iew
99
business segment information
Non-current assets*# 2013
Rm 2012
Rm 2011
Rm
South African energy cluster 67 842 59 062 51 640
■ Mining 12 617 10 240 8 126 ■ Gas 6 710 5 533 5 001 ■ Synfuels 41 176 36 275 32 283 ■ Oil 7 250 6 925 6 141 ■ Other 89 89 89
International energy cluster 29 868 24 262 18 047
■ Synfuels International 9 052 7 973 7 452 ■ Petroleum International 20 816 16 289 10 595
Chemical cluster 52 520 48 370 43 382
■ Polymers 14 462 17 552 17 960 ■ Solvents 9 624 9 694 9 821 ■ Olefins & Surfactants 12 703 7 905 6 478 ■ Other chemical businesses 15 731 13 219 9 123
■ Other businesses 6 938 4 761 3 229
Total operations 157 168 136 455 116 298
Current assets* 2013
Rm 2012
Rm 2011
Rm
South African energy cluster 20 837 17 988 16 547
■ Mining 1 405 1 154 970 ■ Gas 708 667 546 ■ Synfuels 3 073 2 929 2 570 ■ Oil 15 651 13 238 12 456 ■ Other – – 5
International energy cluster 8 446 6 478 5 509
■ Synfuels International 4 255 3 063 2 076 ■ Petroleum International 4 191 3 415 3 433
Chemical cluster 35 625 29 968 27 312
■ Polymers 9 520 9 393 7 360 ■ Solvents 7 099 5 830 5 316 ■ Olefins & Surfactants 12 485 9 979 10 241 ■ Other chemical businesses 6 521 4 766 4 395
■ Other businesses 24 516 10 712 10 364
Total operations 89 424 65 146 59 732
Non-current liabilities* 2013
Rm 2012
Rm 2011
Rm
South African energy cluster 11 366 12 195 11 457
■ Mining 1 863 1 924 1 882 ■ Gas 1 552 1 677 2 200 ■ Synfuels 4 899 5 658 4 535 ■ Oil 3 052 2 936 2 840
International energy cluster 3 235 1 421 919
■ Synfuels International 433 267 207 ■ Petroleum International 2 802 1 154 712
Chemical cluster 8 944 7 487 6 999
■ Polymers 380 935 1 859 ■ Solvents 1 847 1 372 1 134 ■ Olefins & Surfactants 4 040 3 007 2 139 ■ Other chemical businesses 2 677 2 173 1 867
■ Other businesses 20 377 9 608 8 975
Total operations 43 922 30 711 28 350
Current liabilities* 2013
Rm 2012
Rm 2011
Rm
South African energy cluster 11 995 10 091 10 061
■ Mining 1 902 1 419 1 084 ■ Gas 681 663 524 ■ Synfuels 3 228 2 492 1 814 ■ Oil 6 184 5 517 6 639
International energy cluster 4 121 3 361 3 223
■ Synfuels International 2 541 1 887 1 841 ■ Petroleum International 1 580 1 474 1 382
Chemical cluster 12 508 11 899 8 794
■ Polymers 1 898 4 193 1 297 ■ Solvents 1 740 1 187 1 203 ■ Olefins & Surfactants 6 488 4 399 4 375 ■ Other chemical businesses 2 382 2 120 1 919
■ Other businesses 6 094 4 992 4 471
Total operations 34 718 30 343 26 549 * Excludes tax and deferred tax.# Excludes post-retirement benefit assets.
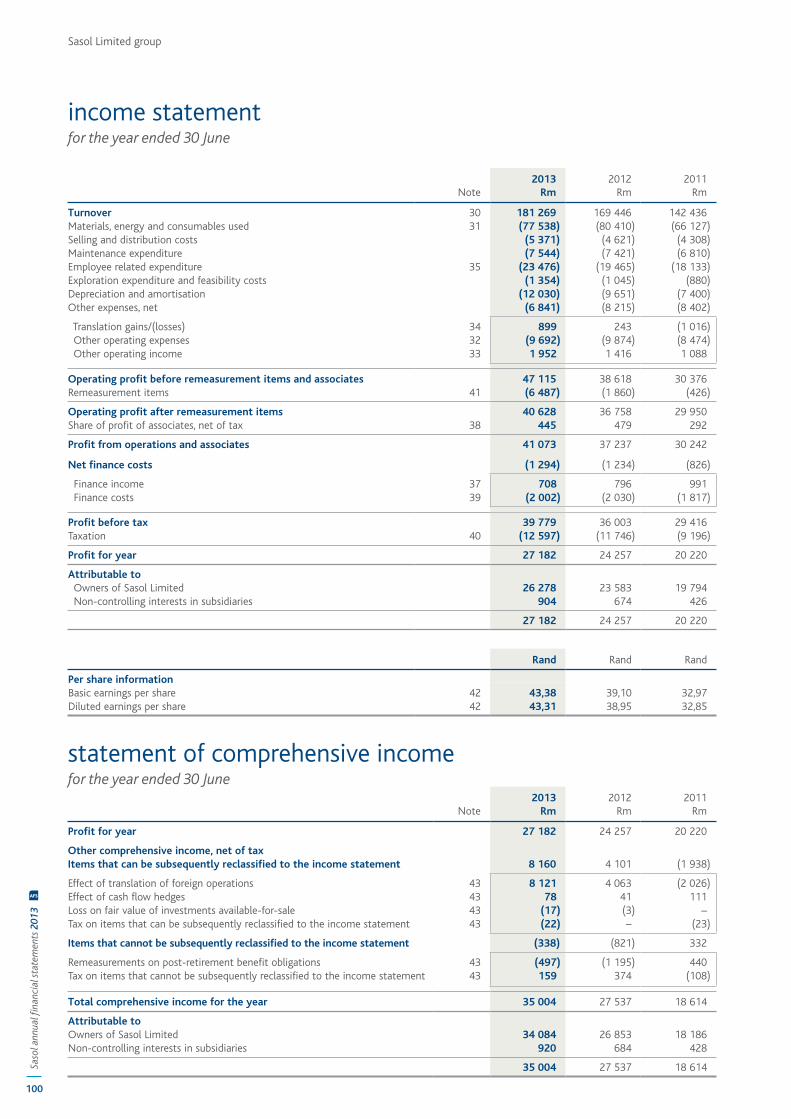
Sasol Limited group
100
Saso
l ann
ual fi
nanc
ial s
tate
men
ts 2
013
AFS
income statementfor the year ended 30 June
Note 2013
Rm 2012
Rm 2011
Rm
Turnover 30 181 269 169 446 142 436 Materials, energy and consumables used 31 (77 538) (80 410) (66 127)Selling and distribution costs (5 371) (4 621) (4 308)Maintenance expenditure (7 544) (7 421) (6 810)Employee related expenditure 35 (23 476) (19 465) (18 133)Exploration expenditure and feasibility costs (1 354) (1 045) (880)Depreciation and amortisation (12 030) (9 651) (7 400)Other expenses, net (6 841) (8 215) (8 402)
Translation gains/(losses) 34 899 243 (1 016) Other operating expenses 32 (9 692) (9 874) (8 474) Other operating income 33 1 952 1 416 1 088
Operating profit before remeasurement items and associates 47 115 38 618 30 376 Remeasurement items 41 (6 487) (1 860) (426)
Operating profit after remeasurement items 40 628 36 758 29 950 Share of profit of associates, net of tax 38 445 479 292
Profit from operations and associates 41 073 37 237 30 242
Net finance costs (1 294) (1 234) (826)
Finance income 37 708 796 991 Finance costs 39 (2 002) (2 030) (1 817)
Profit before tax 39 779 36 003 29 416 Taxation 40 (12 597) (11 746) (9 196)
Profit for year 27 182 24 257 20 220
Attributable to Owners of Sasol Limited 26 278 23 583 19 794 Non-controlling interests in subsidiaries 904 674 426
27 182 24 257 20 220
Rand Rand Rand
Per share informationBasic earnings per share 42 43,38 39,10 32,97 Diluted earnings per share 42 43,31 38,95 32,85
statement of comprehensive incomefor the year ended 30 June
Note 2013
Rm 2012
Rm 2011
Rm
Profit for year 27 182 24 257 20 220
Other comprehensive income, net of taxItems that can be subsequently reclassified to the income statement 8 160 4 101 (1 938)
Effect of translation of foreign operations 43 8 121 4 063 (2 026)Effect of cash flow hedges 43 78 41 111 Loss on fair value of investments available-for-sale 43 (17) (3) –Tax on items that can be subsequently reclassified to the income statement 43 (22) – (23)
Items that cannot be subsequently reclassified to the income statement (338) (821) 332
Remeasurements on post-retirement benefit obligations 43 (497) (1 195) 440 Tax on items that cannot be subsequently reclassified to the income statement 43 159 374 (108)
Total comprehensive income for the year 35 004 27 537 18 614
Attributable toOwners of Sasol Limited 34 084 26 853 18 186 Non-controlling interests in subsidiaries 920 684 428
35 004 27 537 18 614
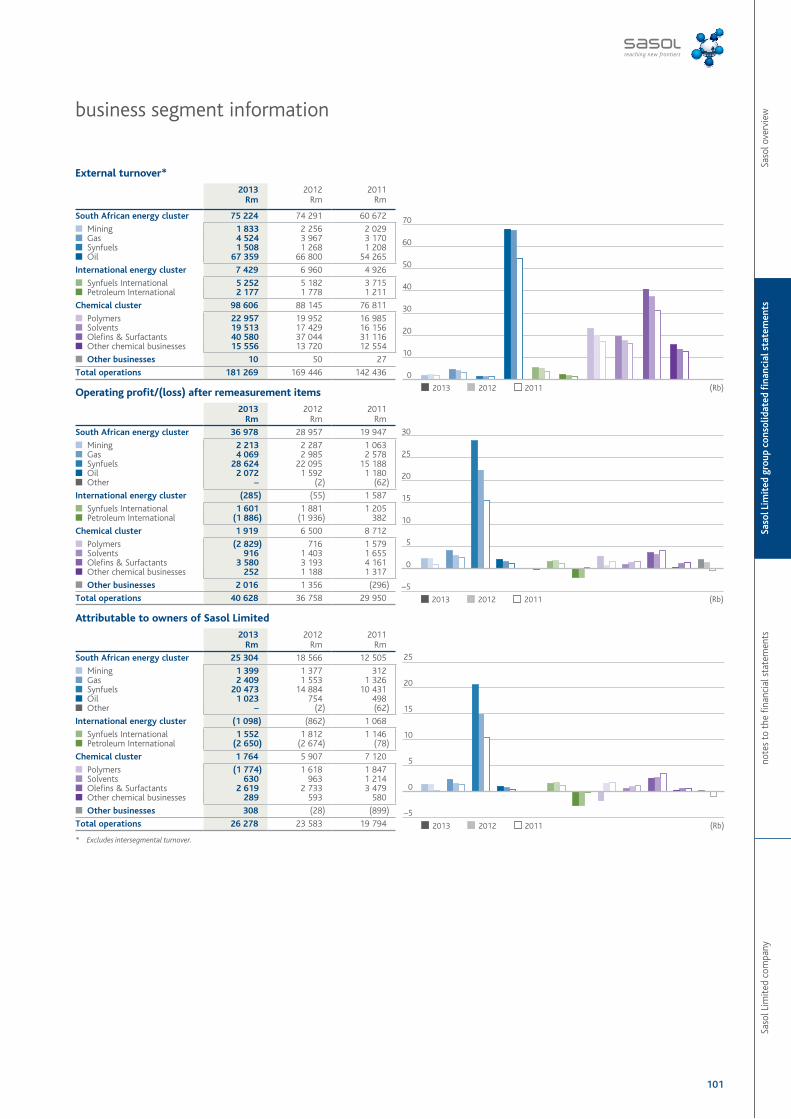
Saso
l Lim
ited
com
pany
note
s to
the
fina
ncia
l sta
tem
ents
Saso
l Lim
ited
gro
up c
onso
lidat
ed fi
nanc
ial s
tate
men
tsSa
sol o
verv
iew
101
business segment information
External turnover*
2013Rm
2012Rm
2011Rm
South African energy cluster 75 224 74 291 60 672
■ Mining 1 833 2 256 2 029 ■ Gas 4 524 3 967 3 170 ■ Synfuels 1 508 1 268 1 208 ■ Oil 67 359 66 800 54 265
International energy cluster 7 429 6 960 4 926
■ Synfuels International 5 252 5 182 3 715 ■ Petroleum International 2 177 1 778 1 211
Chemical cluster 98 606 88 145 76 811
■ Polymers 22 957 19 952 16 985 ■ Solvents 19 513 17 429 16 156 ■ Olefins & Surfactants 40 580 37 044 31 116 ■ Other chemical businesses 15 556 13 720 12 554
■ Other businesses 10 50 27
Total operations 181 269 169 446 142 436
Operating profit/(loss) after remeasurement items
2013Rm
2012Rm
2011Rm
South African energy cluster 36 978 28 957 19 947
■ Mining 2 213 2 287 1 063 ■ Gas 4 069 2 985 2 578 ■ Synfuels 28 624 22 095 15 188 ■ Oil 2 072 1 592 1 180 ■ Other – (2) (62)
International energy cluster (285) (55) 1 587
■ Synfuels International 1 601 1 881 1 205 ■ Petroleum International (1 886) (1 936) 382
Chemical cluster 1 919 6 500 8 712
■ Polymers (2 829) 716 1 579 ■ Solvents 916 1 403 1 655 ■ Olefins & Surfactants 3 580 3 193 4 161 ■ Other chemical businesses 252 1 188 1 317
■ Other businesses 2 016 1 356 (296)
Total operations 40 628 36 758 29 950
Attributable to owners of Sasol Limited
2013Rm
2012Rm
2011Rm
South African energy cluster 25 304 18 566 12 505
■ Mining 1 399 1 377 312 ■ Gas 2 409 1 553 1 326 ■ Synfuels 20 473 14 884 10 431 ■ Oil 1 023 754 498 ■ Other – (2) (62)
International energy cluster (1 098) (862) 1 068
■ Synfuels International 1 552 1 812 1 146 ■ Petroleum International (2 650) (2 674) (78)
Chemical cluster 1 764 5 907 7 120
■ Polymers (1 774) 1 618 1 847 ■ Solvents 630 963 1 214 ■ Olefins & Surfactants 2 619 2 733 3 479 ■ Other chemical businesses 289 593 580
■ Other businesses 308 (28) (899)
Total operations 26 278 23 583 19 794
* Excludes intersegmental turnover.
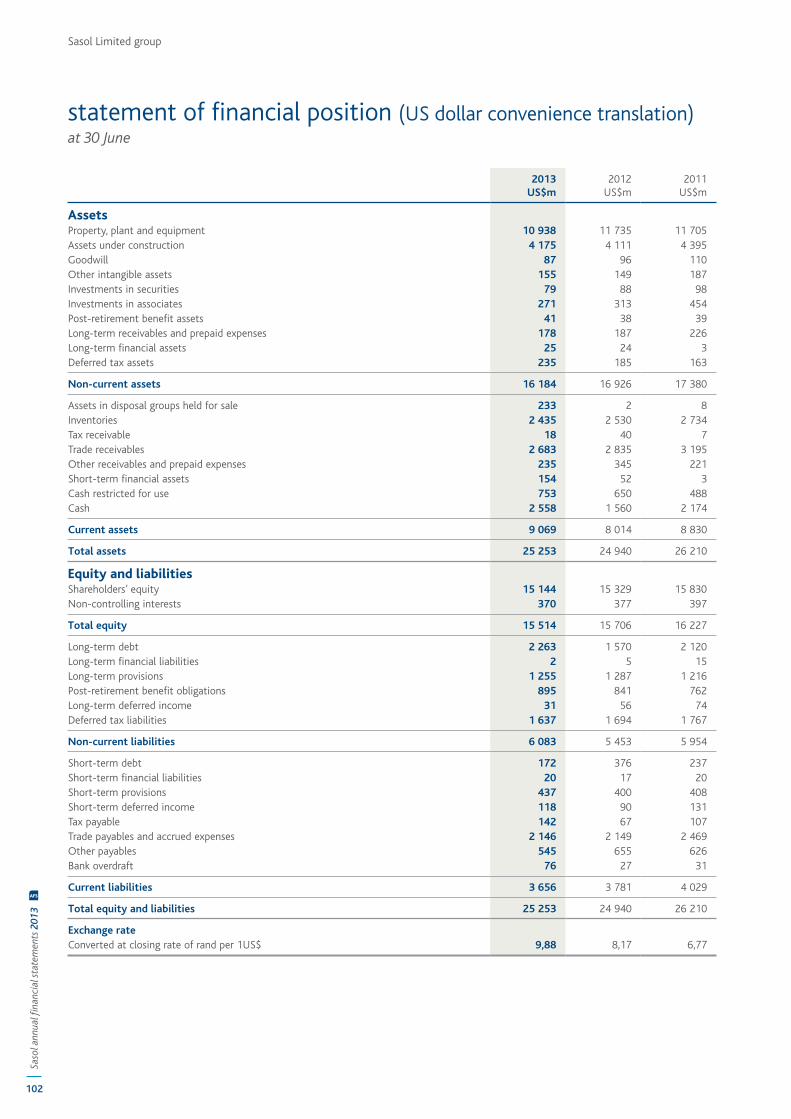
Sasol Limited group
102
Saso
l ann
ual fi
nanc
ial s
tate
men
ts 2
013
AFS
statement of financial position (US dollar convenience translation)at 30 June
2013US$m
2012US$m
2011US$m
AssetsProperty, plant and equipment 10 938 11 735 11 705 Assets under construction 4 175 4 111 4 395 Goodwill 87 96 110 Other intangible assets 155 149 187 Investments in securities 79 88 98 Investments in associates 271 313 454 Post-retirement benefit assets 41 38 39 Long-term receivables and prepaid expenses 178 187 226 Long-term financial assets 25 24 3 Deferred tax assets 235 185 163
Non-current assets 16 184 16 926 17 380
Assets in disposal groups held for sale 233 2 8 Inventories 2 435 2 530 2 734 Tax receivable 18 40 7 Trade receivables 2 683 2 835 3 195 Other receivables and prepaid expenses 235 345 221 Short-term financial assets 154 52 3 Cash restricted for use 753 650 488 Cash 2 558 1 560 2 174
Current assets 9 069 8 014 8 830
Total assets 25 253 24 940 26 210
Equity and liabilitiesShareholders’ equity 15 144 15 329 15 830 Non-controlling interests 370 377 397
Total equity 15 514 15 706 16 227
Long-term debt 2 263 1 570 2 120 Long-term financial liabilities 2 5 15 Long-term provisions 1 255 1 287 1 216 Post-retirement benefit obligations 895 841 762 Long-term deferred income 31 56 74 Deferred tax liabilities 1 637 1 694 1 767
Non-current liabilities 6 083 5 453 5 954
Short-term debt 172 376 237 Short-term financial liabilities 20 17 20 Short-term provisions 437 400 408 Short-term deferred income 118 90 131 Tax payable 142 67 107 Trade payables and accrued expenses 2 146 2 149 2 469 Other payables 545 655 626 Bank overdraft 76 27 31
Current liabilities 3 656 3 781 4 029
Total equity and liabilities 25 253 24 940 26 210
Exchange rateConverted at closing rate of rand per 1US$ 9,88 8,17 6,77
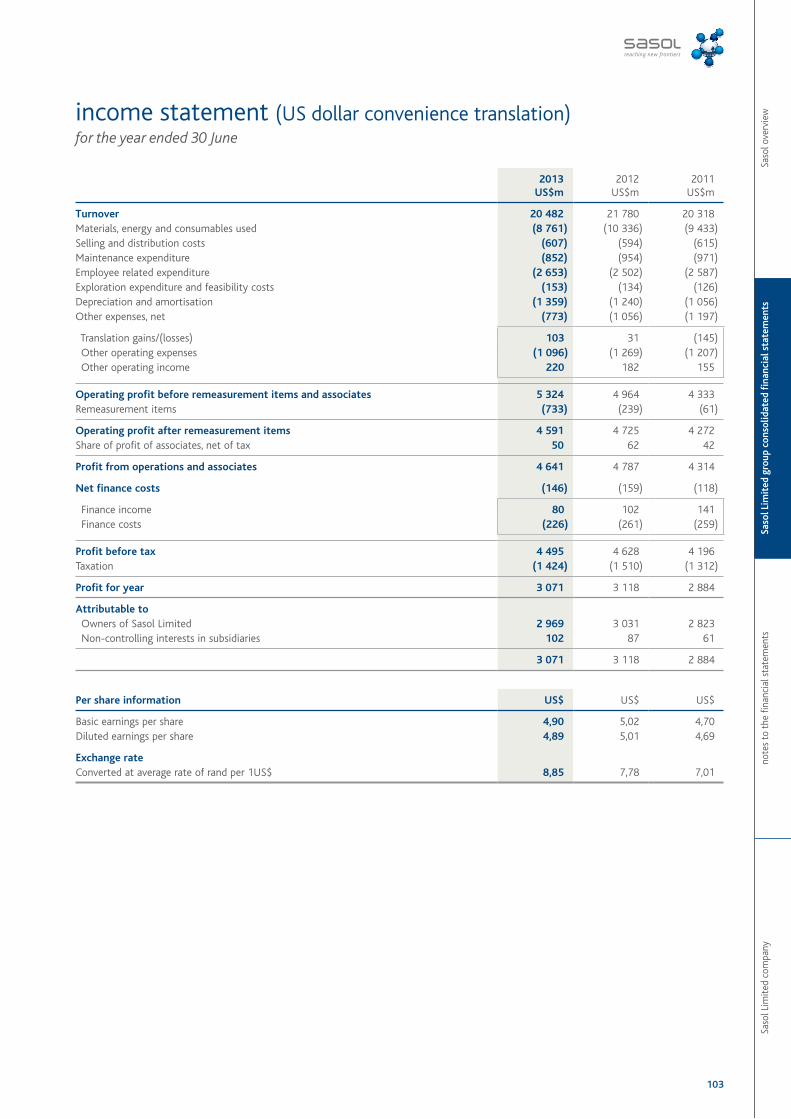
Saso
l Lim
ited
com
pany
note
s to
the
fina
ncia
l sta
tem
ents
Saso
l Lim
ited
gro
up c
onso
lidat
ed fi
nanc
ial s
tate
men
tsSa
sol o
verv
iew
103
income statement (US dollar convenience translation)for the year ended 30 June
2013US$m
2012US$m
2011US$m
Turnover 20 482 21 780 20 318 Materials, energy and consumables used (8 761) (10 336) (9 433)Selling and distribution costs (607) (594) (615)Maintenance expenditure (852) (954) (971)Employee related expenditure (2 653) (2 502) (2 587)Exploration expenditure and feasibility costs (153) (134) (126)Depreciation and amortisation (1 359) (1 240) (1 056)Other expenses, net (773) (1 056) (1 197)
Translation gains/(losses) 103 31 (145) Other operating expenses (1 096) (1 269) (1 207) Other operating income 220 182 155
Operating profit before remeasurement items and associates 5 324 4 964 4 333 Remeasurement items (733) (239) (61)
Operating profit after remeasurement items 4 591 4 725 4 272 Share of profit of associates, net of tax 50 62 42
Profit from operations and associates 4 641 4 787 4 314
Net finance costs (146) (159) (118)
Finance income 80 102 141 Finance costs (226) (261) (259)
Profit before tax 4 495 4 628 4 196 Taxation (1 424) (1 510) (1 312)
Profit for year 3 071 3 118 2 884
Attributable to Owners of Sasol Limited 2 969 3 031 2 823 Non-controlling interests in subsidiaries 102 87 61
3 071 3 118 2 884
Per share information US$ US$ US$
Basic earnings per share 4,90 5,02 4,70 Diluted earnings per share 4,89 5,01 4,69
Exchange rateConverted at average rate of rand per 1US$ 8,85 7,78 7,01
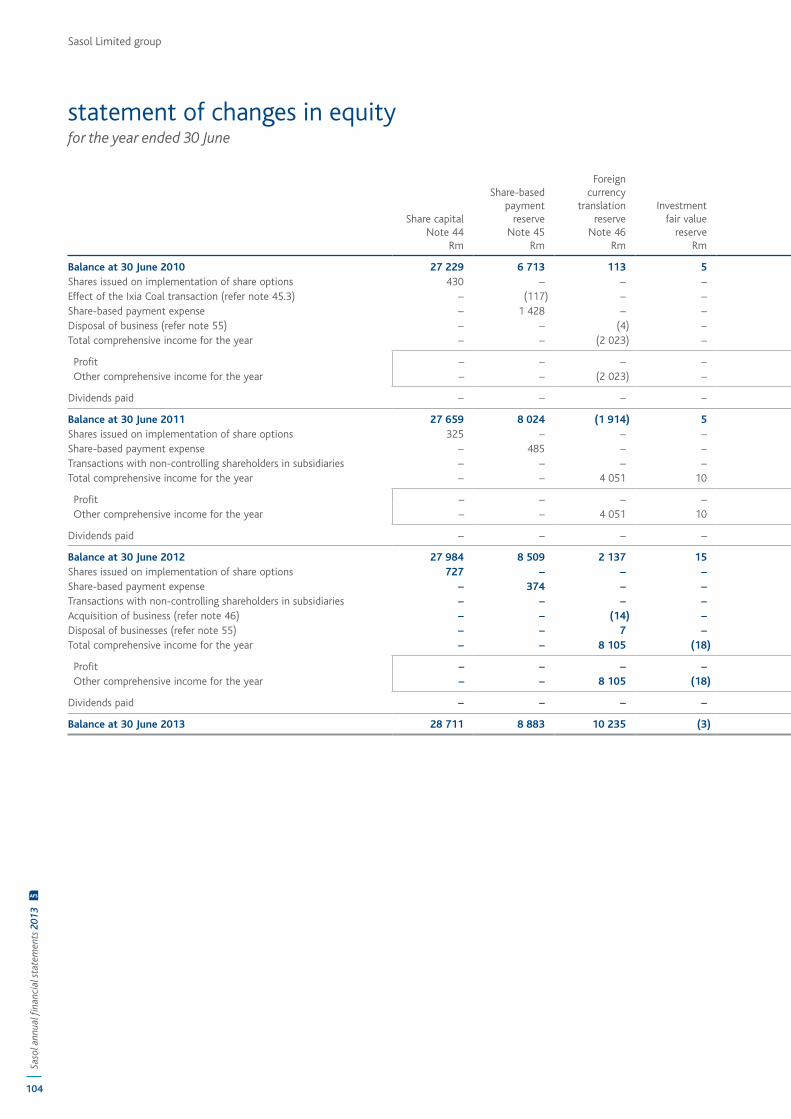
Sasol Limited group
104
Saso
l ann
ual fi
nanc
ial s
tate
men
ts 2
013
AFS
statement of changes in equityfor the year ended 30 June
Share capitalNote 44
Rm
Share-based payment
reserveNote 45
Rm
Foreigncurrency
translation reserveNote 46
Rm
Investmentfair value
reserveRm
Cash flowhedge
accounting reserve
Rm
Sasol Inzaloshare
transactionNote 45
Rm
Remeasure-ments
on post-retirement
obligationsRm
Sharerepurchase
programmeNote 47
Rm
Retainedearnings
Rm
Shareholders’ equity
Rm
Non-controlling
interestsRm
Totalequity
Rm
Balance at 30 June 2010 27 229 6 713 113 5 (122) (22 054) (765) (2 641) 85 437 93 915 2 510 96 425 Shares issued on implementation of share options 430 – – – – – – – – 430 – 430 Effect of the Ixia Coal transaction (refer note 45.3) – (117) – – – – – – (53) (170) 170 –Share-based payment expense – 1 428 – – – – – – – 1 428 – 1 428 Disposal of business (refer note 55) – – (4) – – – – – – (4) – (4) Total comprehensive income for the year – – (2 023) – 83 – 332 – 19 794 18 186 428 18 614
Profit – – – – – – – – 19 794 19 794 426 20 220 Other comprehensive income for the year – – (2 023) – 83 – 332 – – (1 608) 2 (1 606)
Dividends paid – – – – – – – – (6 614) (6 614) (419) (7 033)
Balance at 30 June 2011 27 659 8 024 (1 914) 5 (39) (22 054) (433) (2 641) 98 564 107 171 2 689 109 860 Shares issued on implementation of share options 325 – – – – – – – – 325 – 325 Share-based payment expense – 485 – – – – – – – 485 – 485 Transactions with non-controlling shareholders in subsidiaries – – – – – – – – – – 101 101 Total comprehensive income for the year – – 4 051 10 26 – (817) – 23 583 26 853 684 27 537
Profit – – – – – – – – 23 583 23 583 674 24 257 Other comprehensive income for the year – – 4 051 10 26 – (817) – – 3 270 10 3 280
Dividends paid – – – – – – – – (9 600) (9 600) (394) (9 994)
Balance at 30 June 2012 27 984 8 509 2 137 15 (13) (22 054) (1 250) (2 641) 112 547 125 234 3 080 128 314 Shares issued on implementation of share options 727 – – – – – – – – 727 – 727 Share-based payment expense – 374 – – – – – – – 374 – 374 Transactions with non-controlling shareholders in subsidiaries – – – – – – – – – – 8 8 Acquisition of business (refer note 46) – – (14) – – – – – – (14) – (14) Disposal of businesses (refer note 55) – – 7 – – – – – – 7 – 7 Total comprehensive income for the year – – 8 105 (18) 54 – (335) – 26 278 34 084 920 35 004
Profit – – – – – – – – 26 278 26 278 904 27 182 Other comprehensive income for the year – – 8 105 (18) 54 – (335) – – 7 806 16 7 822
Dividends paid – – – – – – – – (10 787) (10 787) (358) (11 145)
Balance at 30 June 2013 28 711 8 883 10 235 (3) 41 (22 054) (1 585) (2 641) 128 038 149 625 3 650 153 275
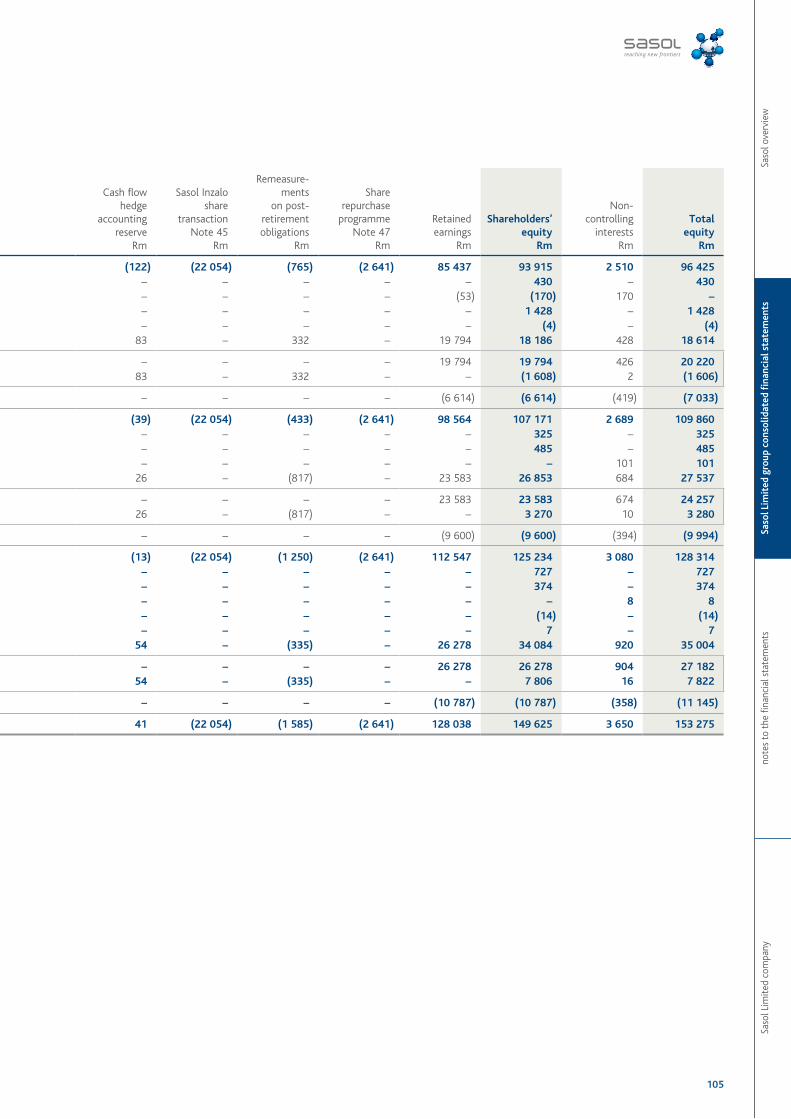
Saso
l Lim
ited
com
pany
note
s to
the
fina
ncia
l sta
tem
ents
Saso
l Lim
ited
gro
up c
onso
lidat
ed fi
nanc
ial s
tate
men
tsSa
sol o
verv
iew
105
Share capitalNote 44
Rm
Share-based payment
reserveNote 45
Rm
Foreigncurrency
translation reserveNote 46
Rm
Investmentfair value
reserveRm
Cash flowhedge
accounting reserve
Rm
Sasol Inzaloshare
transactionNote 45
Rm
Remeasure-ments
on post-retirement
obligationsRm
Sharerepurchase
programmeNote 47
Rm
Retainedearnings
Rm
Shareholders’ equity
Rm
Non-controlling
interestsRm
Totalequity
Rm
Balance at 30 June 2010 27 229 6 713 113 5 (122) (22 054) (765) (2 641) 85 437 93 915 2 510 96 425 Shares issued on implementation of share options 430 – – – – – – – – 430 – 430 Effect of the Ixia Coal transaction (refer note 45.3) – (117) – – – – – – (53) (170) 170 –Share-based payment expense – 1 428 – – – – – – – 1 428 – 1 428 Disposal of business (refer note 55) – – (4) – – – – – – (4) – (4) Total comprehensive income for the year – – (2 023) – 83 – 332 – 19 794 18 186 428 18 614
Profit – – – – – – – – 19 794 19 794 426 20 220 Other comprehensive income for the year – – (2 023) – 83 – 332 – – (1 608) 2 (1 606)
Dividends paid – – – – – – – – (6 614) (6 614) (419) (7 033)
Balance at 30 June 2011 27 659 8 024 (1 914) 5 (39) (22 054) (433) (2 641) 98 564 107 171 2 689 109 860 Shares issued on implementation of share options 325 – – – – – – – – 325 – 325 Share-based payment expense – 485 – – – – – – – 485 – 485 Transactions with non-controlling shareholders in subsidiaries – – – – – – – – – – 101 101 Total comprehensive income for the year – – 4 051 10 26 – (817) – 23 583 26 853 684 27 537
Profit – – – – – – – – 23 583 23 583 674 24 257 Other comprehensive income for the year – – 4 051 10 26 – (817) – – 3 270 10 3 280
Dividends paid – – – – – – – – (9 600) (9 600) (394) (9 994)
Balance at 30 June 2012 27 984 8 509 2 137 15 (13) (22 054) (1 250) (2 641) 112 547 125 234 3 080 128 314 Shares issued on implementation of share options 727 – – – – – – – – 727 – 727 Share-based payment expense – 374 – – – – – – – 374 – 374 Transactions with non-controlling shareholders in subsidiaries – – – – – – – – – – 8 8 Acquisition of business (refer note 46) – – (14) – – – – – – (14) – (14) Disposal of businesses (refer note 55) – – 7 – – – – – – 7 – 7 Total comprehensive income for the year – – 8 105 (18) 54 – (335) – 26 278 34 084 920 35 004
Profit – – – – – – – – 26 278 26 278 904 27 182 Other comprehensive income for the year – – 8 105 (18) 54 – (335) – – 7 806 16 7 822
Dividends paid – – – – – – – – (10 787) (10 787) (358) (11 145)
Balance at 30 June 2013 28 711 8 883 10 235 (3) 41 (22 054) (1 585) (2 641) 128 038 149 625 3 650 153 275
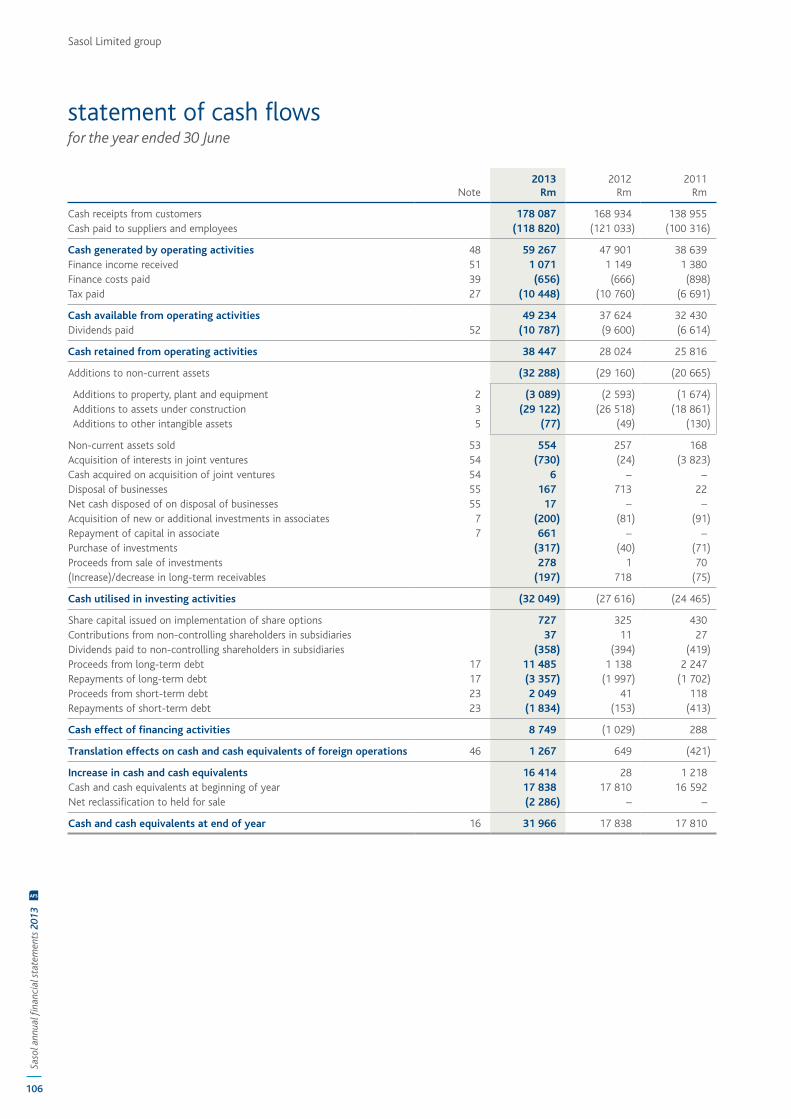
Sasol Limited group
106
Saso
l ann
ual fi
nanc
ial s
tate
men
ts 2
013
AFS
statement of cash flowsfor the year ended 30 June
Note 2013
Rm2012
Rm2011
Rm
Cash receipts from customers 178 087 168 934 138 955 Cash paid to suppliers and employees (118 820) (121 033) (100 316)
Cash generated by operating activities 48 59 267 47 901 38 639 Finance income received 51 1 071 1 149 1 380 Finance costs paid 39 (656) (666) (898)Tax paid 27 (10 448) (10 760) (6 691)
Cash available from operating activities 49 234 37 624 32 430 Dividends paid 52 (10 787) (9 600) (6 614)
Cash retained from operating activities 38 447 28 024 25 816
Additions to non-current assets (32 288) (29 160) (20 665)
Additions to property, plant and equipment 2 (3 089) (2 593) (1 674) Additions to assets under construction 3 (29 122) (26 518) (18 861) Additions to other intangible assets 5 (77) (49) (130)
Non-current assets sold 53 554 257 168 Acquisition of interests in joint ventures 54 (730) (24) (3 823)Cash acquired on acquisition of joint ventures 54 6 – –Disposal of businesses 55 167 713 22 Net cash disposed of on disposal of businesses 55 17 – –Acquisition of new or additional investments in associates 7 (200) (81) (91)Repayment of capital in associate 7 661 – –Purchase of investments (317) (40) (71)Proceeds from sale of investments 278 1 70 (Increase)/decrease in long-term receivables (197) 718 (75)
Cash utilised in investing activities (32 049) (27 616) (24 465)
Share capital issued on implementation of share options 727 325 430 Contributions from non-controlling shareholders in subsidiaries 37 11 27 Dividends paid to non-controlling shareholders in subsidiaries (358) (394) (419)Proceeds from long-term debt 17 11 485 1 138 2 247 Repayments of long-term debt 17 (3 357) (1 997) (1 702)Proceeds from short-term debt 23 2 049 41 118 Repayments of short-term debt 23 (1 834) (153) (413)
Cash effect of financing activities 8 749 (1 029) 288
Translation effects on cash and cash equivalents of foreign operations 46 1 267 649 (421)
Increase in cash and cash equivalents 16 414 28 1 218 Cash and cash equivalents at beginning of year 17 838 17 810 16 592 Net reclassification to held for sale (2 286) – –
Cash and cash equivalents at end of year 16 31 966 17 838 17 810
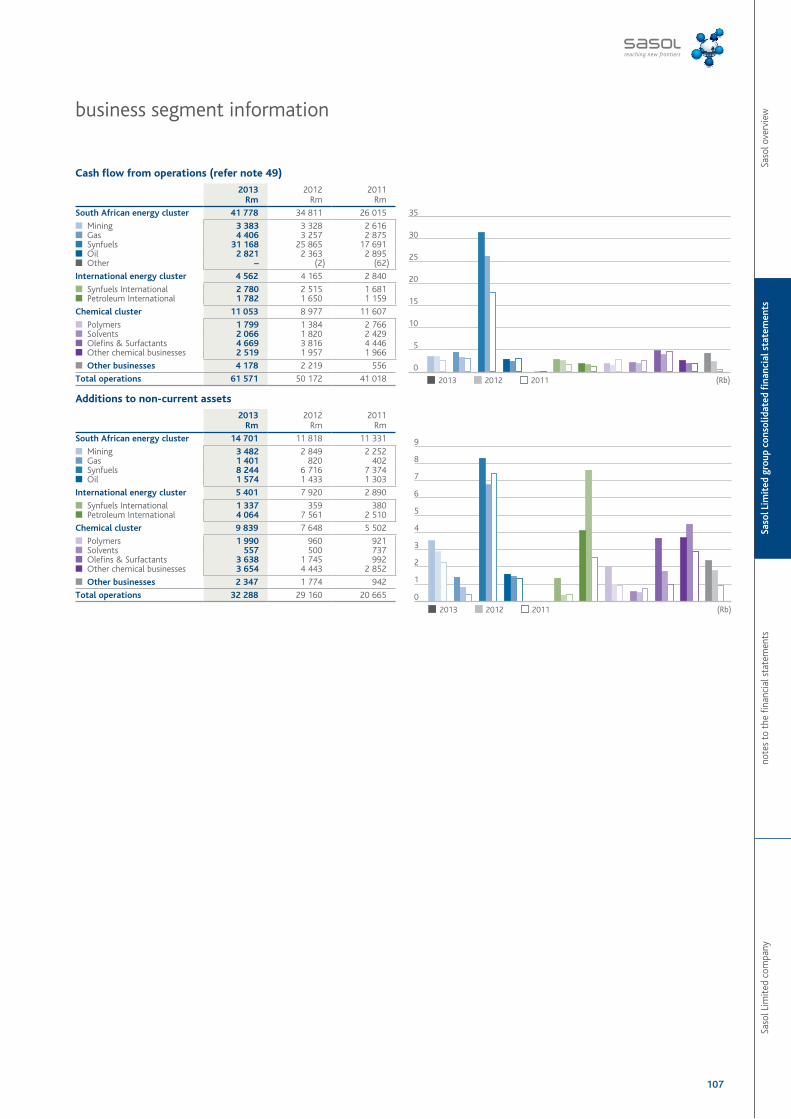
Saso
l Lim
ited
com
pany
note
s to
the
fina
ncia
l sta
tem
ents
Saso
l Lim
ited
gro
up c
onso
lidat
ed fi
nanc
ial s
tate
men
tsSa
sol o
verv
iew
107
business segment information
Cash flow from operations (refer note 49)
2013Rm
2012Rm
2011Rm
South African energy cluster 41 778 34 811 26 015
■ Mining 3 383 3 328 2 616 ■ Gas 4 406 3 257 2 875 ■ Synfuels 31 168 25 865 17 691 ■ Oil 2 821 2 363 2 895 ■ Other – (2) (62)
International energy cluster 4 562 4 165 2 840
■ Synfuels International 2 780 2 515 1 681 ■ Petroleum International 1 782 1 650 1 159
Chemical cluster 11 053 8 977 11 607
■ Polymers 1 799 1 384 2 766 ■ Solvents 2 066 1 820 2 429 ■ Olefins & Surfactants 4 669 3 816 4 446 ■ Other chemical businesses 2 519 1 957 1 966
■ Other businesses 4 178 2 219 556
Total operations 61 571 50 172 41 018
Additions to non-current assets
2013Rm
2012Rm
2011Rm
South African energy cluster 14 701 11 818 11 331
■ Mining 3 482 2 849 2 252 ■ Gas 1 401 820 402 ■ Synfuels 8 244 6 716 7 374 ■ Oil 1 574 1 433 1 303
International energy cluster 5 401 7 920 2 890
■ Synfuels International 1 337 359 380 ■ Petroleum International 4 064 7 561 2 510
Chemical cluster 9 839 7 648 5 502
■ Polymers 1 990 960 921 ■ Solvents 557 500 737 ■ Olefins & Surfactants 3 638 1 745 992 ■ Other chemical businesses 3 654 4 443 2 852
■ Other businesses 2 347 1 774 942
Total operations 32 288 29 160 20 665
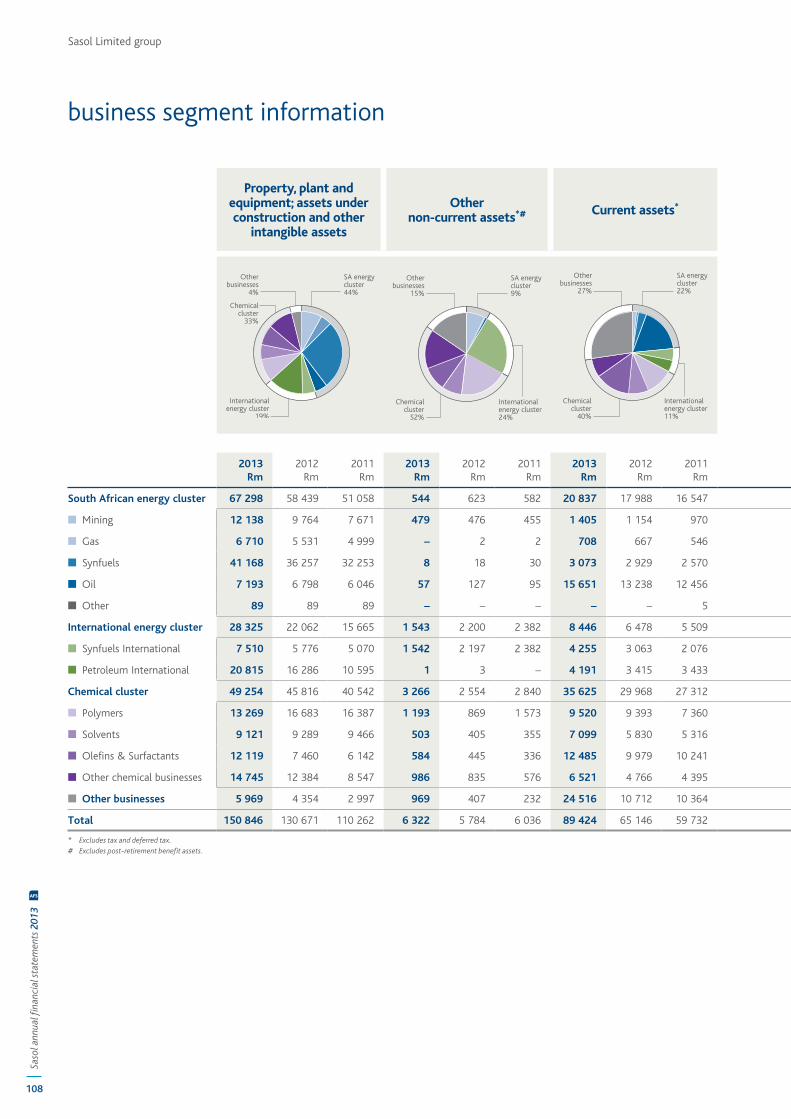
Sasol Limited group
108
Saso
l ann
ual fi
nanc
ial s
tate
men
ts 2
013
AFS
business segment information
Property, plant and equipment; assets under construction and other
intangible assets
Othernon-current assets*# Current assets* Total
consolidated assets*# Non-current liabilities* Current liabilities* Totalconsolidated liabilities*
2013Rm
2012Rm
2011Rm
2013Rm
2012Rm
2011Rm
2013Rm
2012Rm
2011Rm
2013Rm
2012Rm
2011Rm
2013Rm
2012Rm
2011Rm
2013Rm
2012Rm
2011Rm
2013Rm
2012Rm
2011Rm
South African energy cluster 67 298 58 439 51 058 544 623 582 20 837 17 988 16 547 88 679 77 050 68 187 11 366 12 195 11 457 11 995 10 091 10 061 23 361 22 286 21 518
■ Mining 12 138 9 764 7 671 479 476 455 1 405 1 154 970 14 022 11 394 9 096 1 863 1 924 1 882 1 902 1 419 1 084 3 765 3 343 2 966
■ Gas 6 710 5 531 4 999 – 2 2 708 667 546 7 418 6 200 5 547 1 552 1 677 2 200 681 663 524 2 233 2 340 2 724
■ Synfuels 41 168 36 257 32 253 8 18 30 3 073 2 929 2 570 44 249 39 204 34 853 4 899 5 658 4 535 3 228 2 492 1 814 8 127 8 150 6 349
■ Oil 7 193 6 798 6 046 57 127 95 15 651 13 238 12 456 22 901 20 163 18 597 3 052 2 936 2 840 6 184 5 517 6 639 9 236 8 453 9 479
■ Other 89 89 89 – – – – – 5 89 89 94 – – – – – – – – –
International energy cluster 28 325 22 062 15 665 1 543 2 200 2 382 8 446 6 478 5 509 38 314 30 740 23 556 3 235 1 421 919 4 121 3 361 3 223 7 356 4 782 4 142
■ Synfuels International 7 510 5 776 5 070 1 542 2 197 2 382 4 255 3 063 2 076 13 307 11 036 9 528 433 267 207 2 541 1 887 1 841 2 974 2 154 2 048
■ Petroleum International 20 815 16 286 10 595 1 3 – 4 191 3 415 3 433 25 007 19 704 14 028 2 802 1 154 712 1 580 1 474 1 382 4 382 2 628 2 094
Chemical cluster 49 254 45 816 40 542 3 266 2 554 2 840 35 625 29 968 27 312 88 145 78 338 70 694 8 944 7 487 6 999 12 508 11 899 8 794 21 452 19 386 15 793
■ Polymers 13 269 16 683 16 387 1 193 869 1 573 9 520 9 393 7 360 23 982 26 945 25 320 380 935 1 859 1 898 4 193 1 297 2 278 5 128 3 156
■ Solvents 9 121 9 289 9 466 503 405 355 7 099 5 830 5 316 16 723 15 524 15 137 1 847 1 372 1 134 1 740 1 187 1 203 3 587 2 559 2 337
■ Olefins & Surfactants 12 119 7 460 6 142 584 445 336 12 485 9 979 10 241 25 188 17 884 16 719 4 040 3 007 2 139 6 488 4 399 4 375 10 528 7 406 6 514
■ Other chemical businesses 14 745 12 384 8 547 986 835 576 6 521 4 766 4 395 22 252 17 985 13 518 2 677 2 173 1 867 2 382 2 120 1 919 5 059 4 293 3 786
■ Other businesses 5 969 4 354 2 997 969 407 232 24 516 10 712 10 364 31 454 15 473 13 593 20 377 9 608 8 975 6 094 4 992 4 471 26 471 14 600 13 446
Total 150 846 130 671 110 262 6 322 5 784 6 036 89 424 65 146 59 732 246 592 201 601 176 030 43 922 30 711 28 350 34 718 30 343 26 549 78 640 61 054 54 899
* Excludes tax and deferred tax. # Excludes post-retirement benefit assets.
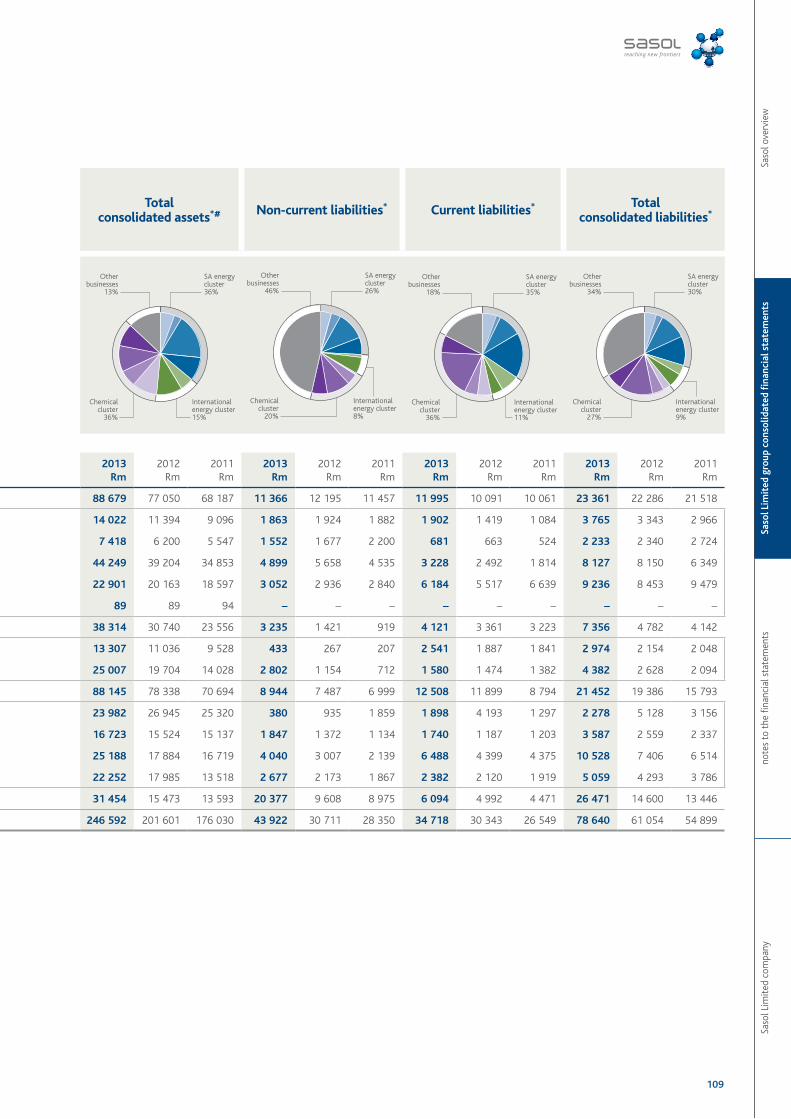
Saso
l Lim
ited
com
pany
note
s to
the
fina
ncia
l sta
tem
ents
Saso
l Lim
ited
gro
up c
onso
lidat
ed fi
nanc
ial s
tate
men
tsSa
sol o
verv
iew
109
Property, plant and equipment; assets under construction and other
intangible assets
Othernon-current assets*# Current assets* Total
consolidated assets*# Non-current liabilities* Current liabilities* Totalconsolidated liabilities*
2013Rm
2012Rm
2011Rm
2013Rm
2012Rm
2011Rm
2013Rm
2012Rm
2011Rm
2013Rm
2012Rm
2011Rm
2013Rm
2012Rm
2011Rm
2013Rm
2012Rm
2011Rm
2013Rm
2012Rm
2011Rm
South African energy cluster 67 298 58 439 51 058 544 623 582 20 837 17 988 16 547 88 679 77 050 68 187 11 366 12 195 11 457 11 995 10 091 10 061 23 361 22 286 21 518
■ Mining 12 138 9 764 7 671 479 476 455 1 405 1 154 970 14 022 11 394 9 096 1 863 1 924 1 882 1 902 1 419 1 084 3 765 3 343 2 966
■ Gas 6 710 5 531 4 999 – 2 2 708 667 546 7 418 6 200 5 547 1 552 1 677 2 200 681 663 524 2 233 2 340 2 724
■ Synfuels 41 168 36 257 32 253 8 18 30 3 073 2 929 2 570 44 249 39 204 34 853 4 899 5 658 4 535 3 228 2 492 1 814 8 127 8 150 6 349
■ Oil 7 193 6 798 6 046 57 127 95 15 651 13 238 12 456 22 901 20 163 18 597 3 052 2 936 2 840 6 184 5 517 6 639 9 236 8 453 9 479
■ Other 89 89 89 – – – – – 5 89 89 94 – – – – – – – – –
International energy cluster 28 325 22 062 15 665 1 543 2 200 2 382 8 446 6 478 5 509 38 314 30 740 23 556 3 235 1 421 919 4 121 3 361 3 223 7 356 4 782 4 142
■ Synfuels International 7 510 5 776 5 070 1 542 2 197 2 382 4 255 3 063 2 076 13 307 11 036 9 528 433 267 207 2 541 1 887 1 841 2 974 2 154 2 048
■ Petroleum International 20 815 16 286 10 595 1 3 – 4 191 3 415 3 433 25 007 19 704 14 028 2 802 1 154 712 1 580 1 474 1 382 4 382 2 628 2 094
Chemical cluster 49 254 45 816 40 542 3 266 2 554 2 840 35 625 29 968 27 312 88 145 78 338 70 694 8 944 7 487 6 999 12 508 11 899 8 794 21 452 19 386 15 793
■ Polymers 13 269 16 683 16 387 1 193 869 1 573 9 520 9 393 7 360 23 982 26 945 25 320 380 935 1 859 1 898 4 193 1 297 2 278 5 128 3 156
■ Solvents 9 121 9 289 9 466 503 405 355 7 099 5 830 5 316 16 723 15 524 15 137 1 847 1 372 1 134 1 740 1 187 1 203 3 587 2 559 2 337
■ Olefins & Surfactants 12 119 7 460 6 142 584 445 336 12 485 9 979 10 241 25 188 17 884 16 719 4 040 3 007 2 139 6 488 4 399 4 375 10 528 7 406 6 514
■ Other chemical businesses 14 745 12 384 8 547 986 835 576 6 521 4 766 4 395 22 252 17 985 13 518 2 677 2 173 1 867 2 382 2 120 1 919 5 059 4 293 3 786
■ Other businesses 5 969 4 354 2 997 969 407 232 24 516 10 712 10 364 31 454 15 473 13 593 20 377 9 608 8 975 6 094 4 992 4 471 26 471 14 600 13 446
Total 150 846 130 671 110 262 6 322 5 784 6 036 89 424 65 146 59 732 246 592 201 601 176 030 43 922 30 711 28 350 34 718 30 343 26 549 78 640 61 054 54 899
* Excludes tax and deferred tax. # Excludes post-retirement benefit assets.
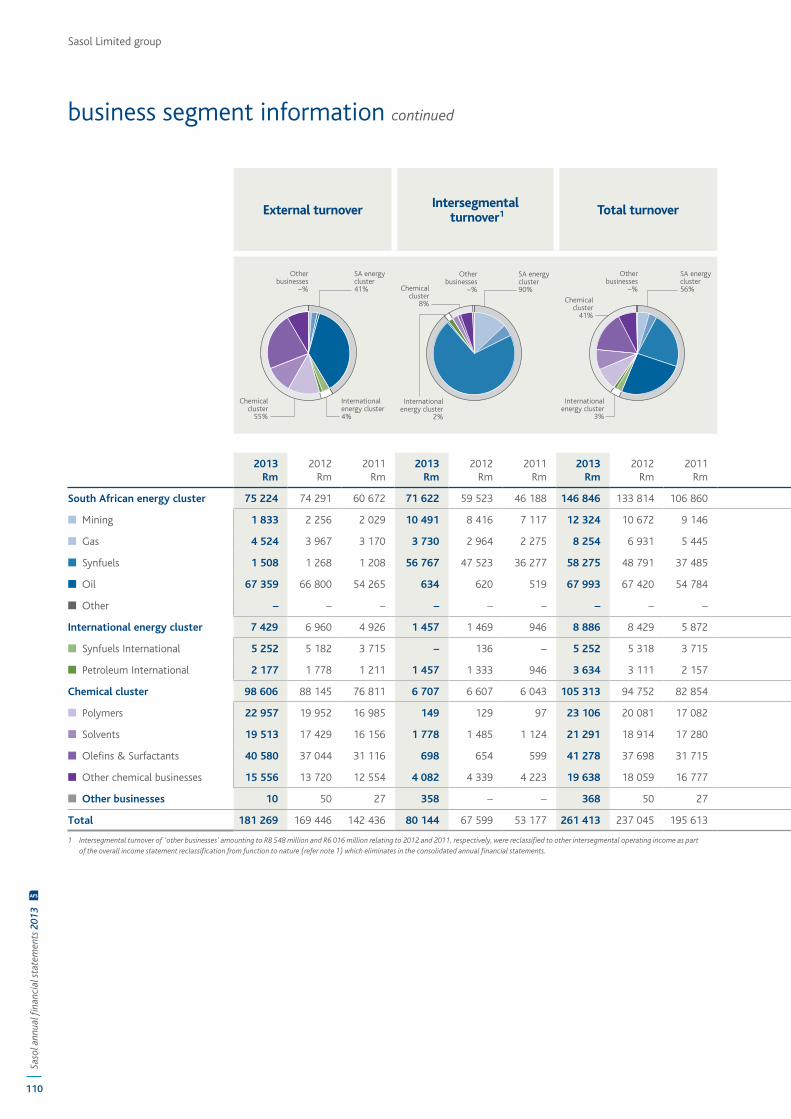
110
Saso
l ann
ual fi
nanc
ial s
tate
men
ts 2
013
AFS
Sasol Limited group
External turnover Intersegmental turnover1 Total turnover Translation
gains/(losses)
Effect of remeasurement items (before tax)
(refer note 41)
Operating profit/(loss) after remeasurement
items
Attributable to ownersof Sasol Limited
2013Rm
2012Rm
2011Rm
2013Rm
2012Rm
2011Rm
2013Rm
2012Rm
2011Rm
2013Rm
2012Rm
2011Rm
2013Rm
2012Rm
2011Rm
2013Rm
2012Rm
2011Rm
2013Rm
2012Rm
2011Rm
South African energy cluster 75 224 74 291 60 672 71 622 59 523 46 188 146 846 133 814 106 860 (246) (331) (473) 162 324 223 36 978 28 957 19 947 25 304 18 566 12 505
■ Mining 1 833 2 256 2 029 10 491 8 416 7 117 12 324 10 672 9 146 5 (5) (27) 7 61 3 2 213 2 287 1 063 1 399 1 377 312
■ Gas 4 524 3 967 3 170 3 730 2 964 2 275 8 254 6 931 5 445 (14) (17) 3 – 11 6 4 069 2 985 2 578 2 409 1 553 1 326
■ Synfuels 1 508 1 268 1 208 56 767 47 523 36 277 58 275 48 791 37 485 42 4 (81) 77 238 197 28 624 22 095 15 188 20 473 14 884 10 431
■ Oil 67 359 66 800 54 265 634 620 519 67 993 67 420 54 784 (279) (313) (368) 78 14 17 2 072 1 592 1 180 1 023 754 498
■ Other – – – – – – – – – – – – – – – – (2) (62) – (2) (62)
International energy cluster 7 429 6 960 4 926 1 457 1 469 946 8 886 8 429 5 872 (184) (322) 187 421 1 643 568 (285) (55) 1 587 (1 098) (862) 1 068
■ Synfuels International 5 252 5 182 3 715 – 136 – 5 252 5 318 3 715 82 (212) 142 (7) 34 126 1 601 1 881 1 205 1 552 1 812 1 146
■ Petroleum International 2 177 1 778 1 211 1 457 1 333 946 3 634 3 111 2 157 (266) (110) 45 428 1 609 442 (1 886) (1 936) 382 (2 650) (2 674) (78)
Chemical cluster 98 606 88 145 76 811 6 707 6 607 6 043 105 313 94 752 82 854 (959) 100 (509) 5 792 (128) (402) 1 919 6 500 8 712 1 764 5 907 7 120
■ Polymers 22 957 19 952 16 985 149 129 97 23 106 20 081 17 082 (1 709) (485) (129) 3 572 62 46 (2 829) 716 1 579 (1 774) 1 618 1 847
■ Solvents 19 513 17 429 16 156 1 778 1 485 1 124 21 291 18 914 17 280 667 479 (293) 341 83 63 916 1 403 1 655 630 963 1 214
■ Olefins & Surfactants 40 580 37 044 31 116 698 654 599 41 278 37 698 31 715 (48) 19 (17) 64 (179) (500) 3 580 3 193 4 161 2 619 2 733 3 479
■ Other chemical businesses 15 556 13 720 12 554 4 082 4 339 4 223 19 638 18 059 16 777 131 87 (70) 1 815 (94) (11) 252 1 188 1 317 289 593 580
■ Other businesses 10 50 27 358 – – 368 50 27 2 288 796 (221) 112 21 37 2 016 1 356 (296) 308 (28) (899)
Total 181 269 169 446 142 436 80 144 67 599 53 177 261 413 237 045 195 613 899 243 (1 016) 6 487 1 860 426 40 628 36 758 29 950 26 278 23 583 19 794
1 Intersegmental turnover of ‘other businesses’ amounting to R8 548 million and R6 016 million relating to 2012 and 2011, respectively, were reclassified to other intersegmental operating income as part of the overall income statement reclassification from function to nature (refer note 1) which eliminates in the consolidated annual financial statements.
business segment information continued
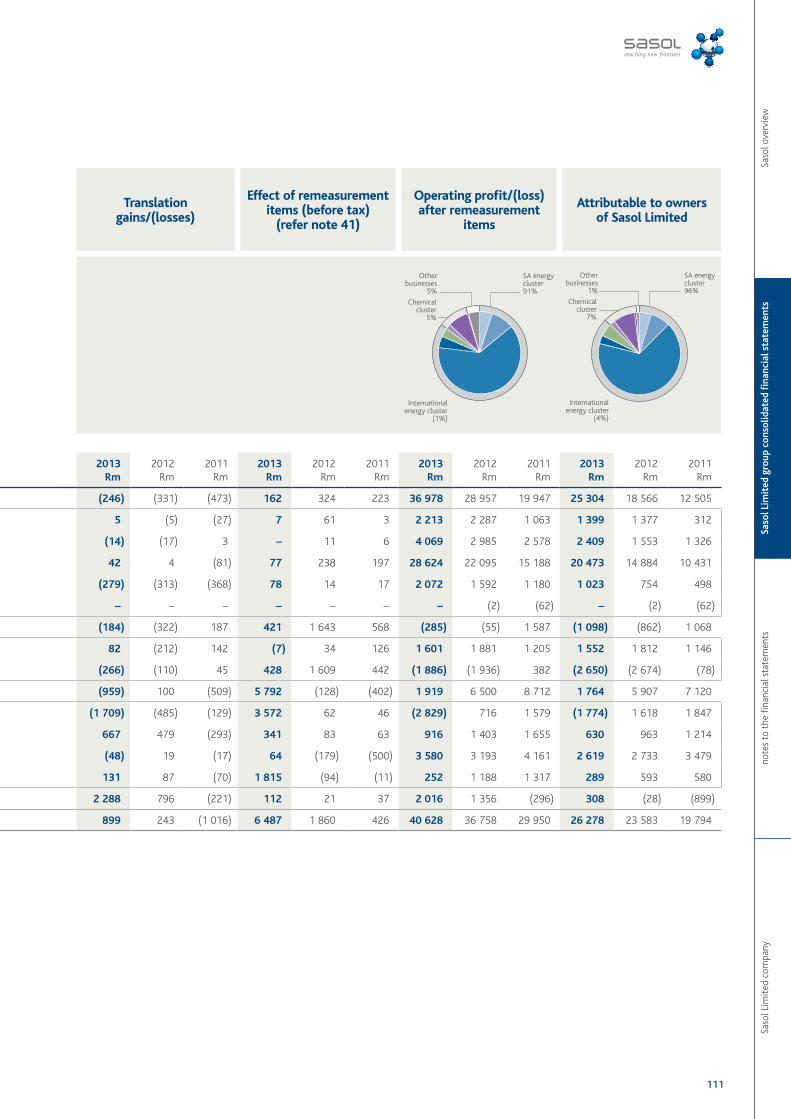
111
Saso
l Lim
ited
com
pany
note
s to
the
fina
ncia
l sta
tem
ents
Saso
l Lim
ited
gro
up c
onso
lidat
ed fi
nanc
ial s
tate
men
tsSa
sol o
verv
iew
External turnover Intersegmental turnover1 Total turnover Translation
gains/(losses)
Effect of remeasurement items (before tax)
(refer note 41)
Operating profit/(loss) after remeasurement
items
Attributable to ownersof Sasol Limited
2013Rm
2012Rm
2011Rm
2013Rm
2012Rm
2011Rm
2013Rm
2012Rm
2011Rm
2013Rm
2012Rm
2011Rm
2013Rm
2012Rm
2011Rm
2013Rm
2012Rm
2011Rm
2013Rm
2012Rm
2011Rm
South African energy cluster 75 224 74 291 60 672 71 622 59 523 46 188 146 846 133 814 106 860 (246) (331) (473) 162 324 223 36 978 28 957 19 947 25 304 18 566 12 505
■ Mining 1 833 2 256 2 029 10 491 8 416 7 117 12 324 10 672 9 146 5 (5) (27) 7 61 3 2 213 2 287 1 063 1 399 1 377 312
■ Gas 4 524 3 967 3 170 3 730 2 964 2 275 8 254 6 931 5 445 (14) (17) 3 – 11 6 4 069 2 985 2 578 2 409 1 553 1 326
■ Synfuels 1 508 1 268 1 208 56 767 47 523 36 277 58 275 48 791 37 485 42 4 (81) 77 238 197 28 624 22 095 15 188 20 473 14 884 10 431
■ Oil 67 359 66 800 54 265 634 620 519 67 993 67 420 54 784 (279) (313) (368) 78 14 17 2 072 1 592 1 180 1 023 754 498
■ Other – – – – – – – – – – – – – – – – (2) (62) – (2) (62)
International energy cluster 7 429 6 960 4 926 1 457 1 469 946 8 886 8 429 5 872 (184) (322) 187 421 1 643 568 (285) (55) 1 587 (1 098) (862) 1 068
■ Synfuels International 5 252 5 182 3 715 – 136 – 5 252 5 318 3 715 82 (212) 142 (7) 34 126 1 601 1 881 1 205 1 552 1 812 1 146
■ Petroleum International 2 177 1 778 1 211 1 457 1 333 946 3 634 3 111 2 157 (266) (110) 45 428 1 609 442 (1 886) (1 936) 382 (2 650) (2 674) (78)
Chemical cluster 98 606 88 145 76 811 6 707 6 607 6 043 105 313 94 752 82 854 (959) 100 (509) 5 792 (128) (402) 1 919 6 500 8 712 1 764 5 907 7 120
■ Polymers 22 957 19 952 16 985 149 129 97 23 106 20 081 17 082 (1 709) (485) (129) 3 572 62 46 (2 829) 716 1 579 (1 774) 1 618 1 847
■ Solvents 19 513 17 429 16 156 1 778 1 485 1 124 21 291 18 914 17 280 667 479 (293) 341 83 63 916 1 403 1 655 630 963 1 214
■ Olefins & Surfactants 40 580 37 044 31 116 698 654 599 41 278 37 698 31 715 (48) 19 (17) 64 (179) (500) 3 580 3 193 4 161 2 619 2 733 3 479
■ Other chemical businesses 15 556 13 720 12 554 4 082 4 339 4 223 19 638 18 059 16 777 131 87 (70) 1 815 (94) (11) 252 1 188 1 317 289 593 580
■ Other businesses 10 50 27 358 – – 368 50 27 2 288 796 (221) 112 21 37 2 016 1 356 (296) 308 (28) (899)
Total 181 269 169 446 142 436 80 144 67 599 53 177 261 413 237 045 195 613 899 243 (1 016) 6 487 1 860 426 40 628 36 758 29 950 26 278 23 583 19 794
1 Intersegmental turnover of ‘other businesses’ amounting to R8 548 million and R6 016 million relating to 2012 and 2011, respectively, were reclassified to other intersegmental operating income as part of the overall income statement reclassification from function to nature (refer note 1) which eliminates in the consolidated annual financial statements.
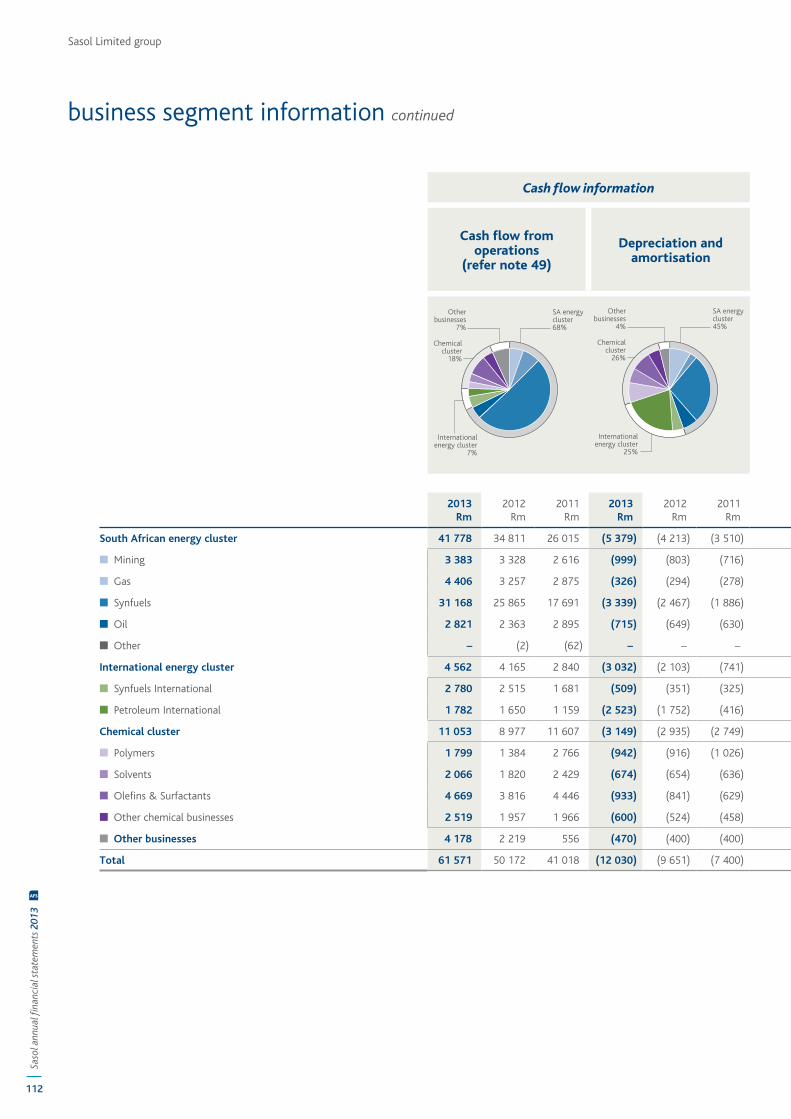
112
Saso
l ann
ual fi
nanc
ial s
tate
men
ts 2
013
AFS
Sasol Limited group
Cash flow information Cash flow information Capital commitments
Cash flow from operations
(refer note 49)
Depreciation and amortisation
Additions to non-current assets
Property, plant and equipment
(refer note 2)
2013Rm
2012Rm
2011Rm
2013Rm
2012Rm
2011Rm
2013Rm
2012Rm
2011Rm
2013Rm
2012Rm
2011Rm
South African energy cluster 41 778 34 811 26 015 (5 379) (4 213) (3 510) 14 701 11 818 11 331 30 355 29 832 27 561
■ Mining 3 383 3 328 2 616 (999) (803) (716) 3 482 2 849 2 252 9 751 10 165 6 113
■ Gas 4 406 3 257 2 875 (326) (294) (278) 1 401 820 402 2 291 1 259 1 994
■ Synfuels 31 168 25 865 17 691 (3 339) (2 467) (1 886) 8 244 6 716 7 374 16 567 16 680 17 036
■ Oil 2 821 2 363 2 895 (715) (649) (630) 1 574 1 433 1 303 1 746 1 728 2 418
■ Other – (2) (62) – – – – – – – – –
International energy cluster 4 562 4 165 2 840 (3 032) (2 103) (741) 5 401 7 920 2 890 12 479 3 883 5 657
■ Synfuels International 2 780 2 515 1 681 (509) (351) (325) 1 337 359 380 7 126 679 384
■ Petroleum International 1 782 1 650 1 159 (2 523) (1 752) (416) 4 064 7 561 2 510 5 353 3 204 5 273
Chemical cluster 11 053 8 977 11 607 (3 149) (2 935) (2 749) 9 839 7 648 5 502 22 725 10 606 12 442
■ Polymers 1 799 1 384 2 766 (942) (916) (1 026) 1 990 960 921 5 917 1 616 1 324
■ Solvents 2 066 1 820 2 429 (674) (654) (636) 557 500 737 1 520 186 272
■ Olefins & Surfactants 4 669 3 816 4 446 (933) (841) (629) 3 638 1 745 992 9 247 4 205 2 775
■ Other chemical businesses 2 519 1 957 1 966 (600) (524) (458) 3 654 4 443 2 852 6 041 4 599 8 071
■ Other businesses 4 178 2 219 556 (470) (400) (400) 2 347 1 774 942 2 193 1 498 2 336
Total 61 571 50 172 41 018 (12 030) (9 651) (7 400) 32 288 29 160 20 665 67 752 45 819 47 996
business segment information continued
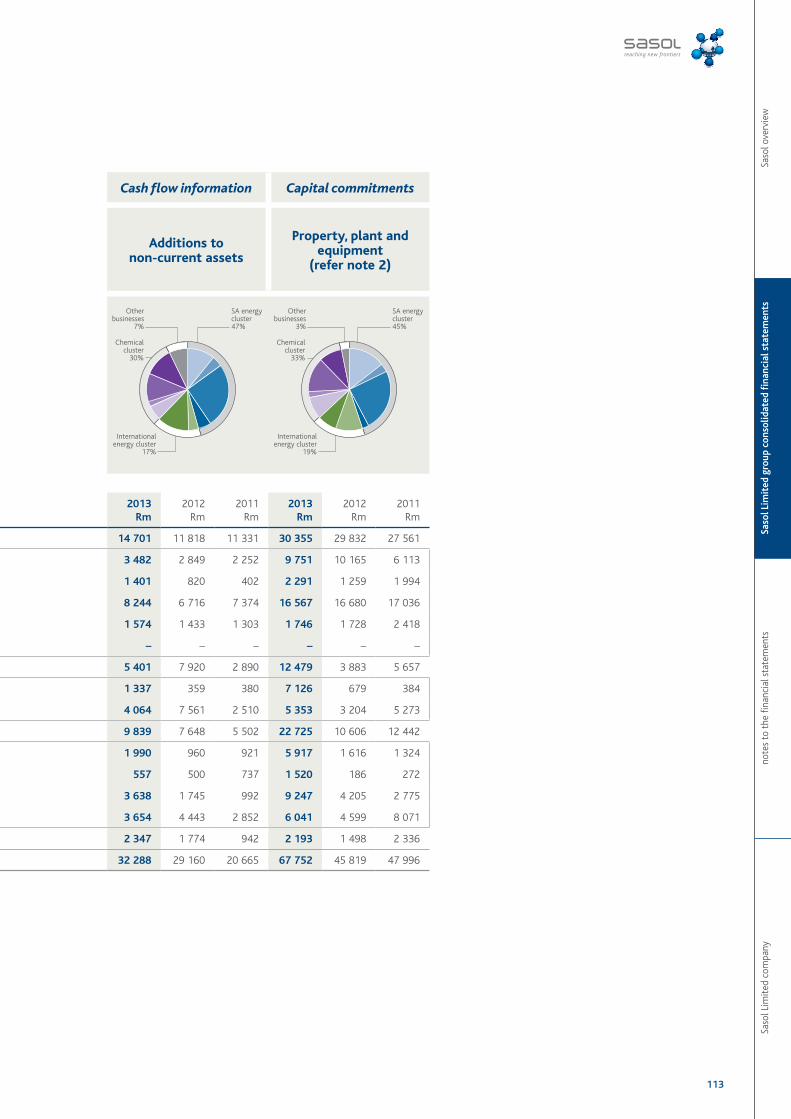
113
Saso
l Lim
ited
com
pany
note
s to
the
fina
ncia
l sta
tem
ents
Saso
l Lim
ited
gro
up c
onso
lidat
ed fi
nanc
ial s
tate
men
tsSa
sol o
verv
iew
Cash flow information Cash flow information Capital commitments
Cash flow from operations
(refer note 49)
Depreciation and amortisation
Additions to non-current assets
Property, plant and equipment
(refer note 2)
2013Rm
2012Rm
2011Rm
2013Rm
2012Rm
2011Rm
2013Rm
2012Rm
2011Rm
2013Rm
2012Rm
2011Rm
South African energy cluster 41 778 34 811 26 015 (5 379) (4 213) (3 510) 14 701 11 818 11 331 30 355 29 832 27 561
■ Mining 3 383 3 328 2 616 (999) (803) (716) 3 482 2 849 2 252 9 751 10 165 6 113
■ Gas 4 406 3 257 2 875 (326) (294) (278) 1 401 820 402 2 291 1 259 1 994
■ Synfuels 31 168 25 865 17 691 (3 339) (2 467) (1 886) 8 244 6 716 7 374 16 567 16 680 17 036
■ Oil 2 821 2 363 2 895 (715) (649) (630) 1 574 1 433 1 303 1 746 1 728 2 418
■ Other – (2) (62) – – – – – – – – –
International energy cluster 4 562 4 165 2 840 (3 032) (2 103) (741) 5 401 7 920 2 890 12 479 3 883 5 657
■ Synfuels International 2 780 2 515 1 681 (509) (351) (325) 1 337 359 380 7 126 679 384
■ Petroleum International 1 782 1 650 1 159 (2 523) (1 752) (416) 4 064 7 561 2 510 5 353 3 204 5 273
Chemical cluster 11 053 8 977 11 607 (3 149) (2 935) (2 749) 9 839 7 648 5 502 22 725 10 606 12 442
■ Polymers 1 799 1 384 2 766 (942) (916) (1 026) 1 990 960 921 5 917 1 616 1 324
■ Solvents 2 066 1 820 2 429 (674) (654) (636) 557 500 737 1 520 186 272
■ Olefins & Surfactants 4 669 3 816 4 446 (933) (841) (629) 3 638 1 745 992 9 247 4 205 2 775
■ Other chemical businesses 2 519 1 957 1 966 (600) (524) (458) 3 654 4 443 2 852 6 041 4 599 8 071
■ Other businesses 4 178 2 219 556 (470) (400) (400) 2 347 1 774 942 2 193 1 498 2 336
Total 61 571 50 172 41 018 (12 030) (9 651) (7 400) 32 288 29 160 20 665 67 752 45 819 47 996
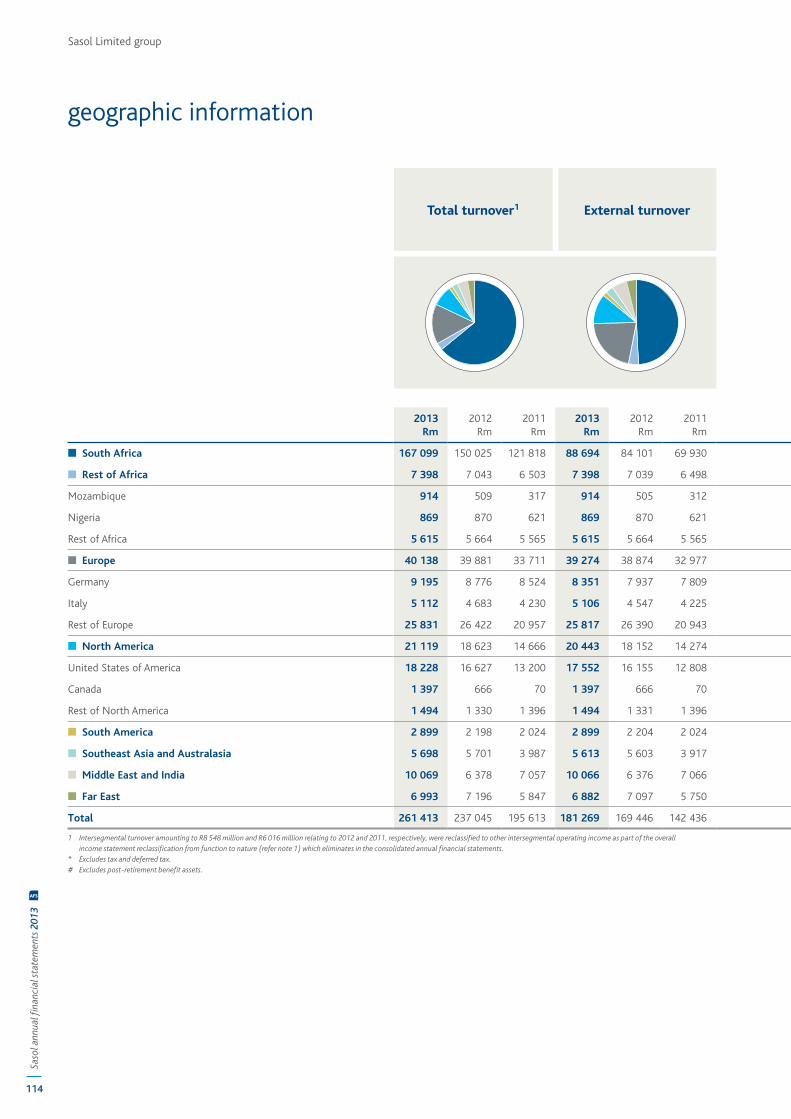
Sasol Limited group
114
Saso
l ann
ual fi
nanc
ial s
tate
men
ts 2
013
AFS
geographic information
Total turnover1 External turnover Operating profit/(loss) after remeasurement
items
Total consolidated assets*#
Additions to non-current assets
(by location of assets)
Capital commitments of property, plant
and equipment
2013Rm
2012Rm
2011Rm
2013Rm
2012Rm
2011Rm
2013Rm
2012Rm
2011Rm
2013Rm
2012Rm
2011Rm
2013Rm
2012Rm
2011Rm
2013Rm
2012Rm
2011Rm
■ South Africa 167 099 150 025 121 818 88 694 84 101 69 930 34 737 27 698 20 316 146 056 123 984 112 353 19 089 18 765 16 463 36 048 37 473 39 483
■ Rest of Africa 7 398 7 043 6 503 7 398 7 039 6 498 717 498 (249) 13 122 11 159 9 925 3 606 872 1 120 5 940 1 048 1 395
Mozambique 914 509 317 914 505 312 461 235 (337) 9 365 6 461 6 226 3 135 673 872 4 381 649 1 138
Nigeria 869 870 621 869 870 621 (259) (242) (233) 1 935 3 325 2 647 8 46 2 21 64 55
Rest of Africa 5 615 5 664 5 565 5 615 5 664 5 565 515 505 321 1 822 1 373 1 052 463 153 246 1 538 335 202
■ Europe 40 138 39 881 33 711 39 274 38 874 32 977 2 652 5 109 5 437 34 204 26 084 22 249 1 375 915 901 1 547 1 635 665
Germany 9 195 8 776 8 524 8 351 7 937 7 809 465 739 1 312 11 994 9 545 9 343 994 619 661 1 316 1 469 469
Italy 5 112 4 683 4 230 5 106 4 547 4 225 209 209 423 4 681 4 408 4 509 148 259 223 171 110 170
Rest of Europe 25 831 26 422 20 957 25 817 26 390 20 943 1 978 4 161 3 702 17 529 12 131 8 397 233 37 17 60 56 26
■ North America 21 119 18 623 14 666 20 443 18 152 14 274 1 316 (11) 1 763 34 697 20 587 14 426 7 212 7 952 1 722 23 610 4 953 6 140
United States of America 18 228 16 627 13 200 17 552 16 155 12 808 2 896 2 111 1 658 17 496 7 244 6 260 4 034 1 071 480 20 803 2 776 2 261
Canada 1 397 666 70 1 397 666 70 (1 800) (2 272) (91) 16 829 13 181 8 035 3 178 6 881 1 242 2 807 2 177 3 879
Rest of North America 1 494 1 330 1 396 1 494 1 331 1 396 220 150 196 372 162 131 – – – – – –
■ South America 2 899 2 198 2 024 2 899 2 204 2 024 227 198 194 525 460 359 1 – – – – –
■ Southeast Asia and Australasia 5 698 5 701 3 987 5 613 5 603 3 917 838 732 86 2 800 2 833 2 069 11 310 186 63 12 38
■ Middle East and India 10 069 6 378 7 057 10 066 6 376 7 066 (513) 1 953 1 858 12 690 14 375 12 853 986 335 262 533 692 275
■ Far East 6 993 7 196 5 847 6 882 7 097 5 750 654 581 545 2 498 2 119 1 796 8 11 11 11 6 –
Total 261 413 237 045 195 613 181 269 169 446 142 436 40 628 36 758 29 950 246 592 201 601 176 030 32 288 29 160 20 665 67 752 45 819 47 996
1 Intersegmental turnover amounting to R8 548 million and R6 016 million relating to 2012 and 2011, respectively, were reclassified to other intersegmental operating income as part of the overall income statement reclassification from function to nature (refer note 1) which eliminates in the consolidated annual financial statements.
* Excludes tax and deferred tax.# Excludes post-retirement benefit assets.
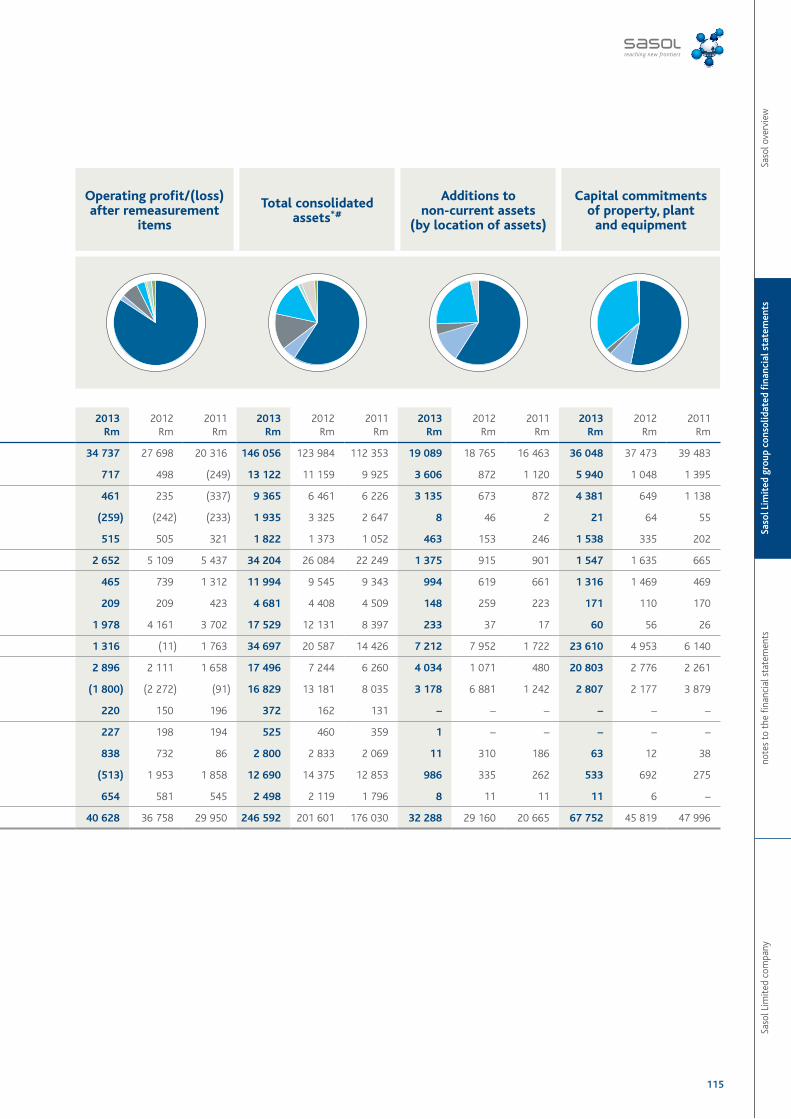
Saso
l Lim
ited
com
pany
note
s to
the
fina
ncia
l sta
tem
ents
Saso
l Lim
ited
gro
up c
onso
lidat
ed fi
nanc
ial s
tate
men
tsSa
sol o
verv
iew
115
Total turnover1 External turnover Operating profit/(loss) after remeasurement
items
Total consolidated assets*#
Additions to non-current assets
(by location of assets)
Capital commitments of property, plant
and equipment
2013Rm
2012Rm
2011Rm
2013Rm
2012Rm
2011Rm
2013Rm
2012Rm
2011Rm
2013Rm
2012Rm
2011Rm
2013Rm
2012Rm
2011Rm
2013Rm
2012Rm
2011Rm
■ South Africa 167 099 150 025 121 818 88 694 84 101 69 930 34 737 27 698 20 316 146 056 123 984 112 353 19 089 18 765 16 463 36 048 37 473 39 483
■ Rest of Africa 7 398 7 043 6 503 7 398 7 039 6 498 717 498 (249) 13 122 11 159 9 925 3 606 872 1 120 5 940 1 048 1 395
Mozambique 914 509 317 914 505 312 461 235 (337) 9 365 6 461 6 226 3 135 673 872 4 381 649 1 138
Nigeria 869 870 621 869 870 621 (259) (242) (233) 1 935 3 325 2 647 8 46 2 21 64 55
Rest of Africa 5 615 5 664 5 565 5 615 5 664 5 565 515 505 321 1 822 1 373 1 052 463 153 246 1 538 335 202
■ Europe 40 138 39 881 33 711 39 274 38 874 32 977 2 652 5 109 5 437 34 204 26 084 22 249 1 375 915 901 1 547 1 635 665
Germany 9 195 8 776 8 524 8 351 7 937 7 809 465 739 1 312 11 994 9 545 9 343 994 619 661 1 316 1 469 469
Italy 5 112 4 683 4 230 5 106 4 547 4 225 209 209 423 4 681 4 408 4 509 148 259 223 171 110 170
Rest of Europe 25 831 26 422 20 957 25 817 26 390 20 943 1 978 4 161 3 702 17 529 12 131 8 397 233 37 17 60 56 26
■ North America 21 119 18 623 14 666 20 443 18 152 14 274 1 316 (11) 1 763 34 697 20 587 14 426 7 212 7 952 1 722 23 610 4 953 6 140
United States of America 18 228 16 627 13 200 17 552 16 155 12 808 2 896 2 111 1 658 17 496 7 244 6 260 4 034 1 071 480 20 803 2 776 2 261
Canada 1 397 666 70 1 397 666 70 (1 800) (2 272) (91) 16 829 13 181 8 035 3 178 6 881 1 242 2 807 2 177 3 879
Rest of North America 1 494 1 330 1 396 1 494 1 331 1 396 220 150 196 372 162 131 – – – – – –
■ South America 2 899 2 198 2 024 2 899 2 204 2 024 227 198 194 525 460 359 1 – – – – –
■ Southeast Asia and Australasia 5 698 5 701 3 987 5 613 5 603 3 917 838 732 86 2 800 2 833 2 069 11 310 186 63 12 38
■ Middle East and India 10 069 6 378 7 057 10 066 6 376 7 066 (513) 1 953 1 858 12 690 14 375 12 853 986 335 262 533 692 275
■ Far East 6 993 7 196 5 847 6 882 7 097 5 750 654 581 545 2 498 2 119 1 796 8 11 11 11 6 –
Total 261 413 237 045 195 613 181 269 169 446 142 436 40 628 36 758 29 950 246 592 201 601 176 030 32 288 29 160 20 665 67 752 45 819 47 996
1 Intersegmental turnover amounting to R8 548 million and R6 016 million relating to 2012 and 2011, respectively, were reclassified to other intersegmental operating income as part of the overall income statement reclassification from function to nature (refer note 1) which eliminates in the consolidated annual financial statements.
* Excludes tax and deferred tax.# Excludes post-retirement benefit assets.
Sasol Limited group
116
Saso
l ann
ual fi
nanc
ial s
tate
men
ts 2
013
AFS
117 Changes to comparative information
117 Non-current assets
134 Current assets
140 Non-current liabilities
161 Current liabilities
164 Results of operations
176 Equity structure
197 Liquidity and capital resources
203 Other disclosures
Notes to the financial statements
cont
ents
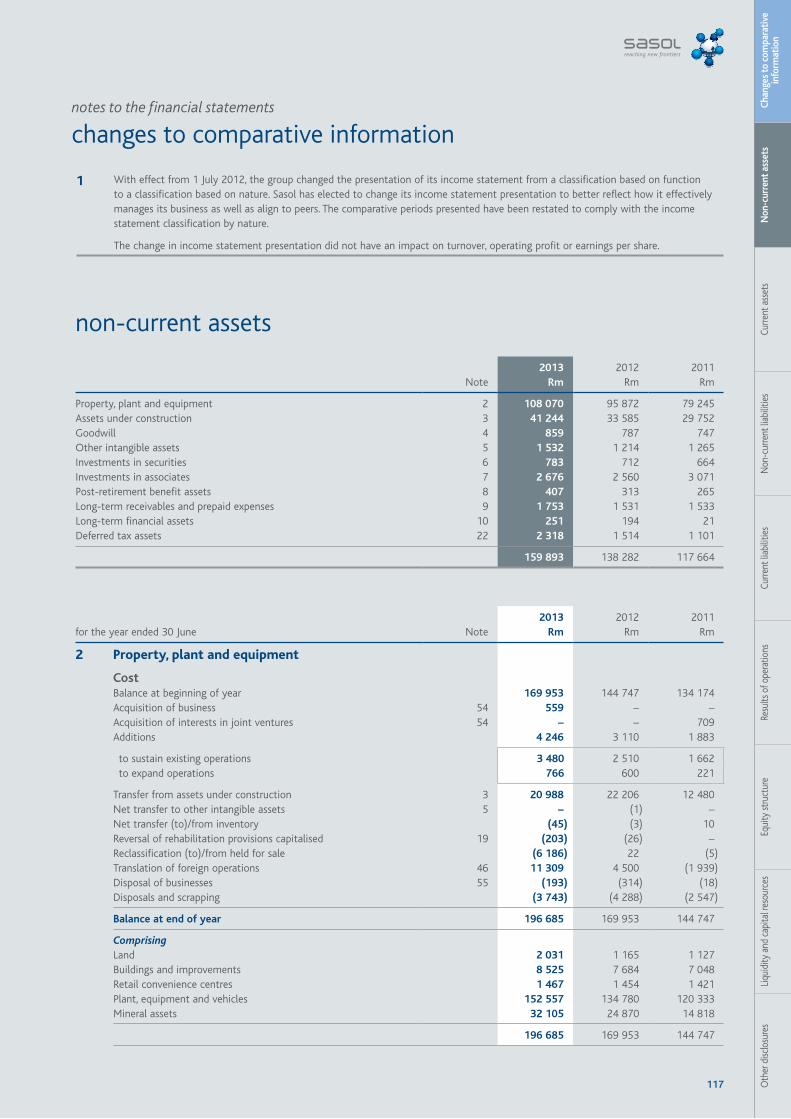
117 Oth
er d
isclo
sure
sLi
quid
ity a
nd c
apita
l res
ourc
esEq
uity
stru
ctur
eRe
sults
of o
pera
tions
Curre
nt li
abili
ties
Non
-cur
rent
liab
ilitie
sCu
rrent
ass
ets
Non
-cur
rent
ass
ets
Chan
ges
to c
ompa
rati
ve
info
rmat
ion
non-current assets
for the year ended 30 June Note 2013
Rm 2012
Rm 2011
Rm
2 Property, plant and equipment
CostBalance at beginning of year 169 953 144 747 134 174 Acquisition of business 54 559 – –Acquisition of interests in joint ventures 54 – – 709 Additions 4 246 3 110 1 883
to sustain existing operations 3 480 2 510 1 662 to expand operations 766 600 221
Transfer from assets under construction 3 20 988 22 206 12 480 Net transfer to other intangible assets 5 – (1) –Net transfer (to)/from inventory (45) (3) 10 Reversal of rehabilitation provisions capitalised 19 (203) (26) –Reclassification (to)/from held for sale (6 186) 22 (5)Translation of foreign operations 46 11 309 4 500 (1 939)Disposal of businesses 55 (193) (314) (18)Disposals and scrapping (3 743) (4 288) (2 547)
Balance at end of year 196 685 169 953 144 747
ComprisingLand 2 031 1 165 1 127 Buildings and improvements 8 525 7 684 7 048 Retail convenience centres 1 467 1 454 1 421 Plant, equipment and vehicles 152 557 134 780 120 333 Mineral assets 32 105 24 870 14 818
196 685 169 953 144 747
notes to the financial statements
changes to comparative information
1 With effect from 1 July 2012, the group changed the presentation of its income statement from a classification based on function to a classification based on nature. Sasol has elected to change its income statement presentation to better reflect how it effectively manages its business as well as align to peers. The comparative periods presented have been restated to comply with the income statement classification by nature.
The change in income statement presentation did not have an impact on turnover, operating profit or earnings per share.
Note 2013
Rm 2012
Rm 2011
Rm
Property, plant and equipment 2 108 070 95 872 79 245 Assets under construction 3 41 244 33 585 29 752 Goodwill 4 859 787 747 Other intangible assets 5 1 532 1 214 1 265 Investments in securities 6 783 712 664 Investments in associates 7 2 676 2 560 3 071 Post-retirement benefit assets 8 407 313 265 Long-term receivables and prepaid expenses 9 1 753 1 531 1 533 Long-term financial assets 10 251 194 21 Deferred tax assets 22 2 318 1 514 1 101
159 893 138 282 117 664
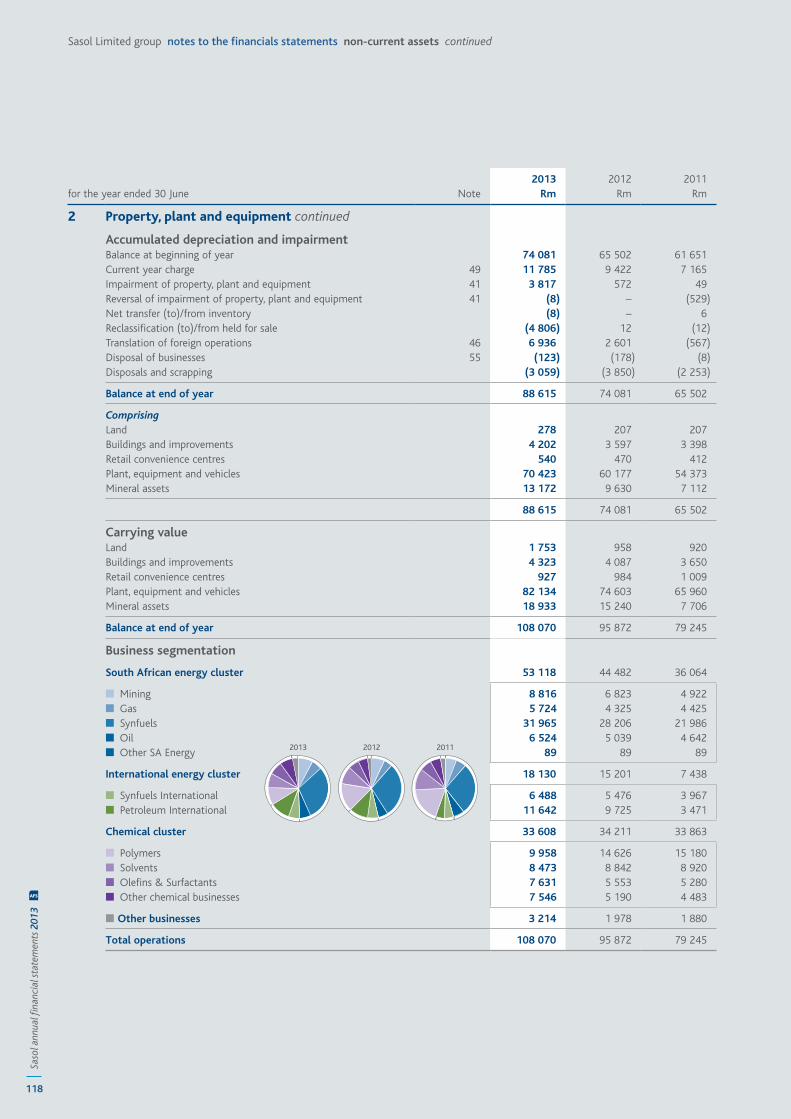
118
Saso
l ann
ual fi
nanc
ial s
tate
men
ts 2
013
AFS
Sasol Limited group notes to the financials statements non-current assets continued
for the year ended 30 June Note 2013
Rm 2012
Rm 2011
Rm
2 Property, plant and equipment continued
Accumulated depreciation and impairmentBalance at beginning of year 74 081 65 502 61 651 Current year charge 49 11 785 9 422 7 165 Impairment of property, plant and equipment 41 3 817 572 49 Reversal of impairment of property, plant and equipment 41 (8) – (529)Net transfer (to)/from inventory (8) – 6 Reclassification (to)/from held for sale (4 806) 12 (12)Translation of foreign operations 46 6 936 2 601 (567)Disposal of businesses 55 (123) (178) (8)Disposals and scrapping (3 059) (3 850) (2 253)
Balance at end of year 88 615 74 081 65 502
ComprisingLand 278 207 207 Buildings and improvements 4 202 3 597 3 398 Retail convenience centres 540 470 412 Plant, equipment and vehicles 70 423 60 177 54 373 Mineral assets 13 172 9 630 7 112
88 615 74 081 65 502
Carrying valueLand 1 753 958 920 Buildings and improvements 4 323 4 087 3 650 Retail convenience centres 927 984 1 009 Plant, equipment and vehicles 82 134 74 603 65 960 Mineral assets 18 933 15 240 7 706
Balance at end of year 108 070 95 872 79 245
Business segmentation
South African energy cluster 53 118 44 482 36 064
■ Mining 8 816 6 823 4 922 ■ Gas 5 724 4 325 4 425 ■ Synfuels 31 965 28 206 21 986 ■ Oil 6 524 5 039 4 642 ■ Other SA Energy 89 89 89
International energy cluster 18 130 15 201 7 438
■ Synfuels International 6 488 5 476 3 967 ■ Petroleum International 11 642 9 725 3 471
Chemical cluster 33 608 34 211 33 863
■ Polymers 9 958 14 626 15 180 ■ Solvents 8 473 8 842 8 920 ■ Olefins & Surfactants 7 631 5 553 5 280 ■ Other chemical businesses 7 546 5 190 4 483
■ Other businesses 3 214 1 978 1 880
Total operations 108 070 95 872 79 245
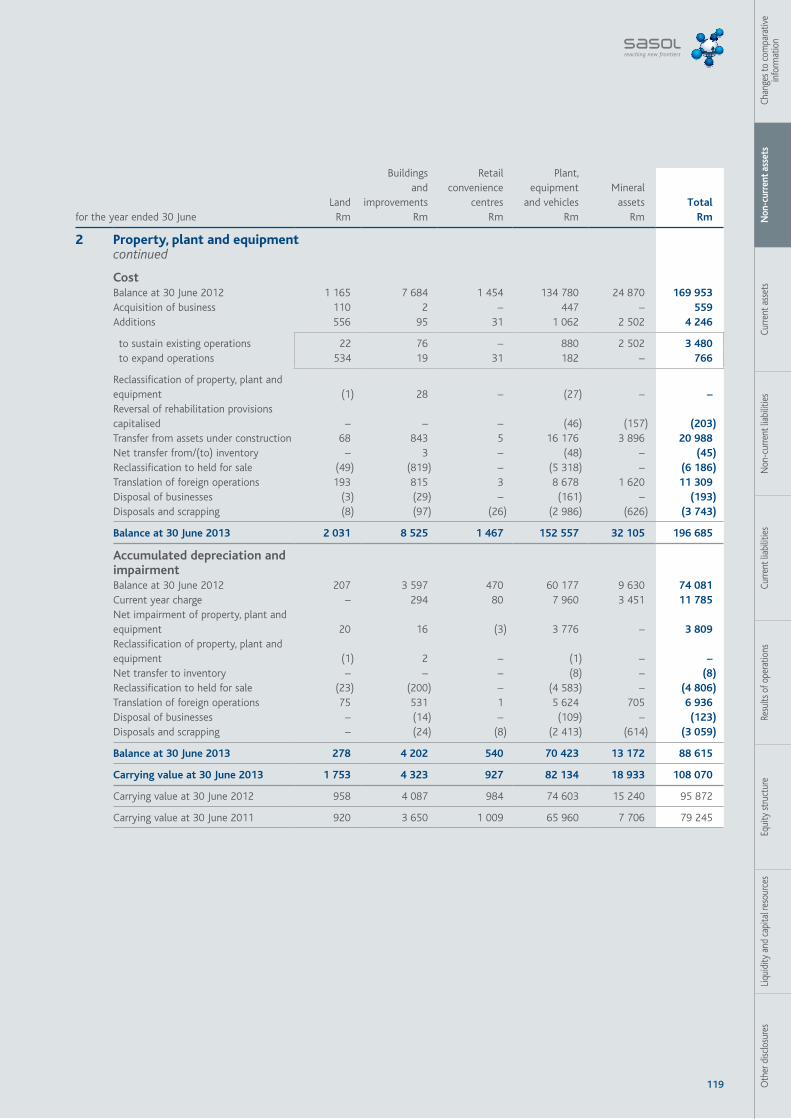
119 Oth
er d
isclo
sure
sLi
quid
ity a
nd c
apita
l res
ourc
esEq
uity
stru
ctur
eRe
sults
of o
pera
tions
Curre
nt li
abili
ties
Non
-cur
rent
liab
ilitie
sCu
rrent
ass
ets
Non
-cur
rent
ass
ets
Chan
ges t
o co
mpa
rativ
e in
form
atio
n
for the year ended 30 JuneLand
Rm
Buildingsand
improvementsRm
Retailconvenience
centresRm
Plant,equipment
and vehiclesRm
Mineralassets
RmTotal
Rm
2 Property, plant and equipment continued
CostBalance at 30 June 2012 1 165 7 684 1 454 134 780 24 870 169 953 Acquisition of business 110 2 – 447 – 559 Additions 556 95 31 1 062 2 502 4 246
to sustain existing operations 22 76 – 880 2 502 3 480 to expand operations 534 19 31 182 – 766
Reclassification of property, plant and equipment (1) 28 – (27) – –Reversal of rehabilitation provisions capitalised – – – (46) (157) (203)Transfer from assets under construction 68 843 5 16 176 3 896 20 988 Net transfer from/(to) inventory – 3 – (48) – (45)Reclassification to held for sale (49) (819) – (5 318) – (6 186)Translation of foreign operations 193 815 3 8 678 1 620 11 309 Disposal of businesses (3) (29) – (161) – (193)Disposals and scrapping (8) (97) (26) (2 986) (626) (3 743)
Balance at 30 June 2013 2 031 8 525 1 467 152 557 32 105 196 685
Accumulated depreciation and impairmentBalance at 30 June 2012 207 3 597 470 60 177 9 630 74 081 Current year charge – 294 80 7 960 3 451 11 785 Net impairment of property, plant and equipment 20 16 (3) 3 776 – 3 809 Reclassification of property, plant and equipment (1) 2 – (1) – –Net transfer to inventory – – – (8) – (8)Reclassification to held for sale (23) (200) – (4 583) – (4 806)Translation of foreign operations 75 531 1 5 624 705 6 936 Disposal of businesses – (14) – (109) – (123)Disposals and scrapping – (24) (8) (2 413) (614) (3 059)
Balance at 30 June 2013 278 4 202 540 70 423 13 172 88 615
Carrying value at 30 June 2013 1 753 4 323 927 82 134 18 933 108 070
Carrying value at 30 June 2012 958 4 087 984 74 603 15 240 95 872
Carrying value at 30 June 2011 920 3 650 1 009 65 960 7 706 79 245
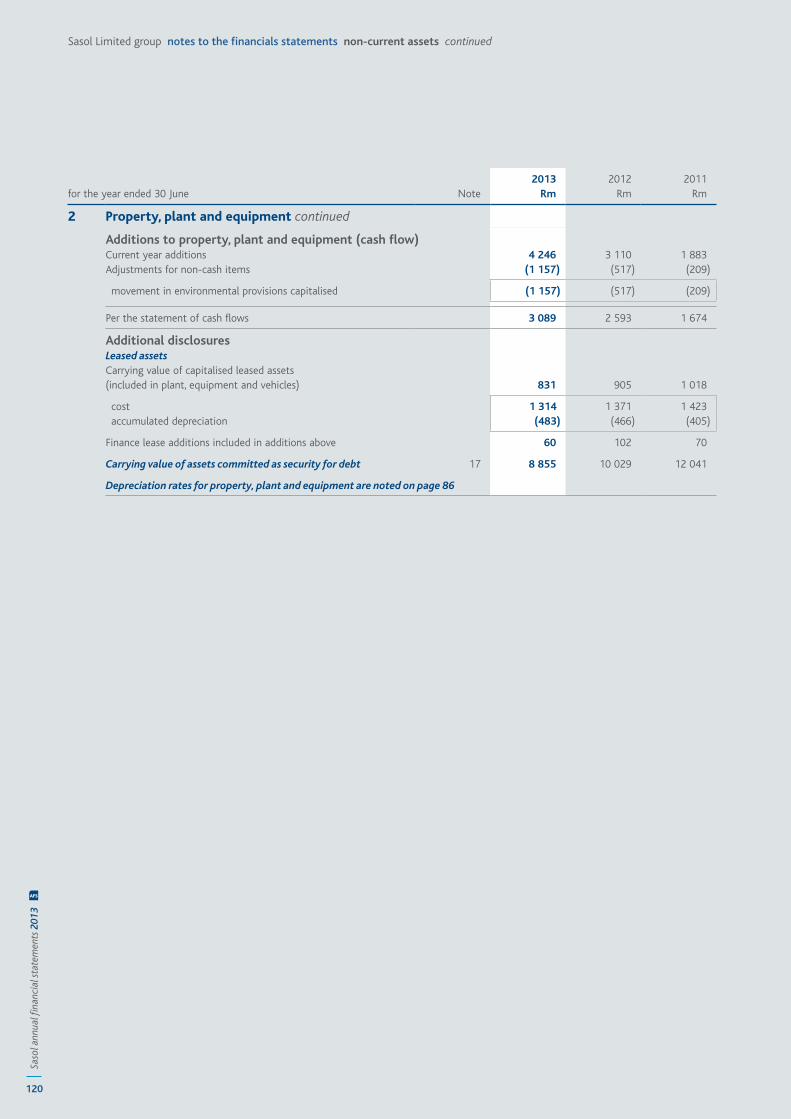
120
Saso
l ann
ual fi
nanc
ial s
tate
men
ts 2
013
AFS
Sasol Limited group notes to the financials statements non-current assets continued
for the year ended 30 June Note2013
Rm 2012
Rm 2011
Rm
2 Property, plant and equipment continued
Additions to property, plant and equipment (cash flow)Current year additions 4 246 3 110 1 883 Adjustments for non-cash items (1 157) (517) (209)
movement in environmental provisions capitalised (1 157) (517) (209)
Per the statement of cash flows 3 089 2 593 1 674
Additional disclosuresLeased assetsCarrying value of capitalised leased assets (included in plant, equipment and vehicles) 831 905 1 018
cost 1 314 1 371 1 423 accumulated depreciation (483) (466) (405)
Finance lease additions included in additions above 60 102 70
Carrying value of assets committed as security for debt 17 8 855 10 029 12 041
Depreciation rates for property, plant and equipment are noted on page 86
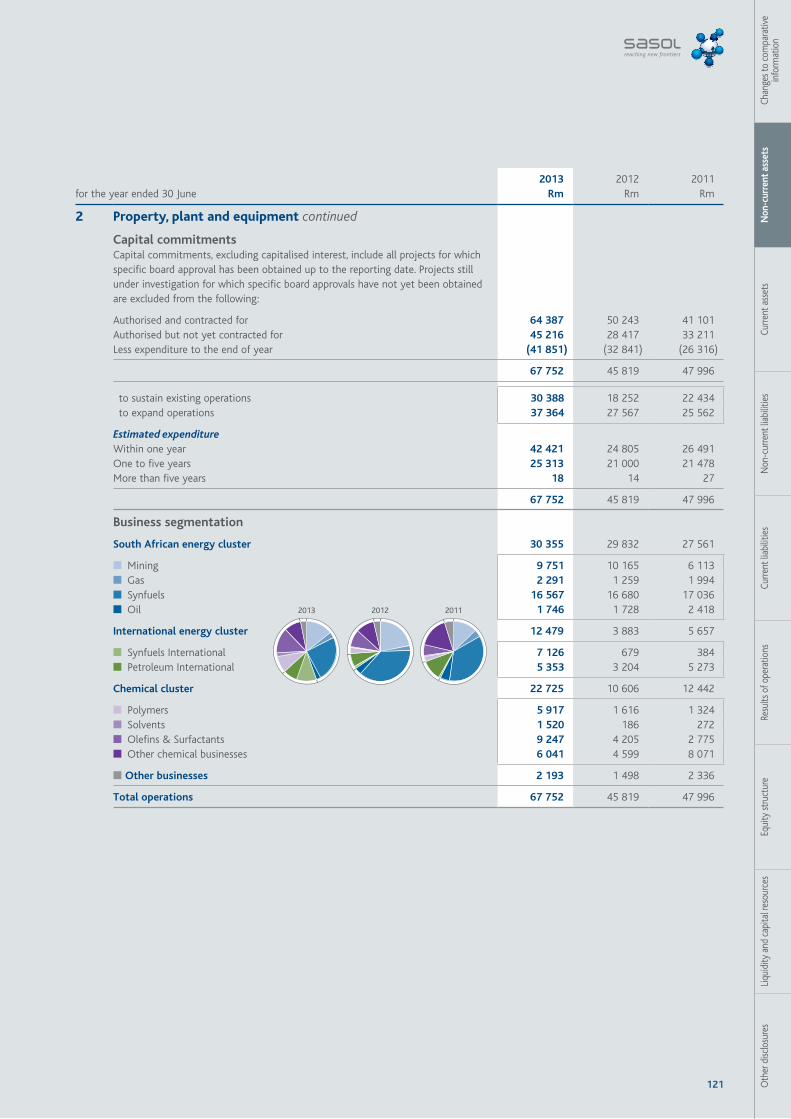
121 Oth
er d
isclo
sure
sLi
quid
ity a
nd c
apita
l res
ourc
esEq
uity
stru
ctur
eRe
sults
of o
pera
tions
Curre
nt li
abili
ties
Non
-cur
rent
liab
ilitie
sCu
rrent
ass
ets
Non
-cur
rent
ass
ets
Chan
ges t
o co
mpa
rativ
e in
form
atio
n
for the year ended 30 June2013
Rm 2012
Rm 2011
Rm
2 Property, plant and equipment continued
Capital commitmentsCapital commitments, excluding capitalised interest, include all projects for which specific board approval has been obtained up to the reporting date. Projects still under investigation for which specific board approvals have not yet been obtained are excluded from the following:
Authorised and contracted for 64 387 50 243 41 101 Authorised but not yet contracted for 45 216 28 417 33 211 Less expenditure to the end of year (41 851) (32 841) (26 316)
67 752 45 819 47 996
to sustain existing operations 30 388 18 252 22 434 to expand operations 37 364 27 567 25 562
Estimated expenditureWithin one year 42 421 24 805 26 491 One to five years 25 313 21 000 21 478 More than five years 18 14 27
67 752 45 819 47 996
Business segmentation
South African energy cluster 30 355 29 832 27 561
■ Mining 9 751 10 165 6 113 ■ Gas 2 291 1 259 1 994 ■ Synfuels 16 567 16 680 17 036 ■ Oil 1 746 1 728 2 418
International energy cluster 12 479 3 883 5 657
■ Synfuels International 7 126 679 384 ■ Petroleum International 5 353 3 204 5 273
Chemical cluster 22 725 10 606 12 442
■ Polymers 5 917 1 616 1 324 ■ Solvents 1 520 186 272 ■ Olefins & Surfactants 9 247 4 205 2 775 ■ Other chemical businesses 6 041 4 599 8 071
■ Other businesses 2 193 1 498 2 336
Total operations 67 752 45 819 47 996
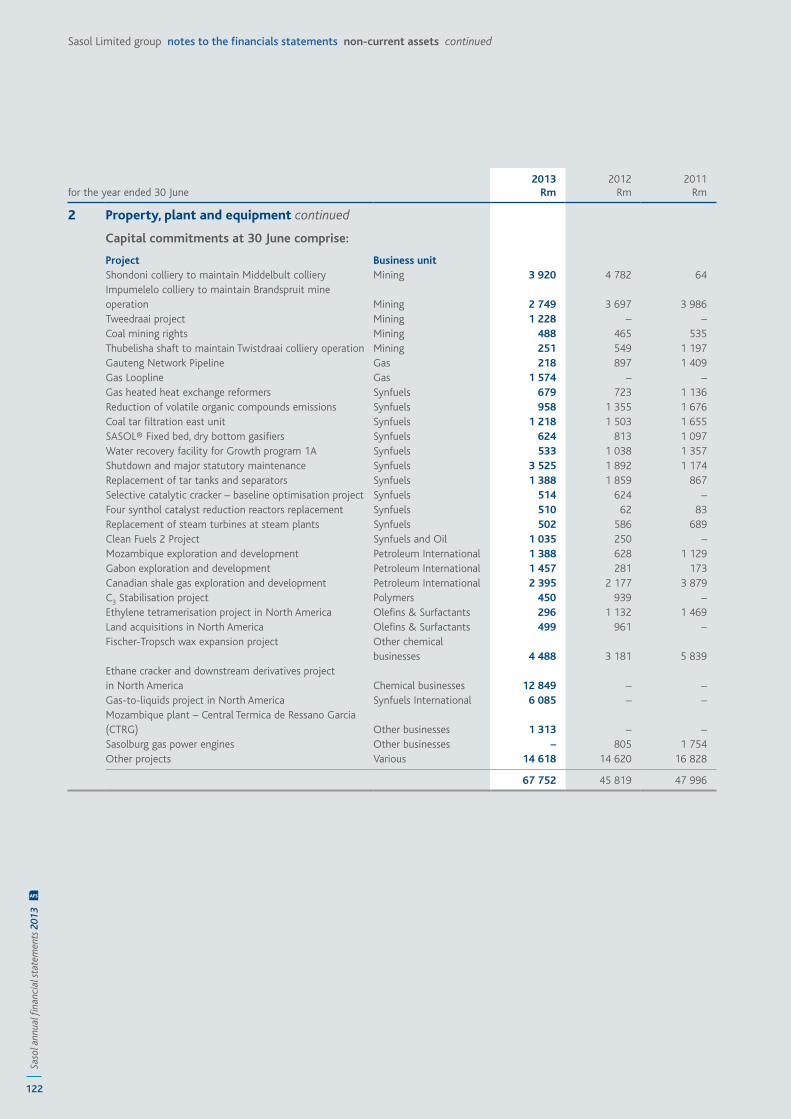
122
Saso
l ann
ual fi
nanc
ial s
tate
men
ts 2
013
AFS
Sasol Limited group notes to the financials statements non-current assets continued
for the year ended 30 June2013
Rm 2012
Rm 2011
Rm
2 Property, plant and equipment continued
Capital commitments at 30 June comprise:
Project Business unitShondoni colliery to maintain Middelbult colliery Mining 3 920 4 782 64 Impumelelo colliery to maintain Brandspruit mine operation Mining 2 749 3 697 3 986 Tweedraai project Mining 1 228 – –Coal mining rights Mining 488 465 535 Thubelisha shaft to maintain Twistdraai colliery operation Mining 251 549 1 197 Gauteng Network Pipeline Gas 218 897 1 409 Gas Loopline Gas 1 574 – –Gas heated heat exchange reformers Synfuels 679 723 1 136 Reduction of volatile organic compounds emissions Synfuels 958 1 355 1 676 Coal tar filtration east unit Synfuels 1 218 1 503 1 655 SASOL® Fixed bed, dry bottom gasifiers Synfuels 624 813 1 097 Water recovery facility for Growth program 1A Synfuels 533 1 038 1 357 Shutdown and major statutory maintenance Synfuels 3 525 1 892 1 174 Replacement of tar tanks and separators Synfuels 1 388 1 859 867 Selective catalytic cracker – baseline optimisation project Synfuels 514 624 –Four synthol catalyst reduction reactors replacement Synfuels 510 62 83 Replacement of steam turbines at steam plants Synfuels 502 586 689 Clean Fuels 2 Project Synfuels and Oil 1 035 250 –Mozambique exploration and development Petroleum International 1 388 628 1 129 Gabon exploration and development Petroleum International 1 457 281 173Canadian shale gas exploration and development Petroleum International 2 395 2 177 3 879 C3 Stabilisation project Polymers 450 939 –Ethylene tetramerisation project in North America Olefins & Surfactants 296 1 132 1 469 Land acquisitions in North America Olefins & Surfactants 499 961 –Fischer-Tropsch wax expansion project Other chemical
businesses 4 488 3 181 5 839 Ethane cracker and downstream derivatives project in North America Chemical businesses 12 849 – –Gas-to-liquids project in North America Synfuels International 6 085 – –Mozambique plant – Central Termica de Ressano Garcia (CTRG) Other businesses 1 313 – –Sasolburg gas power engines Other businesses – 805 1 754 Other projects Various 14 618 14 620 16 828
67 752 45 819 47 996
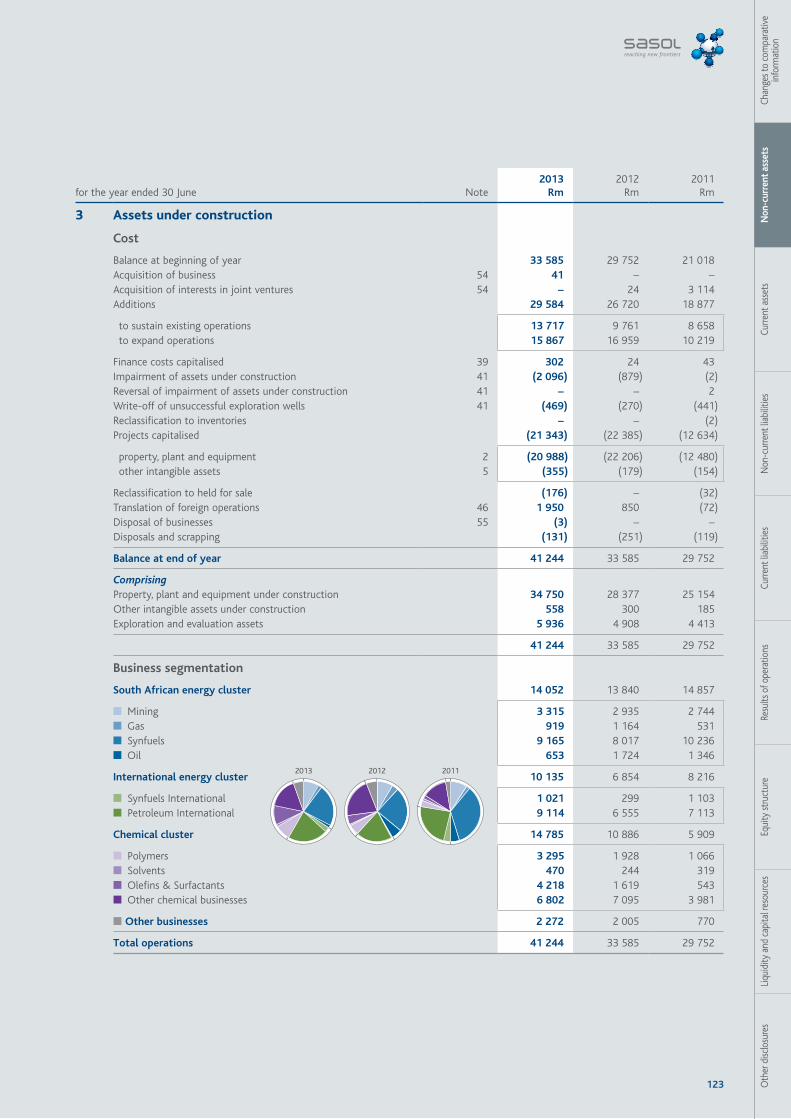
123 Oth
er d
isclo
sure
sLi
quid
ity a
nd c
apita
l res
ourc
esEq
uity
stru
ctur
eRe
sults
of o
pera
tions
Curre
nt li
abili
ties
Non
-cur
rent
liab
ilitie
sCu
rrent
ass
ets
Non
-cur
rent
ass
ets
Chan
ges t
o co
mpa
rativ
e in
form
atio
n
for the year ended 30 June Note 2013
Rm 2012
Rm 2011
Rm
3 Assets under construction
Cost
Balance at beginning of year 33 585 29 752 21 018 Acquisition of business 54 41 – –Acquisition of interests in joint ventures 54 – 24 3 114 Additions 29 584 26 720 18 877
to sustain existing operations 13 717 9 761 8 658 to expand operations 15 867 16 959 10 219
Finance costs capitalised 39 302 24 43 Impairment of assets under construction 41 (2 096) (879) (2)Reversal of impairment of assets under construction 41 – – 2 Write-off of unsuccessful exploration wells 41 (469) (270) (441)Reclassification to inventories – – (2)Projects capitalised (21 343) (22 385) (12 634)
property, plant and equipment 2 (20 988) (22 206) (12 480) other intangible assets 5 (355) (179) (154)
Reclassification to held for sale (176) – (32)Translation of foreign operations 46 1 950 850 (72)Disposal of businesses 55 (3) – –Disposals and scrapping (131) (251) (119)
Balance at end of year 41 244 33 585 29 752
ComprisingProperty, plant and equipment under construction 34 750 28 377 25 154 Other intangible assets under construction 558 300 185 Exploration and evaluation assets 5 936 4 908 4 413
41 244 33 585 29 752
Business segmentation
South African energy cluster 14 052 13 840 14 857
■ Mining 3 315 2 935 2 744 ■ Gas 919 1 164 531 ■ Synfuels 9 165 8 017 10 236 ■ Oil 653 1 724 1 346
International energy cluster 10 135 6 854 8 216
■ Synfuels International 1 021 299 1 103 ■ Petroleum International 9 114 6 555 7 113
Chemical cluster 14 785 10 886 5 909
■ Polymers 3 295 1 928 1 066 ■ Solvents 470 244 319 ■ Olefins & Surfactants 4 218 1 619 543 ■ Other chemical businesses 6 802 7 095 3 981
■ Other businesses 2 272 2 005 770
Total operations 41 244 33 585 29 752
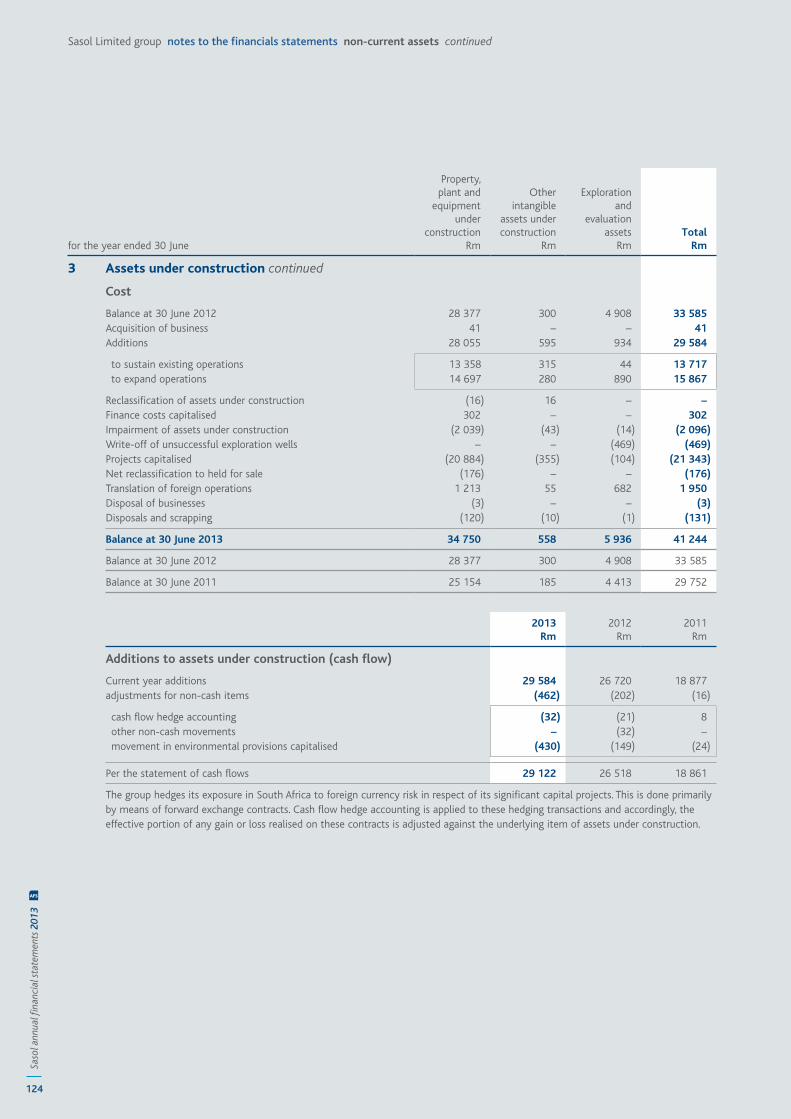
124
Saso
l ann
ual fi
nanc
ial s
tate
men
ts 2
013
AFS
Sasol Limited group notes to the financials statements non-current assets continued
for the year ended 30 June
Property, plant and
equipment under
constructionRm
Otherintangible
assets under construction
Rm
Explorationand
evaluation assets
RmTotal
Rm
3 Assets under construction continued
Cost
Balance at 30 June 2012 28 377 300 4 908 33 585 Acquisition of business 41 – – 41 Additions 28 055 595 934 29 584
to sustain existing operations 13 358 315 44 13 717 to expand operations 14 697 280 890 15 867
Reclassification of assets under construction (16) 16 – –Finance costs capitalised 302 – – 302 Impairment of assets under construction (2 039) (43) (14) (2 096)Write-off of unsuccessful exploration wells – – (469) (469)Projects capitalised (20 884) (355) (104) (21 343)Net reclassification to held for sale (176) – – (176)Translation of foreign operations 1 213 55 682 1 950 Disposal of businesses (3) – – (3)Disposals and scrapping (120) (10) (1) (131)
Balance at 30 June 2013 34 750 558 5 936 41 244
Balance at 30 June 2012 28 377 300 4 908 33 585
Balance at 30 June 2011 25 154 185 4 413 29 752
2013Rm
2012Rm
2011Rm
Additions to assets under construction (cash flow)
Current year additions 29 584 26 720 18 877 adjustments for non-cash items (462) (202) (16)
cash flow hedge accounting (32) (21) 8 other non-cash movements – (32) – movement in environmental provisions capitalised (430) (149) (24)
Per the statement of cash flows 29 122 26 518 18 861
The group hedges its exposure in South Africa to foreign currency risk in respect of its significant capital projects. This is done primarily by means of forward exchange contracts. Cash flow hedge accounting is applied to these hedging transactions and accordingly, the effective portion of any gain or loss realised on these contracts is adjusted against the underlying item of assets under construction.
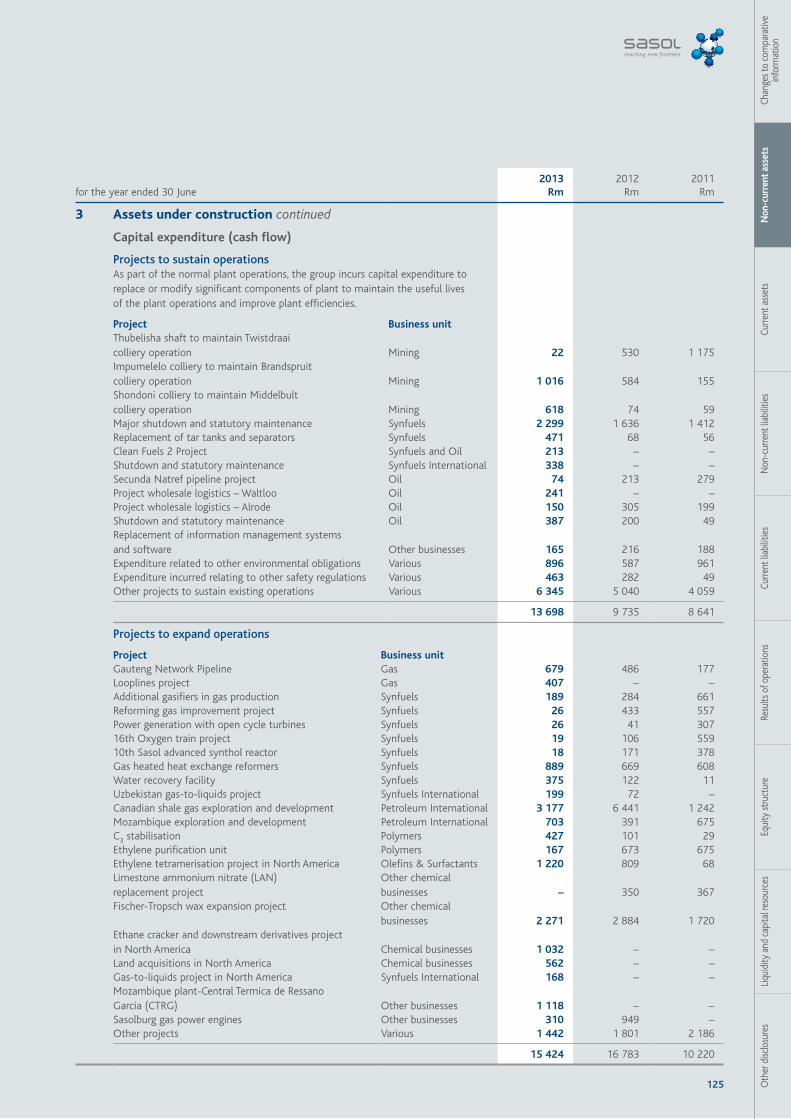
125 Oth
er d
isclo
sure
sLi
quid
ity a
nd c
apita
l res
ourc
esEq
uity
stru
ctur
eRe
sults
of o
pera
tions
Curre
nt li
abili
ties
Non
-cur
rent
liab
ilitie
sCu
rrent
ass
ets
Non
-cur
rent
ass
ets
Chan
ges t
o co
mpa
rativ
e in
form
atio
n
for the year ended 30 June2013
Rm 2012
Rm 2011
Rm
3 Assets under construction continued
Capital expenditure (cash flow)
Projects to sustain operationsAs part of the normal plant operations, the group incurs capital expenditure to replace or modify significant components of plant to maintain the useful lives of the plant operations and improve plant efficiencies.
Project Business unitThubelisha shaft to maintain Twistdraai colliery operation Mining 22 530 1 175 Impumelelo colliery to maintain Brandspruit colliery operation Mining 1 016 584 155 Shondoni colliery to maintain Middelbult colliery operation Mining 618 74 59 Major shutdown and statutory maintenance Synfuels 2 299 1 636 1 412 Replacement of tar tanks and separators Synfuels 471 68 56 Clean Fuels 2 Project Synfuels and Oil 213 – –Shutdown and statutory maintenance Synfuels International 338 – –Secunda Natref pipeline project Oil 74 213 279 Project wholesale logistics – Waltloo Oil 241 – –Project wholesale logistics – Alrode Oil 150 305 199 Shutdown and statutory maintenance Oil 387 200 49 Replacement of information management systems and software Other businesses 165 216 188 Expenditure related to other environmental obligations Various 896 587 961 Expenditure incurred relating to other safety regulations Various 463 282 49 Other projects to sustain existing operations Various 6 345 5 040 4 059
13 698 9 735 8 641
Projectstoexpandoperations
Project Business unitGauteng Network Pipeline Gas 679 486 177 Looplines project Gas 407 – –Additional gasifiers in gas production Synfuels 189 284 661 Reforming gas improvement project Synfuels 26 433 557 Power generation with open cycle turbines Synfuels 26 41 307 16th Oxygen train project Synfuels 19 106 559 10th Sasol advanced synthol reactor Synfuels 18 171 378 Gas heated heat exchange reformers Synfuels 889 669 608 Water recovery facility Synfuels 375 122 11 Uzbekistan gas-to-liquids project Synfuels International 199 72 –Canadian shale gas exploration and development Petroleum International 3 177 6 441 1 242 Mozambique exploration and development Petroleum International 703 391 675 C3 stabilisation Polymers 427 101 29 Ethylene purification unit Polymers 167 673 675 Ethylene tetramerisation project in North America Olefins & Surfactants 1 220 809 68 Limestone ammonium nitrate (LAN) replacement project
Other chemical businesses – 350 367
Fischer-Tropsch wax expansion project
Other chemical businesses 2 271 2 884 1 720
Ethane cracker and downstream derivatives project in North America Chemical businesses 1 032 – –Land acquisitions in North America Chemical businesses 562 – –Gas-to-liquids project in North America Synfuels International 168 – –Mozambique plant-Central Termica de Ressano Garcia (CTRG) Other businesses 1 118 – –Sasolburg gas power engines Other businesses 310 949 –Other projects Various 1 442 1 801 2 186
15 424 16 783 10 220
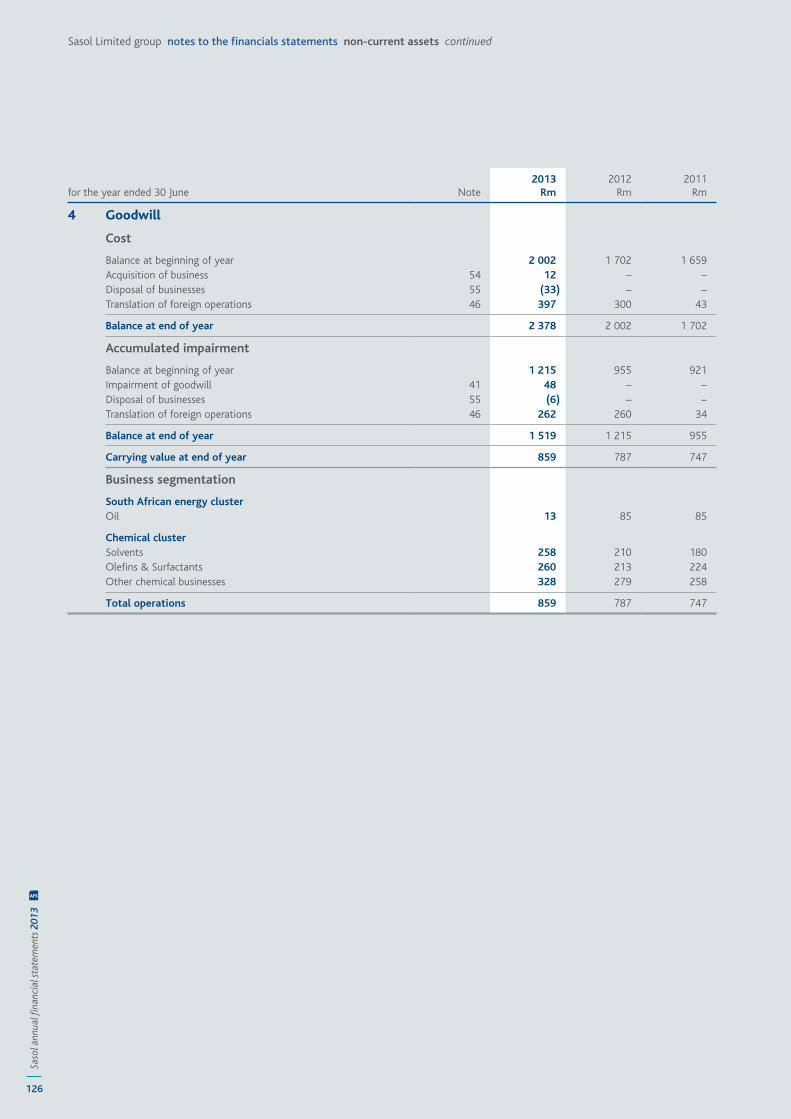
126
Saso
l ann
ual fi
nanc
ial s
tate
men
ts 2
013
AFS
Sasol Limited group notes to the financials statements non-current assets continued
for the year ended 30 June Note 2013
Rm 2012
Rm 2011
Rm
4 Goodwill
Cost
Balance at beginning of year 2 002 1 702 1 659 Acquisition of business 54 12 – –Disposal of businesses 55 (33) – –Translation of foreign operations 46 397 300 43
Balance at end of year 2 378 2 002 1 702
Accumulated impairment
Balance at beginning of year 1 215 955 921 Impairment of goodwill 41 48 – –Disposal of businesses 55 (6) – –Translation of foreign operations 46 262 260 34
Balance at end of year 1 519 1 215 955
Carrying value at end of year 859 787 747
Business segmentation
South African energy clusterOil 13 85 85
Chemical clusterSolvents 258 210 180 Olefins & Surfactants 260 213 224 Other chemical businesses 328 279 258
Total operations 859 787 747
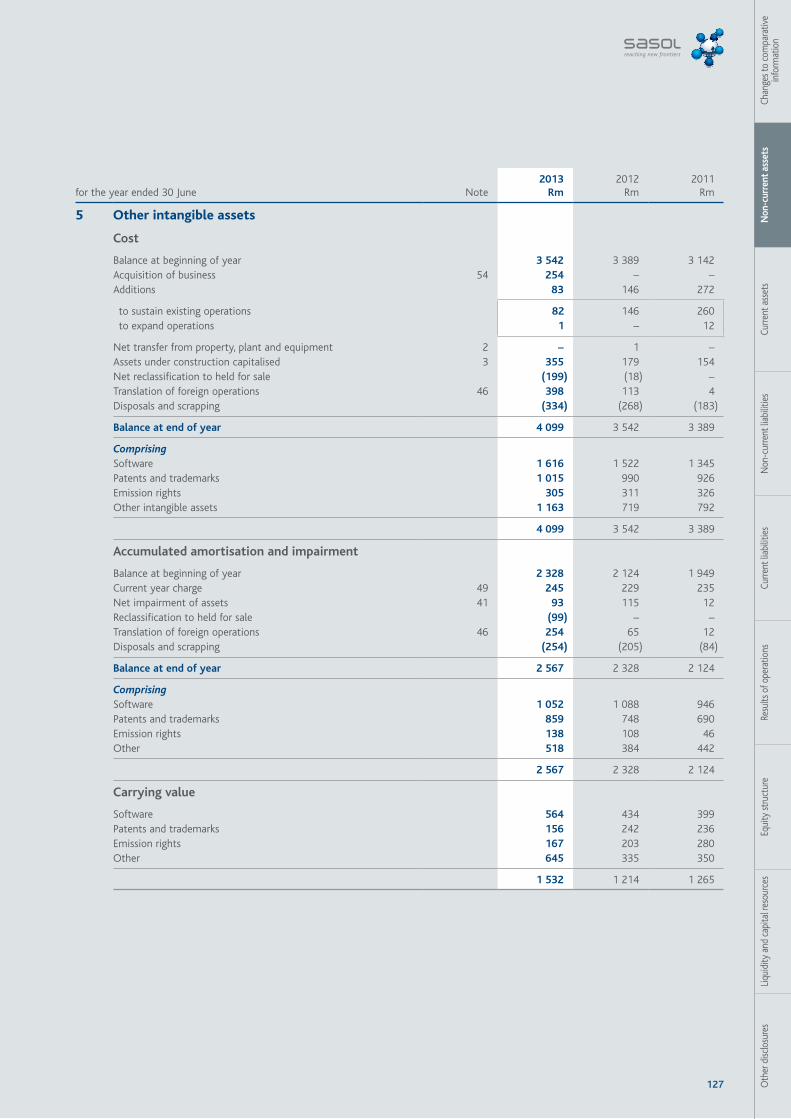
127 Oth
er d
isclo
sure
sLi
quid
ity a
nd c
apita
l res
ourc
esEq
uity
stru
ctur
eRe
sults
of o
pera
tions
Curre
nt li
abili
ties
Non
-cur
rent
liab
ilitie
sCu
rrent
ass
ets
Non
-cur
rent
ass
ets
Chan
ges t
o co
mpa
rativ
e in
form
atio
n
for the year ended 30 June Note 2013
Rm 2012
Rm 2011
Rm
5 Other intangible assets
Cost
Balance at beginning of year 3 542 3 389 3 142 Acquisition of business 54 254 – –Additions 83 146 272
to sustain existing operations 82 146 260 to expand operations 1 – 12
Net transfer from property, plant and equipment 2 – 1 –Assets under construction capitalised 3 355 179 154 Net reclassification to held for sale (199) (18) –Translation of foreign operations 46 398 113 4 Disposals and scrapping (334) (268) (183)
Balance at end of year 4 099 3 542 3 389
ComprisingSoftware 1 616 1 522 1 345 Patents and trademarks 1 015 990 926 Emission rights 305 311 326 Other intangible assets 1 163 719 792
4 099 3 542 3 389
Accumulated amortisation and impairment
Balance at beginning of year 2 328 2 124 1 949 Current year charge 49 245 229 235 Net impairment of assets 41 93 115 12 Reclassification to held for sale (99) – –Translation of foreign operations 46 254 65 12 Disposals and scrapping (254) (205) (84)
Balance at end of year 2 567 2 328 2 124
ComprisingSoftware 1 052 1 088 946 Patents and trademarks 859 748 690 Emission rights 138 108 46 Other 518 384 442
2 567 2 328 2 124
Carrying value
Software 564 434 399 Patents and trademarks 156 242 236 Emission rights 167 203 280 Other 645 335 350
1 532 1 214 1 265
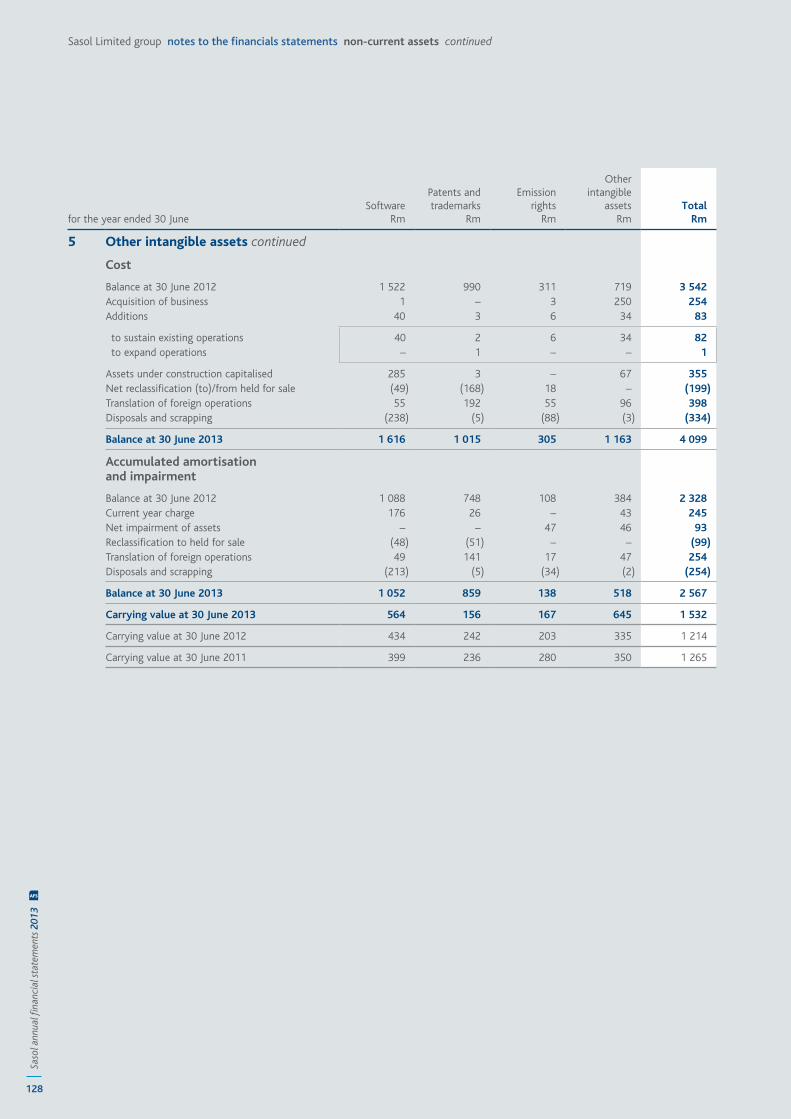
128
Saso
l ann
ual fi
nanc
ial s
tate
men
ts 2
013
AFS
Sasol Limited group notes to the financials statements non-current assets continued
for the year ended 30 JuneSoftware
Rm
Patents andtrademarks
Rm
Emissionrights
Rm
Otherintangible
assetsRm
TotalRm
5 Other intangible assets continued
Cost
Balance at 30 June 2012 1 522 990 311 719 3 542 Acquisition of business 1 – 3 250 254 Additions 40 3 6 34 83
to sustain existing operations 40 2 6 34 82 to expand operations – 1 – – 1
Assets under construction capitalised 285 3 – 67 355 Net reclassification (to)/from held for sale (49) (168) 18 – (199)Translation of foreign operations 55 192 55 96 398 Disposals and scrapping (238) (5) (88) (3) (334)
Balance at 30 June 2013 1 616 1 015 305 1 163 4 099
Accumulated amortisation and impairment
Balance at 30 June 2012 1 088 748 108 384 2 328 Current year charge 176 26 – 43 245 Net impairment of assets – – 47 46 93 Reclassification to held for sale (48) (51) – – (99)Translation of foreign operations 49 141 17 47 254 Disposals and scrapping (213) (5) (34) (2) (254)
Balance at 30 June 2013 1 052 859 138 518 2 567
Carrying value at 30 June 2013 564 156 167 645 1 532
Carrying value at 30 June 2012 434 242 203 335 1 214
Carrying value at 30 June 2011 399 236 280 350 1 265
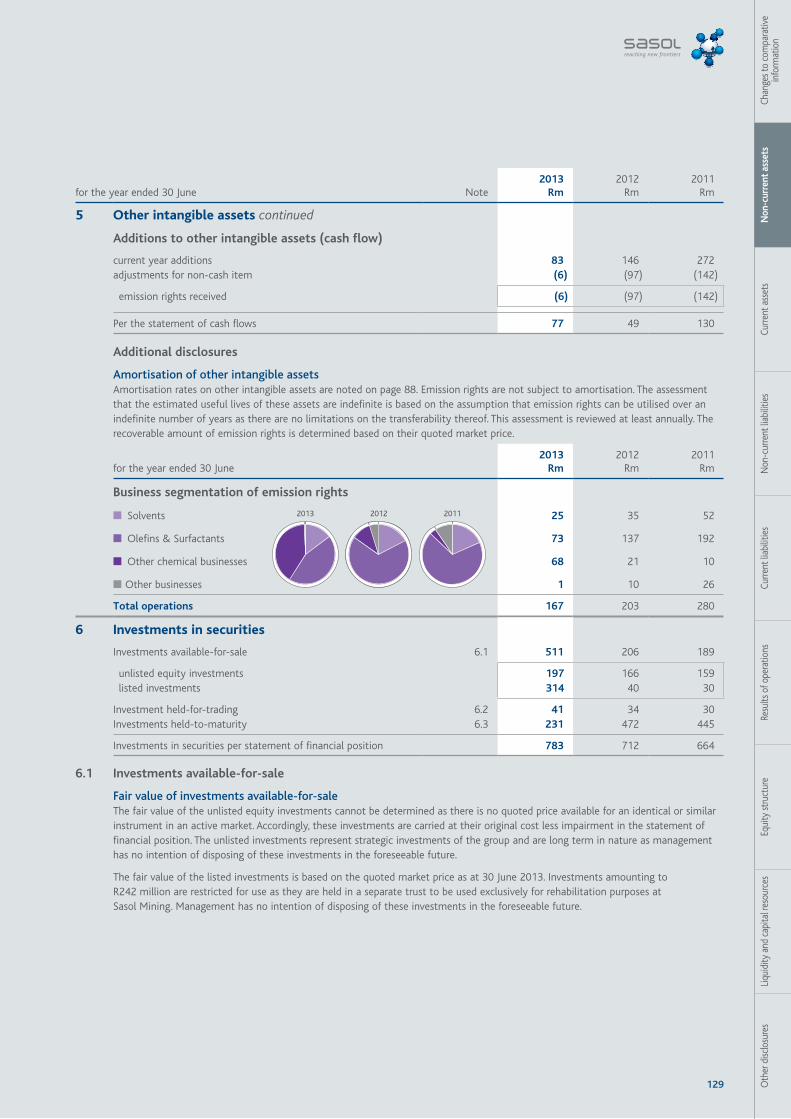
129 Oth
er d
isclo
sure
sLi
quid
ity a
nd c
apita
l res
ourc
esEq
uity
stru
ctur
eRe
sults
of o
pera
tions
Curre
nt li
abili
ties
Non
-cur
rent
liab
ilitie
sCu
rrent
ass
ets
Non
-cur
rent
ass
ets
Chan
ges t
o co
mpa
rativ
e in
form
atio
n
for the year ended 30 June Note2013
Rm 2012
Rm 2011
Rm
5 Other intangible assets continued
Additions to other intangible assets (cash flow)
current year additions 83 146 272 adjustments for non-cash item (6) (97) (142)
emission rights received (6) (97) (142)
Per the statement of cash flows 77 49 130
Additional disclosures
Amortisation of other intangible assetsAmortisation rates on other intangible assets are noted on page 88. Emission rights are not subject to amortisation. The assessment that the estimated useful lives of these assets are indefinite is based on the assumption that emission rights can be utilised over an indefinite number of years as there are no limitations on the transferability thereof. This assessment is reviewed at least annually. The recoverable amount of emission rights is determined based on their quoted market price.
for the year ended 30 June2013
Rm 2012
Rm 2011
Rm
Business segmentation of emission rights
■ Solvents 25 35 52
■ Olefins & Surfactants 73 137 192
■ Other chemical businesses 68 21 10
■ Other businesses 1 10 26
Total operations 167 203 280
6 Investments in securities
Investments available-for-sale 6.1 511 206 189
unlisted equity investments 197 166 159 listed investments 314 40 30
Investment held-for-trading 6.2 41 34 30 Investments held-to-maturity 6.3 231 472 445
Investments in securities per statement of financial position 783 712 664
6.1 Investments available-for-sale
Fair value of investments available-for-saleThe fair value of the unlisted equity investments cannot be determined as there is no quoted price available for an identical or similar instrument in an active market. Accordingly, these investments are carried at their original cost less impairment in the statement of financial position. The unlisted investments represent strategic investments of the group and are long term in nature as management has no intention of disposing of these investments in the foreseeable future.
The fair value of the listed investments is based on the quoted market price as at 30 June 2013. Investments amounting to R242 million are restricted for use as they are held in a separate trust to be used exclusively for rehabilitation purposes at Sasol Mining. Management has no intention of disposing of these investments in the foreseeable future.
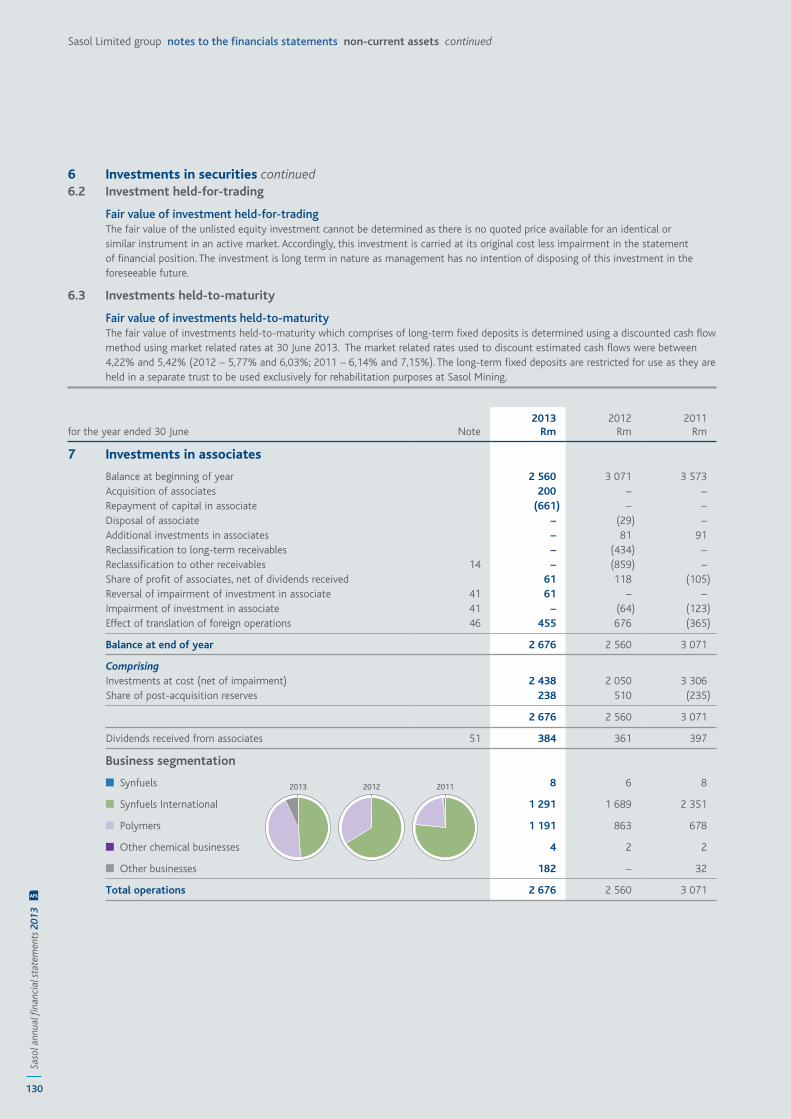
130
Saso
l ann
ual fi
nanc
ial s
tate
men
ts 2
013
AFS
Sasol Limited group notes to the financials statements non-current assets continued
6 Investments in securities continued6.2 Investment held-for-trading
Fair value of investment held-for-tradingThe fair value of the unlisted equity investment cannot be determined as there is no quoted price available for an identical or similar instrument in an active market. Accordingly, this investment is carried at its original cost less impairment in the statement of financial position. The investment is long term in nature as management has no intention of disposing of this investment in the foreseeable future.
6.3 Investments held-to-maturity
Fair value of investments held-to-maturityThe fair value of investments held-to-maturity which comprises of long-term fixed deposits is determined using a discounted cash flow method using market related rates at 30 June 2013. The market related rates used to discount estimated cash flows were between 4,22% and 5,42% (2012 – 5,77% and 6,03%; 2011 – 6,14% and 7,15%). The long-term fixed deposits are restricted for use as they are held in a separate trust to be used exclusively for rehabilitation purposes at Sasol Mining.
for the year ended 30 June Note 2013
Rm 2012
Rm 2011
Rm
7 Investments in associates
Balance at beginning of year 2 560 3 071 3 573 Acquisition of associates 200 – –Repayment of capital in associate (661) – –Disposal of associate – (29) –Additional investments in associates – 81 91 Reclassification to long-term receivables – (434) –Reclassification to other receivables 14 – (859) –Share of profit of associates, net of dividends received 61 118 (105)Reversal of impairment of investment in associate 41 61 – –Impairment of investment in associate 41 – (64) (123)Effect of translation of foreign operations 46 455 676 (365)
Balance at end of year 2 676 2 560 3 071
ComprisingInvestments at cost (net of impairment) 2 438 2 050 3 306 Share of post-acquisition reserves 238 510 (235)
2 676 2 560 3 071
Dividends received from associates 51 384 361 397
Business segmentation
■ Synfuels 8 6 8
■ Synfuels International 1 291 1 689 2 351
■ Polymers 1 191 863 678
■ Other chemical businesses 4 2 2
■ Other businesses 182 – 32
Total operations 2 676 2 560 3 071
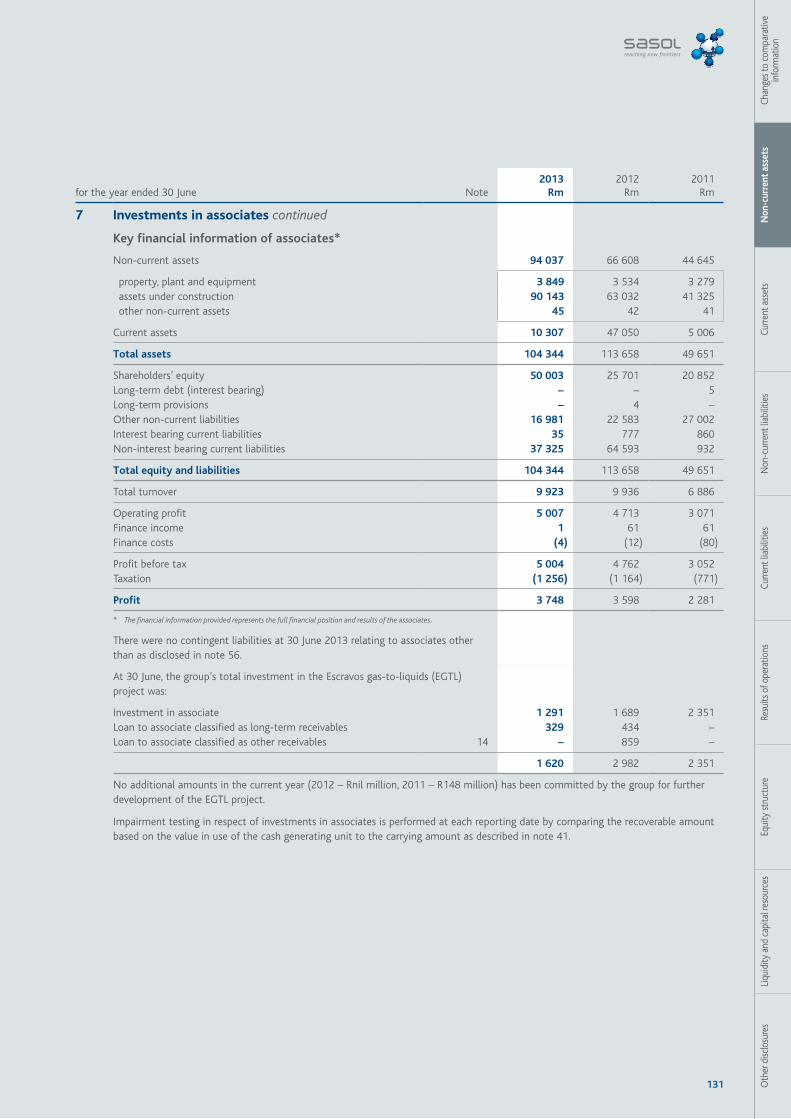
131 Oth
er d
isclo
sure
sLi
quid
ity a
nd c
apita
l res
ourc
esEq
uity
stru
ctur
eRe
sults
of o
pera
tions
Curre
nt li
abili
ties
Non
-cur
rent
liab
ilitie
sCu
rrent
ass
ets
Non
-cur
rent
ass
ets
Chan
ges t
o co
mpa
rativ
e in
form
atio
n
for the year ended 30 June Note 2013
Rm 2012
Rm 2011
Rm
7 Investments in associates continued
Key financial information of associates*
Non-current assets 94 037 66 608 44 645
property, plant and equipment 3 849 3 534 3 279 assets under construction 90 143 63 032 41 325 other non-current assets 45 42 41
Current assets 10 307 47 050 5 006
Total assets 104 344 113 658 49 651
Shareholders’ equity 50 003 25 701 20 852 Long-term debt (interest bearing) – – 5 Long-term provisions – 4 –Other non-current liabilities 16 981 22 583 27 002 Interest bearing current liabilities 35 777 860 Non-interest bearing current liabilities 37 325 64 593 932
Total equity and liabilities 104 344 113 658 49 651
Total turnover 9 923 9 936 6 886
Operating profit 5 007 4 713 3 071 Finance income 1 61 61 Finance costs (4) (12) (80)
Profit before tax 5 004 4 762 3 052 Taxation (1 256) (1 164) (771)
Profit 3 748 3 598 2 281
* The financial information provided represents the full financial position and results of the associates.
There were no contingent liabilities at 30 June 2013 relating to associates other than as disclosed in note 56.
At 30 June, the group’s total investment in the Escravos gas-to-liquids (EGTL) project was:
Investment in associate 1 291 1 689 2 351 Loan to associate classified as long-term receivables 329 434 –Loan to associate classified as other receivables 14 – 859 –
1 620 2 982 2 351
No additional amounts in the current year (2012 – Rnil million, 2011 – R148 million) has been committed by the group for further development of the EGTL project.
Impairment testing in respect of investments in associates is performed at each reporting date by comparing the recoverable amount based on the value in use of the cash generating unit to the carrying amount as described in note 41.
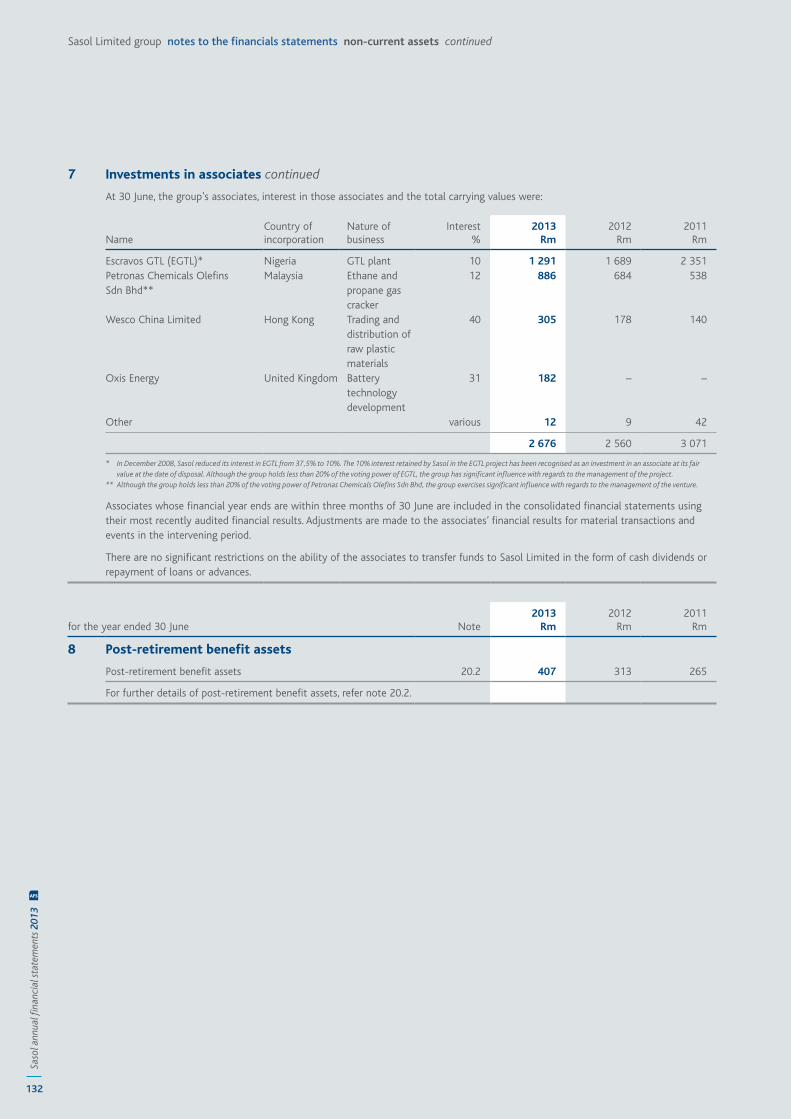
132
Saso
l ann
ual fi
nanc
ial s
tate
men
ts 2
013
AFS
Sasol Limited group notes to the financials statements non-current assets continued
7 Investments in associates continued
At 30 June, the group’s associates, interest in those associates and the total carrying values were:
NameCountry of incorporation
Nature of business
Interest%
2013Rm
2012Rm
2011Rm
Escravos GTL (EGTL)* Nigeria GTL plant 10 1 291 1 689 2 351 Petronas Chemicals Olefins Sdn Bhd**
Malaysia Ethane and propane gas cracker
12 886 684 538
Wesco China Limited Hong Kong Trading and distribution of raw plastic materials
40 305 178 140
Oxis Energy United Kingdom Battery technology development
31 182 – –
Other various 12 9 42
2 676 2 560 3 071
* In December 2008, Sasol reduced its interest in EGTL from 37,5% to 10%. The 10% interest retained by Sasol in the EGTL project has been recognised as an investment in an associate at its fair value at the date of disposal. Although the group holds less than 20% of the voting power of EGTL, the group has significant influence with regards to the management of the project.
** Although the group holds less than 20% of the voting power of Petronas Chemicals Olefins Sdn Bhd, the group exercises significant influence with regards to the management of the venture.
Associates whose financial year ends are within three months of 30 June are included in the consolidated financial statements using their most recently audited financial results. Adjustments are made to the associates’ financial results for material transactions and events in the intervening period.
There are no significant restrictions on the ability of the associates to transfer funds to Sasol Limited in the form of cash dividends or repayment of loans or advances.
for the year ended 30 June Note 2013
Rm 2012
Rm 2011
Rm
8 Post-retirement benefit assets
Post-retirement benefit assets 20.2 407 313 265
For further details of post-retirement benefit assets, refer note 20.2.
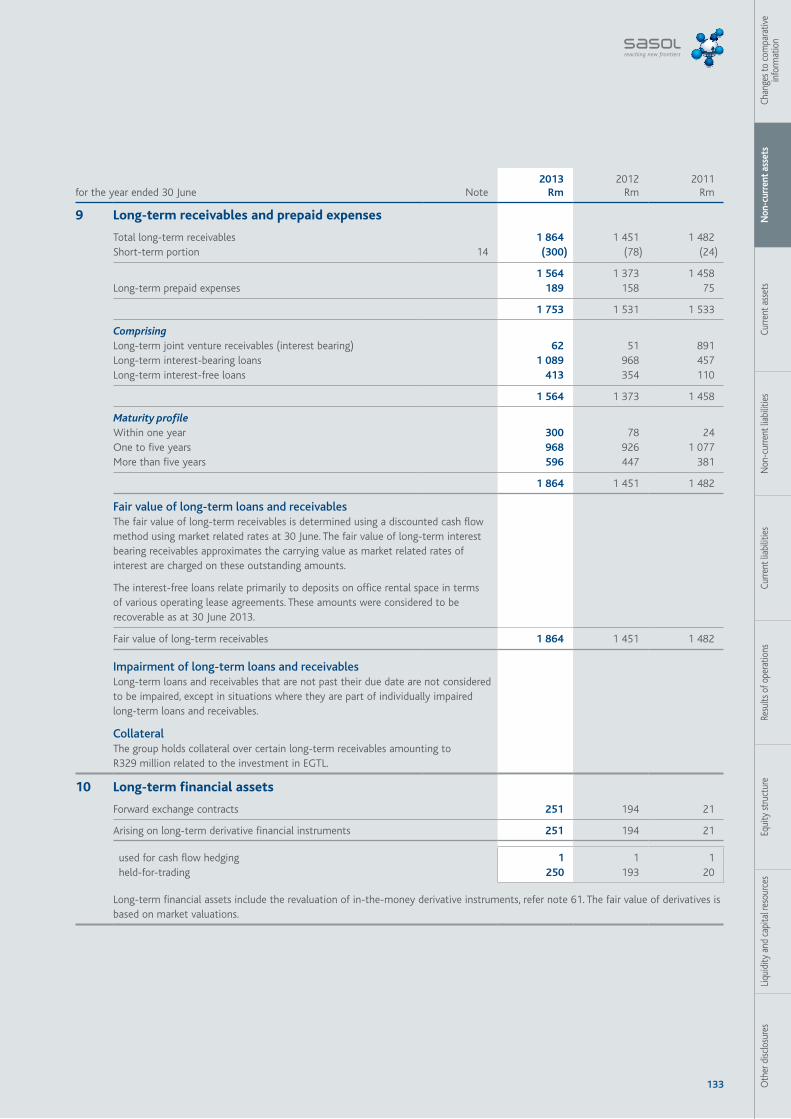
133 Oth
er d
isclo
sure
sLi
quid
ity a
nd c
apita
l res
ourc
esEq
uity
stru
ctur
eRe
sults
of o
pera
tions
Curre
nt li
abili
ties
Non
-cur
rent
liab
ilitie
sCu
rrent
ass
ets
Non
-cur
rent
ass
ets
Chan
ges t
o co
mpa
rativ
e in
form
atio
n
for the year ended 30 June Note2013
Rm 2012
Rm 2011
Rm
9 Long-term receivables and prepaid expenses
Total long-term receivables 1 864 1 451 1 482 Short-term portion 14 (300) (78) (24)
1 564 1 373 1 458 Long-term prepaid expenses 189 158 75
1 753 1 531 1 533
ComprisingLong-term joint venture receivables (interest bearing) 62 51 891 Long-term interest-bearing loans 1 089 968 457 Long-term interest-free loans 413 354 110
1 564 1 373 1 458
Maturity profileWithin one year 300 78 24 One to five years 968 926 1 077 More than five years 596 447 381
1 864 1 451 1 482
Fair value of long-term loans and receivablesThe fair value of long-term receivables is determined using a discounted cash flow method using market related rates at 30 June. The fair value of long-term interest bearing receivables approximates the carrying value as market related rates of interest are charged on these outstanding amounts.
The interest-free loans relate primarily to deposits on office rental space in terms of various operating lease agreements. These amounts were considered to be recoverable as at 30 June 2013.
Fair value of long-term receivables 1 864 1 451 1 482
Impairment of long-term loans and receivablesLong-term loans and receivables that are not past their due date are not considered to be impaired, except in situations where they are part of individually impaired long-term loans and receivables.
CollateralThe group holds collateral over certain long-term receivables amounting to R329 million related to the investment in EGTL.
10 Long-term financial assets
Forward exchange contracts 251 194 21
Arising on long-term derivative financial instruments 251 194 21
used for cash flow hedging 1 1 1 held-for-trading 250 193 20
Long-term financial assets include the revaluation of in-the-money derivative instruments, refer note 61. The fair value of derivatives is based on market valuations.
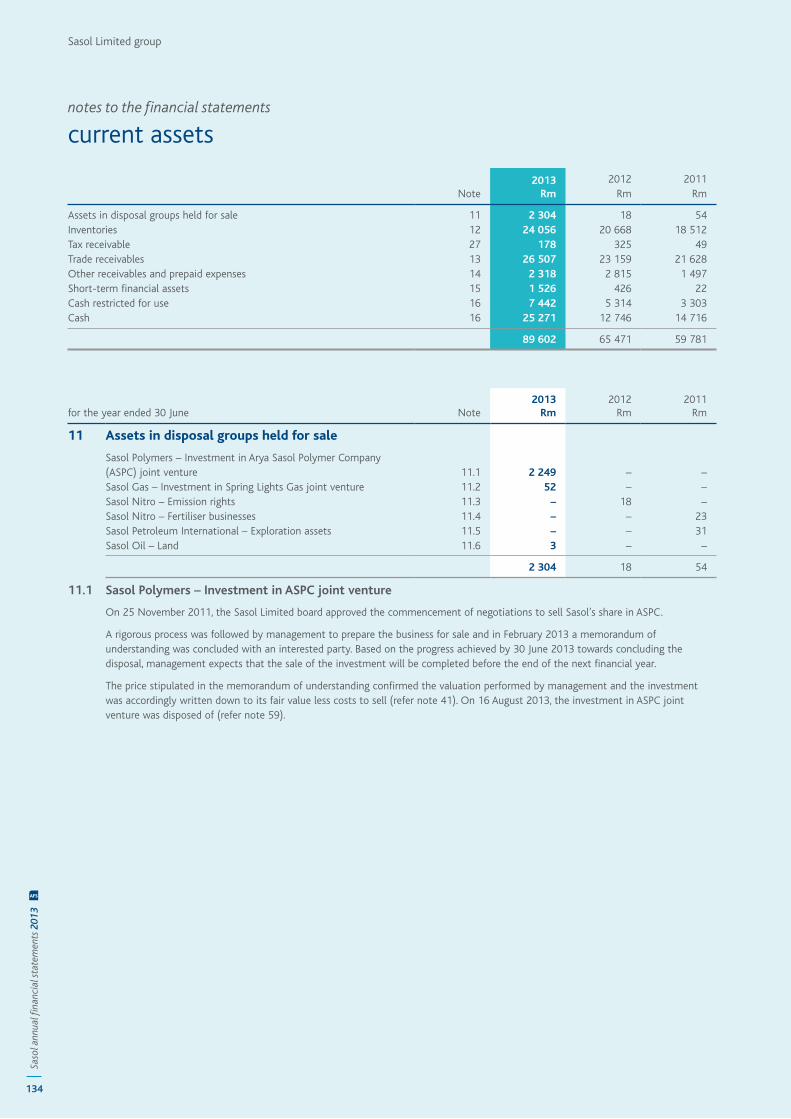
Sasol Limited group
134
Saso
l ann
ual fi
nanc
ial s
tate
men
ts 2
013
AFS
notes to the financial statements
current assets
for the year ended 30 June Note 2013
Rm 2012
Rm 2011
Rm
11 Assets in disposal groups held for sale
Sasol Polymers – Investment in Arya Sasol Polymer Company (ASPC) joint venture 11.1 2 249 – – Sasol Gas – Investment in Spring Lights Gas joint venture 11.2 52 – – Sasol Nitro – Emission rights 11.3 – 18 – Sasol Nitro – Fertiliser businesses 11.4 – – 23 Sasol Petroleum International – Exploration assets 11.5 – – 31 Sasol Oil – Land 11.6 3 – –
2 304 18 54
11.1 Sasol Polymers – Investment in ASPC joint venture
On 25 November 2011, the Sasol Limited board approved the commencement of negotiations to sell Sasol’s share in ASPC.
A rigorous process was followed by management to prepare the business for sale and in February 2013 a memorandum of understanding was concluded with an interested party. Based on the progress achieved by 30 June 2013 towards concluding the disposal, management expects that the sale of the investment will be completed before the end of the next financial year.
The price stipulated in the memorandum of understanding confirmed the valuation performed by management and the investment was accordingly written down to its fair value less costs to sell (refer note 41). On 16 August 2013, the investment in ASPC joint venture was disposed of (refer note 59).
Note 2013
Rm 2012
Rm 2011
Rm
Assets in disposal groups held for sale 11 2 304 18 54 Inventories 12 24 056 20 668 18 512 Tax receivable 27 178 325 49 Trade receivables 13 26 507 23 159 21 628 Other receivables and prepaid expenses 14 2 318 2 815 1 497 Short-term financial assets 15 1 526 426 22 Cash restricted for use 16 7 442 5 314 3 303 Cash 16 25 271 12 746 14 716
89 602 65 471 59 781
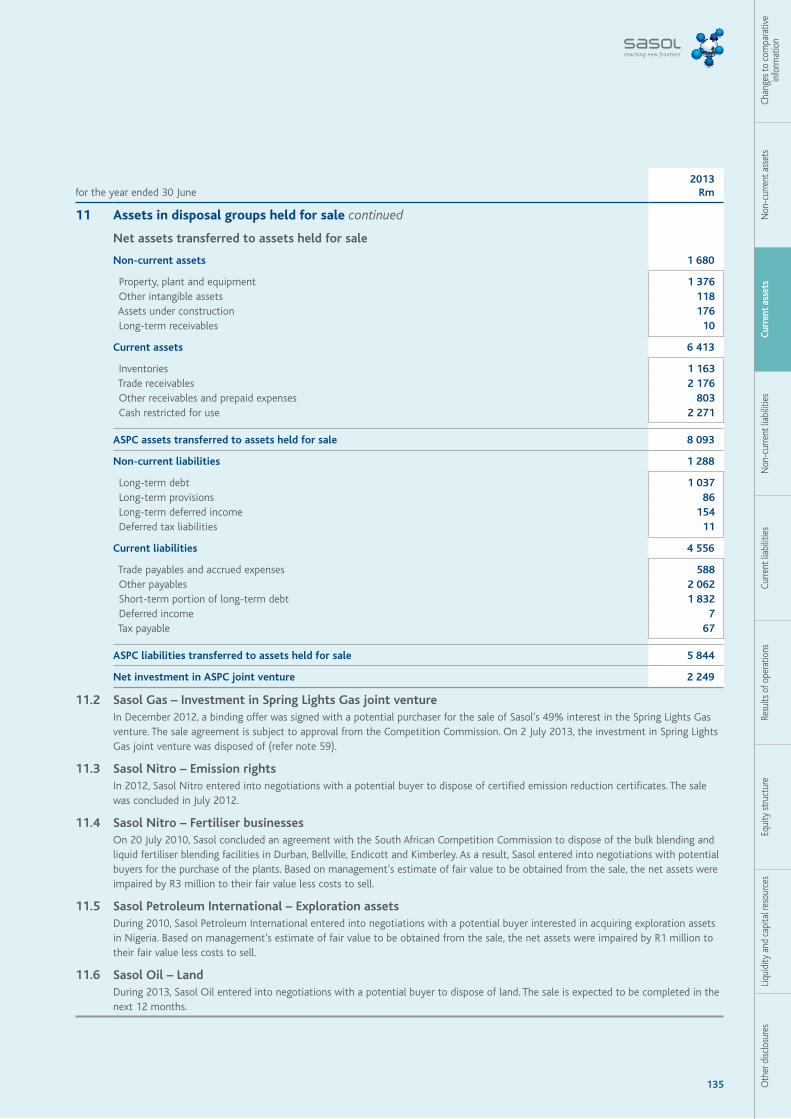
135 Oth
er d
isclo
sure
sLi
quid
ity a
nd c
apita
l res
ourc
esEq
uity
stru
ctur
eRe
sults
of o
pera
tions
Curre
nt li
abili
ties
Non
-cur
rent
liab
ilitie
sCu
rren
t ass
ets
Non
-cur
rent
ass
ets
Chan
ges t
o co
mpa
rativ
e in
form
atio
n
for the year ended 30 June2013
Rm
11 Assets in disposal groups held for sale continued
Net assets transferred to assets held for sale
Non-current assets 1 680
Property, plant and equipment 1 376 Other intangible assets 118 Assets under construction 176 Long-term receivables 10
Current assets 6 413
Inventories 1 163 Trade receivables 2 176 Other receivables and prepaid expenses 803 Cash restricted for use 2 271
ASPC assets transferred to assets held for sale 8 093
Non-current liabilities 1 288
Long-term debt 1 037 Long-term provisions 86 Long-term deferred income 154 Deferred tax liabilities 11
Current liabilities 4 556
Trade payables and accrued expenses 588 Other payables 2 062 Short-term portion of long-term debt 1 832 Deferred income 7 Tax payable 67
ASPC liabilities transferred to assets held for sale 5 844
Net investment in ASPC joint venture 2 249
11.2 Sasol Gas – Investment in Spring Lights Gas joint venture In December 2012, a binding offer was signed with a potential purchaser for the sale of Sasol's 49% interest in the Spring Lights Gas venture. The sale agreement is subject to approval from the Competition Commission. On 2 July 2013, the investment in Spring Lights Gas joint venture was disposed of (refer note 59).
11.3 Sasol Nitro – Emission rights In 2012, Sasol Nitro entered into negotiations with a potential buyer to dispose of certified emission reduction certificates. The sale was concluded in July 2012.
11.4 Sasol Nitro – Fertiliser businesses On 20 July 2010, Sasol concluded an agreement with the South African Competition Commission to dispose of the bulk blending and liquid fertiliser blending facilities in Durban, Bellville, Endicott and Kimberley. As a result, Sasol entered into negotiations with potential buyers for the purchase of the plants. Based on management’s estimate of fair value to be obtained from the sale, the net assets were impaired by R3 million to their fair value less costs to sell.
11.5 Sasol Petroleum International – Exploration assets During 2010, Sasol Petroleum International entered into negotiations with a potential buyer interested in acquiring exploration assets in Nigeria. Based on management’s estimate of fair value to be obtained from the sale, the net assets were impaired by R1 million to their fair value less costs to sell.
11.6 Sasol Oil – Land During 2013, Sasol Oil entered into negotiations with a potential buyer to dispose of land. The sale is expected to be completed in the next 12 months.
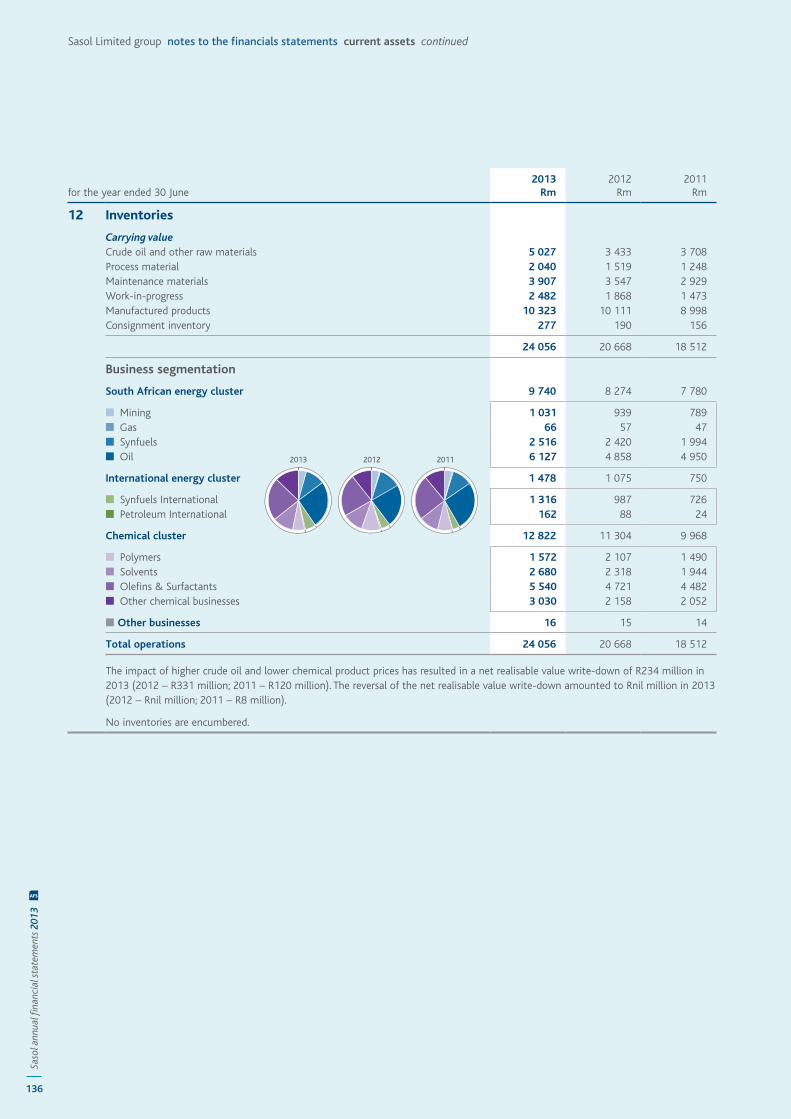
136
Saso
l ann
ual fi
nanc
ial s
tate
men
ts 2
013
AFS
Sasol Limited group notes to the financials statements current assets continued
for the year ended 30 June2013
Rm 2012
Rm 2011
Rm
12 Inventories
Carrying valueCrude oil and other raw materials 5 027 3 433 3 708 Process material 2 040 1 519 1 248 Maintenance materials 3 907 3 547 2 929 Work-in-progress 2 482 1 868 1 473 Manufactured products 10 323 10 111 8 998 Consignment inventory 277 190 156
24 056 20 668 18 512
Business segmentation
South African energy cluster 9 740 8 274 7 780
■ Mining 1 031 939 789 ■ Gas 66 57 47 ■ Synfuels 2 516 2 420 1 994 ■ Oil 6 127 4 858 4 950
International energy cluster 1 478 1 075 750
■ Synfuels International 1 316 987 726 ■ Petroleum International 162 88 24
Chemical cluster 12 822 11 304 9 968
■ Polymers 1 572 2 107 1 490 ■ Solvents 2 680 2 318 1 944 ■ Olefins & Surfactants 5 540 4 721 4 482 ■ Other chemical businesses 3 030 2 158 2 052
■ Other businesses 16 15 14
Total operations 24 056 20 668 18 512
The impact of higher crude oil and lower chemical product prices has resulted in a net realisable value write-down of R234 million in 2013 (2012 – R331 million; 2011 – R120 million). The reversal of the net realisable value write-down amounted to Rnil million in 2013 (2012 – Rnil million; 2011 – R8 million).
No inventories are encumbered.
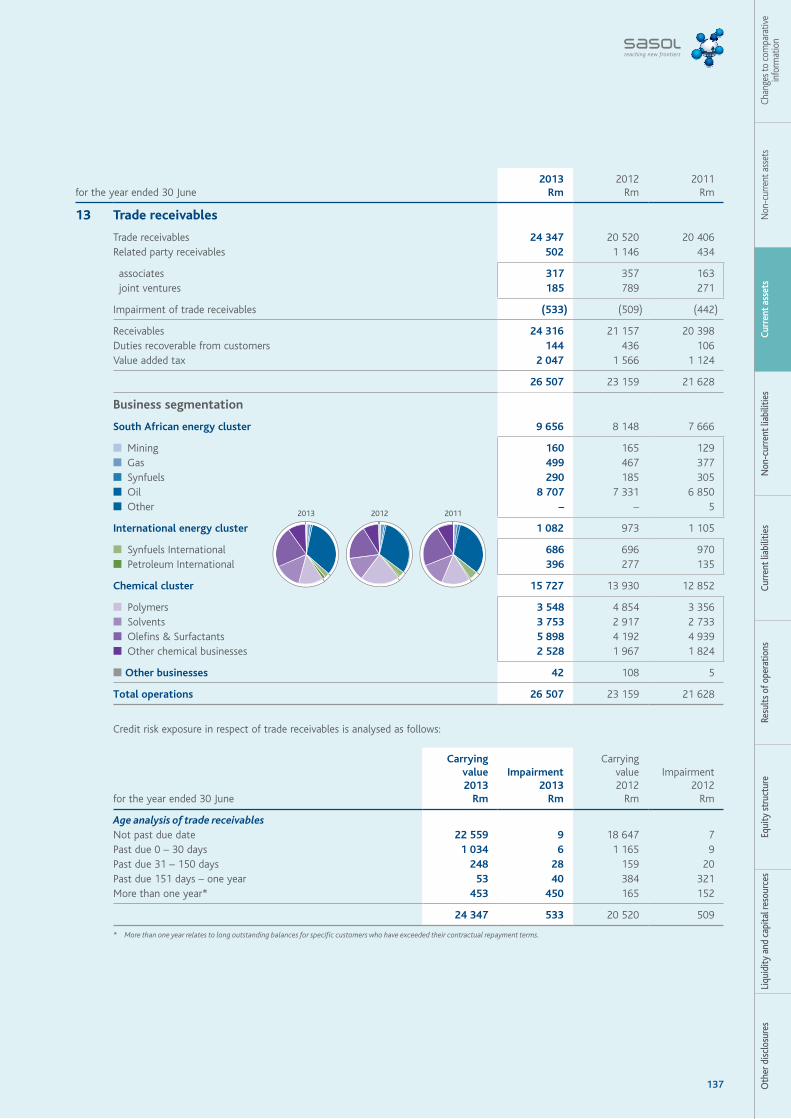
137 Oth
er d
iscl
osur
esLi
quid
ity a
nd c
apita
l res
ourc
esEq
uity
str
uctu
reRe
sults
of o
pera
tions
Curr
ent l
iabi
litie
sN
on-c
urre
nt li
abili
ties
Curr
ent a
sset
sN
on-c
urre
nt a
sset
sCh
ange
s to
com
para
tive
info
rmat
ion
for the year ended 30 June2013
Rm 2012
Rm 2011
Rm
13 Trade receivables
Trade receivables 24 347 20 520 20 406 Related party receivables 502 1 146 434
associates 317 357 163 joint ventures 185 789 271
Impairment of trade receivables (533) (509) (442)
Receivables 24 316 21 157 20 398 Duties recoverable from customers 144 436 106 Value added tax 2 047 1 566 1 124
26 507 23 159 21 628
Business segmentation
South African energy cluster 9 656 8 148 7 666
■ Mining 160 165 129 ■ Gas 499 467 377 ■ Synfuels 290 185 305 ■ Oil 8 707 7 331 6 850 ■ Other – – 5
International energy cluster 1 082 973 1 105
■ Synfuels International 686 696 970 ■ Petroleum International 396 277 135
Chemical cluster 15 727 13 930 12 852
■ Polymers 3 548 4 854 3 356 ■ Solvents 3 753 2 917 2 733 ■ Olefins & Surfactants 5 898 4 192 4 939 ■ Other chemical businesses 2 528 1 967 1 824
■ Other businesses 42 108 5
Total operations 26 507 23 159 21 628
Credit risk exposure in respect of trade receivables is analysed as follows:
for the year ended 30 June
Carryingvalue2013
Rm
Impairment2013
Rm
Carryingvalue2012
Rm
Impairment2012
Rm
Age analysis of trade receivablesNot past due date 22 559 9 18 647 7 Past due 0 – 30 days 1 034 6 1 165 9 Past due 31 – 150 days 248 28 159 20 Past due 151 days – one year 53 40 384 321 More than one year* 453 450 165 152
24 347 533 20 520 509
* More than one year relates to long outstanding balances for specific customers who have exceeded their contractual repayment terms.
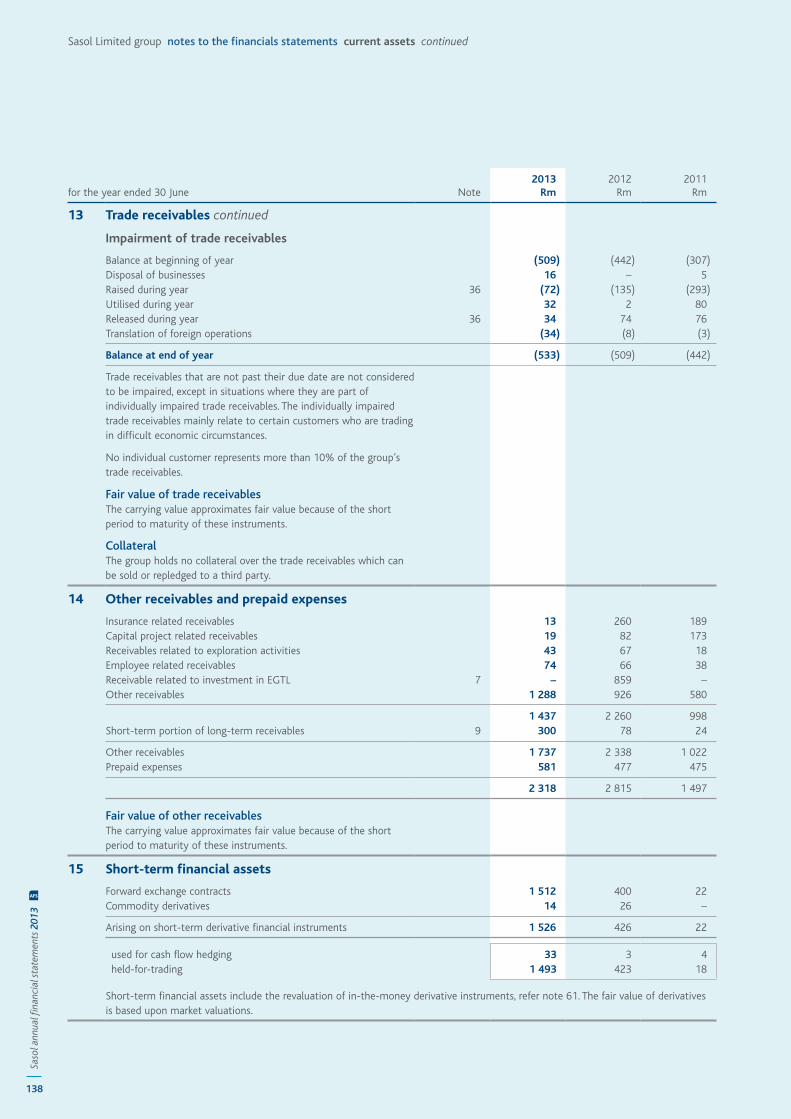
138
Saso
l ann
ual fi
nanc
ial s
tate
men
ts 2
013
AFS
Sasol Limited group notes to the financials statements current assets continued
for the year ended 30 June Note 2013
Rm 2012
Rm 2011
Rm
13 Trade receivables continued
Impairment of trade receivables
Balance at beginning of year (509) (442) (307)Disposal of businesses 16 – 5 Raised during year 36 (72) (135) (293)Utilised during year 32 2 80 Released during year 36 34 74 76 Translation of foreign operations (34) (8) (3)
Balance at end of year (533) (509) (442)
Trade receivables that are not past their due date are not considered to be impaired, except in situations where they are part of individually impaired trade receivables. The individually impaired trade receivables mainly relate to certain customers who are trading in difficult economic circumstances.
No individual customer represents more than 10% of the group’s trade receivables.
Fair value of trade receivablesThe carrying value approximates fair value because of the short period to maturity of these instruments.
CollateralThe group holds no collateral over the trade receivables which can be sold or repledged to a third party.
14 Other receivables and prepaid expenses
Insurance related receivables 13 260 189 Capital project related receivables 19 82 173 Receivables related to exploration activities 43 67 18 Employee related receivables 74 66 38 Receivable related to investment in EGTL 7 – 859 –Other receivables 1 288 926 580
1 437 2 260 998 Short-term portion of long-term receivables 9 300 78 24
Other receivables 1 737 2 338 1 022 Prepaid expenses 581 477 475
2 318 2 815 1 497
Fair value of other receivablesThe carrying value approximates fair value because of the short period to maturity of these instruments.
15 Short-term financial assets
Forward exchange contracts 1 512 400 22 Commodity derivatives 14 26 –
Arising on short-term derivative financial instruments 1 526 426 22
used for cash flow hedging 33 3 4 held-for-trading 1 493 423 18
Short-term financial assets include the revaluation of in-the-money derivative instruments, refer note 61. The fair value of derivatives is based upon market valuations.
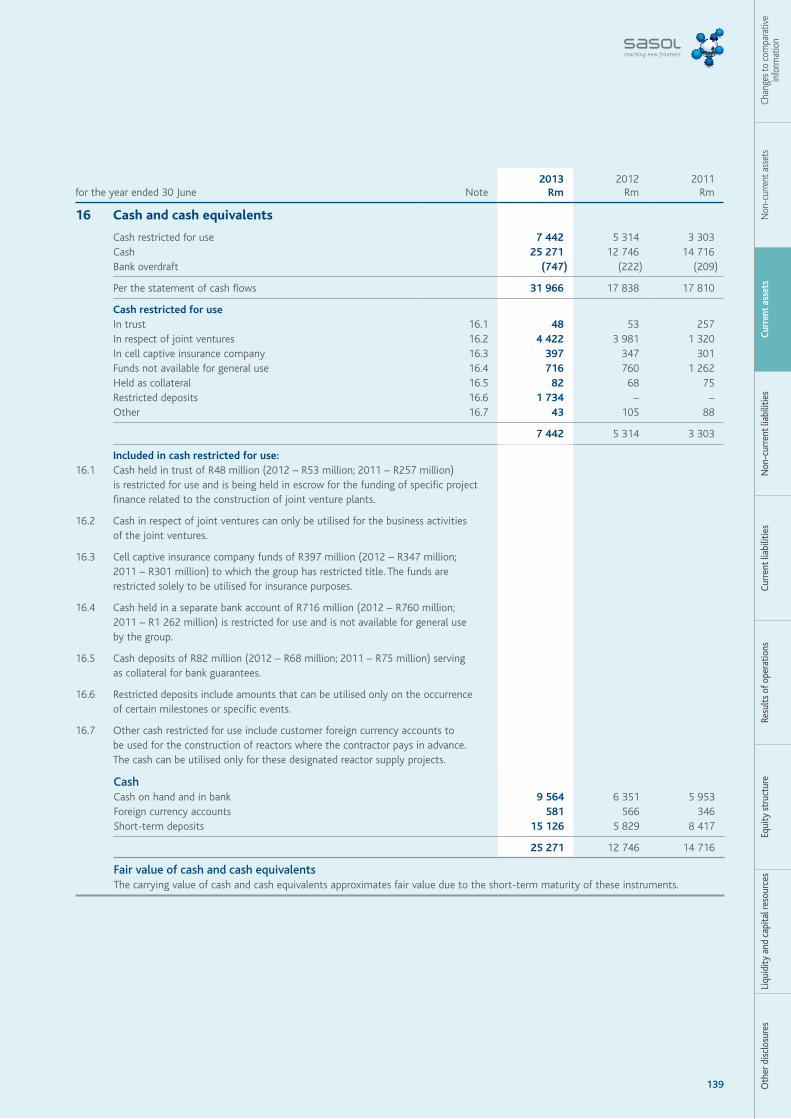
139 Oth
er d
iscl
osur
esLi
quid
ity a
nd c
apita
l res
ourc
esEq
uity
str
uctu
reRe
sults
of o
pera
tions
Curr
ent l
iabi
litie
sN
on-c
urre
nt li
abili
ties
Curr
ent a
sset
sN
on-c
urre
nt a
sset
sCh
ange
s to
com
para
tive
info
rmat
ion
for the year ended 30 June Note 2013
Rm 2012
Rm 2011
Rm
16 Cash and cash equivalents
Cash restricted for use 7 442 5 314 3 303 Cash 25 271 12 746 14 716 Bank overdraft (747) (222) (209)
Per the statement of cash flows 31 966 17 838 17 810
Cash restricted for useIn trust 16.1 48 53 257 In respect of joint ventures 16.2 4 422 3 981 1 320 In cell captive insurance company 16.3 397 347 301 Funds not available for general use 16.4 716 760 1 262 Held as collateral 16.5 82 68 75 Restricted deposits 16.6 1 734 – –Other 16.7 43 105 88
7 442 5 314 3 303
Included in cash restricted for use:16.1 Cash held in trust of R48 million (2012 – R53 million; 2011 – R257 million)
is restricted for use and is being held in escrow for the funding of specific project finance related to the construction of joint venture plants.
16.2 Cash in respect of joint ventures can only be utilised for the business activities of the joint ventures.
16.3 Cell captive insurance company funds of R397 million (2012 – R347 million; 2011 – R301 million) to which the group has restricted title. The funds are restricted solely to be utilised for insurance purposes.
16.4 Cash held in a separate bank account of R716 million (2012 – R760 million; 2011 – R1 262 million) is restricted for use and is not available for general use by the group.
16.5 Cash deposits of R82 million (2012 – R68 million; 2011 – R75 million) serving as collateral for bank guarantees.
16.6 Restricted deposits include amounts that can be utilised only on the occurrence of certain milestones or specific events.
16.7 Other cash restricted for use include customer foreign currency accounts to be used for the construction of reactors where the contractor pays in advance. The cash can be utilised only for these designated reactor supply projects.
Cash Cash on hand and in bank 9 564 6 351 5 953 Foreign currency accounts 581 566 346 Short-term deposits 15 126 5 829 8 417
25 271 12 746 14 716
Fair value of cash and cash equivalentsThe carrying value of cash and cash equivalents approximates fair value due to the short-term maturity of these instruments.
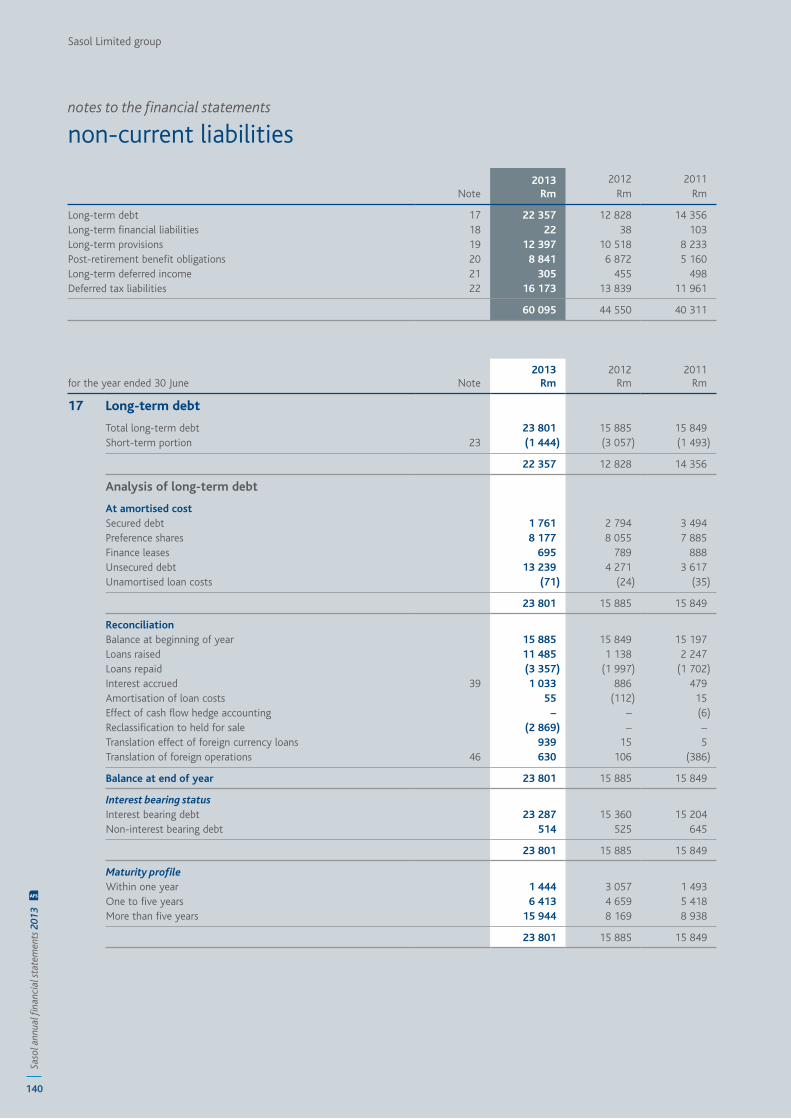
Sasol Limited group
140
Saso
l ann
ual fi
nanc
ial s
tate
men
ts 2
013
AFS
notes to the financial statements
non-current liabilities
for the year ended 30 June Note 2013
Rm 2012
Rm 2011
Rm
17 Long-term debt
Total long-term debt 23 801 15 885 15 849 Short-term portion 23 (1 444) (3 057) (1 493)
22 357 12 828 14 356
Analysis of long-term debt
At amortised costSecured debt 1 761 2 794 3 494 Preference shares 8 177 8 055 7 885 Finance leases 695 789 888 Unsecured debt 13 239 4 271 3 617 Unamortised loan costs (71) (24) (35)
23 801 15 885 15 849
ReconciliationBalance at beginning of year 15 885 15 849 15 197 Loans raised 11 485 1 138 2 247 Loans repaid (3 357) (1 997) (1 702)Interest accrued 39 1 033 886 479 Amortisation of loan costs 55 (112) 15 Effect of cash flow hedge accounting – – (6)Reclassification to held for sale (2 869) – –Translation effect of foreign currency loans 939 15 5 Translation of foreign operations 46 630 106 (386)
Balance at end of year 23 801 15 885 15 849
Interest bearing status Interest bearing debt 23 287 15 360 15 204 Non-interest bearing debt 514 525 645
23 801 15 885 15 849
Maturity profileWithin one year 1 444 3 057 1 493 One to five years 6 413 4 659 5 418 More than five years 15 944 8 169 8 938
23 801 15 885 15 849
Note 2013
Rm 2012
Rm 2011
Rm
Long-term debt 17 22 357 12 828 14 356 Long-term financial liabilities 18 22 38 103 Long-term provisions 19 12 397 10 518 8 233 Post-retirement benefit obligations 20 8 841 6 872 5 160 Long-term deferred income 21 305 455 498 Deferred tax liabilities 22 16 173 13 839 11 961
60 095 44 550 40 311
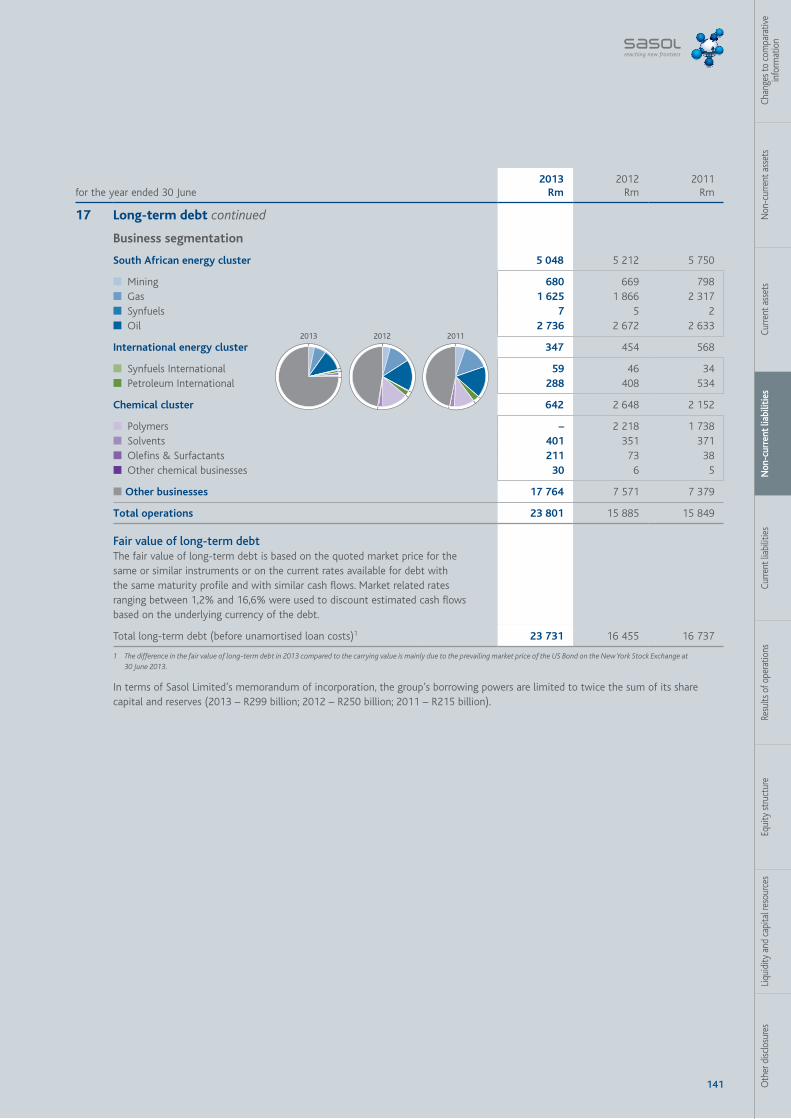
141 Oth
er d
isclo
sure
sLi
quid
ity a
nd c
apita
l res
ourc
esEq
uity
stru
ctur
eRe
sults
of o
pera
tions
Curre
nt li
abili
ties
Non
-cur
rent
liab
iliti
esCu
rrent
ass
ets
Non
-cur
rent
ass
ets
Chan
ges t
o co
mpa
rativ
e in
form
atio
n
for the year ended 30 June2013
Rm 2012
Rm 2011
Rm
17 Long-term debt continued
Business segmentation
South African energy cluster 5 048 5 212 5 750
■ Mining 680 669 798 ■ Gas 1 625 1 866 2 317 ■ Synfuels 7 5 2 ■ Oil 2 736 2 672 2 633
International energy cluster 347 454 568
■ Synfuels International 59 46 34 ■ Petroleum International 288 408 534
Chemical cluster 642 2 648 2 152
■ Polymers – 2 218 1 738 ■ Solvents 401 351 371 ■ Olefins & Surfactants 211 73 38 ■ Other chemical businesses 30 6 5
■ Other businesses 17 764 7 571 7 379
Total operations 23 801 15 885 15 849
Fair value of long-term debtThe fair value of long-term debt is based on the quoted market price for the same or similar instruments or on the current rates available for debt with the same maturity profile and with similar cash flows. Market related rates ranging between 1,2% and 16,6% were used to discount estimated cash flows based on the underlying currency of the debt.
Total long-term debt (before unamortised loan costs)1 23 731 16 455 16 737
1 The difference in the fair value of long-term debt in 2013 compared to the carrying value is mainly due to the prevailing market price of the US Bond on the New York Stock Exchange at 30 June 2013.
In terms of Sasol Limited’s memorandum of incorporation, the group’s borrowing powers are limited to twice the sum of its share capital and reserves (2013 – R299 billion; 2012 – R250 billion; 2011 – R215 billion).
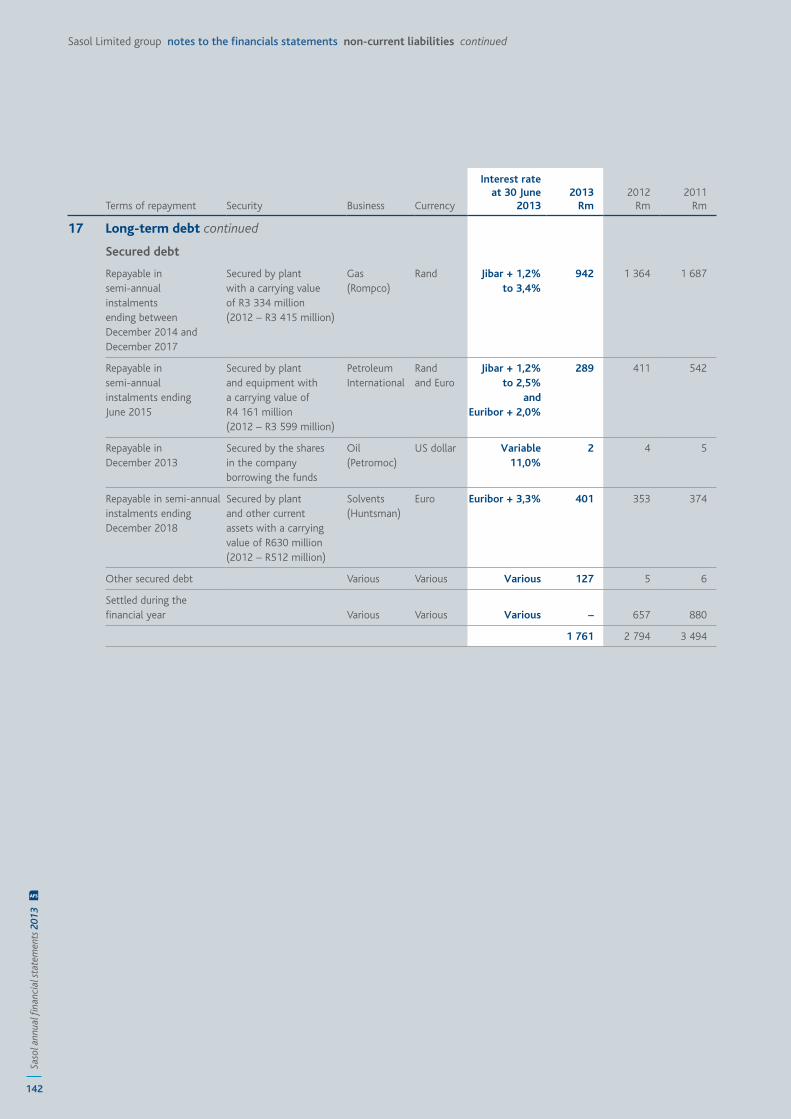
142
Saso
l ann
ual fi
nanc
ial s
tate
men
ts 2
013
AFS
Sasol Limited group notes to the financials statements non-current liabilities continued
Terms of repayment Security Business Currency
Interest rate at 30 June
2013 2013
Rm2012
Rm2011
Rm
17 Long-term debt continued
Secured debt
Repayable in semi-annual instalments ending between December 2014 and December 2017
Secured by plant with a carrying value of R3 334 million (2012 – R3 415 million)
Gas (Rompco)
Rand Jibar + 1,2% to 3,4%
942 1 364 1 687
Repayable in semi-annual instalments ending June 2015
Secured by plant and equipment with a carrying value of R4 161 million (2012 – R3 599 million)
Petroleum International
Rand and Euro
Jibar + 1,2%to 2,5%
andEuribor + 2,0%
289 411 542
Repayable in December 2013
Secured by the shares in the company borrowing the funds
Oil (Petromoc)
US dollar Variable11,0%
2 4 5
Repayable in semi-annual instalments ending December 2018
Secured by plant and other current assets with a carrying value of R630 million (2012 – R512 million)
Solvents (Huntsman)
Euro Euribor + 3,3% 401 353 374
Other secured debt Various Various Various 127 5 6
Settled during the financial year Various Various Various – 657 880
1 761 2 794 3 494
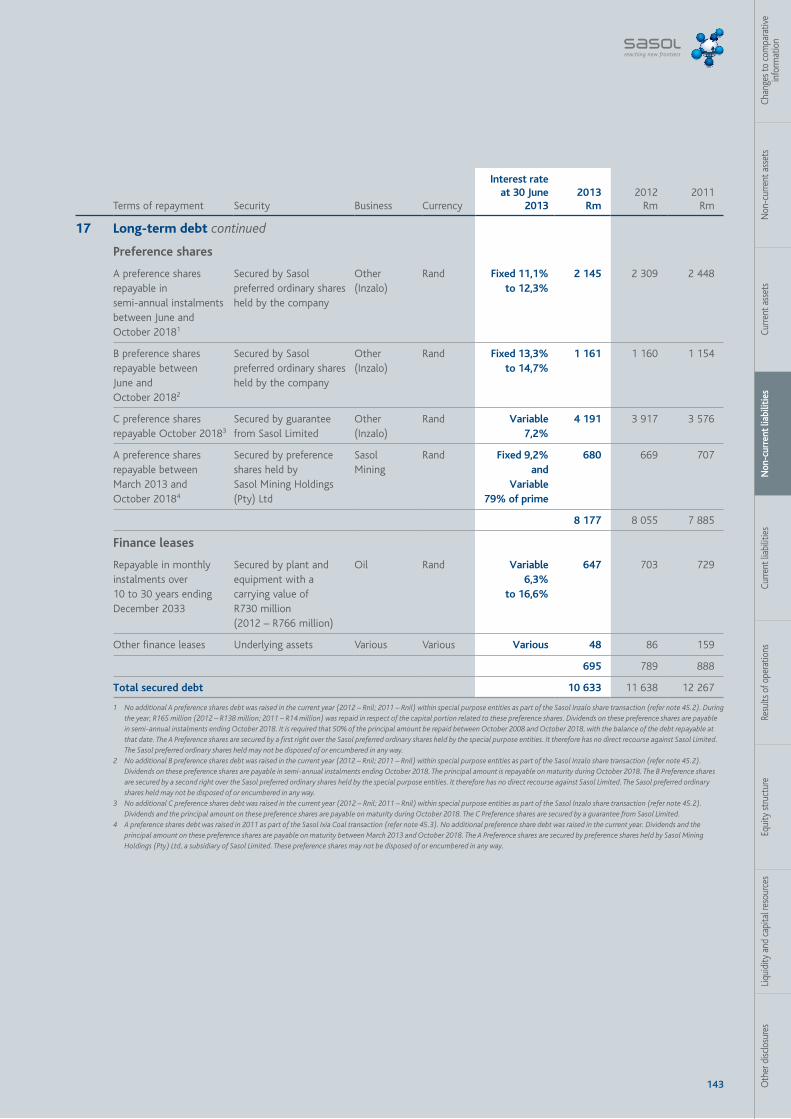
143 Oth
er d
isclo
sure
sLi
quid
ity a
nd c
apita
l res
ourc
esEq
uity
stru
ctur
eRe
sults
of o
pera
tions
Curre
nt li
abili
ties
Non
-cur
rent
liab
iliti
esCu
rrent
ass
ets
Non
-cur
rent
ass
ets
Chan
ges t
o co
mpa
rativ
e in
form
atio
n
Terms of repayment Security Business Currency
Interest rate at 30 June
2013 2013
Rm2012
Rm2011
Rm
17 Long-term debt continued
Preference shares
A preference shares repayable in semi-annual instalments between June and October 20181
Secured by Sasol preferred ordinary shares held by the company
Other (Inzalo)
Rand Fixed 11,1%to 12,3%
2 145 2 309 2 448
B preference shares repayable between June and October 20182
Secured by Sasol preferred ordinary shares held by the company
Other (Inzalo)
Rand Fixed 13,3%to 14,7%
1 161 1 160 1 154
C preference shares repayable October 20183
Secured by guarantee from Sasol Limited
Other (Inzalo)
Rand Variable7,2%
4 191 3 917 3 576
A preference shares repayable between March 2013 and October 20184
Secured by preference shares held by Sasol Mining Holdings (Pty) Ltd
Sasol Mining
Rand Fixed 9,2%and
Variable79% of prime
680 669 707
8 177 8 055 7 885
Finance leases
Repayable in monthly instalments over 10 to 30 years ending December 2033
Secured by plant and equipment with a carrying value of R730 million (2012 – R766 million)
Oil Rand Variable6,3%
to 16,6%
647 703 729
Other finance leases Underlying assets Various Various Various 48 86 159
695 789 888
Total secured debt 10 633 11 638 12 267
1 No additional A preference shares debt was raised in the current year (2012 – Rnil; 2011 – Rnil) within special purpose entities as part of the Sasol Inzalo share transaction (refer note 45.2). During the year, R165 million (2012 – R138 million; 2011 – R14 million) was repaid in respect of the capital portion related to these preference shares. Dividends on these preference shares are payable in semi-annual instalments ending October 2018. It is required that 50% of the principal amount be repaid between October 2008 and October 2018, with the balance of the debt repayable at that date. The A Preference shares are secured by a first right over the Sasol preferred ordinary shares held by the special purpose entities. It therefore has no direct recourse against Sasol Limited. The Sasol preferred ordinary shares held may not be disposed of or encumbered in any way.
2 No additional B preference shares debt was raised in the current year (2012 – Rnil; 2011 – Rnil) within special purpose entities as part of the Sasol Inzalo share transaction (refer note 45.2). Dividends on these preference shares are payable in semi-annual instalments ending October 2018. The principal amount is repayable on maturity during October 2018. The B Preference shares are secured by a second right over the Sasol preferred ordinary shares held by the special purpose entities. It therefore has no direct recourse against Sasol Limited. The Sasol preferred ordinary shares held may not be disposed of or encumbered in any way.
3 No additional C preference shares debt was raised in the current year (2012 – Rnil; 2011 – Rnil) within special purpose entities as part of the Sasol Inzalo share transaction (refer note 45.2). Dividends and the principal amount on these preference shares are payable on maturity during October 2018. The C Preference shares are secured by a guarantee from Sasol Limited.
4 A preference shares debt was raised in 2011 as part of the Sasol Ixia Coal transaction (refer note 45.3). No additional preference share debt was raised in the current year. Dividends and the principal amount on these preference shares are payable on maturity between March 2013 and October 2018. The A Preference shares are secured by preference shares held by Sasol Mining Holdings (Pty) Ltd, a subsidiary of Sasol Limited. These preference shares may not be disposed of or encumbered in any way.
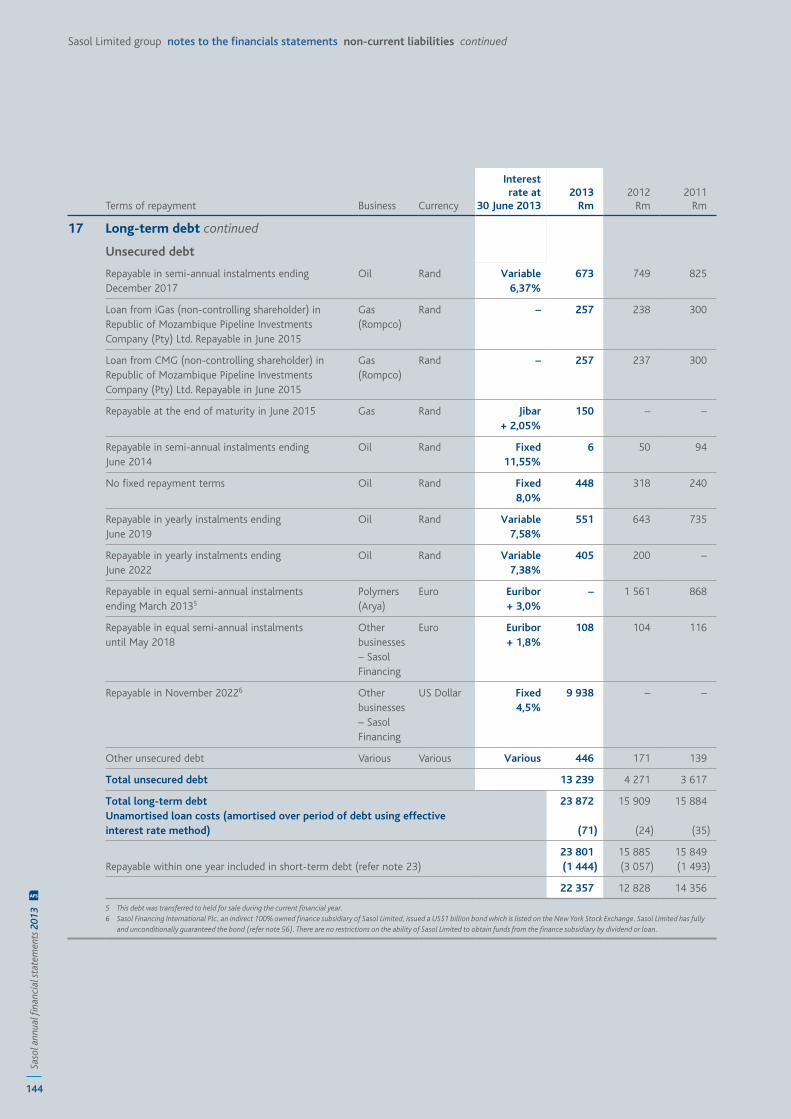
144
Saso
l ann
ual fi
nanc
ial s
tate
men
ts 2
013
AFS
Sasol Limited group notes to the financials statements non-current liabilities continued
Terms of repayment Business Currency
Interestrate at
30 June 2013 2013
Rm2012
Rm2011
Rm
17 Long-term debt continued
Unsecured debt
Repayable in semi-annual instalments ending December 2017
Oil Rand Variable6,37%
673 749 825
Loan from iGas (non-controlling shareholder) in Republic of Mozambique Pipeline Investments Company (Pty) Ltd. Repayable in June 2015
Gas (Rompco)
Rand – 257 238 300
Loan from CMG (non-controlling shareholder) in Republic of Mozambique Pipeline Investments Company (Pty) Ltd. Repayable in June 2015
Gas (Rompco)
Rand – 257 237 300
Repayable at the end of maturity in June 2015 Gas Rand Jibar+ 2,05%
150 – –
Repayable in semi-annual instalments ending June 2014
Oil Rand Fixed11,55%
6 50 94
No fixed repayment terms Oil Rand Fixed8,0%
448 318 240
Repayable in yearly instalments ending June 2019
Oil Rand Variable7,58%
551 643 735
Repayable in yearly instalments ending June 2022
Oil Rand Variable7,38%
405 200 –
Repayable in equal semi-annual instalments ending March 20135
Polymers (Arya)
Euro Euribor+ 3,0%
– 1 561 868
Repayable in equal semi-annual instalments until May 2018
Other businesses – Sasol Financing
Euro Euribor+ 1,8%
108 104 116
Repayable in November 20226 Other businesses – Sasol Financing
US Dollar Fixed4,5%
9 938 – –
Other unsecured debt Various Various Various 446 171 139
Total unsecured debt 13 239 4 271 3 617
Total long-term debt 23 872 15 909 15 884Unamortised loan costs (amortised over period of debt using effective interest rate method) (71) (24) (35)
23 801 15 885 15 849 Repayable within one year included in short-term debt (refer note 23) (1 444) (3 057) (1 493)
22 357 12 828 14 356
5 This debt was transferred to held for sale during the current financial year.6 Sasol Financing International Plc, an indirect 100% owned finance subsidiary of Sasol Limited, issued a US$1 billion bond which is listed on the New York Stock Exchange. Sasol Limited has fully
and unconditionally guaranteed the bond (refer note 56). There are no restrictions on the ability of Sasol Limited to obtain funds from the finance subsidiary by dividend or loan.
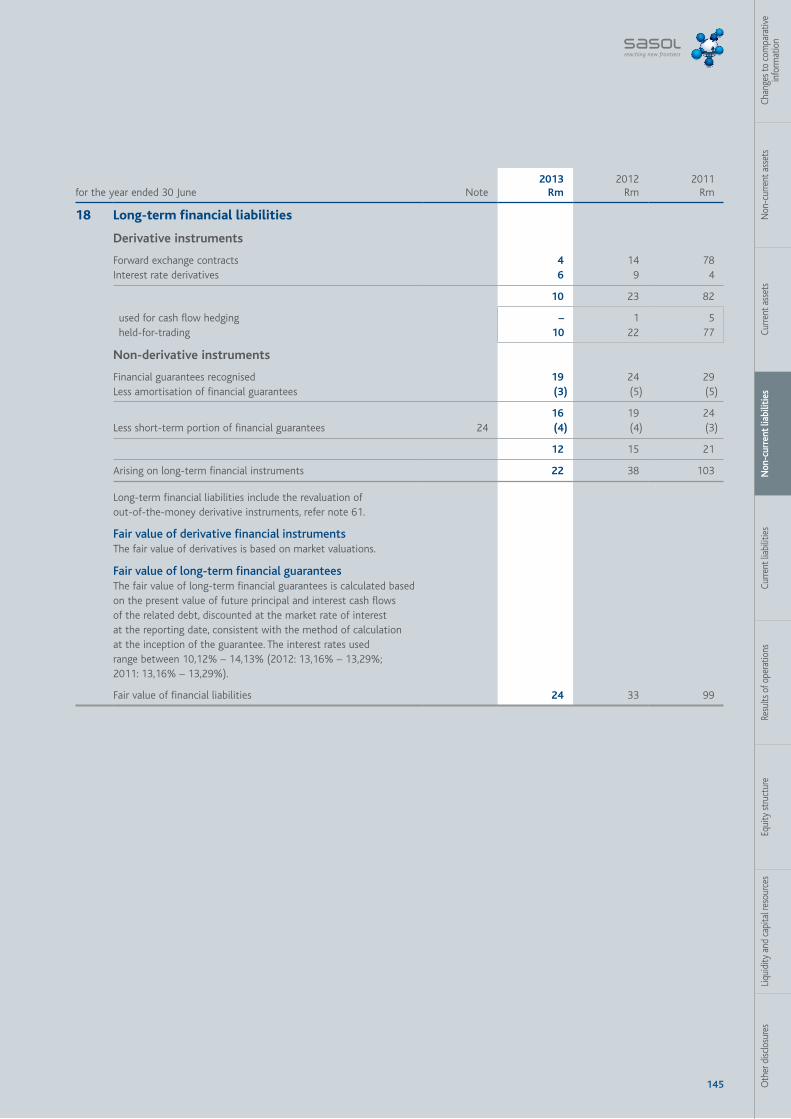
145 Oth
er d
isclo
sure
sLi
quid
ity a
nd c
apita
l res
ourc
esEq
uity
stru
ctur
eRe
sults
of o
pera
tions
Curre
nt li
abili
ties
Non
-cur
rent
liab
iliti
esCu
rrent
ass
ets
Non
-cur
rent
ass
ets
Chan
ges t
o co
mpa
rativ
e in
form
atio
n
for the year ended 30 June Note 2013
Rm 2012
Rm 2011
Rm
18 Long-term financial liabilities
Derivative instruments
Forward exchange contracts 4 14 78 Interest rate derivatives 6 9 4
10 23 82
used for cash flow hedging – 1 5 held-for-trading 10 22 77
Non-derivative instruments
Financial guarantees recognised 19 24 29 Less amortisation of financial guarantees (3) (5) (5)
16 19 24 Less short-term portion of financial guarantees 24 (4) (4) (3)
12 15 21
Arising on long-term financial instruments 22 38 103
Long-term financial liabilities include the revaluation of out-of-the-money derivative instruments, refer note 61.
Fair value of derivative financial instrumentsThe fair value of derivatives is based on market valuations.
Fair value of long-term financial guaranteesThe fair value of long-term financial guarantees is calculated based on the present value of future principal and interest cash flows of the related debt, discounted at the market rate of interest at the reporting date, consistent with the method of calculation at the inception of the guarantee. The interest rates used range between 10,12% – 14,13% (2012: 13,16% – 13,29%; 2011: 13,16% – 13,29%).
Fair value of financial liabilities 24 33 99
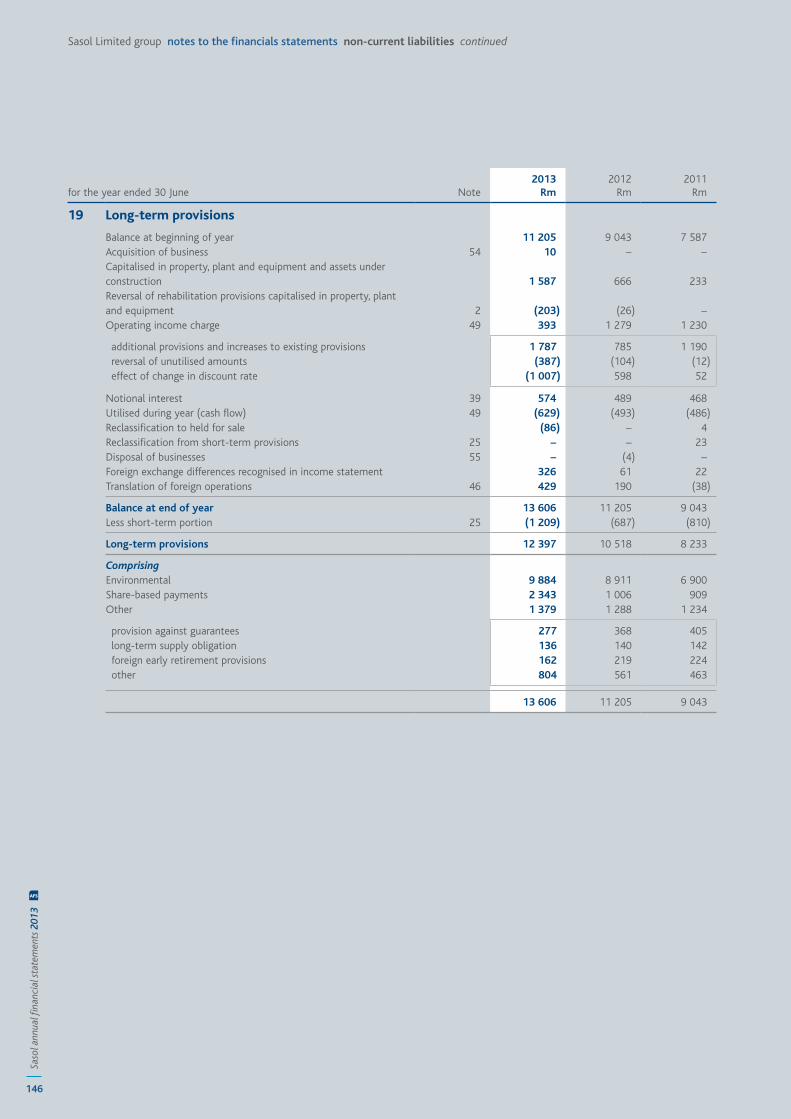
146
Saso
l ann
ual fi
nanc
ial s
tate
men
ts 2
013
AFS
Sasol Limited group notes to the financials statements non-current liabilities continued
for the year ended 30 June Note 2013
Rm 2012
Rm 2011
Rm
19 Long-term provisions
Balance at beginning of year 11 205 9 043 7 587 Acquisition of business 54 10 – –Capitalised in property, plant and equipment and assets under construction 1 587 666 233 Reversal of rehabilitation provisions capitalised in property, plant and equipment 2 (203) (26) –Operating income charge 49 393 1 279 1 230
additional provisions and increases to existing provisions 1 787 785 1 190 reversal of unutilised amounts (387) (104) (12) effect of change in discount rate (1 007) 598 52
Notional interest 39 574 489 468 Utilised during year (cash flow) 49 (629) (493) (486)Reclassification to held for sale (86) – 4 Reclassification from short-term provisions 25 – – 23 Disposal of businesses 55 – (4) –Foreign exchange differences recognised in income statement 326 61 22 Translation of foreign operations 46 429 190 (38)
Balance at end of year 13 606 11 205 9 043 Less short-term portion 25 (1 209) (687) (810)
Long-term provisions 12 397 10 518 8 233
ComprisingEnvironmental 9 884 8 911 6 900 Share-based payments 2 343 1 006 909 Other 1 379 1 288 1 234
provision against guarantees 277 368 405 long-term supply obligation 136 140 142 foreign early retirement provisions 162 219 224 other 804 561 463
13 606 11 205 9 043
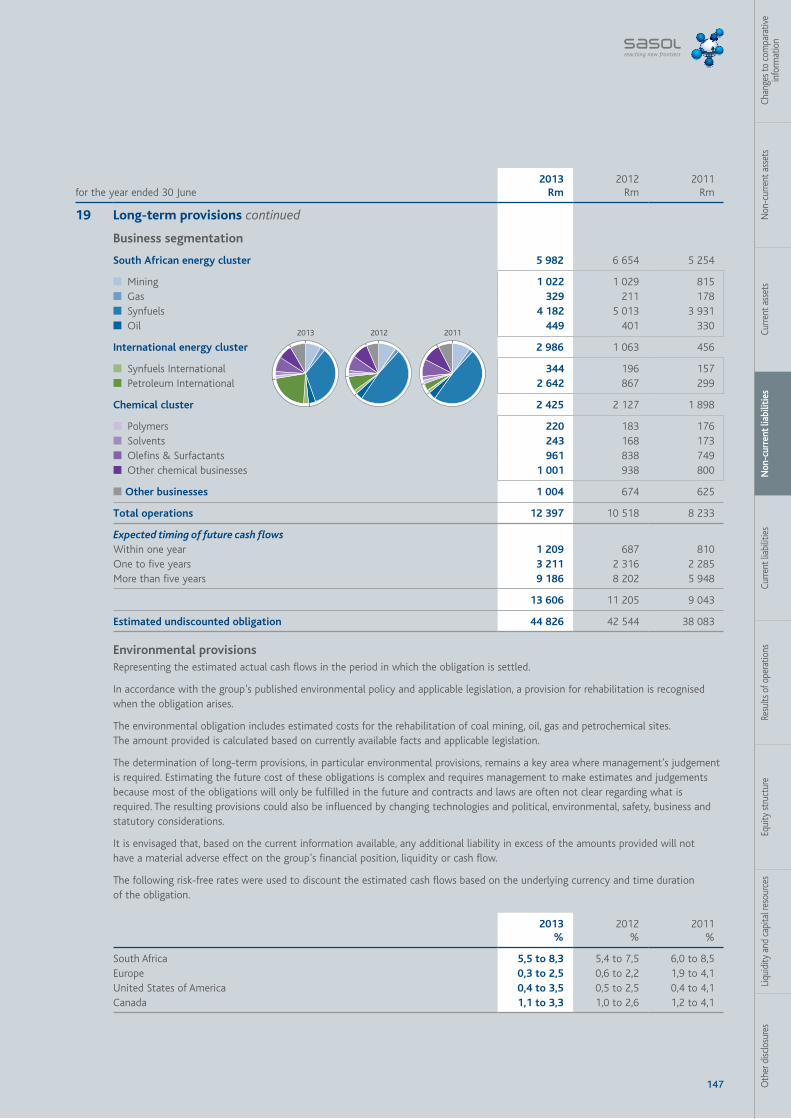
147 Oth
er d
isclo
sure
sLi
quid
ity a
nd c
apita
l res
ourc
esEq
uity
stru
ctur
eRe
sults
of o
pera
tions
Curre
nt li
abili
ties
Non
-cur
rent
liab
iliti
esCu
rrent
ass
ets
Non
-cur
rent
ass
ets
Chan
ges t
o co
mpa
rativ
e in
form
atio
n
for the year ended 30 June2013
Rm 2012
Rm 2011
Rm
19 Long-term provisions continued
Business segmentation
South African energy cluster 5 982 6 654 5 254
■ Mining 1 022 1 029 815 ■ Gas 329 211 178 ■ Synfuels 4 182 5 013 3 931 ■ Oil 449 401 330
International energy cluster 2 986 1 063 456
■ Synfuels International 344 196 157 ■ Petroleum International 2 642 867 299
Chemical cluster 2 425 2 127 1 898
■ Polymers 220 183 176 ■ Solvents 243 168 173 ■ Olefins & Surfactants 961 838 749 ■ Other chemical businesses 1 001 938 800
■ Other businesses 1 004 674 625
Total operations 12 397 10 518 8 233
Expected timing of future cash flowsWithin one year 1 209 687 810 One to five years 3 211 2 316 2 285 More than five years 9 186 8 202 5 948
13 606 11 205 9 043
Estimated undiscounted obligation 44 826 42 544 38 083
Environmental provisionsRepresenting the estimated actual cash flows in the period in which the obligation is settled.
In accordance with the group’s published environmental policy and applicable legislation, a provision for rehabilitation is recognised when the obligation arises.
The environmental obligation includes estimated costs for the rehabilitation of coal mining, oil, gas and petrochemical sites. The amount provided is calculated based on currently available facts and applicable legislation.
The determination of long-term provisions, in particular environmental provisions, remains a key area where management’s judgement is required. Estimating the future cost of these obligations is complex and requires management to make estimates and judgements because most of the obligations will only be fulfilled in the future and contracts and laws are often not clear regarding what is required. The resulting provisions could also be influenced by changing technologies and political, environmental, safety, business and statutory considerations.
It is envisaged that, based on the current information available, any additional liability in excess of the amounts provided will not have a material adverse effect on the group’s financial position, liquidity or cash flow.
The following risk-free rates were used to discount the estimated cash flows based on the underlying currency and time duration of the obligation.
2013%
2012%
2011%
South Africa 5,5 to 8,3 5,4 to 7,5 6,0 to 8,5 Europe 0,3 to 2,5 0,6 to 2,2 1,9 to 4,1 United States of America 0,4 to 3,5 0,5 to 2,5 0,4 to 4,1 Canada 1,1 to 3,3 1,0 to 2,6 1,2 to 4,1
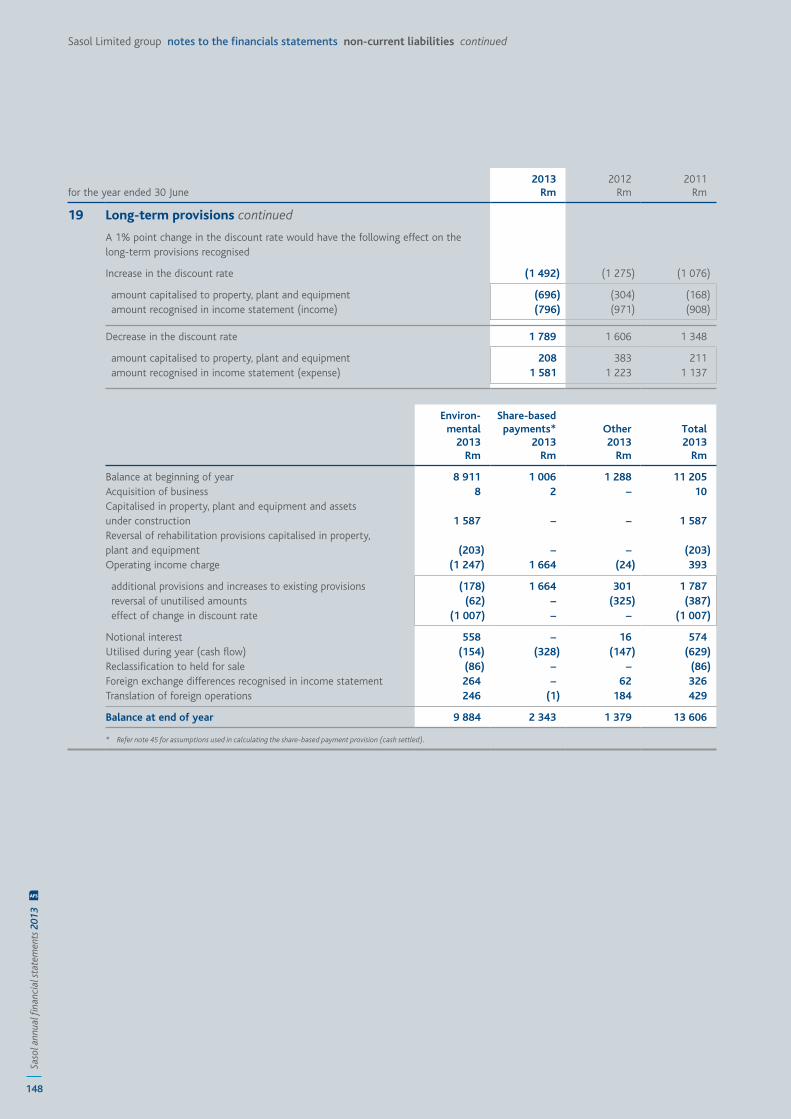
148
Saso
l ann
ual fi
nanc
ial s
tate
men
ts 2
013
AFS
Sasol Limited group notes to the financials statements non-current liabilities continued
for the year ended 30 June2013
Rm 2012
Rm 2011
Rm
19 Long-term provisions continued
A 1% point change in the discount rate would have the following effect on the long-term provisions recognised
Increase in the discount rate (1 492) (1 275) (1 076)
amount capitalised to property, plant and equipment (696) (304) (168) amount recognised in income statement (income) (796) (971) (908)
Decrease in the discount rate 1 789 1 606 1 348
amount capitalised to property, plant and equipment 208 383 211 amount recognised in income statement (expense) 1 581 1 223 1 137
Environ-mental
2013Rm
Share-based payments*
2013Rm
Other2013
Rm
Total2013
Rm
Balance at beginning of year 8 911 1 006 1 288 11 205 Acquisition of business 8 2 – 10 Capitalised in property, plant and equipment and assets under construction 1 587 – – 1 587 Reversal of rehabilitation provisions capitalised in property, plant and equipment (203) – – (203)Operating income charge (1 247) 1 664 (24) 393
additional provisions and increases to existing provisions (178) 1 664 301 1 787 reversal of unutilised amounts (62) – (325) (387) effect of change in discount rate (1 007) – – (1 007)
Notional interest 558 – 16 574 Utilised during year (cash flow) (154) (328) (147) (629)Reclassification to held for sale (86) – – (86)Foreign exchange differences recognised in income statement 264 – 62 326 Translation of foreign operations 246 (1) 184 429
Balance at end of year 9 884 2 343 1 379 13 606
* Refer note 45 for assumptions used in calculating the share-based payment provision (cash settled).
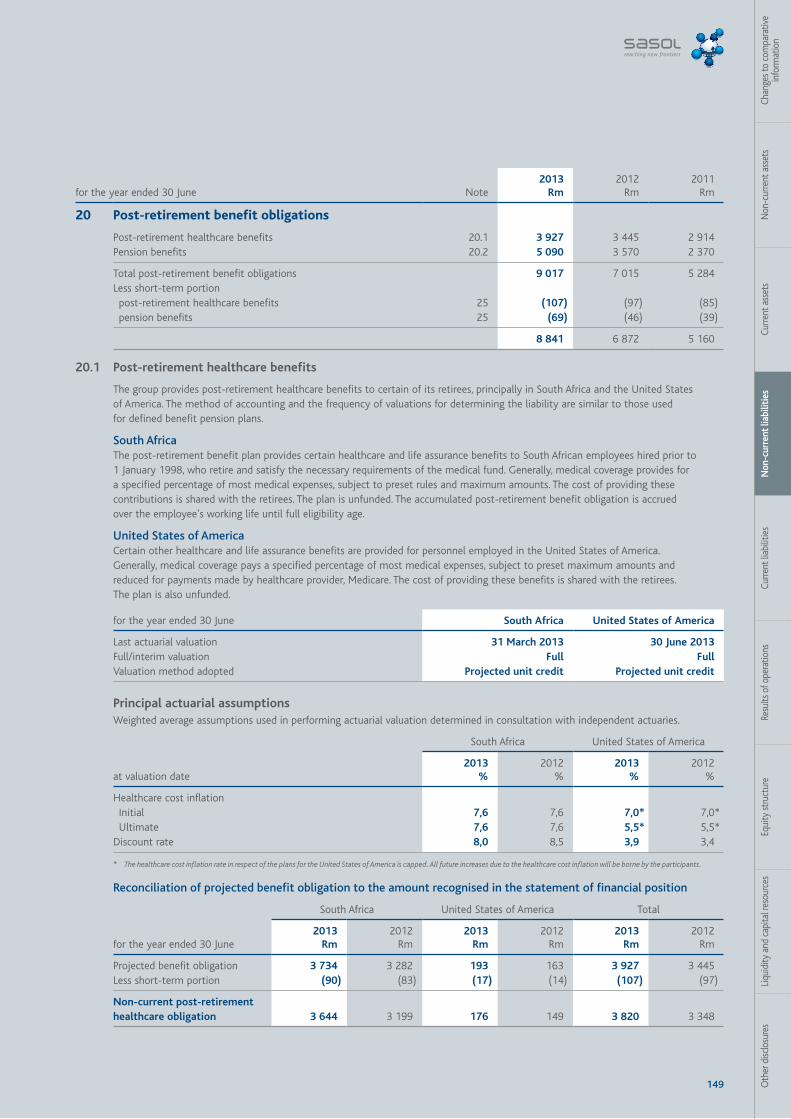
149 Oth
er d
isclo
sure
sLi
quid
ity a
nd c
apita
l res
ourc
esEq
uity
stru
ctur
eRe
sults
of o
pera
tions
Curre
nt li
abili
ties
Non
-cur
rent
liab
iliti
esCu
rrent
ass
ets
Non
-cur
rent
ass
ets
Chan
ges t
o co
mpa
rativ
e in
form
atio
n
for the year ended 30 June Note 2013
Rm 2012
Rm 2011
Rm
20 Post-retirement benefit obligations
Post-retirement healthcare benefits 20.1 3 927 3 445 2 914 Pension benefits 20.2 5 090 3 570 2 370
Total post-retirement benefit obligations 9 017 7 015 5 284 Less short-term portion post-retirement healthcare benefits 25 (107) (97) (85) pension benefits 25 (69) (46) (39)
8 841 6 872 5 160
20.1 Post-retirement healthcare benefits
The group provides post-retirement healthcare benefits to certain of its retirees, principally in South Africa and the United States of America. The method of accounting and the frequency of valuations for determining the liability are similar to those used for defined benefit pension plans.
South AfricaThe post-retirement benefit plan provides certain healthcare and life assurance benefits to South African employees hired prior to 1 January 1998, who retire and satisfy the necessary requirements of the medical fund. Generally, medical coverage provides for a specified percentage of most medical expenses, subject to preset rules and maximum amounts. The cost of providing these contributions is shared with the retirees. The plan is unfunded. The accumulated post-retirement benefit obligation is accrued over the employee’s working life until full eligibility age.
United States of AmericaCertain other healthcare and life assurance benefits are provided for personnel employed in the United States of America. Generally, medical coverage pays a specified percentage of most medical expenses, subject to preset maximum amounts and reduced for payments made by healthcare provider, Medicare. The cost of providing these benefits is shared with the retirees. The plan is also unfunded.
for the year ended 30 June South Africa United States of America
Last actuarial valuation 31 March 2013 30 June 2013Full/interim valuation Full FullValuation method adopted Projected unit credit Projected unit credit
Principal actuarial assumptionsWeighted average assumptions used in performing actuarial valuation determined in consultation with independent actuaries.
South Africa United States of America
at valuation date2013
% 2012
% 2013
% 2012
%
Healthcare cost inflation Initial 7,6 7,6 7,0* 7,0* Ultimate 7,6 7,6 5,5* 5,5*Discount rate 8,0 8,5 3,9 3,4
* The healthcare cost inflation rate in respect of the plans for the United States of America is capped. All future increases due to the healthcare cost inflation will be borne by the participants.
Reconciliation of projected benefit obligation to the amount recognised in the statement of financial position
for the year ended 30 June
South Africa United States of America Total
2013Rm
2012Rm
2013Rm
2012Rm
2013Rm
2012Rm
Projected benefit obligation 3 734 3 282 193 163 3 927 3 445 Less short-term portion (90) (83) (17) (14) (107) (97)
Non-current post-retirement healthcare obligation 3 644 3 199 176 149 3 820 3 348
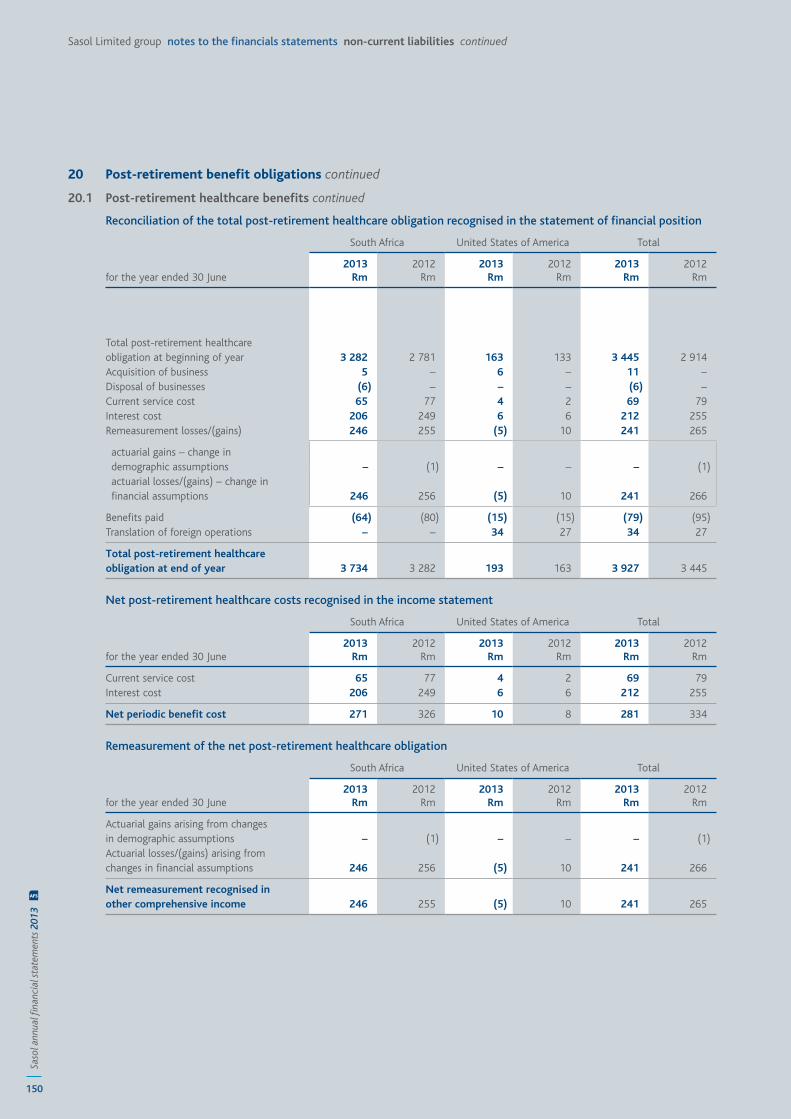
150
Saso
l ann
ual fi
nanc
ial s
tate
men
ts 2
013
AFS
Sasol Limited group notes to the financials statements non-current liabilities continued
20 Post-retirement benefit obligations continued
20.1 Post-retirement healthcare benefits continued
Reconciliation of the total post-retirement healthcare obligation recognised in the statement of financial position
for the year ended 30 June
South Africa United States of America Total
2013Rm
2012Rm
2013Rm
2012Rm
2013Rm
2012Rm
Total post-retirement healthcare obligation at beginning of year 3 282 2 781 163 133 3 445 2 914 Acquisition of business 5 – 6 – 11 –Disposal of businesses (6) – – – (6) –Current service cost 65 77 4 2 69 79 Interest cost 206 249 6 6 212 255 Remeasurement losses/(gains) 246 255 (5) 10 241 265
actuarial gains – change in demographic assumptions – (1) – – – (1)
actuarial losses/(gains) – change in financial assumptions 246 256 (5) 10 241 266
Benefits paid (64) (80) (15) (15) (79) (95)Translation of foreign operations – – 34 27 34 27
Total post-retirement healthcare obligation at end of year 3 734 3 282 193 163 3 927 3 445
Net post-retirement healthcare costs recognised in the income statement
for the year ended 30 June
South Africa United States of America Total
2013Rm
2012Rm
2013Rm
2012Rm
2013Rm
2012Rm
Current service cost 65 77 4 2 69 79 Interest cost 206 249 6 6 212 255
Net periodic benefit cost 271 326 10 8 281 334
Remeasurement of the net post-retirement healthcare obligation
for the year ended 30 June
South Africa United States of America Total
2013Rm
2012Rm
2013Rm
2012Rm
2013Rm
2012Rm
Actuarial gains arising from changes in demographic assumptions – (1) – – – (1)Actuarial losses/(gains) arising from changes in financial assumptions 246 256 (5) 10 241 266
Net remeasurement recognised in other comprehensive income 246 255 (5) 10 241 265
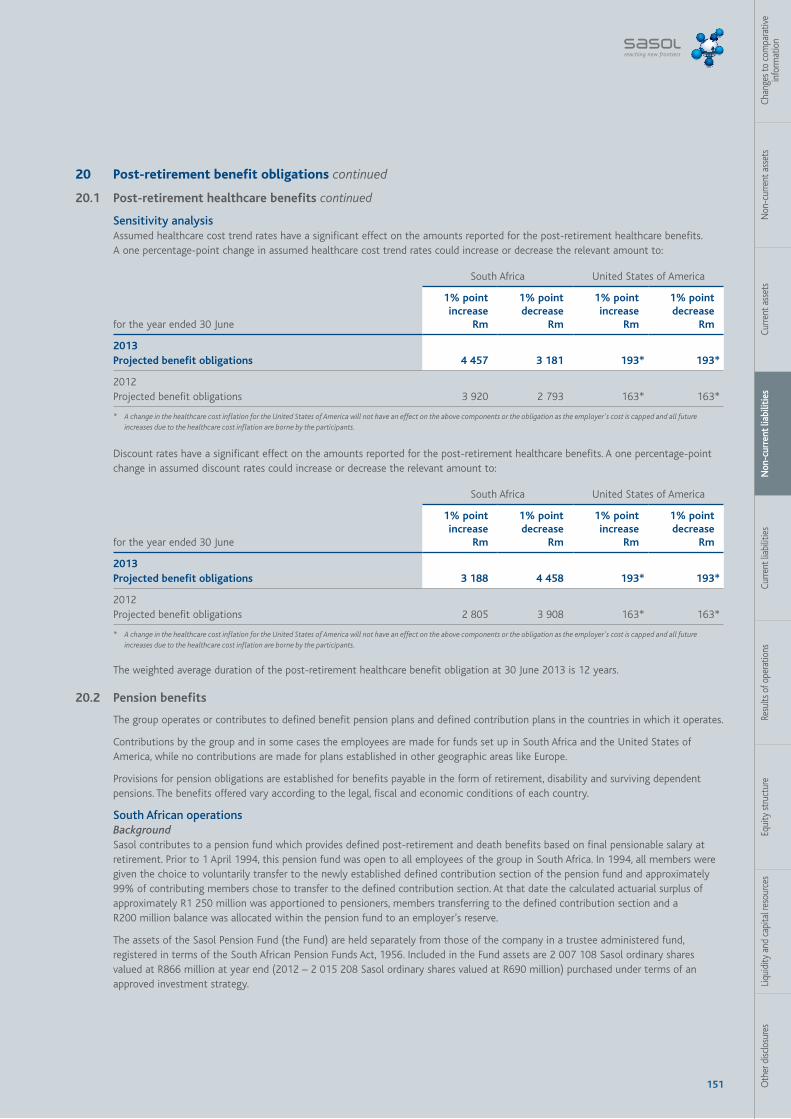
151 Oth
er d
isclo
sure
sLi
quid
ity a
nd c
apita
l res
ourc
esEq
uity
stru
ctur
eRe
sults
of o
pera
tions
Curre
nt li
abili
ties
Non
-cur
rent
liab
iliti
esCu
rrent
ass
ets
Non
-cur
rent
ass
ets
Chan
ges t
o co
mpa
rativ
e in
form
atio
n
20 Post-retirement benefit obligations continued
20.1 Post-retirement healthcare benefits continued
Sensitivity analysisAssumed healthcare cost trend rates have a significant effect on the amounts reported for the post-retirement healthcare benefits. A one percentage-point change in assumed healthcare cost trend rates could increase or decrease the relevant amount to:
for the year ended 30 June
South Africa United States of America
1% point increase
Rm
1% point decrease
Rm
1% point increase
Rm
1% point decrease
Rm
2013 Projected benefit obligations 4 457 3 181 193* 193*
2012 Projected benefit obligations 3 920 2 793 163* 163*
* A change in the healthcare cost inflation for the United States of America will not have an effect on the above components or the obligation as the employer's cost is capped and all future increases due to the healthcare cost inflation are borne by the participants.
Discount rates have a significant effect on the amounts reported for the post-retirement healthcare benefits. A one percentage-point change in assumed discount rates could increase or decrease the relevant amount to:
for the year ended 30 June
South Africa United States of America
1% point increase
Rm
1% point decrease
Rm
1% point increase
Rm
1% point decrease
Rm
2013 Projected benefit obligations 3 188 4 458 193* 193*
2012 Projected benefit obligations 2 805 3 908 163* 163*
* A change in the healthcare cost inflation for the United States of America will not have an effect on the above components or the obligation as the employer's cost is capped and all future increases due to the healthcare cost inflation are borne by the participants.
The weighted average duration of the post-retirement healthcare benefit obligation at 30 June 2013 is 12 years.
20.2 Pension benefits
The group operates or contributes to defined benefit pension plans and defined contribution plans in the countries in which it operates.
Contributions by the group and in some cases the employees are made for funds set up in South Africa and the United States of America, while no contributions are made for plans established in other geographic areas like Europe.
Provisions for pension obligations are established for benefits payable in the form of retirement, disability and surviving dependent pensions. The benefits offered vary according to the legal, fiscal and economic conditions of each country.
South African operationsBackgroundSasol contributes to a pension fund which provides defined post-retirement and death benefits based on final pensionable salary at retirement. Prior to 1 April 1994, this pension fund was open to all employees of the group in South Africa. In 1994, all members were given the choice to voluntarily transfer to the newly established defined contribution section of the pension fund and approximately 99% of contributing members chose to transfer to the defined contribution section. At that date the calculated actuarial surplus of approximately R1 250 million was apportioned to pensioners, members transferring to the defined contribution section and a R200 million balance was allocated within the pension fund to an employer’s reserve.
The assets of the Sasol Pension Fund (the Fund) are held separately from those of the company in a trustee administered fund, registered in terms of the South African Pension Funds Act, 1956. Included in the Fund assets are 2 007 108 Sasol ordinary shares valued at R866 million at year end (2012 – 2 015 208 Sasol ordinary shares valued at R690 million) purchased under terms of an approved investment strategy.
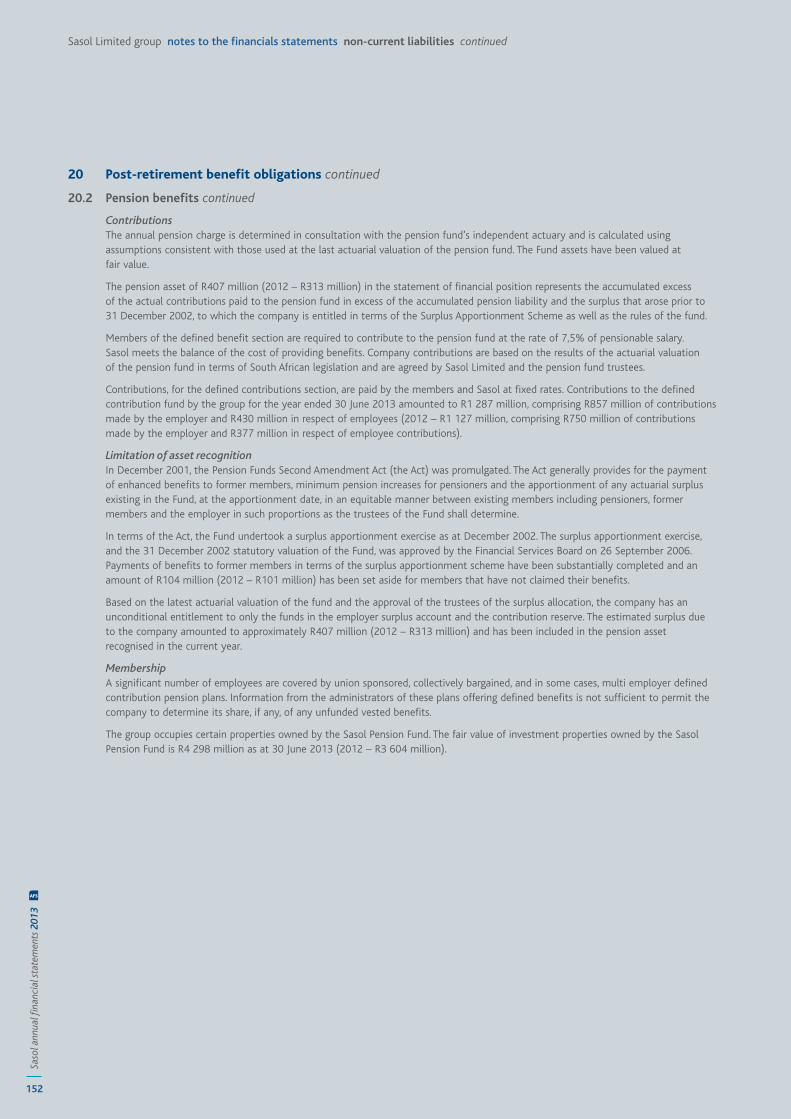
152
Saso
l ann
ual fi
nanc
ial s
tate
men
ts 2
013
AFS
Sasol Limited group notes to the financials statements non-current liabilities continued
20 Post-retirement benefit obligations continued
20.2 Pension benefits continued
ContributionsThe annual pension charge is determined in consultation with the pension fund’s independent actuary and is calculated using assumptions consistent with those used at the last actuarial valuation of the pension fund. The Fund assets have been valued at fair value.
The pension asset of R407 million (2012 – R313 million) in the statement of financial position represents the accumulated excess of the actual contributions paid to the pension fund in excess of the accumulated pension liability and the surplus that arose prior to 31 December 2002, to which the company is entitled in terms of the Surplus Apportionment Scheme as well as the rules of the fund.
Members of the defined benefit section are required to contribute to the pension fund at the rate of 7,5% of pensionable salary. Sasol meets the balance of the cost of providing benefits. Company contributions are based on the results of the actuarial valuation of the pension fund in terms of South African legislation and are agreed by Sasol Limited and the pension fund trustees.
Contributions, for the defined contributions section, are paid by the members and Sasol at fixed rates. Contributions to the defined contribution fund by the group for the year ended 30 June 2013 amounted to R1 287 million, comprising R857 million of contributions made by the employer and R430 million in respect of employees (2012 – R1 127 million, comprising R750 million of contributions made by the employer and R377 million in respect of employee contributions).
Limitation of asset recognitionIn December 2001, the Pension Funds Second Amendment Act (the Act) was promulgated. The Act generally provides for the payment of enhanced benefits to former members, minimum pension increases for pensioners and the apportionment of any actuarial surplus existing in the Fund, at the apportionment date, in an equitable manner between existing members including pensioners, former members and the employer in such proportions as the trustees of the Fund shall determine.
In terms of the Act, the Fund undertook a surplus apportionment exercise as at December 2002. The surplus apportionment exercise, and the 31 December 2002 statutory valuation of the Fund, was approved by the Financial Services Board on 26 September 2006. Payments of benefits to former members in terms of the surplus apportionment scheme have been substantially completed and an amount of R104 million (2012 – R101 million) has been set aside for members that have not claimed their benefits.
Based on the latest actuarial valuation of the fund and the approval of the trustees of the surplus allocation, the company has an unconditional entitlement to only the funds in the employer surplus account and the contribution reserve. The estimated surplus due to the company amounted to approximately R407 million (2012 – R313 million) and has been included in the pension asset recognised in the current year.
MembershipA significant number of employees are covered by union sponsored, collectively bargained, and in some cases, multi employer defined contribution pension plans. Information from the administrators of these plans offering defined benefits is not sufficient to permit the company to determine its share, if any, of any unfunded vested benefits.
The group occupies certain properties owned by the Sasol Pension Fund. The fair value of investment properties owned by the Sasol Pension Fund is R4 298 million as at 30 June 2013 (2012 – R3 604 million).
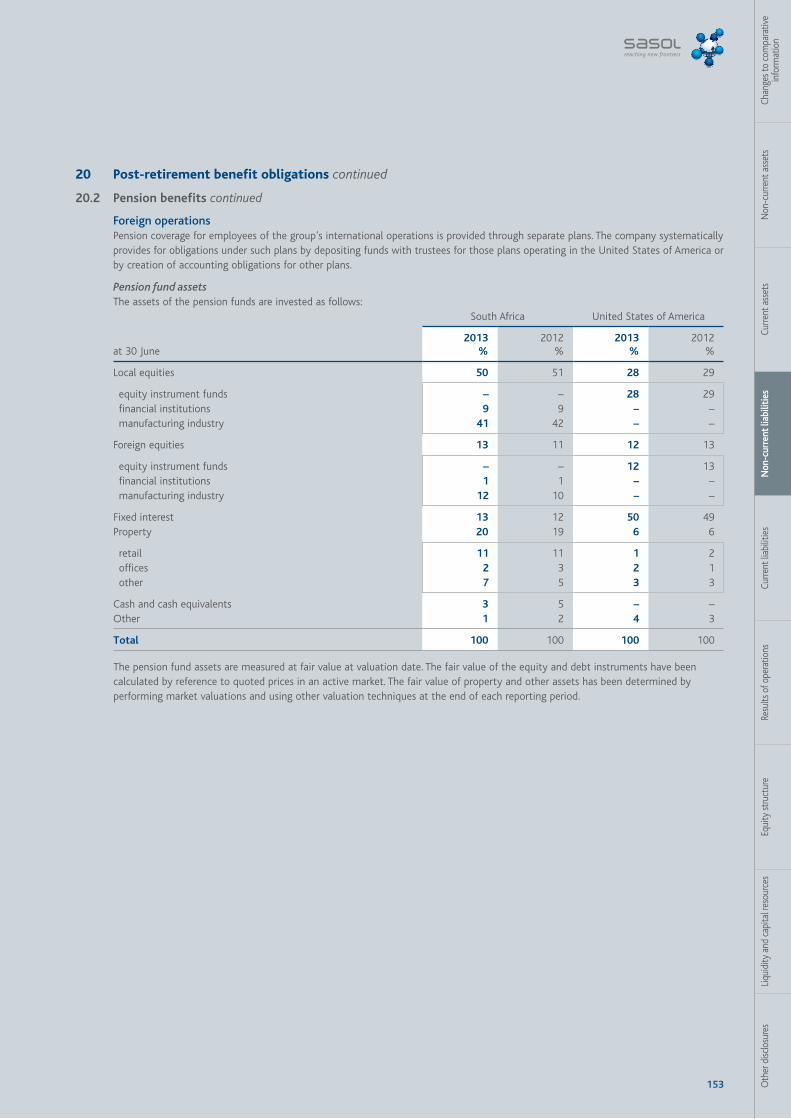
153 Oth
er d
isclo
sure
sLi
quid
ity a
nd c
apita
l res
ourc
esEq
uity
stru
ctur
eRe
sults
of o
pera
tions
Curre
nt li
abili
ties
Non
-cur
rent
liab
iliti
esCu
rrent
ass
ets
Non
-cur
rent
ass
ets
Chan
ges t
o co
mpa
rativ
e in
form
atio
n
20 Post-retirement benefit obligations continued
20.2 Pension benefits continued
Foreign operationsPension coverage for employees of the group’s international operations is provided through separate plans. The company systematically provides for obligations under such plans by depositing funds with trustees for those plans operating in the United States of America or by creation of accounting obligations for other plans.
Pension fund assetsThe assets of the pension funds are invested as follows:
at 30 June
South Africa United States of America
2013%
2012%
2013%
2012%
Local equities 50 51 28 29
equity instrument funds – – 28 29 financial institutions 9 9 – – manufacturing industry 41 42 – –
Foreign equities 13 11 12 13
equity instrument funds – – 12 13 financial institutions 1 1 – – manufacturing industry 12 10 – –
Fixed interest 13 12 50 49 Property 20 19 6 6
retail 11 11 1 2 offices 2 3 2 1 other 7 5 3 3
Cash and cash equivalents 3 5 – –Other 1 2 4 3
Total 100 100 100 100
The pension fund assets are measured at fair value at valuation date. The fair value of the equity and debt instruments have been calculated by reference to quoted prices in an active market. The fair value of property and other assets has been determined by performing market valuations and using other valuation techniques at the end of each reporting period.
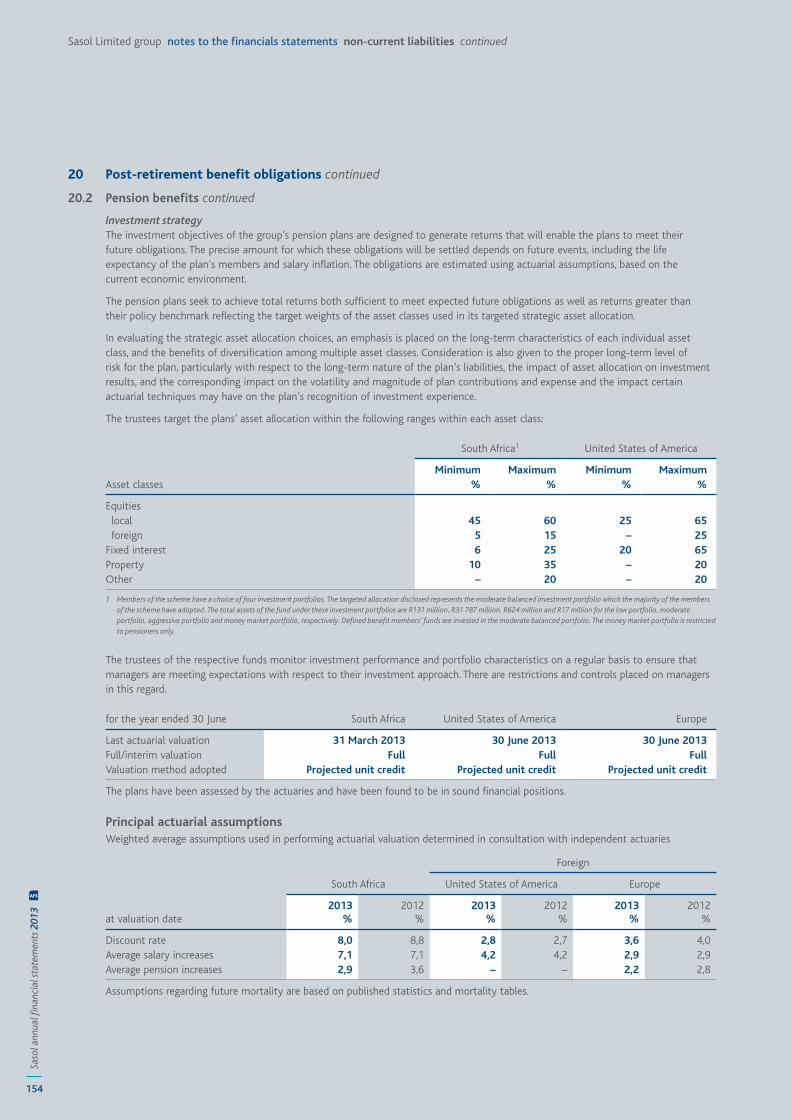
154
Saso
l ann
ual fi
nanc
ial s
tate
men
ts 2
013
AFS
Sasol Limited group notes to the financials statements non-current liabilities continued
20 Post-retirement benefit obligations continued
20.2 Pension benefits continued
Investment strategyThe investment objectives of the group’s pension plans are designed to generate returns that will enable the plans to meet their future obligations. The precise amount for which these obligations will be settled depends on future events, including the life expectancy of the plan’s members and salary inflation. The obligations are estimated using actuarial assumptions, based on the current economic environment.
The pension plans seek to achieve total returns both sufficient to meet expected future obligations as well as returns greater than their policy benchmark reflecting the target weights of the asset classes used in its targeted strategic asset allocation.
In evaluating the strategic asset allocation choices, an emphasis is placed on the long-term characteristics of each individual asset class, and the benefits of diversification among multiple asset classes. Consideration is also given to the proper long-term level of risk for the plan, particularly with respect to the long-term nature of the plan’s liabilities, the impact of asset allocation on investment results, and the corresponding impact on the volatility and magnitude of plan contributions and expense and the impact certain actuarial techniques may have on the plan’s recognition of investment experience.
The trustees target the plans’ asset allocation within the following ranges within each asset class:
Asset classes
South Africa1 United States of America
Minimum%
Maximum%
Minimum%
Maximum%
Equities local 45 60 25 65 foreign 5 15 – 25 Fixed interest 6 25 20 65 Property 10 35 – 20 Other – 20 – 20
1 Members of the scheme have a choice of four investment portfolios. The targeted allocation disclosed represents the moderate balanced investment portfolio which the majority of the members of the scheme have adopted. The total assets of the fund under these investment portfolios are R131 million, R31 787 million, R624 million and R17 million for the low portfolio, moderate portfolio, aggressive portfolio and money market portfolio, respectively. Defined benefit members’ funds are invested in the moderate balanced portfolio. The money market portfolio is restricted to pensioners only.
The trustees of the respective funds monitor investment performance and portfolio characteristics on a regular basis to ensure that managers are meeting expectations with respect to their investment approach. There are restrictions and controls placed on managers in this regard.
for the year ended 30 June South Africa United States of America Europe
Last actuarial valuation 31 March 2013 30 June 2013 30 June 2013Full/interim valuation Full Full FullValuation method adopted Projected unit credit Projected unit credit Projected unit credit
The plans have been assessed by the actuaries and have been found to be in sound financial positions.
Principal actuarial assumptionsWeighted average assumptions used in performing actuarial valuation determined in consultation with independent actuaries
at valuation date
South Africa
Foreign
United States of America Europe
2013%
2012%
2013%
2012%
2013%
2012%
Discount rate 8,0 8,8 2,8 2,7 3,6 4,0Average salary increases 7,1 7,1 4,2 4,2 2,9 2,9Average pension increases 2,9 3,6 – – 2,2 2,8
Assumptions regarding future mortality are based on published statistics and mortality tables.
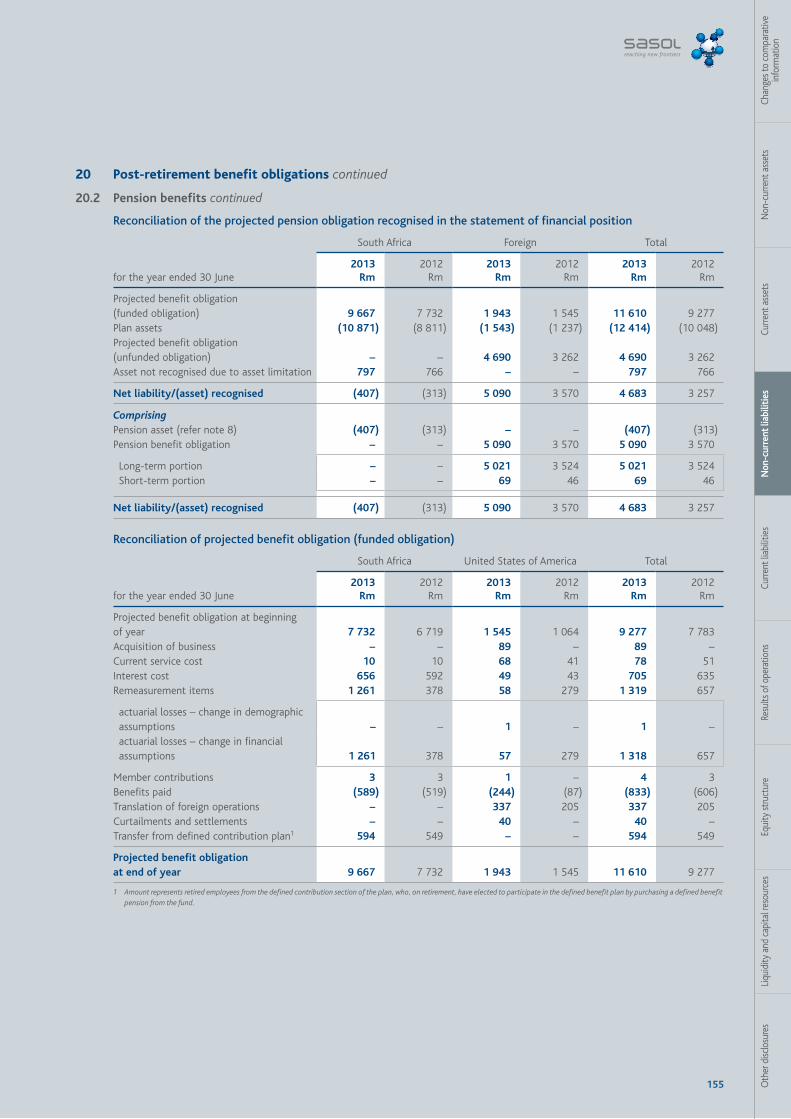
155 Oth
er d
isclo
sure
sLi
quid
ity a
nd c
apita
l res
ourc
esEq
uity
stru
ctur
eRe
sults
of o
pera
tions
Curre
nt li
abili
ties
Non
-cur
rent
liab
iliti
esCu
rrent
ass
ets
Non
-cur
rent
ass
ets
Chan
ges t
o co
mpa
rativ
e in
form
atio
n
20 Post-retirement benefit obligations continued
20.2 Pension benefits continued
Reconciliation of the projected pension obligation recognised in the statement of financial position
for the year ended 30 June
South Africa Foreign Total
2013Rm
2012Rm
2013Rm
2012Rm
2013Rm
2012Rm
Projected benefit obligation (funded obligation) 9 667 7 732 1 943 1 545 11 610 9 277 Plan assets (10 871) (8 811) (1 543) (1 237) (12 414) (10 048)Projected benefit obligation (unfunded obligation) – – 4 690 3 262 4 690 3 262 Asset not recognised due to asset limitation 797 766 – – 797 766
Net liability/(asset) recognised (407) (313) 5 090 3 570 4 683 3 257
ComprisingPension asset (refer note 8) (407) (313) – – (407) (313)Pension benefit obligation – – 5 090 3 570 5 090 3 570
Long-term portion – – 5 021 3 524 5 021 3 524 Short-term portion – – 69 46 69 46
Net liability/(asset) recognised (407) (313) 5 090 3 570 4 683 3 257
Reconciliation of projected benefit obligation (funded obligation)
for the year ended 30 June
South Africa United States of America Total
2013Rm
2012Rm
2013Rm
2012Rm
2013Rm
2012Rm
Projected benefit obligation at beginning of year 7 732 6 719 1 545 1 064 9 277 7 783 Acquisition of business – – 89 – 89 –Current service cost 10 10 68 41 78 51 Interest cost 656 592 49 43 705 635 Remeasurement items 1 261 378 58 279 1 319 657
actuarial losses – change in demographic assumptions – – 1 – 1 –
actuarial losses – change in financial assumptions 1 261 378 57 279 1 318 657
Member contributions 3 3 1 – 4 3 Benefits paid (589) (519) (244) (87) (833) (606)Translation of foreign operations – – 337 205 337 205 Curtailments and settlements – – 40 – 40 –Transfer from defined contribution plan1 594 549 – – 594 549
Projected benefit obligation at end of year 9 667 7 732 1 943 1 545 11 610 9 277
1 Amount represents retired employees from the defined contribution section of the plan, who, on retirement, have elected to participate in the defined benefit plan by purchasing a defined benefit pension from the fund.
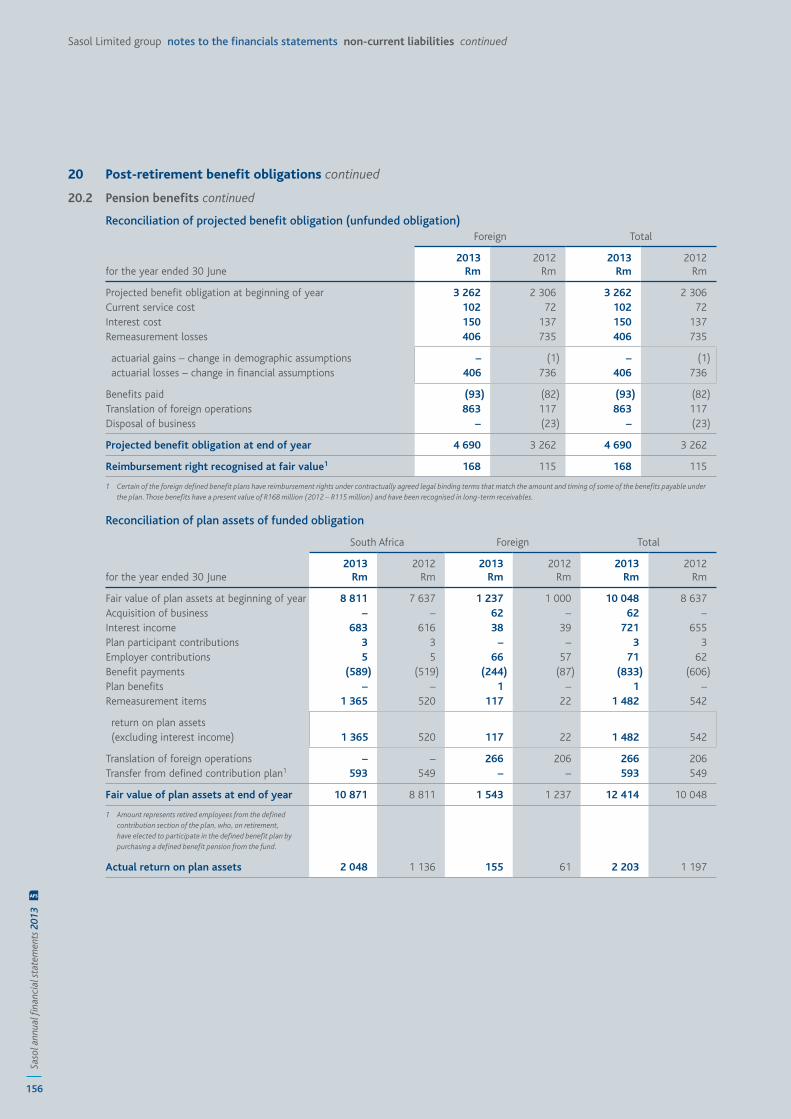
156
Saso
l ann
ual fi
nanc
ial s
tate
men
ts 2
013
AFS
Sasol Limited group notes to the financials statements non-current liabilities continued
20 Post-retirement benefit obligations continued
20.2 Pension benefits continued
Reconciliation of projected benefit obligation (unfunded obligation)
for the year ended 30 June
Foreign Total
2013Rm
2012Rm
2013Rm
2012Rm
Projected benefit obligation at beginning of year 3 262 2 306 3 262 2 306 Current service cost 102 72 102 72 Interest cost 150 137 150 137 Remeasurement losses 406 735 406 735
actuarial gains – change in demographic assumptions – (1) – (1) actuarial losses – change in financial assumptions 406 736 406 736
Benefits paid (93) (82) (93) (82)Translation of foreign operations 863 117 863 117 Disposal of business – (23) – (23)
Projected benefit obligation at end of year 4 690 3 262 4 690 3 262
Reimbursement right recognised at fair value1 168 115 168 115
1 Certain of the foreign defined benefit plans have reimbursement rights under contractually agreed legal binding terms that match the amount and timing of some of the benefits payable under the plan. Those benefits have a present value of R168 million (2012 – R115 million) and have been recognised in long-term receivables.
Reconciliation of plan assets of funded obligation
for the year ended 30 June
South Africa Foreign Total
2013Rm
2012Rm
2013Rm
2012Rm
2013Rm
2012Rm
Fair value of plan assets at beginning of year 8 811 7 637 1 237 1 000 10 048 8 637 Acquisition of business – – 62 – 62 –Interest income 683 616 38 39 721 655 Plan participant contributions 3 3 – – 3 3 Employer contributions 5 5 66 57 71 62 Benefit payments (589) (519) (244) (87) (833) (606)Plan benefits – – 1 – 1 –Remeasurement items 1 365 520 117 22 1 482 542
return on plan assets (excluding interest income) 1 365 520 117 22 1 482 542
Translation of foreign operations – – 266 206 266 206 Transfer from defined contribution plan1 593 549 – – 593 549
Fair value of plan assets at end of year 10 871 8 811 1 543 1 237 12 414 10 048
1 Amount represents retired employees from the defined contribution section of the plan, who, on retirement, have elected to participate in the defined benefit plan by purchasing a defined benefit pension from the fund.
Actual return on plan assets 2 048 1 136 155 61 2 203 1 197
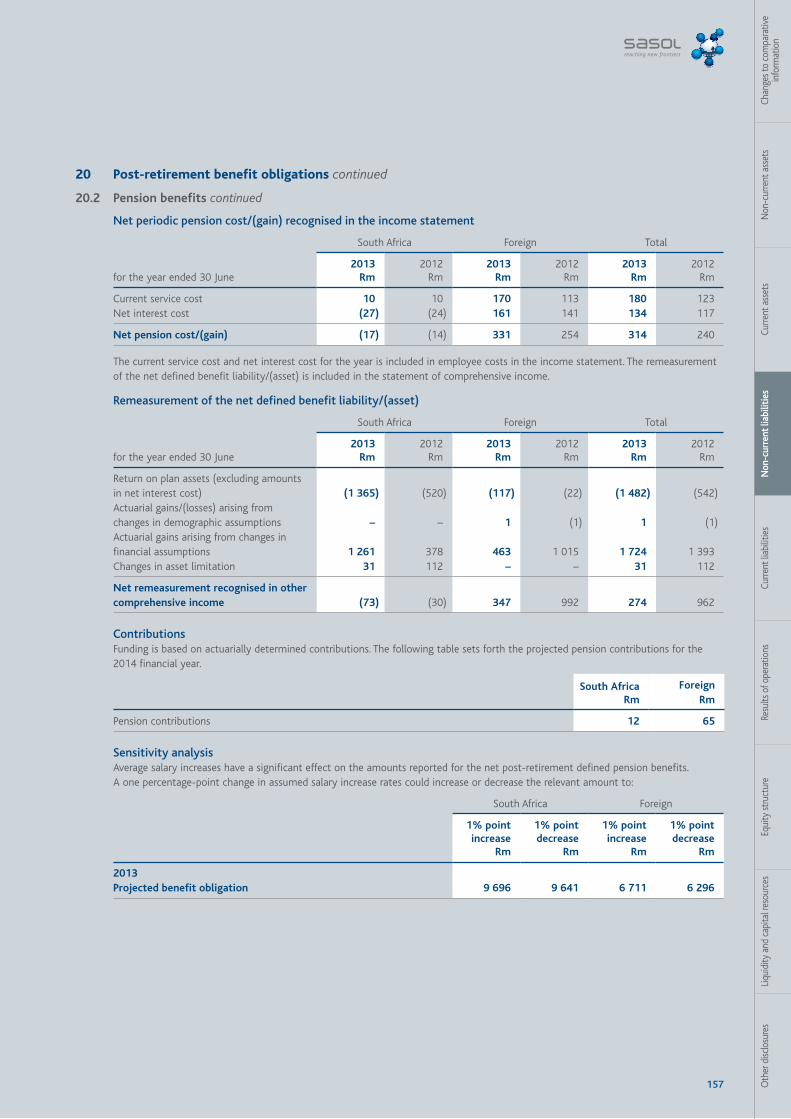
157 Oth
er d
isclo
sure
sLi
quid
ity a
nd c
apita
l res
ourc
esEq
uity
stru
ctur
eRe
sults
of o
pera
tions
Curre
nt li
abili
ties
Non
-cur
rent
liab
iliti
esCu
rrent
ass
ets
Non
-cur
rent
ass
ets
Chan
ges t
o co
mpa
rativ
e in
form
atio
n
20 Post-retirement benefit obligations continued
20.2 Pension benefits continued
Net periodic pension cost/(gain) recognised in the income statement
for the year ended 30 June
South Africa Foreign Total
2013Rm
2012Rm
2013Rm
2012Rm
2013Rm
2012Rm
Current service cost 10 10 170 113 180 123 Net interest cost (27) (24) 161 141 134 117
Net pension cost/(gain) (17) (14) 331 254 314 240
The current service cost and net interest cost for the year is included in employee costs in the income statement. The remeasurement of the net defined benefit liability/(asset) is included in the statement of comprehensive income.
Remeasurement of the net defined benefit liability/(asset)
for the year ended 30 June
South Africa Foreign Total
2013Rm
2012Rm
2013Rm
2012Rm
2013Rm
2012Rm
Return on plan assets (excluding amounts in net interest cost) (1 365) (520) (117) (22) (1 482) (542)Actuarial gains/(losses) arising from changes in demographic assumptions – – 1 (1) 1 (1)Actuarial gains arising from changes in financial assumptions 1 261 378 463 1 015 1 724 1 393 Changes in asset limitation 31 112 – – 31 112
Net remeasurement recognised in other comprehensive income (73) (30) 347 992 274 962
Contributions Funding is based on actuarially determined contributions. The following table sets forth the projected pension contributions for the 2014 financial year.
South Africa Rm
Foreign Rm
Pension contributions 12 65
Sensitivity analysisAverage salary increases have a significant effect on the amounts reported for the net post-retirement defined pension benefits. A one percentage-point change in assumed salary increase rates could increase or decrease the relevant amount to:
South Africa Foreign
1% pointincrease
Rm
1% pointdecrease
Rm
1% pointincrease
Rm
1% pointdecrease
Rm
2013 Projected benefit obligation 9 696 9 641 6 711 6 296
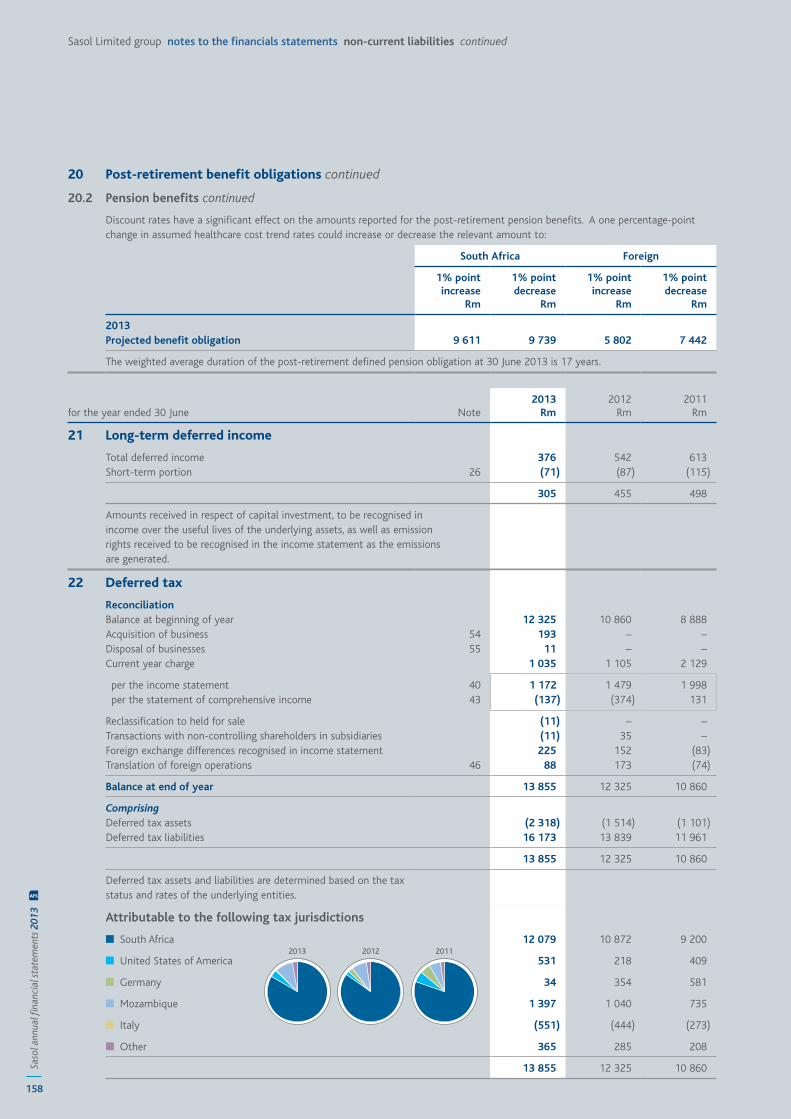
158
Saso
l ann
ual fi
nanc
ial s
tate
men
ts 2
013
AFS
Sasol Limited group notes to the financials statements non-current liabilities continued
20 Post-retirement benefit obligations continued
20.2 Pension benefits continued
Discount rates have a significant effect on the amounts reported for the post-retirement pension benefits. A one percentage-point change in assumed healthcare cost trend rates could increase or decrease the relevant amount to:
South Africa Foreign
1% pointincrease
Rm
1% pointdecrease
Rm
1% pointincrease
Rm
1% pointdecrease
Rm
2013 Projected benefit obligation 9 611 9 739 5 802 7 442
The weighted average duration of the post-retirement defined pension obligation at 30 June 2013 is 17 years.
for the year ended 30 June Note 2013
Rm 2012
Rm 2011
Rm
21 Long-term deferred income
Total deferred income 376 542 613 Short-term portion 26 (71) (87) (115)
305 455 498
Amounts received in respect of capital investment, to be recognised in income over the useful lives of the underlying assets, as well as emission rights received to be recognised in the income statement as the emissions are generated.
22 Deferred tax
ReconciliationBalance at beginning of year 12 325 10 860 8 888 Acquisition of business 54 193 – –Disposal of businesses 55 11 – –Current year charge 1 035 1 105 2 129
per the income statement 40 1 172 1 479 1 998 per the statement of comprehensive income 43 (137) (374) 131
Reclassification to held for sale (11) – –Transactions with non-controlling shareholders in subsidiaries (11) 35 –Foreign exchange differences recognised in income statement 225 152 (83)Translation of foreign operations 46 88 173 (74)
Balance at end of year 13 855 12 325 10 860
ComprisingDeferred tax assets (2 318) (1 514) (1 101)Deferred tax liabilities 16 173 13 839 11 961
13 855 12 325 10 860
Deferred tax assets and liabilities are determined based on the tax status and rates of the underlying entities.
Attributable to the following tax jurisdictions
■ South Africa 12 079 10 872 9 200
■ United States of America 531 218 409
■ Germany 34 354 581
■ Mozambique 1 397 1 040 735
■ Italy (551) (444) (273)
■ Other 365 285 208
13 855 12 325 10 860
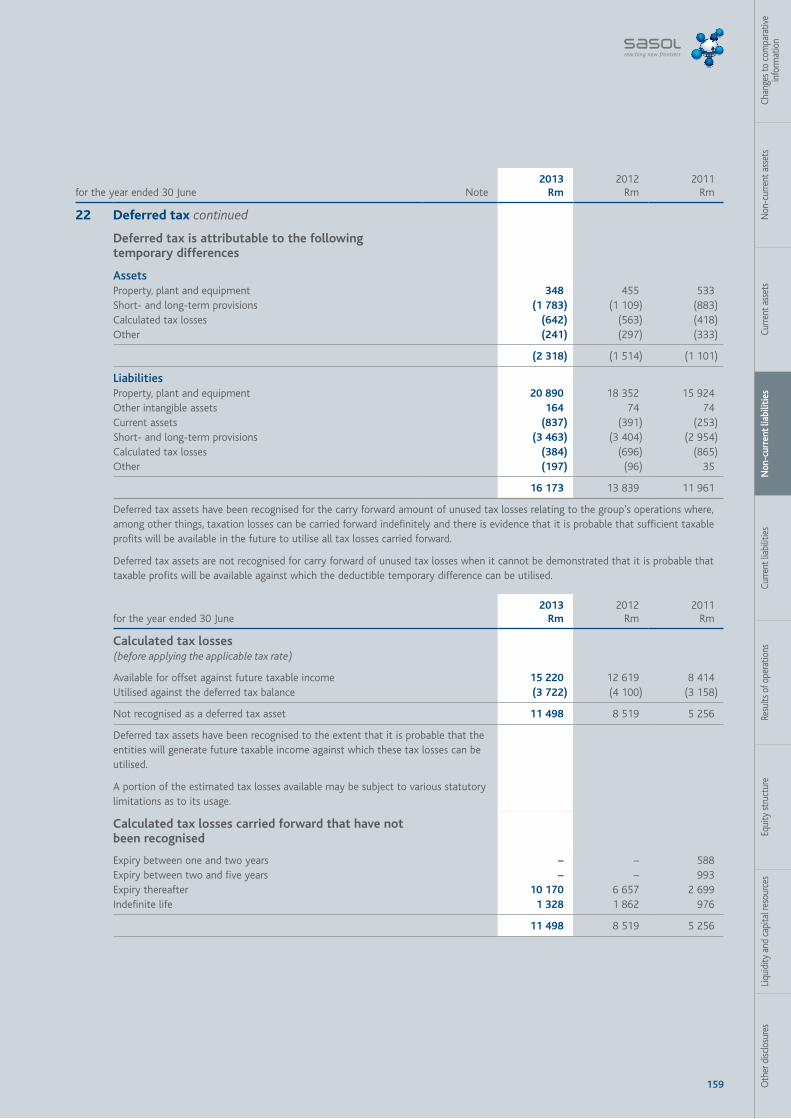
159 Oth
er d
isclo
sure
sLi
quid
ity a
nd c
apita
l res
ourc
esEq
uity
stru
ctur
eRe
sults
of o
pera
tions
Curre
nt li
abili
ties
Non
-cur
rent
liab
iliti
esCu
rrent
ass
ets
Non
-cur
rent
ass
ets
Chan
ges t
o co
mpa
rativ
e in
form
atio
n
for the year ended 30 June Note 2013
Rm 2012
Rm 2011
Rm
22 Deferred tax continued
Deferred tax is attributable to the following temporary differences
AssetsProperty, plant and equipment 348 455 533 Short- and long-term provisions (1 783) (1 109) (883)Calculated tax losses (642) (563) (418)Other (241) (297) (333)
(2 318) (1 514) (1 101)
LiabilitiesProperty, plant and equipment 20 890 18 352 15 924 Other intangible assets 164 74 74 Current assets (837) (391) (253)Short- and long-term provisions (3 463) (3 404) (2 954)Calculated tax losses (384) (696) (865)Other (197) (96) 35
16 173 13 839 11 961
Deferred tax assets have been recognised for the carry forward amount of unused tax losses relating to the group’s operations where, among other things, taxation losses can be carried forward indefinitely and there is evidence that it is probable that sufficient taxable profits will be available in the future to utilise all tax losses carried forward.
Deferred tax assets are not recognised for carry forward of unused tax losses when it cannot be demonstrated that it is probable that taxable profits will be available against which the deductible temporary difference can be utilised.
for the year ended 30 June2013
Rm 2012
Rm 2011
Rm
Calculated tax losses(before applying the applicable tax rate)
Available for offset against future taxable income 15 220 12 619 8 414 Utilised against the deferred tax balance (3 722) (4 100) (3 158)
Not recognised as a deferred tax asset 11 498 8 519 5 256
Deferred tax assets have been recognised to the extent that it is probable that the entities will generate future taxable income against which these tax losses can be utilised.
A portion of the estimated tax losses available may be subject to various statutory limitations as to its usage.
Calculated tax losses carried forward that have not been recognised
Expiry between one and two years – – 588 Expiry between two and five years – – 993 Expiry thereafter 10 170 6 657 2 699 Indefinite life 1 328 1 862 976
11 498 8 519 5 256
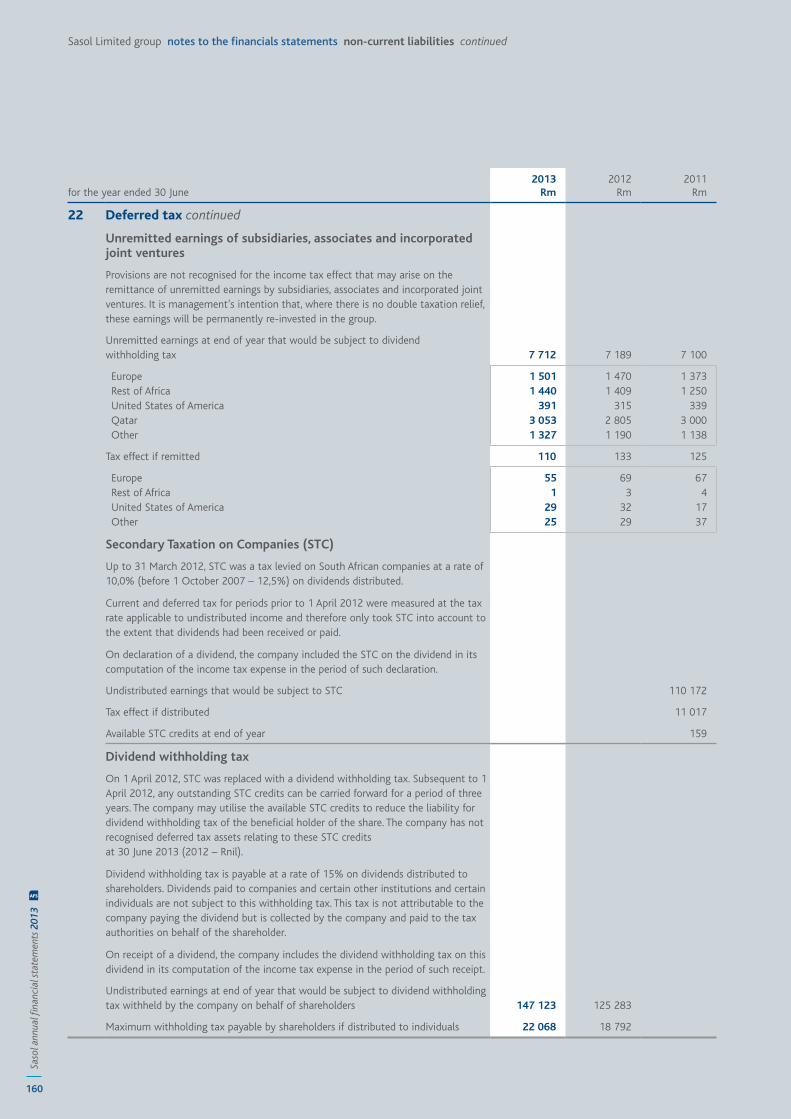
160
Saso
l ann
ual fi
nanc
ial s
tate
men
ts 2
013
AFS
Sasol Limited group notes to the financials statements non-current liabilities continued
for the year ended 30 June2013
Rm 2012
Rm 2011
Rm
22 Deferred tax continued
Unremitted earnings of subsidiaries, associates and incorporated joint ventures
Provisions are not recognised for the income tax effect that may arise on the remittance of unremitted earnings by subsidiaries, associates and incorporated joint ventures. It is management’s intention that, where there is no double taxation relief, these earnings will be permanently re-invested in the group.
Unremitted earnings at end of year that would be subject to dividend withholding tax 7 712 7 189 7 100
Europe 1 501 1 470 1 373 Rest of Africa 1 440 1 409 1 250 United States of America 391 315 339 Qatar 3 053 2 805 3 000 Other 1 327 1 190 1 138
Tax effect if remitted 110 133 125
Europe 55 69 67 Rest of Africa 1 3 4 United States of America 29 32 17 Other 25 29 37
Secondary Taxation on Companies (STC)
Up to 31 March 2012, STC was a tax levied on South African companies at a rate of 10,0% (before 1 October 2007 – 12,5%) on dividends distributed.
Current and deferred tax for periods prior to 1 April 2012 were measured at the tax rate applicable to undistributed income and therefore only took STC into account to the extent that dividends had been received or paid.
On declaration of a dividend, the company included the STC on the dividend in its computation of the income tax expense in the period of such declaration.
Undistributed earnings that would be subject to STC 110 172
Tax effect if distributed 11 017
Available STC credits at end of year 159
Dividend withholding tax
On 1 April 2012, STC was replaced with a dividend withholding tax. Subsequent to 1 April 2012, any outstanding STC credits can be carried forward for a period of three years. The company may utilise the available STC credits to reduce the liability for dividend withholding tax of the beneficial holder of the share. The company has not recognised deferred tax assets relating to these STC credits at 30 June 2013 (2012 – Rnil).
Dividend withholding tax is payable at a rate of 15% on dividends distributed to shareholders. Dividends paid to companies and certain other institutions and certain individuals are not subject to this withholding tax. This tax is not attributable to the company paying the dividend but is collected by the company and paid to the tax authorities on behalf of the shareholder.
On receipt of a dividend, the company includes the dividend withholding tax on this dividend in its computation of the income tax expense in the period of such receipt.
Undistributed earnings at end of year that would be subject to dividend withholding tax withheld by the company on behalf of shareholders 147 123 125 283
Maximum withholding tax payable by shareholders if distributed to individuals 22 068 18 792
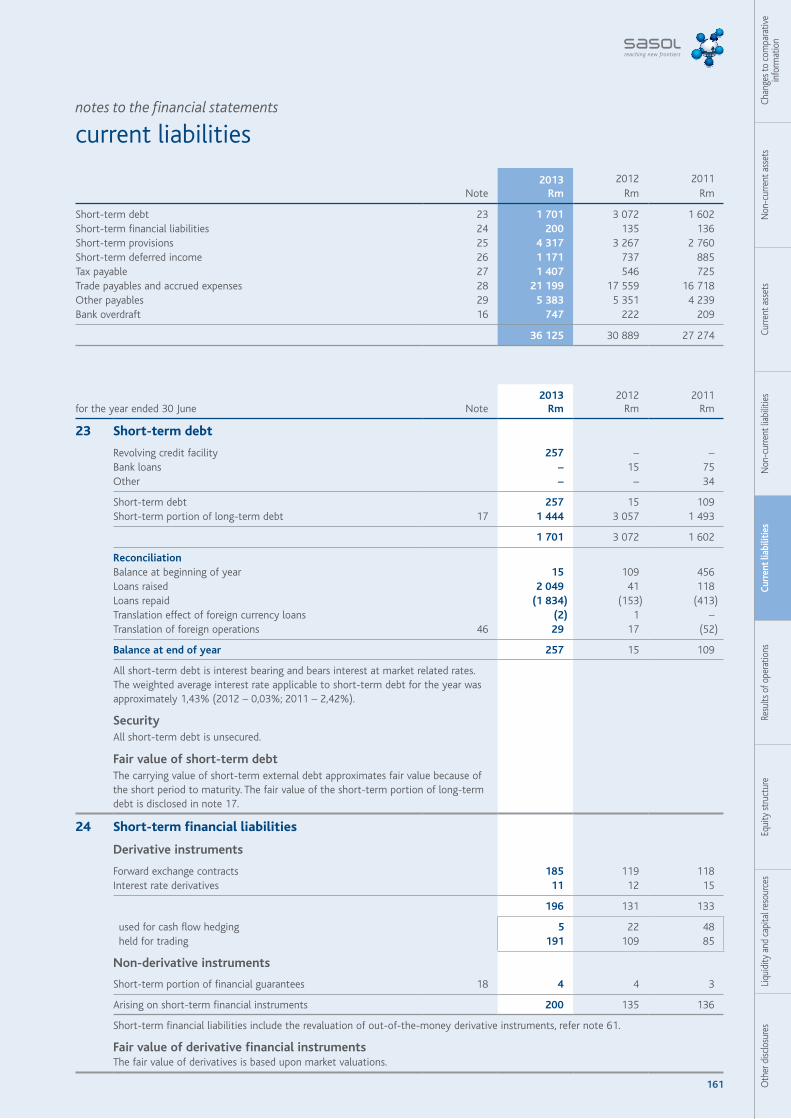
161 Oth
er d
isclo
sure
sLi
quid
ity a
nd c
apita
l res
ourc
esEq
uity
stru
ctur
eRe
sults
of o
pera
tions
Curr
ent l
iabi
litie
sN
on-c
urre
nt li
abili
ties
Curre
nt a
sset
sN
on-c
urre
nt a
sset
sCh
ange
s to
com
para
tive
info
rmat
ion
notes to the financial statements
current liabilities
for the year ended 30 June Note 2013
Rm 2012
Rm 2011
Rm
23 Short-term debt
Revolving credit facility 257 – –Bank loans – 15 75 Other – – 34
Short-term debt 257 15 109 Short-term portion of long-term debt 17 1 444 3 057 1 493
1 701 3 072 1 602
ReconciliationBalance at beginning of year 15 109 456 Loans raised 2 049 41 118 Loans repaid (1 834) (153) (413)Translation effect of foreign currency loans (2) 1 –Translation of foreign operations 46 29 17 (52)
Balance at end of year 257 15 109
All short-term debt is interest bearing and bears interest at market related rates. The weighted average interest rate applicable to short-term debt for the year was approximately 1,43% (2012 – 0,03%; 2011 – 2,42%).
SecurityAll short-term debt is unsecured.
Fair value of short-term debtThe carrying value of short-term external debt approximates fair value because of the short period to maturity. The fair value of the short-term portion of long-term debt is disclosed in note 17.
24 Short-term financial liabilities
Derivative instruments
Forward exchange contracts 185 119 118 Interest rate derivatives 11 12 15
196 131 133
used for cash flow hedging 5 22 48 held for trading 191 109 85
Non-derivative instruments
Short-term portion of financial guarantees 18 4 4 3
Arising on short-term financial instruments 200 135 136
Short-term financial liabilities include the revaluation of out-of-the-money derivative instruments, refer note 61.
Fair value of derivative financial instrumentsThe fair value of derivatives is based upon market valuations.
Note 2013
Rm 2012
Rm 2011
Rm
Short-term debt 23 1 701 3 072 1 602 Short-term financial liabilities 24 200 135 136 Short-term provisions 25 4 317 3 267 2 760 Short-term deferred income 26 1 171 737 885 Tax payable 27 1 407 546 725 Trade payables and accrued expenses 28 21 199 17 559 16 718 Other payables 29 5 383 5 351 4 239 Bank overdraft 16 747 222 209
36 125 30 889 27 274
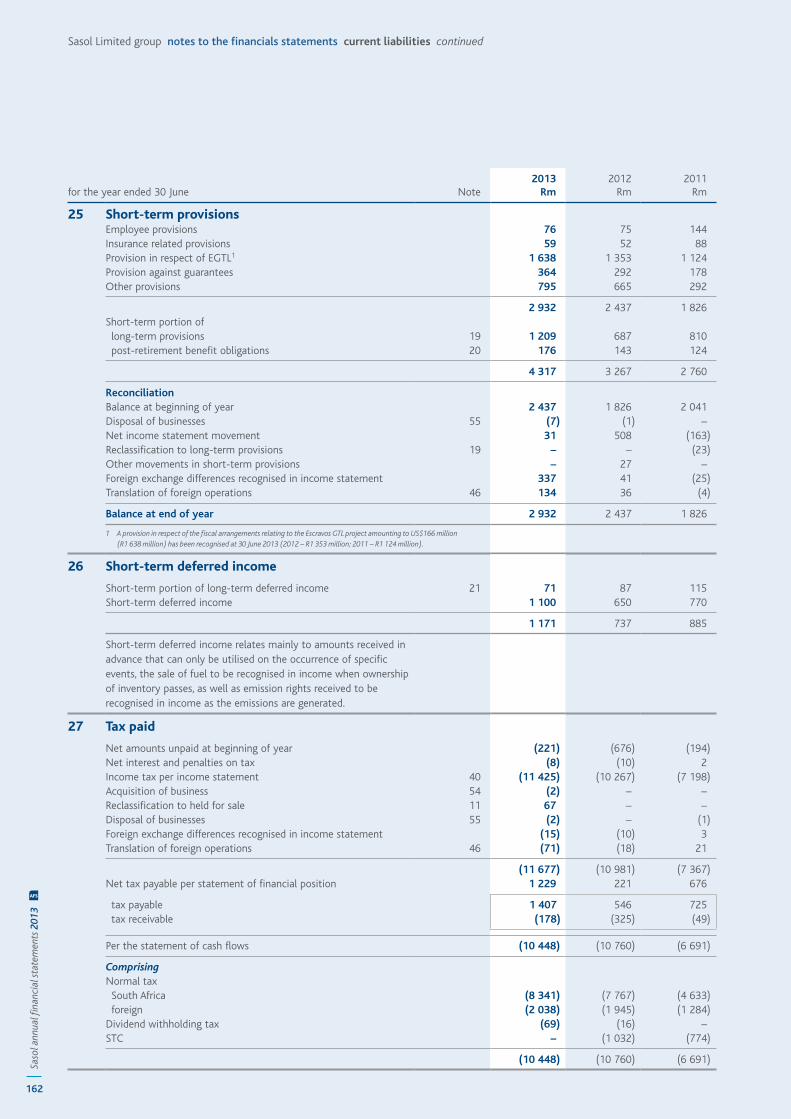
162
Saso
l ann
ual fi
nanc
ial s
tate
men
ts 2
013
AFS
Sasol Limited group notes to the financials statements current liabilities continued
for the year ended 30 June Note 2013
Rm 2012
Rm 2011
Rm
25 Short-term provisionsEmployee provisions 76 75 144 Insurance related provisions 59 52 88 Provision in respect of EGTL1 1 638 1 353 1 124 Provision against guarantees 364 292 178 Other provisions 795 665 292
2 932 2 437 1 826 Short-term portion of long-term provisions 19 1 209 687 810 post-retirement benefit obligations 20 176 143 124
4 317 3 267 2 760
ReconciliationBalance at beginning of year 2 437 1 826 2 041 Disposal of businesses 55 (7) (1) –Net income statement movement 31 508 (163)Reclassification to long-term provisions 19 – – (23)Other movements in short-term provisions – 27 –Foreign exchange differences recognised in income statement 337 41 (25)Translation of foreign operations 46 134 36 (4)
Balance at end of year 2 932 2 437 1 826
1 A provision in respect of the fiscal arrangements relating to the Escravos GTL project amounting to US$166 million (R1 638 million) has been recognised at 30 June 2013 (2012 – R1 353 million; 2011 – R1 124 million).
26 Short-term deferred income
Short-term portion of long-term deferred income 21 71 87 115 Short-term deferred income 1 100 650 770
1 171 737 885
Short-term deferred income relates mainly to amounts received in advance that can only be utilised on the occurrence of specific events, the sale of fuel to be recognised in income when ownership of inventory passes, as well as emission rights received to be recognised in income as the emissions are generated.
27 Tax paid
Net amounts unpaid at beginning of year (221) (676) (194)Net interest and penalties on tax (8) (10) 2 Income tax per income statement 40 (11 425) (10 267) (7 198)Acquisition of business 54 (2) – –Reclassification to held for sale 11 67 – –Disposal of businesses 55 (2) – (1)Foreign exchange differences recognised in income statement (15) (10) 3 Translation of foreign operations 46 (71) (18) 21
(11 677) (10 981) (7 367)Net tax payable per statement of financial position 1 229 221 676
tax payable 1 407 546 725 tax receivable (178) (325) (49)
Per the statement of cash flows (10 448) (10 760) (6 691)
ComprisingNormal tax South Africa (8 341) (7 767) (4 633) foreign (2 038) (1 945) (1 284)Dividend withholding tax (69) (16) –STC – (1 032) (774)
(10 448) (10 760) (6 691)
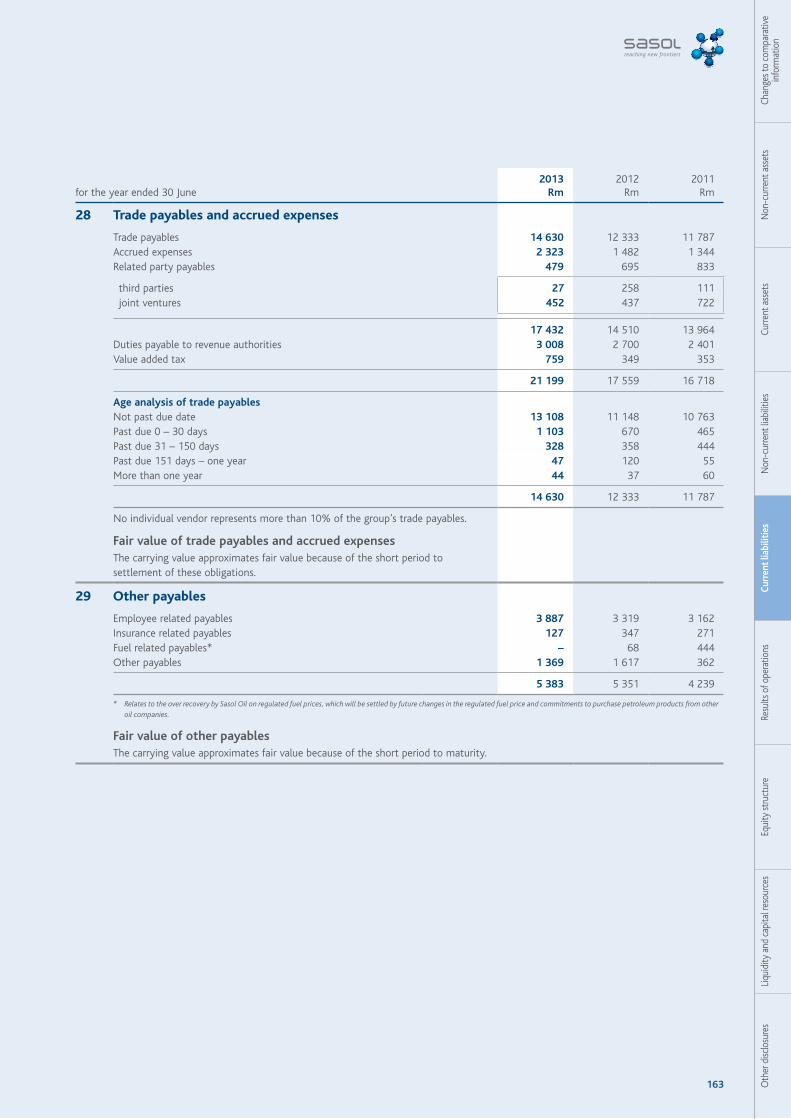
163 Oth
er d
isclo
sure
sLi
quid
ity a
nd c
apita
l res
ourc
esEq
uity
stru
ctur
eRe
sults
of o
pera
tions
Curr
ent l
iabi
litie
sN
on-c
urre
nt li
abili
ties
Curre
nt a
sset
sN
on-c
urre
nt a
sset
sCh
ange
s to
com
para
tive
info
rmat
ion
for the year ended 30 June2013
Rm 2012
Rm 2011
Rm
28 Trade payables and accrued expenses
Trade payables 14 630 12 333 11 787 Accrued expenses 2 323 1 482 1 344 Related party payables 479 695 833
third parties 27 258 111 joint ventures 452 437 722
17 432 14 510 13 964 Duties payable to revenue authorities 3 008 2 700 2 401 Value added tax 759 349 353
21 199 17 559 16 718
Age analysis of trade payablesNot past due date 13 108 11 148 10 763 Past due 0 – 30 days 1 103 670 465 Past due 31 – 150 days 328 358 444 Past due 151 days – one year 47 120 55 More than one year 44 37 60
14 630 12 333 11 787
No individual vendor represents more than 10% of the group’s trade payables.
Fair value of trade payables and accrued expensesThe carrying value approximates fair value because of the short period to settlement of these obligations.
29 Other payables
Employee related payables 3 887 3 319 3 162 Insurance related payables 127 347 271 Fuel related payables* – 68 444 Other payables 1 369 1 617 362
5 383 5 351 4 239
* Relates to the over recovery by Sasol Oil on regulated fuel prices, which will be settled by future changes in the regulated fuel price and commitments to purchase petroleum products from other oil companies.
Fair value of other payablesThe carrying value approximates fair value because of the short period to maturity.
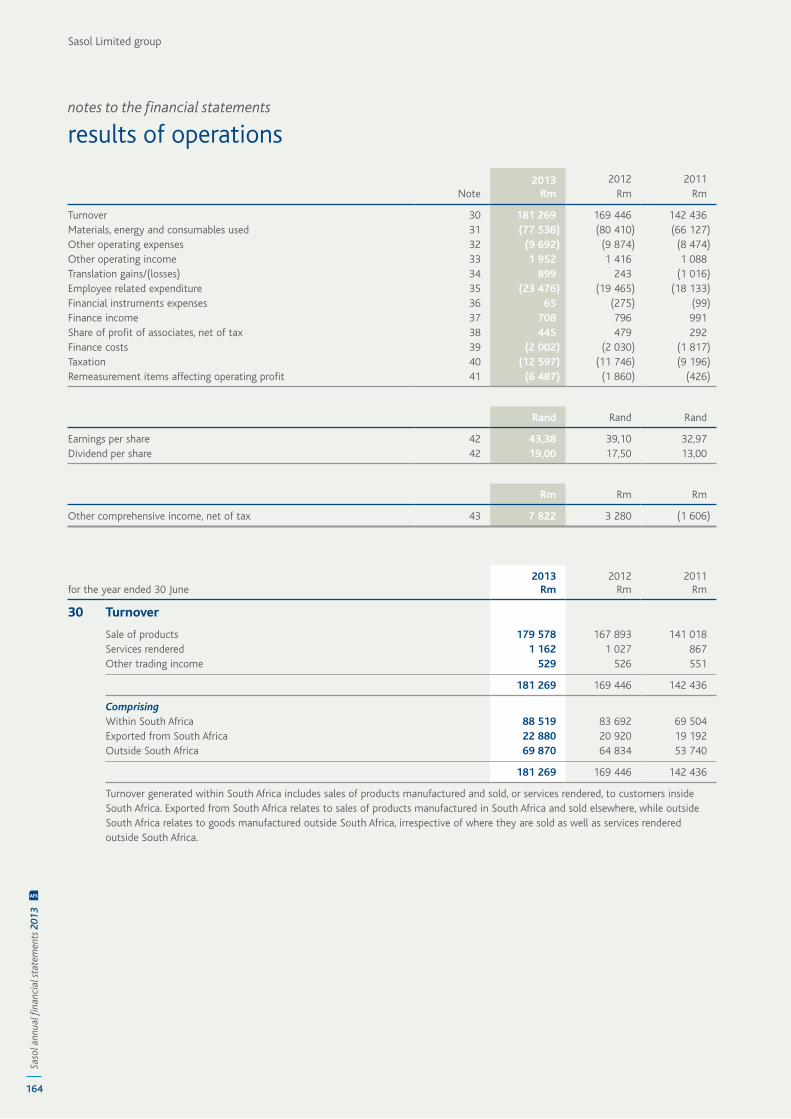
Sasol Limited group
164
Saso
l ann
ual fi
nanc
ial s
tate
men
ts 2
013
AFS
notes to the financial statements
results of operations
for the year ended 30 June2013
Rm 2012
Rm 2011
Rm
30 Turnover
Sale of products 179 578 167 893 141 018 Services rendered 1 162 1 027 867 Other trading income 529 526 551
181 269 169 446 142 436
ComprisingWithin South Africa 88 519 83 692 69 504 Exported from South Africa 22 880 20 920 19 192 Outside South Africa 69 870 64 834 53 740
181 269 169 446 142 436
Turnover generated within South Africa includes sales of products manufactured and sold, or services rendered, to customers inside South Africa. Exported from South Africa relates to sales of products manufactured in South Africa and sold elsewhere, while outside South Africa relates to goods manufactured outside South Africa, irrespective of where they are sold as well as services rendered outside South Africa.
Note 2013
Rm 2012
Rm 2011
Rm
Turnover 30 181 269 169 446 142 436 Materials, energy and consumables used 31 (77 538) (80 410) (66 127)Other operating expenses 32 (9 692) (9 874) (8 474)Other operating income 33 1 952 1 416 1 088 Translation gains/(losses) 34 899 243 (1 016)Employee related expenditure 35 (23 476) (19 465) (18 133)Financial instruments expenses 36 65 (275) (99)Finance income 37 708 796 991 Share of profit of associates, net of tax 38 445 479 292 Finance costs 39 (2 002) (2 030) (1 817)Taxation 40 (12 597) (11 746) (9 196)Remeasurement items affecting operating profit 41 (6 487) (1 860) (426)
Rand Rand Rand
Earnings per share 42 43,38 39,10 32,97 Dividend per share 42 19,00 17,50 13,00
Rm Rm Rm
Other comprehensive income, net of tax 43 7 822 3 280 (1 606)
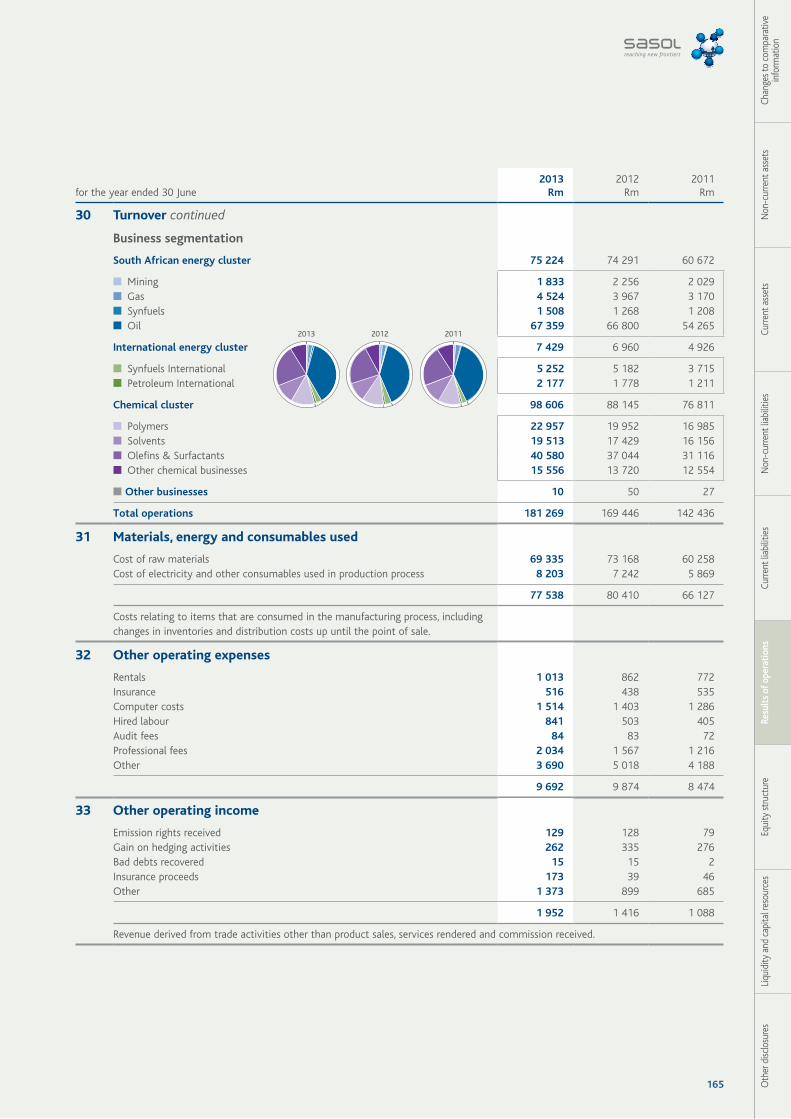
165 Oth
er d
isclo
sure
sLi
quid
ity a
nd c
apita
l res
ourc
esEq
uity
stru
ctur
eRe
sult
s of
ope
rati
ons
Curre
nt li
abili
ties
Non
-cur
rent
liab
ilitie
sCu
rrent
ass
ets
Non
-cur
rent
ass
ets
Chan
ges t
o co
mpa
rativ
e in
form
atio
n
for the year ended 30 June2013
Rm 2012
Rm 2011
Rm
30 Turnover continued
Business segmentation
South African energy cluster 75 224 74 291 60 672
■ Mining 1 833 2 256 2 029 ■ Gas 4 524 3 967 3 170 ■ Synfuels 1 508 1 268 1 208 ■ Oil 67 359 66 800 54 265
International energy cluster 7 429 6 960 4 926
■ Synfuels International 5 252 5 182 3 715 ■ Petroleum International 2 177 1 778 1 211
Chemical cluster 98 606 88 145 76 811
■ Polymers 22 957 19 952 16 985 ■ Solvents 19 513 17 429 16 156 ■ Olefins & Surfactants 40 580 37 044 31 116 ■ Other chemical businesses 15 556 13 720 12 554
■ Other businesses 10 50 27
Total operations 181 269 169 446 142 436
31 Materials, energy and consumables used
Cost of raw materials 69 335 73 168 60 258 Cost of electricity and other consumables used in production process 8 203 7 242 5 869
77 538 80 410 66 127
Costs relating to items that are consumed in the manufacturing process, including changes in inventories and distribution costs up until the point of sale.
32 Other operating expenses
Rentals 1 013 862 772 Insurance 516 438 535 Computer costs 1 514 1 403 1 286 Hired labour 841 503 405 Audit fees 84 83 72 Professional fees 2 034 1 567 1 216 Other 3 690 5 018 4 188
9 692 9 874 8 474
33 Other operating income
Emission rights received 129 128 79 Gain on hedging activities 262 335 276 Bad debts recovered 15 15 2 Insurance proceeds 173 39 46 Other 1 373 899 685
1 952 1 416 1 088
Revenue derived from trade activities other than product sales, services rendered and commission received.
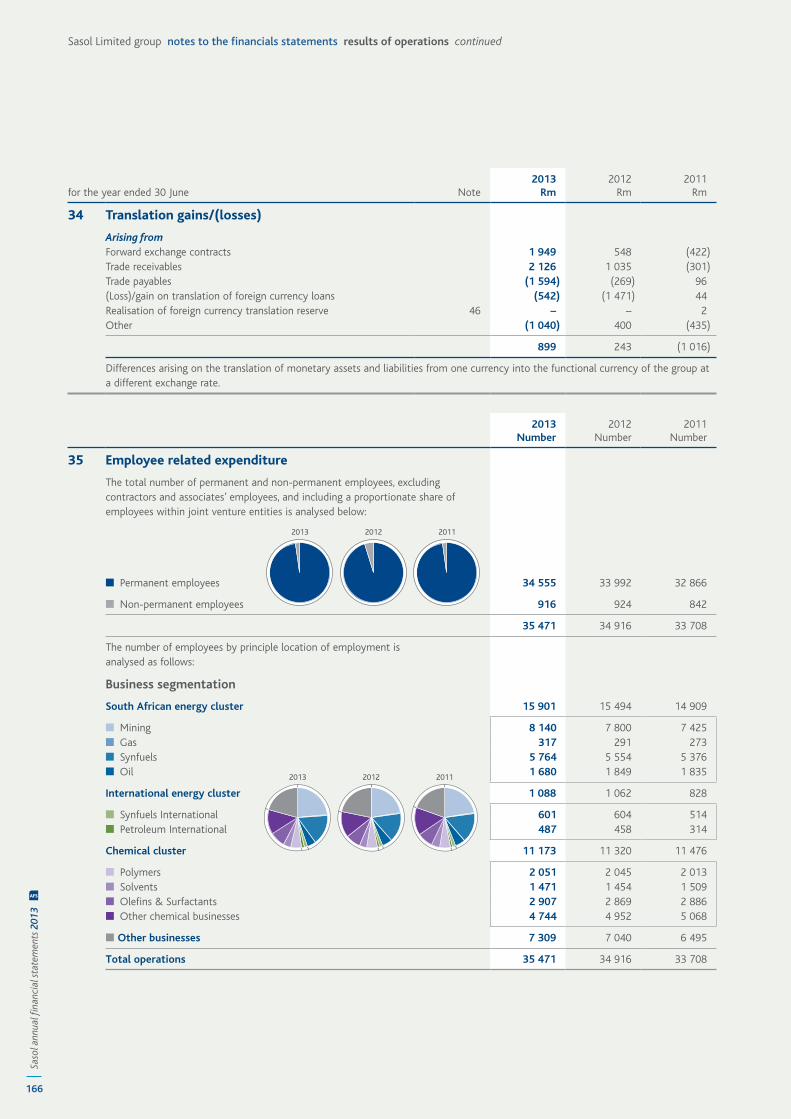
166
Saso
l ann
ual fi
nanc
ial s
tate
men
ts 2
013
AFS
Sasol Limited group notes to the financials statements results of operations continued
for the year ended 30 June Note 2013
Rm 2012
Rm 2011
Rm
34 Translation gains/(losses)
Arising fromForward exchange contracts 1 949 548 (422) Trade receivables 2 126 1 035 (301) Trade payables (1 594) (269) 96 (Loss)/gain on translation of foreign currency loans (542) (1 471) 44 Realisation of foreign currency translation reserve 46 – – 2 Other (1 040) 400 (435)
899 243 (1 016)
Differences arising on the translation of monetary assets and liabilities from one currency into the functional currency of the group at a different exchange rate.
2013Number
2012Number
2011Number
35 Employee related expenditure
The total number of permanent and non-permanent employees, excluding contractors and associates’ employees, and including a proportionate share of employees within joint venture entities is analysed below:
■ Permanent employees 34 555 33 992 32 866
■ Non-permanent employees 916 924 842
35 471 34 916 33 708
The number of employees by principle location of employment is analysed as follows:
Business segmentation
South African energy cluster 15 901 15 494 14 909
■ Mining 8 140 7 800 7 425 ■ Gas 317 291 273 ■ Synfuels 5 764 5 554 5 376 ■ Oil 1 680 1 849 1 835
International energy cluster 1 088 1 062 828
■ Synfuels International 601 604 514 ■ Petroleum International 487 458 314
Chemical cluster 11 173 11 320 11 476
■ Polymers 2 051 2 045 2 013 ■ Solvents 1 471 1 454 1 509 ■ Olefins & Surfactants 2 907 2 869 2 886 ■ Other chemical businesses 4 744 4 952 5 068
■ Other businesses 7 309 7 040 6 495
Total operations 35 471 34 916 33 708
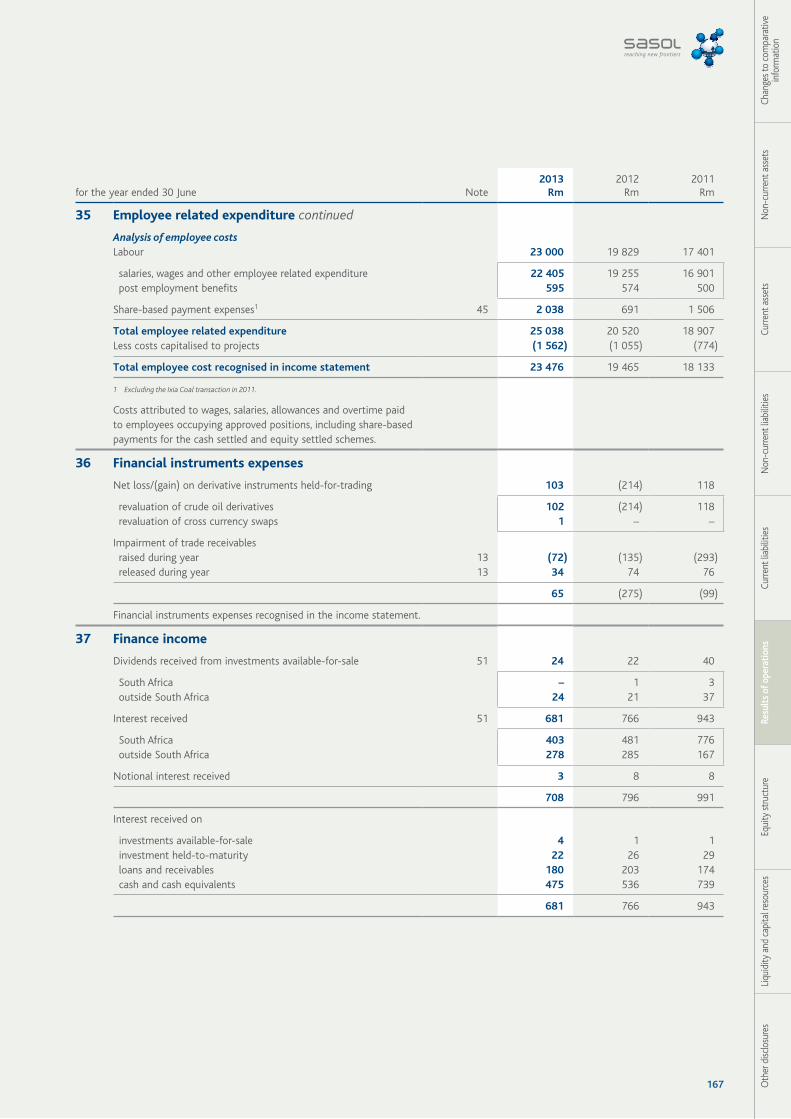
167 Oth
er d
isclo
sure
sLi
quid
ity a
nd c
apita
l res
ourc
esEq
uity
stru
ctur
eRe
sult
s of
ope
rati
ons
Curre
nt li
abili
ties
Non
-cur
rent
liab
ilitie
sCu
rrent
ass
ets
Non
-cur
rent
ass
ets
Chan
ges t
o co
mpa
rativ
e in
form
atio
n
for the year ended 30 June Note2013
Rm 2012
Rm 2011
Rm
35 Employee related expenditure continued
Analysis of employee costsLabour 23 000 19 829 17 401
salaries, wages and other employee related expenditure 22 405 19 255 16 901 post employment benefits 595 574 500
Share-based payment expenses1 45 2 038 691 1 506
Total employee related expenditure 25 038 20 520 18 907 Less costs capitalised to projects (1 562) (1 055) (774)
Total employee cost recognised in income statement 23 476 19 465 18 133
1 Excluding the Ixia Coal transaction in 2011.
Costs attributed to wages, salaries, allowances and overtime paid to employees occupying approved positions, including share-based payments for the cash settled and equity settled schemes.
36 Financial instruments expenses
Net loss/(gain) on derivative instruments held-for-trading 103 (214) 118
revaluation of crude oil derivatives 102 (214) 118 revaluation of cross currency swaps 1 – –
Impairment of trade receivables raised during year 13 (72) (135) (293) released during year 13 34 74 76
65 (275) (99)
Financial instruments expenses recognised in the income statement.
37 Finance income
Dividends received from investments available-for-sale 51 24 22 40
South Africa – 1 3 outside South Africa 24 21 37
Interest received 51 681 766 943
South Africa 403 481 776 outside South Africa 278 285 167
Notional interest received 3 8 8
708 796 991
Interest received on
investments available-for-sale 4 1 1 investment held-to-maturity 22 26 29 loans and receivables 180 203 174 cash and cash equivalents 475 536 739
681 766 943
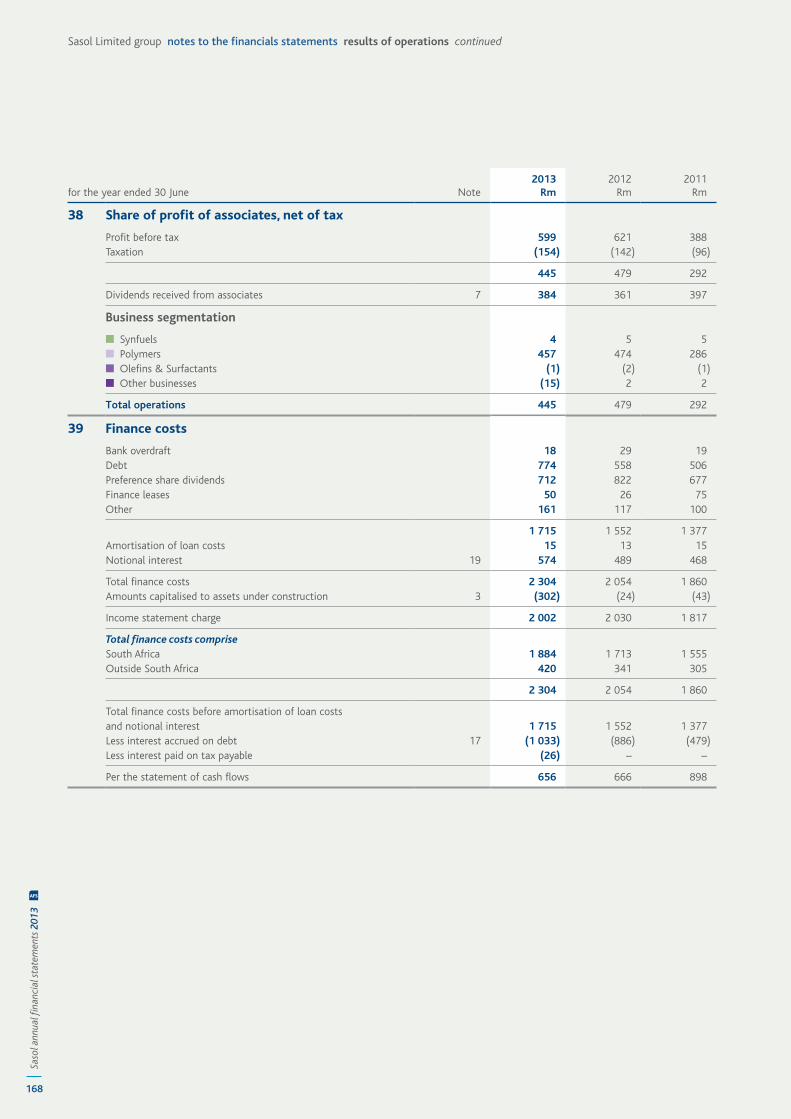
168
Saso
l ann
ual fi
nanc
ial s
tate
men
ts 2
013
AFS
Sasol Limited group notes to the financials statements results of operations continued
for the year ended 30 June Note2013
Rm 2012
Rm 2011
Rm
38 Share of profit of associates, net of tax
Profit before tax 599 621 388 Taxation (154) (142) (96)
445 479 292
Dividends received from associates 7 384 361 397
Business segmentation
■ Synfuels 4 5 5 ■ Polymers 457 474 286 ■ Olefins & Surfactants (1) (2) (1)■ Other businesses (15) 2 2
Total operations 445 479 292
39 Finance costs
Bank overdraft 18 29 19 Debt 774 558 506 Preference share dividends 712 822 677 Finance leases 50 26 75 Other 161 117 100
1 715 1 552 1 377 Amortisation of loan costs 15 13 15 Notional interest 19 574 489 468
Total finance costs 2 304 2 054 1 860 Amounts capitalised to assets under construction 3 (302) (24) (43)
Income statement charge 2 002 2 030 1 817
Total finance costs compriseSouth Africa 1 884 1 713 1 555 Outside South Africa 420 341 305
2 304 2 054 1 860
Total finance costs before amortisation of loan costs and notional interest 1 715 1 552 1 377 Less interest accrued on debt 17 (1 033) (886) (479)Less interest paid on tax payable (26) – –
Per the statement of cash flows 656 666 898
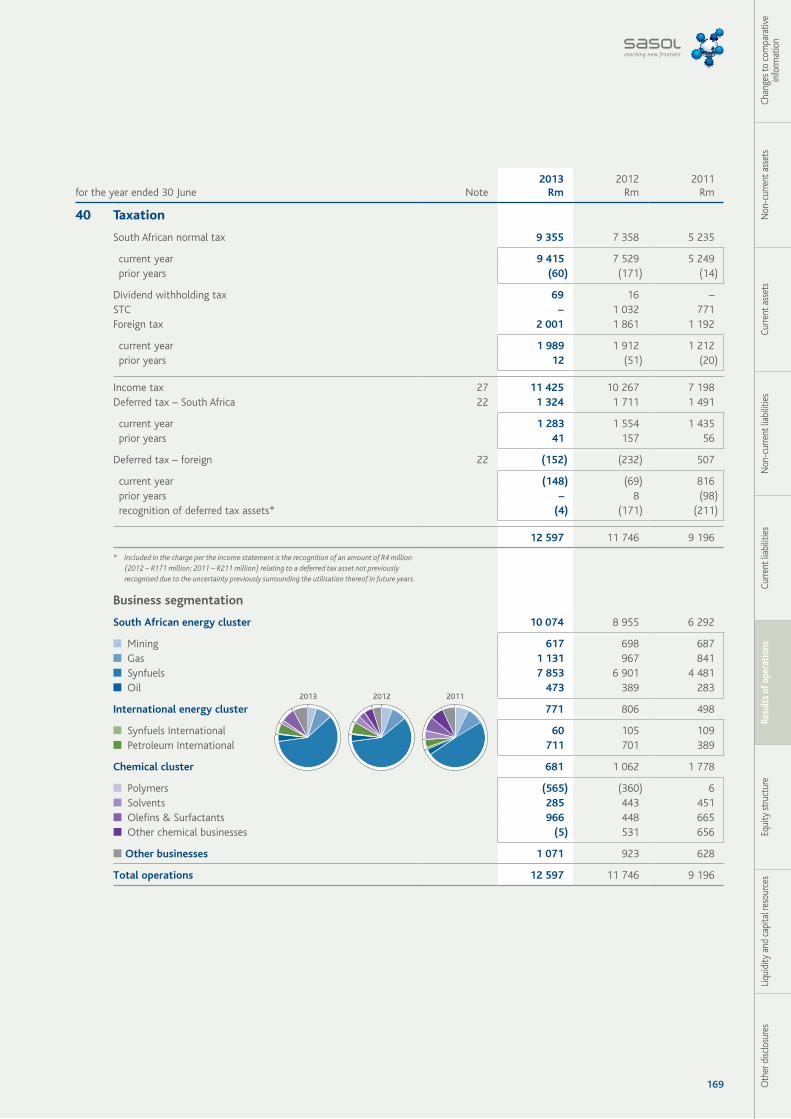
169 Oth
er d
isclo
sure
sLi
quid
ity a
nd c
apita
l res
ourc
esEq
uity
stru
ctur
eRe
sult
s of
ope
rati
ons
Curre
nt li
abili
ties
Non
-cur
rent
liab
ilitie
sCu
rrent
ass
ets
Non
-cur
rent
ass
ets
Chan
ges t
o co
mpa
rativ
e in
form
atio
n
for the year ended 30 June Note 2013
Rm 2012
Rm 2011
Rm
40 Taxation
South African normal tax 9 355 7 358 5 235
current year 9 415 7 529 5 249 prior years (60) (171) (14)
Dividend withholding tax 69 16 –STC – 1 032 771 Foreign tax 2 001 1 861 1 192
current year 1 989 1 912 1 212 prior years 12 (51) (20)
Income tax 27 11 425 10 267 7 198 Deferred tax – South Africa 22 1 324 1 711 1 491
current year 1 283 1 554 1 435 prior years 41 157 56
Deferred tax – foreign 22 (152) (232) 507
current year (148) (69) 816 prior years – 8 (98) recognition of deferred tax assets* (4) (171) (211)
12 597 11 746 9 196
* Included in the charge per the income statement is the recognition of an amount of R4 million (2012 – R171 million; 2011 – R211 million) relating to a deferred tax asset not previously recognised due to the uncertainty previously surrounding the utilisation thereof in future years.
Business segmentation
South African energy cluster 10 074 8 955 6 292
■ Mining 617 698 687 ■ Gas 1 131 967 841 ■ Synfuels 7 853 6 901 4 481 ■ Oil 473 389 283
International energy cluster 771 806 498
■ Synfuels International 60 105 109 ■ Petroleum International 711 701 389
Chemical cluster 681 1 062 1 778
■ Polymers (565) (360) 6 ■ Solvents 285 443 451 ■ Olefins & Surfactants 966 448 665 ■ Other chemical businesses (5) 531 656
■ Other businesses 1 071 923 628
Total operations 12 597 11 746 9 196
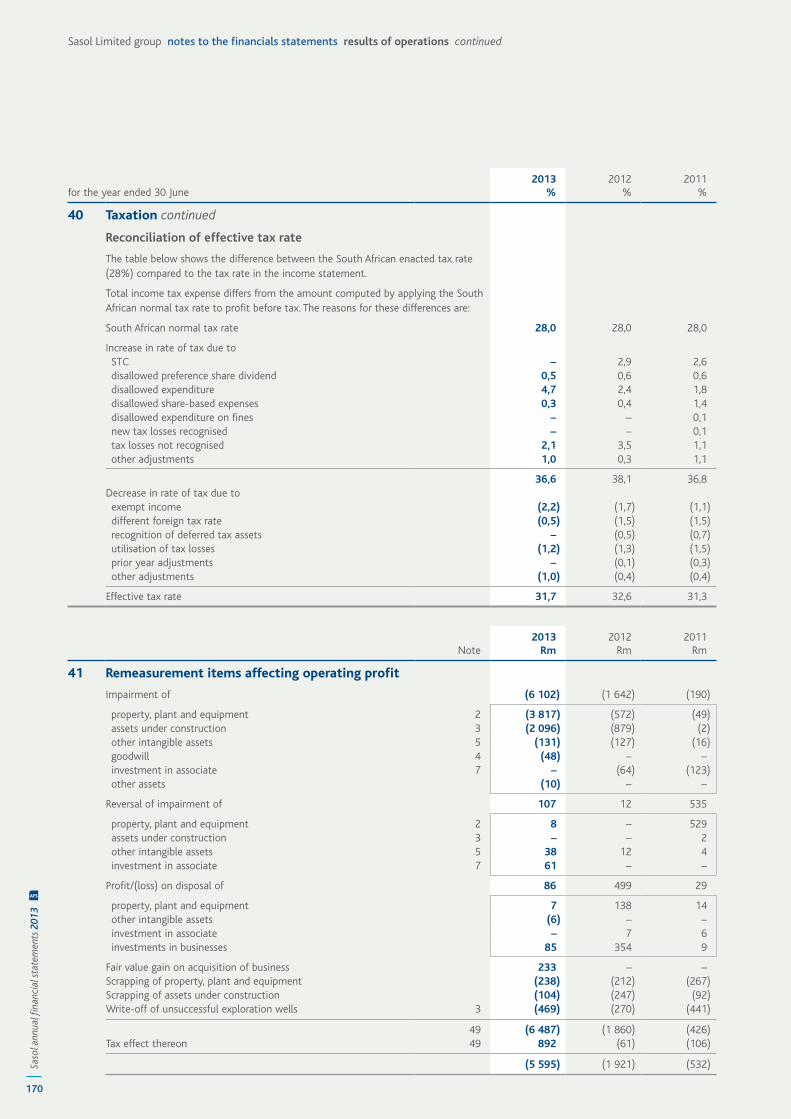
170
Saso
l ann
ual fi
nanc
ial s
tate
men
ts 2
013
AFS
Sasol Limited group notes to the financials statements results of operations continued
for the year ended 30 June2013
% 2012
% 2011
%
40 Taxation continued
Reconciliation of effective tax rate
The table below shows the difference between the South African enacted tax rate (28%) compared to the tax rate in the income statement.
Total income tax expense differs from the amount computed by applying the South African normal tax rate to profit before tax. The reasons for these differences are:
South African normal tax rate 28,0 28,0 28,0
Increase in rate of tax due to STC – 2,9 2,6 disallowed preference share dividend 0,5 0,6 0,6 disallowed expenditure 4,7 2,4 1,8 disallowed share-based expenses 0,3 0,4 1,4 disallowed expenditure on fines – – 0,1 new tax losses recognised – – 0,1 tax losses not recognised 2,1 3,5 1,1 other adjustments 1,0 0,3 1,1
36,6 38,1 36,8 Decrease in rate of tax due to exempt income (2,2) (1,7) (1,1) different foreign tax rate (0,5) (1,5) (1,5) recognition of deferred tax assets – (0,5) (0,7) utilisation of tax losses (1,2) (1,3) (1,5) prior year adjustments – (0,1) (0,3) other adjustments (1,0) (0,4) (0,4)
Effective tax rate 31,7 32,6 31,3
Note 2013
Rm 2012
Rm 2011
Rm
41 Remeasurement items affecting operating profit
Impairment of (6 102) (1 642) (190)
property, plant and equipment 2 (3 817) (572) (49) assets under construction 3 (2 096) (879) (2) other intangible assets 5 (131) (127) (16) goodwill 4 (48) – – investment in associate 7 – (64) (123) other assets (10) – –
Reversal of impairment of 107 12 535
property, plant and equipment 2 8 – 529 assets under construction 3 – – 2 other intangible assets 5 38 12 4 investment in associate 7 61 – –
Profit/(loss) on disposal of 86 499 29
property, plant and equipment 7 138 14 other intangible assets (6) – – investment in associate – 7 6 investments in businesses 85 354 9
Fair value gain on acquisition of business 233 – –Scrapping of property, plant and equipment (238) (212) (267)Scrapping of assets under construction (104) (247) (92)Write-off of unsuccessful exploration wells 3 (469) (270) (441)
49 (6 487) (1 860) (426)Tax effect thereon 49 892 (61) (106)
(5 595) (1 921) (532)
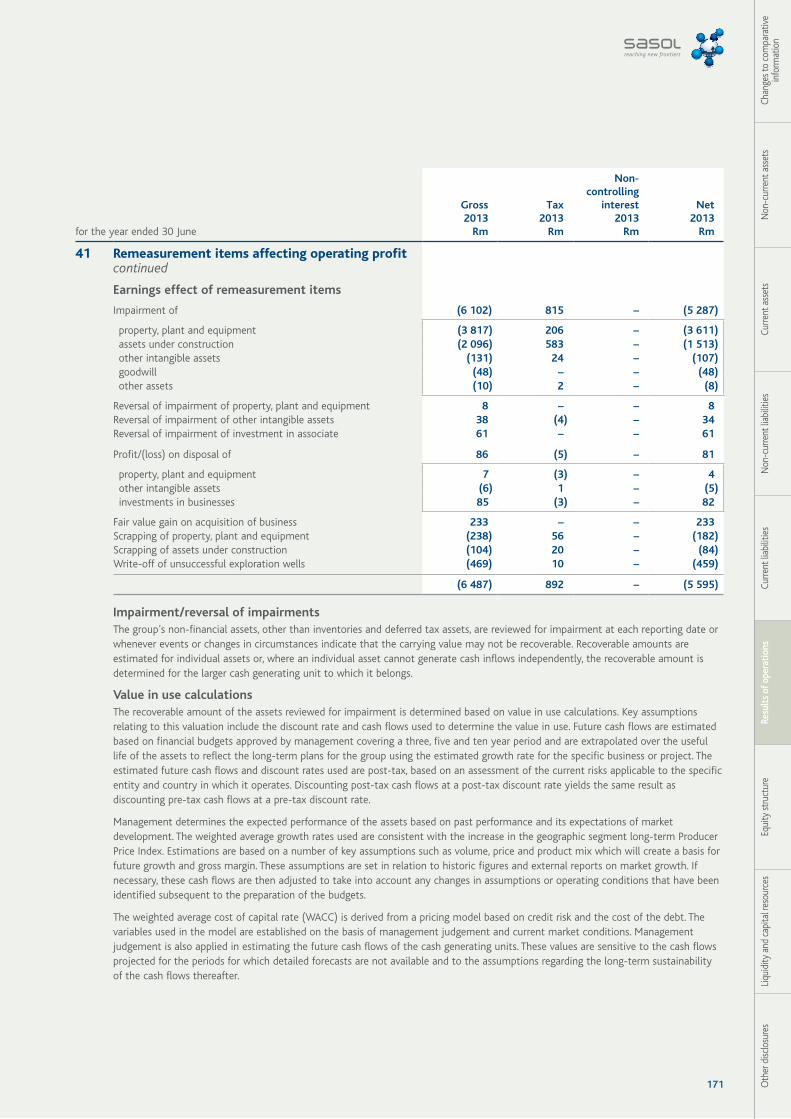
171 Oth
er d
isclo
sure
sLi
quid
ity a
nd c
apita
l res
ourc
esEq
uity
stru
ctur
eRe
sult
s of
ope
rati
ons
Curre
nt li
abili
ties
Non
-cur
rent
liab
ilitie
sCu
rrent
ass
ets
Non
-cur
rent
ass
ets
Chan
ges t
o co
mpa
rativ
e in
form
atio
n
for the year ended 30 June
Gross2013
Rm
Tax2013
Rm
Non-controlling
interest2013
Rm
Net2013
Rm
41 Remeasurement items affecting operating profit continued
Earnings effect of remeasurement items
Impairment of (6 102) 815 – (5 287)
property, plant and equipment (3 817) 206 – (3 611) assets under construction (2 096) 583 – (1 513) other intangible assets (131) 24 – (107) goodwill (48) – – (48) other assets (10) 2 – (8)
Reversal of impairment of property, plant and equipment 8 – – 8 Reversal of impairment of other intangible assets 38 (4) – 34 Reversal of impairment of investment in associate 61 – – 61
Profit/(loss) on disposal of 86 (5) – 81
property, plant and equipment 7 (3) – 4 other intangible assets (6) 1 – (5) investments in businesses 85 (3) – 82
Fair value gain on acquisition of business 233 – – 233 Scrapping of property, plant and equipment (238) 56 – (182)Scrapping of assets under construction (104) 20 – (84)Write-off of unsuccessful exploration wells (469) 10 – (459)
(6 487) 892 – (5 595)
Impairment/reversal of impairments The group’s non-financial assets, other than inventories and deferred tax assets, are reviewed for impairment at each reporting date or whenever events or changes in circumstances indicate that the carrying value may not be recoverable. Recoverable amounts are estimated for individual assets or, where an individual asset cannot generate cash inflows independently, the recoverable amount is determined for the larger cash generating unit to which it belongs.
Value in use calculationsThe recoverable amount of the assets reviewed for impairment is determined based on value in use calculations. Key assumptions relating to this valuation include the discount rate and cash flows used to determine the value in use. Future cash flows are estimated based on financial budgets approved by management covering a three, five and ten year period and are extrapolated over the useful life of the assets to reflect the long-term plans for the group using the estimated growth rate for the specific business or project. The estimated future cash flows and discount rates used are post-tax, based on an assessment of the current risks applicable to the specific entity and country in which it operates. Discounting post-tax cash flows at a post-tax discount rate yields the same result as discounting pre-tax cash flows at a pre-tax discount rate.
Management determines the expected performance of the assets based on past performance and its expectations of market development. The weighted average growth rates used are consistent with the increase in the geographic segment long-term Producer Price Index. Estimations are based on a number of key assumptions such as volume, price and product mix which will create a basis for future growth and gross margin. These assumptions are set in relation to historic figures and external reports on market growth. If necessary, these cash flows are then adjusted to take into account any changes in assumptions or operating conditions that have been identified subsequent to the preparation of the budgets.
The weighted average cost of capital rate (WACC) is derived from a pricing model based on credit risk and the cost of the debt. The variables used in the model are established on the basis of management judgement and current market conditions. Management judgement is also applied in estimating the future cash flows of the cash generating units. These values are sensitive to the cash flows projected for the periods for which detailed forecasts are not available and to the assumptions regarding the long-term sustainability of the cash flows thereafter.
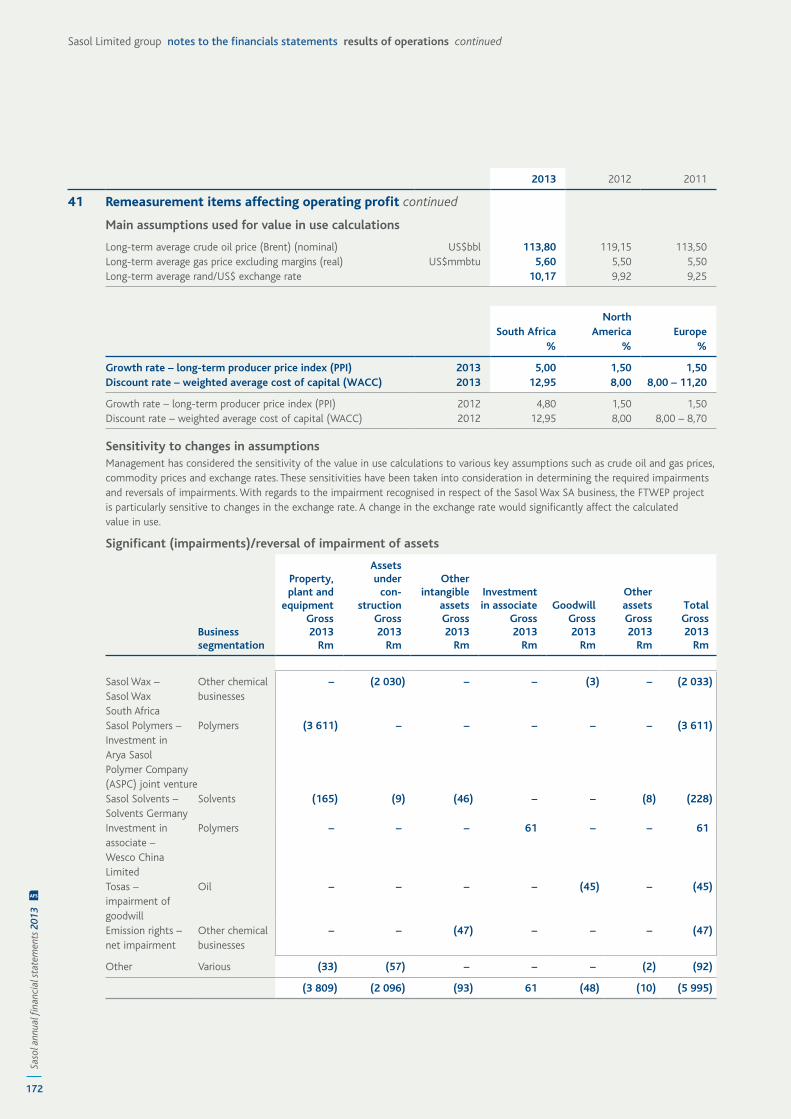
172
Saso
l ann
ual fi
nanc
ial s
tate
men
ts 2
013
AFS
Sasol Limited group notes to the financials statements results of operations continued
2013 2012 2011
41 Remeasurement items affecting operating profit continued
Main assumptions used for value in use calculations
Long-term average crude oil price (Brent) (nominal) US$bbl 113,80 119,15 113,50 Long-term average gas price excluding margins (real) US$mmbtu 5,60 5,50 5,50 Long-term average rand/US$ exchange rate 10,17 9,92 9,25
South Africa North
America Europe % % %
Growth rate – long-term producer price index (PPI) 2013 5,00 1,50 1,50 Discount rate – weighted average cost of capital (WACC) 2013 12,95 8,00 8,00 – 11,20
Growth rate – long-term producer price index (PPI) 2012 4,80 1,50 1,50 Discount rate – weighted average cost of capital (WACC) 2012 12,95 8,00 8,00 – 8,70
Sensitivity to changes in assumptionsManagement has considered the sensitivity of the value in use calculations to various key assumptions such as crude oil and gas prices, commodity prices and exchange rates. These sensitivities have been taken into consideration in determining the required impairments and reversals of impairments. With regards to the impairment recognised in respect of the Sasol Wax SA business, the FTWEP project is particularly sensitive to changes in the exchange rate. A change in the exchange rate would significantly affect the calculated value in use.
Significant (impairments)/reversal of impairment of assets
Businesssegmentation
Property, plant and
equipmentGross2013
Rm
Assets under
con-struction
Gross2013
Rm
Other intangible
assetsGross2013
Rm
Investment in associate
Gross2013
Rm
GoodwillGross2013
Rm
OtherassetsGross2013
Rm
TotalGross2013
Rm
Sasol Wax – Sasol Wax South Africa
Other chemical businesses
– (2 030) – – (3) – (2 033)
Sasol Polymers – Investment in Arya Sasol Polymer Company (ASPC) joint venture
Polymers (3 611) – – – – – (3 611)
Sasol Solvents – Solvents Germany
Solvents (165) (9) (46) – – (8) (228)
Investment in associate – Wesco China Limited
Polymers – – – 61 – – 61
Tosas – impairment of goodwill
Oil – – – – (45) – (45)
Emission rights – net impairment
Other chemical businesses
– – (47) – – – (47)
Other Various (33) (57) – – – (2) (92)
(3 809) (2 096) (93) 61 (48) (10) (5 995)
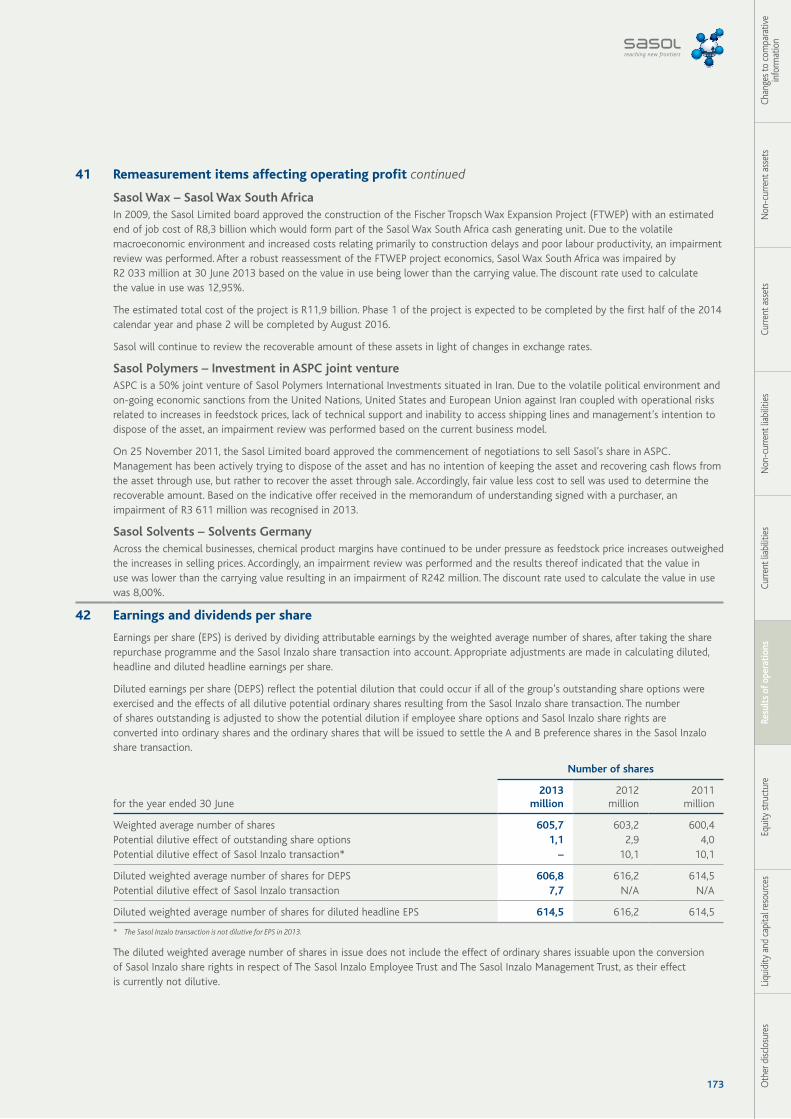
173 Oth
er d
isclo
sure
sLi
quid
ity a
nd c
apita
l res
ourc
esEq
uity
stru
ctur
eRe
sult
s of
ope
rati
ons
Curre
nt li
abili
ties
Non
-cur
rent
liab
ilitie
sCu
rrent
ass
ets
Non
-cur
rent
ass
ets
Chan
ges t
o co
mpa
rativ
e in
form
atio
n
41 Remeasurement items affecting operating profit continued
Sasol Wax – Sasol Wax South Africa In 2009, the Sasol Limited board approved the construction of the Fischer Tropsch Wax Expansion Project (FTWEP) with an estimated end of job cost of R8,3 billion which would form part of the Sasol Wax South Africa cash generating unit. Due to the volatile macroeconomic environment and increased costs relating primarily to construction delays and poor labour productivity, an impairment review was performed. After a robust reassessment of the FTWEP project economics, Sasol Wax South Africa was impaired by R2 033 million at 30 June 2013 based on the value in use being lower than the carrying value. The discount rate used to calculate the value in use was 12,95%.
The estimated total cost of the project is R11,9 billion. Phase 1 of the project is expected to be completed by the first half of the 2014 calendar year and phase 2 will be completed by August 2016.
Sasol will continue to review the recoverable amount of these assets in light of changes in exchange rates.
Sasol Polymers – Investment in ASPC joint venture ASPC is a 50% joint venture of Sasol Polymers International Investments situated in Iran. Due to the volatile political environment and on-going economic sanctions from the United Nations, United States and European Union against Iran coupled with operational risks related to increases in feedstock prices, lack of technical support and inability to access shipping lines and management’s intention to dispose of the asset, an impairment review was performed based on the current business model.
On 25 November 2011, the Sasol Limited board approved the commencement of negotiations to sell Sasol’s share in ASPC. Management has been actively trying to dispose of the asset and has no intention of keeping the asset and recovering cash flows from the asset through use, but rather to recover the asset through sale. Accordingly, fair value less cost to sell was used to determine the recoverable amount. Based on the indicative offer received in the memorandum of understanding signed with a purchaser, an impairment of R3 611 million was recognised in 2013.
Sasol Solvents – Solvents Germany Across the chemical businesses, chemical product margins have continued to be under pressure as feedstock price increases outweighed the increases in selling prices. Accordingly, an impairment review was performed and the results thereof indicated that the value in use was lower than the carrying value resulting in an impairment of R242 million. The discount rate used to calculate the value in use was 8,00%.
42 Earnings and dividends per share
Earnings per share (EPS) is derived by dividing attributable earnings by the weighted average number of shares, after taking the share repurchase programme and the Sasol Inzalo share transaction into account. Appropriate adjustments are made in calculating diluted, headline and diluted headline earnings per share.
Diluted earnings per share (DEPS) reflect the potential dilution that could occur if all of the group’s outstanding share options were exercised and the effects of all dilutive potential ordinary shares resulting from the Sasol Inzalo share transaction. The number of shares outstanding is adjusted to show the potential dilution if employee share options and Sasol Inzalo share rights are converted into ordinary shares and the ordinary shares that will be issued to settle the A and B preference shares in the Sasol Inzalo share transaction.
for the year ended 30 June
Number of shares
2013million
2012million
2011million
Weighted average number of shares 605,7 603,2 600,4 Potential dilutive effect of outstanding share options 1,1 2,9 4,0 Potential dilutive effect of Sasol Inzalo transaction* – 10,1 10,1
Diluted weighted average number of shares for DEPS 606,8 616,2 614,5 Potential dilutive effect of Sasol Inzalo transaction 7,7 N/A N/A
Diluted weighted average number of shares for diluted headline EPS 614,5 616,2 614,5
* The Sasol Inzalo transaction is not dilutive for EPS in 2013.
The diluted weighted average number of shares in issue does not include the effect of ordinary shares issuable upon the conversion of Sasol Inzalo share rights in respect of The Sasol Inzalo Employee Trust and The Sasol Inzalo Management Trust, as their effect is currently not dilutive.
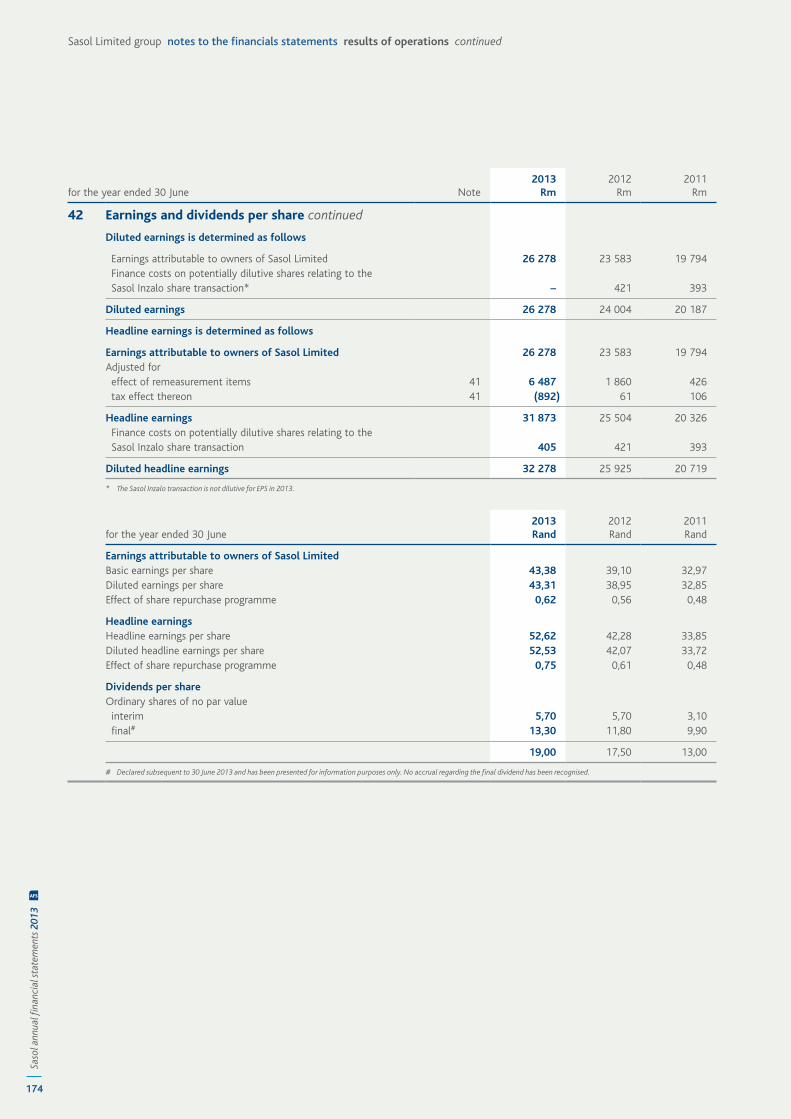
174
Saso
l ann
ual fi
nanc
ial s
tate
men
ts 2
013
AFS
Sasol Limited group notes to the financials statements results of operations continued
for the year ended 30 June Note 2013
Rm 2012
Rm 2011
Rm
42 Earnings and dividends per share continued
Diluted earnings is determined as follows
Earnings attributable to owners of Sasol Limited 26 278 23 583 19 794 Finance costs on potentially dilutive shares relating to the Sasol Inzalo share transaction* – 421 393
Diluted earnings 26 278 24 004 20 187
Headline earnings is determined as follows
Earnings attributable to owners of Sasol Limited 26 278 23 583 19 794 Adjusted for effect of remeasurement items 41 6 487 1 860 426 tax effect thereon 41 (892) 61 106
Headline earnings 31 873 25 504 20 326 Finance costs on potentially dilutive shares relating to the Sasol Inzalo share transaction 405 421 393
Diluted headline earnings 32 278 25 925 20 719
* The Sasol Inzalo transaction is not dilutive for EPS in 2013.
for the year ended 30 June2013Rand
2012Rand
2011Rand
Earnings attributable to owners of Sasol LimitedBasic earnings per share 43,38 39,10 32,97 Diluted earnings per share 43,31 38,95 32,85 Effect of share repurchase programme 0,62 0,56 0,48
Headline earningsHeadline earnings per share 52,62 42,28 33,85 Diluted headline earnings per share 52,53 42,07 33,72 Effect of share repurchase programme 0,75 0,61 0,48
Dividends per share Ordinary shares of no par value interim 5,70 5,70 3,10 final# 13,30 11,80 9,90
19,00 17,50 13,00
# Declared subsequent to 30 June 2013 and has been presented for information purposes only. No accrual regarding the final dividend has been recognised.
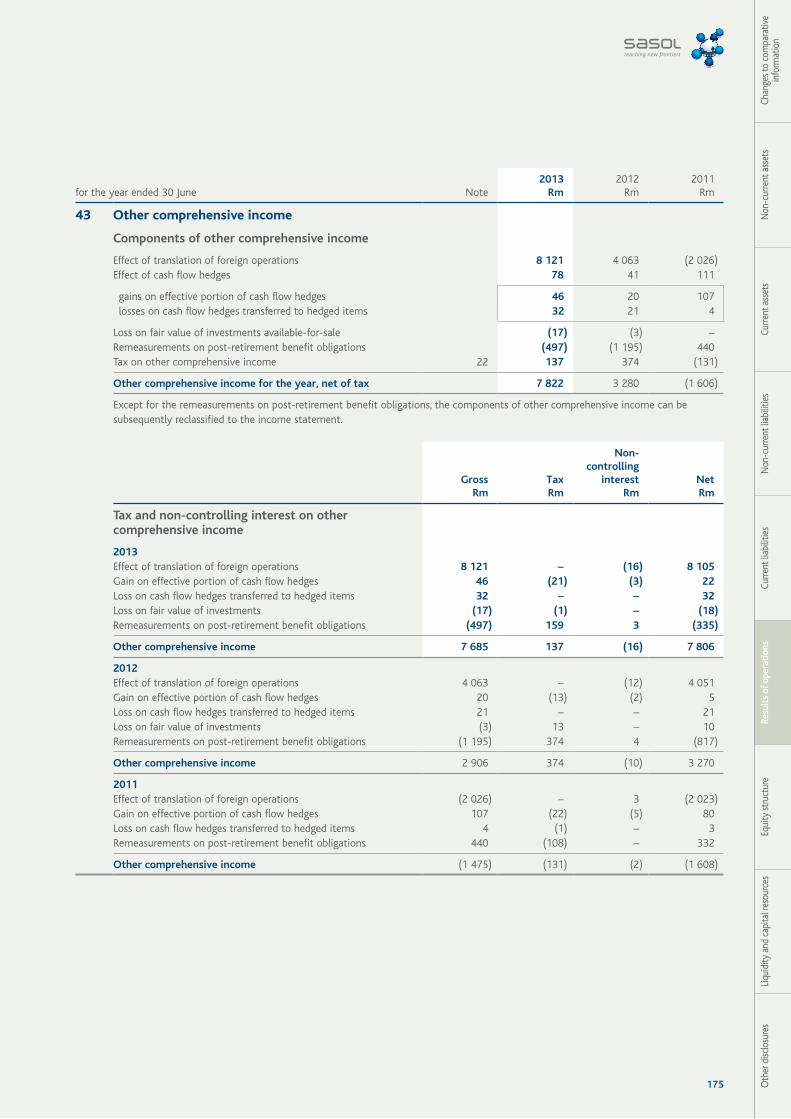
175 Oth
er d
isclo
sure
sLi
quid
ity a
nd c
apita
l res
ourc
esEq
uity
stru
ctur
eRe
sult
s of
ope
rati
ons
Curre
nt li
abili
ties
Non
-cur
rent
liab
ilitie
sCu
rrent
ass
ets
Non
-cur
rent
ass
ets
Chan
ges t
o co
mpa
rativ
e in
form
atio
n
for the year ended 30 June Note 2013
Rm 2012
Rm 2011
Rm
43 Other comprehensive income
Components of other comprehensive income
Effect of translation of foreign operations 8 121 4 063 (2 026)Effect of cash flow hedges 78 41 111
gains on effective portion of cash flow hedges 46 20 107 losses on cash flow hedges transferred to hedged items 32 21 4
Loss on fair value of investments available-for-sale (17) (3) –Remeasurements on post-retirement benefit obligations (497) (1 195) 440 Tax on other comprehensive income 22 137 374 (131)
Other comprehensive income for the year, net of tax 7 822 3 280 (1 606)
Except for the remeasurements on post-retirement benefit obligations, the components of other comprehensive income can be subsequently reclassified to the income statement.
GrossRm
TaxRm
Non-controlling
interestRm
NetRm
Tax and non-controlling interest on other comprehensive income
2013Effect of translation of foreign operations 8 121 – (16) 8 105 Gain on effective portion of cash flow hedges 46 (21) (3) 22 Loss on cash flow hedges transferred to hedged items 32 – – 32 Loss on fair value of investments (17) (1) – (18)Remeasurements on post-retirement benefit obligations (497) 159 3 (335)
Other comprehensive income 7 685 137 (16) 7 806
2012Effect of translation of foreign operations 4 063 – (12) 4 051 Gain on effective portion of cash flow hedges 20 (13) (2) 5 Loss on cash flow hedges transferred to hedged items 21 – – 21 Loss on fair value of investments (3) 13 – 10 Remeasurements on post-retirement benefit obligations (1 195) 374 4 (817)
Other comprehensive income 2 906 374 (10) 3 270
2011Effect of translation of foreign operations (2 026) – 3 (2 023)Gain on effective portion of cash flow hedges 107 (22) (5) 80 Loss on cash flow hedges transferred to hedged items 4 (1) – 3 Remeasurements on post-retirement benefit obligations 440 (108) – 332
Other comprehensive income (1 475) (131) (2) (1 608)
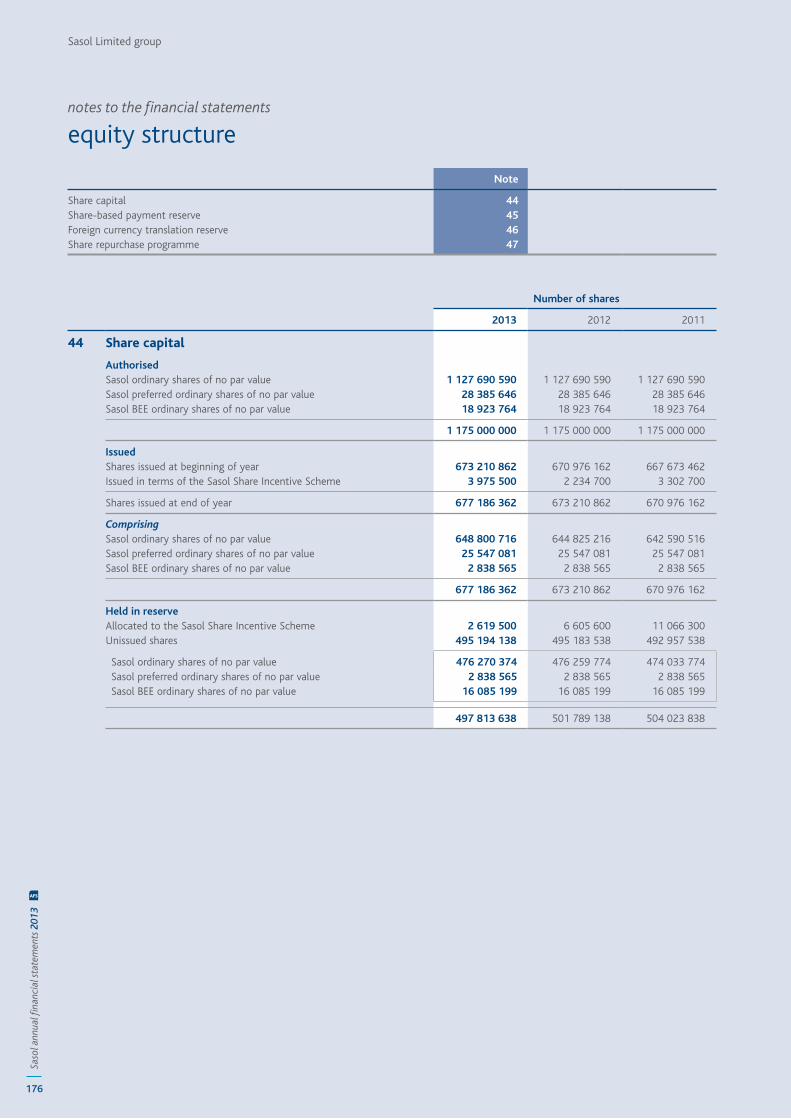
Sasol Limited group
176
Saso
l ann
ual fi
nanc
ial s
tate
men
ts 2
013
AFS
notes to the financial statements
equity structure
Number of shares
2013 2012 2011
44 Share capital
AuthorisedSasol ordinary shares of no par value 1 127 690 590 1 127 690 590 1 127 690 590 Sasol preferred ordinary shares of no par value 28 385 646 28 385 646 28 385 646 Sasol BEE ordinary shares of no par value 18 923 764 18 923 764 18 923 764
1 175 000 000 1 175 000 000 1 175 000 000
IssuedShares issued at beginning of year 673 210 862 670 976 162 667 673 462 Issued in terms of the Sasol Share Incentive Scheme 3 975 500 2 234 700 3 302 700
Shares issued at end of year 677 186 362 673 210 862 670 976 162
ComprisingSasol ordinary shares of no par value 648 800 716 644 825 216 642 590 516 Sasol preferred ordinary shares of no par value 25 547 081 25 547 081 25 547 081 Sasol BEE ordinary shares of no par value 2 838 565 2 838 565 2 838 565
677 186 362 673 210 862 670 976 162
Held in reserve Allocated to the Sasol Share Incentive Scheme 2 619 500 6 605 600 11 066 300 Unissued shares 495 194 138 495 183 538 492 957 538
Sasol ordinary shares of no par value 476 270 374 476 259 774 474 033 774 Sasol preferred ordinary shares of no par value 2 838 565 2 838 565 2 838 565 Sasol BEE ordinary shares of no par value 16 085 199 16 085 199 16 085 199
497 813 638 501 789 138 504 023 838
Note
Share capital 44Share-based payment reserve 45Foreign currency translation reserve 46Share repurchase programme 47
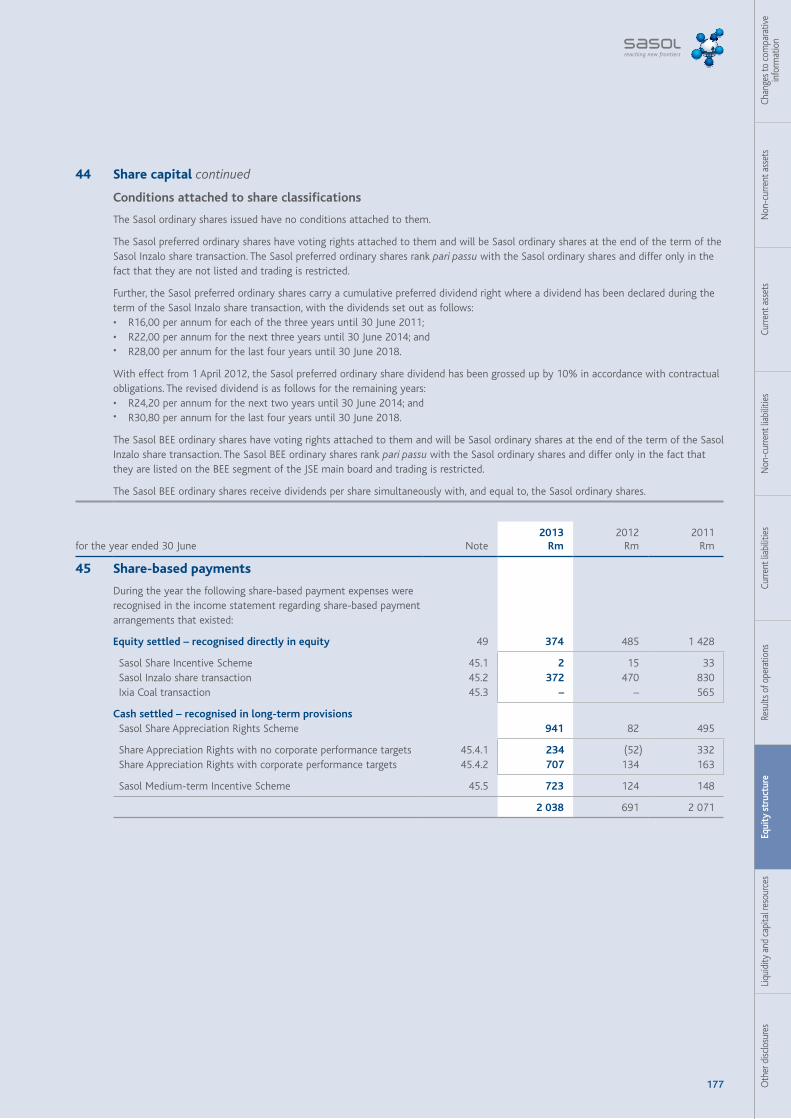
177 Oth
er d
isclo
sure
sLi
quid
ity a
nd c
apita
l res
ourc
esEq
uity
str
uctu
reRe
sults
of o
pera
tions
Curre
nt li
abili
ties
Non
-cur
rent
liab
ilitie
sCu
rrent
ass
ets
Non
-cur
rent
ass
ets
Chan
ges t
o co
mpa
rativ
e in
form
atio
n
44 Share capital continued
Conditions attached to share classifications
The Sasol ordinary shares issued have no conditions attached to them.
The Sasol preferred ordinary shares have voting rights attached to them and will be Sasol ordinary shares at the end of the term of the Sasol Inzalo share transaction. The Sasol preferred ordinary shares rank pari passu with the Sasol ordinary shares and differ only in the fact that they are not listed and trading is restricted.
Further, the Sasol preferred ordinary shares carry a cumulative preferred dividend right where a dividend has been declared during the term of the Sasol Inzalo share transaction, with the dividends set out as follows: • R16,00 per annum for each of the three years until 30 June 2011; • R22,00 per annum for the next three years until 30 June 2014; and • R28,00 per annum for the last four years until 30 June 2018.
With effect from 1 April 2012, the Sasol preferred ordinary share dividend has been grossed up by 10% in accordance with contractual obligations. The revised dividend is as follows for the remaining years: • R24,20 per annum for the next two years until 30 June 2014; and • R30,80 per annum for the last four years until 30 June 2018.
The Sasol BEE ordinary shares have voting rights attached to them and will be Sasol ordinary shares at the end of the term of the Sasol Inzalo share transaction. The Sasol BEE ordinary shares rank pari passu with the Sasol ordinary shares and differ only in the fact that they are listed on the BEE segment of the JSE main board and trading is restricted.
The Sasol BEE ordinary shares receive dividends per share simultaneously with, and equal to, the Sasol ordinary shares.
for the year ended 30 June Note 2013
Rm 2012
Rm 2011
Rm
45 Share-based payments
During the year the following share-based payment expenses were recognised in the income statement regarding share-based payment arrangements that existed:
Equity settled – recognised directly in equity 49 374 485 1 428
Sasol Share Incentive Scheme 45.1 2 15 33 Sasol Inzalo share transaction 45.2 372 470 830 Ixia Coal transaction 45.3 – – 565
Cash settled – recognised in long-term provisions Sasol Share Appreciation Rights Scheme 941 82 495
Share Appreciation Rights with no corporate performance targets 45.4.1 234 (52) 332 Share Appreciation Rights with corporate performance targets 45.4.2 707 134 163
Sasol Medium-term Incentive Scheme 45.5 723 124 148
2 038 691 2 071
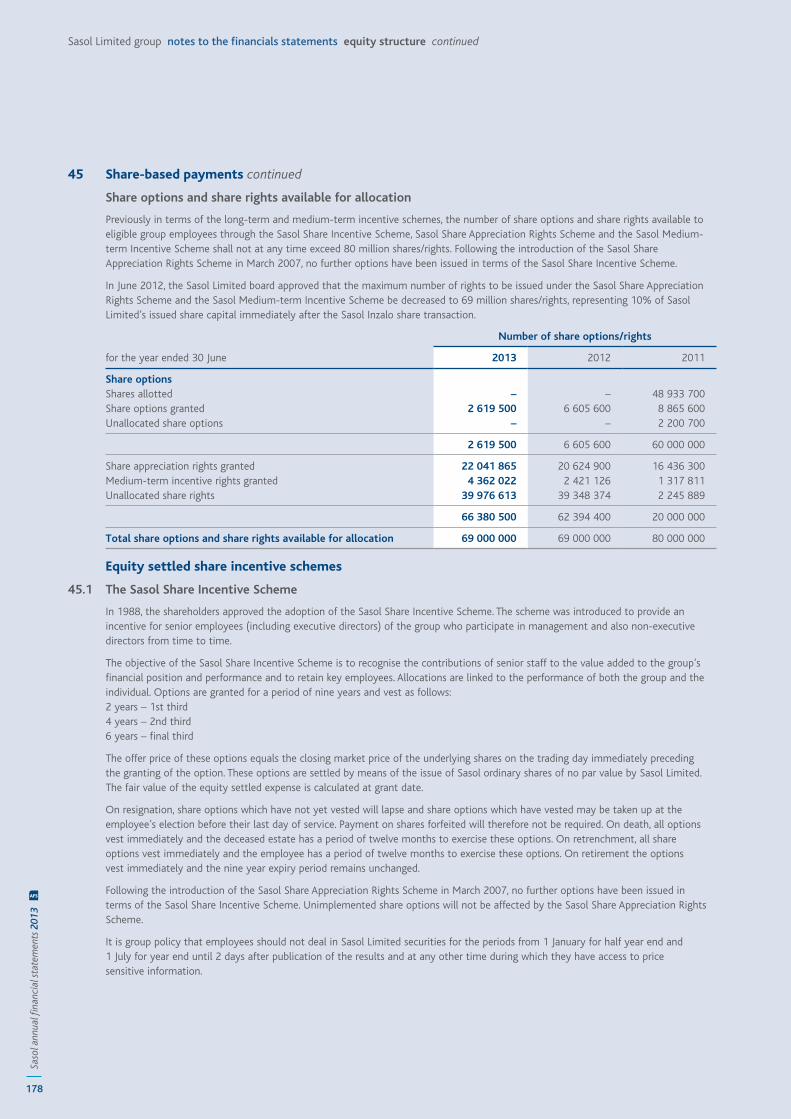
178
Saso
l ann
ual fi
nanc
ial s
tate
men
ts 2
013
AFS
Sasol Limited group notes to the financials statements equity structure continued
45 Share-based payments continued
Share options and share rights available for allocation
Previously in terms of the long-term and medium-term incentive schemes, the number of share options and share rights available to eligible group employees through the Sasol Share Incentive Scheme, Sasol Share Appreciation Rights Scheme and the Sasol Medium-term Incentive Scheme shall not at any time exceed 80 million shares/rights. Following the introduction of the Sasol Share Appreciation Rights Scheme in March 2007, no further options have been issued in terms of the Sasol Share Incentive Scheme.
In June 2012, the Sasol Limited board approved that the maximum number of rights to be issued under the Sasol Share Appreciation Rights Scheme and the Sasol Medium-term Incentive Scheme be decreased to 69 million shares/rights, representing 10% of Sasol Limited’s issued share capital immediately after the Sasol Inzalo share transaction.
for the year ended 30 June
Number of share options/rights
2013 2012 2011
Share optionsShares allotted – – 48 933 700 Share options granted 2 619 500 6 605 600 8 865 600 Unallocated share options – – 2 200 700
2 619 500 6 605 600 60 000 000
Share appreciation rights granted 22 041 865 20 624 900 16 436 300 Medium-term incentive rights granted 4 362 022 2 421 126 1 317 811 Unallocated share rights 39 976 613 39 348 374 2 245 889
66 380 500 62 394 400 20 000 000
Total share options and share rights available for allocation 69 000 000 69 000 000 80 000 000
Equity settled share incentive schemes
45.1 The Sasol Share Incentive Scheme
In 1988, the shareholders approved the adoption of the Sasol Share Incentive Scheme. The scheme was introduced to provide an incentive for senior employees (including executive directors) of the group who participate in management and also non-executive directors from time to time.
The objective of the Sasol Share Incentive Scheme is to recognise the contributions of senior staff to the value added to the group’s financial position and performance and to retain key employees. Allocations are linked to the performance of both the group and the individual. Options are granted for a period of nine years and vest as follows:2 years – 1st third4 years – 2nd third6 years – final third
The offer price of these options equals the closing market price of the underlying shares on the trading day immediately preceding the granting of the option. These options are settled by means of the issue of Sasol ordinary shares of no par value by Sasol Limited. The fair value of the equity settled expense is calculated at grant date.
On resignation, share options which have not yet vested will lapse and share options which have vested may be taken up at the employee’s election before their last day of service. Payment on shares forfeited will therefore not be required. On death, all options vest immediately and the deceased estate has a period of twelve months to exercise these options. On retrenchment, all share options vest immediately and the employee has a period of twelve months to exercise these options. On retirement the options vest immediately and the nine year expiry period remains unchanged.
Following the introduction of the Sasol Share Appreciation Rights Scheme in March 2007, no further options have been issued in terms of the Sasol Share Incentive Scheme. Unimplemented share options will not be affected by the Sasol Share Appreciation Rights Scheme.
It is group policy that employees should not deal in Sasol Limited securities for the periods from 1 January for half year end and 1 July for year end until 2 days after publication of the results and at any other time during which they have access to price sensitive information.
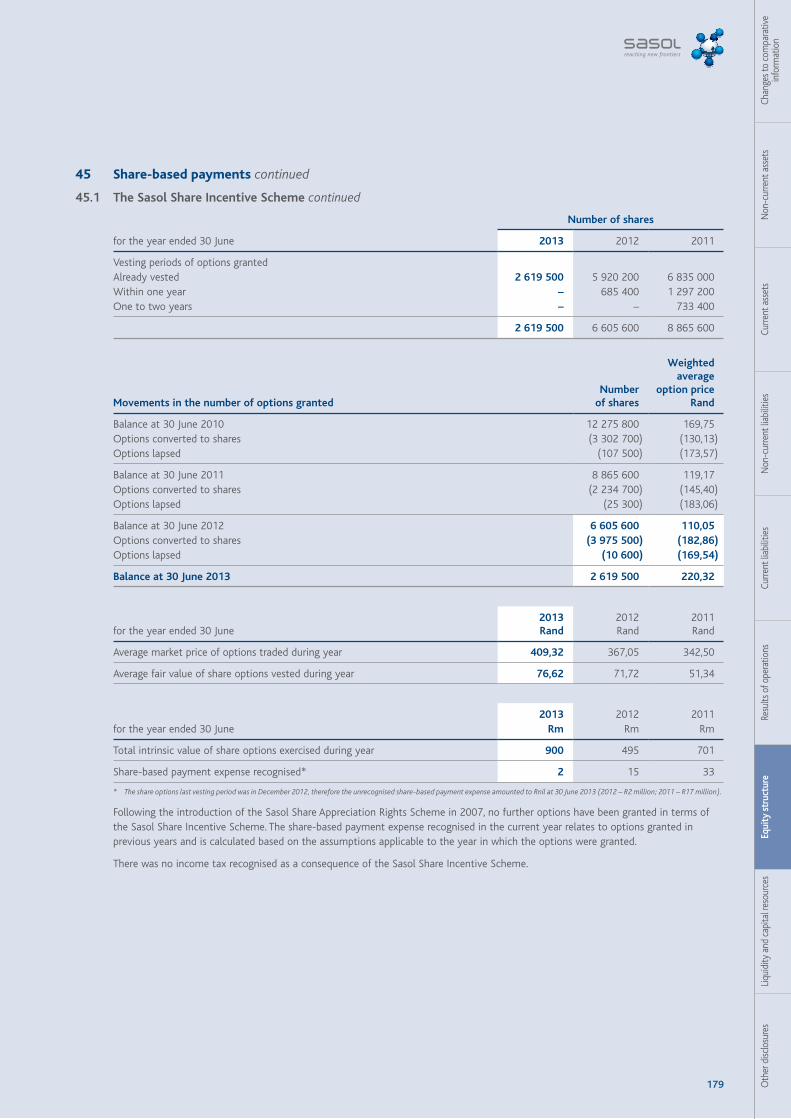
179 Oth
er d
isclo
sure
sLi
quid
ity a
nd c
apita
l res
ourc
esEq
uity
str
uctu
reRe
sults
of o
pera
tions
Curre
nt li
abili
ties
Non
-cur
rent
liab
ilitie
sCu
rrent
ass
ets
Non
-cur
rent
ass
ets
Chan
ges t
o co
mpa
rativ
e in
form
atio
n
45 Share-based payments continued
45.1 The Sasol Share Incentive Scheme continued
for the year ended 30 June
Number of shares
2013 2012 2011
Vesting periods of options grantedAlready vested 2 619 500 5 920 200 6 835 000 Within one year – 685 400 1 297 200 One to two years – – 733 400
2 619 500 6 605 600 8 865 600
Movements in the number of options grantedNumber
of shares
Weighted average
option price Rand
Balance at 30 June 2010 12 275 800 169,75 Options converted to shares (3 302 700) (130,13)Options lapsed (107 500) (173,57)
Balance at 30 June 2011 8 865 600 119,17 Options converted to shares (2 234 700) (145,40)Options lapsed (25 300) (183,06)
Balance at 30 June 2012 6 605 600 110,05Options converted to shares (3 975 500) (182,86)Options lapsed (10 600) (169,54)
Balance at 30 June 2013 2 619 500 220,32
for the year ended 30 June2013Rand
2012Rand
2011Rand
Average market price of options traded during year 409,32 367,05 342,50
Average fair value of share options vested during year 76,62 71,72 51,34
for the year ended 30 June2013
Rm 2012
Rm 2011
Rm
Total intrinsic value of share options exercised during year 900 495 701
Share-based payment expense recognised* 2 15 33
* The share options last vesting period was in December 2012, therefore the unrecognised share-based payment expense amounted to Rnil at 30 June 2013 (2012 – R2 million; 2011 – R17 million).
Following the introduction of the Sasol Share Appreciation Rights Scheme in 2007, no further options have been granted in terms of the Sasol Share Incentive Scheme. The share-based payment expense recognised in the current year relates to options granted in previous years and is calculated based on the assumptions applicable to the year in which the options were granted.
There was no income tax recognised as a consequence of the Sasol Share Incentive Scheme.
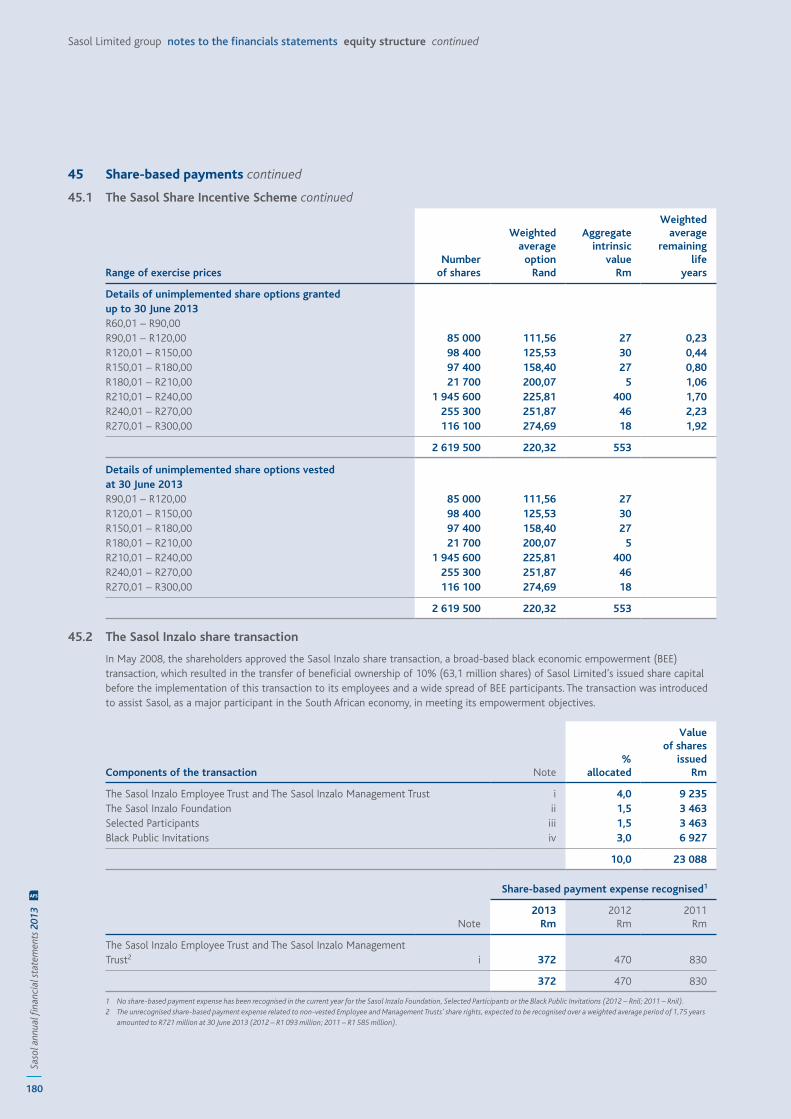
180
Saso
l ann
ual fi
nanc
ial s
tate
men
ts 2
013
AFS
Sasol Limited group notes to the financials statements equity structure continued
45 Share-based payments continued
45.1 The Sasol Share Incentive Scheme continued
Range of exercise prices Number of shares
Weightedaverage
option Rand
Aggregate intrinsic
value Rm
Weighted average
remaininglife
years
Details of unimplemented share options granted up to 30 June 2013R60,01 – R90,00R90,01 – R120,00 85 000 111,56 27 0,23 R120,01 – R150,00 98 400 125,53 30 0,44 R150,01 – R180,00 97 400 158,40 27 0,80 R180,01 – R210,00 21 700 200,07 5 1,06 R210,01 – R240,00 1 945 600 225,81 400 1,70 R240,01 – R270,00 255 300 251,87 46 2,23 R270,01 – R300,00 116 100 274,69 18 1,92
2 619 500 220,32 553
Details of unimplemented share options vested at 30 June 2013R90,01 – R120,00 85 000 111,56 27 R120,01 – R150,00 98 400 125,53 30 R150,01 – R180,00 97 400 158,40 27 R180,01 – R210,00 21 700 200,07 5 R210,01 – R240,00 1 945 600 225,81 400 R240,01 – R270,00 255 300 251,87 46 R270,01 – R300,00 116 100 274,69 18
2 619 500 220,32 553
45.2 The Sasol Inzalo share transaction
In May 2008, the shareholders approved the Sasol Inzalo share transaction, a broad-based black economic empowerment (BEE) transaction, which resulted in the transfer of beneficial ownership of 10% (63,1 million shares) of Sasol Limited’s issued share capital before the implementation of this transaction to its employees and a wide spread of BEE participants. The transaction was introduced to assist Sasol, as a major participant in the South African economy, in meeting its empowerment objectives.
Components of the transaction Note%
allocated
Valueof shares
issuedRm
The Sasol Inzalo Employee Trust and The Sasol Inzalo Management Trust i 4,0 9 235 The Sasol Inzalo Foundation ii 1,5 3 463 Selected Participants iii 1,5 3 463 Black Public Invitations iv 3,0 6 927
10,0 23 088
Note
Share-based payment expense recognised1
2013 Rm
2012 Rm
2011 Rm
The Sasol Inzalo Employee Trust and The Sasol Inzalo Management Trust2 i 372 470 830
372 470 830
1 No share-based payment expense has been recognised in the current year for the Sasol Inzalo Foundation, Selected Participants or the Black Public Invitations (2012 – Rnil; 2011 – Rnil).2 The unrecognised share-based payment expense related to non-vested Employee and Management Trusts’ share rights, expected to be recognised over a weighted average period of 1,75 years
amounted to R721 million at 30 June 2013 (2012 – R1 093 million; 2011 – R1 585 million).
181 Oth
er d
isclo
sure
sLi
quid
ity a
nd c
apita
l res
ourc
esEq
uity
str
uctu
reRe
sults
of o
pera
tions
Curre
nt li
abili
ties
Non
-cur
rent
liab
ilitie
sCu
rrent
ass
ets
Non
-cur
rent
ass
ets
Chan
ges t
o co
mpa
rativ
e in
form
atio
n
45 Share-based payments continued
45.2 The Sasol Inzalo share transaction continued
i The Sasol Inzalo Employee Trust and The Sasol Inzalo Management Trust (the Trusts)On 3 June 2008, staff members that were South African residents or who were migrant workers that did not participate in the Sasol Share Incentive Scheme and the Sasol Share Appreciation Rights Scheme participated in The Sasol Inzalo Employee Trust (Employee Scheme), while all senior black staff that are South African residents participated in The Sasol Inzalo Management Trust (Management Scheme).
The share rights, which entitled the employees from the inception of the scheme to receive Sasol ordinary shares at the end of ten years, vest according to unconditional entitlement as follows: • after three years: 30% • thereafter: 10% per year until maturity
Participants in the Employee Scheme were granted share rights to 850 Sasol ordinary shares. The allocation of the shares in the Management Scheme was based on seniority and range from 5 000 to 25 000. 12% of the allocated shares has been set aside for new employees appointed during the first five years of the transaction. On resignation, within the first three years from the inception of the transaction, share rights granted will be forfeited. For each year thereafter, 10% of such share rights will be forfeited for each year or part thereof remaining until the end of the transaction period. On retirement, death or retrenchment, the rights will remain with the participant.
The fair value of the equity settled share-based payment expense is calculated at grant date and expensed over the vesting period of the share rights.
The Sasol ordinary shares were issued to the Trusts, funded by contributions from Sasol, which collectively subscribed for 25,2 million Sasol ordinary shares at an issue price of R366,00 per share, with a nominal value of R0,01 per share, subject to pre-conditions regarding the right to receive only 50% of ordinary dividends paid on ordinary shares and Sasol’s right to repurchase a number of shares at a nominal value of R0,01 per share at the end of year ten in accordance with a pre-determined formula. The participant has the right to all ordinary dividends received by the Trusts for the duration of the transaction.
After Sasol has exercised its repurchase right and subject to any forfeiture of share rights, each participant will receive a number of Sasol ordinary shares in relation to their respective share rights.
Any shares remaining in the Trusts after the distribution to participants may be distributed to The Sasol Inzalo Foundation.
ii The Sasol Inzalo FoundationOn 3 June 2008, The Sasol Inzalo Foundation, which was incorporated as a trust and in the process of being registered as a public benefit organisation, subscribed for 9,5 million Sasol ordinary shares at an issue price of R366,00 per share, with a nominal value of R0,01 per share.
The primary focus of The Sasol Inzalo Foundation is skills development and capacity building of black South Africans, predominantly in the fields of mathematics, science and technology.
The conditions of subscription for Sasol ordinary shares by The Sasol Inzalo Foundation includes the right to receive dividends equal to 5% of the ordinary dividends declared in respect of Sasol ordinary shares held by the Foundation. During October 2012, the group executive committee approved the increase in the dividend to 50% for the 2013 financial year end. Sasol is entitled to repurchase a number of Sasol ordinary shares from the Foundation at a nominal value of R0,01 per share at the end of ten years in accordance with a pre-determined formula.
After Sasol has exercised its repurchase right, the Foundation will receive 100% of dividends declared on the Sasol ordinary shares owned by the Foundation.
182
Saso
l ann
ual fi
nanc
ial s
tate
men
ts 2
013
AFS
Sasol Limited group notes to the financials statements equity structure continued
45 Share-based payments continued
45.2 The Sasol Inzalo share transaction continued
iii Selected ParticipantsIn 2008, selected BEE groups (Selected Participants) which included Sasol customers, Sasol suppliers, Sasol franchisees, women’s groups, trade unions and other professional associations, through a funding company, which is consolidated as part of the Sasol group, subscribed in total for 9,5 million Sasol preferred ordinary shares at an issue price of R366,00 per share, with a nominal value of R0,01 per share. A portion of these shares have not yet been allocated to Selected Participants and have been subscribed for by a facilitation trust, which is funded by Sasol. As at 30 June 2013, 1,1 million (2012 – 1,1 million; 2011 – 1,1 million) Sasol preferred ordinary shares were issued to the facilitation trust.
The Selected Participants contributed equity between 5% to 10% of the value of their underlying Sasol preferred ordinary shares allocation, with the balance of the contribution funded through preference share debt (refer note 17), including preference shares subscribed for by Sasol.
The fair value of the equity settled share-based payment expense relating to the share rights issued to the Selected Participants was calculated at grant date and was expensed immediately as all vesting conditions had been met at that date.
The Selected Participants are entitled to receive a dividend of up to 5% of the dividend declared on the Sasol preferred ordinary shares in proportion to their effective interest in Sasol’s issued share capital, from the commencement of the fourth year of the transaction term of ten years, subject to the financing requirements of the preference share debt.
At the end of the transaction term, the Sasol preferred ordinary shares will automatically be Sasol ordinary shares and will then be listed on the JSE. The Sasol ordinary shares remaining in the funding company after redeeming the preference share debt and paying costs may then be distributed to the Selected Participants in proportion to their shareholding.
The funding company, from inception, has full voting and economic rights with regard to its shareholding of Sasol’s total issued share capital.
iv Black Public InvitationsThe Sasol Inzalo Black Public Invitations aimed to provide as many black people (Black Public) as possible with an opportunity to acquire shares in Sasol. The Black Public owns 3% of Sasol’s issued share capital, through their participation in the Funded and Cash Invitations described below.
On 8 September 2008, the Black Public indirectly subscribed for 16 085 199 Sasol preferred ordinary shares and directly for 2 838 565 Sasol BEE ordinary shares.
The fair value of the equity settled share-based payment expense relating to the share rights issued to the Black Public calculated at grant date was expensed immediately as all vesting conditions would have been met at that date. At 30 June 2013, 56 090 (2012 – 56 250; 2011 – 56 447) Sasol preferred ordinary shares and 17 475 (2012 – 17 440; 2011 – 17 395) Sasol BEE ordinary shares were issued to a facilitation trust funded by Sasol.
Funded InvitationThe members of the Black Public participating in the Funded Invitation through a funding company, which is consolidated as part of the Sasol group, subscribed for 16,1 million Sasol preferred ordinary shares. The Black Public contributed equity between 5% to 10% of their underlying Sasol preferred ordinary shares allocation, with the balance of the contribution being funded through preference share debt (refer note 17) including preference shares subscribed for by Sasol.
Participants in the Funded Invitation could not dispose of their shares for the first three years after inception. Thereafter, for the remainder of the transaction term, trading in the shares commenced with other Black People or Black Groups through an over-the-counter trading mechanism. Participants in the Funded Invitation may not encumber the shares held by them before the end of the transaction term.
The Black Public are entitled to receive a dividend of up to 5% of the dividend on the Sasol preferred ordinary shares in proportion to their effective interest in Sasol’s issued share capital, from the commencement of the fourth year of the transaction term of ten years, subject to the financing requirements of the preference share debt.
At the end of the transaction term, the Sasol preferred ordinary shares will automatically be Sasol ordinary shares and will then be listed on the JSE. The Sasol ordinary shares remaining in the funding company after redeeming the preference share debt and paying costs may then be distributed to the Black Public in proportion to their shareholding.
The funding company has, from inception, full voting and economic rights with regard to its interest in Sasol’s issued share capital.
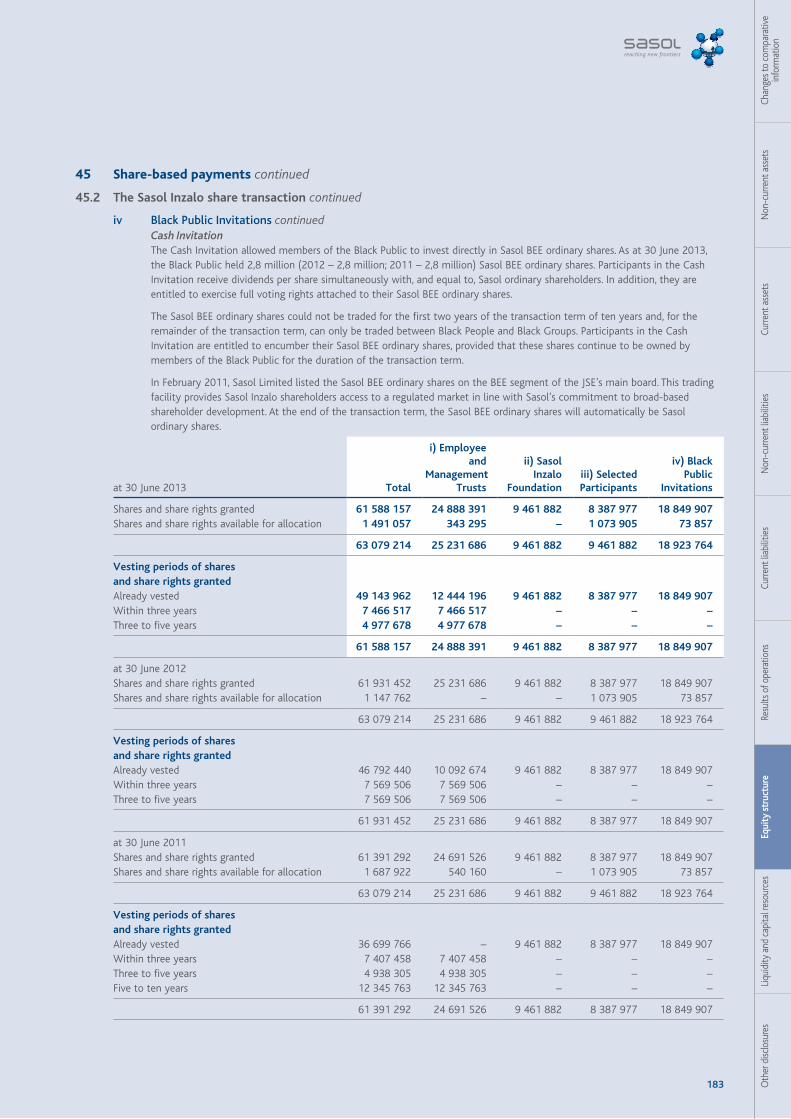
183 Oth
er d
isclo
sure
sLi
quid
ity a
nd c
apita
l res
ourc
esEq
uity
str
uctu
reRe
sults
of o
pera
tions
Curre
nt li
abili
ties
Non
-cur
rent
liab
ilitie
sCu
rrent
ass
ets
Non
-cur
rent
ass
ets
Chan
ges t
o co
mpa
rativ
e in
form
atio
n
45 Share-based payments continued
45.2 The Sasol Inzalo share transaction continued
iv Black Public Invitations continuedCash InvitationThe Cash Invitation allowed members of the Black Public to invest directly in Sasol BEE ordinary shares. As at 30 June 2013, the Black Public held 2,8 million (2012 – 2,8 million; 2011 – 2,8 million) Sasol BEE ordinary shares. Participants in the Cash Invitation receive dividends per share simultaneously with, and equal to, Sasol ordinary shareholders. In addition, they are entitled to exercise full voting rights attached to their Sasol BEE ordinary shares.
The Sasol BEE ordinary shares could not be traded for the first two years of the transaction term of ten years and, for the remainder of the transaction term, can only be traded between Black People and Black Groups. Participants in the Cash Invitation are entitled to encumber their Sasol BEE ordinary shares, provided that these shares continue to be owned by members of the Black Public for the duration of the transaction term.
In February 2011, Sasol Limited listed the Sasol BEE ordinary shares on the BEE segment of the JSE’s main board. This trading facility provides Sasol Inzalo shareholders access to a regulated market in line with Sasol’s commitment to broad-based shareholder development. At the end of the transaction term, the Sasol BEE ordinary shares will automatically be Sasol ordinary shares.
at 30 June 2013 Total
i) Employeeand
Management Trusts
ii) SasolInzalo
Foundation iii) Selected
Participants
iv) Black Public
Invitations
Shares and share rights granted 61 588 157 24 888 391 9 461 882 8 387 977 18 849 907 Shares and share rights available for allocation 1 491 057 343 295 – 1 073 905 73 857
63 079 214 25 231 686 9 461 882 9 461 882 18 923 764
Vesting periods of shares and share rights grantedAlready vested 49 143 962 12 444 196 9 461 882 8 387 977 18 849 907 Within three years 7 466 517 7 466 517 – – –Three to five years 4 977 678 4 977 678 – – –
61 588 157 24 888 391 9 461 882 8 387 977 18 849 907
at 30 June 2012Shares and share rights granted 61 931 452 25 231 686 9 461 882 8 387 977 18 849 907 Shares and share rights available for allocation 1 147 762 – – 1 073 905 73 857
63 079 214 25 231 686 9 461 882 9 461 882 18 923 764
Vesting periods of shares and share rights grantedAlready vested 46 792 440 10 092 674 9 461 882 8 387 977 18 849 907 Within three years 7 569 506 7 569 506 – – –Three to five years 7 569 506 7 569 506 – – –
61 931 452 25 231 686 9 461 882 8 387 977 18 849 907
at 30 June 2011Shares and share rights granted 61 391 292 24 691 526 9 461 882 8 387 977 18 849 907 Shares and share rights available for allocation 1 687 922 540 160 – 1 073 905 73 857
63 079 214 25 231 686 9 461 882 9 461 882 18 923 764
Vesting periods of shares and share rights grantedAlready vested 36 699 766 – 9 461 882 8 387 977 18 849 907 Within three years 7 407 458 7 407 458 – – –Three to five years 4 938 305 4 938 305 – – –Five to ten years 12 345 763 12 345 763 – – –
61 391 292 24 691 526 9 461 882 8 387 977 18 849 907
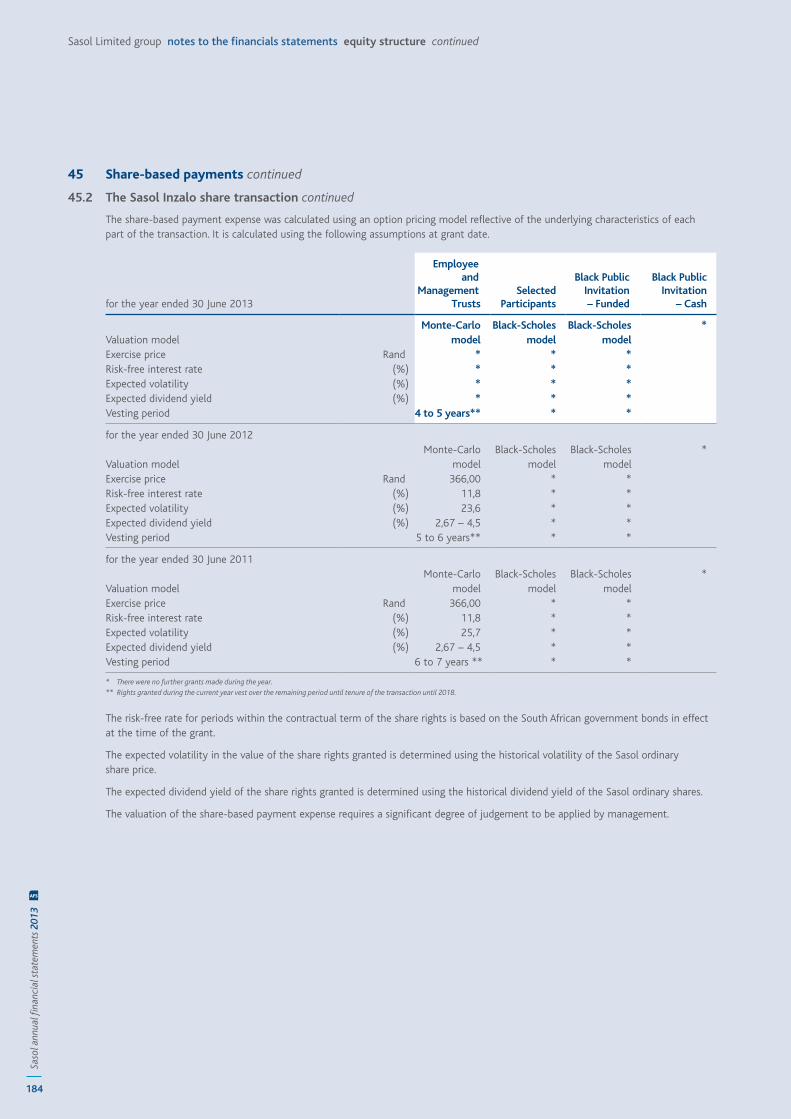
184
Saso
l ann
ual fi
nanc
ial s
tate
men
ts 2
013
AFS
Sasol Limited group notes to the financials statements equity structure continued
45 Share-based payments continued
45.2 The Sasol Inzalo share transaction continued
The share-based payment expense was calculated using an option pricing model reflective of the underlying characteristics of each part of the transaction. It is calculated using the following assumptions at grant date.
for the year ended 30 June 2013
Employeeand
Management Trusts
Selected Participants
Black PublicInvitation – Funded
Black PublicInvitation
– Cash
Valuation modelMonte-Carlo
model Black-Scholes
model Black-Scholes
model *
Exercise price Rand * * * Risk-free interest rate (%) * * * Expected volatility (%) * * * Expected dividend yield (%) * * * Vesting period 4 to 5 years** * *
for the year ended 30 June 2012
Valuation modelMonte-Carlo
model Black-Scholes
model Black-Scholes
model *
Exercise price Rand 366,00 * * Risk-free interest rate (%) 11,8 * * Expected volatility (%) 23,6 * * Expected dividend yield (%) 2,67 – 4,5 * * Vesting period 5 to 6 years** * *
for the year ended 30 June 2011
Valuation modelMonte-Carlo
model Black-Scholes
model Black-Scholes
model *
Exercise price Rand 366,00 * * Risk-free interest rate (%) 11,8 * * Expected volatility (%) 25,7 * * Expected dividend yield (%) 2,67 – 4,5 * * Vesting period 6 to 7 years ** * *
* There were no further grants made during the year.** Rights granted during the current year vest over the remaining period until tenure of the transaction until 2018.
The risk-free rate for periods within the contractual term of the share rights is based on the South African government bonds in effect at the time of the grant.
The expected volatility in the value of the share rights granted is determined using the historical volatility of the Sasol ordinary share price.
The expected dividend yield of the share rights granted is determined using the historical dividend yield of the Sasol ordinary shares.
The valuation of the share-based payment expense requires a significant degree of judgement to be applied by management.
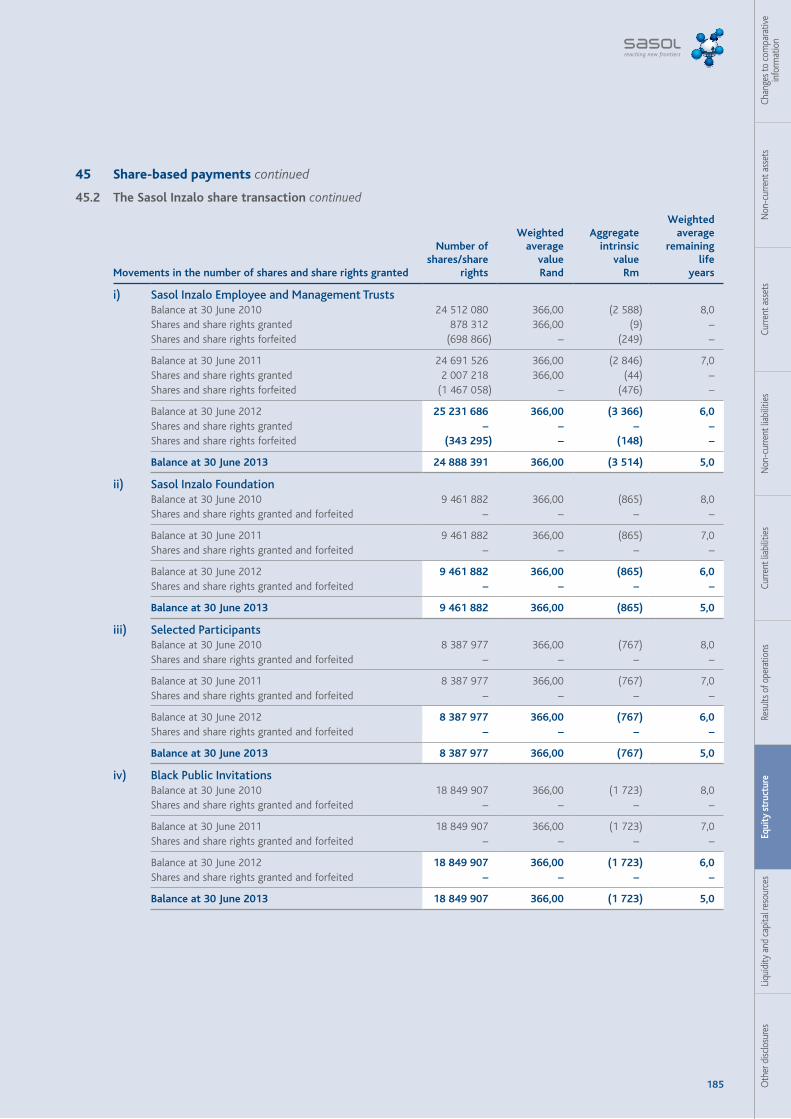
185 Oth
er d
isclo
sure
sLi
quid
ity a
nd c
apita
l res
ourc
esEq
uity
str
uctu
reRe
sults
of o
pera
tions
Curre
nt li
abili
ties
Non
-cur
rent
liab
ilitie
sCu
rrent
ass
ets
Non
-cur
rent
ass
ets
Chan
ges t
o co
mpa
rativ
e in
form
atio
n
45 Share-based payments continued
45.2 The Sasol Inzalo share transaction continued
Movements in the number of shares and share rights granted
Number of shares/share
rights
Weighted average
value Rand
Aggregate intrinsic
valueRm
Weighted average
remaining life
years
i) Sasol Inzalo Employee and Management Trusts Balance at 30 June 2010 24 512 080 366,00 (2 588) 8,0 Shares and share rights granted 878 312 366,00 (9) –Shares and share rights forfeited (698 866) – (249) –
Balance at 30 June 2011 24 691 526 366,00 (2 846) 7,0 Shares and share rights granted 2 007 218 366,00 (44) –Shares and share rights forfeited (1 467 058) – (476) –
Balance at 30 June 2012 25 231 686 366,00 (3 366) 6,0 Shares and share rights granted – – – –Shares and share rights forfeited (343 295) – (148) –
Balance at 30 June 2013 24 888 391 366,00 (3 514) 5,0
ii) Sasol Inzalo Foundation Balance at 30 June 2010 9 461 882 366,00 (865) 8,0 Shares and share rights granted and forfeited – – – –
Balance at 30 June 2011 9 461 882 366,00 (865) 7,0 Shares and share rights granted and forfeited – – – –
Balance at 30 June 2012 9 461 882 366,00 (865) 6,0 Shares and share rights granted and forfeited – – – –
Balance at 30 June 2013 9 461 882 366,00 (865) 5,0
iii) Selected Participants Balance at 30 June 2010 8 387 977 366,00 (767) 8,0 Shares and share rights granted and forfeited – – – –
Balance at 30 June 2011 8 387 977 366,00 (767) 7,0 Shares and share rights granted and forfeited – – – –
Balance at 30 June 2012 8 387 977 366,00 (767) 6,0 Shares and share rights granted and forfeited – – – –
Balance at 30 June 2013 8 387 977 366,00 (767) 5,0
iv) Black Public Invitations Balance at 30 June 2010 18 849 907 366,00 (1 723) 8,0 Shares and share rights granted and forfeited – – – –
Balance at 30 June 2011 18 849 907 366,00 (1 723) 7,0 Shares and share rights granted and forfeited – – – –
Balance at 30 June 2012 18 849 907 366,00 (1 723) 6,0 Shares and share rights granted and forfeited – – – –
Balance at 30 June 2013 18 849 907 366,00 (1 723) 5,0
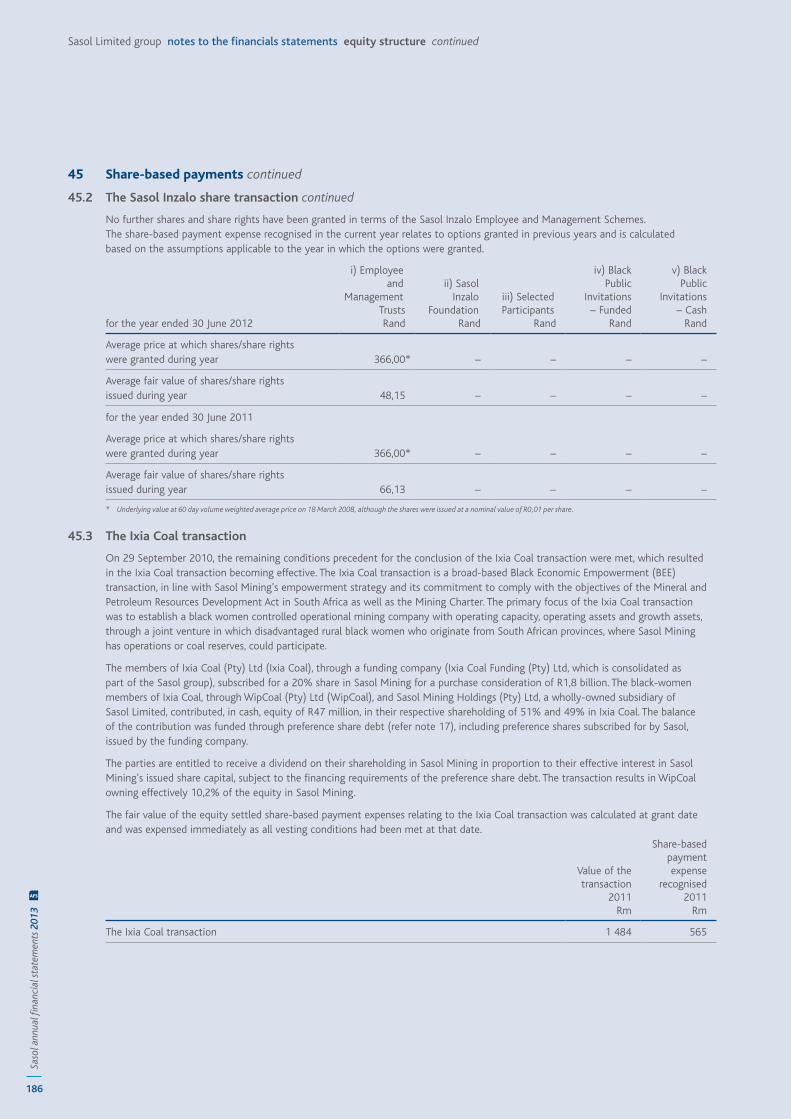
186
Saso
l ann
ual fi
nanc
ial s
tate
men
ts 2
013
AFS
Sasol Limited group notes to the financials statements equity structure continued
45 Share-based payments continued
45.2 The Sasol Inzalo share transaction continued
No further shares and share rights have been granted in terms of the Sasol Inzalo Employee and Management Schemes. The share-based payment expense recognised in the current year relates to options granted in previous years and is calculated based on the assumptions applicable to the year in which the options were granted.
for the year ended 30 June 2012
i) Employeeand
Management Trusts
Rand
ii) SasolInzalo
Foundation Rand
iii) Selected Participants
Rand
iv) Black Public
Invitations– Funded
Rand
v) Black Public
Invitations– Cash
Rand
Average price at which shares/share rights were granted during year 366,00* – – – –
Average fair value of shares/share rights issued during year 48,15 – – – –
for the year ended 30 June 2011
Average price at which shares/share rights were granted during year 366,00* – – – –
Average fair value of shares/share rights issued during year 66,13 – – – –
* Underlying value at 60 day volume weighted average price on 18 March 2008, although the shares were issued at a nominal value of R0,01 per share.
45.3 The Ixia Coal transaction
On 29 September 2010, the remaining conditions precedent for the conclusion of the Ixia Coal transaction were met, which resulted in the Ixia Coal transaction becoming effective. The Ixia Coal transaction is a broad-based Black Economic Empowerment (BEE) transaction, in line with Sasol Mining’s empowerment strategy and its commitment to comply with the objectives of the Mineral and Petroleum Resources Development Act in South Africa as well as the Mining Charter. The primary focus of the Ixia Coal transaction was to establish a black women controlled operational mining company with operating capacity, operating assets and growth assets, through a joint venture in which disadvantaged rural black women who originate from South African provinces, where Sasol Mining has operations or coal reserves, could participate.
The members of Ixia Coal (Pty) Ltd (Ixia Coal), through a funding company (Ixia Coal Funding (Pty) Ltd, which is consolidated as part of the Sasol group), subscribed for a 20% share in Sasol Mining for a purchase consideration of R1,8 billion. The black-women members of Ixia Coal, through WipCoal (Pty) Ltd (WipCoal), and Sasol Mining Holdings (Pty) Ltd, a wholly-owned subsidiary of Sasol Limited, contributed, in cash, equity of R47 million, in their respective shareholding of 51% and 49% in Ixia Coal. The balance of the contribution was funded through preference share debt (refer note 17), including preference shares subscribed for by Sasol, issued by the funding company.
The parties are entitled to receive a dividend on their shareholding in Sasol Mining in proportion to their effective interest in Sasol Mining’s issued share capital, subject to the financing requirements of the preference share debt. The transaction results in WipCoal owning effectively 10,2% of the equity in Sasol Mining.
The fair value of the equity settled share-based payment expenses relating to the Ixia Coal transaction was calculated at grant date and was expensed immediately as all vesting conditions had been met at that date.
Value of the transaction
2011Rm
Share-basedpayment expense
recognised2011
Rm
The Ixia Coal transaction 1 484 565
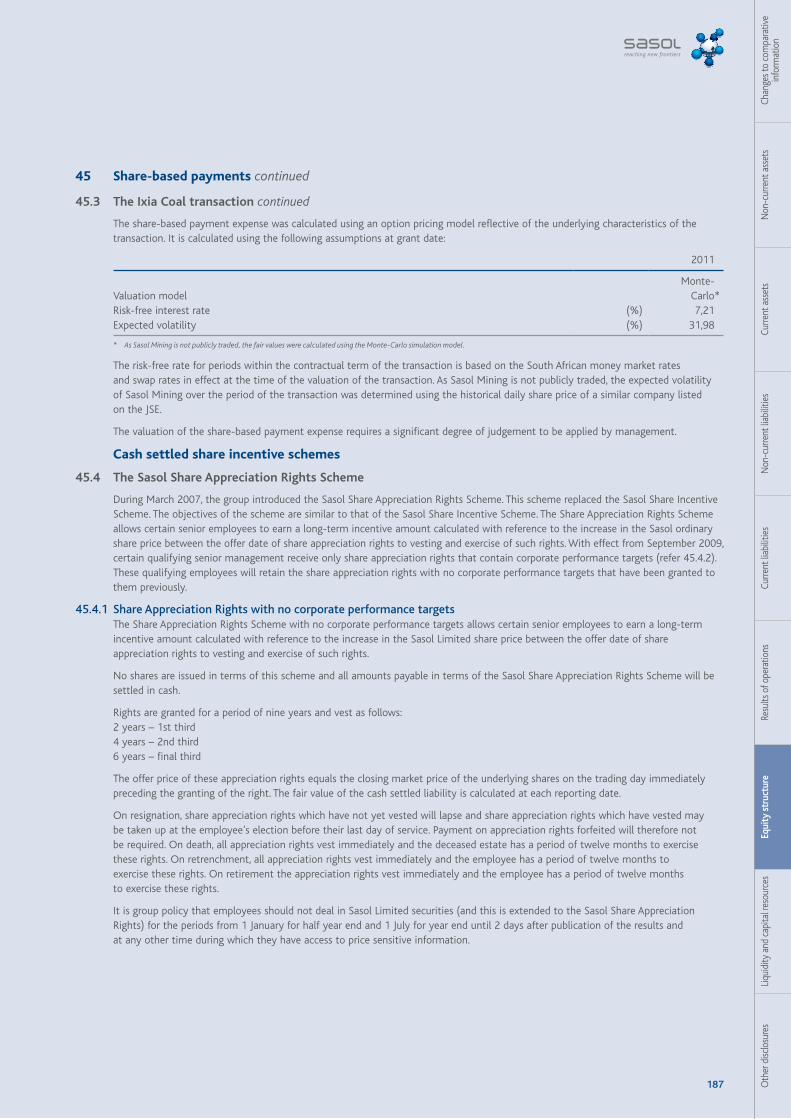
187 Oth
er d
isclo
sure
sLi
quid
ity a
nd c
apita
l res
ourc
esEq
uity
str
uctu
reRe
sults
of o
pera
tions
Curre
nt li
abili
ties
Non
-cur
rent
liab
ilitie
sCu
rrent
ass
ets
Non
-cur
rent
ass
ets
Chan
ges t
o co
mpa
rativ
e in
form
atio
n
45 Share-based payments continued
45.3 The Ixia Coal transaction continued
The share-based payment expense was calculated using an option pricing model reflective of the underlying characteristics of the transaction. It is calculated using the following assumptions at grant date:
2011
Valuation modelMonte-
Carlo*Risk-free interest rate (%) 7,21 Expected volatility (%) 31,98
* As Sasol Mining is not publicly traded, the fair values were calculated using the Monte-Carlo simulation model.
The risk-free rate for periods within the contractual term of the transaction is based on the South African money market rates and swap rates in effect at the time of the valuation of the transaction. As Sasol Mining is not publicly traded, the expected volatility of Sasol Mining over the period of the transaction was determined using the historical daily share price of a similar company listed on the JSE.
The valuation of the share-based payment expense requires a significant degree of judgement to be applied by management.
Cash settled share incentive schemes
45.4 The Sasol Share Appreciation Rights Scheme
During March 2007, the group introduced the Sasol Share Appreciation Rights Scheme. This scheme replaced the Sasol Share Incentive Scheme. The objectives of the scheme are similar to that of the Sasol Share Incentive Scheme. The Share Appreciation Rights Scheme allows certain senior employees to earn a long-term incentive amount calculated with reference to the increase in the Sasol ordinary share price between the offer date of share appreciation rights to vesting and exercise of such rights. With effect from September 2009, certain qualifying senior management receive only share appreciation rights that contain corporate performance targets (refer 45.4.2). These qualifying employees will retain the share appreciation rights with no corporate performance targets that have been granted to them previously.
45.4.1 Share Appreciation Rights with no corporate performance targetsThe Share Appreciation Rights Scheme with no corporate performance targets allows certain senior employees to earn a long-term incentive amount calculated with reference to the increase in the Sasol Limited share price between the offer date of share appreciation rights to vesting and exercise of such rights.
No shares are issued in terms of this scheme and all amounts payable in terms of the Sasol Share Appreciation Rights Scheme will be settled in cash.
Rights are granted for a period of nine years and vest as follows:2 years – 1st third4 years – 2nd third6 years – final third
The offer price of these appreciation rights equals the closing market price of the underlying shares on the trading day immediately preceding the granting of the right. The fair value of the cash settled liability is calculated at each reporting date.
On resignation, share appreciation rights which have not yet vested will lapse and share appreciation rights which have vested may be taken up at the employee’s election before their last day of service. Payment on appreciation rights forfeited will therefore not be required. On death, all appreciation rights vest immediately and the deceased estate has a period of twelve months to exercise these rights. On retrenchment, all appreciation rights vest immediately and the employee has a period of twelve months to exercise these rights. On retirement the appreciation rights vest immediately and the employee has a period of twelve months to exercise these rights.
It is group policy that employees should not deal in Sasol Limited securities (and this is extended to the Sasol Share Appreciation Rights) for the periods from 1 January for half year end and 1 July for year end until 2 days after publication of the results and at any other time during which they have access to price sensitive information.
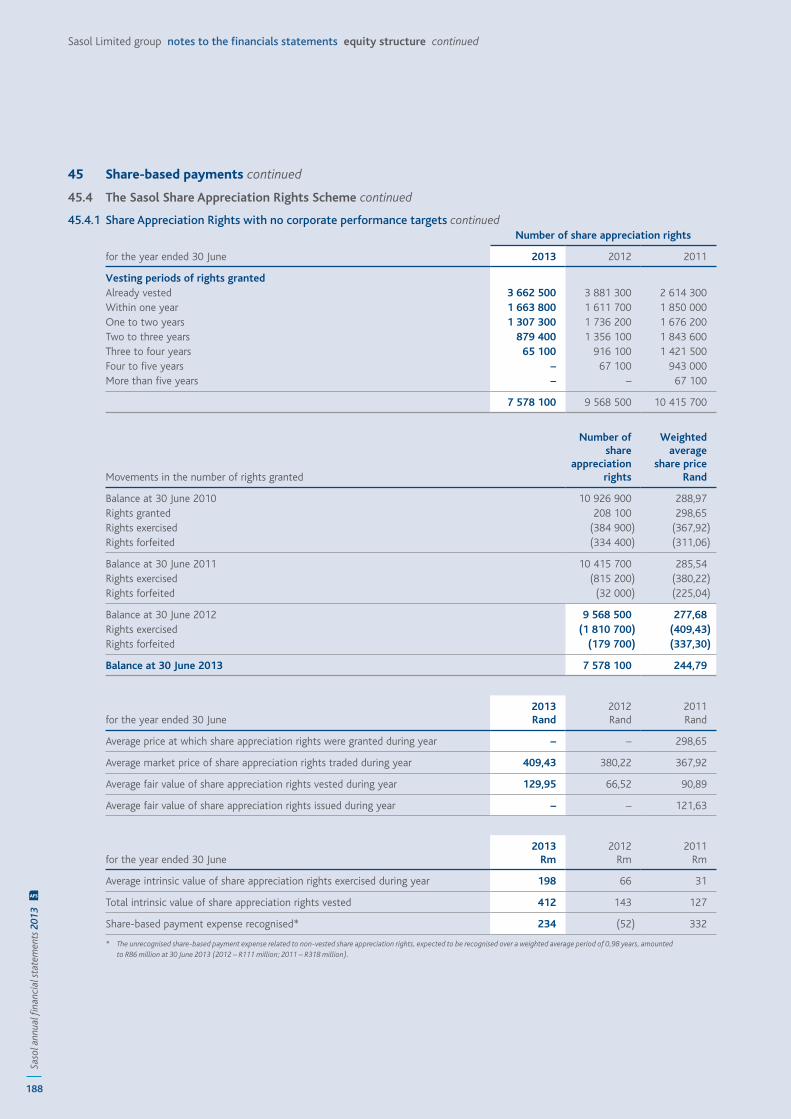
188
Saso
l ann
ual fi
nanc
ial s
tate
men
ts 2
013
AFS
Sasol Limited group notes to the financials statements equity structure continued
45 Share-based payments continued
45.4 The Sasol Share Appreciation Rights Scheme continued
45.4.1 Share Appreciation Rights with no corporate performance targets continued
for the year ended 30 June
Number of share appreciation rights
2013 2012 2011
Vesting periods of rights grantedAlready vested 3 662 500 3 881 300 2 614 300 Within one year 1 663 800 1 611 700 1 850 000 One to two years 1 307 300 1 736 200 1 676 200 Two to three years 879 400 1 356 100 1 843 600 Three to four years 65 100 916 100 1 421 500 Four to five years – 67 100 943 000 More than five years – – 67 100
7 578 100 9 568 500 10 415 700
Movements in the number of rights granted
Number of share
appreciation rights
Weighted average
share priceRand
Balance at 30 June 2010 10 926 900 288,97 Rights granted 208 100 298,65 Rights exercised (384 900) (367,92)Rights forfeited (334 400) (311,06)
Balance at 30 June 2011 10 415 700 285,54 Rights exercised (815 200) (380,22)Rights forfeited (32 000) (225,04)
Balance at 30 June 2012 9 568 500 277,68 Rights exercised (1 810 700) (409,43)Rights forfeited (179 700) (337,30)
Balance at 30 June 2013 7 578 100 244,79
for the year ended 30 June2013Rand
2012Rand
2011Rand
Average price at which share appreciation rights were granted during year – – 298,65
Average market price of share appreciation rights traded during year 409,43 380,22 367,92
Average fair value of share appreciation rights vested during year 129,95 66,52 90,89
Average fair value of share appreciation rights issued during year – – 121,63
for the year ended 30 June2013
Rm 2012
Rm 2011
Rm
Average intrinsic value of share appreciation rights exercised during year 198 66 31
Total intrinsic value of share appreciation rights vested 412 143 127
Share-based payment expense recognised* 234 (52) 332
* The unrecognised share-based payment expense related to non-vested share appreciation rights, expected to be recognised over a weighted average period of 0,98 years, amounted to R86 million at 30 June 2013 (2012 – R111 million; 2011 – R318 million).
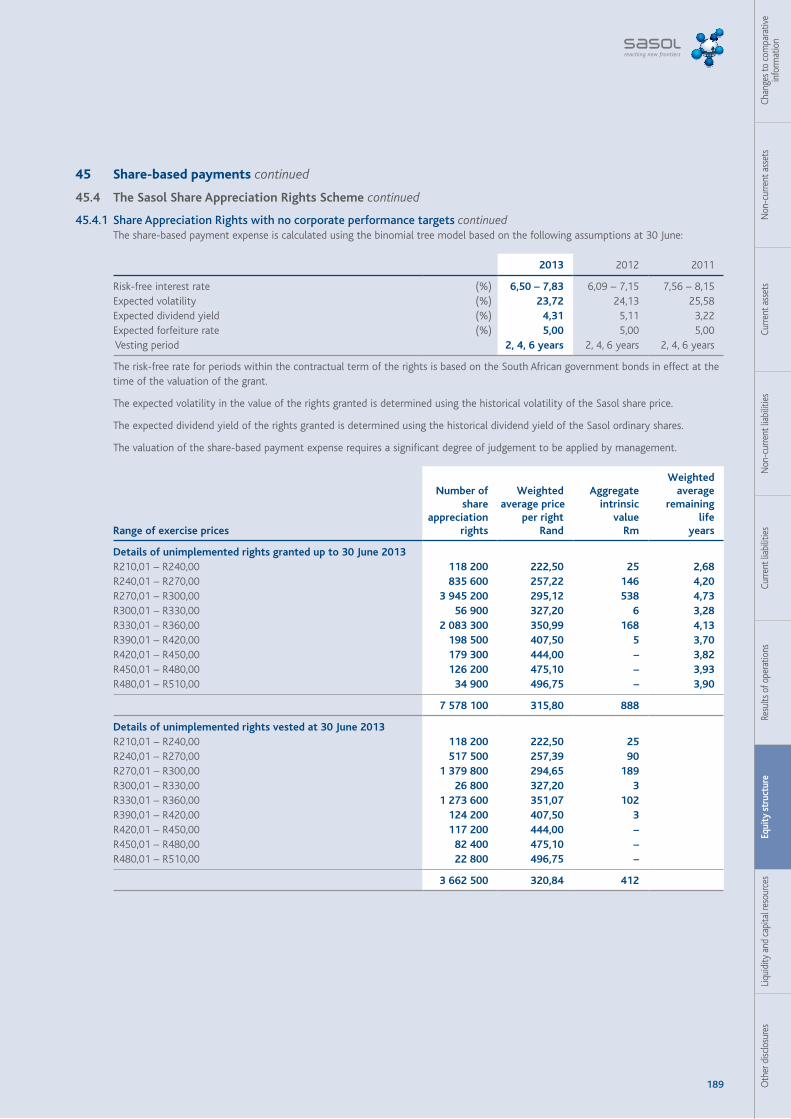
189 Oth
er d
isclo
sure
sLi
quid
ity a
nd c
apita
l res
ourc
esEq
uity
str
uctu
reRe
sults
of o
pera
tions
Curre
nt li
abili
ties
Non
-cur
rent
liab
ilitie
sCu
rrent
ass
ets
Non
-cur
rent
ass
ets
Chan
ges t
o co
mpa
rativ
e in
form
atio
n
45 Share-based payments continued
45.4 The Sasol Share Appreciation Rights Scheme continued
45.4.1 Share Appreciation Rights with no corporate performance targets continuedThe share-based payment expense is calculated using the binomial tree model based on the following assumptions at 30 June:
2013 2012 2011
Risk-free interest rate (%) 6,50 – 7,83 6,09 – 7,15 7,56 – 8,15 Expected volatility (%) 23,72 24,13 25,58 Expected dividend yield (%) 4,31 5,11 3,22 Expected forfeiture rate (%) 5,00 5,00 5,00 Vesting period 2, 4, 6 years 2, 4, 6 years 2, 4, 6 years
The risk-free rate for periods within the contractual term of the rights is based on the South African government bonds in effect at the time of the valuation of the grant.
The expected volatility in the value of the rights granted is determined using the historical volatility of the Sasol share price.
The expected dividend yield of the rights granted is determined using the historical dividend yield of the Sasol ordinary shares.
The valuation of the share-based payment expense requires a significant degree of judgement to be applied by management.
Range of exercise prices
Number of share
appreciation rights
Weighted average price
per rightRand
Aggregate intrinsic
valueRm
Weighted average
remaining life
years
Details of unimplemented rights granted up to 30 June 2013R210,01 – R240,00 118 200 222,50 25 2,68 R240,01 – R270,00 835 600 257,22 146 4,20 R270,01 – R300,00 3 945 200 295,12 538 4,73 R300,01 – R330,00 56 900 327,20 6 3,28 R330,01 – R360,00 2 083 300 350,99 168 4,13 R390,01 – R420,00 198 500 407,50 5 3,70 R420,01 – R450,00 179 300 444,00 – 3,82 R450,01 – R480,00 126 200 475,10 – 3,93 R480,01 – R510,00 34 900 496,75 – 3,90
7 578 100 315,80 888
Details of unimplemented rights vested at 30 June 2013R210,01 – R240,00 118 200 222,50 25 R240,01 – R270,00 517 500 257,39 90 R270,01 – R300,00 1 379 800 294,65 189 R300,01 – R330,00 26 800 327,20 3 R330,01 – R360,00 1 273 600 351,07 102 R390,01 – R420,00 124 200 407,50 3 R420,01 – R450,00 117 200 444,00 –R450,01 – R480,00 82 400 475,10 –R480,01 – R510,00 22 800 496,75 –
3 662 500 320,84 412
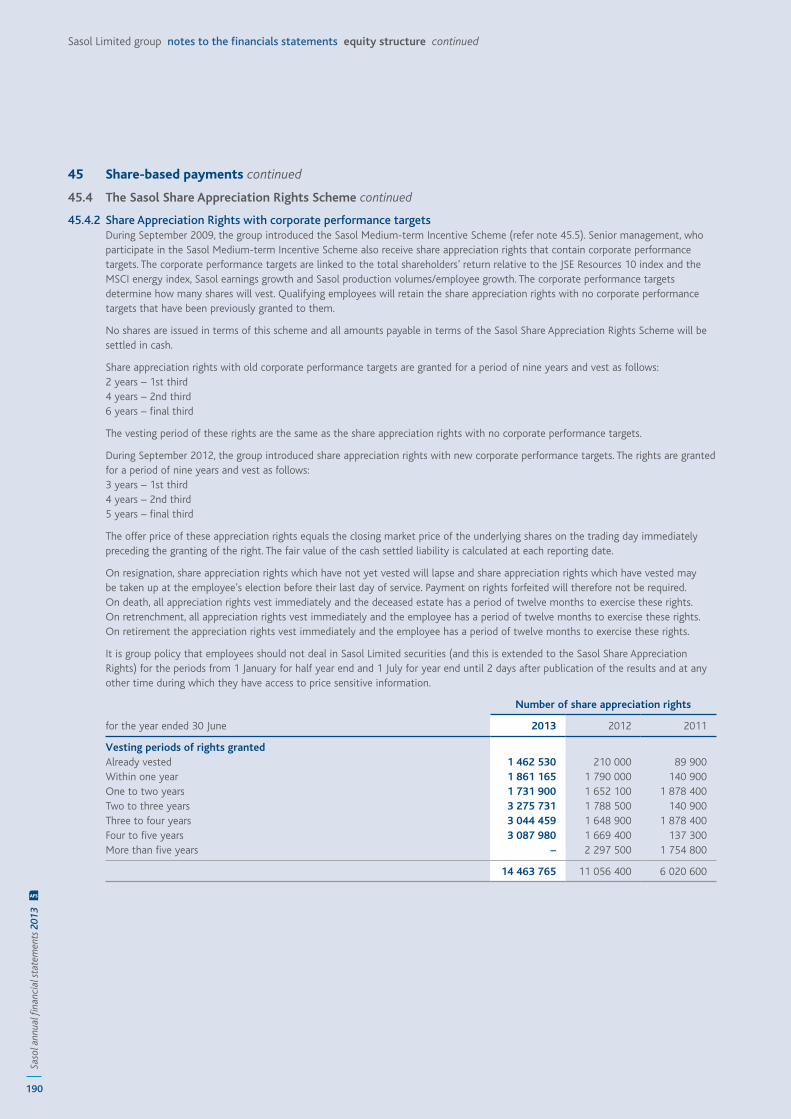
190
Saso
l ann
ual fi
nanc
ial s
tate
men
ts 2
013
AFS
Sasol Limited group notes to the financials statements equity structure continued
45 Share-based payments continued
45.4 The Sasol Share Appreciation Rights Scheme continued
45.4.2 Share Appreciation Rights with corporate performance targetsDuring September 2009, the group introduced the Sasol Medium-term Incentive Scheme (refer note 45.5). Senior management, who participate in the Sasol Medium-term Incentive Scheme also receive share appreciation rights that contain corporate performance targets. The corporate performance targets are linked to the total shareholders’ return relative to the JSE Resources 10 index and the MSCI energy index, Sasol earnings growth and Sasol production volumes/employee growth. The corporate performance targets determine how many shares will vest. Qualifying employees will retain the share appreciation rights with no corporate performance targets that have been previously granted to them.
No shares are issued in terms of this scheme and all amounts payable in terms of the Sasol Share Appreciation Rights Scheme will be settled in cash.
Share appreciation rights with old corporate performance targets are granted for a period of nine years and vest as follows:2 years – 1st third4 years – 2nd third6 years – final third
The vesting period of these rights are the same as the share appreciation rights with no corporate performance targets.
During September 2012, the group introduced share appreciation rights with new corporate performance targets. The rights are granted for a period of nine years and vest as follows:3 years – 1st third4 years – 2nd third5 years – final third
The offer price of these appreciation rights equals the closing market price of the underlying shares on the trading day immediately preceding the granting of the right. The fair value of the cash settled liability is calculated at each reporting date.
On resignation, share appreciation rights which have not yet vested will lapse and share appreciation rights which have vested may be taken up at the employee’s election before their last day of service. Payment on rights forfeited will therefore not be required. On death, all appreciation rights vest immediately and the deceased estate has a period of twelve months to exercise these rights. On retrenchment, all appreciation rights vest immediately and the employee has a period of twelve months to exercise these rights. On retirement the appreciation rights vest immediately and the employee has a period of twelve months to exercise these rights.
It is group policy that employees should not deal in Sasol Limited securities (and this is extended to the Sasol Share Appreciation Rights) for the periods from 1 January for half year end and 1 July for year end until 2 days after publication of the results and at any other time during which they have access to price sensitive information.
for the year ended 30 June
Number of share appreciation rights
2013 2012 2011
Vesting periods of rights grantedAlready vested 1 462 530 210 000 89 900 Within one year 1 861 165 1 790 000 140 900 One to two years 1 731 900 1 652 100 1 878 400 Two to three years 3 275 731 1 788 500 140 900 Three to four years 3 044 459 1 648 900 1 878 400 Four to five years 3 087 980 1 669 400 137 300 More than five years – 2 297 500 1 754 800
14 463 765 11 056 400 6 020 600
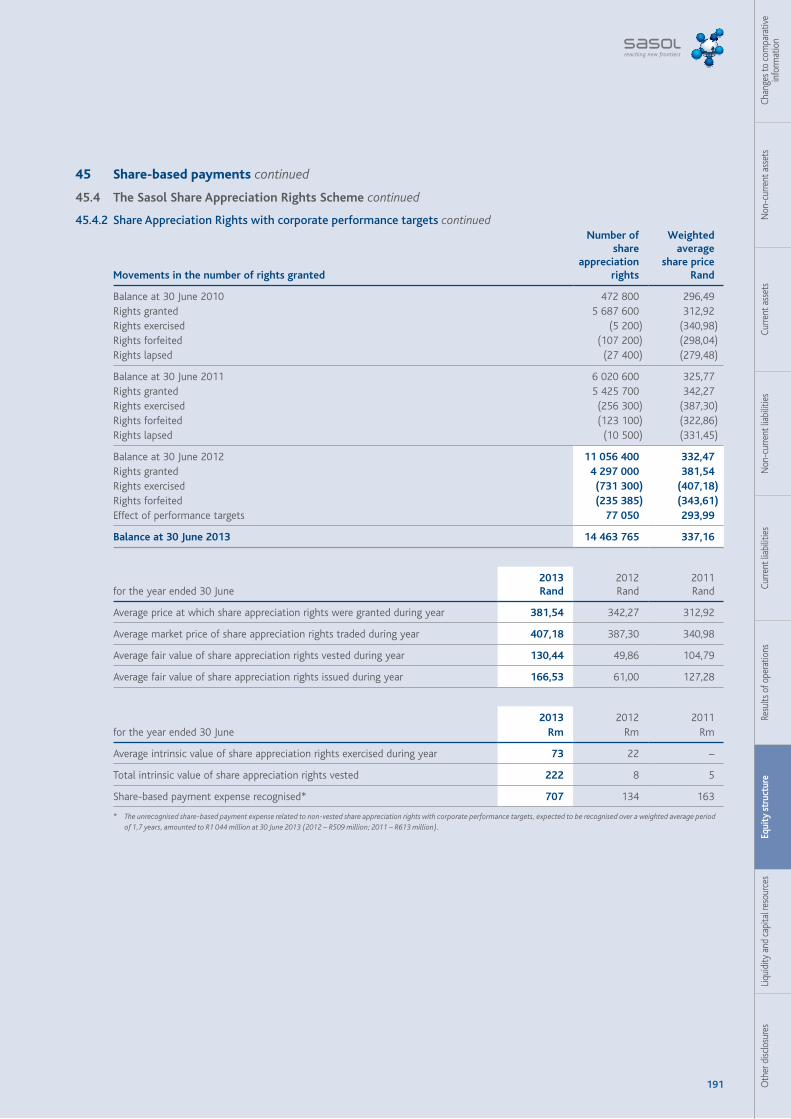
191 Oth
er d
isclo
sure
sLi
quid
ity a
nd c
apita
l res
ourc
esEq
uity
str
uctu
reRe
sults
of o
pera
tions
Curre
nt li
abili
ties
Non
-cur
rent
liab
ilitie
sCu
rrent
ass
ets
Non
-cur
rent
ass
ets
Chan
ges t
o co
mpa
rativ
e in
form
atio
n
45 Share-based payments continued
45.4 The Sasol Share Appreciation Rights Scheme continued
45.4.2 Share Appreciation Rights with corporate performance targets continued
Movements in the number of rights granted
Number of share
appreciation rights
Weighted average
share priceRand
Balance at 30 June 2010 472 800 296,49 Rights granted 5 687 600 312,92 Rights exercised (5 200) (340,98)Rights forfeited (107 200) (298,04)Rights lapsed (27 400) (279,48)
Balance at 30 June 2011 6 020 600 325,77 Rights granted 5 425 700 342,27 Rights exercised (256 300) (387,30)Rights forfeited (123 100) (322,86)Rights lapsed (10 500) (331,45)
Balance at 30 June 2012 11 056 400 332,47 Rights granted 4 297 000 381,54 Rights exercised (731 300) (407,18)Rights forfeited (235 385) (343,61)Effect of performance targets 77 050 293,99
Balance at 30 June 2013 14 463 765 337,16
for the year ended 30 June2013Rand
2012Rand
2011Rand
Average price at which share appreciation rights were granted during year 381,54 342,27 312,92
Average market price of share appreciation rights traded during year 407,18 387,30 340,98
Average fair value of share appreciation rights vested during year 130,44 49,86 104,79
Average fair value of share appreciation rights issued during year 166,53 61,00 127,28
for the year ended 30 June2013
Rm 2012
Rm 2011
Rm
Average intrinsic value of share appreciation rights exercised during year 73 22 –
Total intrinsic value of share appreciation rights vested 222 8 5
Share-based payment expense recognised* 707 134 163
* The unrecognised share-based payment expense related to non-vested share appreciation rights with corporate performance targets, expected to be recognised over a weighted average period of 1,7 years, amounted to R1 044 million at 30 June 2013 (2012 – R509 million; 2011 – R613 million).
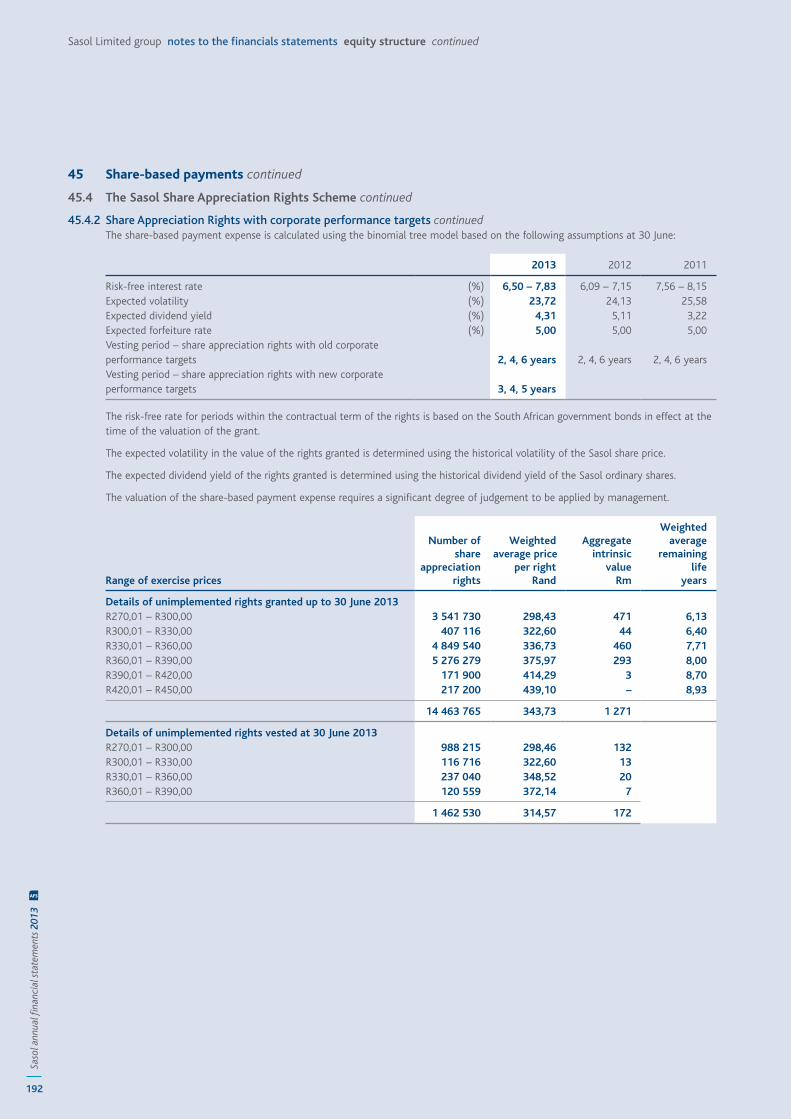
192
Saso
l ann
ual fi
nanc
ial s
tate
men
ts 2
013
AFS
Sasol Limited group notes to the financials statements equity structure continued
45 Share-based payments continued
45.4 The Sasol Share Appreciation Rights Scheme continued
45.4.2 Share Appreciation Rights with corporate performance targets continuedThe share-based payment expense is calculated using the binomial tree model based on the following assumptions at 30 June:
2013 2012 2011
Risk-free interest rate (%) 6,50 – 7,83 6,09 – 7,15 7,56 – 8,15 Expected volatility (%) 23,72 24,13 25,58 Expected dividend yield (%) 4,31 5,11 3,22 Expected forfeiture rate (%) 5,00 5,00 5,00 Vesting period – share appreciation rights with old corporate performance targets 2, 4, 6 years 2, 4, 6 years 2, 4, 6 years Vesting period – share appreciation rights with new corporate performance targets 3, 4, 5 years
The risk-free rate for periods within the contractual term of the rights is based on the South African government bonds in effect at the time of the valuation of the grant.
The expected volatility in the value of the rights granted is determined using the historical volatility of the Sasol share price.
The expected dividend yield of the rights granted is determined using the historical dividend yield of the Sasol ordinary shares.
The valuation of the share-based payment expense requires a significant degree of judgement to be applied by management.
Range of exercise prices
Number of share
appreciation rights
Weighted average price
per rightRand
Aggregate intrinsic
valueRm
Weighted average
remaininglife
years
Details of unimplemented rights granted up to 30 June 2013R270,01 – R300,00 3 541 730 298,43 471 6,13 R300,01 – R330,00 407 116 322,60 44 6,40 R330,01 – R360,00 4 849 540 336,73 460 7,71 R360,01 – R390,00 5 276 279 375,97 293 8,00 R390,01 – R420,00 171 900 414,29 3 8,70 R420,01 – R450,00 217 200 439,10 – 8,93
14 463 765 343,73 1 271
Details of unimplemented rights vested at 30 June 2013R270,01 – R300,00 988 215 298,46 132 R300,01 – R330,00 116 716 322,60 13 R330,01 – R360,00 237 040 348,52 20 R360,01 – R390,00 120 559 372,14 7
1 462 530 314,57 172
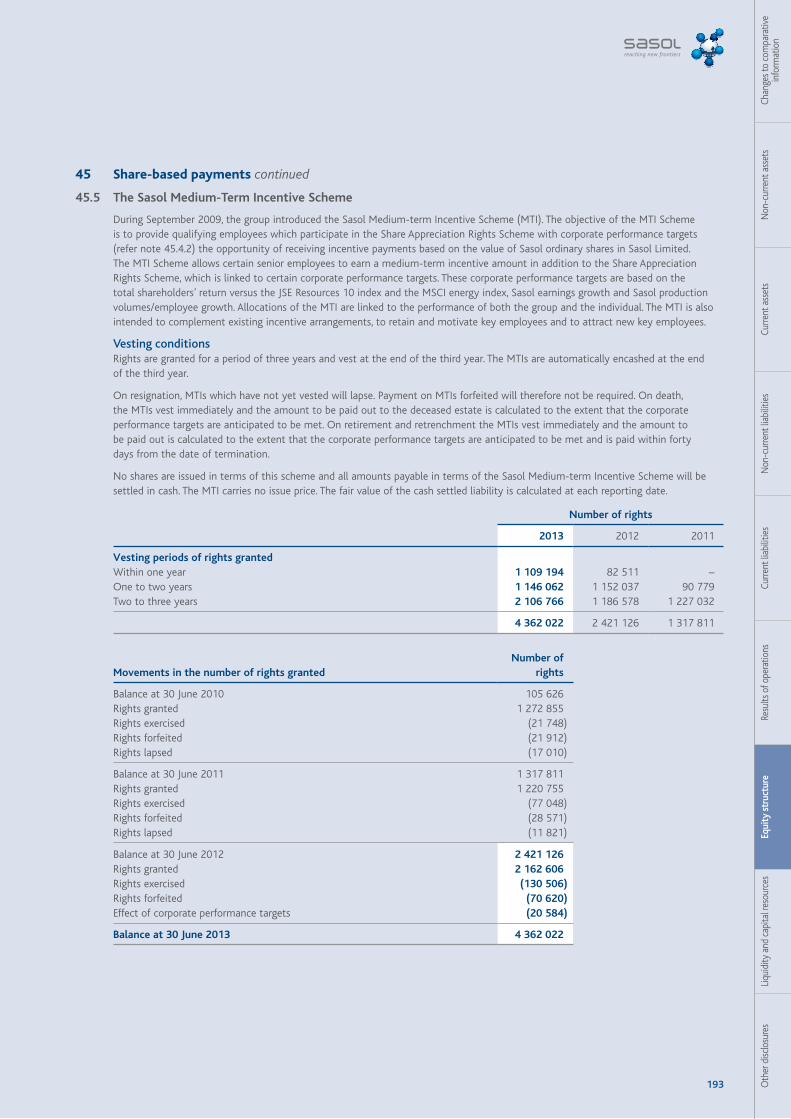
193 Oth
er d
isclo
sure
sLi
quid
ity a
nd c
apita
l res
ourc
esEq
uity
str
uctu
reRe
sults
of o
pera
tions
Curre
nt li
abili
ties
Non
-cur
rent
liab
ilitie
sCu
rrent
ass
ets
Non
-cur
rent
ass
ets
Chan
ges t
o co
mpa
rativ
e in
form
atio
n
45 Share-based payments continued
45.5 The Sasol Medium-Term Incentive Scheme
During September 2009, the group introduced the Sasol Medium-term Incentive Scheme (MTI). The objective of the MTI Scheme is to provide qualifying employees which participate in the Share Appreciation Rights Scheme with corporate performance targets (refer note 45.4.2) the opportunity of receiving incentive payments based on the value of Sasol ordinary shares in Sasol Limited. The MTI Scheme allows certain senior employees to earn a medium-term incentive amount in addition to the Share Appreciation Rights Scheme, which is linked to certain corporate performance targets. These corporate performance targets are based on the total shareholders’ return versus the JSE Resources 10 index and the MSCI energy index, Sasol earnings growth and Sasol production volumes/employee growth. Allocations of the MTI are linked to the performance of both the group and the individual. The MTI is also intended to complement existing incentive arrangements, to retain and motivate key employees and to attract new key employees.
Vesting conditionsRights are granted for a period of three years and vest at the end of the third year. The MTIs are automatically encashed at the end of the third year.
On resignation, MTIs which have not yet vested will lapse. Payment on MTIs forfeited will therefore not be required. On death, the MTIs vest immediately and the amount to be paid out to the deceased estate is calculated to the extent that the corporate performance targets are anticipated to be met. On retirement and retrenchment the MTIs vest immediately and the amount to be paid out is calculated to the extent that the corporate performance targets are anticipated to be met and is paid within forty days from the date of termination.
No shares are issued in terms of this scheme and all amounts payable in terms of the Sasol Medium-term Incentive Scheme will be settled in cash. The MTI carries no issue price. The fair value of the cash settled liability is calculated at each reporting date.
Number of rights
2013 2012 2011
Vesting periods of rights grantedWithin one year 1 109 194 82 511 –One to two years 1 146 062 1 152 037 90 779 Two to three years 2 106 766 1 186 578 1 227 032
4 362 022 2 421 126 1 317 811
Movements in the number of rights grantedNumber of
rights
Balance at 30 June 2010 105 626 Rights granted 1 272 855 Rights exercised (21 748)Rights forfeited (21 912)Rights lapsed (17 010)
Balance at 30 June 2011 1 317 811 Rights granted 1 220 755 Rights exercised (77 048)Rights forfeited (28 571)Rights lapsed (11 821)
Balance at 30 June 2012 2 421 126 Rights granted 2 162 606 Rights exercised (130 506)Rights forfeited (70 620)Effect of corporate performance targets (20 584)
Balance at 30 June 2013 4 362 022
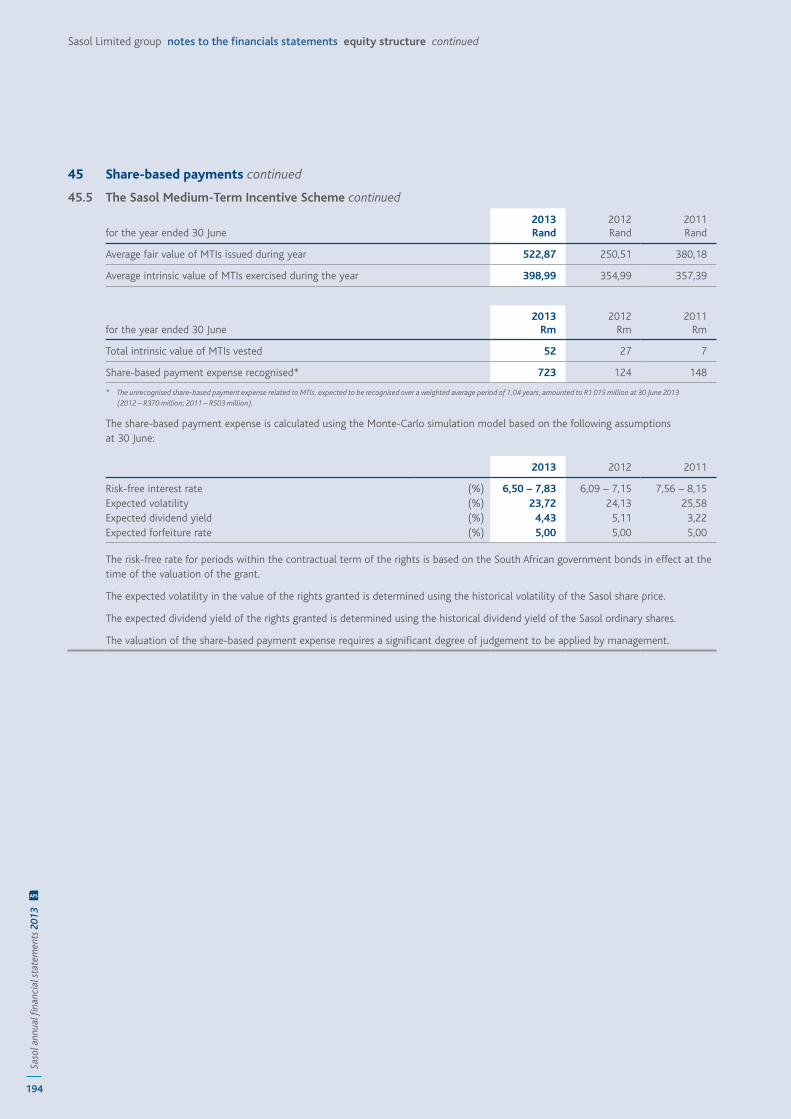
194
Saso
l ann
ual fi
nanc
ial s
tate
men
ts 2
013
AFS
Sasol Limited group notes to the financials statements equity structure continued
45 Share-based payments continued
45.5 The Sasol Medium-Term Incentive Scheme continued
for the year ended 30 June2013Rand
2012Rand
2011Rand
Average fair value of MTIs issued during year 522,87 250,51 380,18
Average intrinsic value of MTIs exercised during the year 398,99 354,99 357,39
for the year ended 30 June2013
Rm 2012
Rm 2011
Rm
Total intrinsic value of MTIs vested 52 27 7
Share-based payment expense recognised* 723 124 148
* The unrecognised share-based payment expense related to MTIs, expected to be recognised over a weighted average period of 1,04 years, amounted to R1 015 million at 30 June 2013 (2012 – R370 million; 2011 – R503 million).
The share-based payment expense is calculated using the Monte-Carlo simulation model based on the following assumptions at 30 June:
2013 2012 2011
Risk-free interest rate (%) 6,50 – 7,83 6,09 – 7,15 7,56 – 8,15 Expected volatility (%) 23,72 24,13 25,58 Expected dividend yield (%) 4,43 5,11 3,22 Expected forfeiture rate (%) 5,00 5,00 5,00
The risk-free rate for periods within the contractual term of the rights is based on the South African government bonds in effect at the time of the valuation of the grant.
The expected volatility in the value of the rights granted is determined using the historical volatility of the Sasol share price.
The expected dividend yield of the rights granted is determined using the historical dividend yield of the Sasol ordinary shares.
The valuation of the share-based payment expense requires a significant degree of judgement to be applied by management.
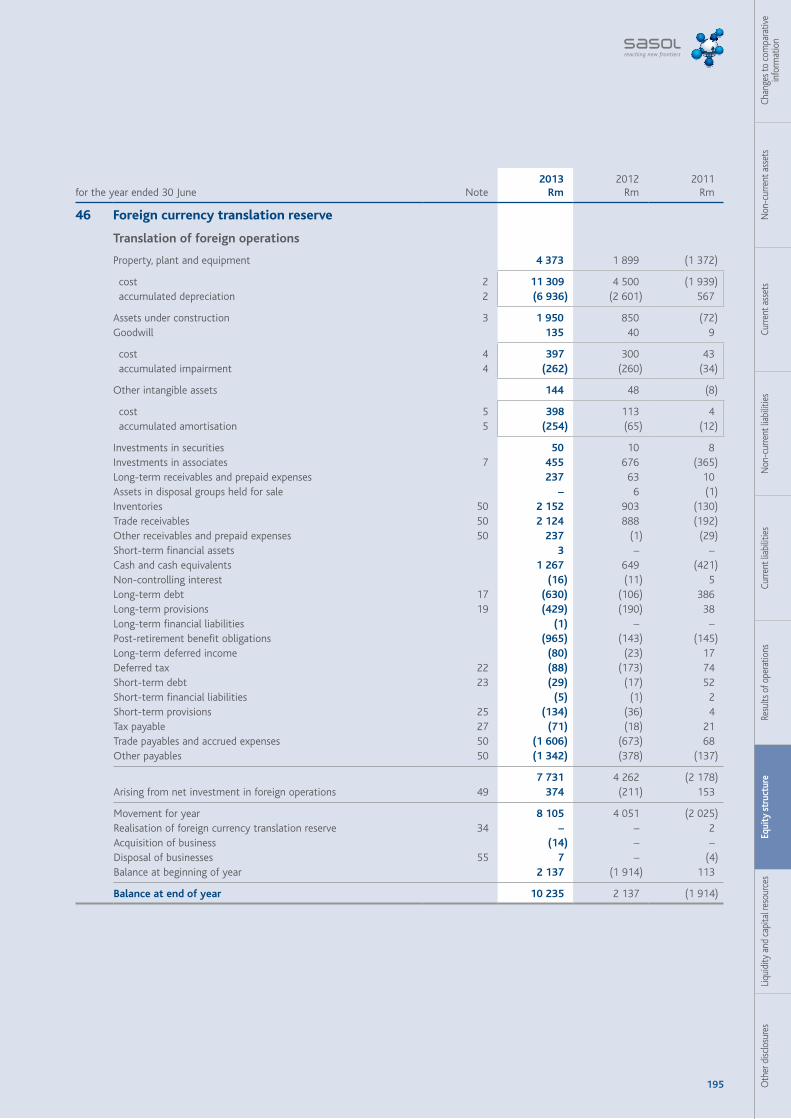
195 Oth
er d
isclo
sure
sLi
quid
ity a
nd c
apita
l res
ourc
esEq
uity
str
uctu
reRe
sults
of o
pera
tions
Curre
nt li
abili
ties
Non
-cur
rent
liab
ilitie
sCu
rrent
ass
ets
Non
-cur
rent
ass
ets
Chan
ges t
o co
mpa
rativ
e in
form
atio
n
for the year ended 30 June Note 2013
Rm 2012
Rm 2011
Rm
46 Foreign currency translation reserve
Translation of foreign operations
Property, plant and equipment 4 373 1 899 (1 372)
cost 2 11 309 4 500 (1 939) accumulated depreciation 2 (6 936) (2 601) 567
Assets under construction 3 1 950 850 (72)Goodwill 135 40 9
cost 4 397 300 43 accumulated impairment 4 (262) (260) (34)
Other intangible assets 144 48 (8)
cost 5 398 113 4 accumulated amortisation 5 (254) (65) (12)
Investments in securities 50 10 8 Investments in associates 7 455 676 (365)Long-term receivables and prepaid expenses 237 63 10 Assets in disposal groups held for sale – 6 (1)Inventories 50 2 152 903 (130)Trade receivables 50 2 124 888 (192)Other receivables and prepaid expenses 50 237 (1) (29)Short-term financial assets 3 – –Cash and cash equivalents 1 267 649 (421)Non-controlling interest (16) (11) 5 Long-term debt 17 (630) (106) 386 Long-term provisions 19 (429) (190) 38 Long-term financial liabilities (1) – –Post-retirement benefit obligations (965) (143) (145)Long-term deferred income (80) (23) 17 Deferred tax 22 (88) (173) 74 Short-term debt 23 (29) (17) 52 Short-term financial liabilities (5) (1) 2 Short-term provisions 25 (134) (36) 4 Tax payable 27 (71) (18) 21 Trade payables and accrued expenses 50 (1 606) (673) 68 Other payables 50 (1 342) (378) (137)
7 731 4 262 (2 178)Arising from net investment in foreign operations 49 374 (211) 153
Movement for year 8 105 4 051 (2 025)Realisation of foreign currency translation reserve 34 – – 2 Acquisition of business (14) – –Disposal of businesses 55 7 – (4)Balance at beginning of year 2 137 (1 914) 113
Balance at end of year 10 235 2 137 (1 914)
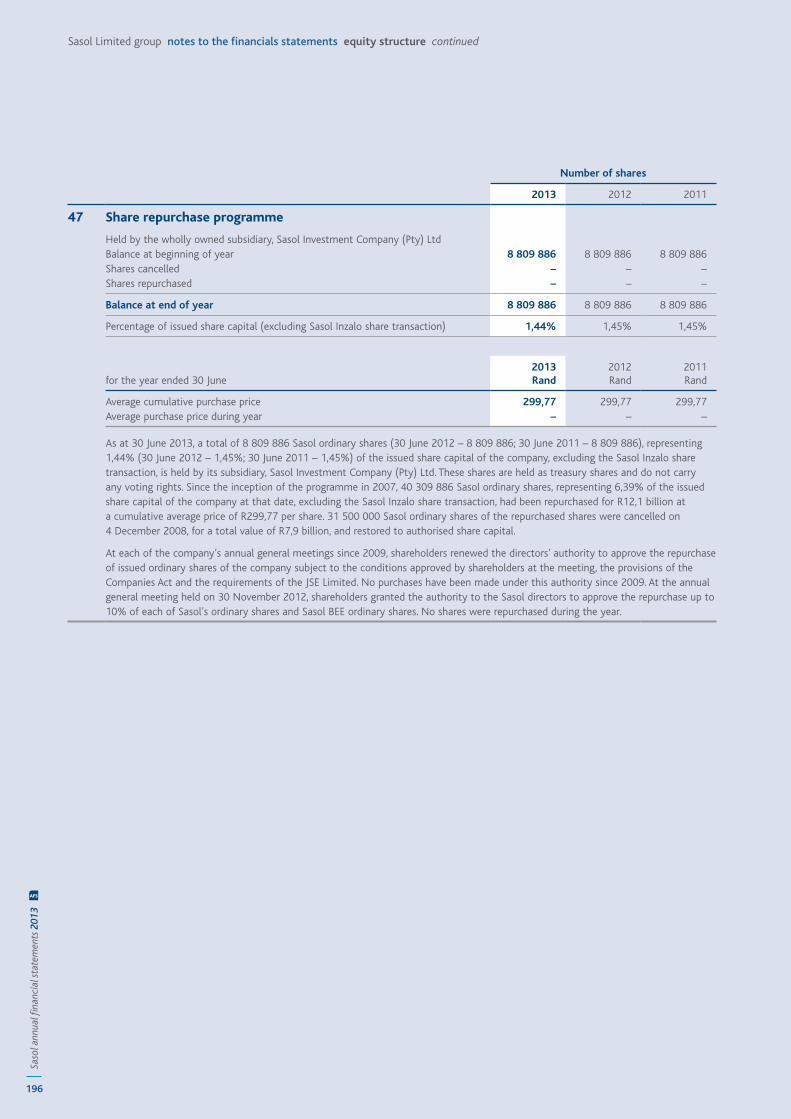
196
Saso
l ann
ual fi
nanc
ial s
tate
men
ts 2
013
AFS
Sasol Limited group notes to the financials statements equity structure continued
Number of shares
2013 2012 2011
47 Share repurchase programme
Held by the wholly owned subsidiary, Sasol Investment Company (Pty) LtdBalance at beginning of year 8 809 886 8 809 886 8 809 886 Shares cancelled – – –Shares repurchased – – –
Balance at end of year 8 809 886 8 809 886 8 809 886
Percentage of issued share capital (excluding Sasol Inzalo share transaction) 1,44% 1,45% 1,45%
for the year ended 30 June2013Rand
2012Rand
2011Rand
Average cumulative purchase price 299,77 299,77 299,77 Average purchase price during year – – –
As at 30 June 2013, a total of 8 809 886 Sasol ordinary shares (30 June 2012 – 8 809 886; 30 June 2011 – 8 809 886), representing 1,44% (30 June 2012 – 1,45%; 30 June 2011 – 1,45%) of the issued share capital of the company, excluding the Sasol Inzalo share transaction, is held by its subsidiary, Sasol Investment Company (Pty) Ltd. These shares are held as treasury shares and do not carry any voting rights. Since the inception of the programme in 2007, 40 309 886 Sasol ordinary shares, representing 6,39% of the issued share capital of the company at that date, excluding the Sasol Inzalo share transaction, had been repurchased for R12,1 billion at a cumulative average price of R299,77 per share. 31 500 000 Sasol ordinary shares of the repurchased shares were cancelled on 4 December 2008, for a total value of R7,9 billion, and restored to authorised share capital.
At each of the company’s annual general meetings since 2009, shareholders renewed the directors’ authority to approve the repurchase of issued ordinary shares of the company subject to the conditions approved by shareholders at the meeting, the provisions of the Companies Act and the requirements of the JSE Limited. No purchases have been made under this authority since 2009. At the annual general meeting held on 30 November 2012, shareholders granted the authority to the Sasol directors to approve the repurchase up to 10% of each of Sasol’s ordinary shares and Sasol BEE ordinary shares. No shares were repurchased during the year.
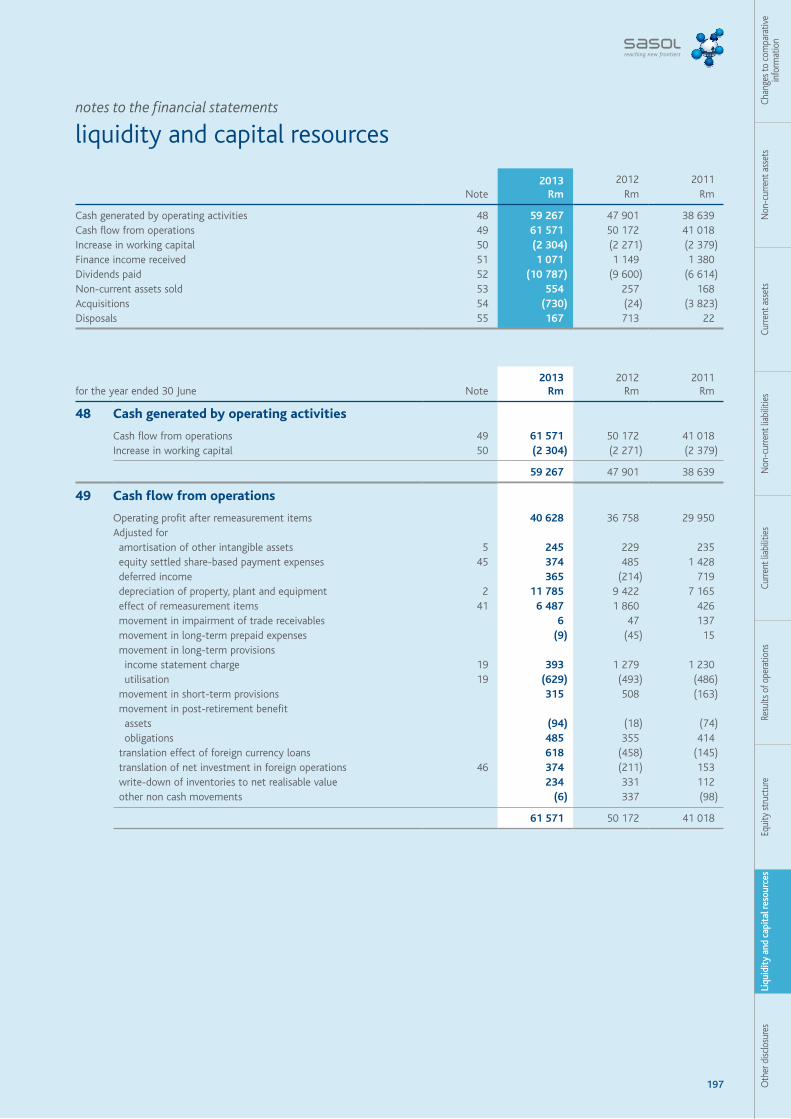
197 Oth
er d
isclo
sure
sLi
quid
ity
and
capi
tal r
esou
rces
Equi
ty st
ruct
ure
Resu
lts o
f ope
ratio
nsCu
rrent
liab
ilitie
sN
on-c
urre
nt li
abili
ties
Curre
nt a
sset
sN
on-c
urre
nt a
sset
sCh
ange
s to
com
para
tive
info
rmat
ion
notes to the financial statements
liquidity and capital resources
for the year ended 30 June Note 2013
Rm 2012
Rm 2011
Rm
48 Cash generated by operating activities
Cash flow from operations 49 61 571 50 172 41 018 Increase in working capital 50 (2 304) (2 271) (2 379)
59 267 47 901 38 639
49 Cash flow from operations
Operating profit after remeasurement items 40 628 36 758 29 950 Adjusted for amortisation of other intangible assets 5 245 229 235 equity settled share-based payment expenses 45 374 485 1 428 deferred income 365 (214) 719 depreciation of property, plant and equipment 2 11 785 9 422 7 165 effect of remeasurement items 41 6 487 1 860 426 movement in impairment of trade receivables 6 47 137 movement in long-term prepaid expenses (9) (45) 15 movement in long-term provisions income statement charge 19 393 1 279 1 230 utilisation 19 (629) (493) (486) movement in short-term provisions 315 508 (163) movement in post-retirement benefit assets (94) (18) (74) obligations 485 355 414 translation effect of foreign currency loans 618 (458) (145) translation of net investment in foreign operations 46 374 (211) 153 write-down of inventories to net realisable value 234 331 112 other non cash movements (6) 337 (98)
61 571 50 172 41 018
Note 2013
Rm 2012
Rm 2011
Rm
Cash generated by operating activities 48 59 267 47 901 38 639 Cash flow from operations 49 61 571 50 172 41 018 Increase in working capital 50 (2 304) (2 271) (2 379)Finance income received 51 1 071 1 149 1 380 Dividends paid 52 (10 787) (9 600) (6 614)Non-current assets sold 53 554 257 168 Acquisitions 54 (730) (24) (3 823)Disposals 55 167 713 22
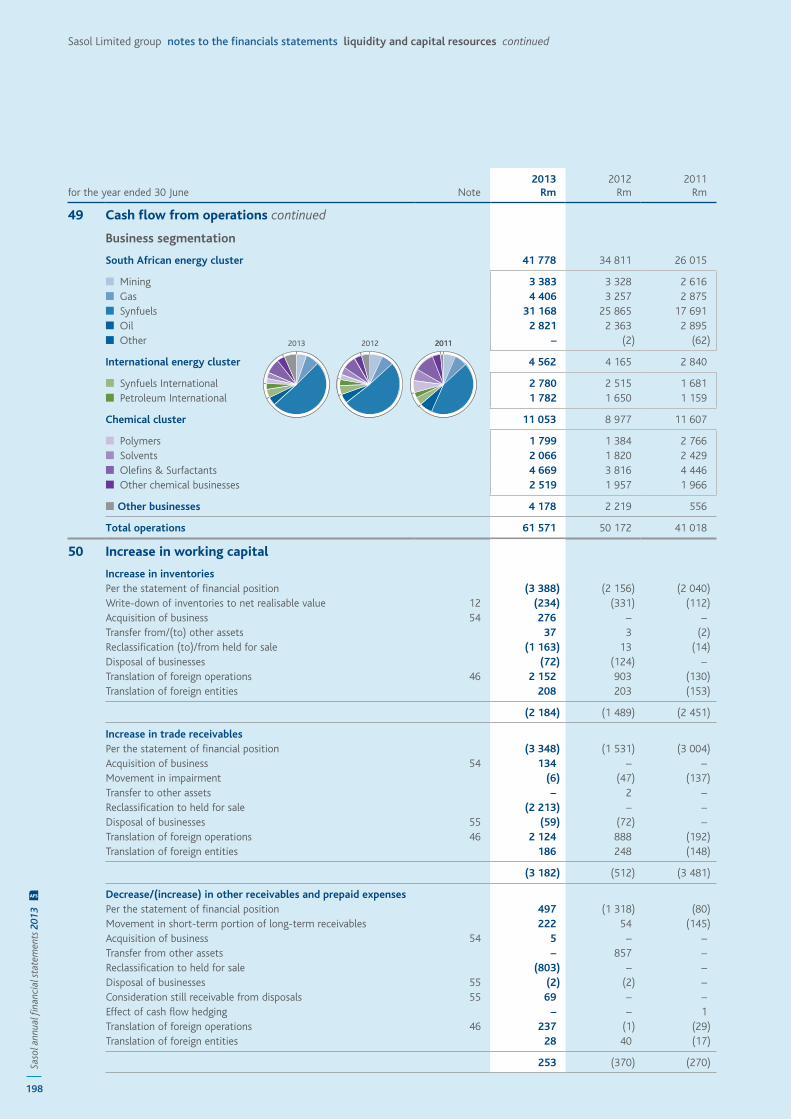
198
Saso
l ann
ual fi
nanc
ial s
tate
men
ts 2
013
AFS
Sasol Limited group notes to the financials statements liquidity and capital resources continued
for the year ended 30 June Note 2013
Rm 2012
Rm 2011
Rm
49 Cash flow from operations continued
Business segmentation
South African energy cluster 41 778 34 811 26 015
■ Mining 3 383 3 328 2 616 ■ Gas 4 406 3 257 2 875 ■ Synfuels 31 168 25 865 17 691 ■ Oil 2 821 2 363 2 895 ■ Other – (2) (62)
International energy cluster 4 562 4 165 2 840
■ Synfuels International 2 780 2 515 1 681 ■ Petroleum International 1 782 1 650 1 159
Chemical cluster 11 053 8 977 11 607
■ Polymers 1 799 1 384 2 766 ■ Solvents 2 066 1 820 2 429 ■ Olefins & Surfactants 4 669 3 816 4 446 ■ Other chemical businesses 2 519 1 957 1 966
■ Other businesses 4 178 2 219 556
Total operations 61 571 50 172 41 018
50 Increase in working capital
Increase in inventoriesPer the statement of financial position (3 388) (2 156) (2 040)Write-down of inventories to net realisable value 12 (234) (331) (112)Acquisition of business 54 276 – –Transfer from/(to) other assets 37 3 (2)Reclassification (to)/from held for sale (1 163) 13 (14)Disposal of businesses (72) (124) –Translation of foreign operations 46 2 152 903 (130)Translation of foreign entities 208 203 (153)
(2 184) (1 489) (2 451)
Increase in trade receivablesPer the statement of financial position (3 348) (1 531) (3 004)Acquisition of business 54 134 – –Movement in impairment (6) (47) (137)Transfer to other assets – 2 –Reclassification to held for sale (2 213) – –Disposal of businesses 55 (59) (72) –Translation of foreign operations 46 2 124 888 (192)Translation of foreign entities 186 248 (148)
(3 182) (512) (3 481)
Decrease/(increase) in other receivables and prepaid expensesPer the statement of financial position 497 (1 318) (80)Movement in short-term portion of long-term receivables 222 54 (145)Acquisition of business 54 5 – –Transfer from other assets – 857 –Reclassification to held for sale (803) – –Disposal of businesses 55 (2) (2) –Consideration still receivable from disposals 55 69 – –Effect of cash flow hedging – – 1 Translation of foreign operations 46 237 (1) (29)Translation of foreign entities 28 40 (17)
253 (370) (270)
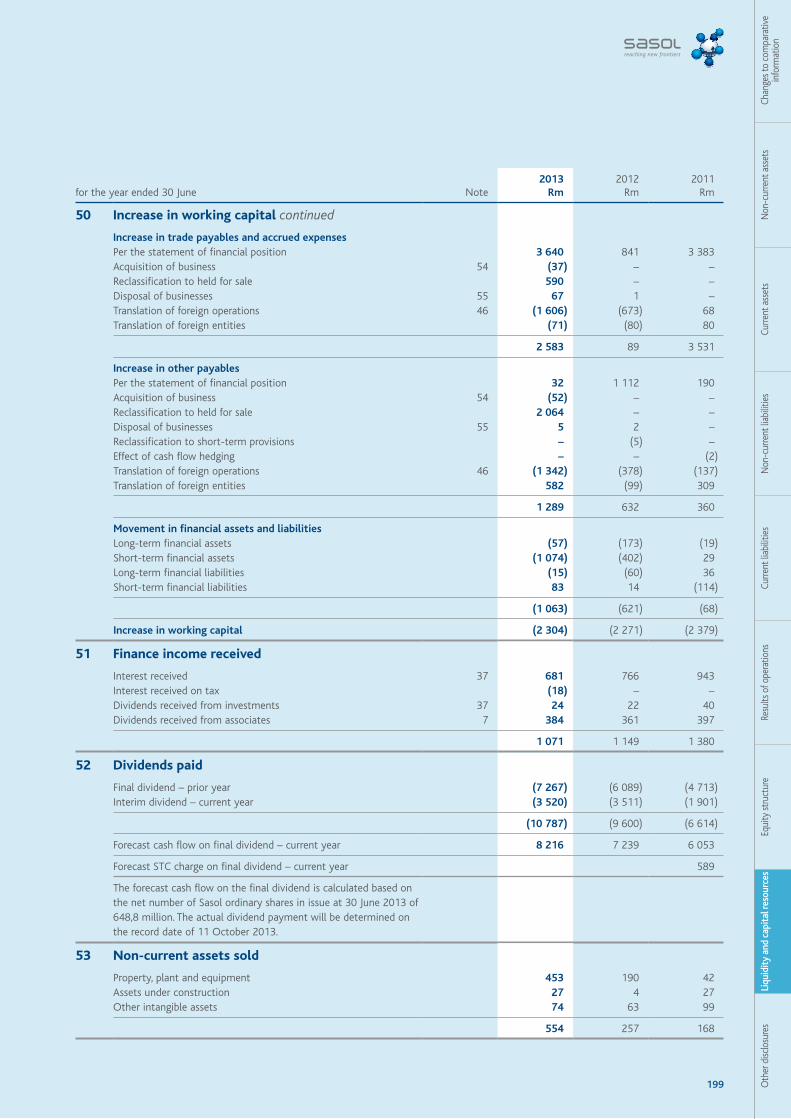
199 Oth
er d
isclo
sure
sLi
quid
ity
and
capi
tal r
esou
rces
Equi
ty st
ruct
ure
Resu
lts o
f ope
ratio
nsCu
rrent
liab
ilitie
sN
on-c
urre
nt li
abili
ties
Curre
nt a
sset
sN
on-c
urre
nt a
sset
sCh
ange
s to
com
para
tive
info
rmat
ion
for the year ended 30 June Note 2013
Rm 2012
Rm 2011
Rm
50 Increase in working capital continued
Increase in trade payables and accrued expensesPer the statement of financial position 3 640 841 3 383 Acquisition of business 54 (37) – –Reclassification to held for sale 590 – –Disposal of businesses 55 67 1 –Translation of foreign operations 46 (1 606) (673) 68 Translation of foreign entities (71) (80) 80
2 583 89 3 531
Increase in other payablesPer the statement of financial position 32 1 112 190 Acquisition of business 54 (52) – –Reclassification to held for sale 2 064 – –Disposal of businesses 55 5 2 –Reclassification to short-term provisions – (5) –Effect of cash flow hedging – – (2)Translation of foreign operations 46 (1 342) (378) (137)Translation of foreign entities 582 (99) 309
1 289 632 360
Movement in financial assets and liabilitiesLong-term financial assets (57) (173) (19)Short-term financial assets (1 074) (402) 29 Long-term financial liabilities (15) (60) 36 Short-term financial liabilities 83 14 (114)
(1 063) (621) (68)
Increase in working capital (2 304) (2 271) (2 379)
51 Finance income received
Interest received 37 681 766 943 Interest received on tax (18) – –Dividends received from investments 37 24 22 40 Dividends received from associates 7 384 361 397
1 071 1 149 1 380
52 Dividends paid
Final dividend – prior year (7 267) (6 089) (4 713)Interim dividend – current year (3 520) (3 511) (1 901)
(10 787) (9 600) (6 614)
Forecast cash flow on final dividend – current year 8 216 7 239 6 053
Forecast STC charge on final dividend – current year 589
The forecast cash flow on the final dividend is calculated based on the net number of Sasol ordinary shares in issue at 30 June 2013 of 648,8 million. The actual dividend payment will be determined on the record date of 11 October 2013.
53 Non-current assets sold
Property, plant and equipment 453 190 42 Assets under construction 27 4 27 Other intangible assets 74 63 99
554 257 168
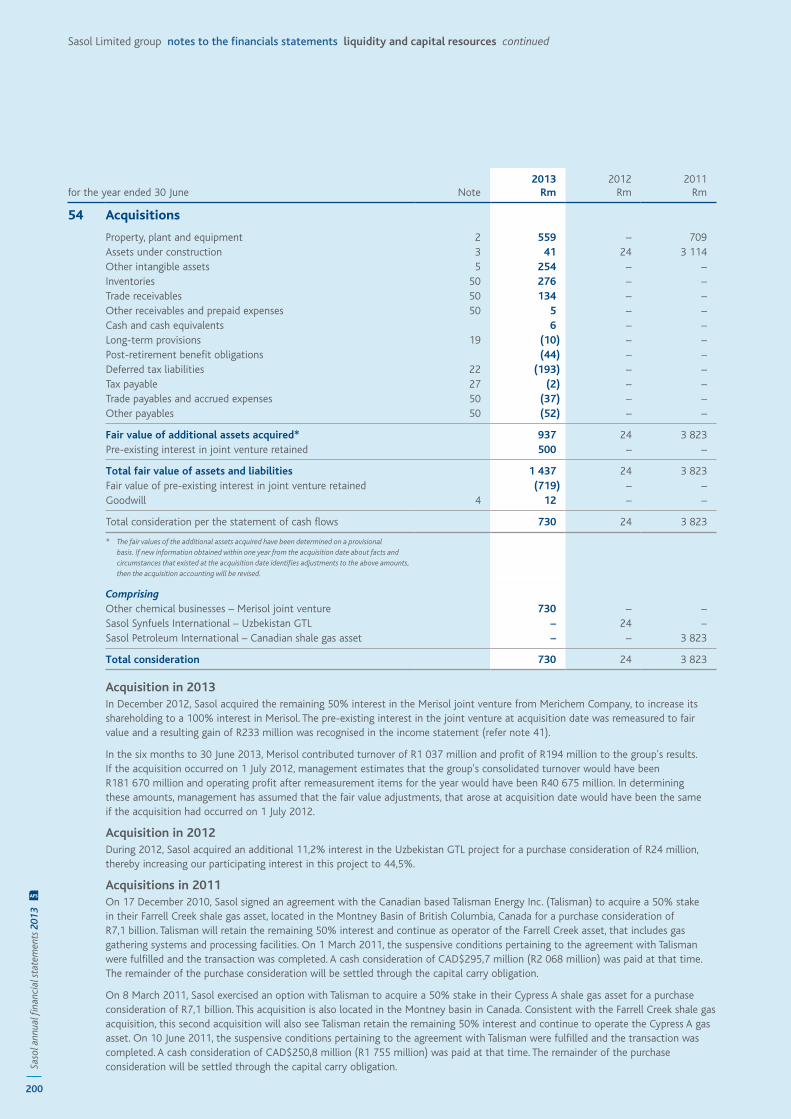
200
Saso
l ann
ual fi
nanc
ial s
tate
men
ts 2
013
AFS
Sasol Limited group notes to the financials statements liquidity and capital resources continued
for the year ended 30 June Note 2013
Rm 2012
Rm 2011
Rm
54 Acquisitions
Property, plant and equipment 2 559 – 709 Assets under construction 3 41 24 3 114 Other intangible assets 5 254 – –Inventories 50 276 – –Trade receivables 50 134 – –Other receivables and prepaid expenses 50 5 – –Cash and cash equivalents 6 – –Long-term provisions 19 (10) – –Post-retirement benefit obligations (44) – –Deferred tax liabilities 22 (193) – –Tax payable 27 (2) – –Trade payables and accrued expenses 50 (37) – –Other payables 50 (52) – –
Fair value of additional assets acquired* 937 24 3 823 Pre-existing interest in joint venture retained 500 – –
Total fair value of assets and liabilities 1 437 24 3 823 Fair value of pre-existing interest in joint venture retained (719) – –Goodwill 4 12 – –
Total consideration per the statement of cash flows 730 24 3 823
* The fair values of the additional assets acquired have been determined on a provisional basis. If new information obtained within one year from the acquisition date about facts and circumstances that existed at the acquisition date identifies adjustments to the above amounts, then the acquisition accounting will be revised.
ComprisingOther chemical businesses – Merisol joint venture 730 – –Sasol Synfuels International – Uzbekistan GTL – 24 –Sasol Petroleum International – Canadian shale gas asset – – 3 823
Total consideration 730 24 3 823
Acquisition in 2013 In December 2012, Sasol acquired the remaining 50% interest in the Merisol joint venture from Merichem Company, to increase its shareholding to a 100% interest in Merisol. The pre-existing interest in the joint venture at acquisition date was remeasured to fair value and a resulting gain of R233 million was recognised in the income statement (refer note 41).
In the six months to 30 June 2013, Merisol contributed turnover of R1 037 million and profit of R194 million to the group's results. If the acquisition occurred on 1 July 2012, management estimates that the group's consolidated turnover would have been R181 670 million and operating profit after remeasurement items for the year would have been R40 675 million. In determining these amounts, management has assumed that the fair value adjustments, that arose at acquisition date would have been the same if the acquisition had occurred on 1 July 2012.
Acquisition in 2012During 2012, Sasol acquired an additional 11,2% interest in the Uzbekistan GTL project for a purchase consideration of R24 million, thereby increasing our participating interest in this project to 44,5%.
Acquisitions in 2011On 17 December 2010, Sasol signed an agreement with the Canadian based Talisman Energy Inc. (Talisman) to acquire a 50% stake in their Farrell Creek shale gas asset, located in the Montney Basin of British Columbia, Canada for a purchase consideration of R7,1 billion. Talisman will retain the remaining 50% interest and continue as operator of the Farrell Creek asset, that includes gas gathering systems and processing facilities. On 1 March 2011, the suspensive conditions pertaining to the agreement with Talisman were fulfilled and the transaction was completed. A cash consideration of CAD$295,7 million (R2 068 million) was paid at that time. The remainder of the purchase consideration will be settled through the capital carry obligation.
On 8 March 2011, Sasol exercised an option with Talisman to acquire a 50% stake in their Cypress A shale gas asset for a purchase consideration of R7,1 billion. This acquisition is also located in the Montney basin in Canada. Consistent with the Farrell Creek shale gas acquisition, this second acquisition will also see Talisman retain the remaining 50% interest and continue to operate the Cypress A gas asset. On 10 June 2011, the suspensive conditions pertaining to the agreement with Talisman were fulfilled and the transaction was completed. A cash consideration of CAD$250,8 million (R1 755 million) was paid at that time. The remainder of the purchase consideration will be settled through the capital carry obligation.
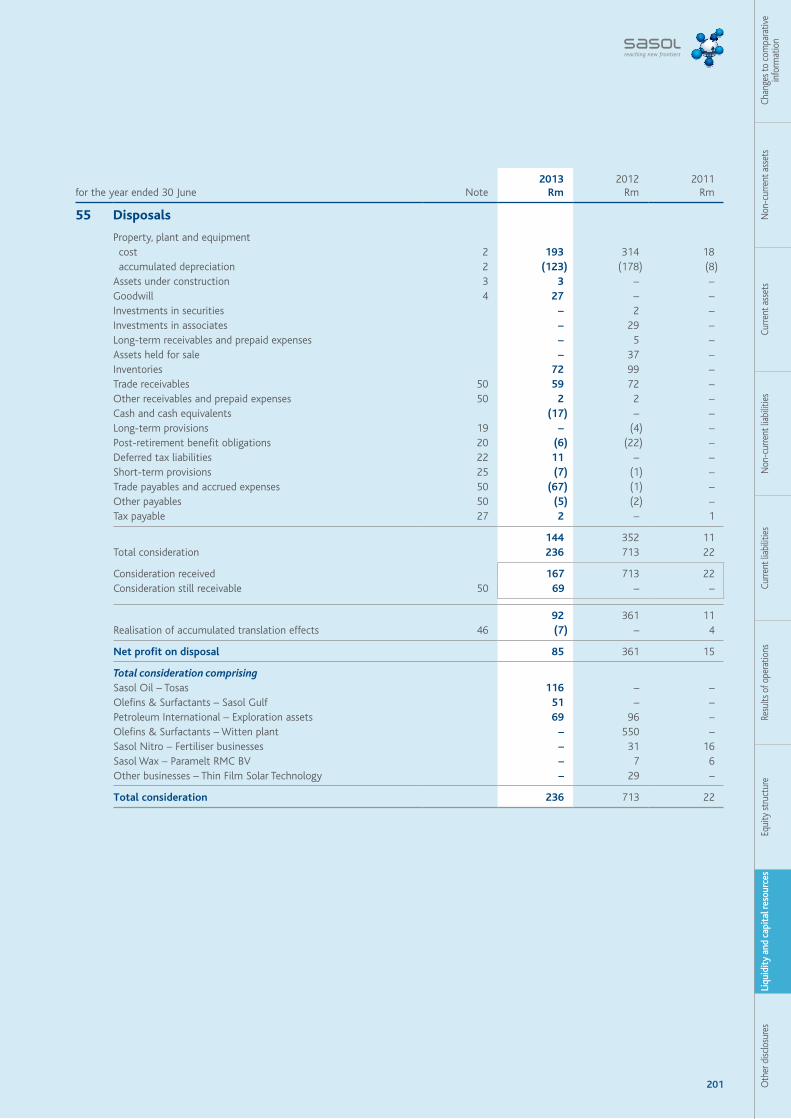
201 Oth
er d
isclo
sure
sLi
quid
ity
and
capi
tal r
esou
rces
Equi
ty st
ruct
ure
Resu
lts o
f ope
ratio
nsCu
rrent
liab
ilitie
sN
on-c
urre
nt li
abili
ties
Curre
nt a
sset
sN
on-c
urre
nt a
sset
sCh
ange
s to
com
para
tive
info
rmat
ion
for the year ended 30 June Note 2013
Rm 2012
Rm 2011
Rm
55 Disposals
Property, plant and equipment cost 2 193 314 18 accumulated depreciation 2 (123) (178) (8)Assets under construction 3 3 – –Goodwill 4 27 – –Investments in securities – 2 –Investments in associates – 29 –Long-term receivables and prepaid expenses – 5 –Assets held for sale – 37 –Inventories 72 99 –Trade receivables 50 59 72 –Other receivables and prepaid expenses 50 2 2 –Cash and cash equivalents (17) – –Long-term provisions 19 – (4) –Post-retirement benefit obligations 20 (6) (22) –Deferred tax liabilities 22 11 – –Short-term provisions 25 (7) (1) –Trade payables and accrued expenses 50 (67) (1) –Other payables 50 (5) (2) –Tax payable 27 2 – 1
144 352 11 Total consideration 236 713 22
Consideration received 167 713 22 Consideration still receivable 50 69 – –
92 361 11 Realisation of accumulated translation effects 46 (7) – 4
Net profit on disposal 85 361 15
Total consideration comprisingSasol Oil – Tosas 116 – –Olefins & Surfactants – Sasol Gulf 51 – –Petroleum International – Exploration assets 69 96 –Olefins & Surfactants – Witten plant – 550 –Sasol Nitro – Fertiliser businesses – 31 16 Sasol Wax – Paramelt RMC BV – 7 6 Other businesses – Thin Film Solar Technology – 29 –
Total consideration 236 713 22
202
Saso
l ann
ual fi
nanc
ial s
tate
men
ts 2
013
AFS
Sasol Limited group notes to the financials statements liquidity and capital resources continued
55 Disposals continued
Disposals in 2013SasolOlefins&Surfactants–SasolGulf On 31 March 2013, Sasol Olefins & Surfactants (O&S) disposed of its subsidiary for a total consideration of R51 million.
SasolOil–Tosas On 1 April 2013, Sasol Oil disposed of its shareholding in Tosas Holdings Pty (Ltd) for a total consideration of R116 million.
SasolPetroleumInternational–Explorationlicences In 2013, Sasol Petroleum International (SPI) disposed of its participation interests in the exploration assets in Papua New Guinea for a total consideration of R69 million.
Disposals in 2012SasolPetroleumInternational–Explorationlicences In 2012, Sasol Petroleum International (SPI) disposed of 10% of its equity interest in an exploration asset in Papua New Guinea for a total consideration of R60 million. In addition, in 2010, SPI entered into negotiations with buyers interested in acquiring exploration assets in Nigeria. The sale of these assets were concluded in 2012 for a total consideration of R36 million.
SasolOlefins&Surfactants–Wittenplant During 2012, as part of the Sasol Olefins & Surfactants (O&S) restructuring programme announced in March 2007, Sasol decided to dispose of the Witten plant, Germany, for a total consideration of R550 million.
SasolNitro–Fertiliserbusinesses In July 2010, Sasol Nitro concluded a settlement agreement with the South African Competition Commission to dispose of the bulk blending and liquid fertiliser blending facilities in Durban, Bellville, Endicott and Kimberley. During 2012, the facilities in Durban, Bellville and Endicott were sold for a total consideration of R31 million.
SasolWax–ParameltRMCBV On 10 July 2007, Sasol Wax disposed of its 31% investment in Paramelt RMC BV, operating in the Netherlands, for a consideration of R251 million, realising a profit of R129 million. During 2012, the additional conditions precedent were met resulting in the receipt of additional consideration of R7 million.
Otherbusinesses–ThinFilmSolarTechnology During 2012, Sasol disposed of its 40% investment in Thin Film Solar Technology for a consideration of R29 million.
Disposals in 2011 On 5 July 2010, Sasol Nitro concluded a settlement agreement with the South African Competition Commission. In terms of this settlement, Sasol Nitro has restructured its fertiliser business. The settlement agreement included, amongst others, the divesting of the regional blending capacity. In March 2011, the sale of the Potchefstroom blending facility was concluded, resulting in a profit of R6 million.
In 2011, the group also disposed of other smaller investments realising a profit of R10 million.
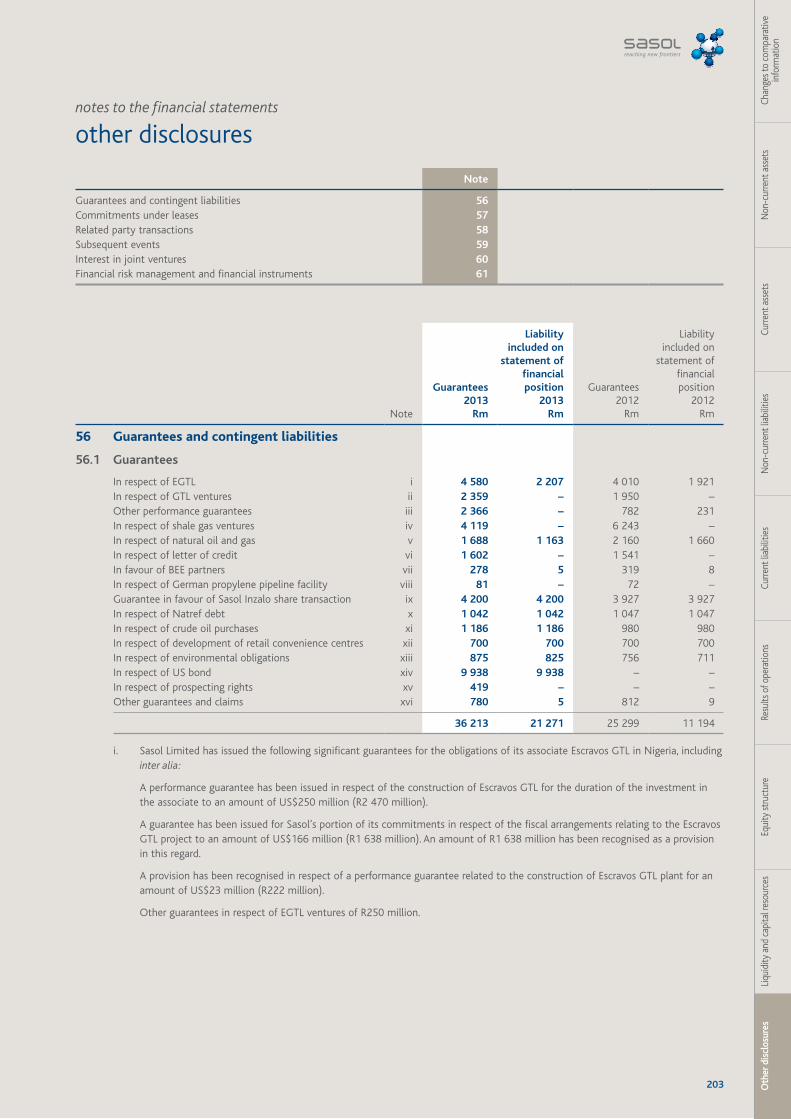
203 Oth
er d
iscl
osur
esLi
quid
ity a
nd c
apita
l res
ourc
esEq
uity
stru
ctur
eRe
sults
of o
pera
tions
Curre
nt li
abili
ties
Non
-cur
rent
liab
ilitie
sCu
rrent
ass
ets
Non
-cur
rent
ass
ets
Chan
ges t
o co
mpa
rativ
e in
form
atio
n
notes to the financial statements
other disclosures
Note
Guarantees2013
Rm
Liability included on
statement of financial position
2013Rm
Guarantees2012
Rm
Liability included on
statement of financial position
2012Rm
56 Guarantees and contingent liabilities
56.1 Guarantees
In respect of EGTL i 4 580 2 207 4 010 1 921 In respect of GTL ventures ii 2 359 – 1 950 – Other performance guarantees iii 2 366 – 782 231 In respect of shale gas ventures iv 4 119 – 6 243 – In respect of natural oil and gas v 1 688 1 163 2 160 1 660 In respect of letter of credit vi 1 602 – 1 541 – In favour of BEE partners vii 278 5 319 8 In respect of German propylene pipeline facility viii 81 – 72 – Guarantee in favour of Sasol Inzalo share transaction ix 4 200 4 200 3 927 3 927 In respect of Natref debt x 1 042 1 042 1 047 1 047 In respect of crude oil purchases xi 1 186 1 186 980 980 In respect of development of retail convenience centres xii 700 700 700 700 In respect of environmental obligations xiii 875 825 756 711 In respect of US bond xiv 9 938 9 938 – – In respect of prospecting rights xv 419 – – – Other guarantees and claims xvi 780 5 812 9
36 213 21 271 25 299 11 194
i. Sasol Limited has issued the following significant guarantees for the obligations of its associate Escravos GTL in Nigeria, including inter alia:
A performance guarantee has been issued in respect of the construction of Escravos GTL for the duration of the investment in the associate to an amount of US$250 million (R2 470 million).
A guarantee has been issued for Sasol’s portion of its commitments in respect of the fiscal arrangements relating to the Escravos GTL project to an amount of US$166 million (R1 638 million). An amount of R1 638 million has been recognised as a provision in this regard.
A provision has been recognised in respect of a performance guarantee related to the construction of Escravos GTL plant for an amount of US$23 million (R222 million).
Other guarantees in respect of EGTL ventures of R250 million.
Note
Guarantees and contingent liabilities 56Commitments under leases 57Related party transactions 58Subsequent events 59Interest in joint ventures 60Financial risk management and financial instruments 61
204
Saso
l ann
ual fi
nanc
ial s
tate
men
ts 2
013
AFS
Sasol Limited group notes to the financials statements other disclosures continued
56 Guarantees and contingent liabilities continued
56.1 Guarantees continued
ii. Sasol Limited has issued the following significant guarantees for the obligations of various of its subsidiaries in respect of the GTL Ventures. These guarantees relate to the construction and funding of ORYX GTL Limited in Qatar, including inter alia:
A guarantee for the take-or-pay obligations of a wholly owned subsidiary has been issued under the gas sale and purchase agreement (GSPA) entered into between ORYX GTL Limited, Qatar Petroleum and ExxonMobil Middle East Gas Marketing Limited, by virtue of this subsidiary’s 49% shareholding in ORYX GTL Limited. Sasol’s exposure is limited to the amount of US$179 million (R1 766 million). In terms of the GSPA, Oryx GTL Limited is contractually committed to purchase minimum volumes of gas from Qatar Petroleum and ExxonMobil Middle East Gas Marketing Limited on a take-or-pay basis. Should ORYX GTL terminate the GSPA prematurely, Sasol Limited’s wholly owned subsidiary will be obliged to take or pay for its 49% share of the contracted gas requirements. The term of the GSPA is 25 years from the date of commencement of operations. The project was commissioned in April 2007.
Sasol Limited issued a performance guarantee for the obligations of its subsidiaries in respect of and for the duration of the investment in Sasol Chevron Holdings Limited, limited to an amount of US$60 million (R593 million). Sasol Chevron Holdings Limited is a joint venture between a wholly owned subsidiary of Sasol Limited and Chevron Corporation.
All guarantees listed above are issued in the normal course of business.
iii. Various performance guarantees issued by subsidiaries. Provisions have been recognised in relation to certain performance guarantees that were issued as part of the licensing of Sasol’s GTL technology and catalyst performance in respect of ORYX GTL. The events that gave rise to these provisions are not expected to have a material effect on the economics of the group’s GTL ventures. Included is a performance guarantee for the Uzbekistan GTL project.
iv. Guarantees of R4 119 million have been issued to Talisman Energy Inc, in respect of the development of the qualifying costs related to the Farrel Creek and Cypress A shale gas assets in Canada.
v. Guarantees have been issued to various financial institutions in respect of the obligations of its subsidiaries (Sasol Petroleum International (Pty) Ltd (SPI) and Republic of Mozambique Pipeline Investment Company (Pty) Ltd (Rompco)) for the natural gas project. The liability on the statement of financial position of R1 163 million represents the gross amount owing by SPI and Rompco to the financial institutions at 30 June 2013.
vi. Various guarantees issued in respect of letters of credit issued by subsidiaries.
vii. In terms of the sale of 25% in Sasol Oil (Pty) Ltd to Tshwarisano LFB Investment (Pty) Ltd (Tshwarisano), facilitation for the financing requirements of Tshwarisano has been provided. The undiscounted exposure at 30 June 2013 amounted to R278 million. A liability for this guarantee at 30 June 2013, amounting to R5 million, has been recognised.
viii. Guarantees issued to various financial institutions in respect of the German propylene pipeline facility.
ix. As part of the Sasol Inzalo share transaction, the C Preference shares issued by the Sasol Inzalo Groups Funding (Pty) Ltd and Sasol Inzalo Public Funding (Pty) Ltd to the financing institutions are secured against a guarantee of R4 200 million.
x. Guarantees issued in favour of various financial institutions in respect of the debt facilities of R1 042 million for the Natref crude oil refinery. The outstanding debt on the statement of financial position was R1 042 million at 30 June 2013.
xi. Sasol Limited issued a guarantee for Sasol Oil International Limited’s (SOIL) term crude oil contract with Saudi Aramco to cover two month’s crude oil commitments.
xii. Guarantees issued to various financial institutions in respect of debt facilities for the establishment of the retail convenience centre network of R700 million. The outstanding debt on the statement of financial position was R700 million at 30 June 2013.
xiii. Guarantees and sureties issued in respect of environmental obligations of R875 million.
xiv. A guarantee has been issued in respect of the US bond which is listed on the New York Stock Exchange issued by its indirect 100% owned finance subsidiary, Sasol Financing International Plc. The outstanding debt on the statement of financial position was R9 938 million on 30 June 2013.
xv. Guarantees issued to Anglo Operations Limited and BHP Billiton Energy Coal South Africa (Pty) Ltd in respect of the outstanding amount under the contract for the purchase of Block IV prospecting rights and prospecting rights documents.
xvi. Included in other guarantees are guarantees for customs and excise of R198 million and R422 million in respect of feedstock purchases.
205 Oth
er d
iscl
osur
esLi
quid
ity a
nd c
apita
l res
ourc
esEq
uity
stru
ctur
eRe
sults
of o
pera
tions
Curre
nt li
abili
ties
Non
-cur
rent
liab
ilitie
sCu
rrent
ass
ets
Non
-cur
rent
ass
ets
Chan
ges t
o co
mpa
rativ
e in
form
atio
n
56 Guarantees and contingent liabilities continued
56.2 Product warranties The group provides product warranties with respect to certain products sold to customers in the ordinary course of business. These warranties typically provide that products sold will conform to specifications. The group generally does not establish a liability for product warranty based on a percentage of turnover or other formula. The group accrues a warranty liability on a transaction-specific basis depending on the individual facts and circumstances related to each sale. Both the liability and the annual expense related to product warranties are immaterial to the consolidated financial statements.
56.3 Other contingenciesSubsidiariesSasol Limited has guaranteed the fulfilment of various subsidiaries’ obligations in terms of contractual agreements.
The group has guaranteed the borrowing facilities and banking arrangements of certain of its subsidiaries.
Mineral rightsAs a result of the promulgation of legislation in South Africa, the common law (mineral rights) and associated statutory competencies of Sasol Mining have been converted to interim statutory rights (Old Order Rights). Sasol Mining is entitled to convert these Old Order Rights to statutory mining and prospecting rights (New Order Rights) after complying with certain statutory requirements. As at 30 June 2013, all applications to acquire prospecting and mining rights were granted by the Department of Minerals Resources (DMR). These rights cover all the prospecting rights in the Free State and Waterberg as well as the prospecting and mining rights in Secunda. No value has been attributed to these rights in the consolidated annual financial statements.
Legal costsLegal costs expected to be incurred in connection with loss contingencies are expensed as incurred.
56.4 LitigationSasol NitroIn 2004, the South African Competition Commission (the Commission) commenced with investigations against Sasol Nitro, a division of Sasol Chemical Industries Limited (SCI), based on complaints levelled against Sasol Nitro by two of its customers, Nutri-Flo and Profert. Both complaints were subsequently referred to the Competition Tribunal (the Tribunal) by the Commission. In May 2009, SCI and the Commission concluded a settlement agreement, in which Sasol Nitro acknowledged that, in the period from 1996 to 2005, it had contravened the Competition Act by fixing prices of certain fertilisers with its competitors, by agreeing with its competitors on the allocation of customers and suppliers and by collusively tendering for supply contracts. Sasol Nitro subsequently paid an administrative penalty of R250,7 million.
Civil claims and law suits totalling approximately R52 million have been instituted against Sasol arising from the admissions made in the settlement agreement. Sasol views the calculation of alleged damages by the plaintiffs as flawed. Sasol is working with an economist on assessing its position on any potential damages caused. The analysis has not been finalised yet. Therefore, it is currently not possible to make an estimate of a contingent liability and accordingly, no provision was made as at 30 June 2013. The period for filing civil claims prescribed on 20 May 2012, therefore no additional claims may be made against Sasol arising from the admitted contraventions.
SasolNitro–complaintreferralbyOmniaOn 31 August 2011, Omnia Group (Pty) Ltd (Omnia) submitted a complaint against SCI to the Commission. The complaint alleged, among other things, excessive pricing for ammonia and price discrimination in respect of ammonia.
On 7 March 2012, the Commission issued a notice of non-referral in respect of the complaint on the grounds that the conduct complained of was substantially the same as the conduct which the Commission had settled on with Sasol in July 2010.
On 5 April 2012, Omnia themselves referred the complaint to the Tribunal. Omnia alleges that SCI charged Omnia an excessive price for ammonia during the period from May 2006 to December 2008 and that SCI has prevented Omnia from expanding within the markets for the supply of certain fertilisers during the period from May 2006 to December 2008 and that SCI has engaged in prohibited price discrimination in respect of ammonia.
SCI does not agree with the allegations made and is defending the matter. The allegations made are substantially similar to allegations in a civil claim for damages made by Omnia in 2009, which SCI is also defending in arbitration proceedings. The competition law complaint, and subsequent referral, have been made by Omnia prior to completing the prosecution of their arbitration claim to completion.
It is currently not possible to make an estimate of a contingent liability from the claim and, accordingly, no provision was made as at 30 June 2013.
206
Saso
l ann
ual fi
nanc
ial s
tate
men
ts 2
013
AFS
Sasol Limited group notes to the financials statements other disclosures continued
56 Guarantees and contingent liabilities continued
56.4 Litigation continued
SasolWaxOn 1 October 2008, following an investigation by the European Commission, the European Union found that members of the European paraffin wax industry, including Sasol Wax GmbH, formed a cartel and violated antitrust laws.
A fine of e318,2 million was imposed by the European Commission on Sasol Wax GmbH (of which Sasol Wax International AG, Sasol Holding in Germany GmbH and Sasol Limited would be jointly and severally liable for e250 million). According to the decision of the European Commission, an infringement of antitrust laws commenced in 1992 or even earlier. In 1995, Sasol became a co-shareholder in an existing wax business located in Hamburg, Germany owned by the Schümann group. In July 2002, Sasol acquired the remaining shares in the joint venture and became the sole shareholder of the business. Sasol was unaware of these infringements before the European Commission commenced their investigation at the wax business in Hamburg in April 2005.
On 15 December 2008, all Sasol companies affected by the decision lodged an appeal with the European Union’s General Court against the decision of the European Commission on the basis that the fine is excessive and should be reduced. On 3 July 2013, the hearing at the Court in Luxemburg took place. The Court has not given any indication to the parties at the hearing of what their legal views are. The next step is a ruling by the Court.
As a result of the fine imposed on Sasol Wax GmbH, on 23 September 2011, Sasol Wax GmbH was served with a law suit in The Netherlands by a company to which potential claims for compensation of damages have been assigned to by eight customers. The law suit does not demand a specific amount. The proceeding is still at an early stage. It is currently not possible to make an estimate of a contingent liability from the claim and, accordingly, no provision was made as at 30 June 2013.
On 30 September 2011, another law suit was lodged with the London High Court by 30 plaintiffs against Sasol Wax GmbH, Sasol Wax International AG and Sasol Holding Germany GmbH. As of June 2013 Sasol settled with all 30 plaintiffs.
Sasol PolymersAs previously disclosed by Sasol, the Commission has been investigating the South African polymers industry. On 12 August 2010, the Commission announced that it had referred its findings to the Tribunal for adjudication.
The complaints that the Commission referred to the Tribunal alleged that SCI had, in the pricing of polypropylene and propylene in the domestic South African market, contravened section 8(a) of the Competition Act (the Act), in that its prices for each of the products were excessive. The referral further alleged that in regard to a formula employed and information exchanged between SCI and Safripol (Pty) Ltd (Safripol) to determine the price of propylene which SCI sold to Safripol, SCI and Safripol had contravened section 4(1)(b)(i) of the Act by engaging in price fixing. The Commission also announced that it had simultaneously reached a settlement with Safripol in which Safripol admitted that the supply agreement between SCI and Safripol and its implementation amounted to the indirect fixing of a price or trading condition in contravention of the Act. This settlement agreement between the Commission and Safripol was confirmed by the Tribunal on 25 August 2010.
On 14 December 2010, Sasol Polymers, a division of SCI, concluded a settlement agreement with the Commission in relation to its existing propylene supply agreement (the Supply Agreement) with Safripol. The Supply Agreement was concluded pursuant to concerns raised by Safripol in relation to the proposed merger in 1993 of Sasol Limited and AECI Limited’s monomer, polymer and certain other chemical operations. To address these concerns, the then Competition Board required a supply agreement, which would ensure Safripol’s ongoing access to propylene according to a pricing formula, which would result in market related prices. At the time, neither party understood this pricing formula to give rise to competition law concerns. The Commission, in terms of the current Competition Act, alleged that the pricing formula, which required the exchange of pricing information amounted to indirect price fixing.
Given the uncertainty surrounding the legal position in relation to the pricing formula and the technicality of the matter, it was considered prudent to settle the matter. Sasol Polymers therefore agreed to pay a penalty of R111,7 million, which represented 3% of Sasol Polymers’ turnover derived from its sale of polypropylene products for its 2009 financial year. The settlement agreement is in full and final settlement of the Commission’s allegations that the pricing formula gave rise to indirect price fixing. The settlement agreement was confirmed by the Tribunal on 24 February 2011.
As mentioned above, the Commission also contended that the prices at which Sasol Polymers supplied propylene and polypropylene were excessive. Sasol Polymers does not agree with the Commission’s position in this regard and is contesting the Commission’s allegations. Consequently, the Commission’s allegations in respect of excessive pricing do not form any part of the settlement agreement concluded between the parties. The results of the excessive pricing investigation by the Commission and the outcome of the hearing by the Tribunal, which commenced on 13 May 2013 and is expected to be closed in October 2013, cannot be determined at present and accordingly, no provision was made at 30 June 2013.
207 Oth
er d
iscl
osur
esLi
quid
ity a
nd c
apita
l res
ourc
esEq
uity
stru
ctur
eRe
sults
of o
pera
tions
Curre
nt li
abili
ties
Non
-cur
rent
liab
ilitie
sCu
rrent
ass
ets
Non
-cur
rent
ass
ets
Chan
ges t
o co
mpa
rativ
e in
form
atio
n
56 Guarantees and contingent liabilities continued
56.4 Litigation continued
Sasol Polymers continued On 31 July 2012, a letter was received from the Commission whereby Sasol was advised that the Commission had initiated a new abuse of dominance complaint against Sasol Limited, Sasol Oil (Pty) Ltd, Sasol Synfuels (Pty) Ltd and SCI. This new complaint is based on a complaint which was initially submitted to the Commission by Safripol in November 2011. The initial Safripol complaint alleged that SCI had contravened various sections of the Act with regard to the pricing and supply of propylene and ethylene. Safripol subsequently withdrew the complaint.
The Commission has however decided to continue with its investigation into the matter. The allegations under investigation are excessive pricing of propylene and ethylene required by Safripol, constructive refusal to supply scarce goods (namely propylene and ethylene), margin squeeze in respect of the supply of propylene and polypropylene and price discrimination in relation to the sale of propylene and ethylene. These are all abuse of dominance allegations. The period of the investigation is from 2008 to date. Sasol continues to defend itself against these allegations. The outcome of this matter cannot be estimated at this point in time and, accordingly, no provision was made at 30 June 2013.
Sasol GasOn 30 October 2009, after being advised that certain provisions in a suite of agreements concluded between Sasol Gas, Coal, Energy and Power Resources Limited (CEPR) and Spring Lights Gas (Pty) Ltd (Spring Lights) constituted contraventions of the Act, Sasol Gas applied for leniency in terms of the Commission’s corporate leniency policy and obtained conditional leniency. Subsequent to Sasol Gas’ leniency application, the Commission investigated the matter and found that provisions in the agreements resulted in fixing of prices and had the effect of dividing the piped gas market by allocating customers and territories. The suite of agreements related to the establishment of Spring Lights as a broad based black economic empowerment (BBBEE) company for the purpose of acquiring a portion of the business of Sasol Gas as part of Sasol’s BBBEE strategy at the time.
On 20 August 2010, Spring Lights concluded a settlement agreement with the Commission in terms of which Spring Lights acknowledged the mentioned contraventions and agreed to pay an administrative penalty of R10,8 million.
Spring Lights had also made an application to the Commission to exempt the conduct set out in these agreements, on the basis that it promoted the ability of small businesses, or firms controlled or owned by historically disadvantaged persons, to become competitive, in terms of section 10 (3)(b)(ii) of the Act. Spring Lights settlement agreement was considered by the Tribunal on 1 September 2010 but the matter was postponed sine die to enable the Commission to make a ruling on the exemption application of Spring Lights. On 26 March 2012, the Commission gazetted its refusal to grant the exemption. On 11 April 2013 the Competition Tribunal confirmed the administrative penalty of R10,8 million which became payable by Spring Lights. There are no liabilities left for Sasol Gas relating to this matter and the Commission has confirmed that Sasol Gas has received full immunity from prosecution. Refer note 59 for the subsequent disposal of the investment in Spring Lights.
SasolOil–CommercialdieselOn 24 October 2012, the Commission referred allegations of price-fixing and market division against Chevron SA, Engen, Shell SA, Total SA, Sasol Limited, BP SA and the South African Petroleum Industry Association (‘SAPIA’) to the Competition Tribunal for adjudication. The Commission is alleging that the respondents exchanged commercially sensitive information, mainly through SAPIA, in order to ensure that their respective prices for commercial diesel followed the Wholesale List Selling Price published by the Department of Energy.
This is not a new matter and Sasol began engaging with the Commission in this regard in 2008 as part of its group-wide competition law compliance review, which preceded the Commission’s investigation into the liquid fuels sector. Sasol has reviewed the Commission’s referral documents and does not agree with the Commission’s allegations. Accordingly, Sasol is defending the matter. The outcome of this referral cannot be estimated at this point in time and, accordingly, no provision was made as at 30 June 2013.
OtherFrom time to time Sasol companies are involved in other litigation and administrative proceedings in the normal course of business. Although the outcome of these proceedings and claims cannot be predicted with certainty, the company does not believe that the outcome of any of these cases would have a material effect on the group’s financial results.
56.5 Competition mattersSasol is continuously evaluating and enhancing its compliance programmes and controls in general, and its competition law compliance programme and controls in particular. As a consequence of these compliance programmes and controls, including monitoring and review activities, Sasol has also adopted appropriate remedial and/or mitigating steps, where necessary or advisable, lodged leniency applications and made disclosures on material findings as and when appropriate. As reported previously, these compliance activities have already revealed, and may still reveal competition law contraventions or potential contraventions in respect of which we have taken, or will take, appropriate remedial and/or mitigating steps including lodging leniency applications.
The Commission is conducting investigations into the South African piped gas, petroleum, fertilisers and polymer industries. Sasol continues to interact and co-operate with the Commission in respect of the subject matter of current leniency applications brought by Sasol, conditional leniency agreements concluded with the Commission, as well as in the areas that are subject to the Commission’s investigations.
208
Saso
l ann
ual fi
nanc
ial s
tate
men
ts 2
013
AFS
Sasol Limited group notes to the financials statements other disclosures continued
56 Guarantees and contingent liabilities continued
56.6 Environmental mattersSasol is subject to loss contingencies pursuant to numerous national and local environmental laws and regulations that regulate the discharge of materials into the environment and that may require Sasol to remediate or rehabilitate the effects of its operations on the environment. The contingencies may exist at a number of sites, including, but not limited to, sites where action has been taken to remediate soil and groundwater contamination. These future costs are not fully determinable due to factors such as the unknown extent of possible contamination, uncertainty regarding the timing and extent of remediation actions that may be required, the allocation of the environmental obligation among multiple parties, the discretion of regulators and changing legal requirements.
Sasol’s environmental obligation accrued at 30 June 2013 was R9 884 million compared to R8 911 million at 30 June 2012. Included in this balance is an amount accrued of approximately R4 397 million in respect of the costs of remediation of soil and groundwater contamination and similar environmental costs. These costs relate to the following activities: site assessments, soil and groundwater clean-up and remediation, and ongoing monitoring. Due to uncertainties regarding future costs the potential loss in excess of the amount accrued cannot be reasonably determined.
Although Sasol has provided for known environmental obligations that are probable and reasonably estimable, the amount of additional future costs relating to remediation and rehabilitation may be material to results of operations in the period in which they are recognised. It is not expected that these environmental obligations will have a material effect on the financial position of the group.
As with the oil and gas and chemical industries generally, compliance with existing and anticipated environmental, health, safety and process safety laws and regulations increases the overall cost of business, including capital costs to construct, maintain, and upgrade equipment and facilities. These laws and regulations have required, and are expected to continue to require, the group to make significant expenditures of both a capital and expense nature.
South AfricaIn South Africa, the environmental regulatory legal framework is still evolving, as is the enforcement process. We work with government authorities in striving to find a balance between economic development and, social and environmental considerations. Recent changes in government resulted in the alignment of departments governing environmental matters. South Africa is considered as a developing country in terms of the Kyoto Protocol under the United Nations Framework Convention on Climate Change and is committed to emission reduction pledges under the voluntary Copenhagen accord which is now incorporated in the National Climate Change Response White Paper.
EuropeOur European facilities are subject to extensive environmental regulation in the various countries in which we operate. For example: The European Union Chemicals Regulation for the registration, evaluation and authorisation of chemicals (REACH) (1907/2006/EC) is intended to harmonise existing European and national regulations to provide a better protection of human health and our environment against the harmful effects of hazardous substances and preparations. Sasol has registered a significant amount of chemical products and will ensure that we continue to comply with the ongoing requirements of REACH.
The countries within which we operate in Europe have all ratified the Kyoto Protocol and we have developed a GHG strategy to comply with applicable GHG restrictions and to manage emission reductions cost effectively.
United StatesSasol North America (Sasol NA), Sasol Wax and Merisol are subject to numerous federal, state, and local laws and regulations that regulate the discharge of materials into the environment or that otherwise relate to the protection of human health and the environment.
Environmental compliance expenditures for our interest in Sasol NA, Sasol Wax and Merisol’s manufacturing sites for the next five years are estimated to range from US$2 million to US$6 million per year.
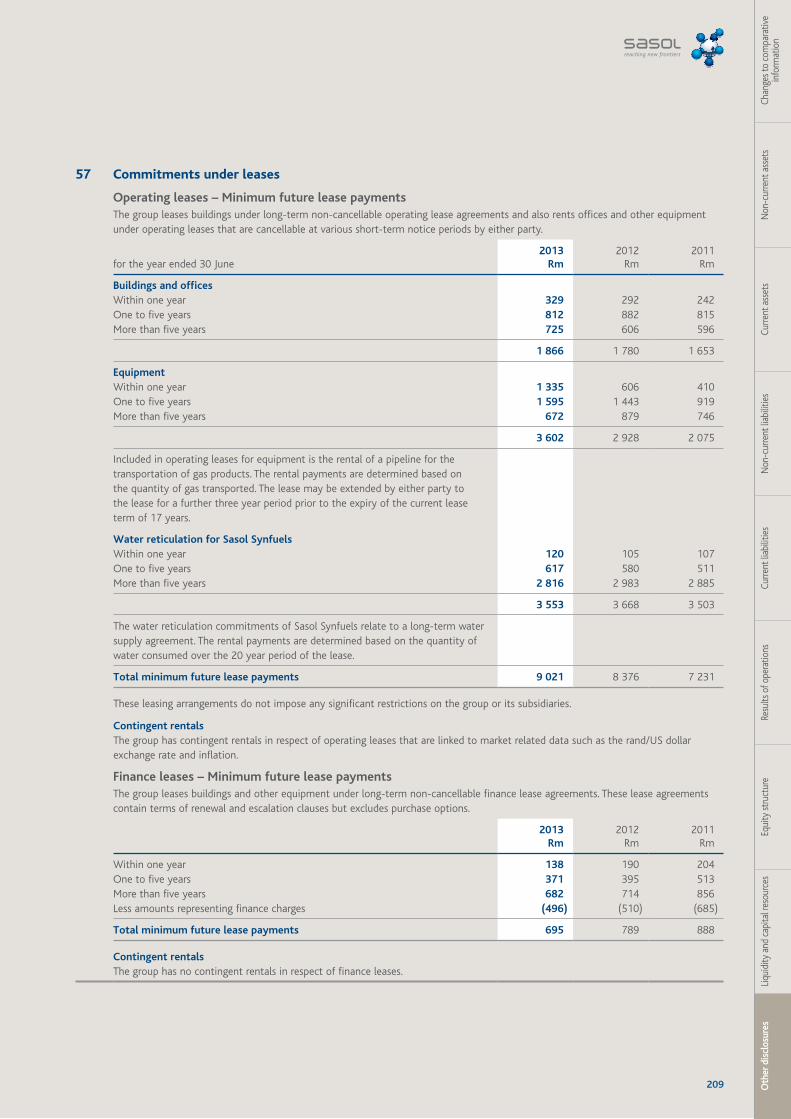
209 Oth
er d
iscl
osur
esLi
quid
ity a
nd c
apita
l res
ourc
esEq
uity
stru
ctur
eRe
sults
of o
pera
tions
Curre
nt li
abili
ties
Non
-cur
rent
liab
ilitie
sCu
rrent
ass
ets
Non
-cur
rent
ass
ets
Chan
ges t
o co
mpa
rativ
e in
form
atio
n
57 Commitments under leases
Operating leases – Minimum future lease paymentsThe group leases buildings under long-term non-cancellable operating lease agreements and also rents offices and other equipment under operating leases that are cancellable at various short-term notice periods by either party.
for the year ended 30 June2013
Rm 2012
Rm 2011
Rm
Buildings and officesWithin one year 329 292 242 One to five years 812 882 815 More than five years 725 606 596
1 866 1 780 1 653
EquipmentWithin one year 1 335 606 410 One to five years 1 595 1 443 919 More than five years 672 879 746
3 602 2 928 2 075
Included in operating leases for equipment is the rental of a pipeline for the transportation of gas products. The rental payments are determined based on the quantity of gas transported. The lease may be extended by either party to the lease for a further three year period prior to the expiry of the current lease term of 17 years.
Water reticulation for Sasol SynfuelsWithin one year 120 105 107 One to five years 617 580 511 More than five years 2 816 2 983 2 885
3 553 3 668 3 503
The water reticulation commitments of Sasol Synfuels relate to a long-term water supply agreement. The rental payments are determined based on the quantity of water consumed over the 20 year period of the lease.
Total minimum future lease payments 9 021 8 376 7 231
These leasing arrangements do not impose any significant restrictions on the group or its subsidiaries.
Contingent rentals The group has contingent rentals in respect of operating leases that are linked to market related data such as the rand/US dollar exchange rate and inflation.
Finance leases – Minimum future lease paymentsThe group leases buildings and other equipment under long-term non-cancellable finance lease agreements. These lease agreements contain terms of renewal and escalation clauses but excludes purchase options.
2013 Rm
2012 Rm
2011 Rm
Within one year 138 190 204 One to five years 371 395 513 More than five years 682 714 856 Less amounts representing finance charges (496) (510) (685)
Total minimum future lease payments 695 789 888
Contingent rentalsThe group has no contingent rentals in respect of finance leases.
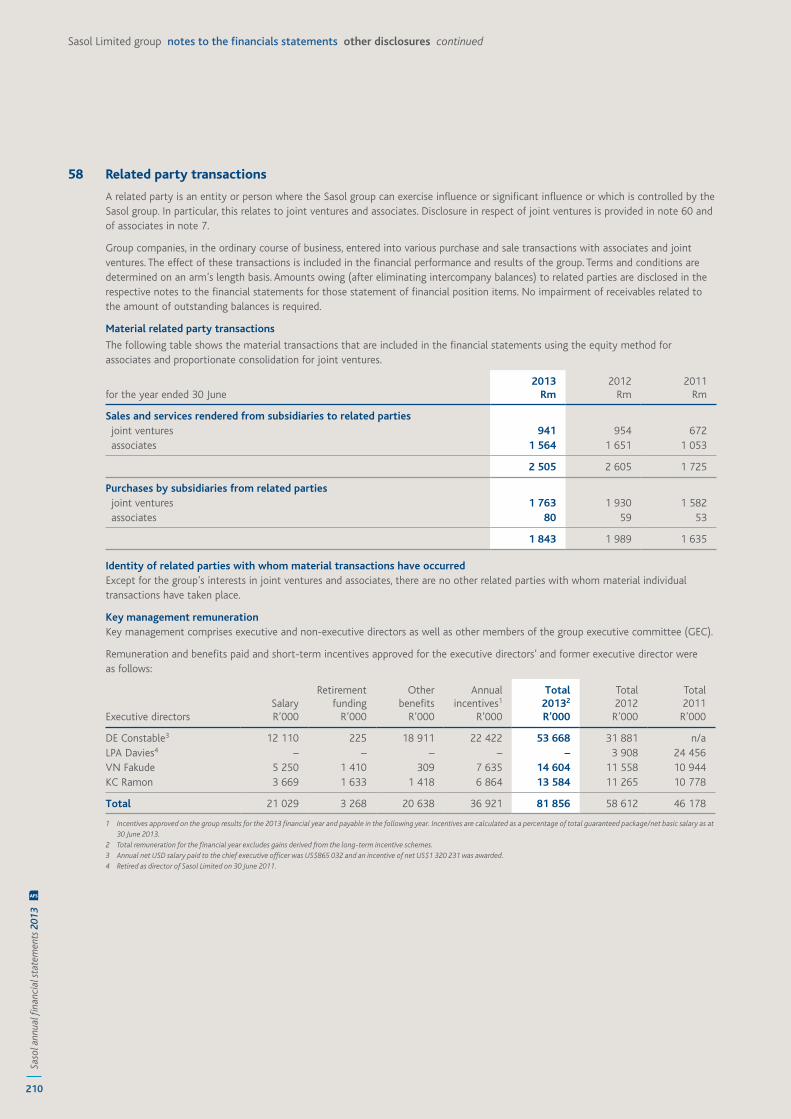
210
Saso
l ann
ual fi
nanc
ial s
tate
men
ts 2
013
AFS
Sasol Limited group notes to the financials statements other disclosures continued
58 Related party transactions
A related party is an entity or person where the Sasol group can exercise influence or significant influence or which is controlled by the Sasol group. In particular, this relates to joint ventures and associates. Disclosure in respect of joint ventures is provided in note 60 and of associates in note 7.
Group companies, in the ordinary course of business, entered into various purchase and sale transactions with associates and joint ventures. The effect of these transactions is included in the financial performance and results of the group. Terms and conditions are determined on an arm’s length basis. Amounts owing (after eliminating intercompany balances) to related parties are disclosed in the respective notes to the financial statements for those statement of financial position items. No impairment of receivables related to the amount of outstanding balances is required.
Material related party transactions
The following table shows the material transactions that are included in the financial statements using the equity method for associates and proportionate consolidation for joint ventures.
for the year ended 30 June2013
Rm 2012
Rm 2011
Rm
Sales and services rendered from subsidiaries to related parties joint ventures 941 954 672 associates 1 564 1 651 1 053
2 505 2 605 1 725
Purchases by subsidiaries from related parties joint ventures 1 763 1 930 1 582 associates 80 59 53
1 843 1 989 1 635
Identity of related parties with whom material transactions have occurredExcept for the group’s interests in joint ventures and associates, there are no other related parties with whom material individual transactions have taken place.
Key management remunerationKey management comprises executive and non-executive directors as well as other members of the group executive committee (GEC).
Remuneration and benefits paid and short-term incentives approved for the executive directors’ and former executive director were as follows:
Executive directorsSalary R’000
Retirement funding
R’000
Other benefits
R’000
Annual incentives1
R’000
Total 20132
R’000
Total 2012
R’000
Total 2011
R’000
DE Constable3 12 110 225 18 911 22 422 53 668 31 881 n/a LPA Davies4 – – – – – 3 908 24 456 VN Fakude 5 250 1 410 309 7 635 14 604 11 558 10 944 KC Ramon 3 669 1 633 1 418 6 864 13 584 11 265 10 778
Total 21 029 3 268 20 638 36 921 81 856 58 612 46 178
1 Incentives approved on the group results for the 2013 financial year and payable in the following year. Incentives are calculated as a percentage of total guaranteed package/net basic salary as at 30 June 2013.
2 Total remuneration for the financial year excludes gains derived from the long-term incentive schemes.3 Annual net USD salary paid to the chief executive officer was US$865 032 and an incentive of net US$1 320 231 was awarded.4 Retired as director of Sasol Limited on 30 June 2011.
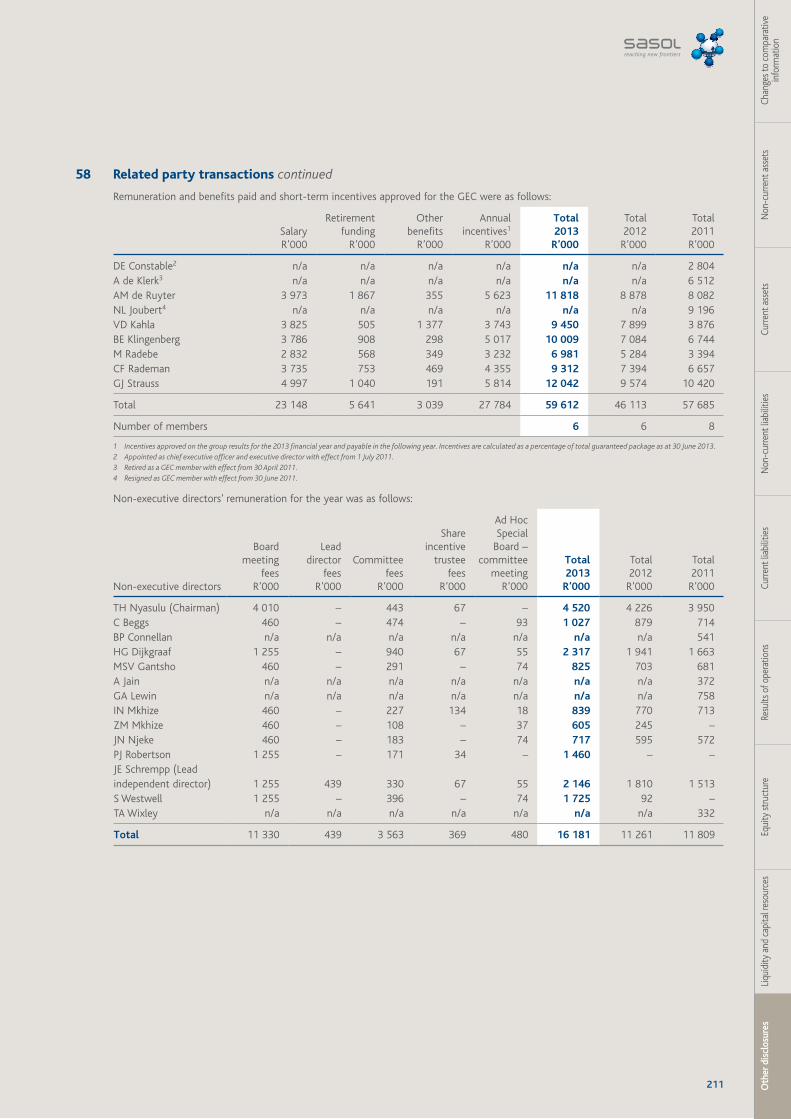
211 Oth
er d
iscl
osur
esLi
quid
ity a
nd c
apita
l res
ourc
esEq
uity
stru
ctur
eRe
sults
of o
pera
tions
Curre
nt li
abili
ties
Non
-cur
rent
liab
ilitie
sCu
rrent
ass
ets
Non
-cur
rent
ass
ets
Chan
ges t
o co
mpa
rativ
e in
form
atio
n
58 Related party transactions continued
Remuneration and benefits paid and short-term incentives approved for the GEC were as follows:
Salary R’000
Retirement funding
R’000
Other benefits
R’000
Annual incentives1
R’000
Total 2013
R’000
Total 2012
R’000
Total 2011
R’000
DE Constable2 n/a n/a n/a n/a n/a n/a 2 804 A de Klerk3 n/a n/a n/a n/a n/a n/a 6 512 AM de Ruyter 3 973 1 867 355 5 623 11 818 8 878 8 082 NL Joubert4 n/a n/a n/a n/a n/a n/a 9 196 VD Kahla 3 825 505 1 377 3 743 9 450 7 899 3 876 BE Klingenberg 3 786 908 298 5 017 10 009 7 084 6 744 M Radebe 2 832 568 349 3 232 6 981 5 284 3 394 CF Rademan 3 735 753 469 4 355 9 312 7 394 6 657 GJ Strauss 4 997 1 040 191 5 814 12 042 9 574 10 420
Total 23 148 5 641 3 039 27 784 59 612 46 113 57 685
Number of members 6 6 8
1 Incentives approved on the group results for the 2013 financial year and payable in the following year. Incentives are calculated as a percentage of total guaranteed package as at 30 June 2013.2 Appointed as chief executive officer and executive director with effect from 1 July 2011.3 Retired as a GEC member with effect from 30 April 2011.4 Resigned as GEC member with effect from 30 June 2011.
Non-executive directors’ remuneration for the year was as follows:
Non-executive directors
Board meeting
feesR’000
Lead director
feesR’000
Committee fees
R’000
Share incentive
trusteefees
R’000
Ad Hoc Special
Board –committee
meetingR’000
Total 2013
R’000
Total2012
R’000
Total2011
R’000
TH Nyasulu (Chairman) 4 010 – 443 67 – 4 520 4 226 3 950 C Beggs 460 – 474 – 93 1 027 879 714 BP Connellan n/a n/a n/a n/a n/a n/a n/a 541 HG Dijkgraaf 1 255 – 940 67 55 2 317 1 941 1 663 MSV Gantsho 460 – 291 – 74 825 703 681 A Jain n/a n/a n/a n/a n/a n/a n/a 372 GA Lewin n/a n/a n/a n/a n/a n/a n/a 758 IN Mkhize 460 – 227 134 18 839 770 713 ZM Mkhize 460 – 108 – 37 605 245 –JN Njeke 460 – 183 – 74 717 595 572 PJ Robertson 1 255 – 171 34 – 1 460 – –JE Schrempp (Lead independent director) 1 255 439 330 67 55 2 146 1 810 1 513 S Westwell 1 255 – 396 – 74 1 725 92 –TA Wixley n/a n/a n/a n/a n/a n/a n/a 332
Total 11 330 439 3 563 369 480 16 181 11 261 11 809
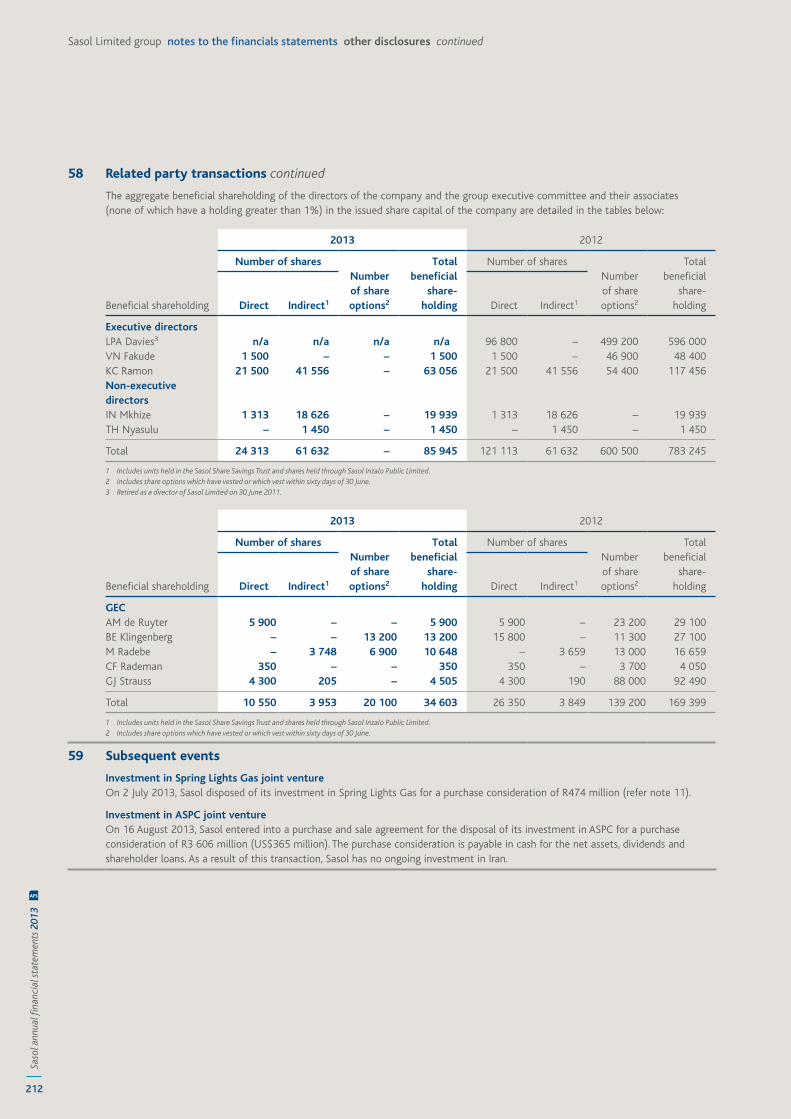
212
Saso
l ann
ual fi
nanc
ial s
tate
men
ts 2
013
AFS
Sasol Limited group notes to the financials statements other disclosures continued
58 Related party transactions continued
The aggregate beneficial shareholding of the directors of the company and the group executive committee and their associates (none of which have a holding greater than 1%) in the issued share capital of the company are detailed in the tables below:
Beneficial shareholding
2013 2012
Number of sharesNumberof shareoptions2
Totalbeneficial
share-holding
Number of sharesNumberof shareoptions2
Totalbeneficial
share-holdingDirect Indirect1 Direct Indirect1
Executive directorsLPA Davies3 n/a n/a n/a n/a 96 800 – 499 200 596 000VN Fakude 1 500 – – 1 500 1 500 – 46 900 48 400 KC Ramon 21 500 41 556 – 63 056 21 500 41 556 54 400 117 456 Non-executive directorsIN Mkhize 1 313 18 626 – 19 939 1 313 18 626 – 19 939 TH Nyasulu – 1 450 – 1 450 – 1 450 – 1 450
Total 24 313 61 632 – 85 945 121 113 61 632 600 500 783 245
1 Includes units held in the Sasol Share Savings Trust and shares held through Sasol Inzalo Public Limited.2 Includes share options which have vested or which vest within sixty days of 30 June.3 Retired as a director of Sasol Limited on 30 June 2011.
Beneficial shareholding
2013 2012
Number of sharesNumberof shareoptions2
Totalbeneficial
share-holding
Number of sharesNumberof shareoptions2
Totalbeneficial
share-holdingDirect Indirect1 Direct Indirect1
GECAM de Ruyter 5 900 – – 5 900 5 900 – 23 200 29 100 BE Klingenberg – – 13 200 13 200 15 800 – 11 300 27 100 M Radebe – 3 748 6 900 10 648 – 3 659 13 000 16 659 CF Rademan 350 – – 350 350 – 3 700 4 050 GJ Strauss 4 300 205 – 4 505 4 300 190 88 000 92 490
Total 10 550 3 953 20 100 34 603 26 350 3 849 139 200 169 399
1 Includes units held in the Sasol Share Savings Trust and shares held through Sasol Inzalo Public Limited.2 Includes share options which have vested or which vest within sixty days of 30 June.
59 Subsequent events
Investment in Spring Lights Gas joint ventureOn 2 July 2013, Sasol disposed of its investment in Spring Lights Gas for a purchase consideration of R474 million (refer note 11).
Investment in ASPC joint ventureOn 16 August 2013, Sasol entered into a purchase and sale agreement for the disposal of its investment in ASPC for a purchase consideration of R3 606 million (US$365 million). The purchase consideration is payable in cash for the net assets, dividends and shareholder loans. As a result of this transaction, Sasol has no ongoing investment in Iran.
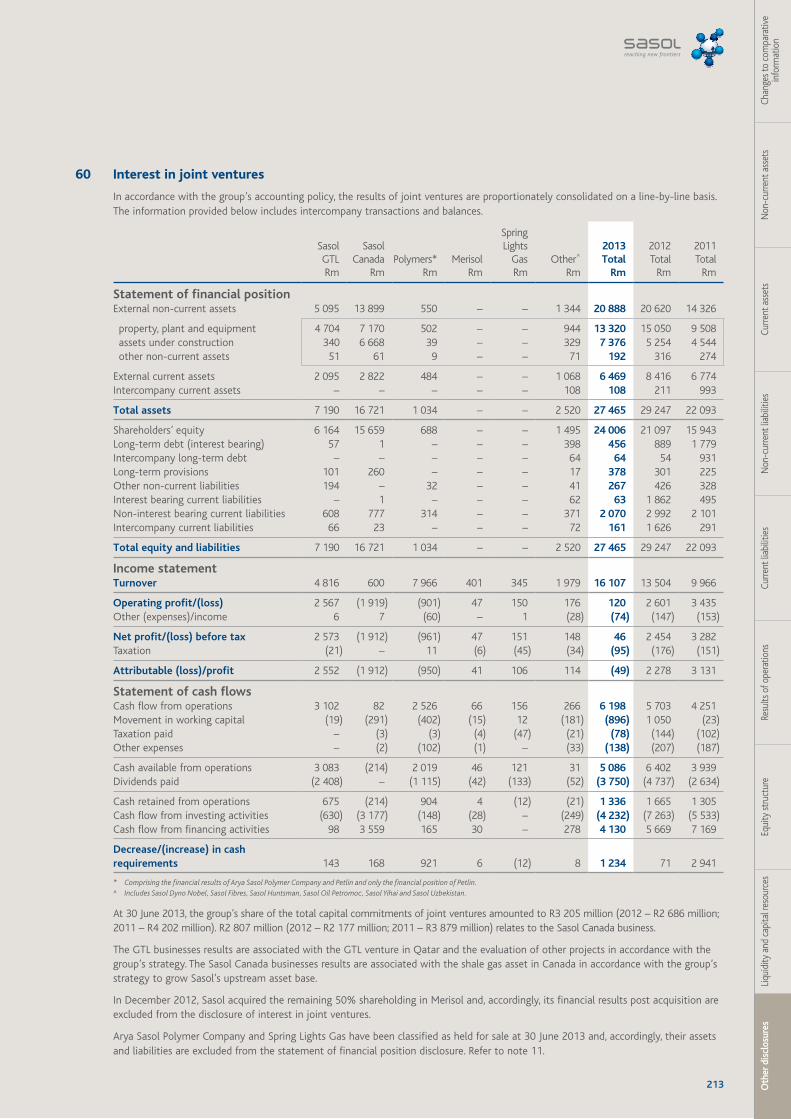
213 Oth
er d
iscl
osur
esLi
quid
ity a
nd c
apita
l res
ourc
esEq
uity
stru
ctur
eRe
sults
of o
pera
tions
Curre
nt li
abili
ties
Non
-cur
rent
liab
ilitie
sCu
rrent
ass
ets
Non
-cur
rent
ass
ets
Chan
ges t
o co
mpa
rativ
e in
form
atio
n
60 Interest in joint ventures
In accordance with the group’s accounting policy, the results of joint ventures are proportionately consolidated on a line-by-line basis. The information provided below includes intercompany transactions and balances.
Sasol GTLRm
Sasol Canada
RmPolymers*
RmMerisol
Rm
Spring Lights
GasRm
Other^
Rm
2013 Total
Rm
2012 Total
Rm
2011 Total
Rm
Statement of financial positionExternal non-current assets 5 095 13 899 550 – – 1 344 20 888 20 620 14 326
property, plant and equipment 4 704 7 170 502 – – 944 13 320 15 050 9 508 assets under construction 340 6 668 39 – – 329 7 376 5 254 4 544 other non-current assets 51 61 9 – – 71 192 316 274
External current assets 2 095 2 822 484 – – 1 068 6 469 8 416 6 774 Intercompany current assets – – – – – 108 108 211 993
Total assets 7 190 16 721 1 034 – – 2 520 27 465 29 247 22 093
Shareholders’ equity 6 164 15 659 688 – – 1 495 24 006 21 097 15 943 Long-term debt (interest bearing) 57 1 – – – 398 456 889 1 779 Intercompany long-term debt – – – – – 64 64 54 931 Long-term provisions 101 260 – – – 17 378 301 225 Other non-current liabilities 194 – 32 – – 41 267 426 328 Interest bearing current liabilities – 1 – – – 62 63 1 862 495 Non-interest bearing current liabilities 608 777 314 – – 371 2 070 2 992 2 101 Intercompany current liabilities 66 23 – – – 72 161 1 626 291
Total equity and liabilities 7 190 16 721 1 034 – – 2 520 27 465 29 247 22 093
Income statementTurnover 4 816 600 7 966 401 345 1 979 16 107 13 504 9 966
Operating profit/(loss) 2 567 (1 919) (901) 47 150 176 120 2 601 3 435 Other (expenses)/income 6 7 (60) – 1 (28) (74) (147) (153)
Net profit/(loss) before tax 2 573 (1 912) (961) 47 151 148 46 2 454 3 282 Taxation (21) – 11 (6) (45) (34) (95) (176) (151)
Attributable (loss)/profit 2 552 (1 912) (950) 41 106 114 (49) 2 278 3 131
Statement of cash flowsCash flow from operations 3 102 82 2 526 66 156 266 6 198 5 703 4 251 Movement in working capital (19) (291) (402) (15) 12 (181) (896) 1 050 (23)Taxation paid – (3) (3) (4) (47) (21) (78) (144) (102)Other expenses – (2) (102) (1) – (33) (138) (207) (187)
Cash available from operations 3 083 (214) 2 019 46 121 31 5 086 6 402 3 939 Dividends paid (2 408) – (1 115) (42) (133) (52) (3 750) (4 737) (2 634)
Cash retained from operations 675 (214) 904 4 (12) (21) 1 336 1 665 1 305 Cash flow from investing activities (630) (3 177) (148) (28) – (249) (4 232) (7 263) (5 533)Cash flow from financing activities 98 3 559 165 30 – 278 4 130 5 669 7 169
Decrease/(increase) in cash requirements 143 168 921 6 (12) 8 1 234 71 2 941
* Comprising the financial results of Arya Sasol Polymer Company and Petlin and only the financial position of Petlin.^ Includes Sasol Dyno Nobel, Sasol Fibres, Sasol Huntsman, Sasol Oil Petromoc, Sasol Yihai and Sasol Uzbekistan.
At 30 June 2013, the group’s share of the total capital commitments of joint ventures amounted to R3 205 million (2012 – R2 686 million; 2011 – R4 202 million). R2 807 million (2012 – R2 177 million; 2011 – R3 879 million) relates to the Sasol Canada business.
The GTL businesses results are associated with the GTL venture in Qatar and the evaluation of other projects in accordance with the group’s strategy. The Sasol Canada businesses results are associated with the shale gas asset in Canada in accordance with the group’s strategy to grow Sasol’s upstream asset base.
In December 2012, Sasol acquired the remaining 50% shareholding in Merisol and, accordingly, its financial results post acquisition are excluded from the disclosure of interest in joint ventures.
Arya Sasol Polymer Company and Spring Lights Gas have been classified as held for sale at 30 June 2013 and, accordingly, their assets and liabilities are excluded from the statement of financial position disclosure. Refer to note 11.
214
Saso
l ann
ual fi
nanc
ial s
tate
men
ts 2
013
AFS
Sasol Limited group notes to the financials statements other disclosures continued
61 Financial risk management and financial instruments
IntroductionThe group is exposed in varying degrees to a variety of financial instrument related risks. The group executive committee (GEC) has the overall responsibility for the establishment and oversight of the group’s risk management framework. The board of directors established the risk and safety, health and environment committee, which is responsible for providing the board of directors with the assurance that significant business risks are systematically identified, assessed and reduced to acceptable levels. A comprehensive risk management process has been developed to continuously monitor and control these risks. The Sasol group has a central treasury function that manages the financial risks relating to the group’s operations. The group business committee, a sub-committee of the GEC consisting of the managing directors of the business units and functional core representatives, meets regularly to review and, if appropriate, approve the implementation of optimal strategies for the effective management of financial risks. The committee reports on a regular basis to the GEC on its activities.
Capital risk managementThe group’s objectives when managing capital (which includes share capital, borrowings, working capital and cash and cash equivalents) are to maintain a flexible capital structure that reduces the cost of capital to an acceptable level of risk, to safeguard the group’s ability to continue as a going concern while taking advantage of strategic opportunities in order to provide sustainable returns for shareholders and benefits to the stakeholders.
The group manages the capital structure and makes adjustments to it in light of changes in economic conditions and the risk characteristics of the underlying assets. In order to maintain the capital structure, the group may adjust the amount of dividends paid to shareholders, return capital to shareholders, repurchase shares currently issued, issue new shares, issue new debt, issue new debt to replace existing debt with different characteristics and/or sell assets to reduce debt.
The group monitors capital utilising a number of measures, including the gearing ratio. The gearing ratio is calculated as net borrowings (total borrowings less cash) divided by shareholders’ equity. The gearing level takes into account the group’s substantial capital investment and susceptibility to external market factors such as crude oil prices, exchange rates and commodity chemical prices. In 2009, the targeted gearing ratio was lowered to 20% – 40% from the previous range of 30% – 50%. The group’s gearing level for 2013 is (0,31) % (2012 – 2,7%; 2011 – 1,3%). The gearing ratio is expected to return to the targeted range as the capital expansion programme progresses in the medium- to long-term horizon.
Financing riskFinancing risk refers to the risk that financing of the group’s capital requirements and refinancing of existing borrowings could become more difficult or more costly in the future. This risk can be decreased by achieving the targeted gearing ratio, ensuring that maturity dates are evenly distributed over time, and that total short-term borrowings do not exceed liquidity levels. The group’s target for long-term borrowings include an average time to maturity of at least 2 years, and an even spread of maturities.
Credit ratingTo achieve and keep an efficient capital structure, the group aims to maintain a stable long-term credit rating.
Risk profileRisk management and measurement relating to each of these risks is discussed under the headings below (subcategorised into credit risk, liquidity risk and market risk) which entails an analysis of the types of risk exposure, the way in which such exposure is managed and quantification of the level of exposure in the statement of financial position. The group’s objective in using derivative instruments is for hedging purposes to reduce the uncertainty over future cash flows arising from foreign currency, interest rate and commodity price risk exposures.
215 Oth
er d
iscl
osur
esLi
quid
ity a
nd c
apita
l res
ourc
esEq
uity
stru
ctur
eRe
sults
of o
pera
tions
Curre
nt li
abili
ties
Non
-cur
rent
liab
ilitie
sCu
rrent
ass
ets
Non
-cur
rent
ass
ets
Chan
ges t
o co
mpa
rativ
e in
form
atio
n
61 Financial risk management and financial instruments continued
Credit risk Credit risk, or the risk of financial loss due to counterparties not meeting their contractual obligations, is managed by the application of credit approvals, limits and monitoring procedures. Where appropriate, the group obtains security in the form of guarantees to mitigate risk. Counterparty credit limits are in place and are reviewed and approved by the respective subsidiary credit management committees. The central treasury function provides credit risk management for the group-wide exposure in respect of a diversified group of banks and other financial institutions. These are evaluated regularly for financial robustness especially in the current global economic environment. Management has evaluated treasury counterparty risk and does not expect any treasury counterparties to fail in meeting their obligations.
Trade and other receivables consists of a large number of customers spread across diverse industries and geographical areas. The exposure to credit risk is influenced by the individual characteristics, the industry and geographical area of the counterparty with whom we have transacted. Trade and other receivables are carefully monitored for impairment. An allowance for impairment of trade receivables is made where there is an identified loss event, which based on previous experience, is evidence of a reduction in the recoverability of the cash flows. Details of the credit quality of trade receivables and the associated provision for impairment is disclosed in note 13.
No single customer represents more than 10% of the group’s total turnover or more than 10% of total trade receivables for the years ended 30 June 2013, 2012 and 2011. Approximately 49% (2012 – 50%; 2011 – 49%) of the group’s total turnover is generated from sales within South Africa, while about 22% (2012 – 23%; 2011 – 23%) relates to European sales. Approximately 49% (2012 – 48%; 2011 – 47%) of the amount owing in respect of trade receivables is from counterparties in South Africa, while European receivables amount to about 26% (2012 – 24%; 2011 – 28%).
Long-term receivables consists of debtors located mainly in South Africa, Rest of Africa and Europe. The long-term receivables relate mainly to deposits on office rental space in terms of various operating lease agreements and amounts related to the investment in Escravos gas-to-liquids. These amounts are carefully monitored for impairment. Impairments are recognised when there is an identified loss event, which based on previous experience, is evidence of a reduction in the recoverability of the cash flows. The credit quality assessment indicated that none of the long-term receivables where past their due date.
Credit risk exposure in respect of long-term receivables and trade receivables is further analysed in notes 9 and 13, respectively. The carrying value represents the maximum credit risk exposure.
The group has provided guarantees for the financial obligations of subsidiaries, joint-ventures and third parties. The outstanding guarantees at 30 June 2013 are provided in note 56.
Liquidity riskLiquidity risk is the risk that an entity in the group will be unable to meet its obligations as they become due. The group manages liquidity risk by effectively managing its working capital, capital expenditure and cash flows, making use of a central treasury function to manage pooled business unit cash investments and borrowing requirements. Currently the group is maintaining a positive cash position, conserving the group’s cash resources through renewed focus on working capital improvement and capital reprioritisation. The group meets its financing requirements through a mixture of cash generated from its operations and, short- and long-term borrowings. Adequate banking facilities and reserve borrowing capacities are maintained. The Sasol group is in compliance with all of the financial covenants per its loan agreements, none of which is expected to present a material restriction on funding or its investment policy in the near future. The group has sufficient undrawn borrowing facilities, which could be utilised to settle obligations.
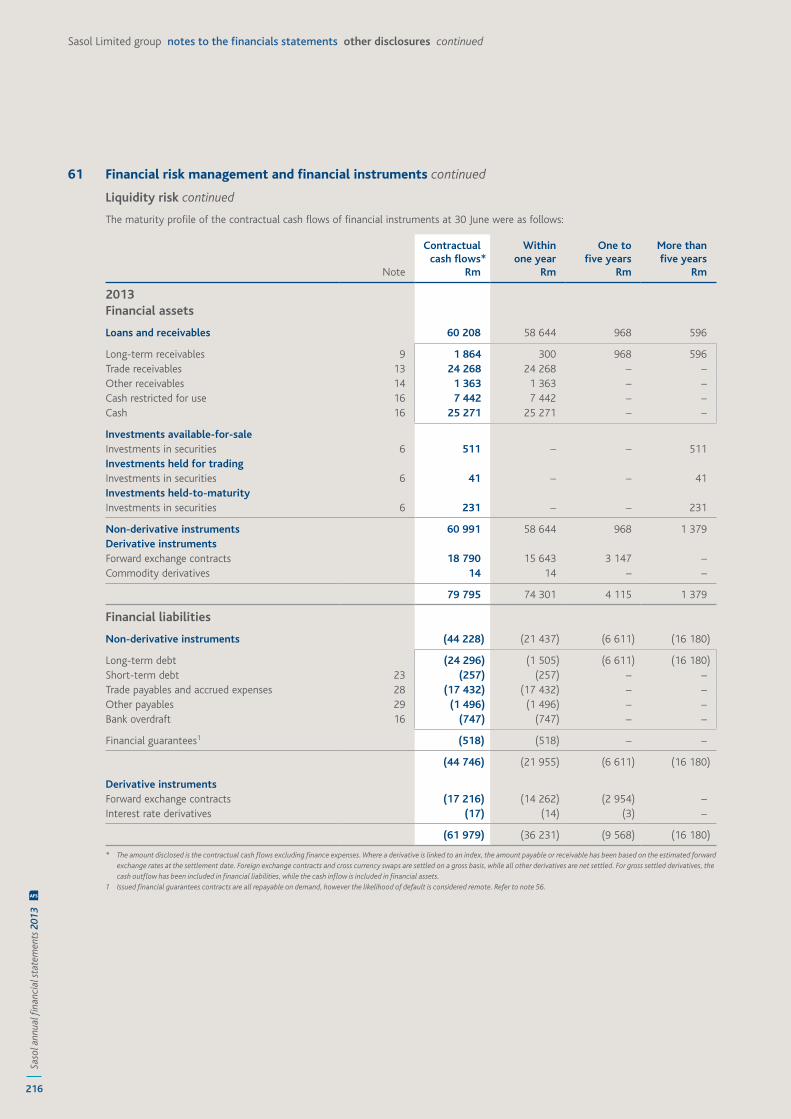
216
Saso
l ann
ual fi
nanc
ial s
tate
men
ts 2
013
AFS
Sasol Limited group notes to the financials statements other disclosures continued
61 Financial risk management and financial instruments continued
Liquidity risk continued
The maturity profile of the contractual cash flows of financial instruments at 30 June were as follows:
Note
Contractual cash flows*
Rm
Within one year
Rm
One to five years
Rm
More than five years
Rm
2013Financial assets
Loans and receivables 60 208 58 644 968 596
Long-term receivables 9 1 864 300 968 596 Trade receivables 13 24 268 24 268 – –Other receivables 14 1 363 1 363 – –Cash restricted for use 16 7 442 7 442 – –Cash 16 25 271 25 271 – –
Investments available-for-saleInvestments in securities 6 511 – – 511 Investments held for tradingInvestments in securities 6 41 – – 41 Investments held-to-maturityInvestments in securities 6 231 – – 231
Non-derivative instruments 60 991 58 644 968 1 379Derivative instrumentsForward exchange contracts 18 790 15 643 3 147 –Commodity derivatives 14 14 – –
79 795 74 301 4 115 1 379
Financial liabilities
Non-derivative instruments (44 228) (21 437) (6 611) (16 180)
Long-term debt (24 296) (1 505) (6 611) (16 180)Short-term debt 23 (257) (257) – –Trade payables and accrued expenses 28 (17 432) (17 432) – –Other payables 29 (1 496) (1 496) – –Bank overdraft 16 (747) (747) – –
Financial guarantees1 (518) (518) – –
(44 746) (21 955) (6 611) (16 180)
Derivative instrumentsForward exchange contracts (17 216) (14 262) (2 954) –Interest rate derivatives (17) (14) (3) –
(61 979) (36 231) (9 568) (16 180)
* The amount disclosed is the contractual cash flows excluding finance expenses. Where a derivative is linked to an index, the amount payable or receivable has been based on the estimated forward exchange rates at the settlement date. Foreign exchange contracts and cross currency swaps are settled on a gross basis, while all other derivatives are net settled. For gross settled derivatives, the cash outflow has been included in financial liabilities, while the cash inflow is included in financial assets.
1 Issued financial guarantees contracts are all repayable on demand, however the likelihood of default is considered remote. Refer to note 56.
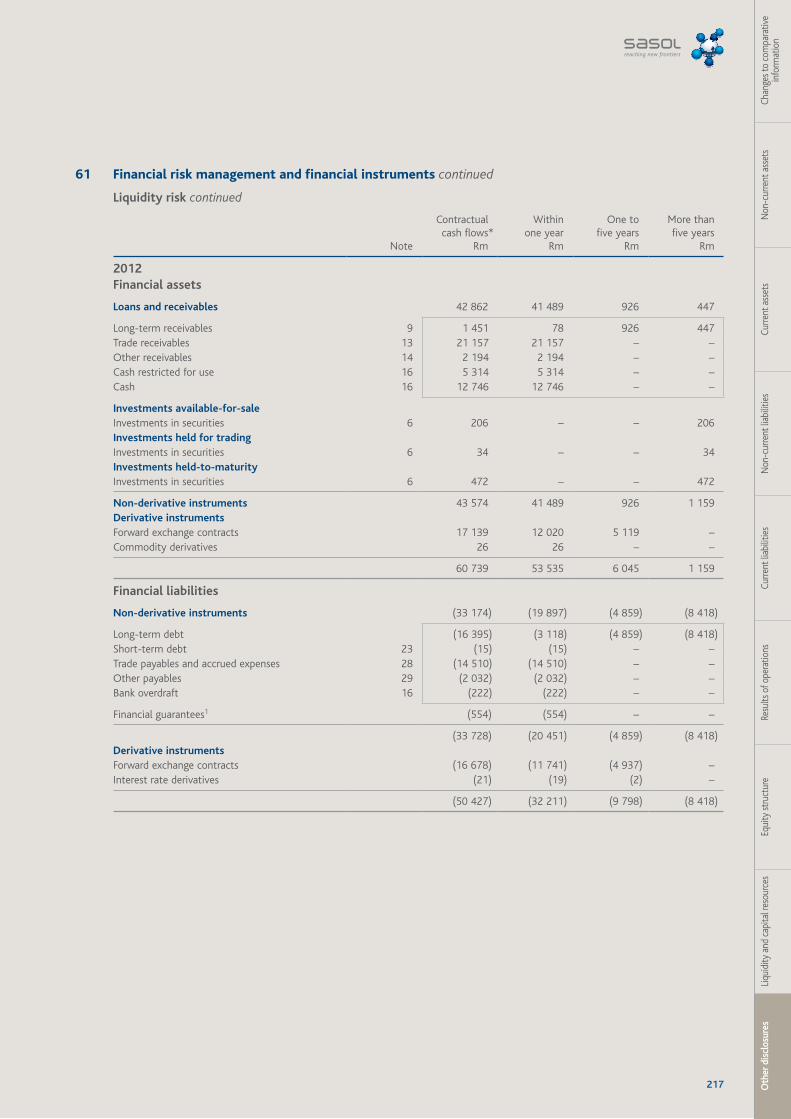
217 Oth
er d
iscl
osur
esLi
quid
ity a
nd c
apita
l res
ourc
esEq
uity
stru
ctur
eRe
sults
of o
pera
tions
Curre
nt li
abili
ties
Non
-cur
rent
liab
ilitie
sCu
rrent
ass
ets
Non
-cur
rent
ass
ets
Chan
ges t
o co
mpa
rativ
e in
form
atio
n
61 Financial risk management and financial instruments continued
Liquidity risk continued
Note
Contractual cash flows*
Rm
Within one year
Rm
One to five years
Rm
More thanfive years
Rm
2012Financial assets
Loans and receivables 42 862 41 489 926 447
Long-term receivables 9 1 451 78 926 447 Trade receivables 13 21 157 21 157 – –Other receivables 14 2 194 2 194 – –Cash restricted for use 16 5 314 5 314 – –Cash 16 12 746 12 746 – –
Investments available-for-saleInvestments in securities 6 206 – – 206 Investments held for tradingInvestments in securities 6 34 – – 34 Investments held-to-maturityInvestments in securities 6 472 – – 472
Non-derivative instruments 43 574 41 489 926 1 159 Derivative instrumentsForward exchange contracts 17 139 12 020 5 119 –Commodity derivatives 26 26 – –
60 739 53 535 6 045 1 159
Financial liabilities
Non-derivative instruments (33 174) (19 897) (4 859) (8 418)
Long-term debt (16 395) (3 118) (4 859) (8 418)Short-term debt 23 (15) (15) – –Trade payables and accrued expenses 28 (14 510) (14 510) – –Other payables 29 (2 032) (2 032) – –Bank overdraft 16 (222) (222) – –
Financial guarantees1 (554) (554) – –
(33 728) (20 451) (4 859) (8 418) Derivative instrumentsForward exchange contracts (16 678) (11 741) (4 937) –Interest rate derivatives (21) (19) (2) –
(50 427) (32 211) (9 798) (8 418)
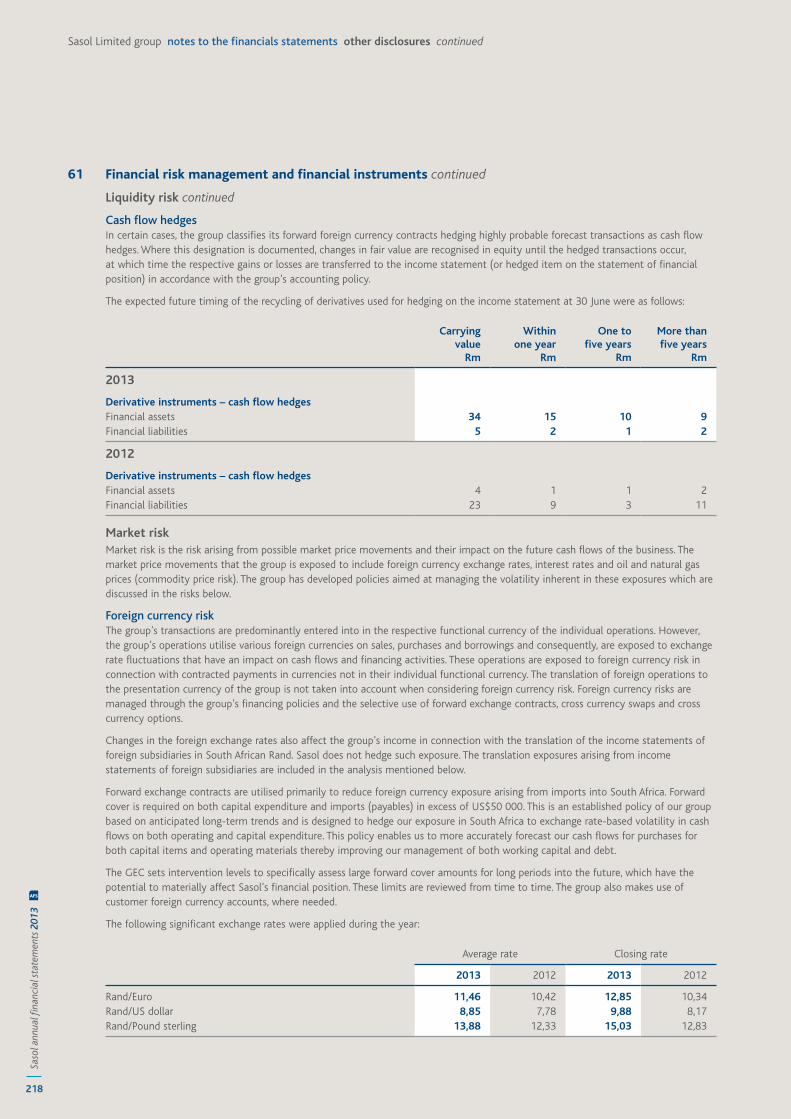
218
Saso
l ann
ual fi
nanc
ial s
tate
men
ts 2
013
AFS
Sasol Limited group notes to the financials statements other disclosures continued
61 Financial risk management and financial instruments continued
Liquidity risk continued
Cash flow hedgesIn certain cases, the group classifies its forward foreign currency contracts hedging highly probable forecast transactions as cash flow hedges. Where this designation is documented, changes in fair value are recognised in equity until the hedged transactions occur, at which time the respective gains or losses are transferred to the income statement (or hedged item on the statement of financial position) in accordance with the group’s accounting policy.
The expected future timing of the recycling of derivatives used for hedging on the income statement at 30 June were as follows:
Carrying value
Rm
Within one year
Rm
One to five years
Rm
More than five years
Rm
2013
Derivative instruments – cash flow hedgesFinancial assets 34 15 10 9 Financial liabilities 5 2 1 2
2012
Derivative instruments – cash flow hedgesFinancial assets 4 1 1 2Financial liabilities 23 9 3 11
Market riskMarket risk is the risk arising from possible market price movements and their impact on the future cash flows of the business. The market price movements that the group is exposed to include foreign currency exchange rates, interest rates and oil and natural gas prices (commodity price risk). The group has developed policies aimed at managing the volatility inherent in these exposures which are discussed in the risks below.
Foreign currency riskThe group’s transactions are predominantly entered into in the respective functional currency of the individual operations. However, the group’s operations utilise various foreign currencies on sales, purchases and borrowings and consequently, are exposed to exchange rate fluctuations that have an impact on cash flows and financing activities. These operations are exposed to foreign currency risk in connection with contracted payments in currencies not in their individual functional currency. The translation of foreign operations to the presentation currency of the group is not taken into account when considering foreign currency risk. Foreign currency risks are managed through the group’s financing policies and the selective use of forward exchange contracts, cross currency swaps and cross currency options.
Changes in the foreign exchange rates also affect the group’s income in connection with the translation of the income statements of foreign subsidiaries in South African Rand. Sasol does not hedge such exposure. The translation exposures arising from income statements of foreign subsidiaries are included in the analysis mentioned below.
Forward exchange contracts are utilised primarily to reduce foreign currency exposure arising from imports into South Africa. Forward cover is required on both capital expenditure and imports (payables) in excess of US$50 000. This is an established policy of our group based on anticipated long-term trends and is designed to hedge our exposure in South Africa to exchange rate-based volatility in cash flows on both operating and capital expenditure. This policy enables us to more accurately forecast our cash flows for purchases for both capital items and operating materials thereby improving our management of both working capital and debt.
The GEC sets intervention levels to specifically assess large forward cover amounts for long periods into the future, which have the potential to materially affect Sasol’s financial position. These limits are reviewed from time to time. The group also makes use of customer foreign currency accounts, where needed.
The following significant exchange rates were applied during the year:
Average rate Closing rate
2013 2012 2013 2012
Rand/Euro 11,46 10,42 12,85 10,34 Rand/US dollar 8,85 7,78 9,88 8,17 Rand/Pound sterling 13,88 12,33 15,03 12,83
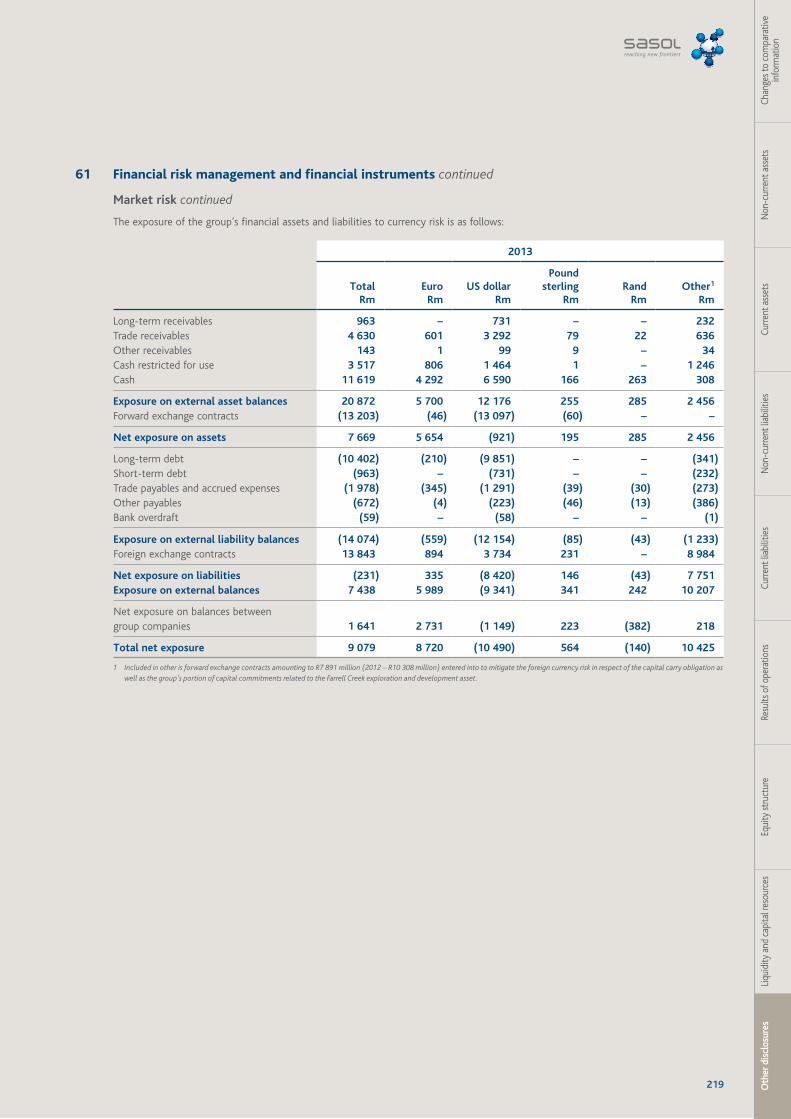
219 Oth
er d
iscl
osur
esLi
quid
ity a
nd c
apita
l res
ourc
esEq
uity
stru
ctur
eRe
sults
of o
pera
tions
Curre
nt li
abili
ties
Non
-cur
rent
liab
ilitie
sCu
rrent
ass
ets
Non
-cur
rent
ass
ets
Chan
ges t
o co
mpa
rativ
e in
form
atio
n
61 Financial risk management and financial instruments continued
Market risk continued
The exposure of the group’s financial assets and liabilities to currency risk is as follows:
2013
TotalRm
EuroRm
US dollarRm
Pound sterling
Rm Rand
Rm Other1
Rm
Long-term receivables 963 – 731 – – 232 Trade receivables 4 630 601 3 292 79 22 636 Other receivables 143 1 99 9 – 34 Cash restricted for use 3 517 806 1 464 1 – 1 246 Cash 11 619 4 292 6 590 166 263 308
Exposure on external asset balances 20 872 5 700 12 176 255 285 2 456 Forward exchange contracts (13 203) (46) (13 097) (60) – –
Net exposure on assets 7 669 5 654 (921) 195 285 2 456
Long-term debt (10 402) (210) (9 851) – – (341) Short-term debt (963) – (731) – – (232) Trade payables and accrued expenses (1 978) (345) (1 291) (39) (30) (273) Other payables (672) (4) (223) (46) (13) (386) Bank overdraft (59) – (58) – – (1)
Exposure on external liability balances (14 074) (559) (12 154) (85) (43) (1 233) Foreign exchange contracts 13 843 894 3 734 231 – 8 984
Net exposure on liabilities (231) 335 (8 420) 146 (43) 7 751 Exposure on external balances 7 438 5 989 (9 341) 341 242 10 207
Net exposure on balances between group companies 1 641 2 731 (1 149) 223 (382) 218
Total net exposure 9 079 8 720 (10 490) 564 (140) 10 425
1 Included in other is forward exchange contracts amounting to R7 891 million (2012 – R10 308 million) entered into to mitigate the foreign currency risk in respect of the capital carry obligation as well as the group’s portion of capital commitments related to the Farrell Creek exploration and development asset.
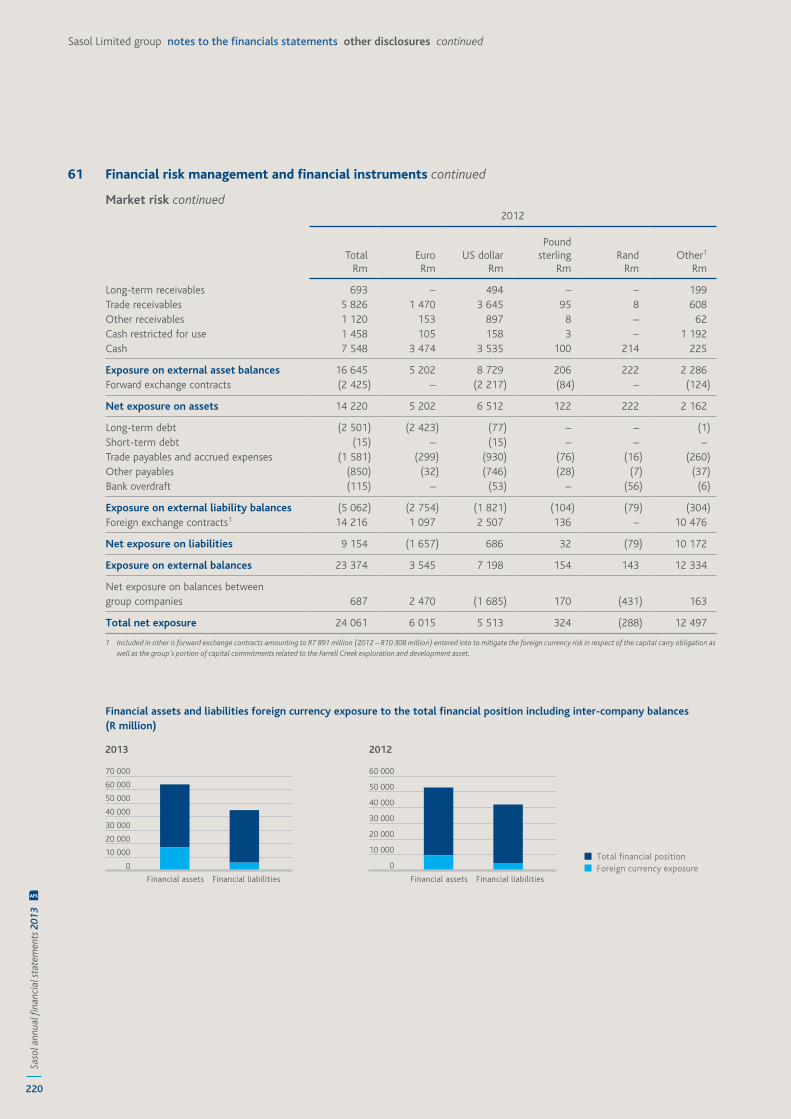
220
Saso
l ann
ual fi
nanc
ial s
tate
men
ts 2
013
AFS
Sasol Limited group notes to the financials statements other disclosures continued
61 Financial risk management and financial instruments continued
Market risk continued2012
TotalRm
EuroRm
US dollarRm
Pound sterling
Rm Rand
Rm Other1
Rm
Long-term receivables 693 – 494 – – 199 Trade receivables 5 826 1 470 3 645 95 8 608 Other receivables 1 120 153 897 8 – 62 Cash restricted for use 1 458 105 158 3 – 1 192 Cash 7 548 3 474 3 535 100 214 225
Exposure on external asset balances 16 645 5 202 8 729 206 222 2 286 Forward exchange contracts (2 425) – (2 217) (84) – (124)
Net exposure on assets 14 220 5 202 6 512 122 222 2 162
Long-term debt (2 501) (2 423) (77) – – (1) Short-term debt (15) – (15) – – –Trade payables and accrued expenses (1 581) (299) (930) (76) (16) (260) Other payables (850) (32) (746) (28) (7) (37) Bank overdraft (115) – (53) – (56) (6)
Exposure on external liability balances (5 062) (2 754) (1 821) (104) (79) (304) Foreign exchange contracts1 14 216 1 097 2 507 136 – 10 476
Net exposure on liabilities 9 154 (1 657) 686 32 (79) 10 172
Exposure on external balances 23 374 3 545 7 198 154 143 12 334
Net exposure on balances between group companies 687 2 470 (1 685) 170 (431) 163
Total net exposure 24 061 6 015 5 513 324 (288) 12 497
1 Included in other is forward exchange contracts amounting to R7 891 million (2012 – R10 308 million) entered into to mitigate the foreign currency risk in respect of the capital carry obligation as well as the group’s portion of capital commitments related to the Farrell Creek exploration and development asset.
Financial assets and liabilities foreign currency exposure to the total financial position including inter-company balances (R million)
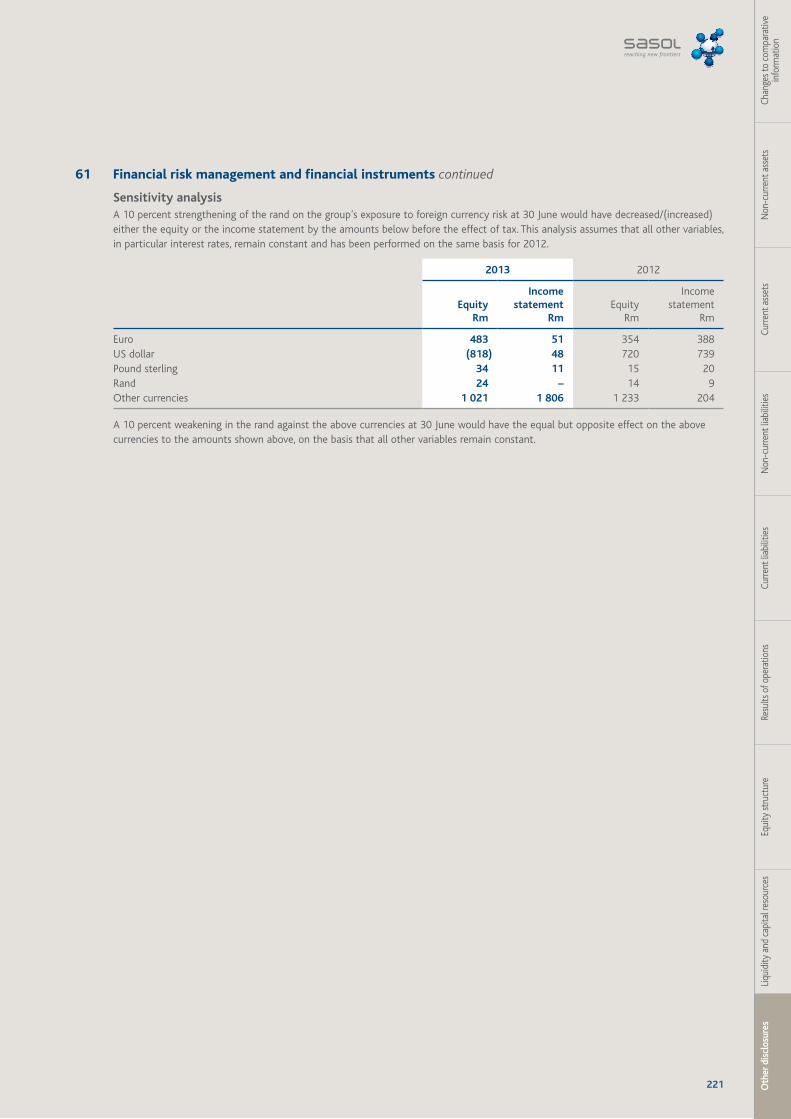
221 Oth
er d
iscl
osur
esLi
quid
ity a
nd c
apita
l res
ourc
esEq
uity
stru
ctur
eRe
sults
of o
pera
tions
Curre
nt li
abili
ties
Non
-cur
rent
liab
ilitie
sCu
rrent
ass
ets
Non
-cur
rent
ass
ets
Chan
ges t
o co
mpa
rativ
e in
form
atio
n
61 Financial risk management and financial instruments continued
Sensitivity analysisA 10 percent strengthening of the rand on the group’s exposure to foreign currency risk at 30 June would have decreased/(increased) either the equity or the income statement by the amounts below before the effect of tax. This analysis assumes that all other variables, in particular interest rates, remain constant and has been performed on the same basis for 2012.
2013 2012
EquityRm
Income statement
RmEquity
Rm
Income statement
Rm
Euro 483 51 354 388 US dollar (818) 48 720 739 Pound sterling 34 11 15 20 Rand 24 – 14 9 Other currencies 1 021 1 806 1 233 204
A 10 percent weakening in the rand against the above currencies at 30 June would have the equal but opposite effect on the above currencies to the amounts shown above, on the basis that all other variables remain constant.
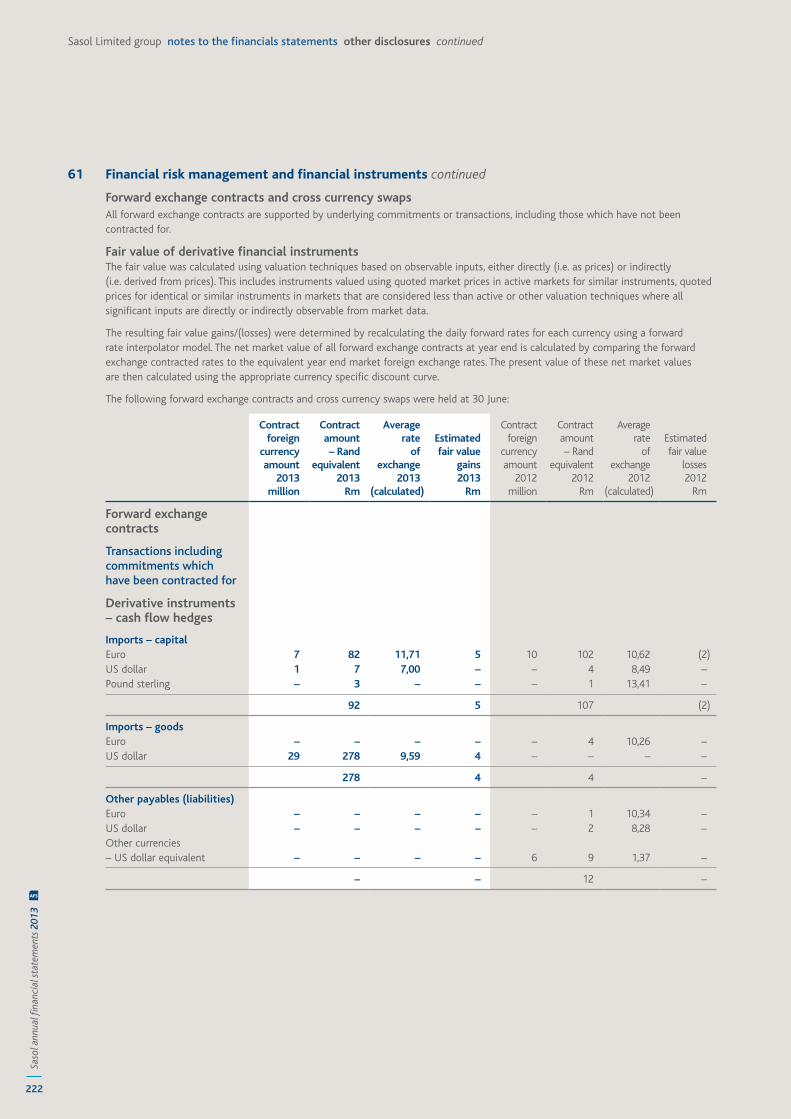
222
Saso
l ann
ual fi
nanc
ial s
tate
men
ts 2
013
AFS
Sasol Limited group notes to the financials statements other disclosures continued
61 Financial risk management and financial instruments continued
Forward exchange contracts and cross currency swapsAll forward exchange contracts are supported by underlying commitments or transactions, including those which have not been contracted for.
Fair value of derivative financial instrumentsThe fair value was calculated using valuation techniques based on observable inputs, either directly (i.e. as prices) or indirectly (i.e. derived from prices). This includes instruments valued using quoted market prices in active markets for similar instruments, quoted prices for identical or similar instruments in markets that are considered less than active or other valuation techniques where all significant inputs are directly or indirectly observable from market data.
The resulting fair value gains/(losses) were determined by recalculating the daily forward rates for each currency using a forward rate interpolator model. The net market value of all forward exchange contracts at year end is calculated by comparing the forward exchange contracted rates to the equivalent year end market foreign exchange rates. The present value of these net market values are then calculated using the appropriate currency specific discount curve.
The following forward exchange contracts and cross currency swaps were held at 30 June:
Contract foreign
currency amount
2013million
Contract amount
– Rand equivalent
2013Rm
Averagerate
of exchange
2013(calculated)
Estimated fair value
gains2013
Rm
Contract foreign
currency amount
2012million
Contract amount
– Rand equivalent
2012Rm
Average rate
of exchange
2012(calculated)
Estimated fair value
losses2012
Rm
Forward exchange contracts
Transactions including commitments which have been contracted for
Derivative instruments – cash flow hedges
Imports – capitalEuro 7 82 11,71 5 10 102 10,62 (2) US dollar 1 7 7,00 – – 4 8,49 –Pound sterling – 3 – – – 1 13,41 –
92 5 107 (2)
Imports – goodsEuro – – – – – 4 10,26 –US dollar 29 278 9,59 4 – – – –
278 4 4 –
Other payables (liabilities)Euro – – – – – 1 10,34 –US dollar – – – – – 2 8,28 –Other currencies – US dollar equivalent – – – – 6 9 1,37 –
– – 12 –
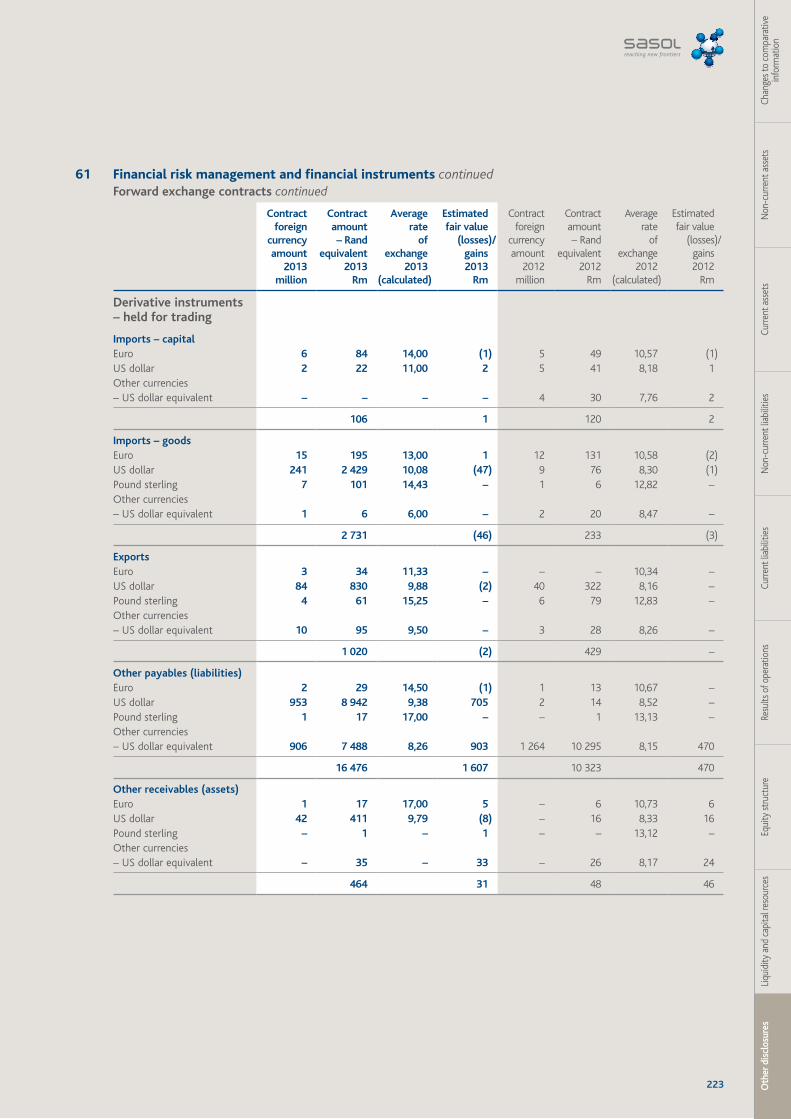
223 Oth
er d
iscl
osur
esLi
quid
ity a
nd c
apita
l res
ourc
esEq
uity
stru
ctur
eRe
sults
of o
pera
tions
Curre
nt li
abili
ties
Non
-cur
rent
liab
ilitie
sCu
rrent
ass
ets
Non
-cur
rent
ass
ets
Chan
ges t
o co
mpa
rativ
e in
form
atio
n
61 Financial risk management and financial instruments continuedForward exchange contracts continued
Contract foreign
currency amount
2013million
Contract amount
– Rand equivalent
2013Rm
Averagerate
of exchange
2013(calculated)
Estimated fair value
(losses)/gains2013
Rm
Contract foreign
currency amount
2012million
Contract amount
– Rand equivalent
2012Rm
Average rate
of exchange
2012(calculated)
Estimated fair value
(losses)/gains2012
Rm
Derivative instruments – held for trading
Imports – capitalEuro 6 84 14,00 (1) 5 49 10,57 (1)US dollar 2 22 11,00 2 5 41 8,18 1 Other currencies – US dollar equivalent – – – – 4 30 7,76 2
106 1 120 2
Imports – goodsEuro 15 195 13,00 1 12 131 10,58 (2) US dollar 241 2 429 10,08 (47) 9 76 8,30 (1) Pound sterling 7 101 14,43 – 1 6 12,82 –Other currencies – US dollar equivalent 1 6 6,00 – 2 20 8,47 –
2 731 (46) 233 (3)
ExportsEuro 3 34 11,33 – – – 10,34 –US dollar 84 830 9,88 (2) 40 322 8,16 –Pound sterling 4 61 15,25 – 6 79 12,83 –Other currencies – US dollar equivalent 10 95 9,50 – 3 28 8,26 –
1 020 (2) 429 –
Other payables (liabilities)Euro 2 29 14,50 (1) 1 13 10,67 –US dollar 953 8 942 9,38 705 2 14 8,52 –Pound sterling 1 17 17,00 – – 1 13,13 –Other currencies – US dollar equivalent 906 7 488 8,26 903 1 264 10 295 8,15 470
16 476 1 607 10 323 470
Other receivables (assets)Euro 1 17 17,00 5 – 6 10,73 6 US dollar 42 411 9,79 (8) – 16 8,33 16 Pound sterling – 1 – 1 – – 13,12 –Other currencies – US dollar equivalent – 35 – 33 – 26 8,17 24
464 31 48 46
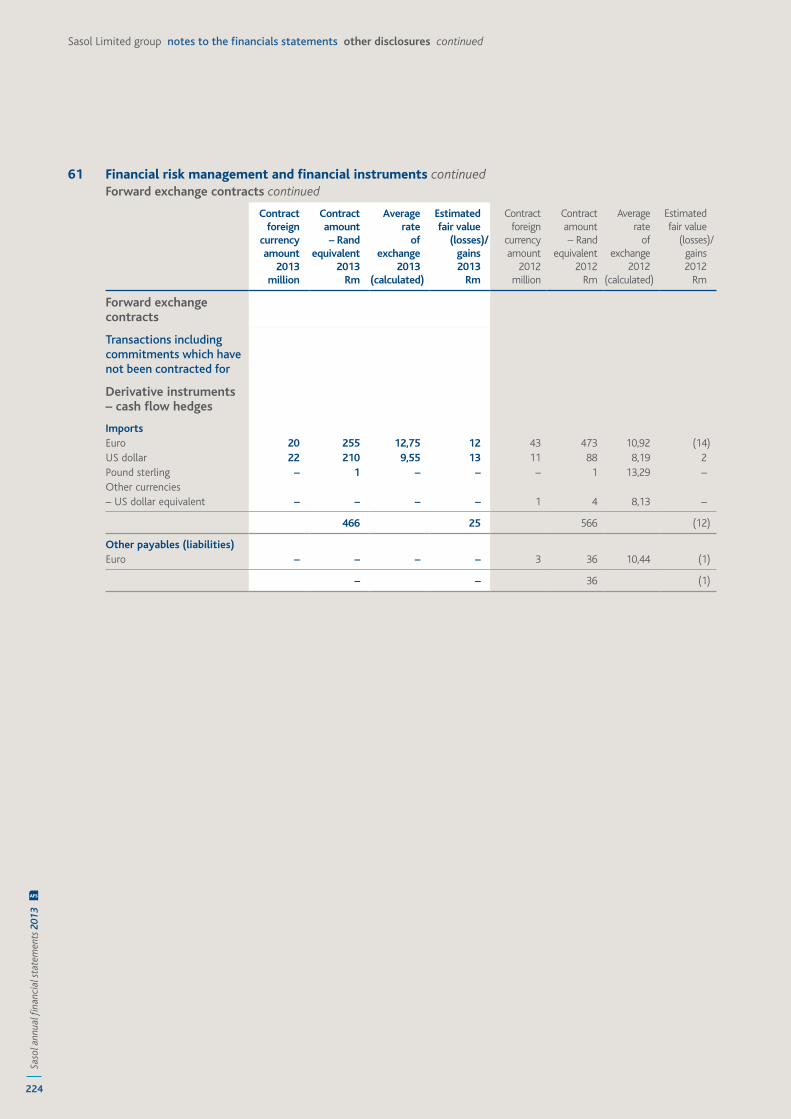
224
Saso
l ann
ual fi
nanc
ial s
tate
men
ts 2
013
AFS
Sasol Limited group notes to the financials statements other disclosures continued
61 Financial risk management and financial instruments continuedForward exchange contracts continued
Contract foreign
currency amount
2013million
Contract amount
– Rand equivalent
2013Rm
Averagerate
of exchange
2013(calculated)
Estimated fair value
(losses)/gains2013
Rm
Contract foreign
currency amount
2012million
Contract amount
– Rand equivalent
2012Rm
Average rate
of exchange
2012(calculated)
Estimated fair value
(losses)/gains2012
Rm
Forward exchange contracts
Transactions including commitments which have not been contracted for
Derivative instruments – cash flow hedges
ImportsEuro 20 255 12,75 12 43 473 10,92 (14) US dollar 22 210 9,55 13 11 88 8,19 2 Pound sterling – 1 – – – 1 13,29 –Other currencies – US dollar equivalent – – – – 1 4 8,13 –
466 25 566 (12)
Other payables (liabilities)Euro – – – – 3 36 10,44 (1)
– – 36 (1)
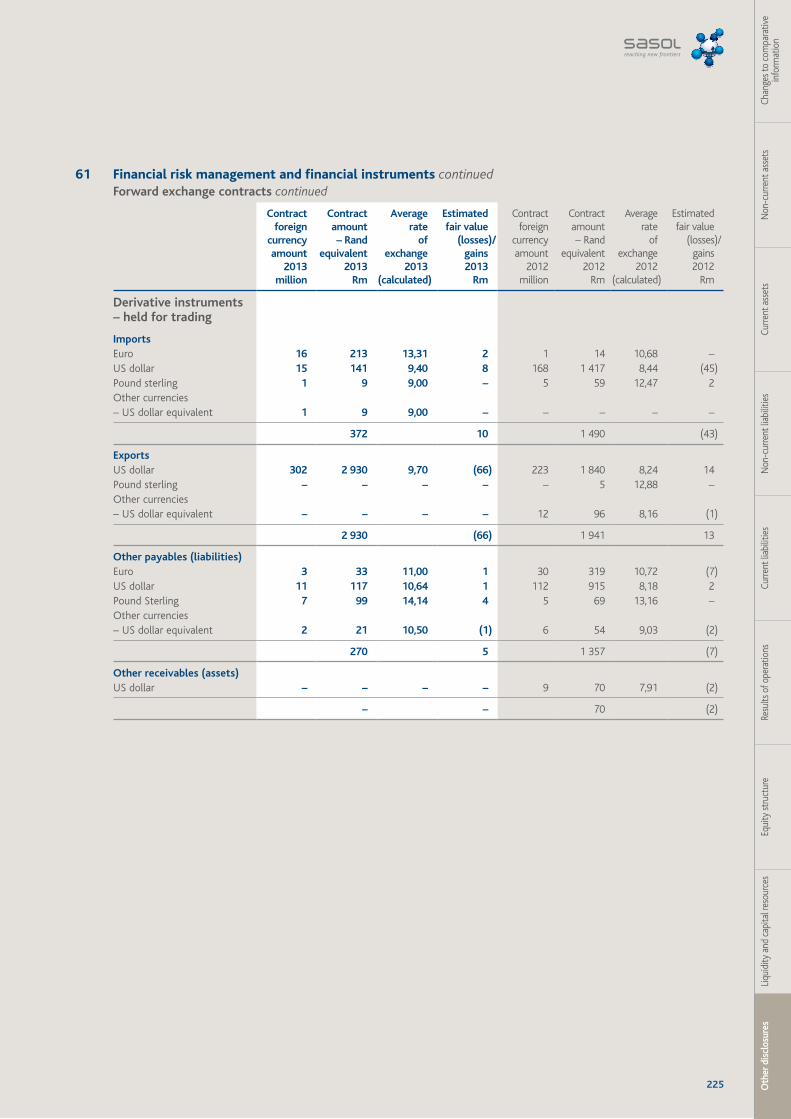
225 Oth
er d
iscl
osur
esLi
quid
ity a
nd c
apita
l res
ourc
esEq
uity
stru
ctur
eRe
sults
of o
pera
tions
Curre
nt li
abili
ties
Non
-cur
rent
liab
ilitie
sCu
rrent
ass
ets
Non
-cur
rent
ass
ets
Chan
ges t
o co
mpa
rativ
e in
form
atio
n
61 Financial risk management and financial instruments continuedForward exchange contracts continued
Contract foreign
currency amount
2013million
Contract amount
– Rand equivalent
2013Rm
Averagerate
of exchange
2013(calculated)
Estimated fair value
(losses)/gains2013
Rm
Contract foreign
currency amount
2012million
Contract amount
– Rand equivalent
2012Rm
Average rate
of exchange
2012(calculated)
Estimated fair value
(losses)/gains2012
Rm
Derivative instruments – held for trading
ImportsEuro 16 213 13,31 2 1 14 10,68 –US dollar 15 141 9,40 8 168 1 417 8,44 (45) Pound sterling 1 9 9,00 – 5 59 12,47 2 Other currencies – US dollar equivalent 1 9 9,00 – – – – –
372 10 1 490 (43)
Exports US dollar 302 2 930 9,70 (66) 223 1 840 8,24 14 Pound sterling – – – – – 5 12,88 –Other currencies – US dollar equivalent – – – – 12 96 8,16 (1)
2 930 (66) 1 941 13
Other payables (liabilities)Euro 3 33 11,00 1 30 319 10,72 (7) US dollar 11 117 10,64 1 112 915 8,18 2 Pound Sterling 7 99 14,14 4 5 69 13,16 –Other currencies – US dollar equivalent 2 21 10,50 (1) 6 54 9,03 (2)
270 5 1 357 (7)
Other receivables (assets)US dollar – – – – 9 70 7,91 (2)
– – 70 (2)
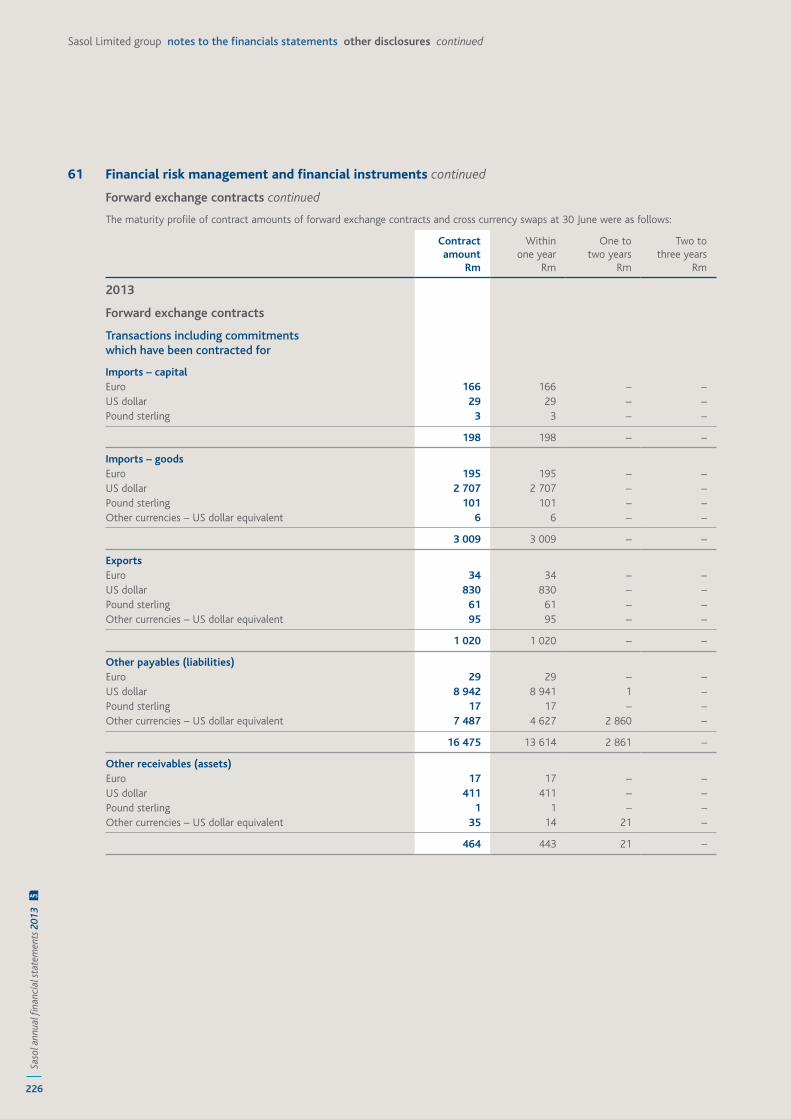
226
Saso
l ann
ual fi
nanc
ial s
tate
men
ts 2
013
AFS
Sasol Limited group notes to the financials statements other disclosures continued
61 Financial risk management and financial instruments continued
Forward exchange contracts continued
The maturity profile of contract amounts of forward exchange contracts and cross currency swaps at 30 June were as follows:
Contract amount
Rm
Within one year
Rm
One to two years
Rm
Two to three years
Rm
2013
Forward exchange contracts
Transactions including commitments which have been contracted for
Imports – capitalEuro 166 166 – –US dollar 29 29 – –Pound sterling 3 3 – –
198 198 – –
Imports – goodsEuro 195 195 – –US dollar 2 707 2 707 – –Pound sterling 101 101 – –Other currencies – US dollar equivalent 6 6 – –
3 009 3 009 – –
ExportsEuro 34 34 – –US dollar 830 830 – –Pound sterling 61 61 – –Other currencies – US dollar equivalent 95 95 – –
1 020 1 020 – –
Other payables (liabilities)Euro 29 29 – –US dollar 8 942 8 941 1 –Pound sterling 17 17 – –Other currencies – US dollar equivalent 7 487 4 627 2 860 –
16 475 13 614 2 861 –
Other receivables (assets)Euro 17 17 – –US dollar 411 411 – –Pound sterling 1 1 – –Other currencies – US dollar equivalent 35 14 21 –
464 443 21 –
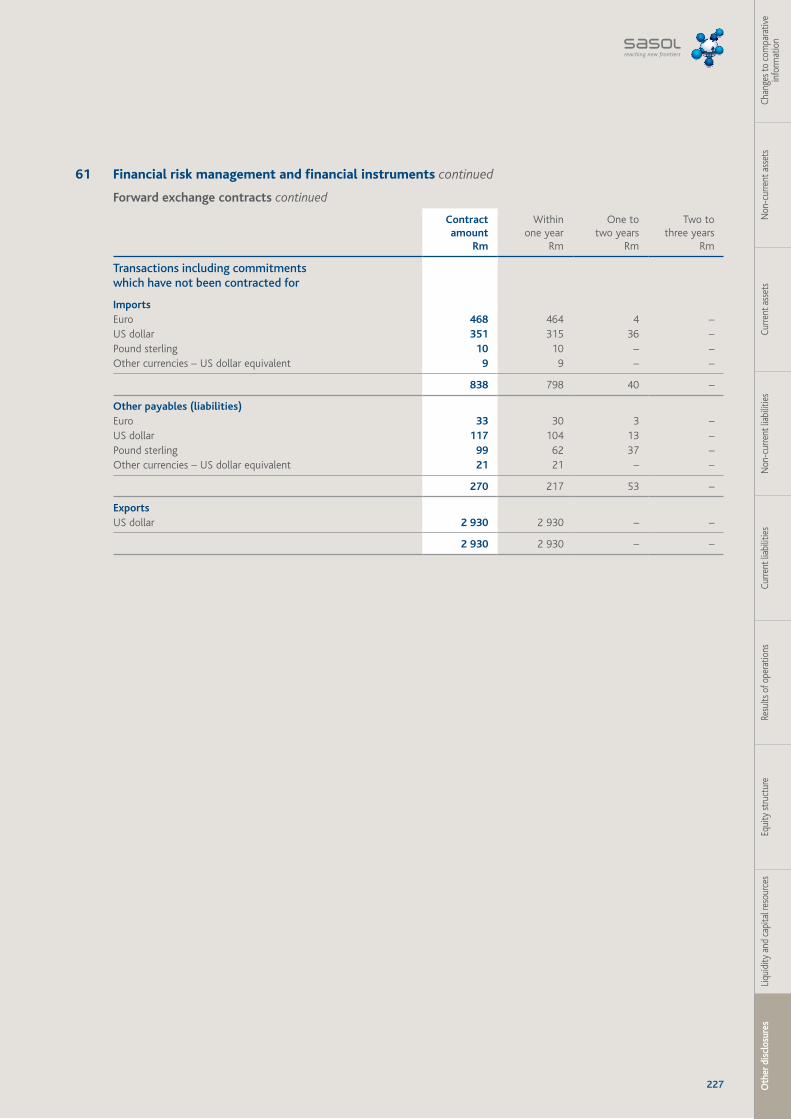
227 Oth
er d
iscl
osur
esLi
quid
ity a
nd c
apita
l res
ourc
esEq
uity
stru
ctur
eRe
sults
of o
pera
tions
Curre
nt li
abili
ties
Non
-cur
rent
liab
ilitie
sCu
rrent
ass
ets
Non
-cur
rent
ass
ets
Chan
ges t
o co
mpa
rativ
e in
form
atio
n
61 Financial risk management and financial instruments continued
Forward exchange contracts continued
Contract amount
Rm
Within one year
Rm
One to two years
Rm
Two to three years
Rm
Transactions including commitments which have not been contracted for
ImportsEuro 468 464 4 –US dollar 351 315 36 –Pound sterling 10 10 – –Other currencies – US dollar equivalent 9 9 – –
838 798 40 –
Other payables (liabilities)Euro 33 30 3 –US dollar 117 104 13 –Pound sterling 99 62 37 –Other currencies – US dollar equivalent 21 21 – –
270 217 53 –
Exports US dollar 2 930 2 930 – –
2 930 2 930 – –
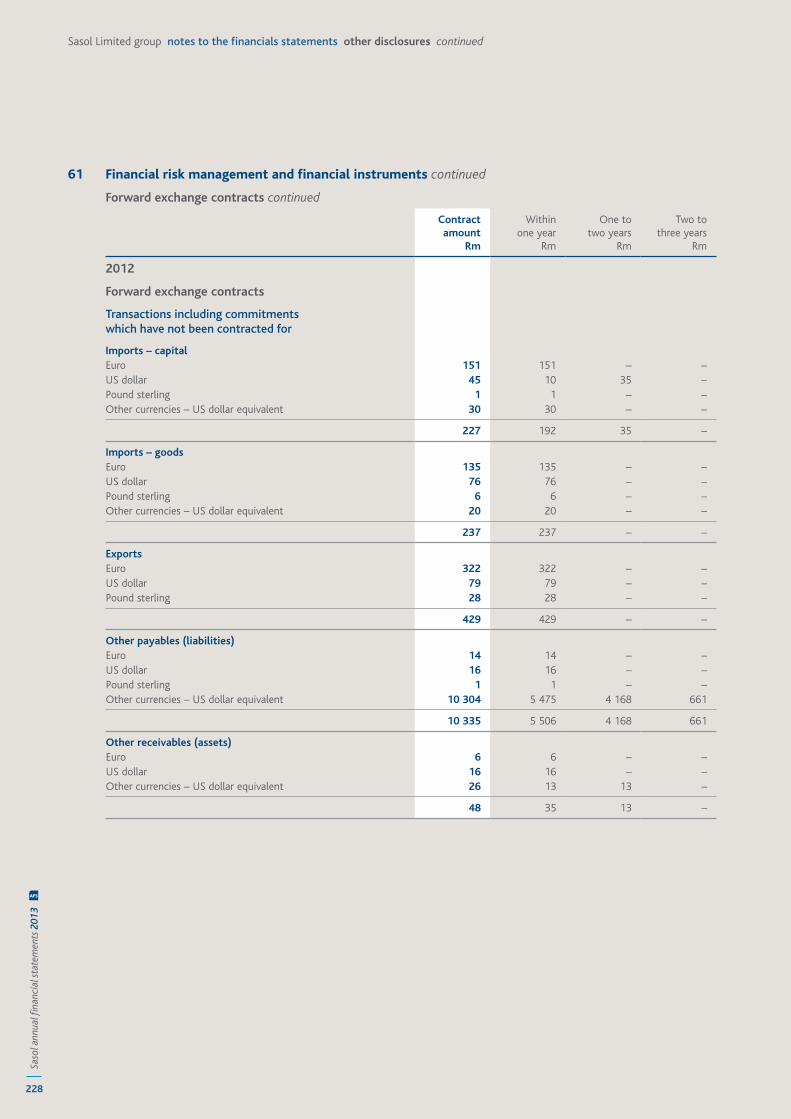
228
Saso
l ann
ual fi
nanc
ial s
tate
men
ts 2
013
AFS
Sasol Limited group notes to the financials statements other disclosures continued
61 Financial risk management and financial instruments continued
Forward exchange contracts continued
Contract amount
Rm
Within one year
Rm
One to two years
Rm
Two to three years
Rm
2012
Forward exchange contracts
Transactions including commitments which have not been contracted for
Imports – capitalEuro 151 151 – –US dollar 45 10 35 –Pound sterling 1 1 – –Other currencies – US dollar equivalent 30 30 – –
227 192 35 –
Imports – goodsEuro 135 135 – –US dollar 76 76 – –Pound sterling 6 6 – –Other currencies – US dollar equivalent 20 20 – –
237 237 – –
ExportsEuro 322 322 – –US dollar 79 79 – –Pound sterling 28 28 – –
429 429 – –
Other payables (liabilities)Euro 14 14 – –US dollar 16 16 – –Pound sterling 1 1 – –Other currencies – US dollar equivalent 10 304 5 475 4 168 661
10 335 5 506 4 168 661
Other receivables (assets)Euro 6 6 – –US dollar 16 16 – –Other currencies – US dollar equivalent 26 13 13 –
48 35 13 –
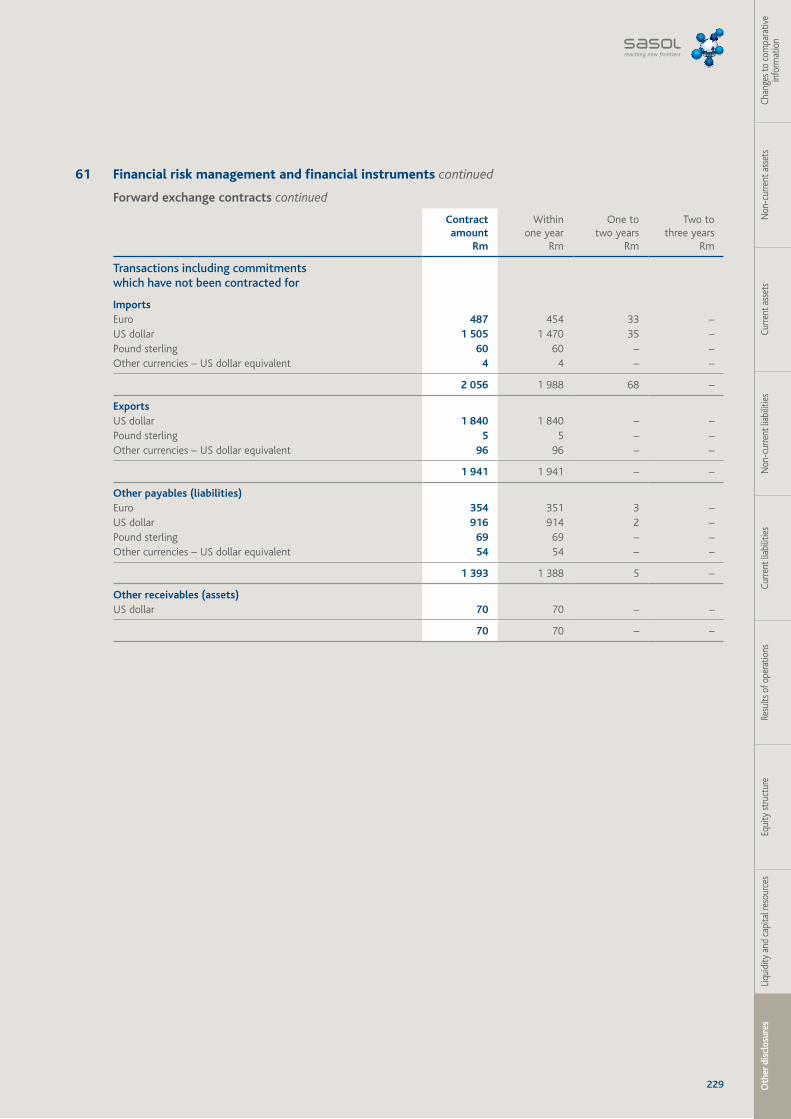
229 Oth
er d
iscl
osur
esLi
quid
ity a
nd c
apita
l res
ourc
esEq
uity
stru
ctur
eRe
sults
of o
pera
tions
Curre
nt li
abili
ties
Non
-cur
rent
liab
ilitie
sCu
rrent
ass
ets
Non
-cur
rent
ass
ets
Chan
ges t
o co
mpa
rativ
e in
form
atio
n
61 Financial risk management and financial instruments continued
Forward exchange contracts continued
Contract amount
Rm
Within one year
Rm
One to two years
Rm
Two to three years
Rm
Transactions including commitments which have not been contracted for
ImportsEuro 487 454 33 –US dollar 1 505 1 470 35 –Pound sterling 60 60 – –Other currencies – US dollar equivalent 4 4 – –
2 056 1 988 68 –
ExportsUS dollar 1 840 1 840 – –Pound sterling 5 5 – –Other currencies – US dollar equivalent 96 96 – –
1 941 1 941 – –
Other payables (liabilities)Euro 354 351 3 –US dollar 916 914 2 –Pound sterling 69 69 – –Other currencies – US dollar equivalent 54 54 – –
1 393 1 388 5 –
Other receivables (assets)US dollar 70 70 – –
70 70 – –
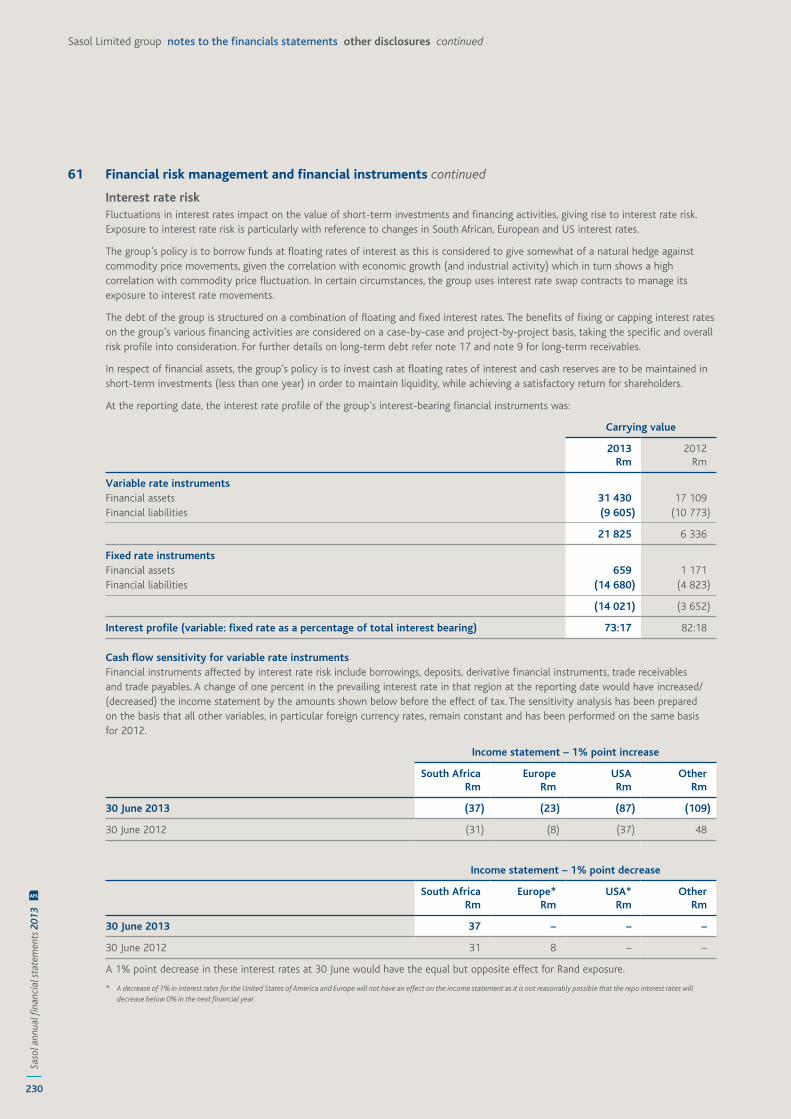
230
Saso
l ann
ual fi
nanc
ial s
tate
men
ts 2
013
AFS
Sasol Limited group notes to the financials statements other disclosures continued
61 Financial risk management and financial instruments continued
Interest rate riskFluctuations in interest rates impact on the value of short-term investments and financing activities, giving rise to interest rate risk. Exposure to interest rate risk is particularly with reference to changes in South African, European and US interest rates.
The group’s policy is to borrow funds at floating rates of interest as this is considered to give somewhat of a natural hedge against commodity price movements, given the correlation with economic growth (and industrial activity) which in turn shows a high correlation with commodity price fluctuation. In certain circumstances, the group uses interest rate swap contracts to manage its exposure to interest rate movements.
The debt of the group is structured on a combination of floating and fixed interest rates. The benefits of fixing or capping interest rates on the group’s various financing activities are considered on a case-by-case and project-by-project basis, taking the specific and overall risk profile into consideration. For further details on long-term debt refer note 17 and note 9 for long-term receivables.
In respect of financial assets, the group’s policy is to invest cash at floating rates of interest and cash reserves are to be maintained in short-term investments (less than one year) in order to maintain liquidity, while achieving a satisfactory return for shareholders.
At the reporting date, the interest rate profile of the group’s interest-bearing financial instruments was:
Carrying value
2013Rm
2012Rm
Variable rate instrumentsFinancial assets 31 430 17 109 Financial liabilities (9 605) (10 773)
21 825 6 336
Fixed rate instrumentsFinancial assets 659 1 171 Financial liabilities (14 680) (4 823)
(14 021) (3 652)
Interest profile (variable: fixed rate as a percentage of total interest bearing) 73:17 82:18
Cash flow sensitivity for variable rate instrumentsFinancial instruments affected by interest rate risk include borrowings, deposits, derivative financial instruments, trade receivables and trade payables. A change of one percent in the prevailing interest rate in that region at the reporting date would have increased/(decreased) the income statement by the amounts shown below before the effect of tax. The sensitivity analysis has been prepared on the basis that all other variables, in particular foreign currency rates, remain constant and has been performed on the same basis for 2012.
Income statement – 1% point increase
South AfricaRm
EuropeRm
USARm
OtherRm
30 June 2013 (37) (23) (87) (109)
30 June 2012 (31) (8) (37) 48
Income statement – 1% point decrease
South AfricaRm
Europe*Rm
USA*Rm
OtherRm
30 June 2013 37 – – –
30 June 2012 31 8 – –
A 1% point decrease in these interest rates at 30 June would have the equal but opposite effect for Rand exposure.
* A decrease of 1% in interest rates for the United States of America and Europe will not have an effect on the income statement as it is not reasonably possible that the repo interest rates will decrease below 0% in the next financial year.
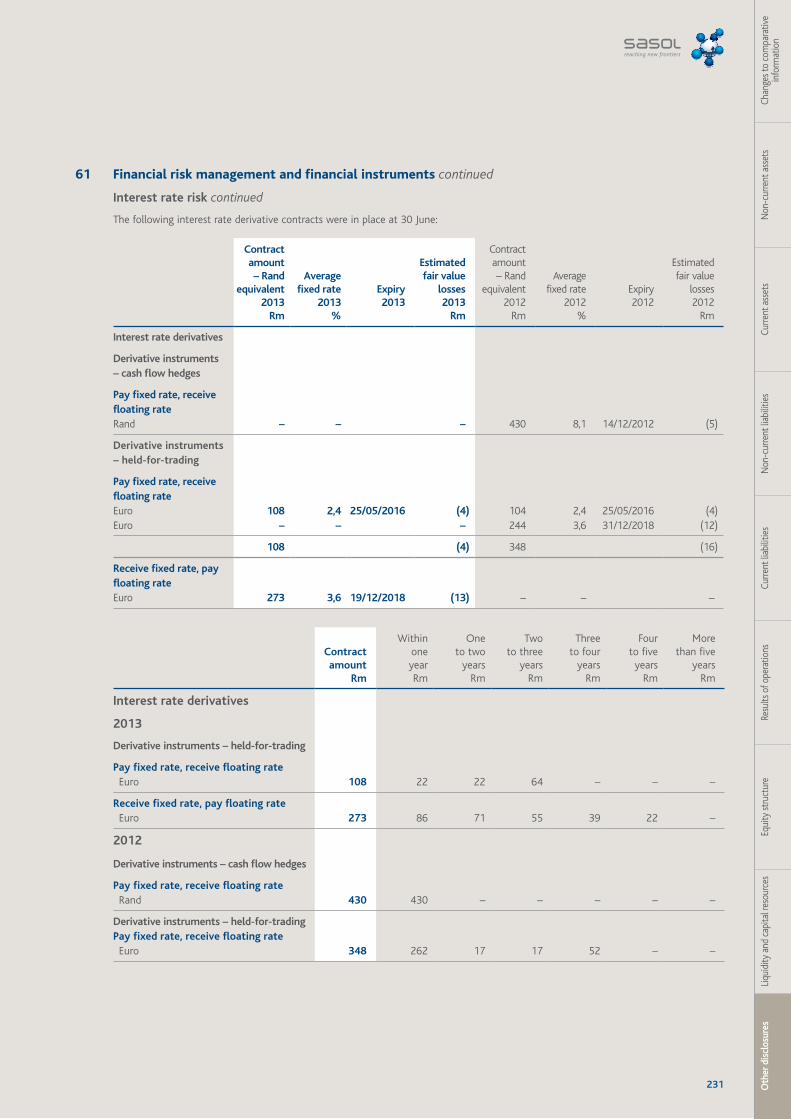
231 Oth
er d
iscl
osur
esLi
quid
ity a
nd c
apita
l res
ourc
esEq
uity
stru
ctur
eRe
sults
of o
pera
tions
Curre
nt li
abili
ties
Non
-cur
rent
liab
ilitie
sCu
rrent
ass
ets
Non
-cur
rent
ass
ets
Chan
ges t
o co
mpa
rativ
e in
form
atio
n
61 Financial risk management and financial instruments continued
Interest rate risk continued
The following interest rate derivative contracts were in place at 30 June:
Contract amount
– Rand equivalent
2013Rm
Average fixed rate
2013%
Expiry2013
Estimated fair value
losses2013
Rm
Contract amount
– Rand equivalent
2012Rm
Average fixed rate
2012%
Expiry2012
Estimated fair value
losses2012
Rm
Interest rate derivatives
Derivative instruments – cash flow hedges
Pay fixed rate, receive floating rateRand – – – 430 8,1 14/12/2012 (5)
Derivative instruments – held-for-trading
Pay fixed rate, receive floating rateEuro 108 2,4 25/05/2016 (4) 104 2,4 25/05/2016 (4) Euro – – – 244 3,6 31/12/2018 (12)
108 (4) 348 (16)
Receive fixed rate, pay floating rateEuro 273 3,6 19/12/2018 (13) – – –
Contract amount
Rm
Within one year
Rm
One to two
yearsRm
Two to three
yearsRm
Three to four
yearsRm
Four to five years
Rm
More than five
yearsRm
Interest rate derivatives
2013
Derivative instruments – held-for-trading
Pay fixed rate, receive floating rate Euro 108 22 22 64 – – –
Receive fixed rate, pay floating rate Euro 273 86 71 55 39 22 –
2012
Derivative instruments – cash flow hedges
Pay fixed rate, receive floating rate Rand 430 430 – – – – –
Derivative instruments – held-for-tradingPay fixed rate, receive floating rate Euro 348 262 17 17 52 – –
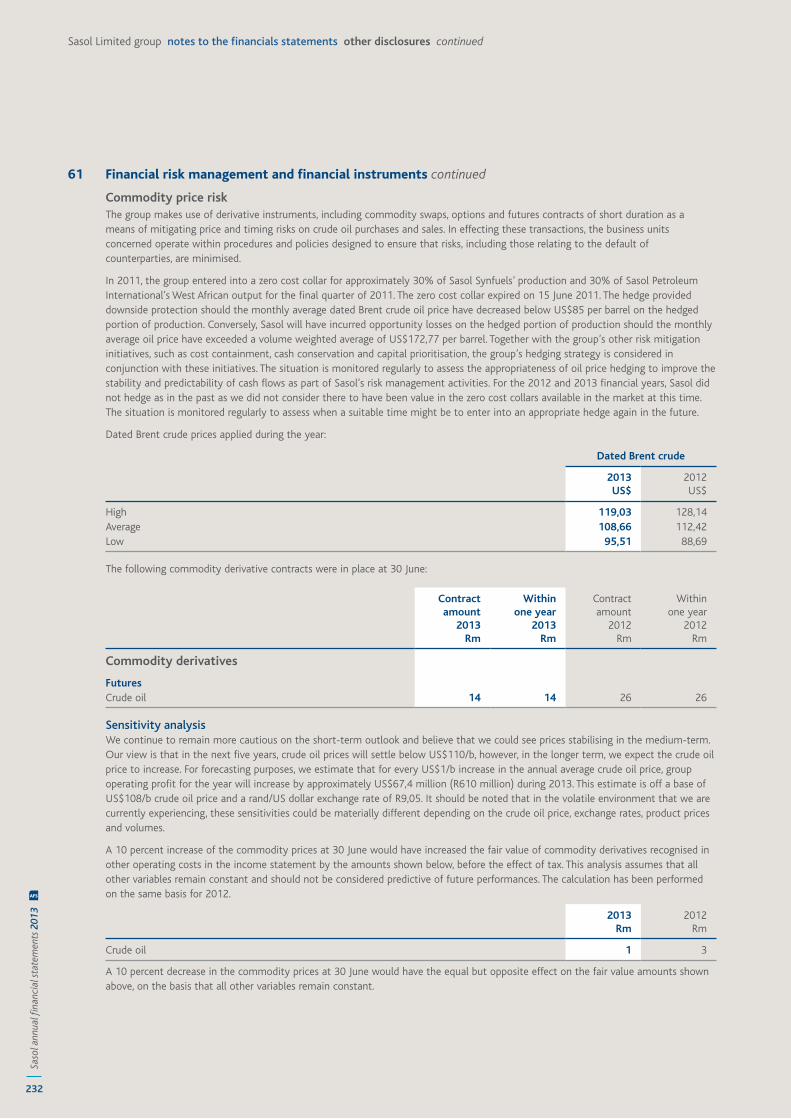
232
Saso
l ann
ual fi
nanc
ial s
tate
men
ts 2
013
AFS
Sasol Limited group notes to the financials statements other disclosures continued
61 Financial risk management and financial instruments continued
Commodity price riskThe group makes use of derivative instruments, including commodity swaps, options and futures contracts of short duration as a means of mitigating price and timing risks on crude oil purchases and sales. In effecting these transactions, the business units concerned operate within procedures and policies designed to ensure that risks, including those relating to the default of counterparties, are minimised.
In 2011, the group entered into a zero cost collar for approximately 30% of Sasol Synfuels’ production and 30% of Sasol Petroleum International’s West African output for the final quarter of 2011. The zero cost collar expired on 15 June 2011. The hedge provided downside protection should the monthly average dated Brent crude oil price have decreased below US$85 per barrel on the hedged portion of production. Conversely, Sasol will have incurred opportunity losses on the hedged portion of production should the monthly average oil price have exceeded a volume weighted average of US$172,77 per barrel. Together with the group’s other risk mitigation initiatives, such as cost containment, cash conservation and capital prioritisation, the group’s hedging strategy is considered in conjunction with these initiatives. The situation is monitored regularly to assess the appropriateness of oil price hedging to improve the stability and predictability of cash flows as part of Sasol’s risk management activities. For the 2012 and 2013 financial years, Sasol did not hedge as in the past as we did not consider there to have been value in the zero cost collars available in the market at this time. The situation is monitored regularly to assess when a suitable time might be to enter into an appropriate hedge again in the future.
Dated Brent crude prices applied during the year:
Dated Brent crude
2013US$
2012US$
High 119,03 128,14Average 108,66 112,42Low 95,51 88,69
The following commodity derivative contracts were in place at 30 June:
Contract amount
2013Rm
Within one year
2013Rm
Contract amount
2012Rm
Within one year
2012Rm
Commodity derivatives
FuturesCrude oil 14 14 26 26
Sensitivity analysisWe continue to remain more cautious on the short-term outlook and believe that we could see prices stabilising in the medium-term. Our view is that in the next five years, crude oil prices will settle below US$110/b, however, in the longer term, we expect the crude oil price to increase. For forecasting purposes, we estimate that for every US$1/b increase in the annual average crude oil price, group operating profit for the year will increase by approximately US$67,4 million (R610 million) during 2013. This estimate is off a base of US$108/b crude oil price and a rand/US dollar exchange rate of R9,05. It should be noted that in the volatile environment that we are currently experiencing, these sensitivities could be materially different depending on the crude oil price, exchange rates, product prices and volumes.
A 10 percent increase of the commodity prices at 30 June would have increased the fair value of commodity derivatives recognised in other operating costs in the income statement by the amounts shown below, before the effect of tax. This analysis assumes that all other variables remain constant and should not be considered predictive of future performances. The calculation has been performed on the same basis for 2012.
2013Rm
2012Rm
Crude oil 1 3
A 10 percent decrease in the commodity prices at 30 June would have the equal but opposite effect on the fair value amounts shown above, on the basis that all other variables remain constant.
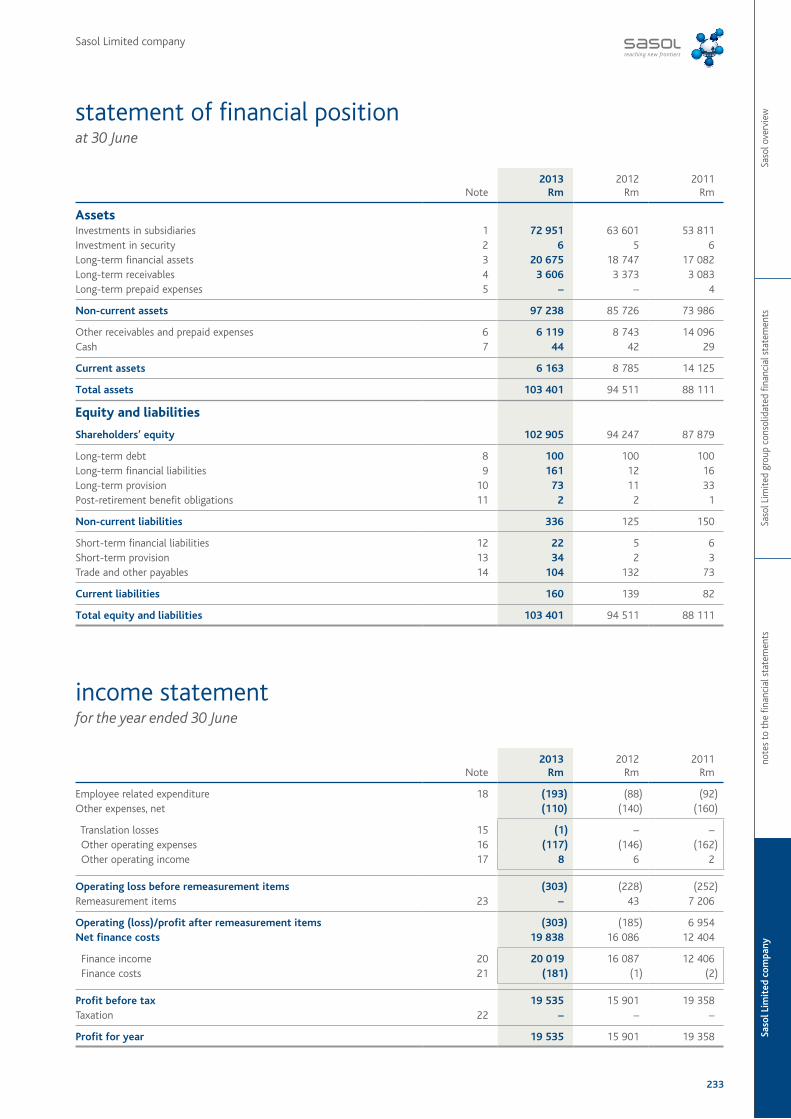
Saso
l Lim
ited
com
pany
note
s to
the
fina
ncia
l sta
tem
ents
Saso
l Lim
ited
grou
p co
nsol
idat
ed fi
nanc
ial s
tate
men
tsSa
sol o
verv
iew
233
statement of financial positionat 30 June
income statementfor the year ended 30 June
Note 2013
Rm2012
Rm2011
Rm
AssetsInvestments in subsidiaries 1 72 951 63 601 53 811 Investment in security 2 6 5 6 Long-term financial assets 3 20 675 18 747 17 082 Long-term receivables 4 3 606 3 373 3 083 Long-term prepaid expenses 5 – – 4
Non-current assets 97 238 85 726 73 986
Other receivables and prepaid expenses 6 6 119 8 743 14 096 Cash 7 44 42 29
Current assets 6 163 8 785 14 125
Total assets 103 401 94 511 88 111
Equity and liabilities
Shareholders’ equity 102 905 94 247 87 879
Long-term debt 8 100 100 100 Long-term financial liabilities 9 161 12 16 Long-term provision 10 73 11 33 Post-retirement benefit obligations 11 2 2 1
Non-current liabilities 336 125 150
Short-term financial liabilities 12 22 5 6 Short-term provision 13 34 2 3 Trade and other payables 14 104 132 73
Current liabilities 160 139 82
Total equity and liabilities 103 401 94 511 88 111
Note 2013
Rm 2012
Rm 2011
Rm
Employee related expenditure 18 (193) (88) (92)Other expenses, net (110) (140) (160)
Translation losses 15 (1) – – Other operating expenses 16 (117) (146) (162) Other operating income 17 8 6 2
Operating loss before remeasurement items (303) (228) (252)Remeasurement items 23 – 43 7 206
Operating (loss)/profit after remeasurement items (303) (185) 6 954 Net finance costs 19 838 16 086 12 404
Finance income 20 20 019 16 087 12 406 Finance costs 21 (181) (1) (2)
Profit before tax 19 535 15 901 19 358 Taxation 22 – – –
Profit for year 19 535 15 901 19 358
Sasol Limited company
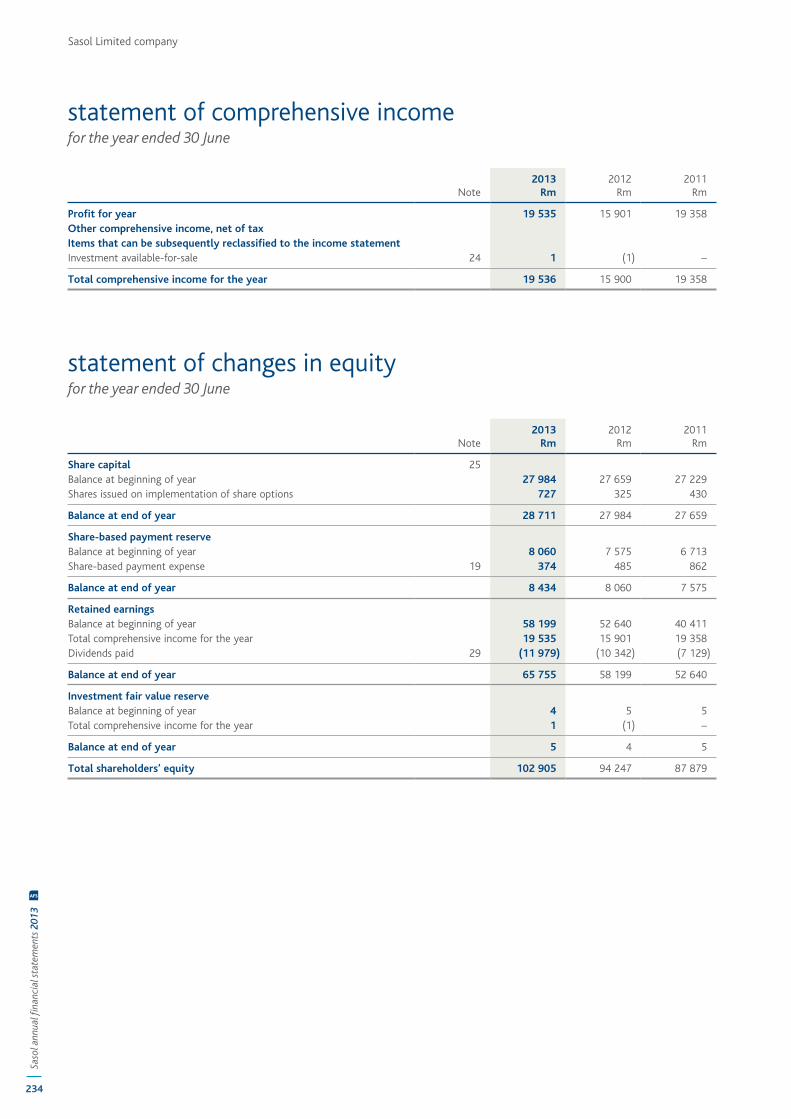
Sasol Limited company
234
Saso
l ann
ual fi
nanc
ial s
tate
men
ts 2
013
AFS
statement of comprehensive incomefor the year ended 30 June
statement of changes in equityfor the year ended 30 June
Note 2013
Rm 2012
Rm 2011
Rm
Profit for year 19 535 15 901 19 358 Other comprehensive income, net of taxItems that can be subsequently reclassified to the income statementInvestment available-for-sale 24 1 (1) –
Total comprehensive income for the year 19 536 15 900 19 358
Note 2013
Rm2012
Rm2011
Rm
Share capital 25 Balance at beginning of year 27 984 27 659 27 229 Shares issued on implementation of share options 727 325 430
Balance at end of year 28 711 27 984 27 659
Share-based payment reserveBalance at beginning of year 8 060 7 575 6 713 Share-based payment expense 19 374 485 862
Balance at end of year 8 434 8 060 7 575
Retained earningsBalance at beginning of year 58 199 52 640 40 411 Total comprehensive income for the year 19 535 15 901 19 358 Dividends paid 29 (11 979) (10 342) (7 129)
Balance at end of year 65 755 58 199 52 640
Investment fair value reserveBalance at beginning of year 4 5 5 Total comprehensive income for the year 1 (1) –
Balance at end of year 5 4 5
Total shareholders’ equity 102 905 94 247 87 879
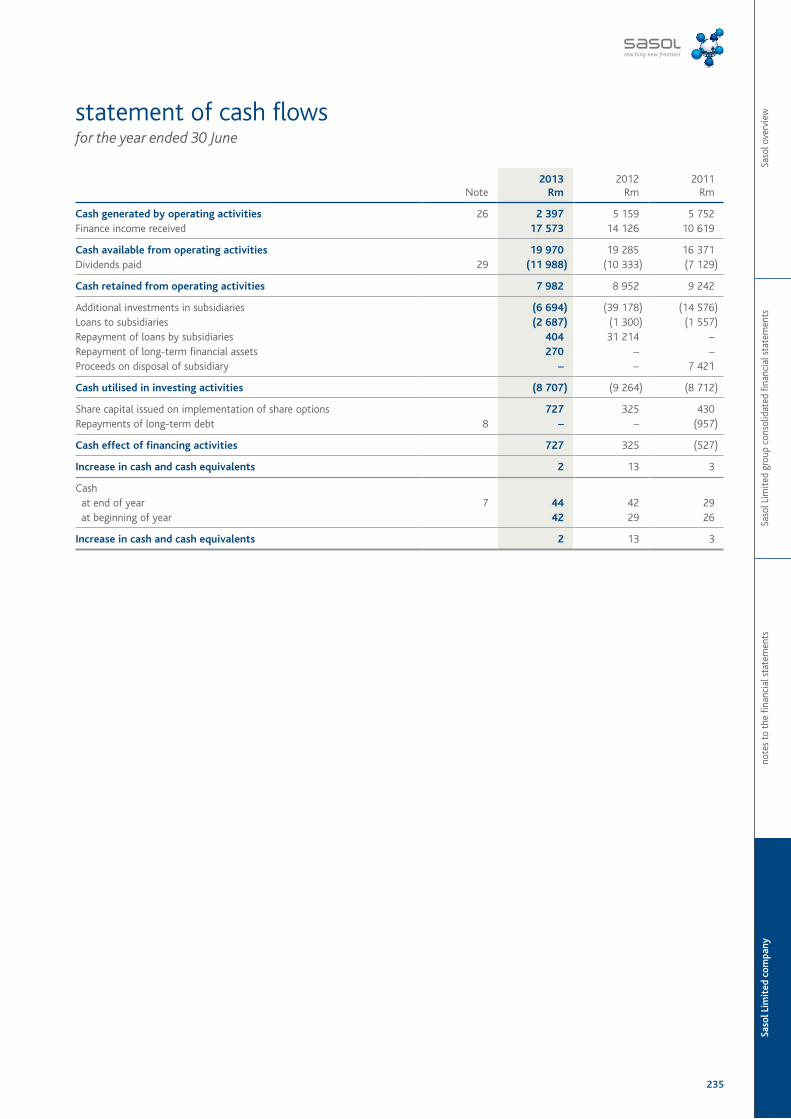
Saso
l Lim
ited
com
pany
note
s to
the
fina
ncia
l sta
tem
ents
Saso
l Lim
ited
grou
p co
nsol
idat
ed fi
nanc
ial s
tate
men
tsSa
sol o
verv
iew
235
statement of cash flowsfor the year ended 30 June
Note 2013
Rm2012
Rm2011
Rm
Cash generated by operating activities 26 2 397 5 159 5 752 Finance income received 17 573 14 126 10 619
Cash available from operating activities 19 970 19 285 16 371 Dividends paid 29 (11 988) (10 333) (7 129)
Cash retained from operating activities 7 982 8 952 9 242
Additional investments in subsidiaries (6 694) (39 178) (14 576)Loans to subsidiaries (2 687) (1 300) (1 557)Repayment of loans by subsidiaries 404 31 214 – Repayment of long-term financial assets 270 – – Proceeds on disposal of subsidiary – – 7 421
Cash utilised in investing activities (8 707) (9 264) (8 712)
Share capital issued on implementation of share options 727 325 430 Repayments of long-term debt 8 – – (957)
Cash effect of financing activities 727 325 (527)
Increase in cash and cash equivalents 2 13 3
Cash at end of year 7 44 42 29 at beginning of year 42 29 26
Increase in cash and cash equivalents 2 13 3
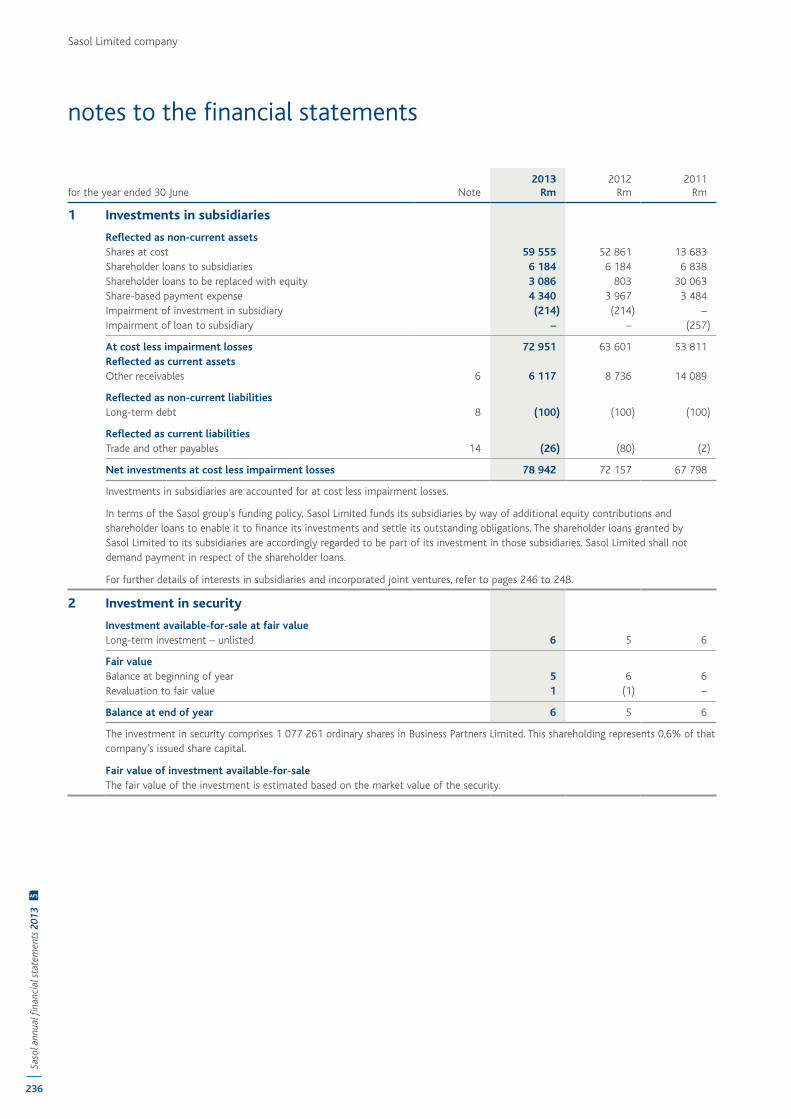
Sasol Limited company
236
Saso
l ann
ual fi
nanc
ial s
tate
men
ts 2
013
AFS
notes to the financial statements
for the year ended 30 June Note2013
Rm2012
Rm2011
Rm
1 Investments in subsidiaries
Reflected as non-current assetsShares at cost 59 555 52 861 13 683 Shareholder loans to subsidiaries 6 184 6 184 6 838 Shareholder loans to be replaced with equity 3 086 803 30 063 Share-based payment expense 4 340 3 967 3 484 Impairment of investment in subsidiary (214) (214) – Impairment of loan to subsidiary – – (257)
At cost less impairment losses 72 951 63 601 53 811 Reflected as current assetsOther receivables 6 6 117 8 736 14 089
Reflected as non-current liabilitiesLong-term debt 8 (100) (100) (100)
Reflected as current liabilitiesTrade and other payables 14 (26) (80) (2)
Net investments at cost less impairment losses 78 942 72 157 67 798
Investments in subsidiaries are accounted for at cost less impairment losses.
In terms of the Sasol group’s funding policy, Sasol Limited funds its subsidiaries by way of additional equity contributions and shareholder loans to enable it to finance its investments and settle its outstanding obligations. The shareholder loans granted by Sasol Limited to its subsidiaries are accordingly regarded to be part of its investment in those subsidiaries. Sasol Limited shall not demand payment in respect of the shareholder loans.
For further details of interests in subsidiaries and incorporated joint ventures, refer to pages 246 to 248.
2 Investment in security
Investment available-for-sale at fair valueLong-term investment – unlisted 6 5 6
Fair valueBalance at beginning of year 5 6 6 Revaluation to fair value 1 (1) –
Balance at end of year 6 5 6
The investment in security comprises 1 077 261 ordinary shares in Business Partners Limited. This shareholding represents 0,6% of that company’s issued share capital.
Fair value of investment available-for-saleThe fair value of the investment is estimated based on the market value of the security.
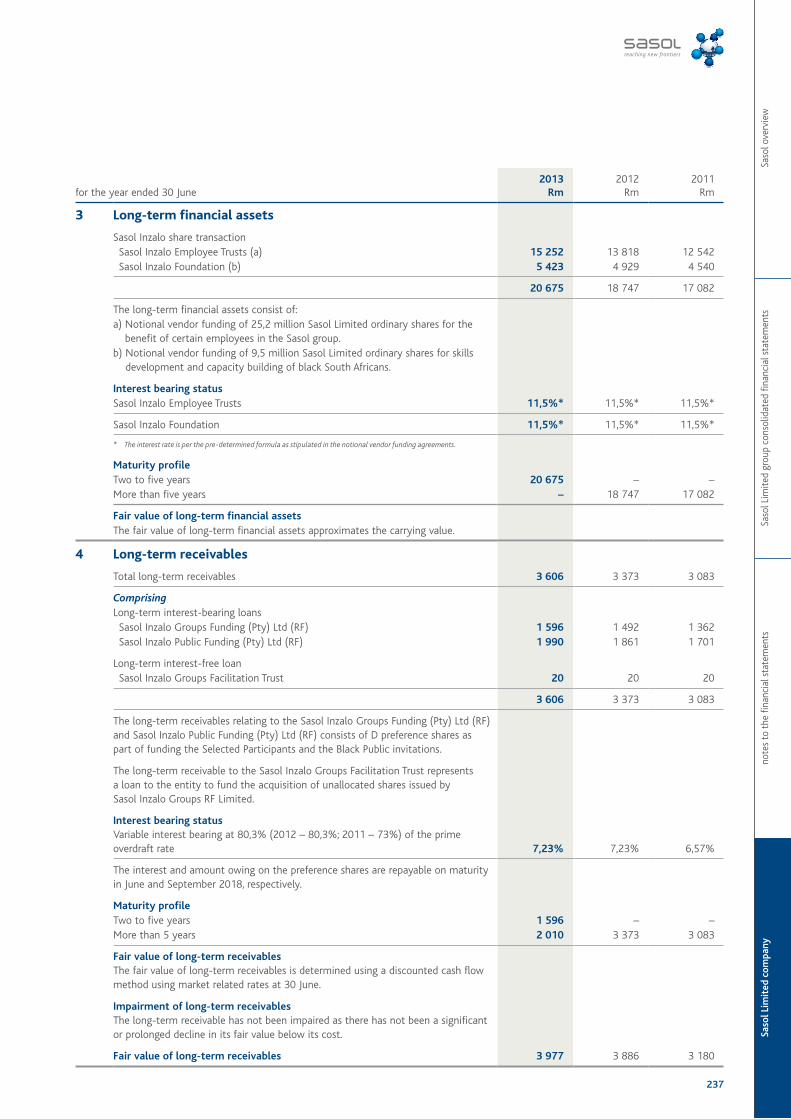
Saso
l Lim
ited
com
pany
note
s to
the
fina
ncia
l sta
tem
ents
Saso
l Lim
ited
grou
p co
nsol
idat
ed fi
nanc
ial s
tate
men
tsSa
sol o
verv
iew
237
for the year ended 30 June2013
Rm2012
Rm2011
Rm
3 Long-term financial assets
Sasol Inzalo share transaction Sasol Inzalo Employee Trusts (a) 15 252 13 818 12 542 Sasol Inzalo Foundation (b) 5 423 4 929 4 540
20 675 18 747 17 082
The long-term financial assets consist of:a) Notional vendor funding of 25,2 million Sasol Limited ordinary shares for the
benefit of certain employees in the Sasol group.b) Notional vendor funding of 9,5 million Sasol Limited ordinary shares for skills
development and capacity building of black South Africans.
Interest bearing statusSasol Inzalo Employee Trusts 11,5%* 11,5%* 11,5%*
Sasol Inzalo Foundation 11,5%* 11,5%* 11,5%*
* The interest rate is per the pre-determined formula as stipulated in the notional vendor funding agreements.
Maturity profileTwo to five years 20 675 – – More than five years – 18 747 17 082
Fair value of long-term financial assetsThe fair value of long-term financial assets approximates the carrying value.
4 Long-term receivables
Total long-term receivables 3 606 3 373 3 083
ComprisingLong-term interest-bearing loans Sasol Inzalo Groups Funding (Pty) Ltd (RF) 1 596 1 492 1 362 Sasol Inzalo Public Funding (Pty) Ltd (RF) 1 990 1 861 1 701
Long-term interest-free loan Sasol Inzalo Groups Facilitation Trust 20 20 20
3 606 3 373 3 083
The long-term receivables relating to the Sasol Inzalo Groups Funding (Pty) Ltd (RF) and Sasol Inzalo Public Funding (Pty) Ltd (RF) consists of D preference shares as part of funding the Selected Participants and the Black Public invitations.
The long-term receivable to the Sasol Inzalo Groups Facilitation Trust represents a loan to the entity to fund the acquisition of unallocated shares issued by Sasol Inzalo Groups RF Limited.
Interest bearing statusVariable interest bearing at 80,3% (2012 – 80,3%; 2011 – 73%) of the prime overdraft rate 7,23% 7,23% 6,57%
The interest and amount owing on the preference shares are repayable on maturity in June and September 2018, respectively.
Maturity profileTwo to five years 1 596 – – More than 5 years 2 010 3 373 3 083
Fair value of long-term receivablesThe fair value of long-term receivables is determined using a discounted cash flow method using market related rates at 30 June.
Impairment of long-term receivablesThe long-term receivable has not been impaired as there has not been a significant or prolonged decline in its fair value below its cost.
Fair value of long-term receivables 3 977 3 886 3 180
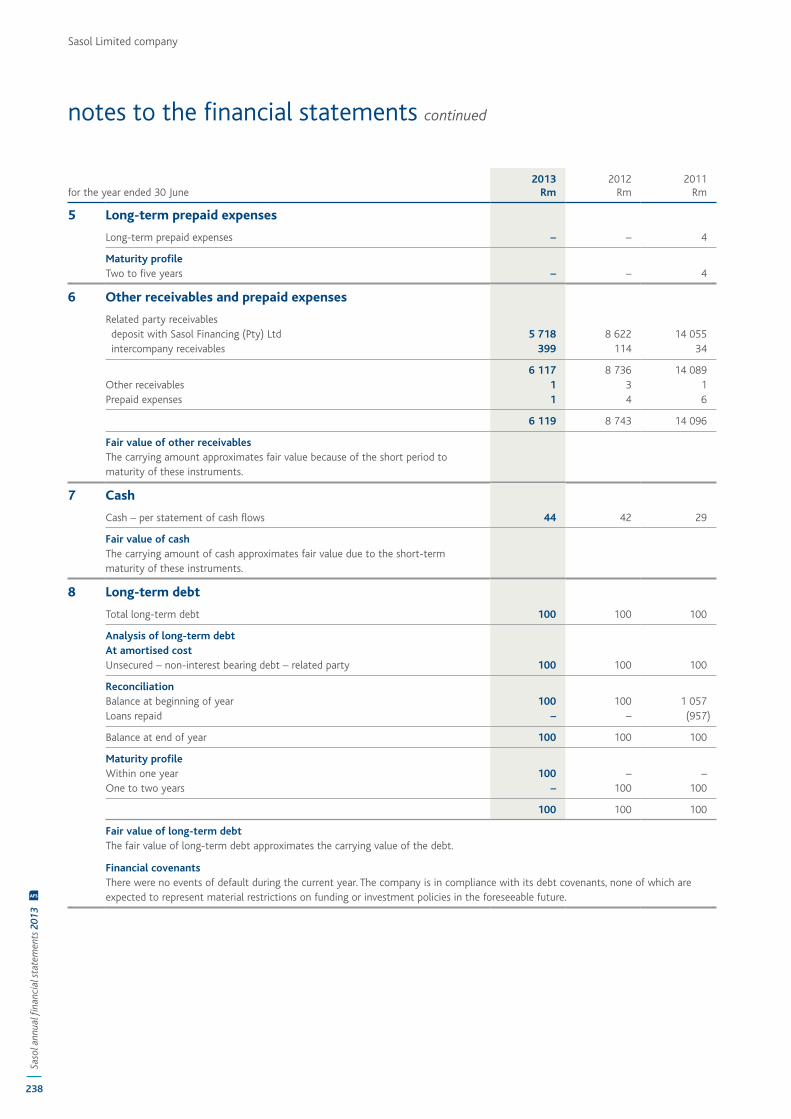
Sasol Limited company
238
Saso
l ann
ual fi
nanc
ial s
tate
men
ts 2
013
AFS
notes to the financial statements continued
for the year ended 30 June2013
Rm2012
Rm2011
Rm
5 Long-term prepaid expenses
Long-term prepaid expenses – – 4
Maturity profileTwo to five years – – 4
6 Other receivables and prepaid expenses
Related party receivables deposit with Sasol Financing (Pty) Ltd 5 718 8 622 14 055 intercompany receivables 399 114 34
6 117 8 736 14 089 Other receivables 1 3 1 Prepaid expenses 1 4 6
6 119 8 743 14 096
Fair value of other receivablesThe carrying amount approximates fair value because of the short period to maturity of these instruments.
7 Cash
Cash – per statement of cash flows 44 42 29
Fair value of cash The carrying amount of cash approximates fair value due to the short-term maturity of these instruments.
8 Long-term debt
Total long-term debt 100 100 100
Analysis of long-term debtAt amortised cost Unsecured – non-interest bearing debt – related party 100 100 100
ReconciliationBalance at beginning of year 100 100 1 057 Loans repaid – – (957)
Balance at end of year 100 100 100
Maturity profileWithin one year 100 – – One to two years – 100 100
100 100 100
Fair value of long-term debtThe fair value of long-term debt approximates the carrying value of the debt.
Financial covenantsThere were no events of default during the current year. The company is in compliance with its debt covenants, none of which are expected to represent material restrictions on funding or investment policies in the foreseeable future.
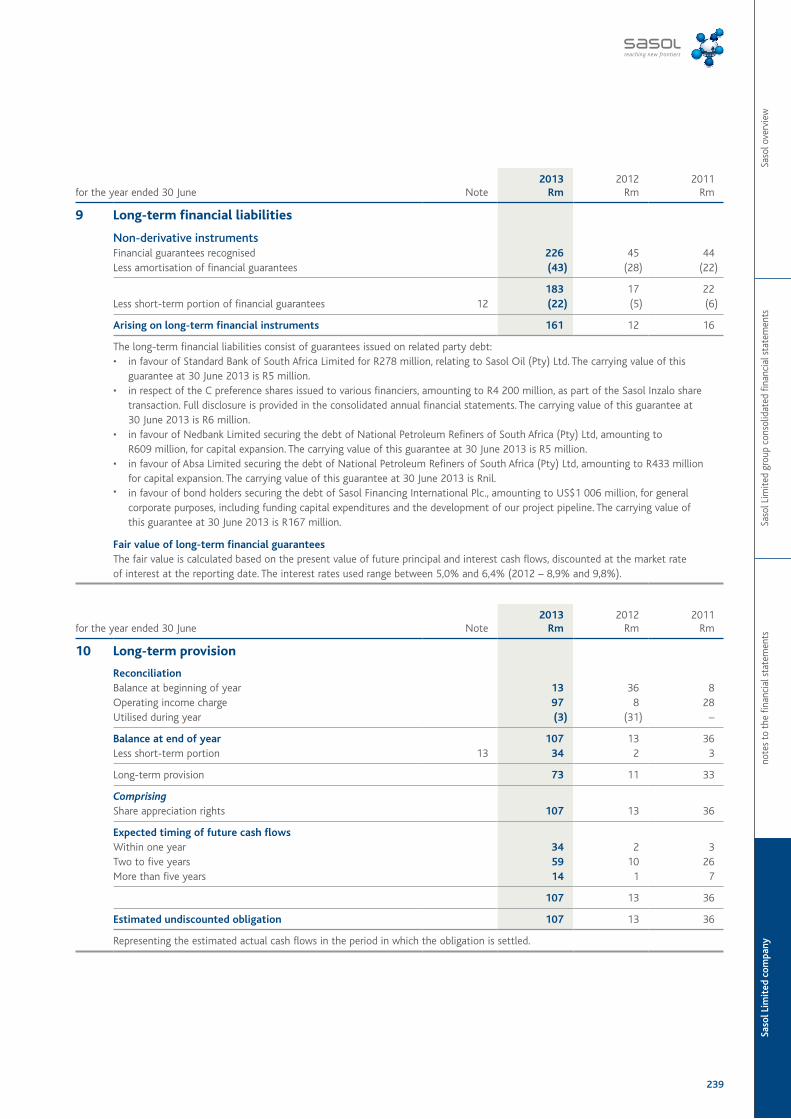
Saso
l Lim
ited
com
pany
note
s to
the
fina
ncia
l sta
tem
ents
Saso
l Lim
ited
grou
p co
nsol
idat
ed fi
nanc
ial s
tate
men
tsSa
sol o
verv
iew
239
for the year ended 30 June Note2013
Rm2012
Rm2011
Rm
9 Long-term financial liabilities
Non-derivative instrumentsFinancial guarantees recognised 226 45 44 Less amortisation of financial guarantees (43) (28) (22)
183 17 22 Less short-term portion of financial guarantees 12 (22) (5) (6)
Arising on long-term financial instruments 161 12 16
The long-term financial liabilities consist of guarantees issued on related party debt: • in favour of Standard Bank of South Africa Limited for R278 million, relating to Sasol Oil (Pty) Ltd. The carrying value of this
guarantee at 30 June 2013 is R5 million. • in respect of the C preference shares issued to various financiers, amounting to R4 200 million, as part of the Sasol Inzalo share
transaction. Full disclosure is provided in the consolidated annual financial statements. The carrying value of this guarantee at 30 June 2013 is R6 million.
• in favour of Nedbank Limited securing the debt of National Petroleum Refiners of South Africa (Pty) Ltd, amounting to R609 million, for capital expansion. The carrying value of this guarantee at 30 June 2013 is R5 million.
• in favour of Absa Limited securing the debt of National Petroleum Refiners of South Africa (Pty) Ltd, amounting to R433 million for capital expansion. The carrying value of this guarantee at 30 June 2013 is Rnil.
• in favour of bond holders securing the debt of Sasol Financing International Plc., amounting to US$1 006 million, for general corporate purposes, including funding capital expenditures and the development of our project pipeline. The carrying value of this guarantee at 30 June 2013 is R167 million.
Fair value of long-term financial guaranteesThe fair value is calculated based on the present value of future principal and interest cash flows, discounted at the market rate of interest at the reporting date. The interest rates used range between 5,0% and 6,4% (2012 – 8,9% and 9,8%).
for the year ended 30 June Note2013
Rm2012
Rm2011
Rm
10 Long-term provision
ReconciliationBalance at beginning of year 13 36 8 Operating income charge 97 8 28 Utilised during year (3) (31) –
Balance at end of year 107 13 36 Less short-term portion 13 34 2 3
Long-term provision 73 11 33
ComprisingShare appreciation rights 107 13 36
Expected timing of future cash flowsWithin one year 34 2 3 Two to five years 59 10 26 More than five years 14 1 7
107 13 36
Estimated undiscounted obligation 107 13 36
Representing the estimated actual cash flows in the period in which the obligation is settled.
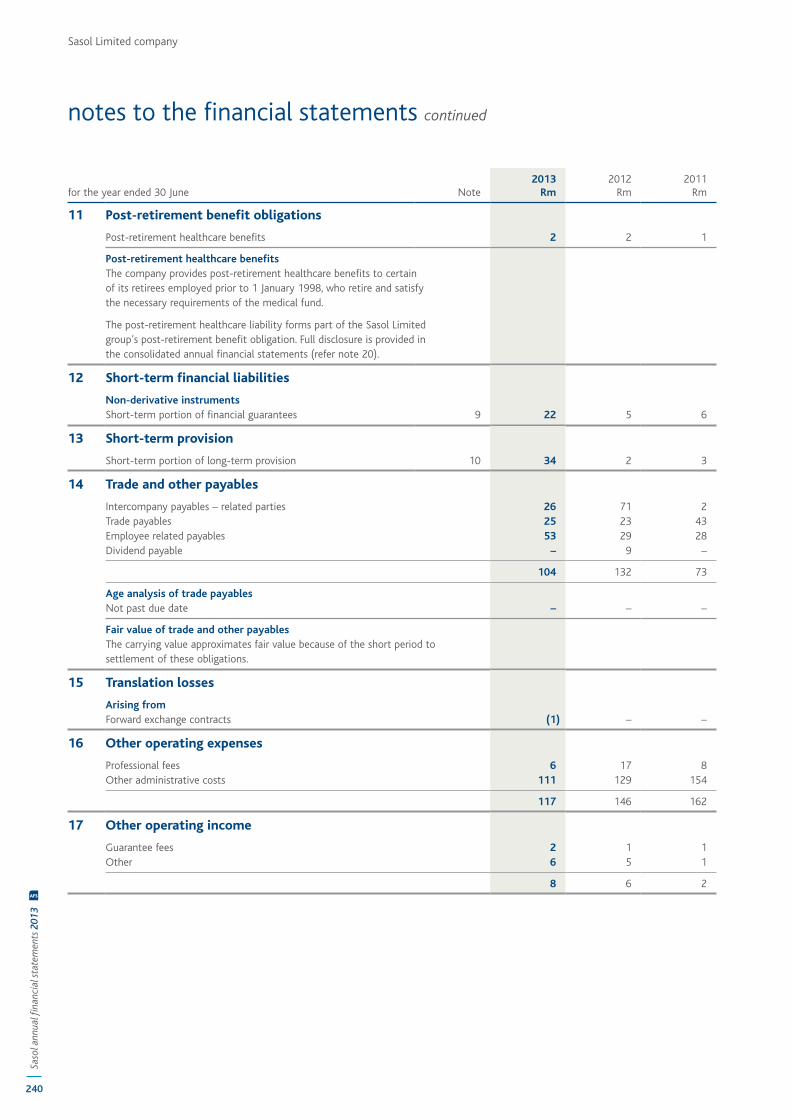
Sasol Limited company
240
Saso
l ann
ual fi
nanc
ial s
tate
men
ts 2
013
AFS
notes to the financial statements continued
for the year ended 30 June Note2013
Rm2012
Rm2011
Rm
11 Post-retirement benefit obligations
Post-retirement healthcare benefits 2 2 1
Post-retirement healthcare benefitsThe company provides post-retirement healthcare benefits to certain of its retirees employed prior to 1 January 1998, who retire and satisfy the necessary requirements of the medical fund.
The post-retirement healthcare liability forms part of the Sasol Limited group’s post-retirement benefit obligation. Full disclosure is provided in the consolidated annual financial statements (refer note 20).
12 Short-term financial liabilities
Non-derivative instrumentsShort-term portion of financial guarantees 9 22 5 6
13 Short-term provision
Short-term portion of long-term provision 10 34 2 3
14 Trade and other payables
Intercompany payables – related parties 26 71 2 Trade payables 25 23 43 Employee related payables 53 29 28 Dividend payable – 9 –
104 132 73
Age analysis of trade payablesNot past due date – – –
Fair value of trade and other payablesThe carrying value approximates fair value because of the short period to settlement of these obligations.
15 Translation losses
Arising from Forward exchange contracts (1) – –
16 Other operating expenses
Professional fees 6 17 8 Other administrative costs 111 129 154
117 146 162
17 Other operating income
Guarantee fees 2 1 1 Other 6 5 1
8 6 2
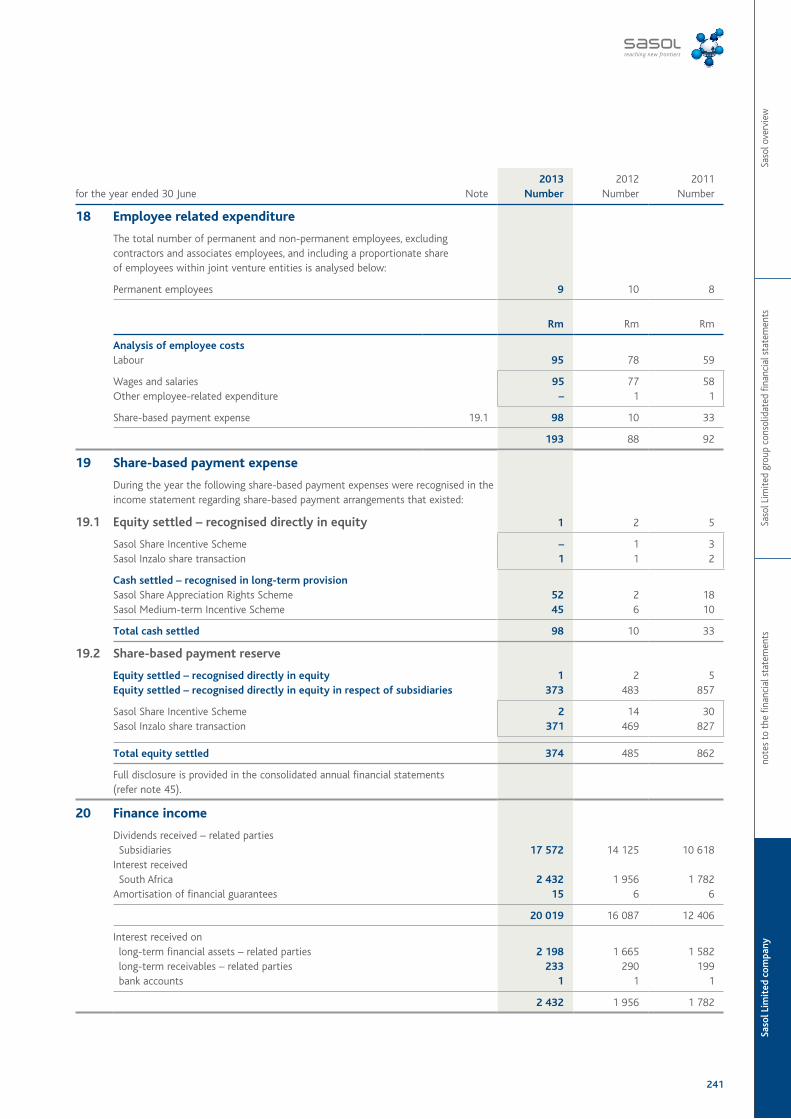
Saso
l Lim
ited
com
pany
note
s to
the
fina
ncia
l sta
tem
ents
Saso
l Lim
ited
grou
p co
nsol
idat
ed fi
nanc
ial s
tate
men
tsSa
sol o
verv
iew
241
for the year ended 30 June Note2013
Number 2012
Number 2011
Number
18 Employee related expenditure
The total number of permanent and non-permanent employees, excluding contractors and associates employees, and including a proportionate share of employees within joint venture entities is analysed below:
Permanent employees 9 10 8
Rm Rm Rm
Analysis of employee costsLabour 95 78 59
Wages and salaries 95 77 58 Other employee-related expenditure – 1 1
Share-based payment expense 19.1 98 10 33
193 88 92
19 Share-based payment expense
During the year the following share-based payment expenses were recognised in the income statement regarding share-based payment arrangements that existed:
19.1 Equity settled – recognised directly in equity 1 2 5
Sasol Share Incentive Scheme – 1 3 Sasol Inzalo share transaction 1 1 2
Cash settled – recognised in long-term provisionSasol Share Appreciation Rights Scheme 52 2 18 Sasol Medium-term Incentive Scheme 45 6 10
Total cash settled 98 10 33
19.2 Share-based payment reserve
Equity settled – recognised directly in equity 1 2 5 Equity settled – recognised directly in equity in respect of subsidiaries 373 483 857
Sasol Share Incentive Scheme 2 14 30 Sasol Inzalo share transaction 371 469 827
Total equity settled 374 485 862
Full disclosure is provided in the consolidated annual financial statements (refer note 45).
20 Finance income
Dividends received – related parties Subsidiaries 17 572 14 125 10 618 Interest received South Africa 2 432 1 956 1 782 Amortisation of financial guarantees 15 6 6
20 019 16 087 12 406
Interest received on long-term financial assets – related parties 2 198 1 665 1 582 long-term receivables – related parties 233 290 199 bank accounts 1 1 1
2 432 1 956 1 782
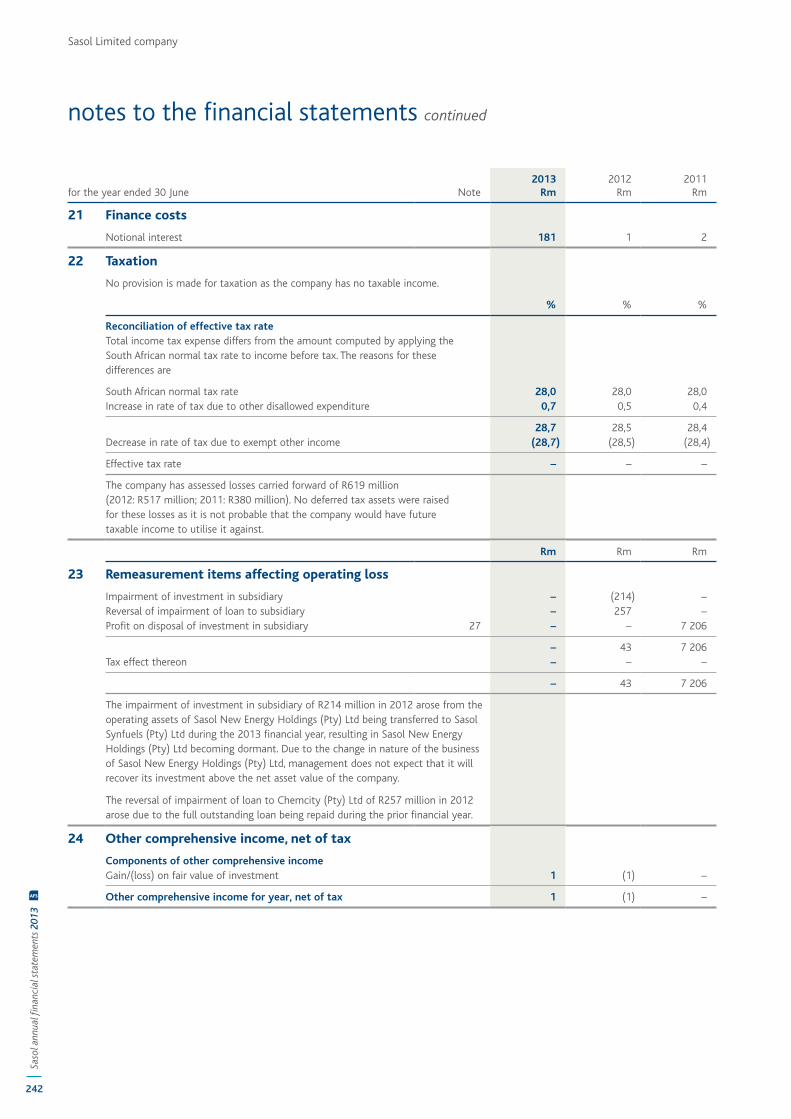
Sasol Limited company
242
Saso
l ann
ual fi
nanc
ial s
tate
men
ts 2
013
AFS
notes to the financial statements continued
for the year ended 30 June Note2013
Rm2012
Rm2011
Rm
21 Finance costs
Notional interest 181 1 2
22 Taxation
No provision is made for taxation as the company has no taxable income.
% % %
Reconciliation of effective tax rateTotal income tax expense differs from the amount computed by applying the South African normal tax rate to income before tax. The reasons for these differences are
South African normal tax rate 28,0 28,0 28,0Increase in rate of tax due to other disallowed expenditure 0,7 0,5 0,4
28,7 28,5 28,4Decrease in rate of tax due to exempt other income (28,7) (28,5) (28,4)
Effective tax rate – – –
The company has assessed losses carried forward of R619 million (2012: R517 million; 2011: R380 million). No deferred tax assets were raised for these losses as it is not probable that the company would have future taxable income to utilise it against.
Rm Rm Rm
23 Remeasurement items affecting operating loss
Impairment of investment in subsidiary – (214) – Reversal of impairment of loan to subsidiary – 257 – Profit on disposal of investment in subsidiary 27 – – 7 206
– 43 7 206 Tax effect thereon – – –
– 43 7 206
The impairment of investment in subsidiary of R214 million in 2012 arose from the operating assets of Sasol New Energy Holdings (Pty) Ltd being transferred to Sasol Synfuels (Pty) Ltd during the 2013 financial year, resulting in Sasol New Energy Holdings (Pty) Ltd becoming dormant. Due to the change in nature of the business of Sasol New Energy Holdings (Pty) Ltd, management does not expect that it will recover its investment above the net asset value of the company.
The reversal of impairment of loan to Chemcity (Pty) Ltd of R257 million in 2012 arose due to the full outstanding loan being repaid during the prior financial year.
24 Other comprehensive income, net of tax
Components of other comprehensive incomeGain/(loss) on fair value of investment 1 (1) –
Other comprehensive income for year, net of tax 1 (1) –
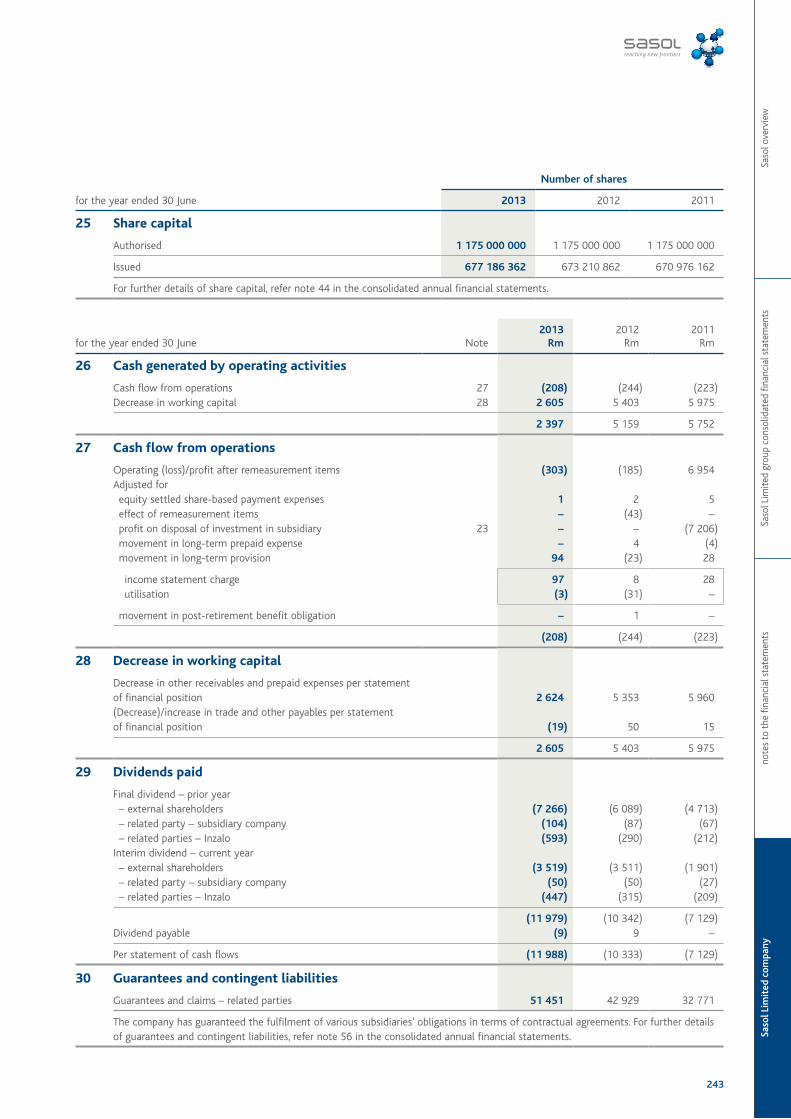
Saso
l Lim
ited
com
pany
note
s to
the
fina
ncia
l sta
tem
ents
Saso
l Lim
ited
grou
p co
nsol
idat
ed fi
nanc
ial s
tate
men
tsSa
sol o
verv
iew
243
for the year ended 30 June
Number of shares
2013 2012 2011
25 Share capital
Authorised 1 175 000 000 1 175 000 000 1 175 000 000
Issued 677 186 362 673 210 862 670 976 162
For further details of share capital, refer note 44 in the consolidated annual financial statements.
for the year ended 30 June Note2013
Rm2012
Rm2011
Rm
26 Cash generated by operating activities
Cash flow from operations 27 (208) (244) (223)Decrease in working capital 28 2 605 5 403 5 975
2 397 5 159 5 752
27 Cash flow from operations
Operating (loss)/profit after remeasurement items (303) (185) 6 954 Adjusted for equity settled share-based payment expenses 1 2 5 effect of remeasurement items – (43) – profit on disposal of investment in subsidiary 23 – – (7 206) movement in long-term prepaid expense – 4 (4) movement in long-term provision 94 (23) 28
income statement charge 97 8 28 utilisation (3) (31) –
movement in post-retirement benefit obligation – 1 –
(208) (244) (223)
28 Decrease in working capital
Decrease in other receivables and prepaid expenses per statement of financial position 2 624 5 353 5 960 (Decrease)/increase in trade and other payables per statement of financial position (19) 50 15
2 605 5 403 5 975
29 Dividends paid
Final dividend – prior year – external shareholders (7 266) (6 089) (4 713) – related party – subsidiary company (104) (87) (67) – related parties – Inzalo (593) (290) (212)Interim dividend – current year – external shareholders (3 519) (3 511) (1 901) – related party – subsidiary company (50) (50) (27) – related parties – Inzalo (447) (315) (209)
(11 979) (10 342) (7 129)Dividend payable (9) 9 –
Per statement of cash flows (11 988) (10 333) (7 129)
30 Guarantees and contingent liabilities
Guarantees and claims – related parties 51 451 42 929 32 771
The company has guaranteed the fulfilment of various subsidiaries’ obligations in terms of contractual agreements. For further details of guarantees and contingent liabilities, refer note 56 in the consolidated annual financial statements.
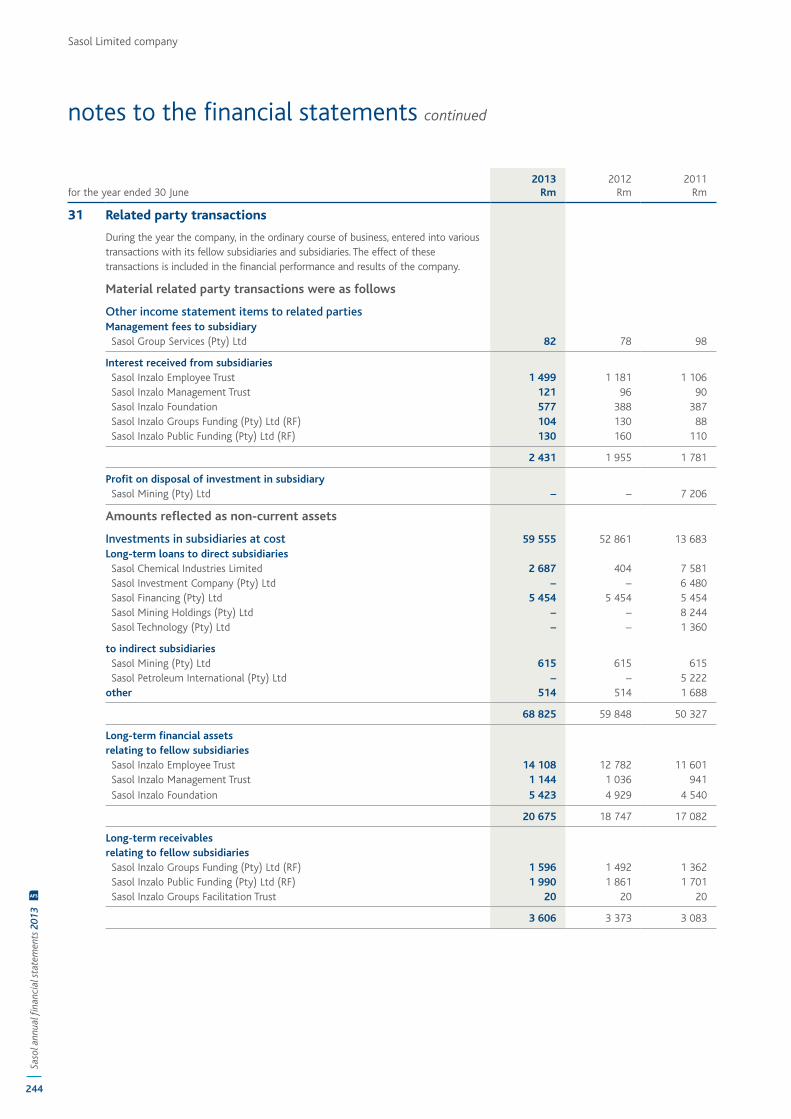
Sasol Limited company
244
Saso
l ann
ual fi
nanc
ial s
tate
men
ts 2
013
AFS
notes to the financial statements continued
for the year ended 30 June2013
Rm2012
Rm2011
Rm
31 Related party transactions
During the year the company, in the ordinary course of business, entered into various transactions with its fellow subsidiaries and subsidiaries. The effect of these transactions is included in the financial performance and results of the company.
Material related party transactions were as follows
OtherincomestatementitemstorelatedpartiesManagement fees to subsidiary Sasol Group Services (Pty) Ltd 82 78 98
Interest received from subsidiaries Sasol Inzalo Employee Trust 1 499 1 181 1 106 Sasol Inzalo Management Trust 121 96 90 Sasol Inzalo Foundation 577 388 387 Sasol Inzalo Groups Funding (Pty) Ltd (RF) 104 130 88 Sasol Inzalo Public Funding (Pty) Ltd (RF) 130 160 110
2 431 1 955 1 781
Profit on disposal of investment in subsidiary Sasol Mining (Pty) Ltd – – 7 206
Amounts reflected as non-current assets
Investments in subsidiaries at cost 59 555 52 861 13 683 Long-term loans to direct subsidiaries Sasol Chemical Industries Limited 2 687 404 7 581 Sasol Investment Company (Pty) Ltd – – 6 480 Sasol Financing (Pty) Ltd 5 454 5 454 5 454 Sasol Mining Holdings (Pty) Ltd – – 8 244 Sasol Technology (Pty) Ltd – – 1 360
to indirect subsidiaries Sasol Mining (Pty) Ltd 615 615 615 Sasol Petroleum International (Pty) Ltd – – 5 222 other 514 514 1 688
68 825 59 848 50 327
Long-term financial assetsrelating to fellow subsidiaries Sasol Inzalo Employee Trust 14 108 12 782 11 601 Sasol Inzalo Management Trust 1 144 1 036 941
Sasol Inzalo Foundation 5 423 4 929 4 540
20 675 18 747 17 082
Long-term receivablesrelating to fellow subsidiaries Sasol Inzalo Groups Funding (Pty) Ltd (RF) 1 596 1 492 1 362 Sasol Inzalo Public Funding (Pty) Ltd (RF) 1 990 1 861 1 701 Sasol Inzalo Groups Facilitation Trust 20 20 20
3 606 3 373 3 083
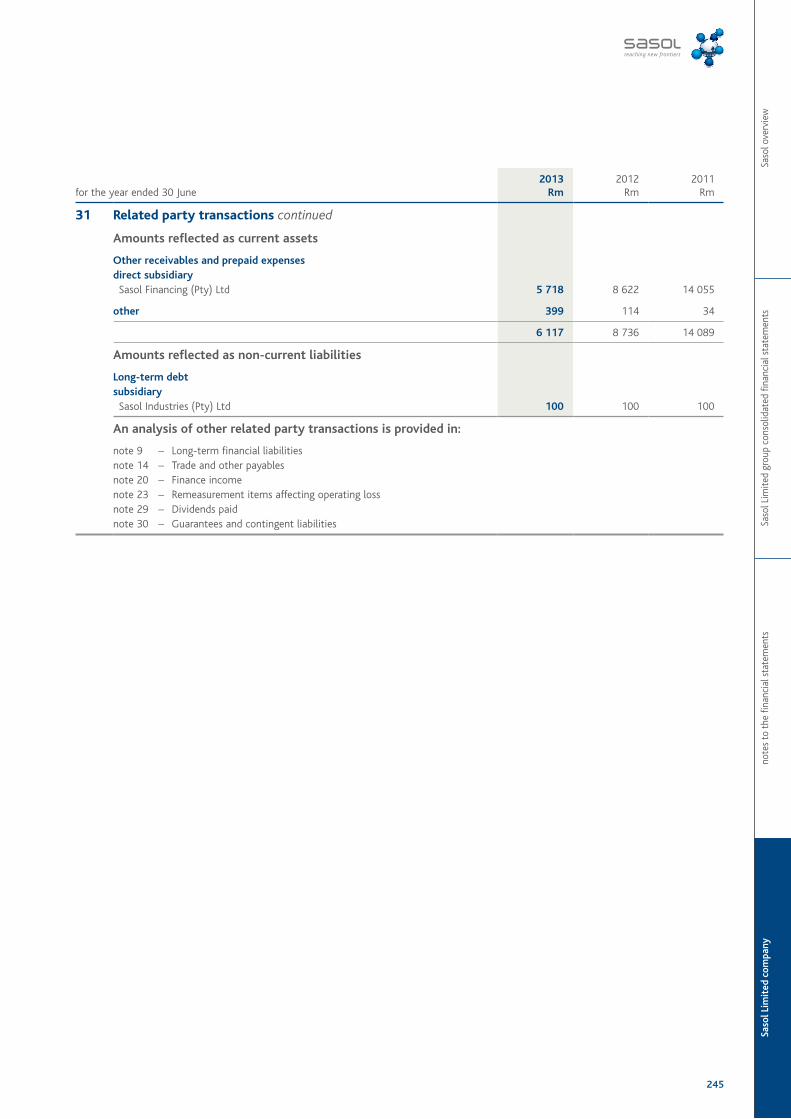
Saso
l Lim
ited
com
pany
note
s to
the
fina
ncia
l sta
tem
ents
Saso
l Lim
ited
grou
p co
nsol
idat
ed fi
nanc
ial s
tate
men
tsSa
sol o
verv
iew
245
for the year ended 30 June2013
Rm2012
Rm2011
Rm
31 Related party transactions continued
Amounts reflected as current assets
Other receivables and prepaid expensesdirect subsidiary Sasol Financing (Pty) Ltd 5 718 8 622 14 055
other 399 114 34
6 117 8 736 14 089
Amounts reflected as non-current liabilities
Long-term debtsubsidiary Sasol Industries (Pty) Ltd 100 100 100
An analysis of other related party transactions is provided in:
note 9 – Long-term financial liabilitiesnote 14 – Trade and other payablesnote 20 – Finance incomenote 23 – Remeasurement items affecting operating lossnote 29 – Dividends paidnote 30 – Guarantees and contingent liabilities
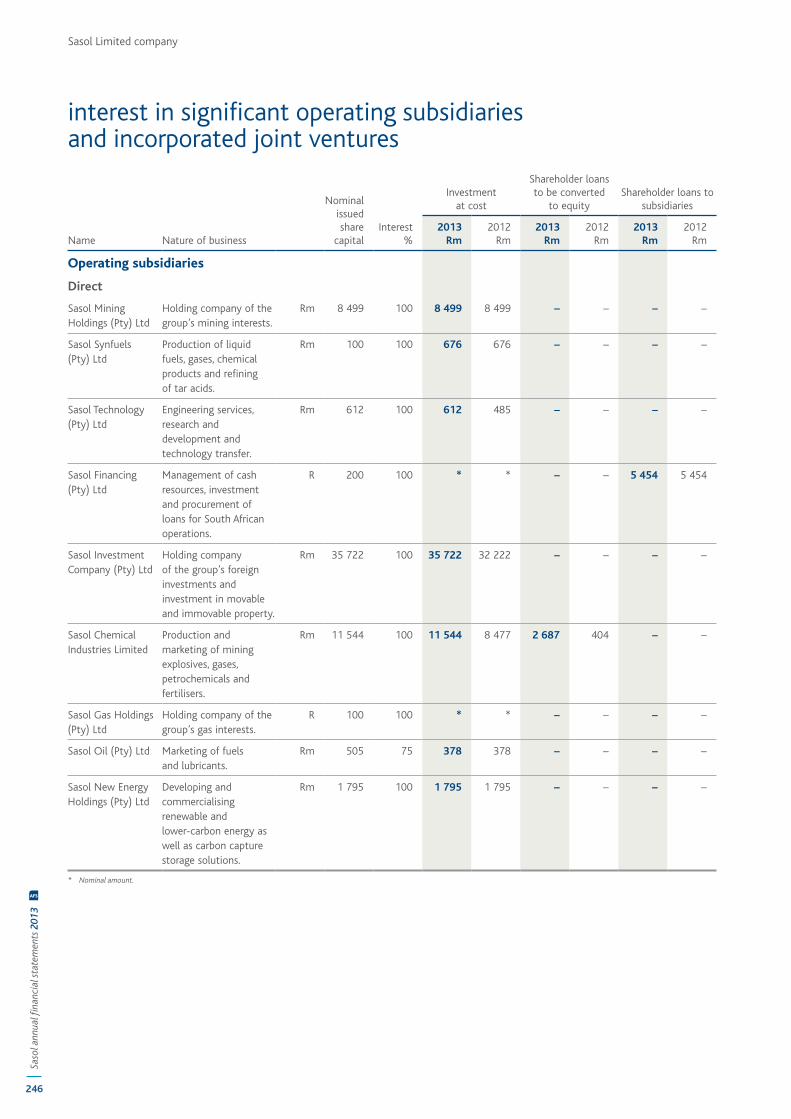
Sasol Limited company
246
Saso
l ann
ual fi
nanc
ial s
tate
men
ts 2
013
AFS
interest in significant operating subsidiaries and incorporated joint ventures
Name Nature of business
Nominal issued share
capital Interest
%
Investment at cost
Shareholder loans to be converted
to equity Shareholder loans to
subsidiaries
2013Rm
2012Rm
2013Rm
2012Rm
2013Rm
2012Rm
Operating subsidiaries
Direct
Sasol Mining Holdings (Pty) Ltd
Holding company of the group’s mining interests.
Rm 8 499 100 8 499 8 499 – – – –
Sasol Synfuels (Pty) Ltd
Production of liquid fuels, gases, chemical products and refining of tar acids.
Rm 100 100 676 676 – – – –
Sasol Technology (Pty) Ltd
Engineering services, research and development and technology transfer.
Rm 612 100 612 485 – – – –
Sasol Financing (Pty) Ltd
Management of cash resources, investment and procurement of loans for South African operations.
R 200 100 * * – – 5 454 5 454
Sasol Investment Company (Pty) Ltd
Holding company of the group’s foreign investments and investment in movable and immovable property.
Rm 35 722 100 35 722 32 222 – – – –
Sasol Chemical Industries Limited
Production and marketing of mining explosives, gases, petrochemicals and fertilisers.
Rm 11 544 100 11 544 8 477 2 687 404 – –
Sasol Gas Holdings (Pty) Ltd
Holding company of the group’s gas interests.
R 100 100 * * – – – –
Sasol Oil (Pty) Ltd Marketing of fuels and lubricants.
Rm 505 75 378 378 – – – –
Sasol New Energy Holdings (Pty) Ltd
Developing and commercialising renewable and lower-carbon energy as well as carbon capture storage solutions.
Rm 1 795 100 1 795 1 795 – – – –
* Nominal amount.
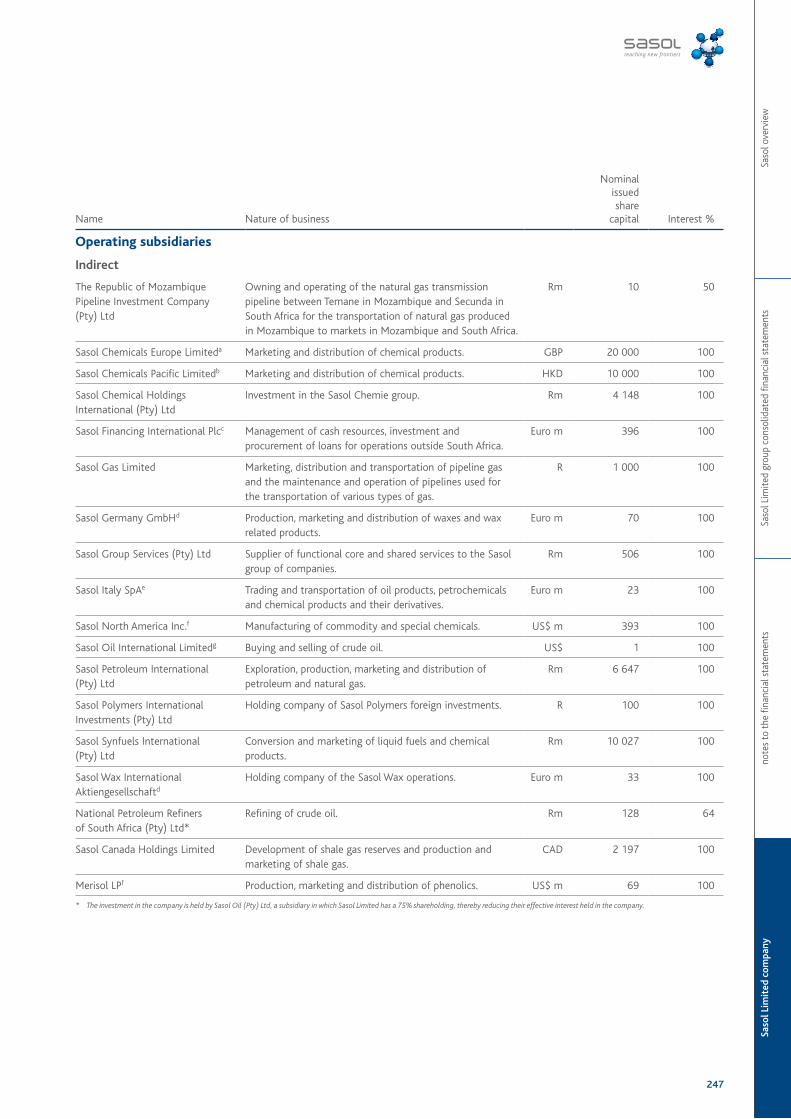
Saso
l Lim
ited
com
pany
note
s to
the
fina
ncia
l sta
tem
ents
Saso
l Lim
ited
grou
p co
nsol
idat
ed fi
nanc
ial s
tate
men
tsSa
sol o
verv
iew
247
Name Nature of business
Nominal issued share
capital Interest %
Operating subsidiaries
Indirect
The Republic of Mozambique Pipeline Investment Company (Pty) Ltd
Owning and operating of the natural gas transmission pipeline between Temane in Mozambique and Secunda in South Africa for the transportation of natural gas produced in Mozambique to markets in Mozambique and South Africa.
Rm 10 50
Sasol Chemicals Europe Limiteda Marketing and distribution of chemical products. GBP 20 000 100
Sasol Chemicals Pacific Limitedb Marketing and distribution of chemical products. HKD 10 000 100
Sasol Chemical Holdings International (Pty) Ltd
Investment in the Sasol Chemie group. Rm 4 148 100
Sasol Financing International Plcc Management of cash resources, investment and procurement of loans for operations outside South Africa.
Euro m 396 100
Sasol Gas Limited Marketing, distribution and transportation of pipeline gas and the maintenance and operation of pipelines used for the transportation of various types of gas.
R 1 000 100
Sasol Germany GmbHd Production, marketing and distribution of waxes and wax related products.
Euro m 70 100
Sasol Group Services (Pty) Ltd Supplier of functional core and shared services to the Sasol group of companies.
Rm 506 100
Sasol Italy SpAe Trading and transportation of oil products, petrochemicals and chemical products and their derivatives.
Euro m 23 100
Sasol North America Inc.f Manufacturing of commodity and special chemicals. US$ m 393 100
Sasol Oil International Limitedg Buying and selling of crude oil. US$ 1 100
Sasol Petroleum International (Pty) Ltd
Exploration, production, marketing and distribution of petroleum and natural gas.
Rm 6 647 100
Sasol Polymers International Investments (Pty) Ltd
Holding company of Sasol Polymers foreign investments. R 100 100
Sasol Synfuels International (Pty) Ltd
Conversion and marketing of liquid fuels and chemical products.
Rm 10 027 100
Sasol Wax International Aktiengesellschaftd
Holding company of the Sasol Wax operations. Euro m 33 100
National Petroleum Refiners of South Africa (Pty) Ltd*
Refining of crude oil. Rm 128 64
Sasol Canada Holdings Limited Development of shale gas reserves and production and marketing of shale gas.
CAD 2 197 100
Merisol LPf Production, marketing and distribution of phenolics. US$ m 69 100
* The investment in the company is held by Sasol Oil (Pty) Ltd, a subsidiary in which Sasol Limited has a 75% shareholding, thereby reducing their effective interest held in the company.
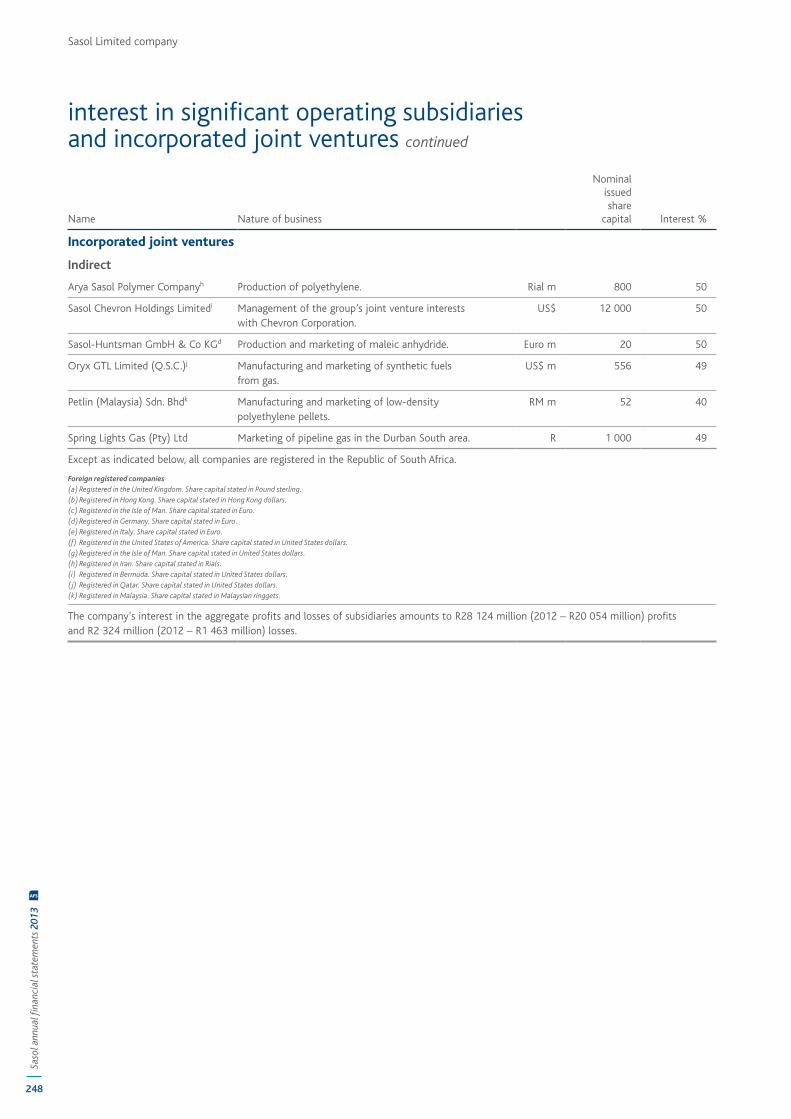
Sasol Limited company
248
Saso
l ann
ual fi
nanc
ial s
tate
men
ts 2
013
AFS
interest in significant operating subsidiaries and incorporated joint ventures continued
Name Nature of business
Nominal issued share
capital Interest %
Incorporated joint ventures
Indirect
Arya Sasol Polymer Companyh Production of polyethylene. Rial m 800 50
Sasol Chevron Holdings Limitedi Management of the group’s joint venture interests with Chevron Corporation.
US$ 12 000 50
Sasol-Huntsman GmbH & Co KGd Production and marketing of maleic anhydride. Euro m 20 50
Oryx GTL Limited (Q.S.C.)j Manufacturing and marketing of synthetic fuels from gas.
US$ m 556 49
Petlin (Malaysia) Sdn. Bhdk Manufacturing and marketing of low-density polyethylene pellets.
RM m 52 40
Spring Lights Gas (Pty) Ltd Marketing of pipeline gas in the Durban South area. R 1 000 49
Except as indicated below, all companies are registered in the Republic of South Africa.
Foreign registered companies(a) Registered in the United Kingdom. Share capital stated in Pound sterling.(b) Registered in Hong Kong. Share capital stated in Hong Kong dollars.(c) Registered in the Isle of Man. Share capital stated in Euro.(d) Registered in Germany. Share capital stated in Euro.(e) Registered in Italy. Share capital stated in Euro.(f) Registered in the United States of America. Share capital stated in United States dollars.(g) Registered in the Isle of Man. Share capital stated in United States dollars.(h) Registered in Iran. Share capital stated in Rials.(i) Registered in Bermuda. Share capital stated in United States dollars.( j) Registered in Qatar. Share capital stated in United States dollars.(k) Registered in Malaysia. Share capital stated in Malaysian ringgets.
The company’s interest in the aggregate profits and losses of subsidiaries amounts to R28 124 million (2012 – R20 054 million) profits and R2 324 million (2012 – R1 463 million) losses.
Shareholder helpline Information helpline: 0861 100 933 email: [email protected]
Assistance with AGM queries and proxy forms: Telephone: +27(0) 11 370 5511 Telefax: +27(0) 11 688 5238
Shareholder enquiries: Telephone: +27(0) 86 110 0926 Telefax: +27(0)11 688 5238
Depositary bankThe Bank of New York Mellon Depositary Receipts Division 101 Barclay Street New York, NY 10286 United States of America
Direct purchase planThe Bank of New York Mellon maintains a sponsored dividend reinvestment and direct purchase programme for Sasol’s depositary receipts. As a participant in Global BuyDIRECTSM, investors benefit from the direct ownership of their depositary receipts, the efficiency of receiving corporate communications directly from the depositary receipt issuer, and the savings resulting from the reduced brokerage and transaction costs. Additional information is available at www.globalbuydirect.com.
Questions or correspondence about Global BuyDIRECTSM should be addressed to:The Bank of New York Mellon Shareowner Services, PO Box 358516 Pittsburgh PA 15252-6825 United States of America
Toll-free telephone for US Global BuyDIRECTSM participants: 1-888-BNY-ADRS Telephone for international callers: 1-201-680-6825 E-mail: [email protected] Website: www.bnymellon.com/shareowner
Share registrarsComputershare Investor Services (Pty) Ltd. 70 Marshall Street Johannesburg 2001 Republic of South Africa
PO Box 61051 Marshalltown 2107 Republic of South Africa
Telephone: +27(0) 11 370 7700
Company registration number1979/003231/06
Sasol contactsBusiness address and registered office: 1 Sturdee Avenue Rosebank 2196 Johannesburg Republic of South Africa
Postal and electronic addresses and telecommunication numbers:PO Box 5486 Johannesburg 2000 Republic of South Africa
Telephone: +27(0) 11 441 3111 Telefax: +27(0) 11 788 5092 Website: www.sasol.com
Investor relationsTelephone: +27(0) 11 441 3113 E-mail: [email protected]
Corporate affairsTelephone: +27(0) 11 441 3237 Telefax: +27(0) 11 441 3236
contact information
Forward-looking statements: Contingent resources are defined as those quantities of petroleum estimated, as of a given date, to be potentially recoverable from a known accumulation by application of development projects, but which are not currently considered to be commercially recoverable due to one or more contingencies. There is therefore uncertainty as to the portion of the volumes identified as contingent resources that will be commercially producible. Sasol may, in this document, make certain statements that are not historical facts and relate to analyses and other information which are based on forecasts of future results and estimates of amounts not yet determinable. These statements may also relate to our future prospects, developments and business strategies. Examples of such forward-looking statements include, but are not limited to, statements regarding exchange rate fluctuations, volume growth, increases in market share, total shareholder return and cost reductions. Words such as “believe”, “anticipate”, “expect”, “intend”, “seek”, “will”, “plan”, “could”, “may”, “endeavour” and “project” and similar expressions are intended to identify such forward-looking statements, but are not the exclusive means of identifying such statements. By their very nature, forward-looking statements involve inherent risks and uncertainties, both general and specific, and there are risks that the predictions, forecasts, projections and other forward-looking statements will not be achieved. If one or more of these risks materialise, or should underlying assumptions prove incorrect, our actual results may differ materially from those anticipated. You should understand that a number of important factors could cause actual results to differ materially from the plans, objectives, expectations, estimates and intentions expressed in such forward-looking statements. These factors are discussed more fully in our most recent annual report under the Securities Exchange Act of 1934 on Form 20-F filed on 9 October 2013 and in other filings with the United States Securities and Exchange Commission. The list of factors discussed therein is not exhaustive; when relying on forward-looking statements to make investment decisions, you should carefully consider both these factors and other uncertainties and events. Forward-looking statements apply only as of the date on which they are made, and we do not undertake any obligation to update or revise any of them, whether as a result of new information, future events or otherwise.
Please note: A billion is defined as one thousand million. All references to years refer to the financial year ended 30 June. Any reference to a calendar year is prefaced by the word “calendar”.
www.sasol.com