Embed Size (px)
Citation preview
Chapter 2Financial Statements
and Cash Flows
2.1Financial Statements
Financial Statements Balance sheetIncome statementStatement of cash flows
Balance SheetStatement of financial position.The balance sheet is a financial statement
that shows the firm’s assets, liabilities and equity at a given point in time.
Balance Sheet IdentityAssets = Liabilities + Shareholders’ Equity
(Owner’s Equity)
Assets and LiquidityThe speed and ease with which an asset can
be converted to cash.Ease of conversion to cash.Without significant loss in value.
Trade-off between the advantages of liquidity and foregone potential profits.The more liquid a firm is, the less likely it is to
experience financial distress.The return on liquid assets is low.
Debt versus EquityShareholder’s equity = Assets – LiabilitiesShareholder’s equity is the residual portion
and equity owners are entitled to only the residual value.
The use of debt in a firm’s capital is called financial leverage. The more debt a firm has, the greater of financial leverage.
Net Working CapitalNet Working Capital = Current Assets – Current
LiabilitiesPositive when current assets exceed current
liabilities.Positive when the cash that will become
available over the next 12 months exceeds the cash that will be paid over the next 12 months.
Usually positive in a healthy firm.
Market Value versus Book ValueBook value – the balance sheet
Assets at historical costs.Market value - the price at which an item
could be bought or soldStockholder wealth maximization is to
maximize the market value of the stock, not the book value.
Income StatementProfit and loss statement.Statement of financial performance.The income statement shows the revenue and
expenses of a firm during a period of time.Revenue – Expenses = IncomeAccounting net income is not the same as
cash flow. Depreciation, a noncash expense, is deducted
when net income is calculated.
Sources and Uses of CashSources of cash
Cash inflowsDecrease in assets other than cash Increase in liabilities or equity
Uses of cashCash outflowsIncrease in assets other than cashDecrease in liabilities or equity
Statement of Cash FlowsThe statement which summarizes the
sources and uses of cash.Three categories
Operating activitiesInvestment activities Financing activities
2.2Cash Flows
Cash FlowThe difference between the number of money
that came in and the number that went out.The actual net cash, as opposed to
accounting net income, that flows into or out of a firm during a certain period.
Free cash flow refers to the cash that the firm is free to distribute to creditors or stockholders because it is not needed for working capital or fixed asset investment.
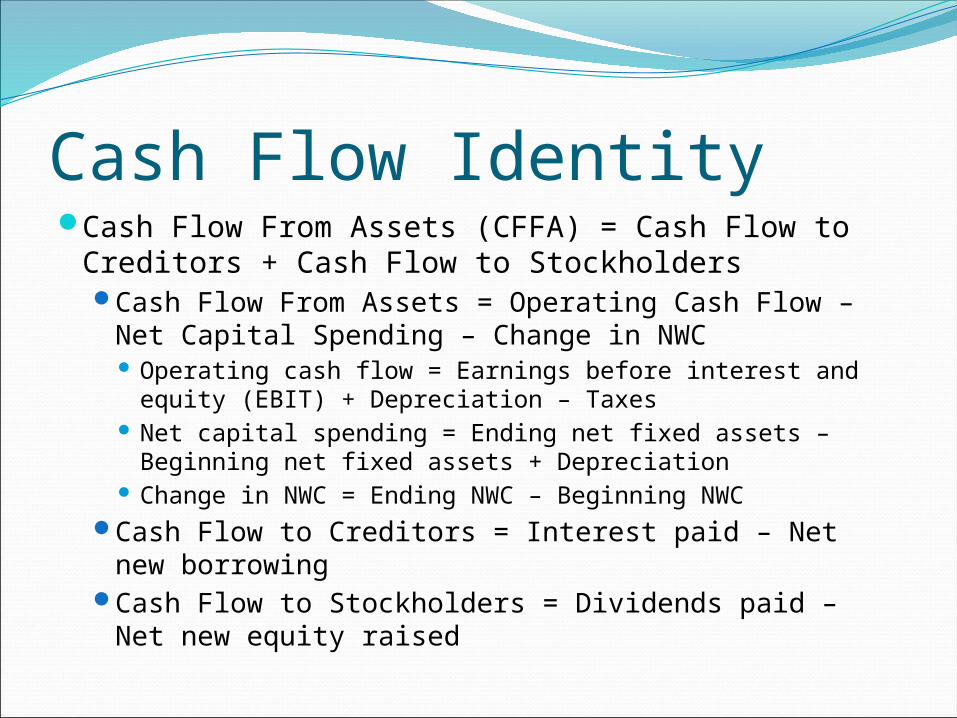
Cash Flow IdentityCash Flow From Assets (CFFA) = Cash Flow to
Creditors + Cash Flow to StockholdersCash Flow From Assets = Operating Cash Flow –
Net Capital Spending – Change in NWC Operating cash flow = Earnings before interest and
equity (EBIT) + Depreciation – Taxes Net capital spending = Ending net fixed assets –
Beginning net fixed assets + Depreciation Change in NWC = Ending NWC – Beginning NWC
Cash Flow to Creditors = Interest paid – Net new borrowing
Cash Flow to Stockholders = Dividends paid – Net new equity raised
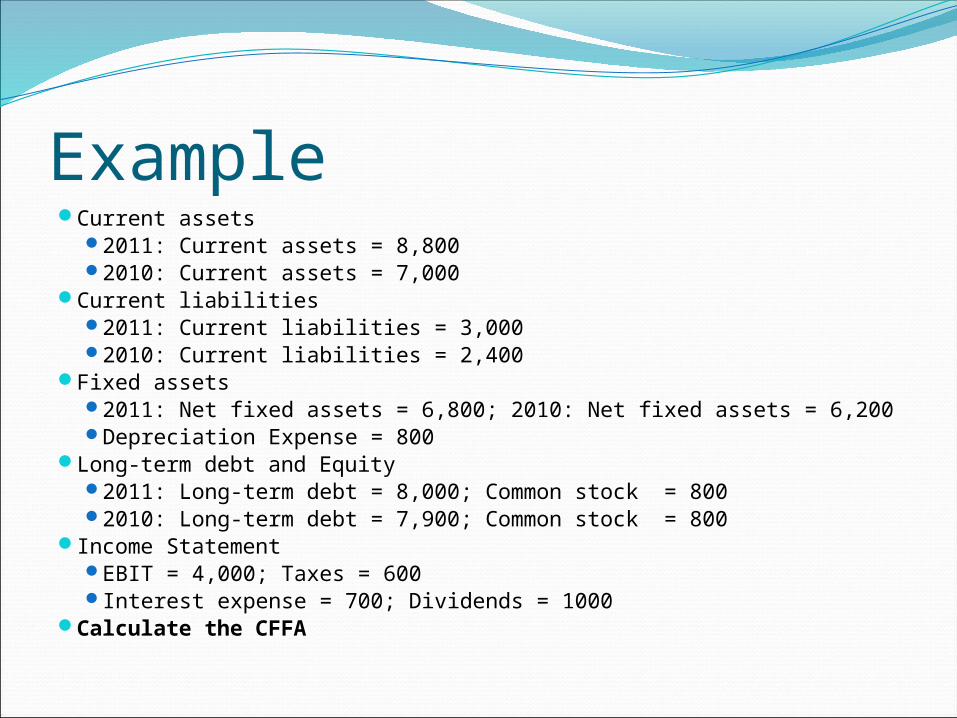
Example Current assets
2011: Current assets = 8,800 2010: Current assets = 7,000
Current liabilities 2011: Current liabilities = 3,000 2010: Current liabilities = 2,400
Fixed assets 2011: Net fixed assets = 6,800; 2010: Net fixed assets = 6,200 Depreciation Expense = 800
Long-term debt and Equity 2011: Long-term debt = 8,000; Common stock = 800 2010: Long-term debt = 7,900; Common stock = 800
Income Statement EBIT = 4,000; Taxes = 600 Interest expense = 700; Dividends = 1000
Calculate the CFFA
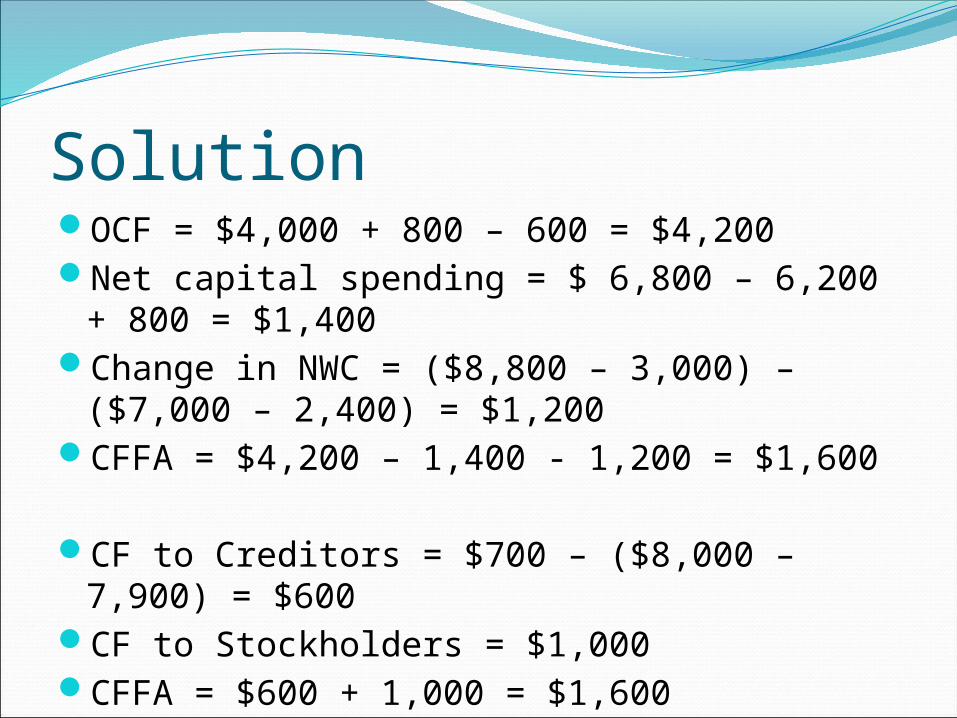
SolutionOCF = $4,000 + 800 – 600 = $4,200Net capital spending = $ 6,800 – 6,200 + 800
= $1,400Change in NWC = ($8,800 – 3,000) – ($7,000
– 2,400) = $1,200CFFA = $4,200 – 1,400 - 1,200 = $1,600
CF to Creditors = $700 – ($8,000 – 7,900) = $600
CF to Stockholders = $1,000CFFA = $600 + 1,000 = $1,600
2.3Working withFinancial Statements
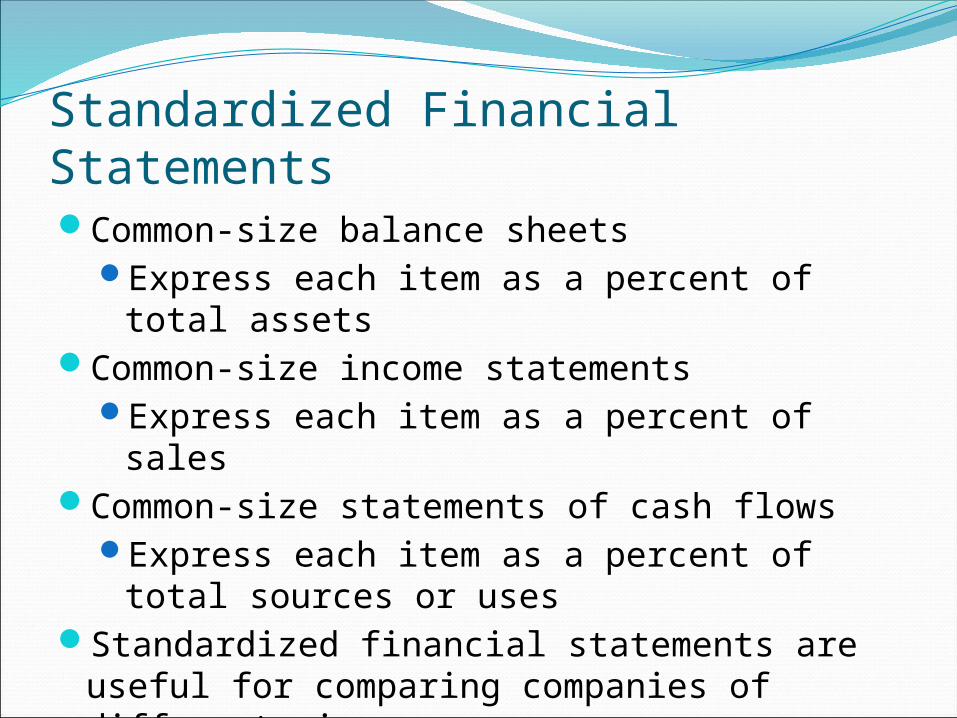
Standardized Financial StatementsCommon-size balance sheets
Express each item as a percent of total assets
Common-size income statementsExpress each item as a percent of sales
Common-size statements of cash flowsExpress each item as a percent of total
sources or usesStandardized financial statements are useful
for comparing companies of different sizes.
Trend AnalysisCommon base-year statements
Choose a base year and express each item relative to the base amount.
Combined common-size base-year analysisAs the assets grow, most of the other accounts
must grow as well.By forming the common-size statements, the
effect of the overall growth would be eliminated.
Ratio AnalysisRatio analysis are useful for comparing through
time or between companies.Categories of financial ratios
Short-term solvency or liquidity ratiosLong-term solvency or financial leverage ratiosAsset management or turnover ratiosProfitability ratiosMarket value ratios
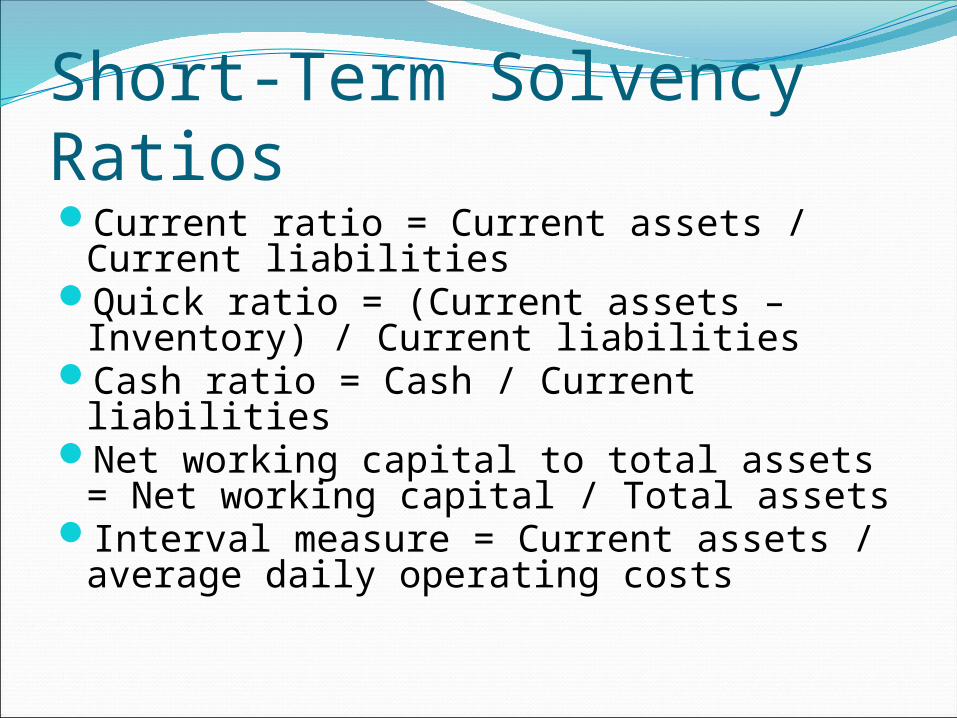
Short-Term Solvency RatiosCurrent ratio = Current assets / Current
liabilitiesQuick ratio = (Current assets – Inventory)
/ Current liabilitiesCash ratio = Cash / Current liabilitiesNet working capital to total assets = Net
working capital / Total assetsInterval measure = Current assets /
average daily operating costs
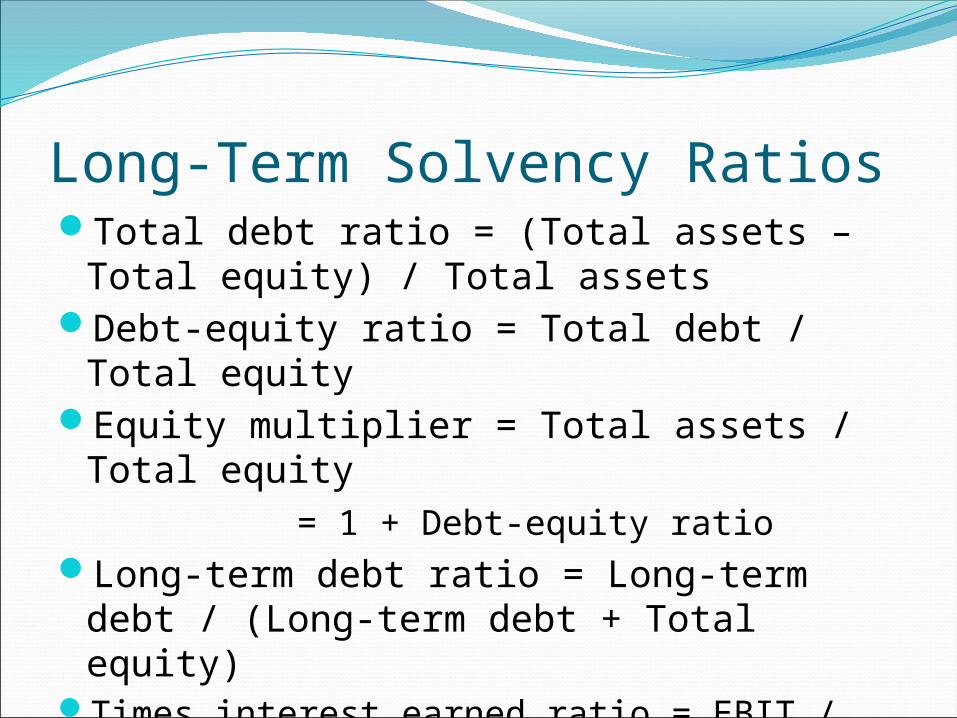
Long-Term Solvency RatiosTotal debt ratio = (Total assets – Total
equity) / Total assetsDebt-equity ratio = Total debt / Total
equityEquity multiplier = Total assets / Total
equity = 1 + Debt-equity ratio
Long-term debt ratio = Long-term debt / (Long-term debt + Total equity)
Times interest earned ratio = EBIT / InterestCash coverage ratio = (EBIT +
Depreciation) / Interest
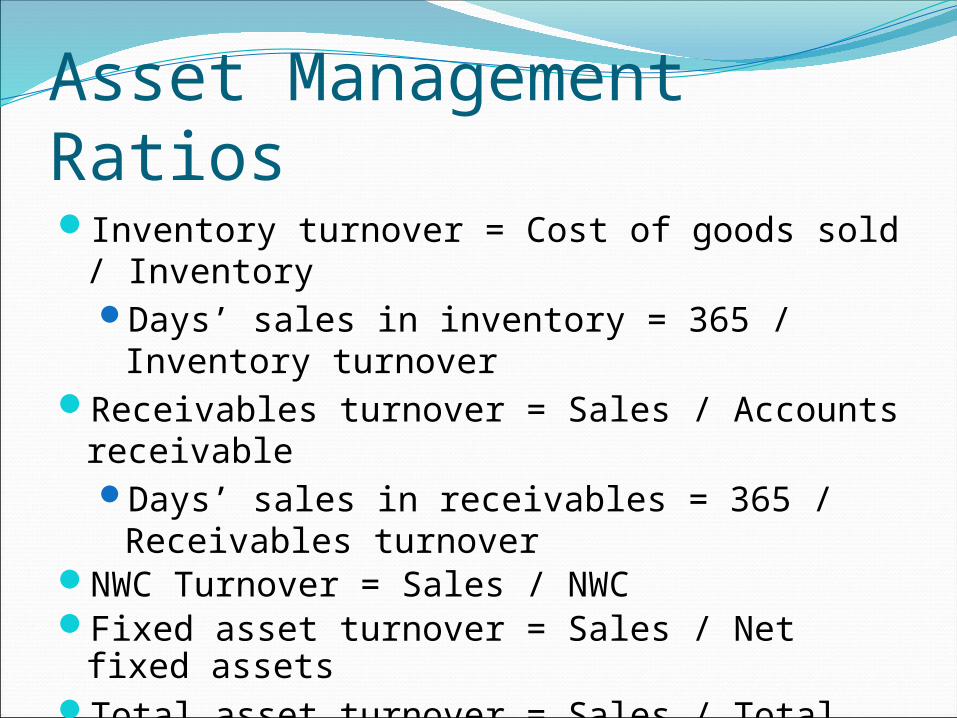
Asset Management RatiosInventory turnover = Cost of goods sold /
InventoryDays’ sales in inventory = 365 / Inventory
turnoverReceivables turnover = Sales / Accounts
receivableDays’ sales in receivables = 365 /
Receivables turnoverNWC Turnover = Sales / NWCFixed asset turnover = Sales / Net fixed
assetsTotal asset turnover = Sales / Total assets
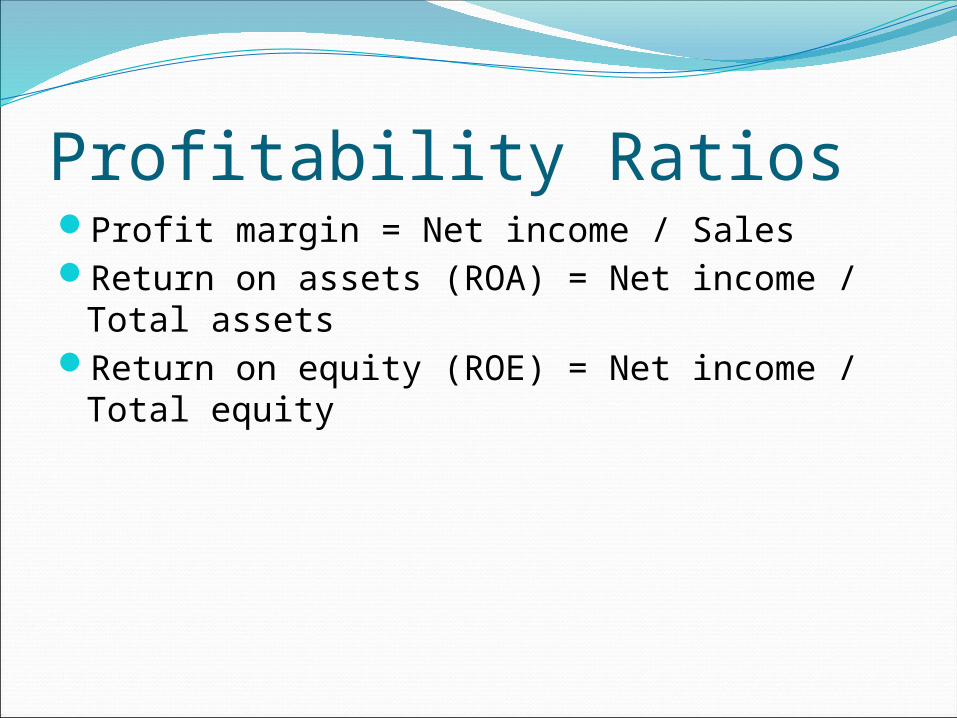
Profitability RatiosProfit margin = Net income / SalesReturn on assets (ROA) = Net income / Total
assetsReturn on equity (ROE) = Net income / Total
equity
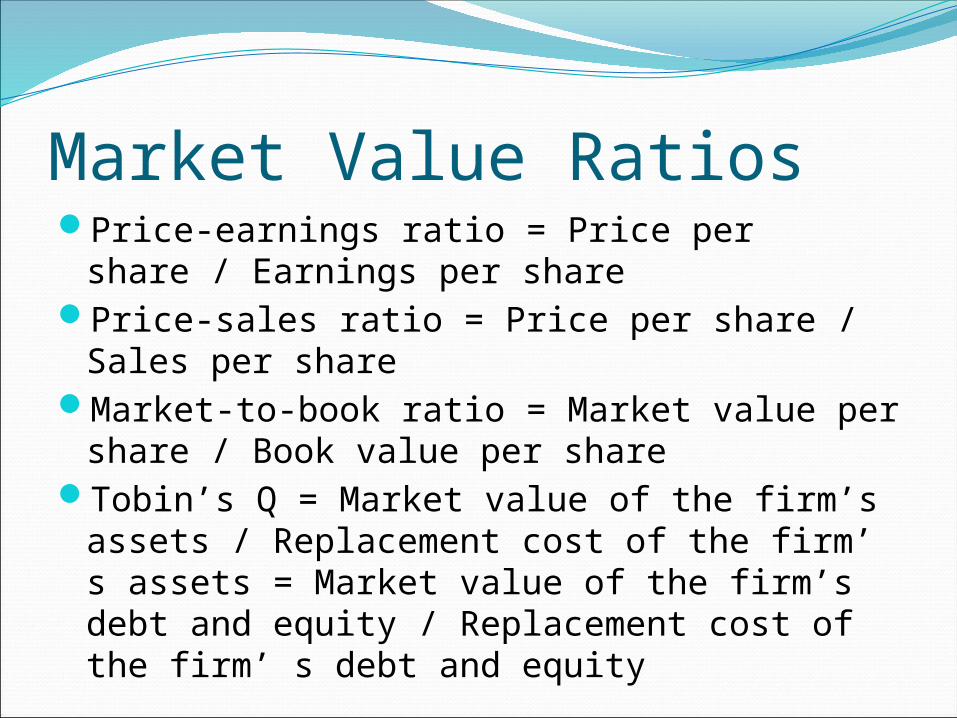
Market Value RatiosPrice-earnings ratio = Price per share /
Earnings per sharePrice-sales ratio = Price per share / Sales per
shareMarket-to-book ratio = Market value per
share / Book value per shareTobin’s Q = Market value of the firm’s
assets / Replacement cost of the firm’ s assets = Market value of the firm’s debt and equity / Replacement cost of the firm’ s debt and equity
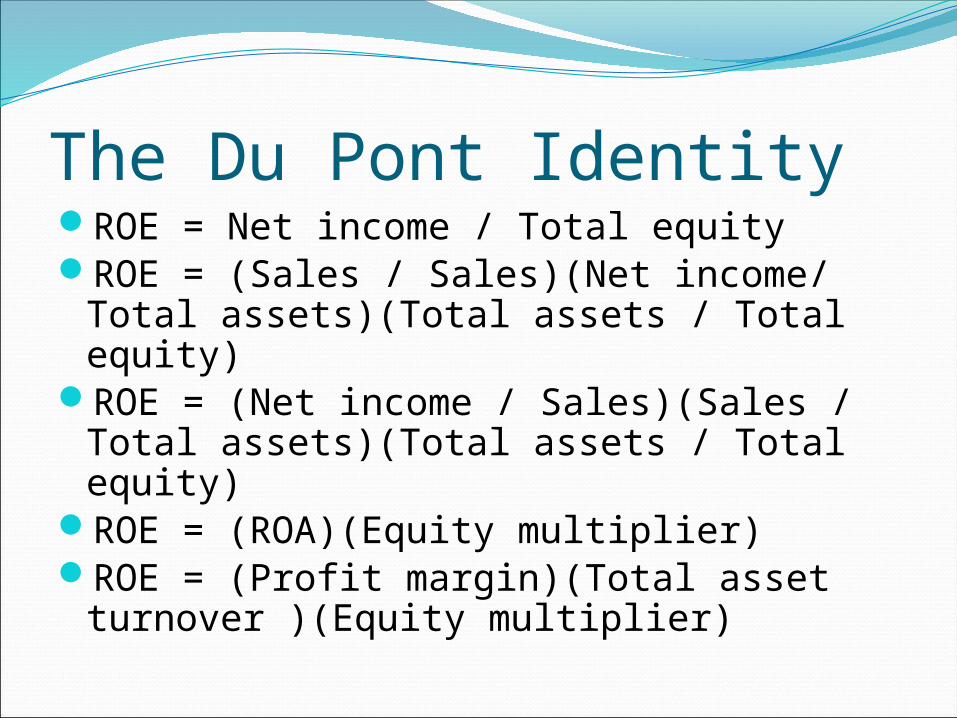
The Du Pont IdentityROE = Net income / Total equityROE = (Sales / Sales)(Net income/ Total
assets)(Total assets / Total equity)ROE = (Net income / Sales)(Sales / Total
assets)(Total assets / Total equity)ROE = (ROA)(Equity multiplier)ROE = (Profit margin)(Total asset
turnover )(Equity multiplier)
The Du Pont IdentityROE = (Profit margin)(Total asset
turnover)(Equity multiplier)Profit margin – profitability ratio, operating
efficiency Total asset turnover – asset management
ratio, asset use efficiencyEquity multiplier – long-term solvency ratio,
financial leverage
Why Evaluate Financial Statements?Internal uses
Performance evaluationPlanning for the future
External usesCreditorsSuppliersCustomersCredit-rating agencies

Choosing a BenchmarkTime-trend analysis
Compared to historyPeer group analysis
Compare to the peer group
LimitationsThe results of ratio analysis depend on the
quality of financial statements. It is difficult for diversified firms to find a
benchmark.Factors such as inflation, different operating
and accounting practices, seasonal factors can distort comparisons.
It is difficult to judge whether a particular ratio is “good” or “bad”.
It is difficult to judge whether a firm is “good” or “bad” if some ratios look “good” and some ratios look “bad”.