Embed Size (px)
Citation preview

Annual Report andFinancial Statementsfor the year ended 30 June 2010


www.jpelonline.com 4
J.P. Morgan Private Equity Limited
J.P. Morgan Private Equity Limited
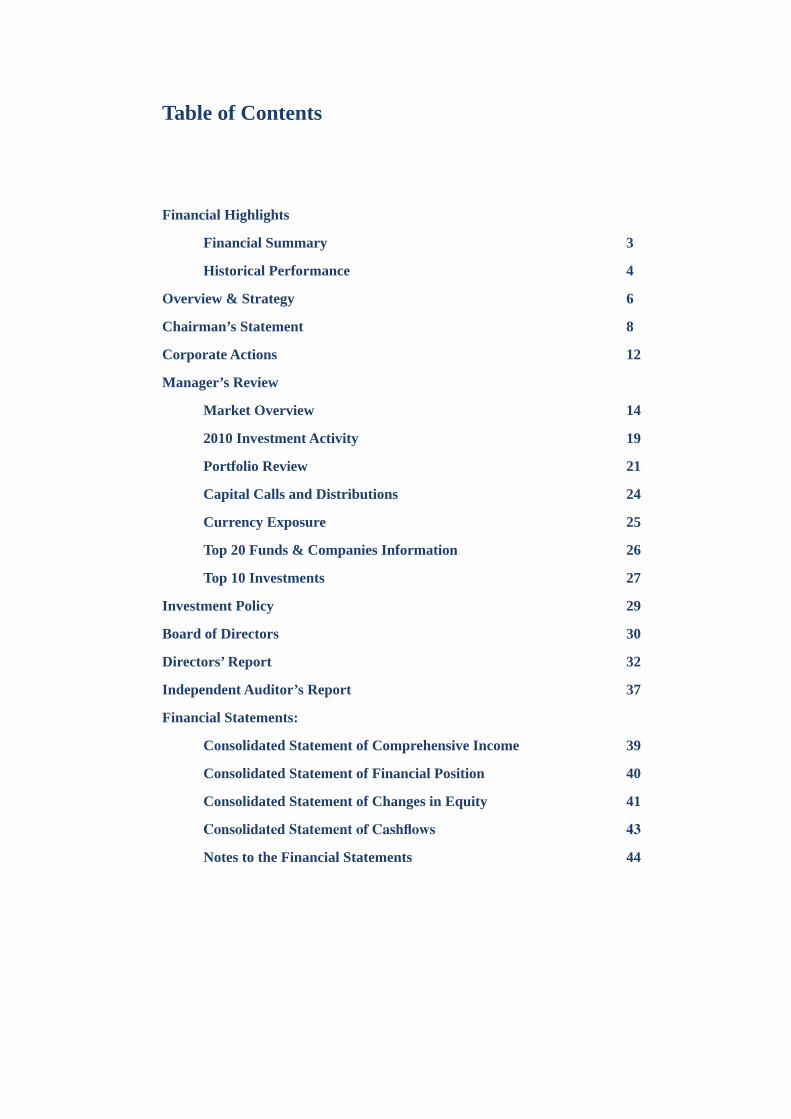
Table of Contents
Financial Highlights
Financial Summary 3
Historical Performance 4
Overview & Strategy 6
Chairman’s Statement 8
Corporate Actions 12
Manager’s Review
Market Overview 14
2010 Investment Activity 19
Portfolio Review 21
Capital Calls and Distributions 24
Currency Exposure 25
Top 20 Funds & Companies Information 26
Top 10 Investments 27
Investment Policy 29
Board of Directors 30
Directors’ Report 32
Independent Auditor’s Report 37
Financial Statements:
Consolidated Statement of Comprehensive Income 39
Consolidated Statement of Financial Position 40
Consolidated Statement of Changes in Equity 41
ConsolidatedStatementofCashflows 43
Notes to the Financial Statements 44

www.jpelonline.com 2
J.P. Morgan Private Equity Limited J.P. Morgan Private Equity Limited
Financial Highlights
J.P. Morgan Private Equity Limited J.P. Morgan Private Equity Limited
www.jpelonline.com3
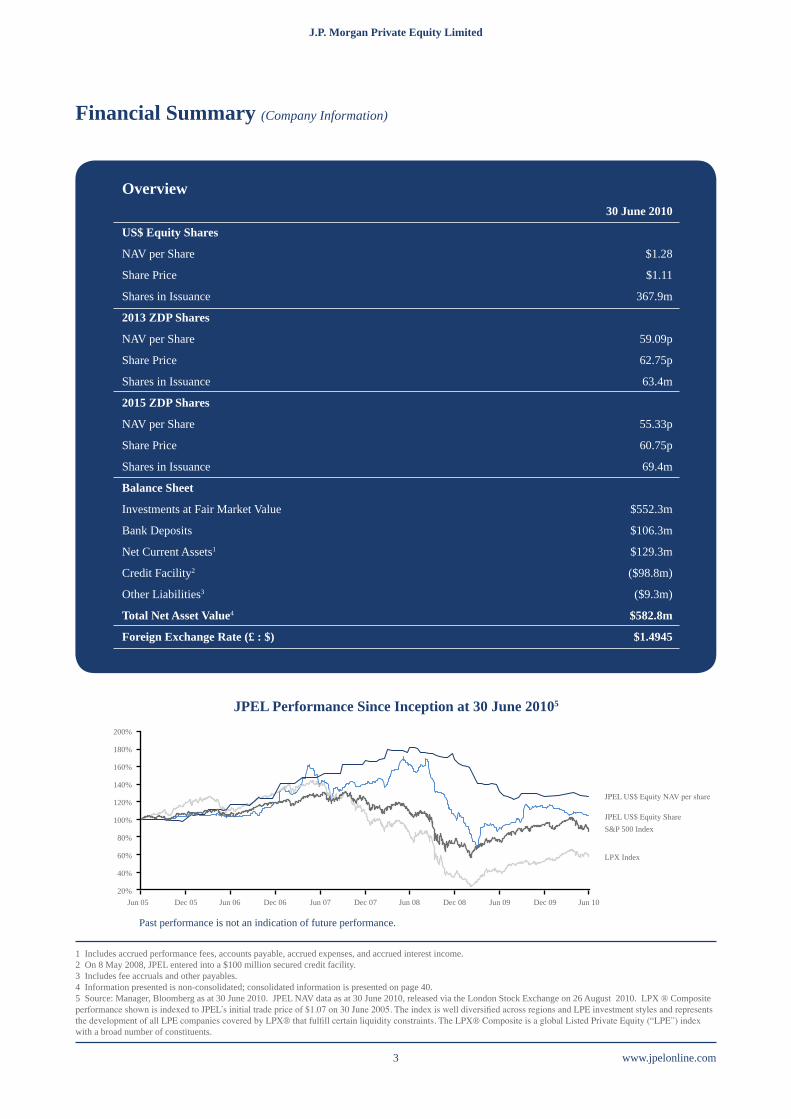
Financial Summary (Company Information)
Overview 30 June 2010
US$ Equity Shares
NAV per Share $1.28
Share Price $1.11
Shares in Issuance 367.9m
2013 ZDP Shares
NAV per Share 59.09p
Share Price 62.75p
Shares in Issuance 63.4m
2015 ZDP Shares
NAV per Share 55.33p
Share Price 60.75p
Shares in Issuance 69.4m
Balance Sheet
Investments at Fair Market Value $552.3m
Bank Deposits $106.3m
Net Current Assets1 $129.3m
Credit Facility2 ($98.8m)
Other Liabilities3 ($9.3m)
Total Net Asset Value4 $582.8m
Foreign Exchange Rate (£ : $) $1.4945
1 Includes accrued performance fees, accounts payable, accrued expenses, and accrued interest income.2 On 8 May 2008, JPEL entered into a $100 million secured credit facility. 3 Includes fee accruals and other payables.4 Information presented is non-consolidated; consolidated information is presented on page 40.5 Source: Manager, Bloomberg as at 30 June 2010. JPEL NAV data as at 30 June 2010, released via the London Stock Exchange on 26 August 2010. LPX ® Composite performance shown is indexed to JPEL’s initial trade price of $1.07 on 30 June 2005. The index is well diversified across regions and LPE investment styles and represents the development of all LPE companies covered by LPX® that fulfill certain liquidity constraints. The LPX® Composite is a global Listed Private Equity (“LPE”) index with a broad number of constituents.
JPEL Performance Since Inception at 30 June 20105
200%
180%
160%
140%
120%
100%
80%
60%
40%
20%Jun 05 Dec 05 Jun 06 Dec 06 Jun 07 Dec 07 Jun 08 Dec 08 Jun 09 Dec 09 Jun 10
JPEL US$ Equity NAV per share
JPEL US$ Equity ShareS&P 500 Index
LPX Index
Past performance is not an indication of future performance.
www.jpelonline.com 4
J.P. Morgan Private Equity Limited J.P. Morgan Private Equity Limited
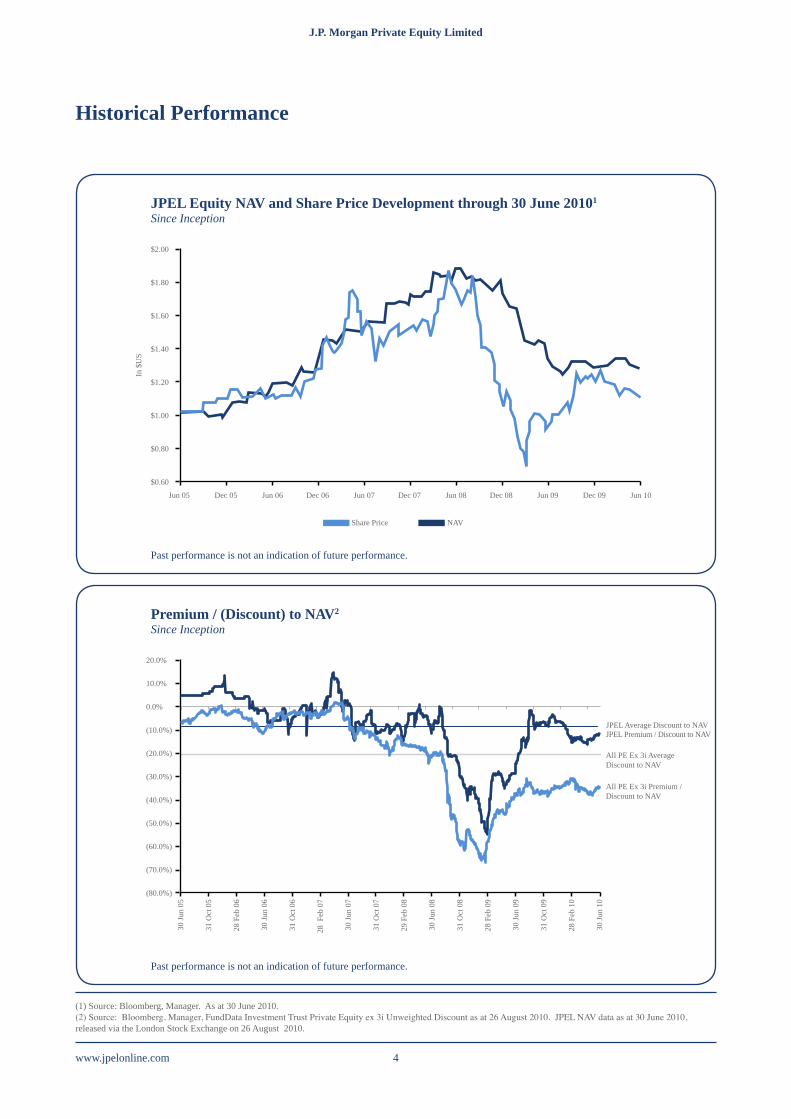
Historical Performance
JPEL Equity NAV and Share Price Development through 30 June 20101
Since Inception
Premium / (Discount) to NAV2
Since Inception
Past performance is not an indication of future performance.
Past performance is not an indication of future performance.
$2.00
$1.80
$1.60
$1.40
$1.20
$1.00
$0.80
$0.60
20.0%
10.0%
0.0%
(10.0%)
(20.0%)
(30.0%)
(40.0%)
(50.0%)
(60.0%)
(70.0%)
(80.0%)
Jun 05 Dec 05 Jun 06 Dec 06 Jun 07 Dec 07 Jun 08 Dec 08 Jun 09 Dec 09 Jun 10
Share Price NAV
In $
US
30 Ju
n 05
31 O
ct 0
5
28 F
eb 0
6
30 Ju
n 06
31 O
ct 0
6
28 F
eb 0
7
30 Ju
n 07
31 O
ct 0
7
29 F
eb 0
8
30 Ju
n 08
31 O
ct 0
8
28 F
eb 0
9
30 Ju
n 09
31 O
ct 0
9
28 F
eb 1
0
30 Ju
n 10
JPEL Average Discount to NAVJPEL Premium / Discount to NAV
All PE Ex 3i Average Discount to NAV
All PE Ex 3i Premium / Discount to NAV
(1) Source: Bloomberg, Manager. As at 30 June 2010.(2) Source: Bloomberg, Manager, FundData Investment Trust Private Equity ex 3i Unweighted Discount as at 26 August 2010. JPEL NAV data as at 30 June 2010, released via the London Stock Exchange on 26 August 2010.
J.P. Morgan Private Equity Limited J.P. Morgan Private Equity Limited
www.jpelonline.com5
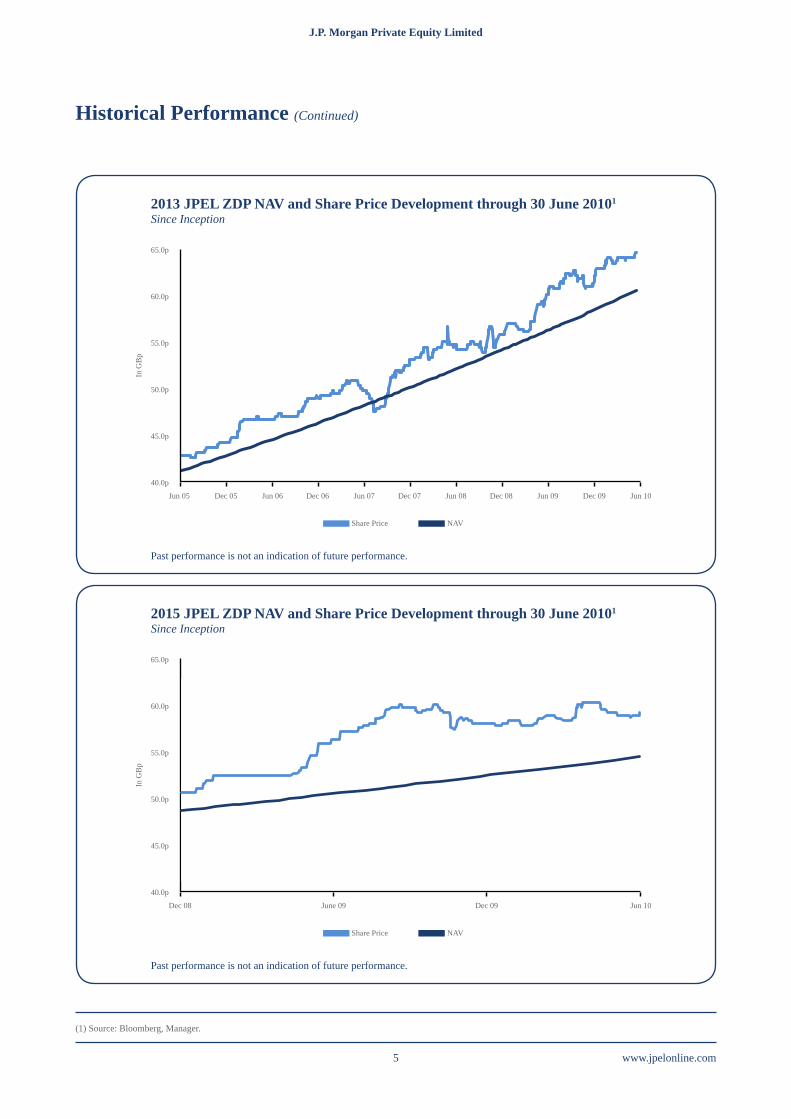
Historical Performance (Continued)
2013 JPEL ZDP NAV and Share Price Development through 30 June 20101 Since Inception
2015 JPEL ZDP NAV and Share Price Development through 30 June 20101 Since Inception
Past performance is not an indication of future performance.
Past performance is not an indication of future performance.
65.0p
60.0p
55.0p
50.0p
45.0p
40.0p
65.0p
60.0p
55.0p
50.0p
45.0p
40.0p
Jun 05 Dec 05 Jun 06 Dec 06 Jun 07 Dec 07 Jun 08 Dec 08 Jun 09 Dec 09 Jun 10
Dec 08 June 09 Dec 09 Jun 10
Share Price NAV
Share Price NAV
In G
Bp
In G
Bp
(1) Source: Bloomberg, Manager.
www.jpelonline.com 6
J.P. Morgan Private Equity Limited J.P. Morgan Private Equity Limited
Overview
J.P. Morgan Private Equity Limited (“JPEL” or the “Company”) is a Guernsey registered and incorporated closed ended investment company that trades on the London Stock Exchange (LSE: JPEL, JPEZ, JPZZ, JPWW). The Company is designed primarily to invest in the global private equity market. The fair value of the Company’s total assets as at 30 June 2010 was $690.9 million.
JPEL held its initial public offering on 30 June 2005 under the name “Bear Stearns Private Equity Limited”. The Company currently has three classes of shares: US$ Equity Shares, 2013 Zero Dividend Preference Shares (“2013 ZDP Shares”) and 2015 Zero Dividend Preference Shares (“2015 ZDP Shares”). At 30 June 2010, 2013 ZDP Shares made up 9.6% of total capital, 2015 ZDP Shares made up 9.9% of total capital and US$ Equity Shares made up the remaining 80.5%.
JPEL issued warrants free of subscription cost to shareholders on record as at 17 August 2009. One warrant was issued for every six US$ Equity Shares owned. The warrants are publicly traded on the London Stock Exchange under the symbol “JPWW”. As at the time of publication of the Annual Report, there were 57,928,923 warrants in issuance.
JPEL is managed by Bear Stearns Asset Management Inc. (“BSAM Inc.” or the “Manager”), a wholly-owned subsidiary of JPMorgan Chase & Co. Following the acquisition of The Bear Stearns Companies Inc. by JPMorgan Chase & Co., the investment management team within BSAM Inc. that has managed the Company since its inception joined J.P. Morgan Asset Management. The Company has entered into a management agreement with the Manager to invest the assets of the Company on a discretionary basis, subject to the overall supervision of the Board of Directors (the “Directors”), a majority of whom are independent. The Directors are responsible for the determination of the Manager’s investment policy and have overall responsibility for the Company’s activities.
JPMorgan Chase & Co. (NYSE: JPM) is a leading global financial services firm with assets of $2.1 trillion and operations in more than 60 countries. The firm is a leader in investment banking, financial services for consumers, small business and commercial banking, financial transaction processing, asset management, and private equity.
StrategyThe Company primarily pursues the following strategies to enhance shareholder value and to meet its investment objective:• acquires secondary portfolios of direct investments and significantly invested partnership investments to accelerate NAV
development;• opportunistically invests in buyout, venture capital, and other special situations funds and investments on a global basis
on attractive transaction values, advantageous market conditions, and compelling risk-adjusted return potential;• obtains exposure to individual companies by co-investing alongside private equity sponsors in companies that offer the
potential for substantial equity appreciation;• diversifies its portfolio by manager, industry, geography, investment stage, and vintage year; and actively manages the
portfolio by repositioning its investment composition from time to time in order to capitalise on changes in private equity market conditions.
In summary, the investment objective of the Company is to achieve both short-term and long-term capital appreciation by in-vesting in a well-diversified portfolio of private equity fund interests and by capitalising on the inefficiencies of the secondary private equity market.

J.P. Morgan Private Equity Limited J.P. Morgan Private Equity Limited
www.jpelonline.com7
Chairman’s Statement
www.jpelonline.com 8
J.P. Morgan Private Equity Limited J.P. Morgan Private Equity Limited
Chairman’s Statement
ThisyearmarksJPEL’sfifthanniversary
JPEL began operations five years ago as a small, unknown entrant in the listed private equity sector with just over $60 million in assets. Today, the Company is recognised as a market leader. JPEL has a portfolio of approximately $690 million and trades at a significant premium to its peers. Over the last five years, JPEL outperformed public indices and has been a top performer in its sector. But, as I look back over the past five years, I am most proud of how the Company and the Manager performed during the financial crisis. In 2009, the Manager and the Board acted aggressively to preserve value and to improve JPEL’s balance sheet. JPEL reduced unfunded commitments, raised approximately $144 million in a very difficult fundraising environment, issued bonus warrants in lieu of tendering shares, and was ever-present in the market to reassure investors. I believe these actions resulted in a Company that is well-positioned for the future and are why JPEL is recognised with a premium rating.
Likewise, I am proud of what the Company achieved during the past year. JPEL continued to be cautious while returning to its core business: investing in quality companies around the globe at deep value purchase prices.
Among the key events of the past year, I would highlight the following:
Ordinary share price appreciation.• The US$ Equity Share price increased 15.9% for fiscal year 2010, outperforming the MSCI World Index by 7.9 percentage points. Moreover, JPEL currently trades at a relatively narrow 10.9% discount to Net Asset Value (“NAV”) as compared to a 45.8% discount for its peer group.1
ZDP share price appreciation. • 2013 ZDP and 2015 ZDP share prices increased by 6.8% and 3.8%, respectively. Both classes of ZDPs trade at significant premiums of 7.0% and 15.2% to NAV, respectively.1 In addition, JPEL’s ZDP share classes have strong coverage ratios of 8.2x for the 2013 ZDPs and 5.5x for the 2015 ZDPS.2
Additional capital secured.• From June to September 2009, JPEL raised $93.5 million and in November 2009 the Company raised a further £30 million in an oversubscribed offering of 2015 ZDP Shares, totalling $143.5 million raised in calendar year 2009.
Tender resumed.• As we recently announced in September 2010, JPEL will be making a tender offer to purchase up to 3% of current Shares outstanding. Offering the tender is a direct result of the Company’s strong balance sheet and the recent increase in distribution activity from underlying investments. When distribution activity is sufficient, the Company endeavours to give shareholders the ability to periodically redeem shares at NAV even when the stock price trades at a discount. Since its IPO in 2005, JPEL has returned over $112 million to shareholders and over $95 million since 2008.3 JPEL is the only listed private equity fund to offer a tender.
Asian exposure doubled.• During fiscal year 2010, JPEL doubled its exposure to Asian assets. At 30 June 2010, JPEL’s exposure to Asia was 21% of the private equity portfolio as compared to 11% as at 30 June 2009. The Manager has focused on growth companies with lower levels of debt and has found ways to invest in this region at compelling entry valuations.
As JPEL embarks on the next five years, I remain confident that the Company is well positioned for the future. I believe JPEL has the right investment strategy, the right portfolio, and the right capital structure needed to navigate current markets. Importantly, the Com-pany’s strong balance sheet positions it to withstand further market disruptions, should they arise.
(1) Cazenove Alternative Stats, Bloomberg as at 26 August 2010 when JPEL’s 30 June 2010 NAV was released via RNS. Snapshot of performance on 26 August 2010 and does not represent the average discount to NAV since inception. The Peer group is not an exhaustive list and is based on the multi-manager peer group included in LPE Focus | RBS manager survey – June 2010 and includes a selection of funds set forth in such research. The peer group includes: APEN, SHPN, PEHN, PIN, CPEN, PEY, CCAP, ABSP, HPEQ, FPEO, NBPE, HVPE, SEP.(2) J.P. Morgan Cazenove Inv Cos Daily Splits Stats as at 1 July 2010. Based on non-cumulative cover. (3) Includes operation of JPEL’s tender facility for the quarters ending 31 December 2007, 30 June 2008 and 31 December 2008.
J.P. Morgan Private Equity Limited J.P. Morgan Private Equity Limited
www.jpelonline.com9
Chairman’s Statement (Continued)
Core Secondary Investment Strategy
Although capital was deployed less rapidly than expected during fiscal year 2010, the Manager is pleased with its recent investment activity and believes recent acquisitions were purchased at extremely attractive valuations. JPEL completed seven new investments throughout Europe, Asia and the United States in fiscal year 2010. The Company acquired secondary interests in four private equity funds and participated in three secondary direct transactions. In aggregate, the new investments represent $67.6 million of NAV as at 30 June 2010.
As a reminder, JPEL does not participate in large, publicized secondary market auctions. Rather, the Company focuses on smaller, more complex transactions with limited competition. JPEL’s core strategy is to sift through global opportunities in the private capital markets to find quality assets at deep value entry levels. By remaining focused on value, the Manager has constructed a portfolio that it believes may retain value in a recessionary environment and remain poised to target positive performance when the economy rebounds. Key highlights of the portfolio include:
Defensive industries. • JPEL continues to emphasize industries that have recession-resistant or defensive characteristics. For in-stance, approximately 17% of its portfolio is invested in healthcare-oriented companies.
Low debt levels at underlying companies.• JPEL has continued to focus on portfolio investments in underlying companies with rational debt levels. JPEL’s top 35 buyout holdings had a weighted average Net Debt / EBITDA level of 1.9x.1
Solid growth of top assets.• JPEL’s top holdings had solid operational performance over the past year. Revenues for the top 35 buyout companies increased 9.3%, while EBITDA increased 18.1%.1
Significant exposure to Asia and special situations.• Asia and debt exposure represents 21% and 23% of private equity portfolio value, respectively. The Manager is pleased to have approximately 44% of its portfolio in these two segments and hopes to op-portunistically increase allocations in both sectors over the coming years.
Focus on smaller buyouts.• Approximately 85% of its buyout portfolio is invested in small to medium sized buyouts, which tend to utilize lower leverage and purchase multiples. The Manager continues to believe this segment of the buyout market represents the best risk adjusted returns and that it should benefit from any meaningful increase in M&A activity.
Annual Performance Ending 30 June 2010
The performance for the year was positive for all three share classes.
The US$ Equity Share price increased 15.9% for the fiscal year, outperforming the MSCI World Index by 7.9 percentage points. The discount to NAV for JPEL’s US$ Equity Shares was 10.9% to NAV. JPEL’s listed private equity peer group continued to trade at a 45.8% discount to NAV at 30 June 2010.2 As at 14 October 2010, the Company traded at a 10.3% discount to net asset value, which was considerably less than the selected multi-manager peer group average of 41.7%.3
(1) Represents underlying buyout investments within JPEL’s 50 largest underlying companies. Buyout related investments represent 35 of JPEL’s largest 50 investments. Based on latest available underlying company data at time of publication.(2) Cazenove Alternative Stats, Bloomberg as at 26 August 2010 when JPEL’s 30 June 2010 NAV was released via RNS. Snapshot of performance on 26 August 2010 and does not represent the average discount to NAV since inception. The Peer group is not an exhaustive list and is based on the multi-manager peer group included in LPE Focus| RBS manager survey – June 2010 and includes a selection of funds set forth in such research. The peer group includes: APEN, SHPN, PEHN, PIN, CPEN, PEY, CCAP, ABSP, HPEQ, FPEO, NBPE, HVPE, SEP.(3) Cazenove Alternative Stats, Bloomberg as at 14 October 2010. JPEL NAV based on 31 August 2010. Snapshot of performance on 26 August 2010 and does not represent the average discount to NAV since inception. The Peer group is not an exhaustive list and is based on the multi-manager peer group included in LPE Focus| RBS manager survey – June 2010 and includes a selection of funds set forth in such research. The peer group includes: APEN, SHPN, PEHN, PIN, CPEN, PEY, CCAP, ABSP, HPEQ, FPEO, NBPE, HVPE, SEP.
www.jpelonline.com 10
J.P. Morgan Private Equity Limited J.P. Morgan Private Equity Limited
Chairman’s Statement (Continued)
Both ZDP share classes continue to trade at significant premiums to stated NAVs. At the time JPEL’s 30 June 2010 NAV was released, the 2013 and 2015 ZDP Shares traded at a 7.0% and 15.2% premium to NAV, respectively.1 Over the fiscal year, the 2013 ZDP Share price increased 6.8% while the 2015 ZDP Share price gained 3.8%.
JPEL’s Warrants, which were issued to shareholders of record as of 17 August 2009, ended the fiscal year at $0.12.
5-Year Performance
As we mark the Company’s fifth anniversary, I believe that it is important to review the positive relative performance JPEL has achieved from inception. Unlike most new private equity funds, JPEL did not experience the typical pri-vate equity J-Curve effect where performance is generally underwater for the first several years of a new fund. Rather, JPEL began producing positive NAV growth from the first quarter of its life.
Since June 2005, JPEL’s NAV per US$ Equity Share has increased 25.5%. This compares favourably with major public indices. During this time, FTSE, S&P 500, and MSCI World indices suffered losses of 3.8%, 13.5% and 9.4%, respectively. More significantly, JPEL’s US$ Equity Share price has outperformed the LPX composite index by approximately 45%.2
Many shareholders did not participate in JPEL’s IPO, but rather invested in the Company during its April 2007 offering. Unfortunately, JPEL’s US$ Equity Share NAV has declined 14.7% since that offering, while JPEL’s US$ Equity Share price declined 27.3%. How-ever, once again, this represents relative outperformance compared to major public indices and peers. The FTSE, S&P 500, and MSCI World indices suffered losses of 23.4%, 31.0% and 34.3%, respectively over the period. During the period, the LPX index suffered substantial declines of 57.9%.3
While we are disappointed that absolute performance has not been higher, this performance represents clear superior relative returns. Moreover, I would note that the Company returned over $112 million of cash to investors at NAV per US$ Equity Share at an average price of $1.71, which is not reflected in these performance numbers. The $112 million of distributions through the operation of JPEL’s tender facility represents nearly 24% of total capital raised in the first three JPEL fundraisings from 2005-2007. If these distributions were added back to NAV performance, JPEL’s absolute and relative outperformance would be even greater.
A JPEL shareholder who invested in the Company at its IPO and participated in the maximum tender offered in each instance since in-ception would have received approximately 45% of their initial investment back - in cash – at these higher levels. Under this scenario, a US$ Equity Share investor would have increased its total return from 25.5% to 35.7%.
“US$ Equity Share price increased 15.9%forthefiscalyear,
outperforming the MSCI World Index by 7.9 percentage points”
(1) Bloomberg. As at 26 August 2010 when JPEL’s 30 June 2010NAV was released via RNS. Snapshot of performance on 26 August 2010 and does not represent the average premium since inception. (2) LPX ® Composite performance shown is indexed to JPEL’s initial trade price of $1.07 on 30 June 2005. The index is well diversified across regions and LPE invest-ment styles and represents the development of all LPE companies covered by LPX® that fulfill certain liquidity constraints. The LPX® Composite is a global Listed Private Equity (“LPE”) index with a broad number of constituents. (3) Based on performance from 27 April 2007 through 30 June

J.P. Morgan Private Equity Limited J.P. Morgan Private Equity Limited
www.jpelonline.com11
Chairman’s Statement (Continued)
Market Outlook
Although 2010 certainly is a vast improvement from the turmoil of 2009, we continue to live in uncertain times. I am hopeful for a steady market recovery, but JPEL must position itself for the possibility that global economies might suffer a relapse. Even with a recovery, I believe the new norm will encompass volatility and periodic market disruptions. Fortunately, I believe we are well-situated for any of these eventualities.
JPEL has an opportunistic investment style that thrives in markets that produce distressed and motivated sellers. Moreover, the Com-pany has a portfolio and balance sheet that has focused on lower levels of risk and debt – imperative to withstanding extreme market volatility. I remain confident that JPEL will continue to be a market leader and that the Company will be able to offer a compelling, differentiated strategy to its shareholders.
In conclusion, I would like to thank shareholders for the support and continued confidence that they have placed in the Company. I look forward to the next five years and hope that the solid base that JPEL has established will properly reward shareholders for their faith in the Company.
Trevor AshChairman
27 October 2010
www.jpelonline.com 12
J.P. Morgan Private Equity Limited J.P. Morgan Private Equity Limited
Corporate Actions
Since June 2009, JPEL has raised approximately $144 million of new capital through a variety of treasury and tap offerings of US$ Equity Shares, 2013 ZDP Shares and 2015 ZDP Shares.
As a reminder, on 15 June 2009, the Board approved an open offer of capital raising by the Company of US$ Equity Shares on a pro-rata, pre-emptive basis. The Company’s US$ Equity Share price was $0.97 at 15 June 2009. The Company’s Open Offer and subse-quent offering of US$ Equity Shares were well received by investors. Below, please find a summary of the various closing dates and amount of shares issued as part of JPEL’s 2009 offering.
On 16 July 2009, pursuant to the approvals granted by shareholders, the Company announced that it had received applications for • 36,926,479 new US$ Equity Shares pursuant to the Open Offer made to shareholders at an issue price of US$1.00 per share. The applications represented the acceptance of pre-emptive demand from existing investors totalling US$36.9 million to the Company.
On 17 July 2009, under a tap issue placing, the Company issued 3,550,000 US$ Equity Shares at a price of US$1.00 per share. •
On 31 July 2009, under a tap issue placing, the Company issued 12,812,050 US$ Equity Shares at a price of US$1.00 per share.•
On 7 August 2009, under a tap issue placing, the Company issued 6,234,583 US$ Equity Shares at a price of US$1.00 per share.•
On 12 August 2009, the Company issued 15,703,886 US$ Equity Shares at a price of US$1.00 per share. 12,760,580 US$ Equity • Shares were issued under a tap issue placing and 2,943,306 US$ Equity Shares were issued out of treasury.
On 28 August 2009, the Company issued 3,144,965 US$ Equity Shares at a price of US$1.00 per share. 1,276,070 US$ Equity • Shares were issued under a tap issue placing and 1,868,895 US$ Equity Shares were issued out of treasury.
On 24 September 2009, the Company issued 15,104,710 US$ Equity Shares at a price of US$1.00 per share. 127,607 US$ • Equity Shares were issued under a tap issue placing and 14,977,103 US$ Equity Shares were issued out of treasury.
In addition to the offerings described above, on 18 August 2009, in connection with a bonus issue of warrants to the holders of US$ Equity Shares, the Company issued 58,075,764 warrants. The warrants may be exercised in relation to the purchase of US$ Equity Shares during the period from 1 October 2009 through 30 June 2014. The warrants trade on the main market of the London Stock Exchange under the ticker “JPWW” (ISIN: GG00B60XDY53, SEDOL: B60XDY53). Documents relating to the warrants can be found on the Company’s website (www.jpelonline.com, www.jpelonline.co.uk) under the “Investor Information” and “Shareholder Documents” links.
On 17 November 2009, the Company issued 53,333,333 2015 ZDP Shares at a price of 56.25p per share.
On 12 February 2010, the Company announced that it would increase the frequency of the reporting and valuation of its private equity portfolio. Beginning with the month that ended 31 January 2010, the Company began valuing its private equity portfolio on a monthly basis.
On 6 April 2010, the Company announced the appointment of RBS Hoare Govett Limited as joint corporate broker with immediate effect.
On 29 September 2010, the Company announced a tender offer to purchase up to 3% of current US$ Equity Shares, 2013 ZDP Shares and 2015 ZDP Shares, respectively, outstanding (excluding shares held in treasury). Shares will be tendered at a price based on the prevailing net asset value (NAV) for the quarter ending 31 December 2010.

J.P. Morgan Private Equity Limited J.P. Morgan Private Equity Limited
www.jpelonline.com13
Manager’s Review
www.jpelonline.com 14
J.P. Morgan Private Equity Limited J.P. Morgan Private Equity Limited
No of Deals Deal Value
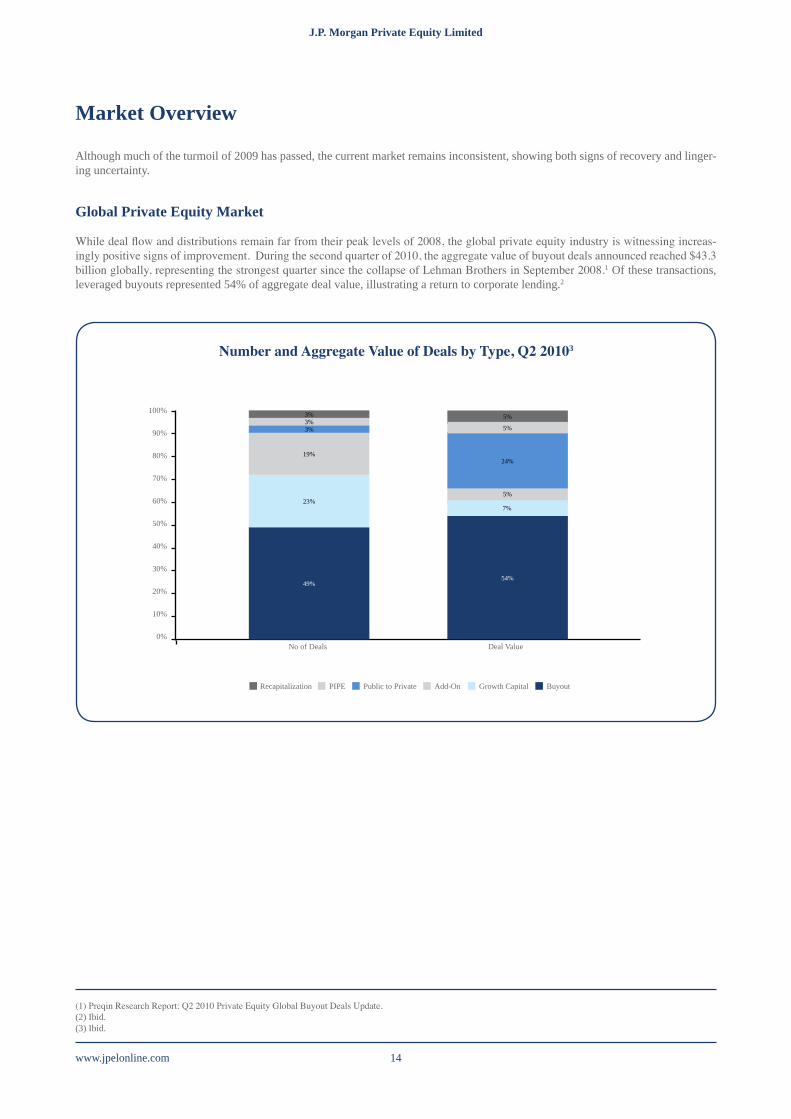
Market Overview
Although much of the turmoil of 2009 has passed, the current market remains inconsistent, showing both signs of recovery and linger-ing uncertainty.
Global Private Equity Market
While deal flow and distributions remain far from their peak levels of 2008, the global private equity industry is witnessing increas-ingly positive signs of improvement. During the second quarter of 2010, the aggregate value of buyout deals announced reached $43.3 billion globally, representing the strongest quarter since the collapse of Lehman Brothers in September 2008.1 Of these transactions, leveraged buyouts represented 54% of aggregate deal value, illustrating a return to corporate lending.2
(1) Preqin Research Report: Q2 2010 Private Equity Global Buyout Deals Update.(2) Ibid.(3) Ibid.
100%
90%
80%
70%
60%
50%
40%
30%
20%
10%
0%
NumberandAggregateValueofDealsbyType,Q220103
3%3%3%
19%
23%
49%
5%
5%
5%
7%
54%
24%
Recapitalization PIPE Public to Private Add-On Growth Capital Buyout
J.P. Morgan Private Equity Limited J.P. Morgan Private Equity Limited
www.jpelonline.com15
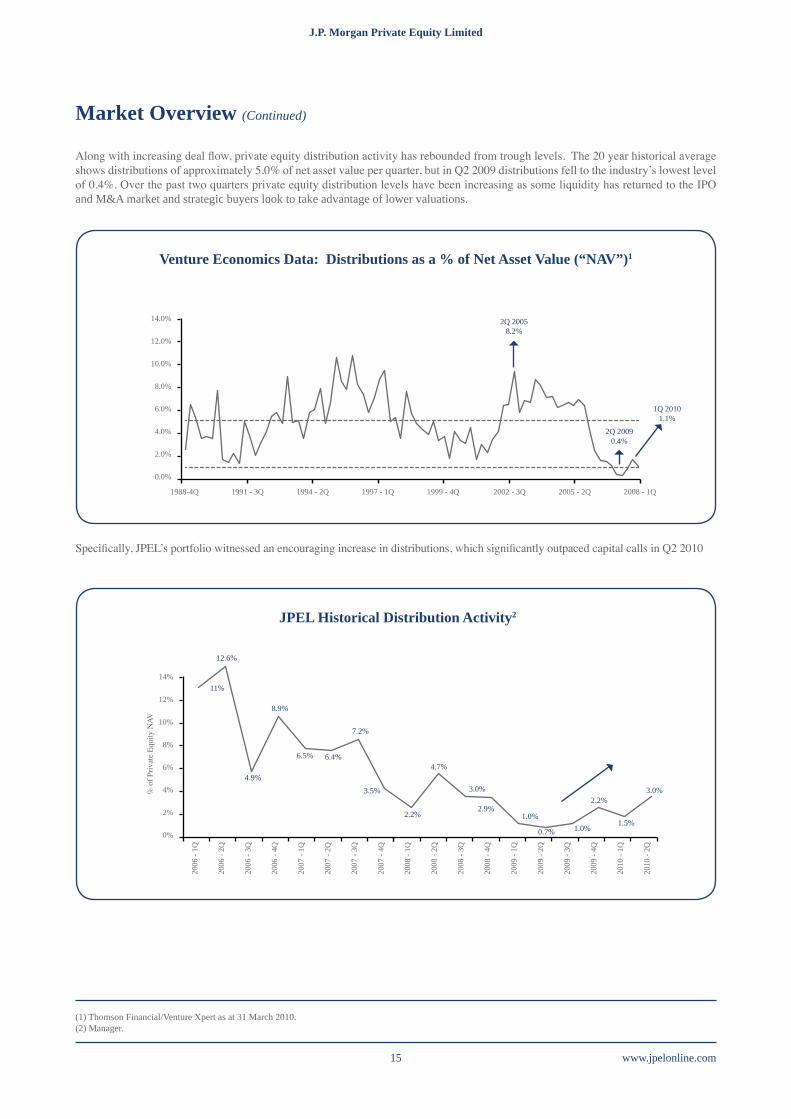
Market Overview (Continued)
Along with increasing deal flow, private equity distribution activity has rebounded from trough levels. The 20 year historical average shows distributions of approximately 5.0% of net asset value per quarter, but in Q2 2009 distributions fell to the industry’s lowest level of 0.4%. Over the past two quarters private equity distribution levels have been increasing as some liquidity has returned to the IPO and M&A market and strategic buyers look to take advantage of lower valuations.
(1) Thomson Financial/Venture Xpert as at 31 March 2010.(2) Manager.
14.0%
12.0%
10.0%
8.0%
6.0%
4.0%
2.0%
0.0%
14%
12%
10%
8%
6%
4%
2%
0%
Venture Economics Data: Distributions as a % of Net Asset Value (“NAV”)1
JPEL Historical Distribution Activity2
1988-4Q 1991 - 3Q 1994 - 2Q 1997 - 1Q 1999 - 4Q 2002 - 3Q 2005 - 2Q 2008 - 1Q
2Q 20058.2%
2Q 20090.4%
1Q 20101.1%
12.6%
4.9%
8.9%
6.5% 6.4%
7.2%
3.5%
2.2%
4.7%
3.0%
2.9%1.0%
0.7% 1.0%
2.2%
1.5%
3.0%
11%
% o
f Priv
ate
Equi
ty N
AV
2006
- 1Q
2006
- 2Q
2006
- 3Q
2006
- 4Q
2007
- 1Q
2007
- 2Q
2007
- 3Q
2007
- 4Q
2008
- 1Q
2008
- 2Q
2008
- 3Q
2008
- 4Q
2009
- 1Q
2009
- 2Q
2009
- 3Q
2009
- 4Q
2010
- 1Q
2010
- 2Q
Specifically, JPEL’s portfolio witnessed an encouraging increase in distributions, which significantly outpaced capital calls in Q2 2010
www.jpelonline.com 16
J.P. Morgan Private Equity Limited J.P. Morgan Private Equity Limited
120%
100%
80%
60%
40%
20%
0%
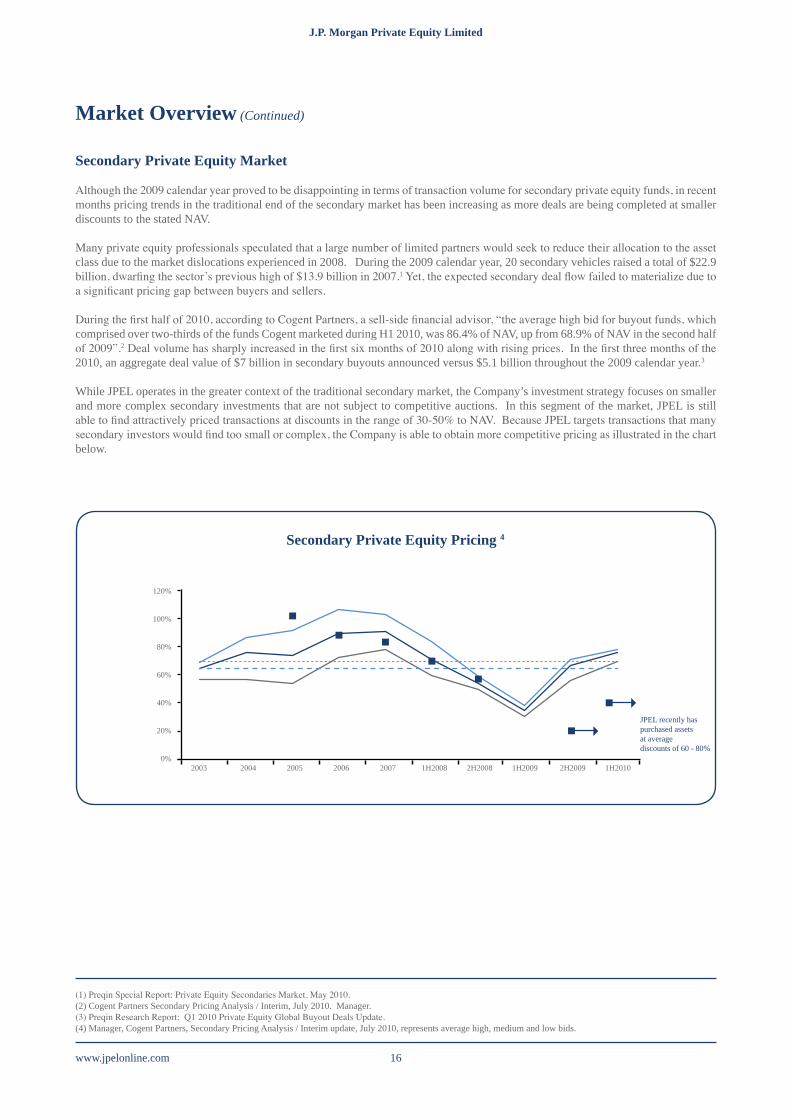
Secondary Private Equity Pricing 4
2003 2004 2005 2006 2007 1H2008 2H2008 1H2009 2H2009 1H2010
JPEL recently haspurchased assetsat averagediscounts of 60 - 80%
Market Overview (Continued)
Secondary Private Equity Market
Although the 2009 calendar year proved to be disappointing in terms of transaction volume for secondary private equity funds, in recent months pricing trends in the traditional end of the secondary market has been increasing as more deals are being completed at smaller discounts to the stated NAV.
Many private equity professionals speculated that a large number of limited partners would seek to reduce their allocation to the asset class due to the market dislocations experienced in 2008. During the 2009 calendar year, 20 secondary vehicles raised a total of $22.9 billion, dwarfing the sector’s previous high of $13.9 billion in 2007.1 Yet, the expected secondary deal flow failed to materialize due to a significant pricing gap between buyers and sellers.
During the first half of 2010, according to Cogent Partners, a sell-side financial advisor, “the average high bid for buyout funds, which comprised over two-thirds of the funds Cogent marketed during H1 2010, was 86.4% of NAV, up from 68.9% of NAV in the second half of 2009”.2 Deal volume has sharply increased in the first six months of 2010 along with rising prices. In the first three months of the 2010, an aggregate deal value of $7 billion in secondary buyouts announced versus $5.1 billion throughout the 2009 calendar year.3
While JPEL operates in the greater context of the traditional secondary market, the Company’s investment strategy focuses on smaller and more complex secondary investments that are not subject to competitive auctions. In this segment of the market, JPEL is still able to find attractively priced transactions at discounts in the range of 30-50% to NAV. Because JPEL targets transactions that many secondary investors would find too small or complex, the Company is able to obtain more competitive pricing as illustrated in the chart below.
(1) Preqin Special Report: Private Equity Secondaries Market, May 2010.(2) Cogent Partners Secondary Pricing Analysis / Interim, July 2010. Manager.(3) Preqin Research Report: Q1 2010 Private Equity Global Buyout Deals Update.(4) Manager, Cogent Partners, Secondary Pricing Analysis / Interim update, July 2010, represents average high, medium and low bids.
J.P. Morgan Private Equity Limited J.P. Morgan Private Equity Limited
www.jpelonline.com17
(69.3%)
(56.5%)(52.6%) (51.2%)
(49.0%)(46.2%)
(43.0%)(40.6%) (40.4%) (39.3%) (39.2%) (39.0%)
(28.9%)
(10.9%)
Market Overview (Ctontinued)
Listed Private Equity Market
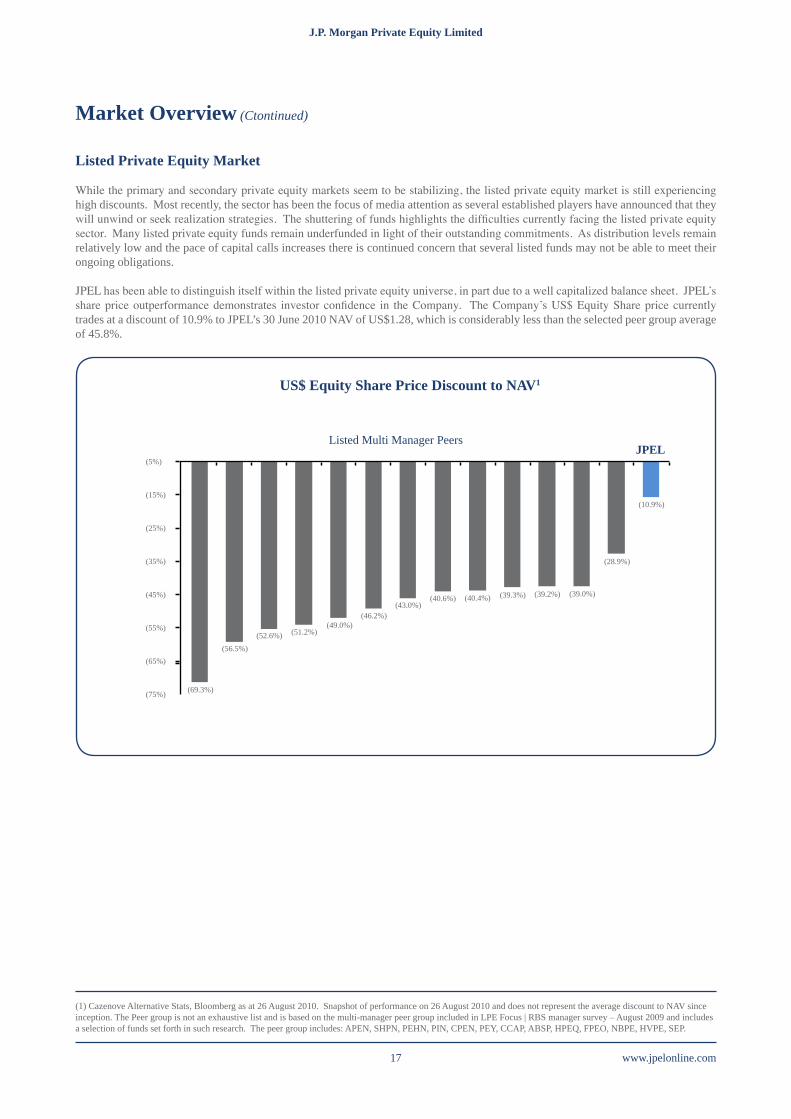
While the primary and secondary private equity markets seem to be stabilizing, the listed private equity market is still experiencing high discounts. Most recently, the sector has been the focus of media attention as several established players have announced that they will unwind or seek realization strategies. The shuttering of funds highlights the difficulties currently facing the listed private equity sector. Many listed private equity funds remain underfunded in light of their outstanding commitments. As distribution levels remain relatively low and the pace of capital calls increases there is continued concern that several listed funds may not be able to meet their ongoing obligations.
JPEL has been able to distinguish itself within the listed private equity universe, in part due to a well capitalized balance sheet. JPEL’s share price outperformance demonstrates investor confidence in the Company. The Company’s US$ Equity Share price currently trades at a discount of 10.9% to JPEL’s 30 June 2010 NAV of US$1.28, which is considerably less than the selected peer group average of 45.8%.
(1) Cazenove Alternative Stats, Bloomberg as at 26 August 2010. Snapshot of performance on 26 August 2010 and does not represent the average discount to NAV since inception. The Peer group is not an exhaustive list and is based on the multi-manager peer group included in LPE Focus | RBS manager survey – August 2009 and includes a selection of funds set forth in such research. The peer group includes: APEN, SHPN, PEHN, PIN, CPEN, PEY, CCAP, ABSP, HPEQ, FPEO, NBPE, HVPE, SEP.
US$ Equity Share Price Discount to NAV1
(5%)
(15%)
(25%)
(35%)
(45%)
(55%)
(65%)
(75%)
JPELListed Multi Manager Peers
www.jpelonline.com 18
J.P. Morgan Private Equity Limited J.P. Morgan Private Equity Limited
Market Overview (Continued)
20.0%
10.0%
0.0%
(10.0%)
(20.0%)
(30.0%)
(40.0%)
(50.0%)
(60.0%)
(70.0%)
(80.0%)
Premium / (Discount) to NAV: 30 June 2005 - Present130
Jun
05
31 O
ct 0
5
28 F
eb 0
6
30 Ju
n 06
31 O
ct 0
6
28 F
eb 0
7
30 Ju
n 07
31 O
ct 0
7
28 F
eb 0
9
30 Ju
n 09
31 O
ct 0
9
28 F
eb 1
0
30 Ju
n 10
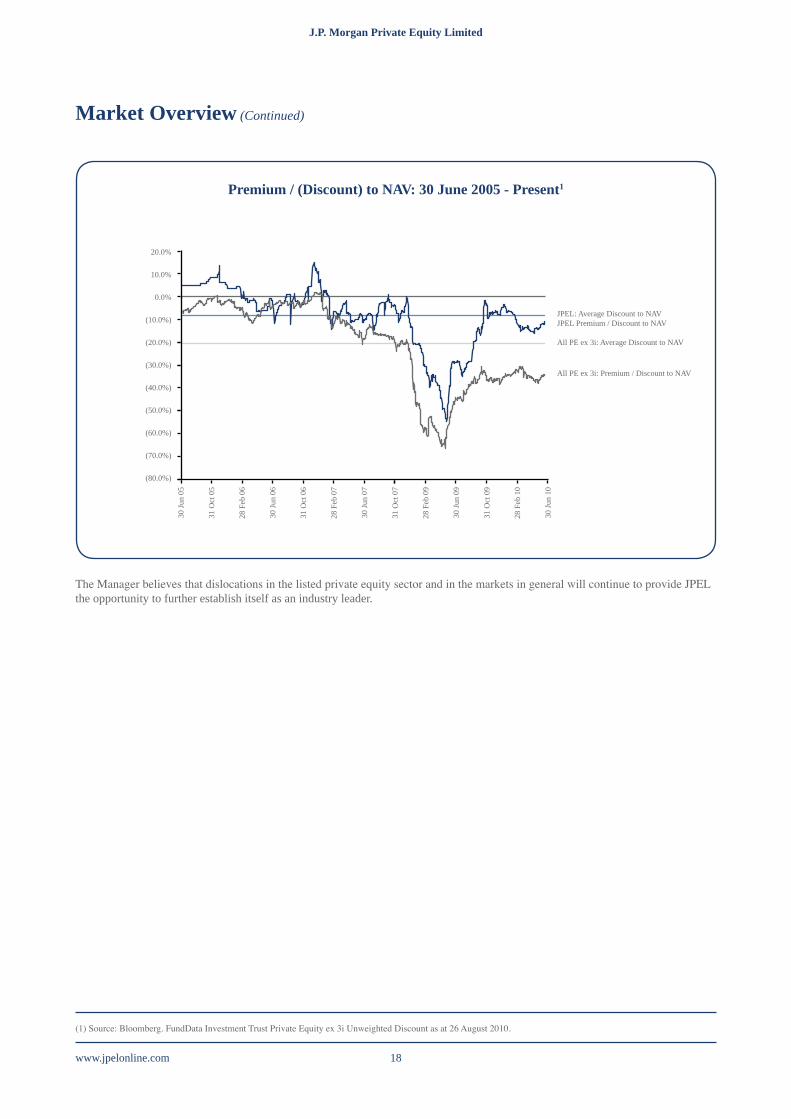
The Manager believes that dislocations in the listed private equity sector and in the markets in general will continue to provide JPEL the opportunity to further establish itself as an industry leader.
(1) Source: Bloomberg. FundData Investment Trust Private Equity ex 3i Unweighted Discount as at 26 August 2010.
JPEL: Average Discount to NAVJPEL Premium / Discount to NAV
All PE ex 3i: Average Discount to NAV
All PE ex 3i: Premium / Discount to NAV
J.P. Morgan Private Equity Limited J.P. Morgan Private Equity Limited
www.jpelonline.com19
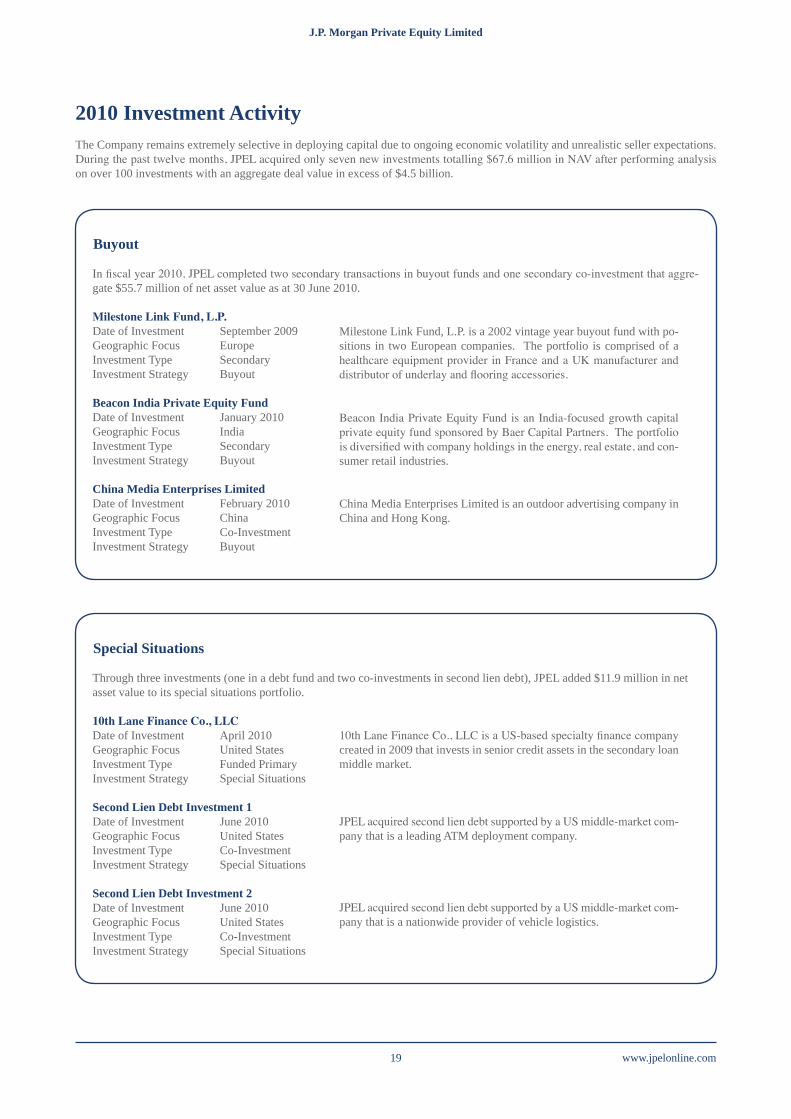
Special Situations
Through three investments (one in a debt fund and two co-investments in second lien debt), JPEL added $11.9 million in net asset value to its special situations portfolio.
10thLaneFinanceCo.,LLCDate of Investment April 2010 Geographic Focus United States Investment Type Funded Primary Investment Strategy Special Situations
Second Lien Debt Investment 1Date of Investment June 2010 Geographic Focus United States Investment Type Co-Investment Investment Strategy Special Situations
Second Lien Debt Investment 2Date of Investment June 2010 Geographic Focus United States Investment Type Co-Investment Investment Strategy Special Situations
Buyout
In fiscal year 2010, JPEL completed two secondary transactions in buyout funds and one secondary co-investment that aggre-gate $55.7 million of net asset value as at 30 June 2010.
MilestoneLinkFund,L.P.Date of Investment September 2009 Geographic Focus Europe Investment Type Secondary Investment Strategy Buyout
Beacon India Private Equity FundDate of Investment January 2010 Geographic Focus India Investment Type Secondary Investment Strategy Buyout
China Media Enterprises LimitedDate of Investment February 2010 Geographic Focus China Investment Type Co-Investment Investment Strategy Buyout
2010 Investment ActivityThe Company remains extremely selective in deploying capital due to ongoing economic volatility and unrealistic seller expectations. During the past twelve months, JPEL acquired only seven new investments totalling $67.6 million in NAV after performing analysis on over 100 investments with an aggregate deal value in excess of $4.5 billion.
Milestone Link Fund, L.P. is a 2002 vintage year buyout fund with po-sitions in two European companies. The portfolio is comprised of a healthcare equipment provider in France and a UK manufacturer and distributor of underlay and flooring accessories.
10th Lane Finance Co., LLC is a US-based specialty finance company created in 2009 that invests in senior credit assets in the secondary loan middle market.
Beacon India Private Equity Fund is an India-focused growth capital private equity fund sponsored by Baer Capital Partners. The portfolio is diversified with company holdings in the energy, real estate, and con-sumer retail industries.
JPEL acquired second lien debt supported by a US middle-market com-pany that is a leading ATM deployment company.
China Media Enterprises Limited is an outdoor advertising company in China and Hong Kong.
JPEL acquired second lien debt supported by a US middle-market com-pany that is a nationwide provider of vehicle logistics.
www.jpelonline.com 20
J.P. Morgan Private Equity Limited J.P. Morgan Private Equity Limited
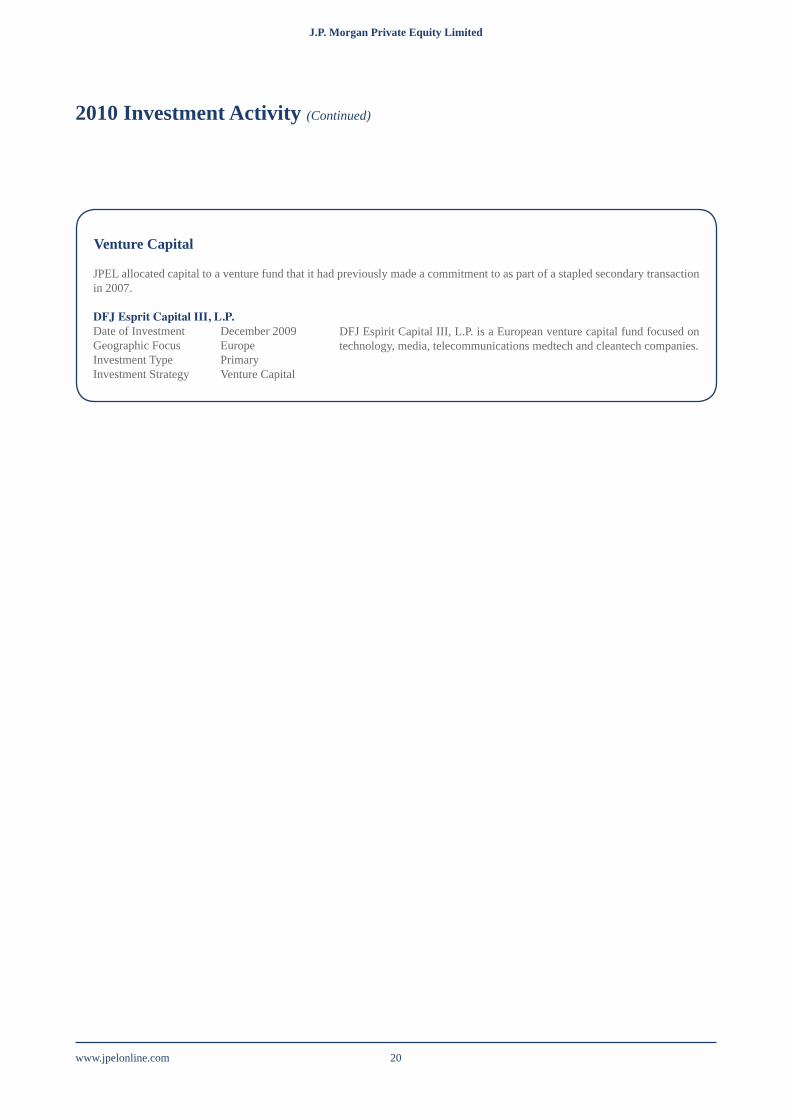
Venture Capital
JPEL allocated capital to a venture fund that it had previously made a commitment to as part of a stapled secondary transaction in 2007.
DFJEspritCapitalIII,L.P.Date of Investment December 2009 Geographic Focus Europe Investment Type Primary Investment Strategy Venture Capital
2010 Investment Activity (Continued)
DFJ Espirit Capital III, L.P. is a European venture capital fund focused on technology, media, telecommunications medtech and cleantech companies.
J.P. Morgan Private Equity Limited J.P. Morgan Private Equity Limited
www.jpelonline.com21
Portfolio Review
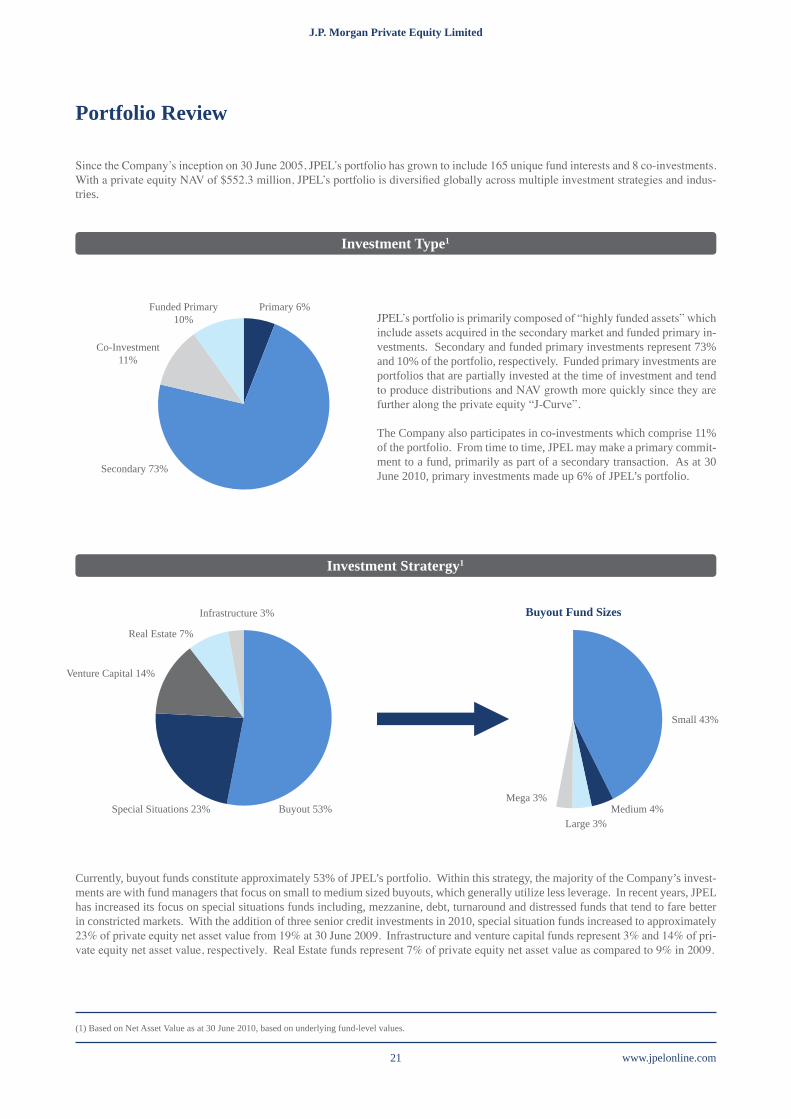
Since the Company’s inception on 30 June 2005, JPEL’s portfolio has grown to include 165 unique fund interests and 8 co-investments. With a private equity NAV of $552.3 million, JPEL’s portfolio is diversified globally across multiple investment strategies and indus-tries.
Investment Type1
Investment Stratergy1
JPEL’s portfolio is primarily composed of “highly funded assets” which include assets acquired in the secondary market and funded primary in-vestments. Secondary and funded primary investments represent 73% and 10% of the portfolio, respectively. Funded primary investments are portfolios that are partially invested at the time of investment and tend to produce distributions and NAV growth more quickly since they are further along the private equity “J-Curve”.
The Company also participates in co-investments which comprise 11% of the portfolio. From time to time, JPEL may make a primary commit-ment to a fund, primarily as part of a secondary transaction. As at 30 June 2010, primary investments made up 6% of JPEL’s portfolio.
Currently, buyout funds constitute approximately 53% of JPEL’s portfolio. Within this strategy, the majority of the Company’s invest-ments are with fund managers that focus on small to medium sized buyouts, which generally utilize less leverage. In recent years, JPEL has increased its focus on special situations funds including, mezzanine, debt, turnaround and distressed funds that tend to fare better in constricted markets. With the addition of three senior credit investments in 2010, special situation funds increased to approximately 23% of private equity net asset value from 19% at 30 June 2009. Infrastructure and venture capital funds represent 3% and 14% of pri-vate equity net asset value, respectively. Real Estate funds represent 7% of private equity net asset value as compared to 9% in 2009.
(1) Based on Net Asset Value as at 30 June 2010, based on underlying fund-level values.
Funded Primary10%
Primary 6%
Infrastructure 3%
Real Estate 7%
Venture Capital 14%
Small 43%
Medium 4%Large 3%
Mega 3% Special Situations 23% Buyout 53%
Co-Investment 11%
Secondary 73%
Buyout Fund Sizes
www.jpelonline.com 22
J.P. Morgan Private Equity Limited J.P. Morgan Private Equity Limited
Portfolio Review (Continued)
Portfolio Age1
Geographic Footprint2
Average Age of Portfolioby Investment Strategy
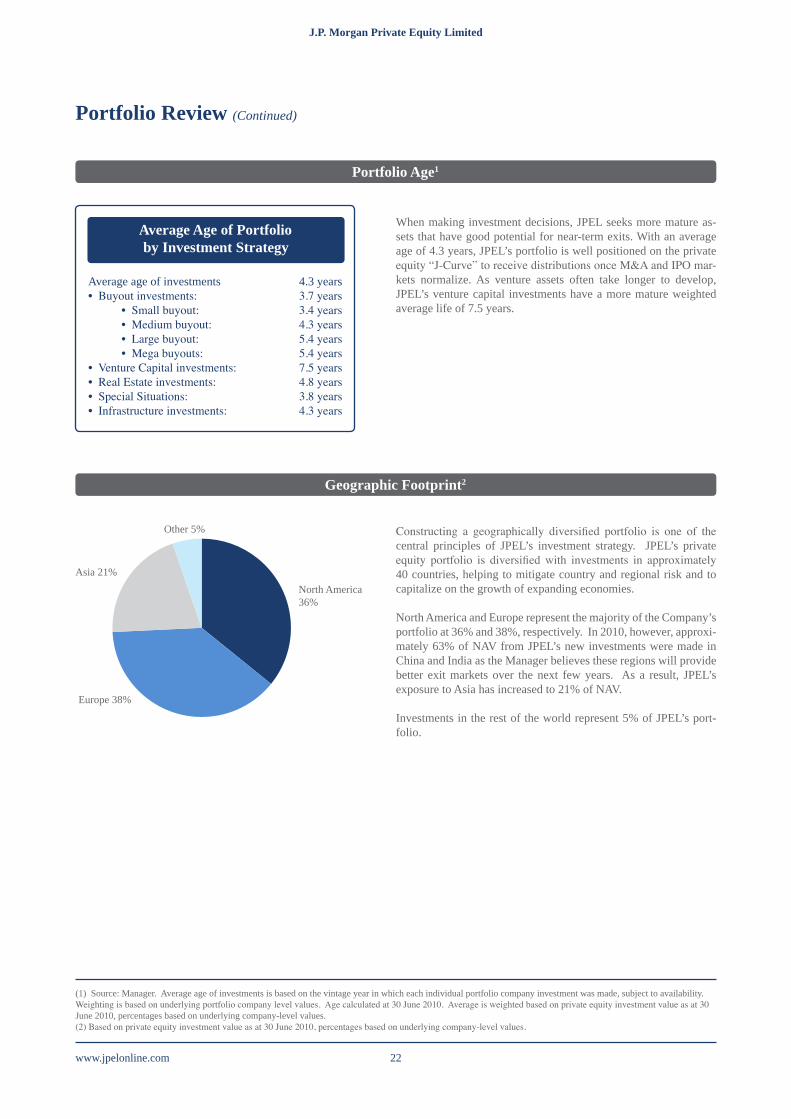
When making investment decisions, JPEL seeks more mature as-sets that have good potential for near-term exits. With an average age of 4.3 years, JPEL’s portfolio is well positioned on the private equity “J-Curve” to receive distributions once M&A and IPO mar-kets normalize. As venture assets often take longer to develop, JPEL’s venture capital investments have a more mature weighted average life of 7.5 years.
Constructing a geographically diversified portfolio is one of the central principles of JPEL’s investment strategy. JPEL’s private equity portfolio is diversified with investments in approximately 40 countries, helping to mitigate country and regional risk and to capitalize on the growth of expanding economies.
North America and Europe represent the majority of the Company’s portfolio at 36% and 38%, respectively. In 2010, however, approxi-mately 63% of NAV from JPEL’s new investments were made in China and India as the Manager believes these regions will provide better exit markets over the next few years. As a result, JPEL’s exposure to Asia has increased to 21% of NAV.
Investments in the rest of the world represent 5% of JPEL’s port-folio.
(1) Source: Manager. Average age of investments is based on the vintage year in which each individual portfolio company investment was made, subject to availability. Weighting is based on underlying portfolio company level values. Age calculated at 30 June 2010. Average is weighted based on private equity investment value as at 30 June 2010, percentages based on underlying company-level values.(2) Based on private equity investment value as at 30 June 2010, percentages based on underlying company-level values.
Average age of investments 4.3 years• Buyout investments: 3.7 years • Small buyout: 3.4 years • Medium buyout: 4.3 years • Large buyout: 5.4 years • Mega buyouts: 5.4 years• Venture Capital investments: 7.5 years• Real Estate investments: 4.8 years• Special Situations: 3.8 years• Infrastructure investments: 4.3 years
Other 5%
Asia 21%
Europe 38%
North America 36%
J.P. Morgan Private Equity Limited J.P. Morgan Private Equity Limited
www.jpelonline.com23
Portfolio Review (Continued)
Industry Composistion1
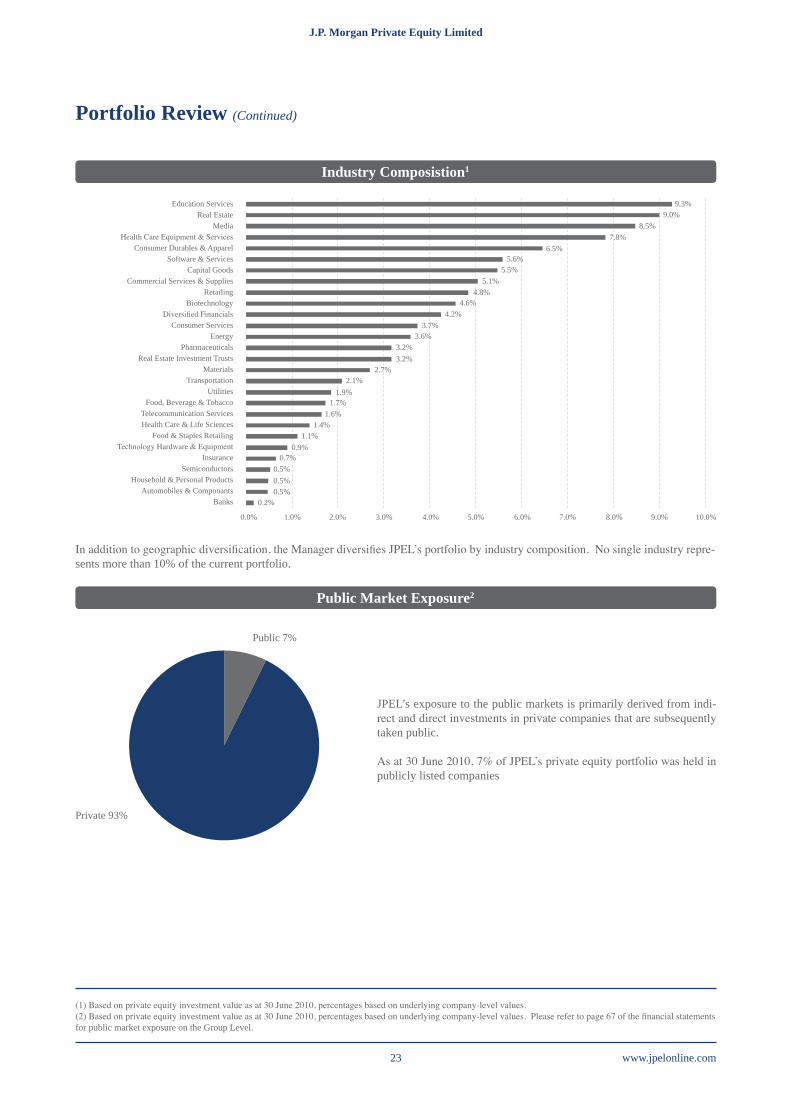
In addition to geographic diversification, the Manager diversifies JPEL’s portfolio by industry composition. No single industry repre-sents more than 10% of the current portfolio.
Public Market Exposure2
JPEL’s exposure to the public markets is primarily derived from indi-rect and direct investments in private companies that are subsequently taken public.
As at 30 June 2010, 7% of JPEL’s private equity portfolio was held in publicly listed companies
(1) Based on private equity investment value as at 30 June 2010, percentages based on underlying company-level values.(2) Based on private equity investment value as at 30 June 2010, percentages based on underlying company-level values. Please refer to page 67 of the financial statements for public market exposure on the Group Level.
Private 93%
Public 7%
Education ServicesReal Estate
MediaHealth Care Equipment & Services
Consumer Durables & ApparelSoftware & Services
Capital GoodsCommercial Services & Supplies
RetailingBiotechnology
Diversified FinancialsConsumer Services
EnergyPharmaceuticals
Real Estate Investment TrustsMaterials
TransportationUtilities
Food, Beverage & TobaccoTelecommunication ServicesHealth Care & Life Sciences
Food & Staples RetailingTechnology Hardware & Equipment
InsuranceSemiconductors
Household & Personal ProductsAutomobiles & Componants
Banks
9.3%9.0%
8.5%7.8%
6.5%5.6%
5.5%5.1%
4.8%4.6%
4.2%3.7%
3.6%3.2%3.2%
2.7%2.1%
1.9%1.7%
1.6%1.4%
1.1%0.9%
0.7%0.5%0.5%0.5%
0.2%
0.0% 1.0% 2.0% 3.0% 4.0% 5.0% 6.0% 7.0% 8.0% 9.0% 10.0%
www.jpelonline.com 24
J.P. Morgan Private Equity Limited J.P. Morgan Private Equity Limited
Capital Calls and Distribution
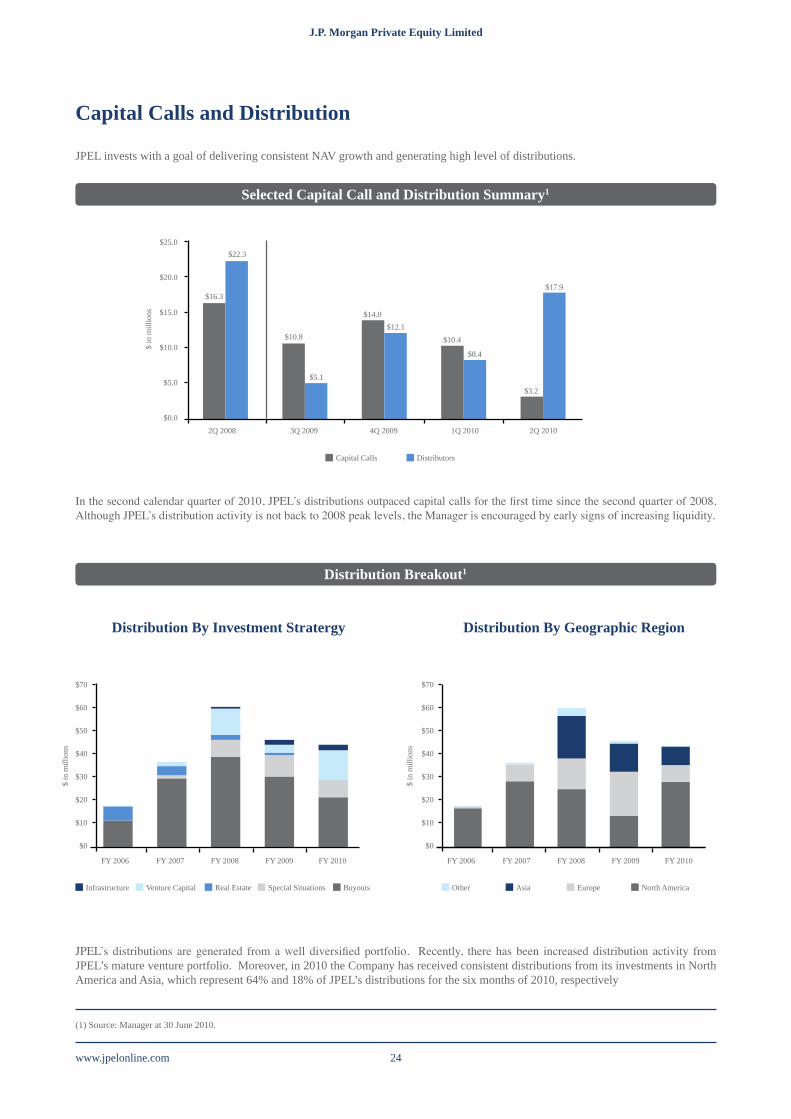
JPEL invests with a goal of delivering consistent NAV growth and generating high level of distributions.
Selected Capital Call and Distribution Summary1
In the second calendar quarter of 2010, JPEL’s distributions outpaced capital calls for the first time since the second quarter of 2008. Although JPEL’s distribution activity is not back to 2008 peak levels, the Manager is encouraged by early signs of increasing liquidity.
Distribution Breakout1
JPEL’s distributions are generated from a well diversified portfolio. Recently, there has been increased distribution activity from JPEL’s mature venture portfolio. Moreover, in 2010 the Company has received consistent distributions from its investments in North America and Asia, which represent 64% and 18% of JPEL’s distributions for the six months of 2010, respectively
(1) Source: Manager at 30 June 2010.
$16.3
$22.3
$10.8
$5.1
$14.0$12.1
$10.4
$8.4
$3.2
$17.9
2Q 2008 3Q 2009 4Q 2009 1Q 2010 2Q 2010
FY 2006 FY 2007 FY 2008 FY 2009 FY 2010 FY 2006 FY 2007 FY 2008 FY 2009 FY 2010
Infrastructure OtherVenture Capital AsiaReal Estate EuropeSpecial Situations North AmericaBuyouts
$25.0
$20.0
$15.0
$10.0
$5.0
$0.0
$70
$60
$50
$40
$30
$20
$10
$0
$70
$60
$50
$40
$30
$20
$10
$0
$ in
mill
ions
Capital Calls Distributors
$ in
mill
ions
$ in
mill
ions
Distribution By Investment Stratergy Distribution By Geographic Region
J.P. Morgan Private Equity Limited J.P. Morgan Private Equity Limited
www.jpelonline.com25
Currency Exposure
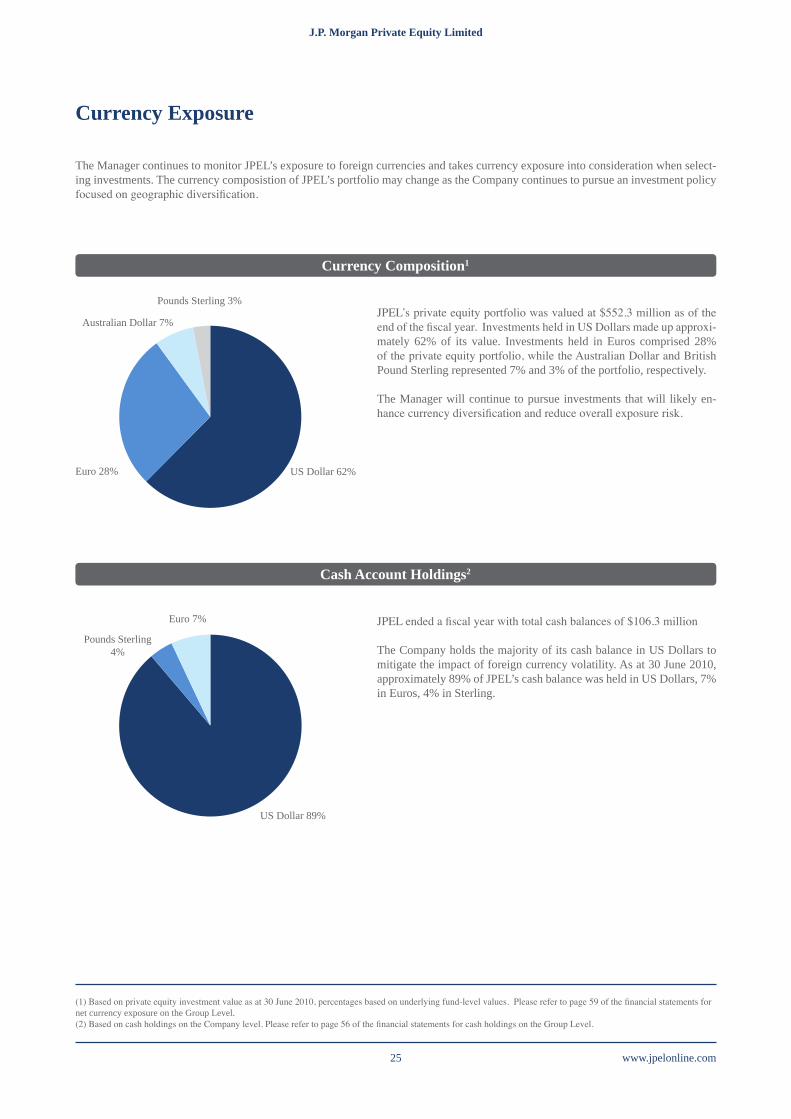
The Manager continues to monitor JPEL’s exposure to foreign currencies and takes currency exposure into consideration when select-ing investments. The currency composistion of JPEL’s portfolio may change as the Company continues to pursue an investment policy focused on geographic diversification.
Currency Composition1
Cash Account Holdings2
JPEL’s private equity portfolio was valued at $552.3 million as of the end of the fiscal year. Investments held in US Dollars made up approxi-mately 62% of its value. Investments held in Euros comprised 28% of the private equity portfolio, while the Australian Dollar and British Pound Sterling represented 7% and 3% of the portfolio, respectively.
The Manager will continue to pursue investments that will likely en-hance currency diversification and reduce overall exposure risk.
JPEL ended a fiscal year with total cash balances of $106.3 million
The Company holds the majority of its cash balance in US Dollars to mitigate the impact of foreign currency volatility. As at 30 June 2010, approximately 89% of JPEL’s cash balance was held in US Dollars, 7% in Euros, 4% in Sterling.
(1) Based on private equity investment value as at 30 June 2010, percentages based on underlying fund-level values. Please refer to page 59 of the financial statements for net currency exposure on the Group Level. (2) Based on cash holdings on the Company level. Please refer to page 56 of the financial statements for cash holdings on the Group Level.
US Dollar 62%
Pounds Sterling 3%
Euro 7%
US Dollar 89%
Pounds Sterling 4%
Euro 28%
Australian Dollar 7%
www.jpelonline.com 26
J.P. Morgan Private Equity Limited J.P. Morgan Private Equity Limited
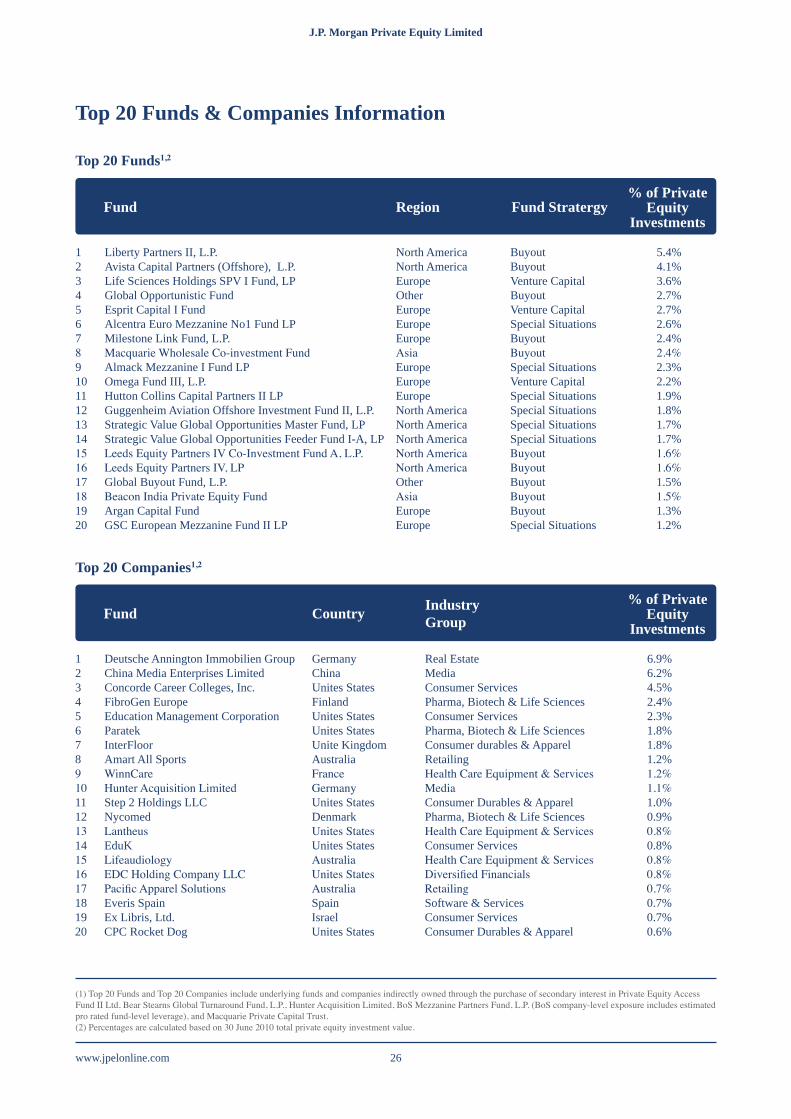
Top 20 Funds & Companies Information
Top 20 Funds1,2
(1) Top 20 Funds and Top 20 Companies include underlying funds and companies indirectly owned through the purchase of secondary interest in Private Equity Access Fund II Ltd, Bear Stearns Global Turnaround Fund, L.P., Hunter Acquisition Limited, BoS Mezzanine Partners Fund, L.P. (BoS company-level exposure includes estimated pro rated fund-level leverage), and Macquarie Private Capital Trust.(2) Percentages are calculated based on 30 June 2010 total private equity investment value.
1 Liberty Partners II, L.P. North America Buyout 5.4%2 Avista Capital Partners (Offshore), L.P. North America Buyout 4.1%3 Life Sciences Holdings SPV I Fund, LP Europe Venture Capital 3.6%4 Global Opportunistic Fund Other Buyout 2.7%5 Esprit Capital I Fund Europe Venture Capital 2.7%6 Alcentra Euro Mezzanine No1 Fund LP Europe Special Situations 2.6%7 Milestone Link Fund, L.P. Europe Buyout 2.4%8 Macquarie Wholesale Co-investment Fund Asia Buyout 2.4%9 Almack Mezzanine I Fund LP Europe Special Situations 2.3%10 Omega Fund III, L.P. Europe Venture Capital 2.2%11 Hutton Collins Capital Partners II LP Europe Special Situations 1.9%12 Guggenheim Aviation Offshore Investment Fund II, L.P. North America Special Situations 1.8%13 Strategic Value Global Opportunities Master Fund, LP North America Special Situations 1.7%14 Strategic Value Global Opportunities Feeder Fund I-A, LP North America Special Situations 1.7%15 Leeds Equity Partners IV Co-Investment Fund A, L.P. North America Buyout 1.6%16 Leeds Equity Partners IV, LP North America Buyout 1.6%17 Global Buyout Fund, L.P. Other Buyout 1.5%18 Beacon India Private Equity Fund Asia Buyout 1.5%19 Argan Capital Fund Europe Buyout 1.3%20 GSC European Mezzanine Fund II LP Europe Special Situations 1.2%
1 Deutsche Annington Immobilien Group Germany Real Estate 6.9%2 China Media Enterprises Limited China Media 6.2%3 Concorde Career Colleges, Inc. Unites States Consumer Services 4.5%4 FibroGen Europe Finland Pharma, Biotech & Life Sciences 2.4%5 Education Management Corporation Unites States Consumer Services 2.3%6 Paratek Unites States Pharma, Biotech & Life Sciences 1.8%7 InterFloor Unite Kingdom Consumer durables & Apparel 1.8%8 Amart All Sports Australia Retailing 1.2%9 WinnCare France Health Care Equipment & Services 1.2%10 Hunter Acquisition Limited Germany Media 1.1%11 Step 2 Holdings LLC Unites States Consumer Durables & Apparel 1.0%12 Nycomed Denmark Pharma, Biotech & Life Sciences 0.9%13 Lantheus Unites States Health Care Equipment & Services 0.8%14 EduK Unites States Consumer Services 0.8%15 Lifeaudiology Australia Health Care Equipment & Services 0.8%16 EDC Holding Company LLC Unites States Diversified Financials 0.8%17 Pacific Apparel Solutions Australia Retailing 0.7%18 Everis Spain Spain Software & Services 0.7%19 Ex Libris, Ltd. Israel Consumer Services 0.7%20 CPC Rocket Dog Unites States Consumer Durables & Apparel 0.6%
Fund
Fund
Region
Country
Fund Stratergy
Industry Group
% of PrivateEquity
Investments
% of PrivateEquity
Investments
Top 20 Companies1,2
J.P. Morgan Private Equity Limited J.P. Morgan Private Equity Limited
www.jpelonline.com27
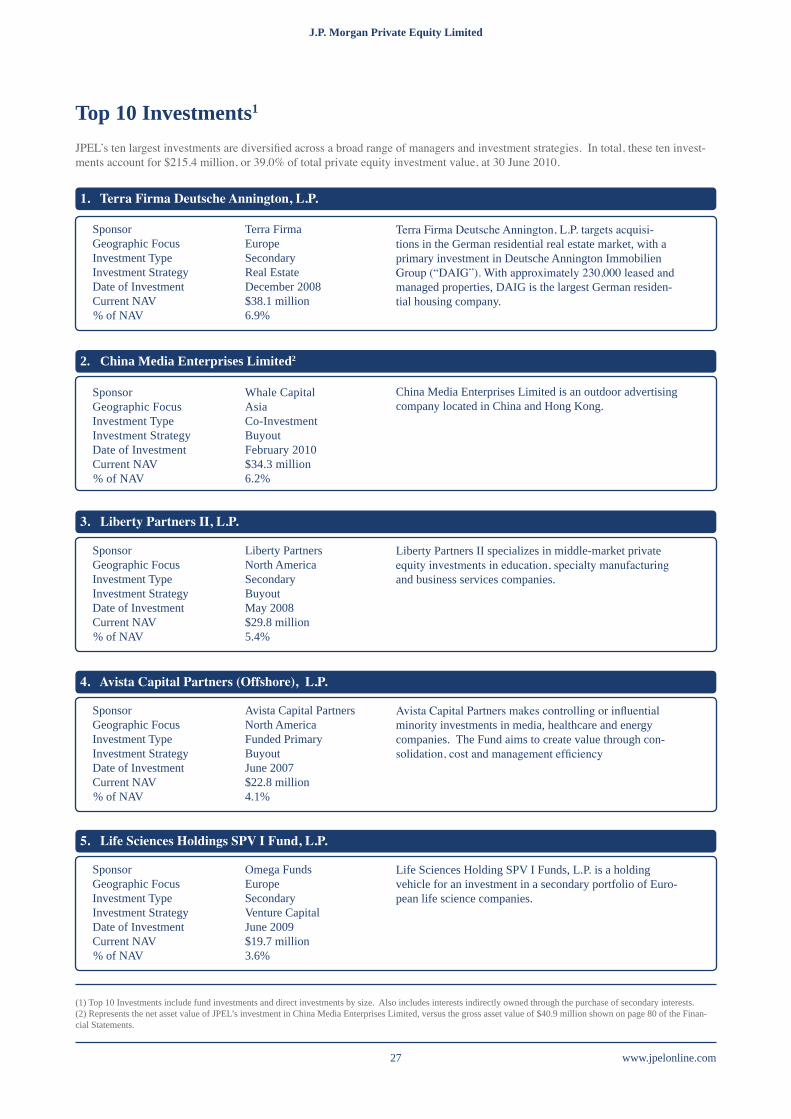
Top 10 Investments1
JPEL’s ten largest investments are diversified across a broad range of managers and investment strategies. In total, these ten invest-ments account for $215.4 million, or 39.0% of total private equity investment value, at 30 June 2010.
1.TerraFirmaDeutscheAnnington,L.P.
3.LibertyPartnersII,L.P.
2. China Media Enterprises Limited2
4.AvistaCapitalPartners(Offshore),L.P.
5.LifeSciencesHoldingsSPVIFund,L.P.
Sponsor Terra FirmaGeographic Focus EuropeInvestment Type SecondaryInvestment Strategy Real EstateDate of Investment December 2008Current NAV $38.1 million% of NAV 6.9%
Sponsor Liberty PartnersGeographic Focus North AmericaInvestment Type SecondaryInvestment Strategy BuyoutDate of Investment May 2008Current NAV $29.8 million% of NAV 5.4%
Sponsor Whale CapitalGeographic Focus AsiaInvestment Type Co-InvestmentInvestment Strategy BuyoutDate of Investment February 2010Current NAV $34.3 million% of NAV 6.2%
Sponsor Avista Capital PartnersGeographic Focus North AmericaInvestment Type Funded PrimaryInvestment Strategy BuyoutDate of Investment June 2007Current NAV $22.8 million% of NAV 4.1%
Sponsor Omega FundsGeographic Focus EuropeInvestment Type SecondaryInvestment Strategy Venture CapitalDate of Investment June 2009Current NAV $19.7 million% of NAV 3.6%
Terra Firma Deutsche Annington, L.P. targets acquisi-tions in the German residential real estate market, with a primary investment in Deutsche Annington Immobilien Group (“DAIG”). With approximately 230,000 leased and managed properties, DAIG is the largest German residen-tial housing company.
Liberty Partners II specializes in middle-market private equity investments in education, specialty manufacturing and business services companies.
China Media Enterprises Limited is an outdoor advertising company located in China and Hong Kong.
Avista Capital Partners makes controlling or influential minority investments in media, healthcare and energy companies. The Fund aims to create value through con-solidation, cost and management efficiency
Life Sciences Holding SPV I Funds, L.P. is a holding vehicle for an investment in a secondary portfolio of Euro-pean life science companies.
(1) Top 10 Investments include fund investments and direct investments by size. Also includes interests indirectly owned through the purchase of secondary interests.(2) Represents the net asset value of JPEL’s investment in China Media Enterprises Limited, versus the gross asset value of $40.9 million shown on page 80 of the Finan-cial Statements.
www.jpelonline.com 28
J.P. Morgan Private Equity Limited J.P. Morgan Private Equity Limited
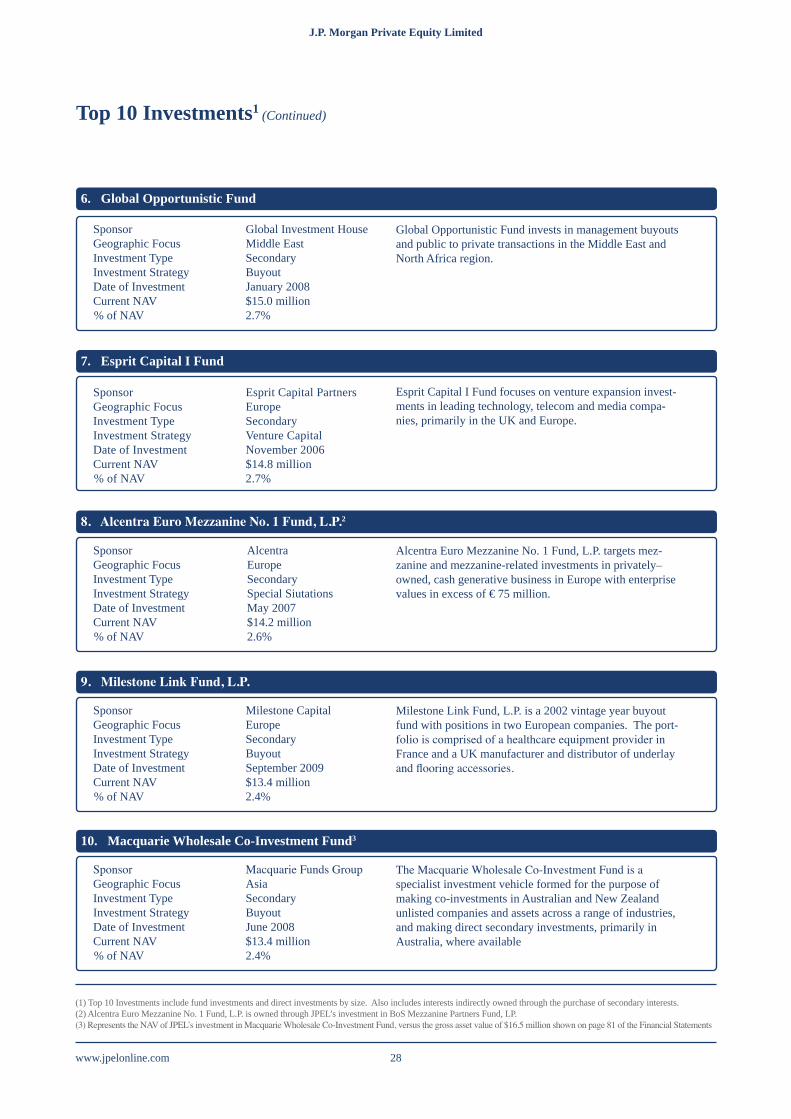
Top 10 Investments1 (Continued)
6. Global Opportunistic Fund
8.AlcentraEuroMezzanineNo.1Fund,L.P.2
7. Esprit Capital I Fund
9.MilestoneLinkFund,L.P.
10. Macquarie Wholesale Co-Investment Fund3
Sponsor Global Investment HouseGeographic Focus Middle EastInvestment Type SecondaryInvestment Strategy BuyoutDate of Investment January 2008Current NAV $15.0 million% of NAV 2.7%
Sponsor AlcentraGeographic Focus EuropeInvestment Type SecondaryInvestment Strategy Special SiutationsDate of Investment May 2007Current NAV $14.2 million% of NAV 2.6%
Sponsor Esprit Capital PartnersGeographic Focus EuropeInvestment Type SecondaryInvestment Strategy Venture CapitalDate of Investment November 2006Current NAV $14.8 million% of NAV 2.7%
Sponsor Milestone CapitalGeographic Focus EuropeInvestment Type SecondaryInvestment Strategy BuyoutDate of Investment September 2009Current NAV $13.4 million% of NAV 2.4%
Sponsor Macquarie Funds GroupGeographic Focus AsiaInvestment Type SecondaryInvestment Strategy BuyoutDate of Investment June 2008Current NAV $13.4 million% of NAV 2.4%
Global Opportunistic Fund invests in management buyouts and public to private transactions in the Middle East and North Africa region.
Alcentra Euro Mezzanine No. 1 Fund, L.P. targets mez-zanine and mezzanine-related investments in privately–owned, cash generative business in Europe with enterprise values in excess of €75 million.
Esprit Capital I Fund focuses on venture expansion invest-ments in leading technology, telecom and media compa-nies, primarily in the UK and Europe.
Milestone Link Fund, L.P. is a 2002 vintage year buyout fund with positions in two European companies. The port-folio is comprised of a healthcare equipment provider in France and a UK manufacturer and distributor of underlay and flooring accessories.
The Macquarie Wholesale Co-Investment Fund is a specialist investment vehicle formed for the purpose of making co-investments in Australian and New Zealand unlisted companies and assets across a range of industries, and making direct secondary investments, primarily in Australia, where available
(1) Top 10 Investments include fund investments and direct investments by size. Also includes interests indirectly owned through the purchase of secondary interests.(2) Alcentra Euro Mezzanine No. 1 Fund, L.P. is owned through JPEL’s investment in BoS Mezzanine Partners Fund, LP.(3) Represents the NAV of JPEL’s investment in Macquarie Wholesale Co-Investment Fund, versus the gross asset value of $16.5 million shown on page 81 of the Financial Statements
J.P. Morgan Private Equity Limited J.P. Morgan Private Equity Limited
www.jpelonline.com29
Investment Policy
Asset Allocation
The majority of the Company Portfolio is allocated to buyout funds, and the balance to venture capital, real estate and multi-style funds.
• A buyout fund typically targets the acquisition of a significant portion or majority control of businesses which normally entails a change of ownership. Buyout funds ordinarily invest in more mature companies with established business plans to finance expan-sions, consolidations, turnarounds and sales, or spinouts of divisions or subsidiaries. A leveraged buyout, commonly referred to as a LBO, is a buyout that uses debt financing to fund a portion of the purchase price of the targeted business.
• Venture capital refers to private equity capital typically provided to early-stage, high-potential growth companies.
• A multi-style investment strategy refers to fund managers that make investments in companies in various stages of develop-ment. A multi-style manager may make investments in start-up enterprises, later-stage venture companies and established businesses – all within the same fund. These investments may involve control positions or may be minority, passive positions.
By investing in a portfolio of private equity funds, the Company is exposed to numerous underlying investments in individual compa-nies, ranging from start-up ventures to large, multi-national enterprises. The Manager will endeavour to purchase private equity fund interests and co-investments in the secondary market to ensure that JPEL’s portfolio contains investments that will be made and exited in different economic cycles.
The Company may invest capital not otherwise allocated to private equity into near cash and other investments. The Company, in the Manager’s sole discretion, may invest in a wide variety of investments and other financial instruments.
The Company will not enter into derivative transactions (such as options, futures and contracts for difference) other than for the pur-poses of efficient portfolio management.
The Company will not take any legal or management control of any underlying company or fund in the Company Portfolio.
RiskDiversification
The Manager actively monitors the Company Portfolio and attempts to mitigate risk primarily through diversification. Not more than 20 per cent. of the Company’s Net Asset Value, at the time of investment, is permitted to be invested in any single investment. For the avoidance of doubt, if the Company acquires a portfolio of companies in a single transaction, this limitation shall be applied individu-ally to each of the underlying companies purchased and not to the portfolio as a whole.
Leverage
The Company has the ability to borrow up to 20 per cent. of its Adjusted Total of Capital and Reserves subject to and in accordance with the limitations and conditions in its Articles. As part of its leverage policy, the Company may borrow for short-term or temporary purposes as is necessary for settlement of transactions, to facilitate the operation of the over-commitment policy or to meet ongoing expenses. The Directors and the Manager will not incur any short-term borrowings to facilitate any tender or redemption of Shares un-less such borrowings have a repayment period of 180 days or less. The Company is indirectly exposed to borrowings to the extent that subsidiaries and underlying funds in its portfolio are themselves leveraged.

www.jpelonline.com 30
J.P. Morgan Private Equity Limited J.P. Morgan Private Equity Limited
Board of DirectorsThe Board of Directors is comprised of four non-executive directors, and no individual has the ability to make unilateral decisions. As required by the UK Listing Rules, the Board of Directors is independent of the Manager1; it oversees the activities of the Com-pany, but is not involved in the day-to-day management of the Company. In preparing this Annual Report and Financial Statements, the independence of each Director has been considered. The day-to-day management of the Group will remain the responsibility of the Manager, acting through the Manager’s employees.
TrevorAsh,Chairman,IndependentTrevorC.Ash,63 spent 27 years with the Rothschild Group, retiring in May 1999 as Managing Director of the Guernsey-based Rothschild Asset Management (C.I.) Limited and non executive Director of Rothschild Asset Management Limited in London. He also recently retired as a Non-Executive Director of N. M. Rothschild & Sons (C.I.) Limited, the banking arm of the Rothschild Group in the Channel Islands. In retirement Mr Ash has retained a number of Directorships of the Rothschild Group and joined the Boards of a number of Offshore funds managed by groups including Merrill Lynch, Thames River Capital, Dexion Capital Manage-ment and ING. Mr Ash is a Fellow of the Securities Institute of England and Wales.
JohnLoudon,Director,IndependentJohnLoudon,73 has been Chairman of Caneminster Ltd., a British investment company, since June 1988. Mr. Loudon serves as a director of GEMS Oriental & General Fund II Limited and GEMS Oriental & General Fund III Limited. Previously, Mr. Loudon was a Managing Director of N.M. Rothschild & Sons from 1970 to 1988 and the Chairman of Warrier International Limited from 1988 to 1991. Mr. Loudon also served as a director of Exel Group plc from 1992 to 2004, XL Capital Ltd from 1992 to 2005 and Derby Trust plc from 1989 to 2003. Mr. Loudon is a resident of the UK.
ChristopherSpencer,Director,IndependentChristopherSpencer,60 qualified as a chartered accountant in London in 1975. Mr. Spencer, who specialized in audit and fiduciary work, was Managing Partner/Director of Pannell Kerr Forster (Guernsey) Limited from 1990 until his retirement in May 2000. Mr. Spencer is a past President of the Guernsey Society of Chartered and Certified Accountants, and a past Chairman of the Guernsey Branch of the Institute of Directors. Mr. Spencer sits on the Board of Directors of Real Estate Credit Investments Ltd, IRP Property Investment, Tamar European Industrial Fund Limited, Dexion Trading Limited, Henderson Far East Income limited, and Ruffer Investment Company Limited, each of which is listed on the London Stock Exchange. Mr. Spencer also sits on the Board of Directors of Longstone Limited, and Nevsky Fund limited, both of which are listed on the Irish Stock Exchange. Mr. Spencer is also a member of the Board of Directors of a number of companies, details of which can be found in the latest prospectus of the Company which can be found at the investor section of the Company’s website. Mr. Spencer is a resident of Guernsey.
GregoryGetschow,DirectorGregoryGetschow,46 is a Managing Director of J.P. Morgan Asset Management2 and a portfolio manager for the Company. Mr. Getschow has been on the Company’s investment committee since its inception on 30 June 2005. Prior to joining J.P. Morgan As-set Management, Mr. Getschow was a Senior Managing Director of BSAM Inc. Prior to joining BSAM Inc., Mr. Getschow was a co-founder of BDC Financial, Inc. Mr Getschow began his career practicing law at Bingham Dana LLP and Sullivan & Worcester LLP. Mr. Getschow received a JD from Villanova Law School, where he was a member of the Law Review, and an AB from Colby College.
(1) Though a majority of the Board of Directors is unaffiliated with the Manager, Gregory Getschow is a senior executive of BSAM Inc., the Manager of the Group.(2) J.P. Morgan Asset Management is a marketing name for the Investment Management subsidiaries of JPMorgan Chase & Co. and its affiliates worldwide.

J.P. Morgan Private Equity Limited J.P. Morgan Private Equity Limited
www.jpelonline.com31
Directors’ Report
www.jpelonline.com 32
J.P. Morgan Private Equity Limited J.P. Morgan Private Equity Limited
Directors’ Report
Introduction The Directors present their report together with the audited consolidated financial statements of J.P. Morgan Private Equity Limited and its subsidiaries (the “Group”) for the year ended 30 June 2010. The financial highlights are set out on page 3. A detailed review of activities is contained in the Manager’s Review on pages 14 to 29.
The Directors believe that Bear Stearns Asset Management Inc (“BSAM Inc” or the “Manager”), a subsidiary of JPMorgan Chase & Co., has performed credibly since its appointment as the manager at the time of the Company’s inception.
Principal ActivityThe Group’s primary activity is that of an investment company investing in private equity funds.
Going ConcernThe Directors have examined significant areas of possible financial risk and have satisfied themselves that no material exposures exist. The Directors therefore consider that the Group has adequate resources to continue in operational existence for the foreseeable future and after due consideration believe it is appropriate to adopt the going concern basis in preparing the financial statements.
Corporate GovernancePrinciples StatementThe Directors are committed to high standards of corporate governance and have made it Group policy to comply with best practice in this area, insofar as the Directors believe it is relevant and appropriate to the Group, and notwithstanding the fact that the Group is not obliged to comply with the ‘Combined Code’ (i.e. the Code of Best Practice published by the Committee, in respect of a financial year beginning before 31 December 2009, on the Financial Aspects of Corporate Governance) as it is a Guernsey registered company. The complete UK Corporate Governance Code can be viewed on the Financial Reporting Council website http://www.frc.org.uk.
Role of the BoardThe Board has determined that its role is to consider and determine the following principal matters which it considers are of strategic importance to the Group:• review the overall objectives for the Group as described in the prospectus and set the Group‘s strategy for fulfilling those objec-
tives within an appropriate risk framework; • consider any shifts in strategy that it considers may be appropriate in light of market conditions;
• review the capital structure of the Company including consideration of an appropriate use of gearing both for the Group and in any joint ventures in which the Group may invest in from time to time;
• evaluate its own performance and that of the individual Directors; • appoint the Manager, Administrator and other appropriately skilled service providers and monitor their effectiveness
through regular reports and meetings; and review key elements of the Group’s performance including NAV and payment of divi-dends.
Other than Christopher Spencer who owns 30,067 US$ Equity Shares, no other Director holds directly or indirectly shares in the Group.
From 1 January 2007 Mr. Ash is entitled to receive Directors fees of £25,000 per annum, Mr. Loudon and Mr. Spencer are each entitled to receive Directors fees of £20,000 per annum. Mr Getschow has waived his right to Directors fees.
During the year further payments were made to each director for additional services provided. Each Director received a total of £20,000 in additional payments during the year with the exception of Mr. Getschow who received no payment. The total remuneration for Mr Ash was £45,000, Mr. Loudon and Mr. Spencer each received a total of £40,000 during the year.
J.P. Morgan Private Equity Limited J.P. Morgan Private Equity Limited
www.jpelonline.com33
Directors’ Report (Continued)
Corporate Governance (Continued)
Board DecisionsAt its Board meetings, the Board ensures that all the strategic matters listed under ‘Role of the Board’ are considered and resolved by the Board. While issues associated with implementing the Group’s strategy are generally considered by the Board to be non strategic in nature and are delegated either to the Manager or the Administrator, the Board considers there are implementation matters that are sig-nificant enough to be of strategic importance to the Group and should be reserved to the Board (e.g. investments made by the Group).
Directors,RotationofDirectorsandDirectorsTenureThe Directors listed below were all appointed on 28 April 2005 except where detailed below: Trevor Charles AshJohn LoudonChristopher Paul SpencerGregory Getschow (appointed 11 June 2009) The Combined Code recommends that Directors should be appointed for a specified period. The Board has resolved in this instance that Directors’ appointments need not comply with this requirement as all Directors are non-executive and their respective appoint-ments can be terminated at any time without penalty. Mr Getschow will be put forward for re-election as a non-executive Director of the Company.
Directors InterestsMr. Gregory Getschow is a senior executive of Bear Stearns Asset Management Inc. (“BSAM Inc.”), the Manager to the Group and a subsidiary of JPMorgan Chase & Co. Other than Christopher Spencer who owns 30,067 US$ Equity Shares, no other Director holds directly or indirectly shares in the Group.
Audit CommitteeThe Board as a whole fulfils the function of an audit committee in relation to, amongst other things, monitoring the internal controls and risk management systems of the Group and its service providers, reviewing the financial statements of the Group, monitoring the independence of the auditor and the effectiveness of the audit process and reviewing the findings of the external auditor. The Board considers that, given its size and the size of the Group, it would not be appropriate to establish a separate audit committee.
Remuneration CommitteeThe Board as a whole fulfils the function of a remuneration committee in relation to the setting and periodic review of the fees of the Di-rectors and the Chairman, taking into account, amongst other factors, prevailing market conditions and the need to attract to the Board, and retain thereafter, suitable persons. The Board considers that, given its size and the size of the Group, it would not be appropriate to establish a separate remuneration committee.
Nomination CommitteeThe Board as a whole fulfils the function of a nomination committee. The Board considers that, given its size and the size of the Group, it would not be appropriate to establish a separate nomination committee.
Board MeetingsThe Board meets quarterly and as required from time to time to consider specific issues reserved to the Board. At the quarterly meetings it considers papers circulated seven days in advance including reports provided by the Manager and the Administrator. The Manager’s report comments on:
• The investment market including recommendations for any changes in strategy that the Manager considers may be appropriate;• Performance of the Group’s portfolio and key asset management initiatives;• Transactional activity undertaken over the previous quarter and being contemplated for the future; and• The Group’s financial position including its relationship with its bankers and lenders.
The Administrator provides a compliance report.
www.jpelonline.com 34
J.P. Morgan Private Equity Limited J.P. Morgan Private Equity Limited
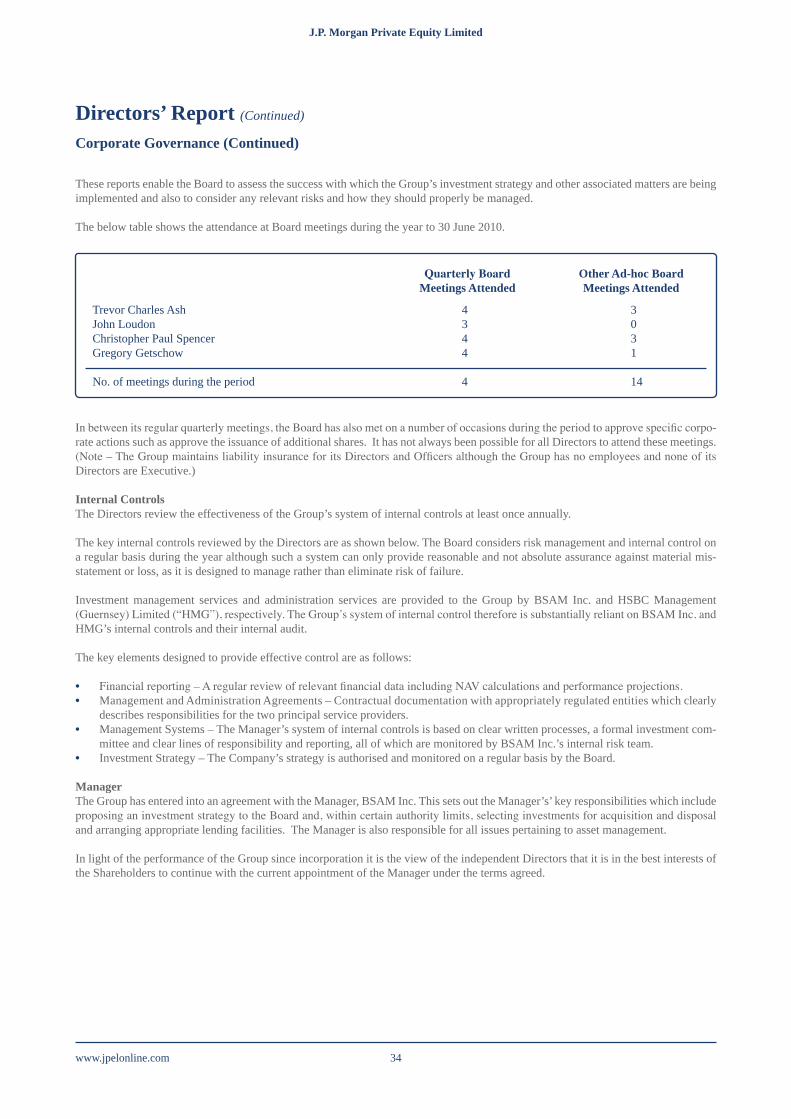
Trevor Charles Ash 4 3John Loudon 3 0Christopher Paul Spencer 4 3Gregory Getschow 4 1
No. of meetings during the period 4 14
Directors’ Report (Continued)
Corporate Governance (Continued)
These reports enable the Board to assess the success with which the Group’s investment strategy and other associated matters are being implemented and also to consider any relevant risks and how they should properly be managed.
The below table shows the attendance at Board meetings during the year to 30 June 2010.
In between its regular quarterly meetings, the Board has also met on a number of occasions during the period to approve specific corpo-rate actions such as approve the issuance of additional shares. It has not always been possible for all Directors to attend these meetings. (Note – The Group maintains liability insurance for its Directors and Officers although the Group has no employees and none of its Directors are Executive.)
Internal ControlsThe Directors review the effectiveness of the Group’s system of internal controls at least once annually.
The key internal controls reviewed by the Directors are as shown below. The Board considers risk management and internal control on a regular basis during the year although such a system can only provide reasonable and not absolute assurance against material mis-statement or loss, as it is designed to manage rather than eliminate risk of failure.
Investment management services and administration services are provided to the Group by BSAM Inc. and HSBC Management (Guernsey) Limited (“HMG”), respectively. The Group’s system of internal control therefore is substantially reliant on BSAM Inc. and HMG’s internal controls and their internal audit.
The key elements designed to provide effective control are as follows:
• Financial reporting – A regular review of relevant financial data including NAV calculations and performance projections.• Management and Administration Agreements – Contractual documentation with appropriately regulated entities which clearly
describes responsibilities for the two principal service providers. • Management Systems – The Manager’s system of internal controls is based on clear written processes, a formal investment com-
mittee and clear lines of responsibility and reporting, all of which are monitored by BSAM Inc.’s internal risk team.• Investment Strategy – The Company’s strategy is authorised and monitored on a regular basis by the Board.
Manager The Group has entered into an agreement with the Manager, BSAM Inc. This sets out the Manager’s’ key responsibilities which include proposing an investment strategy to the Board and, within certain authority limits, selecting investments for acquisition and disposal and arranging appropriate lending facilities. The Manager is also responsible for all issues pertaining to asset management.
In light of the performance of the Group since incorporation it is the view of the independent Directors that it is in the best interests of the Shareholders to continue with the current appointment of the Manager under the terms agreed.
QuarterlyBoardMeetings Attended
Other Ad-hoc Board Meetings Attended
J.P. Morgan Private Equity Limited J.P. Morgan Private Equity Limited
www.jpelonline.com35
Directors’ Report (Continued)
In conjunction with the Groups’ acquisition of Macquarie Private Capital Group (‘MPCG’), Macquarie Investment Management Lim-ited (‘MIML’) was retained as an advisor and sub-administrator by BSPEL Australia Limited. Pursuant to the management agreement between BSPEL Australia Limited and MIML, BSAM Inc. has assumed day-to-day control over the portfolio.
SecretaryHSBC Management (Guernsey) Limited held the office of Secretary throughout the period.
DividendsThe Directors do not propose the payment of a dividend.
Independent AuditorA resolution for the re-appointment of KPMG Channel Islands Limited is to be proposed at the forthcoming Annual General Meeting.
Shareholder RelationsShareholder communications are a high priority for the Board. The Manager produces a monthly fact sheet which is distributed to shareholders and released to the London Stock Exchange. Members of the Manager’s Investment Committee make themselves avail-able at all reasonable times to meet with principal shareholders and key sector analysts. Feedback from these sessions is provided by the Manager to quarterly Board meetings.
In addition, the Board is also kept fully appraised of all market commentary on the Group by the Manager and other professional advis-ers including the Group’s brokers. Through this process the Board seeks to monitor the views of shareholders and to ensure that the Group’s communication program is effective.
The Chairman and the Manager will be available at the Annual General Meeting to answer any questions that attending shareholders may have.
Results of Annual General Meeting (AGM) of 12/07/2010
The Company convened an AGM on 12 July 2010 to vote on the following resolutions all of which were approved by the shareholders;
• To renew the Company’s authority to make purchases of its own issued shares pursuant to any proposed tender offer; • To renew the Company’s general authority to make market purchases of its own issued shares;• To approve and adopt the Annual Report and Financial Statements of the Company for the year ended 30 June 2009;• To re-elect Trevor Charles Ash as a non-executive Director of the Company, who retires by rotation;• To re-elect John Loudon as a non-executive Director of the Company, who retires by rotation;• To re-elect Christopher Paul Spencer as a non-executive Director of the Company, who retires by rotation;• To re-elect Gregory S. Getschow as an executive Director of the Company, who retires by rotation;• To re-elect KPMG Channel Islands Limited as Auditors to the Company;• To authorise the Directors to determine the Auditors’ remuneration.
www.jpelonline.com 36
J.P. Morgan Private Equity Limited J.P. Morgan Private Equity Limited
Directors’ Report (continued)
Statement of the Directors’ ResponsibilitiesThe Directors are responsible for preparing the Directors’ Report, Annual Report and Financial Statements in accordance with the ap-plicable laws and regulations.
Company law requires the Directors to prepare financials statements for each financial year. Under that law they have elected to prepare the financial statements in accordance with International Financial Reporting Standards (IFRS) and applicable law.
The financial statements are required by law to give a true and fair view of the state of affairs of the Group and of the profit or loss of the Group for that period.
In preparing those financial statements the Directors are required to:
• Select suitable accounting policies and apply them consistently;• Make judgments and estimates that are reasonable and prudent;• State whether applicable accounting standards have been followed, subject to any material departures disclosed and explained in
the financial statements; and• Prepare the financial statements on the going concern basis unless it is inappropriate to presume that the Group will continue in
business.
The Directors are responsible for keeping proper accounting records which disclose with reasonable accuracy at any time the financial position of the Group and to enable them to ensure that the financial statements comply with The Companies (Guernsey) Law, 2008. They have a general responsibility for taking such steps as are reasonably open to them to safeguard the assets of the Group and to prevent and detect fraud and other irregularities.
Disclosure of Information to AuditorThe Directors who held office at the date of approval of this Directors’ report confirm that, so far they are each aware, there is no relevant audit information of which the Group’s Auditor is unaware; and each Director has taken all the steps that he ought to have taken as a Director to make himself aware of any relevant audit information and to establish that the Group’s Auditors is aware of that information.
We also confirm that to the best of our knowledge:
• the financial statements, prepared in accordance with the applicable set of accounting standards, give a true and fair view of the assets, liabilities, financial position and profit or loss of the issuer and the undertakings included in the consolidation taken as a whole as required by Disclosure and Transparency Rules (“DTR”) 4.1.12R; and
• the management report includes a fair review of the development and performance of the business and the position of the issuer and the undertakings included in the consolidation taken as a whole, together with a description of the principal risks and uncer-tainties that they face as required by DTR 4.1.12R.
By order of the Board
Trevor Ash Chris SpencerDirector Director
Date: 27 October 2010
J.P. Morgan Private Equity Limited J.P. Morgan Private Equity Limited
www.jpelonline.com37
Independent Auditor’s Report
Independent auditor’s report to the members of J.P. Morgan Private Equity LimitedWe have audited the Group financial statements of J.P. Morgan Private Equity Limited (the “Company”) for the year ended 30 June 2010 which comprise the Consolidated Statement of Comprehensive Income, the Consolidated Statement of Financial Position, the Consolidated Statement of Changes in Equity, the Consolidated Statement of Cash Flows and the related notes. These financial state-ments have been prepared under the accounting policies set out therein.
This report is made solely to the Company’s members, as a body, in accordance with section 262 of The Companies (Guernsey) Law, 2008. Our audit work has been undertaken so that we might state to the Company’s members those matters we are required to state to them in an auditor’s report and for no other purpose. To the fullest extent permitted by law, we do not accept or assume responsibility to anyone other than the Company and the Company’s members as a body, for our audit work, for this report, or for the opinions we have formed.
Respective responsibilities of Directors and auditorsThe Directors’ responsibilities for preparing the financial statements which give a true and fair view and are in accordance with Inter-national Financial Reporting Standards and are in compliance with applicable Guernsey law are set out in the Statement of Directors’ Responsibilities on page 36.
Our responsibility is to audit the financial statements in accordance with relevant legal and regulatory requirements and International Standards on Auditing (UK and Ireland).
We report to you our opinion as to whether the financial statements give a true and fair view, are in accordance with International Finan-cial Reporting Standards and comply with The Companies (Guernsey) Law, 2008. We also report to you if, in our opinion, the Com-pany has not kept proper accounting records, or if we have not received all the information and explanations we require for our audit.
We read the other information accompanying the financial statements and consider whether it is consistent with those statements. We consider the implications for our report if we become aware of any apparent misstatements or material inconsistencies with the financial statements.
Basis of audit opinionWe conducted our audit in accordance with International Standards on Auditing (UK and Ireland) issued by the Auditing Practices Board. An audit includes examination, on a test basis, of evidence relevant to the amounts and disclosures in the financial statements. It also includes an assessment of the significant estimates and judgements made by the Directors in the preparation of the financial state-ments, and of whether the accounting policies are appropriate to the Company’s circumstances, consistently applied and adequately disclosed.
We planned and performed our audit so as to obtain all the information and explanations which we considered necessary in order to provide us with sufficient evidence to give reasonable assurance that the financial statements are free from material misstatement, whether caused by fraud or other irregularity or error. In forming our opinion we also evaluated the overall adequacy of the presenta-tion of information in the financial statements.
OpinionIn our opinion the financial statements:• give a true and fair view of the state of the Group’s affairs as at 30 June 2010 and of Group’s profit for the year then ended; • are in accordance with International Financial Reporting Standards; and • comply with The Companies (Guernsey) Law, 2008.
Dermot A. Dempsey For and on behalf of KMPG Channel Islands Chartered Accountants and Recognised Auditors

www.jpelonline.com 38
J.P. Morgan Private Equity Limited J.P. Morgan Private Equity Limited
Financial Statements
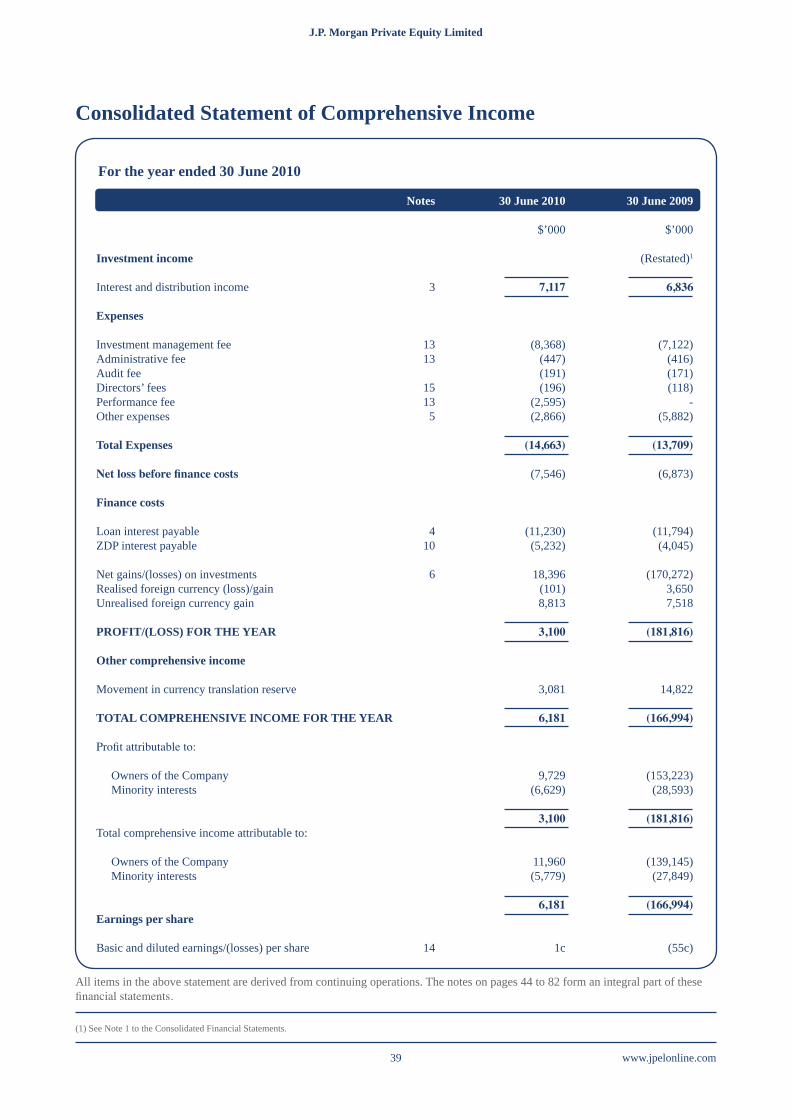
J.P. Morgan Private Equity Limited J.P. Morgan Private Equity Limited
www.jpelonline.com39
For the year ended 30 June 2010
Notes 30 June 2010 30 June 2009
$’000 $’000
Investment income (Restated)1
Interest and distribution income 3 7,117 6,836 Expenses
Investment management fee 13 (8,368) (7,122)Administrative fee 13 (447) (416)Audit fee (191) (171)Directors’ fees 15 (196) (118)Performance fee 13 (2,595) -Other expenses 5 (2,866) (5,882)
Total Expenses (14,663) (13,709) Netlossbeforefinancecosts (7,546) (6,873) Finance costs
Loan interest payable 4 (11,230) (11,794)ZDP interest payable 10 (5,232) (4,045) Net gains/(losses) on investments 6 18,396 (170,272)Realised foreign currency (loss)/gain (101) 3,650Unrealised foreign currency gain 8,813 7,518
PROFIT/(LOSS) FOR THE YEAR 3,100 (181,816) Other comprehensive income
Movement in currency translation reserve 3,081 14,822 TOTAL COMPREHENSIVE INCOME FOR THE YEAR 6,181 (166,994) Profit attributable to:
Owners of the Company 9,729 (153,223) Minority interests (6,629) (28,593) 3,100 (181,816)Total comprehensive income attributable to:
Owners of the Company 11,960 (139,145) Minority interests (5,779) (27,849) 6,181 (166,994)Earnings per share
Basic and diluted earnings/(losses) per share 14 1c (55c)
Consolidated Statement of Comprehensive Income
All items in the above statement are derived from continuing operations. The notes on pages 44 to 82 form an integral part of these financial statements.
(1) See Note 1 to the Consolidated Financial Statements.
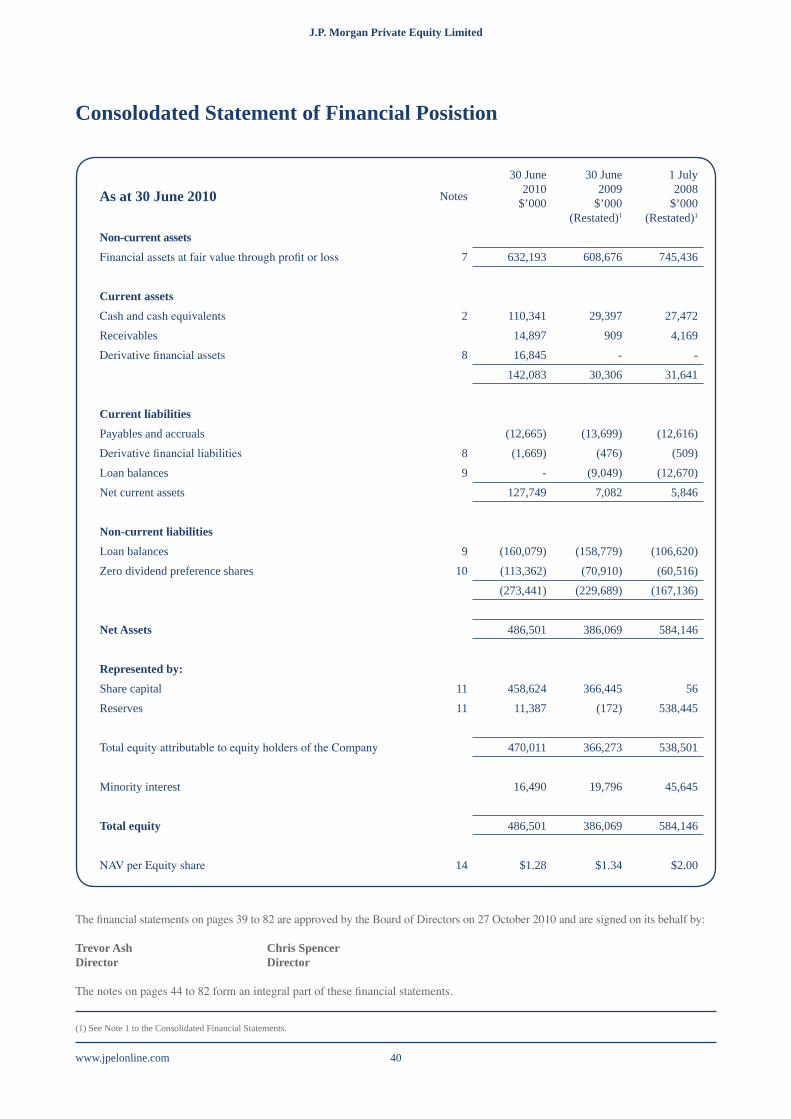
www.jpelonline.com 40
J.P. Morgan Private Equity Limited J.P. Morgan Private Equity Limited
As at 30 June 2010 Notes
30 June2010
$’000
30 June2009
$’000(Restated)1
1 July2008
$’000(Restated)1
Non-current assetsFinancial assets at fair value through profit or loss 7 632,193 608,676 745,436
Current assetsCash and cash equivalents 2 110,341 29,397 27,472Receivables 14,897 909 4,169Derivative financial assets 8 16,845 - - 142,083 30,306 31,641
Current liabilitiesPayables and accruals (12,665) (13,699) (12,616)Derivative financial liabilities 8 (1,669) (476) (509)Loan balances 9 - (9,049) (12,670)Net current assets 127,749 7,082 5,846 Non-current liabilitiesLoan balances 9 (160,079) (158,779) (106,620)Zero dividend preference shares 10 (113,362) (70,910) (60,516)
(273,441) (229,689) (167,136)
Net Assets 486,501 386,069 584,146
Represented by:Share capital 11 458,624 366,445 56Reserves 11 11,387 (172) 538,445 Total equity attributable to equity holders of the Company 470,011 366,273 538,501 Minority interest 16,490 19,796 45,645
Total equity 486,501 386,069 584,146
NAV per Equity share 14 $1.28 $1.34 $2.00
Consolodated Statement of Financial Posistion
The financial statements on pages 39 to 82 are approved by the Board of Directors on 27 October 2010 and are signed on its behalf by:
Trevor Ash Chris SpencerDirector Director
The notes on pages 44 to 82 form an integral part of these financial statements.
(1) See Note 1 to the Consolidated Financial Statements.
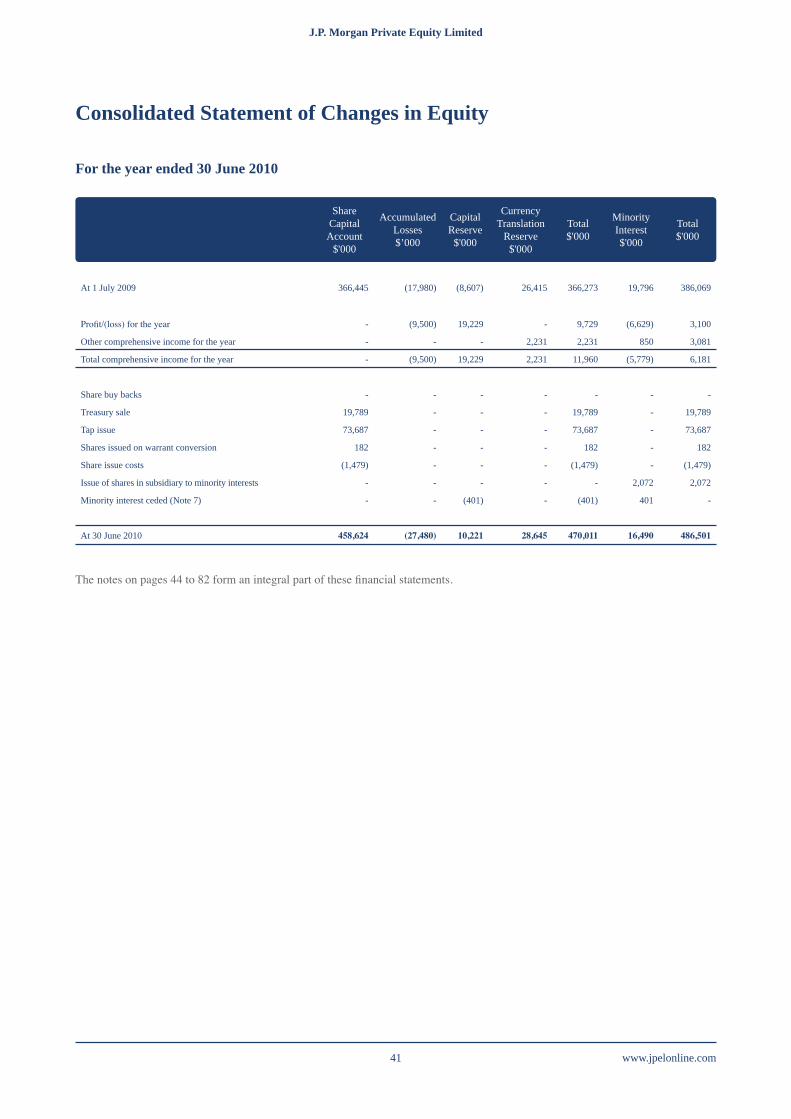
J.P. Morgan Private Equity Limited J.P. Morgan Private Equity Limited
www.jpelonline.com41
Share Capital Account
$'000
Accumulated Losses $’000
Capital Reserve
$'000
Currency Translation
Reserve $'000
Total $'000
Minority Interest $'000
Total $'000
At 1 July 2009 366,445 (17,980) (8,607) 26,415 366,273 19,796 386,069
Profit/(loss) for the year - (9,500) 19,229 - 9,729 (6,629) 3,100
Other comprehensive income for the year - - - 2,231 2,231 850 3,081
Total comprehensive income for the year - (9,500) 19,229 2,231 11,960 (5,779) 6,181
Share buy backs - - - - - - -
Treasury sale 19,789 - - - 19,789 - 19,789
Tap issue 73,687 - - - 73,687 - 73,687
Shares issued on warrant conversion 182 - - - 182 - 182
Share issue costs (1,479) - - - (1,479) - (1,479)
Issue of shares in subsidiary to minority interests - - - - - 2,072 2,072
Minority interest ceded (Note 7) - - (401) - (401) 401 -
At 30 June 2010 458,624 (27,480) 10,221 28,645 470,011 16,490 486,501
Consolidated Statement of Changes in Equity
For the year ended 30 June 2010
The notes on pages 44 to 82 form an integral part of these financial statements.
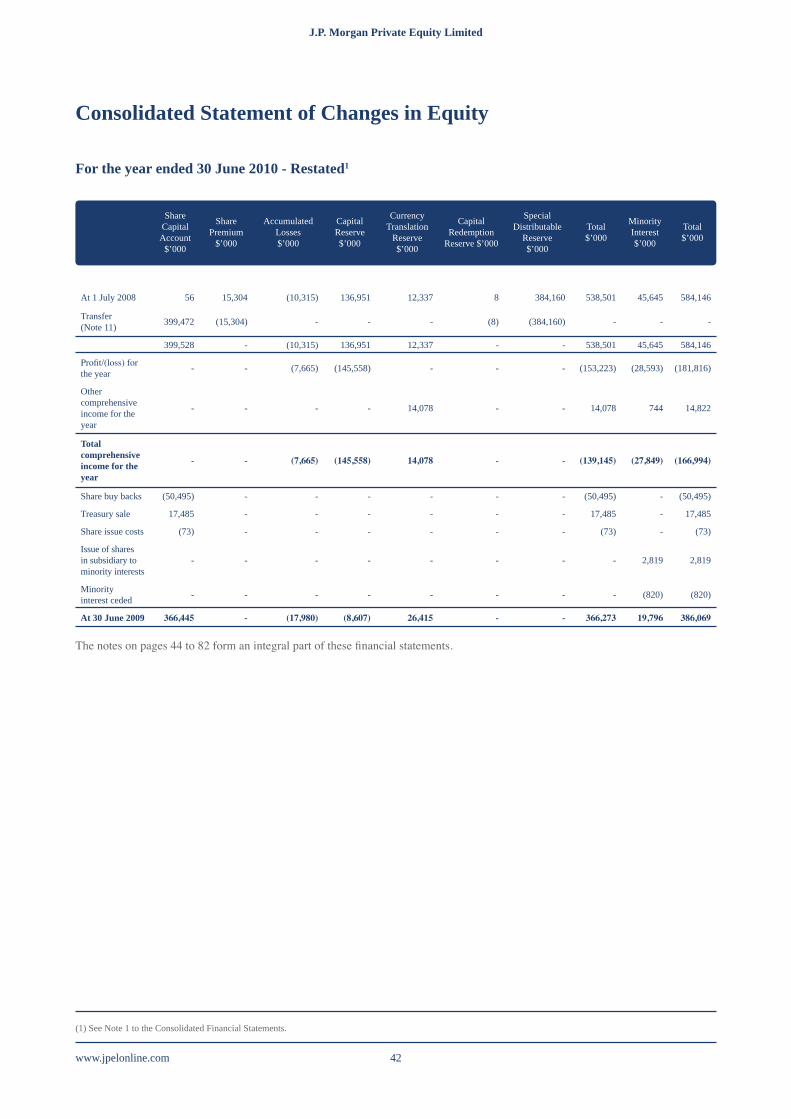
www.jpelonline.com 42
J.P. Morgan Private Equity Limited J.P. Morgan Private Equity Limited
Share Capital Account
$’000
Share Premium
$’000
Accumulated Losses$’000
Capital Reserve $’000
Currency Translation
Reserve $’000
Capital Redemption
Reserve $’000
Special Distributable
Reserve $’000
Total $’000
Minority Interest $’000
Total $’000
At 1 July 2008 56 15,304 (10,315) 136,951 12,337 8 384,160 538,501 45,645 584,146
Transfer (Note 11) 399,472 (15,304) - - - (8) (384,160) - - -
399,528 - (10,315) 136,951 12,337 - - 538,501 45,645 584,146
Profit/(loss) for the year - - (7,665) (145,558) - - - (153,223) (28,593) (181,816)
Other comprehensive income for the year
- - - - 14,078 - - 14,078 744 14,822
Total comprehensive income for the year
- - (7,665) (145,558) 14,078 - - (139,145) (27,849) (166,994)
Share buy backs (50,495) - - - - - - (50,495) - (50,495)
Treasury sale 17,485 - - - - - - 17,485 - 17,485
Share issue costs (73) - - - - - - (73) - (73)
Issue of shares in subsidiary to minority interests
- - - - - - - - 2,819 2,819
Minority interest ceded - - - - - - - - (820) (820)
At 30 June 2009 366,445 - (17,980) (8,607) 26,415 - - 366,273 19,796 386,069
Consolidated Statement of Changes in Equity
For the year ended 30 June 2010 - Restated1
(1) See Note 1 to the Consolidated Financial Statements.
The notes on pages 44 to 82 form an integral part of these financial statements.
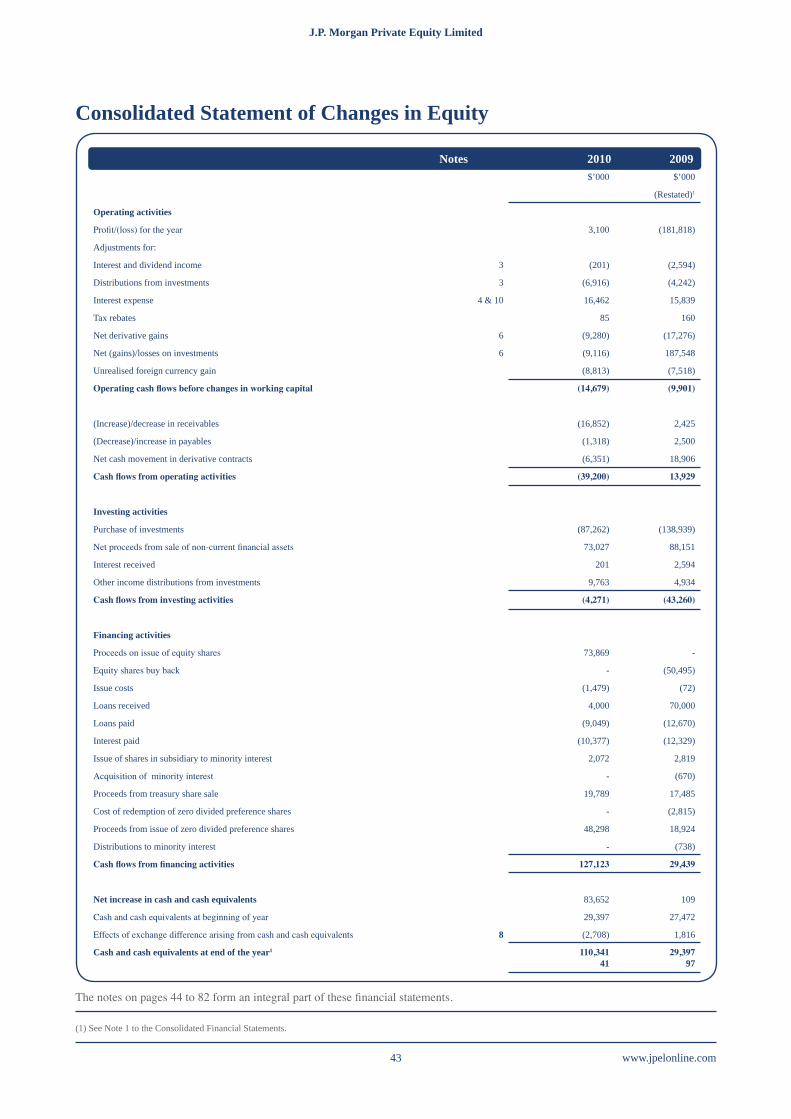
J.P. Morgan Private Equity Limited J.P. Morgan Private Equity Limited
www.jpelonline.com43
Consolidated Statement of Changes in Equity
$’000 $’000
(Restated)1
Operating activities
Profit/(loss) for the year 3,100 (181,818)
Adjustments for:
Interest and dividend income 3 (201) (2,594)
Distributions from investments 3 (6,916) (4,242)
Interest expense 4 & 10 16,462 15,839
Tax rebates 85 160
Net derivative gains 6 (9,280) (17,276)
Net (gains)/losses on investments 6 (9,116) 187,548
Unrealised foreign currency gain (8,813) (7,518)
Operatingcashflowsbeforechangesinworkingcapital (14,679) (9,901)
(Increase)/decrease in receivables (16,852) 2,425
(Decrease)/increase in payables (1,318) 2,500
Net cash movement in derivative contracts (6,351) 18,906
Cashflowsfromoperatingactivities (39,200) 13,929
Investing activities
Purchase of investments (87,262) (138,939)
Net proceeds from sale of non-current financial assets 73,027 88,151
Interest received 201 2,594
Other income distributions from investments 9,763 4,934
Cashflowsfrominvestingactivities (4,271) (43,260)
Financing activities
Proceeds on issue of equity shares 73,869 -
Equity shares buy back - (50,495)
Issue costs (1,479) (72)
Loans received 4,000 70,000
Loans paid (9,049) (12,670)
Interest paid (10,377) (12,329)
Issue of shares in subsidiary to minority interest 2,072 2,819
Acquisition of minority interest - (670)
Proceeds from treasury share sale 19,789 17,485
Cost of redemption of zero divided preference shares - (2,815)
Proceeds from issue of zero divided preference shares 48,298 18,924
Distributions to minority interest - (738)
Cashflowsfromfinancingactivities 127,123 29,439
Net increase in cash and cash equivalents 83,652 109
Cash and cash equivalents at beginning of year 29,397 27,472
Effects of exchange difference arising from cash and cash equivalents 8 (2,708) 1,816
Cash and cash equivalents at end of the year1 110,34141
29,39797
Notes 2010 2009
(1) See Note 1 to the Consolidated Financial Statements.
The notes on pages 44 to 82 form an integral part of these financial statements.

www.jpelonline.com 44
J.P. Morgan Private Equity Limited J.P. Morgan Private Equity Limited
Notes to the Consolidated Financial Statements For the Year Ended 30 June 2010
1. SIGNIFICANT ACCOUNTING POLICIESJ.P. Morgan Private Equity Limited (“the Company”) is a closed ended investment fund incorporated as a limited liability company in Guernsey under the Companies (Guernsey) Law, 1994 (the “old law”) on 28 April 2005. The old law has now been superseded by the Companies (Guernsey) Law, 2008. The Company’s capital structure consists of three classes of shares, Equity Shares and two series of Zero Dividend Preference Shares, all of which are listed on the London Stock Exchange.
The primary objective of the Company and its subsidiaries (“the Group”) is to achieve capital growth, with income as secondary objec-tive, from a diversified portfolio consisting predominantly of private equity limited partnership interests. The Group may also invest directly in private equity investments.
The accounting policies set out below have been applied consistently to all periods presented in these consolidated financial statements, and have been applied consistently by the Group. Certain comparative amounts have been reclassified to conform to the current year’s presentation.
Change in accounting policyDuring the financial year,ving the results of the Group from the functional currency (the US Dollar) to the presentational currency of the roup from Sterling to US Dollar. The Board of Directors believes that adopting the US Dollar as the presentation currency of the Group would:
(i) Eliminate the volatility of reported results from translating the results of the Group from the functional currency (the US Dollar) to the presentational currency.(ii) Enable ease of comparability of the financial statements and the reports to the financial statements namely the Chairman’s report and the Manager’s report both of which are presented in the US Dollar; and(iii) Ensure that the financial statements are presented in a uniform currency as the monthly portfolio reports that use the US Dollar as the presentation currency.
This change in presentational currency has been treated as a change in accounting policy in accordance with International Accounting Standard No. 8 (IAS 8- Accounting Policies, Changes in Accounting Estimates and Errors). The accounting policy change has been car-ried out retrospectively to all other comparative balances. In compliance with IAS 1 (Presentation of Financial Statements), the Group has restated all comparative balances and has presented three statement of financials position as at:
(a) The end of the current period,(b) The end of the previous period (which is the same as the beginning of the current period), and(c) The beginning of the earliest comparative period.
In addition the Group has restated the basic and diluted earnings per share of the comparative period.
Statement of complianceThe consolidated financial statements have been prepared in accordance with International Financial Reporting Standards (“IFRS”) issued and adopted by the International Accounting Standards Board (the “IASB”) and interpretations issued by the International Fi-nancial Reporting Interpretations Committee. They give a true and fair view and are in compliance with applicable legal and regulatory requirements of The Companies (Guernsey) Law, 2008 and the Listing Rules of the UK Listing Authority.
J.P. Morgan Private Equity Limited J.P. Morgan Private Equity Limited
www.jpelonline.com45
Notes to the Consolidated Financial Statements (Continued)
1. SIGNIFICANT ACCOUNTING POLICIES (a) Standards, amendments and interpretations to published standards effective 1 January 2009 adopted by the Group.
IFRS 7 (Amendment) Financial Instruments Disclosures (effective for accounting periods beginning or after 1 January 2009). The amendment is part of the IASB’s annual improvement project published in March 2009. The amendment expands the disclosures required in respect of fair value measurements recognised in the statement of financial position. A three-level hierarchy has been intro-duced; the appropriate level for an instrument is determined on the basis of the lowest level input that is ‘significant’ to the fair value measurement.
The hierarchy for the fair value disclosures is as follows;
• Level 1: Comprises of financial instruments whose value are determined by quoted prices (unadjusted) in active markets for identi-cal assets or liabilities;
• Level 2: Comprises of financial instruments whose values are determined by inputs other than quoted prices included in Level 1 that are observable for the asset or liability, either directly (i.e. as prices) or indirectly (i.e. derived from prices); and
• Level 3: Comprises of financial instruments whose values are determined by inputs that are not based on observable market data (unobservable inputs).
The amendment also specifies enhanced liquidity risk disclosures for derivative and non-derivative financial liabilities. The Group will apply all the amendments from 1 July 2009. As this is a disclosure standard it will not have any impact on the resultsor net assets of the Group.
Revised disclosures in respect of fair values of financial instruments are included in note 7.
IAS1(Revised):Presentationoffinancialstatements (effective for accounting periods beginning on or after 1 January 2009). The revised standard introduces the term total comprehensive income which represents ‘non-owner changes in equity’ to be presented separately from owner changes in equity. All non-owner changes in equity will be required to be shown in a performance statement (the statement of comprehensive income) or two statements (the income statement and statement of comprehensive income). Where entities restate or reclassify comprehensive information, they will be required to present a restated comprehensive statement of financial posi-tion as at the beginning of the comparative period in addition to the current requirement to present comprehensive statement of financial position at the end of the current period and comparative period.
The Group has opted to present a single consolidated statement of comprehensive income.
Revised IFRS 3: Business combinations (effective for accounting periods beginning on or after 1 July 2009) incorporates the follow-ing changes that are likely to be relevant to the Group’s operations:
• The definition of the business has been broadened, which is likely to result in more acquisitions being treated as business combinations;
• Contingent considerations will be measured at fair value, with subsequent changes therein recognised in profit or loss;• Transaction costs, other than share and debt issue costs, will be expensed as incurred;• Any pre-existing interest in the acquiree will be measured at fair value with the gain or loss recognised in profit or loss; and• Any minority interest will be measured at either fair value, or at its proportionate interest in the identifiable assets and liabilities
of the acquiree, on a transaction-by-transaction basis.
Revised IFRS 3, which becomes mandatory for the Group’s 2010 consolidated financial statements, will be applied prospectively and therefore there will have no impact on prior periods in the consolidated financial statements
www.jpelonline.com 46
J.P. Morgan Private Equity Limited J.P. Morgan Private Equity Limited
Notes to the Consolidated Financial Statements (Continued)
1. SIGNIFICANT ACCOUNTING POLICIES (Continued)
IFRS 8: Operating segments (effective for accounting periods beginning on or after 1 January 2009). This standard sets out require-ments for the disclosure of information about an entity’s operating segments and replaces IAS 14. As this is a disclosure standard it will not have any impact on the results or net assets of the Group.
Amended IAS 27: Consolidated and Separate Financial Statements (2008) require accounting for changes in ownership interests by the Group in a subsidiary, while maintaining control, to be recognised as an equity transaction. When the Group loses control of a subsidiary, any interest retained in the former subsidiary will be measured at fair value with the gain or loss recognised in profit or loss. The amendment to IAS 27 which becomes mandatory for the Group’s 2010 consolidated financial statements is not expected to have a significant impact on the consolidated financial statements.
(b) New standards and interpretations not yet adopted A number of new standards, amendments to standards and interpretations in issue are not yet effective for the year ended 30 June 2010, and have not been applied in preparing these financial statements. None of these will have an effect on the financial statements of the Group.
IFRS 9: Financial Instruments (effective for accounting periods beginning on or after 1 January 2013). IFRS 9 deals with classifica-tion and measurement of financial assets and its requirements represent a significant change from the existing requirements in IAS 39 in respect of financial assets. The standard contains two primary measurement categories for financial assets: amortised cost and fair value. A financial asset would be measured at amortised cost if it is held within a business model whose objective is to hold assets in order to collect contractual cash flows, and the asset’s contractual terms give rise on specified dates to cash flows that are solely pay-ments of principal and interest on the principal outstanding. All other financial assets would be measured at fair value.
The standard eliminates the existing IAS 39 categories of held to maturity, available for sale and loans and receivables. For an in-vestment in an equity instrument which is not held for trading, the standard permits an irrevocable election, on initial recognition, on an individual share-by-share basis, to present all fair value changes from the investment in other comprehensive income. No amount recognised in other comprehensive income would ever be reclassified to profit or loss. However, dividends on such investments are recognised in profit or loss, rather than other comprehensive income unless they clearly represent a partial recovery of the cost of the investment. Investments in equity instruments in respect of which an entity does not elect to present fair value changes in other com-prehensive income would be measured at fair value with changes in fair value recognised in profit or loss.
The standard requires that derivatives embedded in contracts with a host that is a financial asset within the scope of the standard are not separated; instead the hybrid financial instrument is assessed in its entirety as to whether it should be measured at amortised cost or fair value. The Group is currently in the process of evaluating the potential effect of this standard. The standard is not expected to have a significant impact on the financial statements since the majority of the Group’s financial assets are designated at fair value through profit or loss.

J.P. Morgan Private Equity Limited J.P. Morgan Private Equity Limited
www.jpelonline.com47
Notes to the Consolidated Financial Statements (Continued)
1. SIGNIFICANT ACCOUNTING POLICIES (Continued)
Basis of Preparation
These consolidated financial statements have been prepared in US Dollars on the historical cost basis except for investments and de-rivative financial instruments that are measured at fair value with changes in fair value recognized in profit and loss. Other financial assets and financial liabilities including receivables, payables, accruals, loans and zero dividend preference shares are stated at amor-tised cost.
The preparation of financial statements in conformity with IFRS requires management to make judgements, estimates and assumptions that affect the application of policies and the reported amounts of assets and liabilities, income and expenses. The estimates and as-sociated assumptions are based on historical experience and various other factors that are believed to be reasonable under the circum-stances, the results of which form the basis of making judgements about the carrying values of assets and liabilities that are not readily apparent from other sources. Actual results may differ from these estimates.
In particular, information about significant areas of estimation uncertainty and critical judgements in applying accounting policies that have the most significant effect on the amount recognised in the consolidated financial statements are described below in key estimates and assumptions.
www.jpelonline.com 48
J.P. Morgan Private Equity Limited J.P. Morgan Private Equity Limited
Notes to the Consolidated Financial Statements (Continued)
1. SIGNIFICANT ACCOUNTING POLICIES (Continued)
Basis of consolidation
SubsidiariesSubsidiaries are entities controlled by the Group. Control exists when the Group has the power to govern the financial and operating policies of an entity so as to obtain benefits from its activities. In assessing control, potential voting rights that currently are exercisable are taken into account. The financial statements of subsidiaries are included in the consolidated financial statements from the date that control commences until the date that control ceases. The accounting policies of subsidiaries are consistent with the policies adopted by the Group. Intra-group balances, and any unrealised income and expenses arising from intra-group transactions are eliminated in preparing the consolidated financial statements.
AssociatesAssociates are entities in which the entity has significant influence but no control over the financial and operating policies. Interests in associates are carried in the statement of financial position at fair value. This treatment is permitted by IAS 28 Investments in Associ-ates, which requires associates interests held by funds to be excluded from its scope where those investments are designated upon initial recognition, as at fair value through profit or loss and accounted for in accordance with IAS 39 – Financial Instruments: Recognition and Measurement, with changes in fair value recognised in profit or loss in the period of the change.
Financial instrumentsFinancial assets and financial liabilities are recognised in the statement of financial position when the Group becomes a party to the contractual provisions of the instrument. Financial assets and financial liabilities are only offset and the net amount reported in the consolidated statement of financial position and statement of comprehensive income when there is a currently enforceable legal right to offset the recognised amounts and the Group intends to settle on a net basis or realise the asset and liability simultaneously.
i) Financial assetsThe classification of financial assets at initial recognition depends on the purpose for which the financial asset was acquired and its characteristics. All financial assets are initially recognised at fair value plus, for an item not at fair value through profit or loss, transac-tion costs that are directly attributable to its acquisition or issue. All purchases of financial assets are recorded at trade date, being the date on which the Company or Group became party to the contractual requirement of the financial asset. The Group’s financial assets comprise of assets designated as financial assets at fair value through profit or loss and loans and receivables. Unless otherwise indi-cated the carrying amounts of the Group’s financial assets approximate to their fair values.
a)FinancialassetsatfairvaluethroughprofitorlossThe Group manages its investments with a view to profiting from the receipt of dividends and changes in fair value of equity invest-ments. Therefore, all quoted investments and unquoted equity investments are designated as at fair value through profit or loss and sub-sequently carried in the statement of financial position at fair value. Acquisition costs are attributed to equity investments and related transaction costs are recognised immediately in the consolidated statement of comprehensive income within other expenses.
Investments in funds are recorded at fair value of the Group’s percentage holding as reported by the general partners of these funds. The underlying investments held by the funds are measured at fair value, which is based on the General Partners’ estimate. In estimat-ing the fair value of underlying investments the objective of the General Partners is to replicate the assumptions and estimates that parties in an arm’s length transaction would make. In arriving at the estimated value of underlying investments, the General Partners consider market multiples, net assets, industry benchmarks, prices of recent transactions, negotiated sales prices, projected operational and financial results of the company and discounted cash flow valuations.
J.P. Morgan Private Equity Limited J.P. Morgan Private Equity Limited
www.jpelonline.com49
Notes to the Consolidated Financial Statements (Continued)
1. SIGNIFICANT ACCOUNTING POLICIES (Continued))
a)Financialassetsatfairvaluethroughprofitorloss(continued)The valuation policies used by many of the private equity general partners and sponsors in undertaking such valuations are generally in line with the recommendations of either the International Private Equity and Venture Capital Valuation Guidelines (IPEVCG) or standard industry practice. Changes in fair value are recognised in the consolidated statement of comprehensive income under net gains/losses on investments.
Investments made by the Group are generally considered to be long term investments and are not intended to be disposed of on a short term basis. Accordingly, valuations do not necessarily represent the amounts which may eventually be realised from sales or other dis-posals of investments. Values of unlisted investments may differ significantly from the values that would have been used had a ready market for these assets existed.
The disclosure requirements in IFRS 7 establish a hierarchal disclosure framework, which prioritizes and ranks the level of market price observability used in measuring investments at fair value. Market price observability is impacted by a number of factors, including the type of investment and characteristics specific to the investment. Investments with readily available actively quoted prices or for which fair value can be measured from actively quoted prices generally will have a higher degree of market price observability and lesser degree of judgment used in measuring fair value.
Investments measured and reported at fair value are classified and disclosed in one of the following categories:
• Level I – Quoted prices are available in active markets for identical investments as of the reporting date. The types of investments that would generally be included in Level I include listed equities and listed derivatives. The Group, to the extent it holds such investments, does not adjust the quoted price for these investments, even in situations where the Group holds a large position and a sale could reasonably impact the quoted price.
• Level II – Pricing inputs other than quoted prices in active markets, which are either directly or indirectly observable as of the reporting date, and fair value is determined through the use of models or other valuation methodologies. The types of in-vestments that would generally be included in this category include corporate bonds and loans, less liquid and restricted equity securities and certain over-the-counter derivatives.
• Level III – Pricing inputs are unobservable for the investment and include situations where there is little, if any, market activity for the investment. The inputs into the determination of fair value require significant management judgment or estimation. The types of investments that would generally be included in this category include equity and/or debt securities issued by private entities.
In certain cases, the inputs used to measure fair value may fall into different levels of the fair value hierarchy. In such cases, a Portfo-lio Fund’s level within the above hierarchy is based on the lowest level of input that is significant to the fair value measurement. The Group’s assessment of the significance of a particular input to the fair value measurement in its entirety requires judgment and considers factors specific to the Portfolio Fund.
b) Loans and receivablesThese assets are non-derivative financial assets with fixed or determinable payments that are not quoted in an active market. They principally comprise trade and other receivables. They are initially recognised at fair value plus transaction costs that are directly attributable to the acquisition, and subsequently carried at amortised cost using the effective interest rate method, less provision for impairment.

www.jpelonline.com 50
J.P. Morgan Private Equity Limited J.P. Morgan Private Equity Limited
Notes to the Consolidated Financial Statements (Continued)
1. SIGNIFICANT ACCOUNTING POLICIES (Continued)
c)DerivativefinancialinstrumentsDerivatives are initially recognised at fair value on the date that a derivative contract is entered into and are subsequently re-measured at their fair value.
The Groups’ derivative instruments do not qualify for hedge accounting. Changes in the fair value of any of these derivative instruments are recognised immediately in the consolidated statement of comprehensive income within ‘net (losses) / gains on investments’.
d)De-recognitionoffinancialassetsA financial asset (in whole or in part) is derecognised either:
• When the Group has transferred substantially all the risk and rewards of ownership; or
• When it has neither transferred nor retained substantially all the risk and rewards and when it no longer has control over the asset or a portion of the asset; or
• When the contractual right to receive cash flow has expired.
ii) Financial liabilitiesThe classification of financial liabilities at initial recognition depends on the purpose for which the financial liability was issued and its characteristics. All financial liabilities are initially recognised at fair value net of transaction costs incurred. All purchases of financial liabilities are recorded on trade date, being the date on which the Company or Group becomes party to the contractual requirements of the financial liability. Unless otherwise indicated the carrying amounts of the Company and Group’s financial liabilities approximate to their fair values.
a) Financial liabilities measured at amortised costThese include trade payables and other short-term monetary liabilities, loans and Zero Dividend Preference shares which are initially recognised at fair value and subsequently carried at amortised cost using the effective interest rate method.
b)De-recognisingoffinancialliabilitiesA financial liability (in whole or in part) is derecognised when the Company or Group has extinguished its contractual obligations, it expires or is cancelled. Any gain or loss on de-recognition is taken to the consolidated statement of comprehensive income.
Cash and cash equivalentsCash comprises deposits with banks. Cash equivalents are short-term highly liquid investments that are readily convertible to known amounts of cash, are subject to an insignificant risk of changes in value and are held for the purpose of meeting short term cash com-mitments rather than for investment or other purposes.
Zero Dividend Preference sharesZero Dividend Preference shares (“ZDP Shares”) are classified as a liability in the financial statements as the ZDPs have a maturity date of either 28 June 2013 or 31 December 2015 and receive a fixed redemption yield of 7% or 8.25%, respectively. They are initially recognised at their capital entitlement being fair value less issuance costs. Subsequent to the initial recognition, ZDP shares are carried at amortised cost using the effective interest rate method. Increases in the carrying value of ZDP shares due to accrued but unpaid inter-est are recognised in the consolidated statement of comprehensive income and charged to the capital reserves.
Costs incurred for the issuance of ordinary shares Incremental external costs directly attributable to the equity transaction and costs associated with the establishment of the Company that would otherwise have been avoided are written off against share capital account.
J.P. Morgan Private Equity Limited J.P. Morgan Private Equity Limited
www.jpelonline.com51
Notes to the Consolidated Financial Statements (Continued)
1. SIGNIFICANT ACCOUNTING POLICIES (Continued)
InterestInterest income and expense is recognised in the consolidated statement of comprehensive income as it accrues using the original ef-fective interest rate of the instrument calculated at the acquisition or origination date.
ExpensesExpenses are recognised on an accruals basis in the consolidated statement of comprehensive income.
Segmental informationOperating segments are reported in a manner consistent with the internal reporting provided to the chief operating decision-maker. The chief operating decision-maker, which is responsible for allocating resources and assessing performance of the operating segments, has been identified as the Board of Directors (“BoD”) that makes strategic decisions. The BoD has determined that the Group operates in only one segment, being Private Equity, based on the reports reviewed by the BoD that are used to make strategic decisions. The BoD assesses the performance of the Group as a single segment.
Foreign Exchange
Functional and presentation currency
The Board of Directors has resolved that the financial statements of the Group be presented in the US Dollar. The Board of Directors considers the US Dollar as the currency that most faithfully represents the economic effects of the underlying transactions, events and conditions. The consolidated financial statements are presented in the US Dollar, which is also the Group’s functional currency.
Foreign currency transactions are translated into the functional currency using the exchange rates prevailing at the dates of the transac-tions. Foreign currency assets and liabilities are translated into the functional currency using the exchange rate prevailing at the balance sheet date.
Foreign exchange gains and losses arising from translation, including those arising from the translation of subsidiary balances, are included in the consolidated statement of comprehensive income.
Foreign exchange gains and losses relating to cash and cash equivalents are presented in the consolidated statement of comprehensive income within ‘net foreign currency gains or losses on cash and cash equivalents’.
Foreign exchange gains and losses relating to the financial assets and liabilities carried at fair value through profit or loss are presented in the statement of comprehensive income within ‘Net gains/(losses) on investments.
Taxation All Guernsey based companies fall under the Zero-10 tax regime and have their investment income assessed for tax at a taxable rate of 0%.
The Australian Subsidiary, MPCT, is not subject to income tax provided the taxable income of MPCT is fully distributed either by way of cash or reinvestment (i.e. unit holders are presently entitled to the income of MPCT).
BSPEL (Lux) S.a.r.l. is subject to all the taxes relevant to commercial companies in Luxembourg.
Bear Stearns Global Turnaround Fund, LP, a Delaware partnership, is not subject to income tax. As a partnership, tax basis income and losses are passed through to the Company as sole limited partner and accordingly, there is no provision for income taxes.
Iberian Acquisition Holdings, LLC is a Delaware Limited Liability Company which is treated as a partnership for income tax purposes. All business losses, profits, and expenses as passed through to the Company as its sole member.

www.jpelonline.com 52
J.P. Morgan Private Equity Limited J.P. Morgan Private Equity Limited
Notes to the Consolidated Financial Statements (Continued)
1. SIGNIFICANT ACCOUNTING POLICIES (Continued)
Key estimates and assumptionsEstimates and judgements used in preparing the financial information are continually evaluated and are based on historical experience and other factors, including expectations of future events that are believed to be reasonable. The resulting estimates will, by definition, seldom equal the related actual results.
The only estimates and assumptions that have a significant risk of causing a material adjustment to the carrying amounts of assets and liabilities relate to the valuation of unquoted investments. These are valued in accordance with IPEVC valuation guidelines as set out in financial assets policy above. Judgement is required in order to determine the appropriate valuation methodology under these guidelines, and subsequently in determining the inputs into the valuation models used. These judgements include making assessments of the future earnings potential of portfolio companies, appropriate earnings multiples to apply, and marketability discounts. Although the judgements are significant, the valuation guidelines are clear, well established and supported by a large part of the global private equity industry.
Investments in private equity funds do not have a readily available market and are generally valued based on the fair value of each pri-vate equity fund as reported by the respective general partner, which necessarily incorporates estimates made by those general partners. The Group believes that this value, in most cases, represents fair value as of the relevant statement date, although, if other factors lead the Group to conclude that fair value provided by the general partner does not represent actual fair value, the Manager will adjust the value of the investment from the general partner’s estimate. The Group estimates fair value based on publicly available information and the most recent financial information provided by the general partners, as adjusted for cash flows since the date of the most recent financial information.
Additionally, the value of public equity securities known to be owned by the private equity funds, based on the most recent information reported to the Group by the general partners, have been marked to market as of the last quoted price on the reporting date.
Where applicable, a discount is applied to such securities based on an estimate of the discount applied by the general partners (to ac-count for restrictions or other constraints) in calculating NAV. The transfer of each of the Groups’ investments in private equity funds generally requires the consent of the corresponding private equity fund manager, and the transfer of certain fund investments is subject to rights of first refusal or other pre-emptive rights, further limiting the Company from transferring an investment in a private equity fund.
The weighted average life of the Groups’ investments in private equity funds was 4.3 years as at the reporting date prior to any exten-sions based upon the funds’ stated termination date. It is common practice for general partners to extend the life of a fund for a period of several years beyond the original termination date. Thus, it is likely that the average remaining life for Groups’ investments in private equity funds is materially greater than 4.3 years. Historical J-curves analysis for private equity investments indicates that the average life for a fund is fifteen years.
Direct co-investments and other investments where no fair value is being provided to the Group by the general partner or sponsor are carried at fair value, as estimated by the Manager. In estimating fair value, the Manager considers the value assigned to each investment by the fund with which the Group has co-invested, to the extent known. The Manager also considers the estimated fair value based on the projected enterprise value at which the underlying company could be sold in an orderly disposition over a reasonable period of time and in a transaction between willing parties other than in a forced sale or liquidation. In these instances, market multiples considering specified financial measures (such as EBITDA, adjusted EBITDA, cash flow, net income, revenues or NAV) and/or a discounted cash flow or liquidation analysis can be used.
Consideration may also be given to such factors as the company’s historical and projected financial data, valuations given to compa-rable companies, the size and scope of the company’s operations, the company’s strengths, weaknesses, applicable restrictions on trans-fer, industry information and assumptions, general economic and market conditions and other factors deemed relevant. The Manager may also engage the services of a third party valuation firm to assist with valuing the asset.
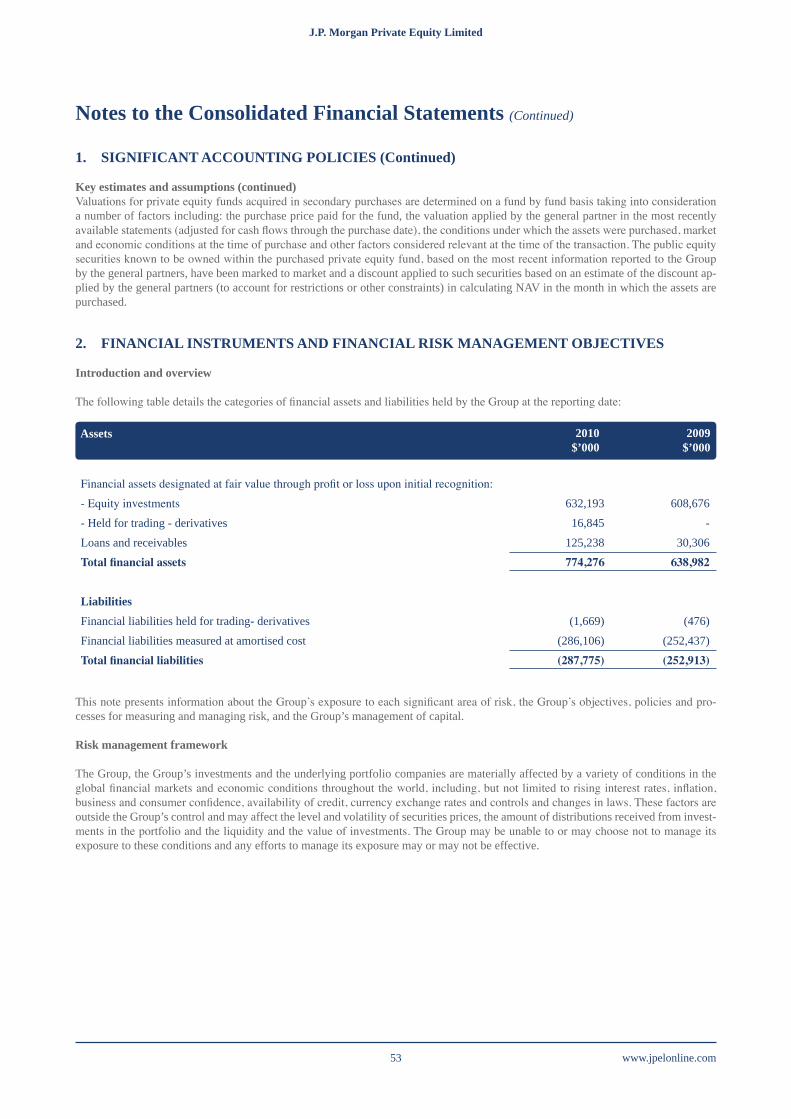
J.P. Morgan Private Equity Limited J.P. Morgan Private Equity Limited
www.jpelonline.com53
Notes to the Consolidated Financial Statements (Continued)
1. SIGNIFICANT ACCOUNTING POLICIES (Continued)
Key estimates and assumptions (continued)Valuations for private equity funds acquired in secondary purchases are determined on a fund by fund basis taking into consideration a number of factors including: the purchase price paid for the fund, the valuation applied by the general partner in the most recently available statements (adjusted for cash flows through the purchase date), the conditions under which the assets were purchased, market and economic conditions at the time of purchase and other factors considered relevant at the time of the transaction. The public equity securities known to be owned within the purchased private equity fund, based on the most recent information reported to the Group by the general partners, have been marked to market and a discount applied to such securities based on an estimate of the discount ap-plied by the general partners (to account for restrictions or other constraints) in calculating NAV in the month in which the assets are purchased.
2. FINANCIAL INSTRUMENTS AND FINANCIAL RISK MANAGEMENT OBJECTIVES
Introduction and overview
The following table details the categories of financial assets and liabilities held by the Group at the reporting date:
Financial assets designated at fair value through profit or loss upon initial recognition:- Equity investments 632,193 608,676- Held for trading - derivatives 16,845 -Loans and receivables 125,238 30,306Totalfinancialassets 774,276 638,982
LiabilitiesFinancial liabilities held for trading- derivatives (1,669) (476)Financial liabilities measured at amortised cost (286,106) (252,437)Totalfinancialliabilities (287,775) (252,913)
This note presents information about the Group’s exposure to each significant area of risk, the Group’s objectives, policies and pro-cesses for measuring and managing risk, and the Group’s management of capital.
Risk management framework
The Group, the Group’s investments and the underlying portfolio companies are materially affected by a variety of conditions in the global financial markets and economic conditions throughout the world, including, but not limited to rising interest rates, inflation, business and consumer confidence, availability of credit, currency exchange rates and controls and changes in laws. These factors are outside the Group’s control and may affect the level and volatility of securities prices, the amount of distributions received from invest-ments in the portfolio and the liquidity and the value of investments. The Group may be unable to or may choose not to manage its exposure to these conditions and any efforts to manage its exposure may or may not be effective.
Assets 2009$’000
2010$’000
www.jpelonline.com 54
J.P. Morgan Private Equity Limited J.P. Morgan Private Equity Limited
Notes to the Consolidated Financial Statements (Continued)
2. FINANCIAL INSTRUMENTS AND FINANCIAL RISK MANAGEMENT OBJECTIVES
(Continued)
The primary investment objective is to achieve both short and long-term capital appreciation by investing in a well diversified portfolio of private equity fund interests purchased in the secondary market and sourced through the primary market. While the Group intends to make investments that will create long-term value for shareholders, the investments made may not appreciate in value and, in fact, may decline in value. Moreover, the Group’s historical financial performance, in particular its Net Asset Value, reflects unrealised gains on investments as of applicable measurement dates which may never be realised due to many factors, some of which are not in the Group’s control, which may adversely affect the ultimate value realised from the Group’s investments. The success of any of the investments in the portfolio will depend upon:
• the quality of its management and the management of the portfolio companies in which it invests;• its ability to select successfully investment opportunities;• general economic conditions; and• its ability to liquidate its investments.
The Group can offer no assurance that its investments will generate gains or income or that any gains or income that may be generated on particular investments will be sufficient to offset any losses that may be sustained.
The Group anticipates that the scope of risk management activities it undertakes will vary based on the level and volatility of interest rates and public equity indexes, prevailing foreign currency exchange rates, the type of investments that are made and other changing market conditions. The use of hedging transactions and other derivative instruments to reduce the effects of a decline in the value of a position does not eliminate the possibility of fluctuations in the value of the position or prevent losses if the value of the position declines.
Please refer to the Group’s Prospectus for further risk disclosures.
Market risk embodies the potential for both gains and losses and includes currency risk, interest rate risk and price risk.
The private equity funds and direct private equity investments in the Groups’ portfolio may be materially affected by conditions in the global financial markets and economic conditions. The capital and credit markets have experienced unprecedented volatility and disruption over recent periods. Uncertainty created by market and economic conditions and a tightening of credit could lead to declines in valuations of equity and debt securities without regard to the underlying financial condition of the issuer in certain cases.
The global financial markets and economic conditions may become dislocated or deteriorate, due to a variety of factors beyond the control of the Group. The general partners of the funds held by the Group may face reduced opportunities to sell and realise value from their existing portfolio companies, and portfolio companies may employ substantial indebtedness that may be difficult to extend or replace and which may magnify the impact of any valuation changes.
In addition, while difficult market conditions may increase opportunities to make certain distressed asset investments, such conditions also increase the risk of default with respect to portfolio companies with debt investments. Such defaults would adversely affect the profitability and net asset values of the investment funds in the Group Portfolio, and consequently, the profitability, Net Asset Value and Share price of the Group. Furthermore, during periods of adverse economic conditions, the Group may have difficulty accessing financial markets, which could make it more difficult or impossible for the Group to obtain funding for additional investments and harm its profitability, Net Asset Value and Share price. Deteriorating conditions in the global financial markets, and actions by governments to address them, have created a great deal of uncertainty for the asset management industry, which may adversely affect the Group’s investments, access to financing, competitive landscape and overall performance.
J.P. Morgan Private Equity Limited J.P. Morgan Private Equity Limited
www.jpelonline.com55
Notes to the Consolidated Financial Statements (Continued)
2. FINANCIAL INSTRUMENTS AND FINANCIAL RISK MANAGEMENT OBJECTIVES
(Continued)
Management of market risksThe Group’s strategy on the management of investment risk is driven by its investment objective. The primary investment objective is to achieve both short and long-term capital appreciation by investing in a well diversified portfolio of private equity fund interests purchased in the secondary market and sourced through the primary market. The Group also makes investments in individual compa-nies by co-investing with private equity sponsors. These investments are generally illiquid and non-public, however the Group may at times invest in public listed securities. The Group’s market risks are managed on an ongoing basis by the Manager in accordance with internal policies and procedures and are discussed with the Board of Directors on a quarterly basis.
The Manager works to mitigate risk by building a diversified portfolio, focusing on achieving a balance across managers, industrial sectors, geographical focus and investment styles. The Manager will also seek to invest in funds created during different vintage years to dampen systemic economic conditions that may impact the private equity market in any given year. Details of the nature of the Group’s investment portfolio at the balance sheet date are disclosed in the Portfolio Review on page 21.
The Manager invests on a highly selective basis and seeks opportunities with high quality private equity investment firms that have proven track records and capabilities. The Manager will validate a given firm’s underlying investment thesis and evaluate its ability to successfully invest in private equity prior to proceeding with any investment. In addition, the Group’s secondary investment strategy enables the Manager to evaluate specific private equity assets.
This permits the Manager to diversify its portfolio at the Company level as well as the fund manager level and to determine that as-sets are purchased at valuations acceptable to the Manager. The Manager actively manages the investment portfolio by meeting with private equity sponsors to discuss current and prospective investments. In addition, each quarter the Manager evaluates private equity sponsor performance reports, valuations, financial health and current activities, and proactively engages them on any potential issues or underlying industry trends.
Exposure to interest rate riskThe Group’s exposure to market risk for changes in interest rates relates primarily to cash and cash equivalents and floating rate debt obligations. The Group has incurred, and expects to continue to incur, indebtedness to fund its liquidity needs and to potentially lever-age certain investments. Due to the foregoing, the Company is, and believes that it will continue to be, exposed to risks associated with movements in prevailing interest rates. An increase in interest rates could make it more difficult or expensive to obtain debt financing, could negatively impact the values of fixed income investments, and could decrease the returns that investments generate or cause them to generate losses.
The Group is, and believes that it will continue to be, subject to additional risks associated with changes in prevailing interest rates due to the fact that its capital is invested in underlying portfolio companies whose capital structures may have a significant degree of indebt-edness. Investments in leveraged companies are inherently more sensitive to declines in revenues, increases in expenses and interest rates and adverse economic, market and industry developments. A leveraged company’s income and net assets also tend to increase or decrease at a greater rate than would be the case if money had not been borrowed. As a result, the risk of loss associated with an invest-ment in a leveraged company is generally greater than for companies with comparably less debt.
As at 30 June 2010, all of the Company’s direct corporate borrowings were drawn from its US$100 million secured credit facility. This facility has been fully drawn down during the year. This capital is a floating rate debt and the interest expenses incurred from this facil-ity is based on the US London Interbank Offer Rate (LIBOR).
The Group has non-recourse indebtedness of $1,776,114 and €24,750,000 (2009: $1,776,114 and €28,350,000) and AU$ 30,000,000 (2009: AU$ 34,500,000) through its BSPEL/MIGDAL Mezzanine Limited and BSPEL Australia Limited subsidiaries respectively which have been consolidated in these financial statements. Both credit facilities are available in multiple currencies and therefore borrow funds that are tied to US LIBOR, GBP LIBOR, EURIBOR, and the Australian Bank Bill Swap Rate.
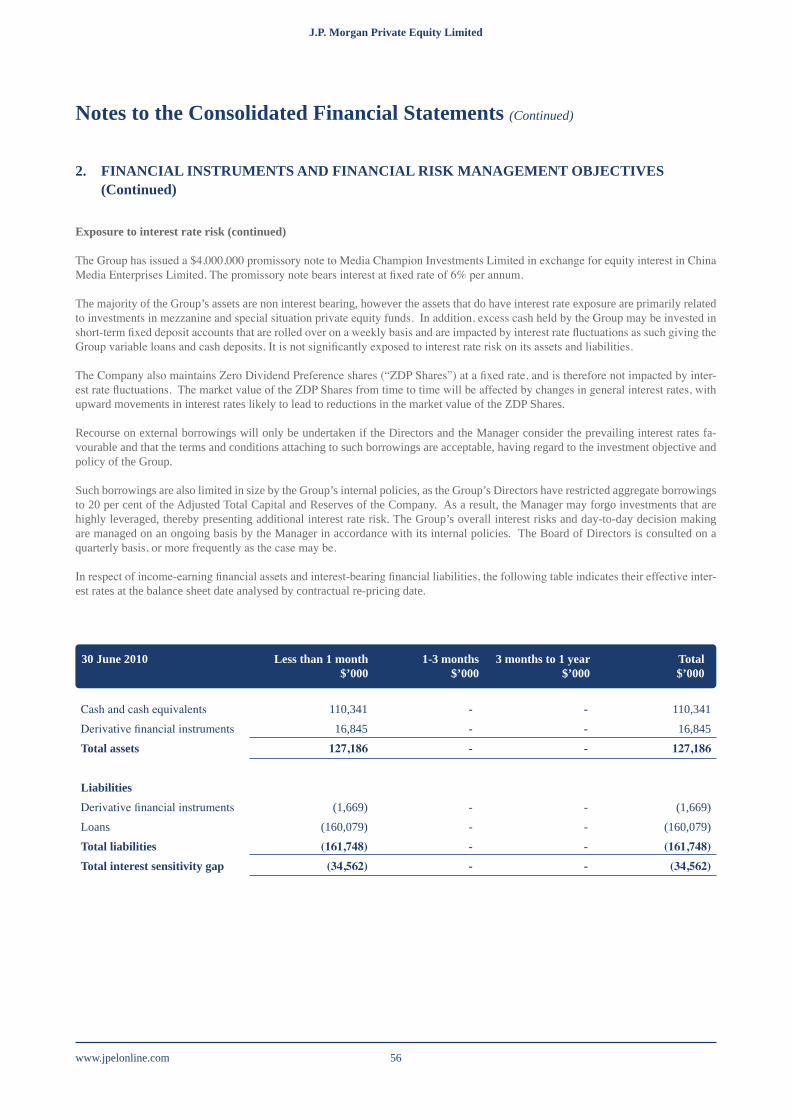
www.jpelonline.com 56
J.P. Morgan Private Equity Limited J.P. Morgan Private Equity Limited
Notes to the Consolidated Financial Statements (Continued)
2. FINANCIAL INSTRUMENTS AND FINANCIAL RISK MANAGEMENT OBJECTIVES
(Continued)
Exposure to interest rate risk (continued)
The Group has issued a $4,000,000 promissory note to Media Champion Investments Limited in exchange for equity interest in China Media Enterprises Limited. The promissory note bears interest at fixed rate of 6% per annum.
The majority of the Group’s assets are non interest bearing, however the assets that do have interest rate exposure are primarily related to investments in mezzanine and special situation private equity funds. In addition, excess cash held by the Group may be invested in short-term fixed deposit accounts that are rolled over on a weekly basis and are impacted by interest rate fluctuations as such giving the Group variable loans and cash deposits. It is not significantly exposed to interest rate risk on its assets and liabilities.
The Company also maintains Zero Dividend Preference shares (“ZDP Shares”) at a fixed rate, and is therefore not impacted by inter-est rate fluctuations. The market value of the ZDP Shares from time to time will be affected by changes in general interest rates, with upward movements in interest rates likely to lead to reductions in the market value of the ZDP Shares.
Recourse on external borrowings will only be undertaken if the Directors and the Manager consider the prevailing interest rates fa-vourable and that the terms and conditions attaching to such borrowings are acceptable, having regard to the investment objective and policy of the Group.
Such borrowings are also limited in size by the Group’s internal policies, as the Group’s Directors have restricted aggregate borrowings to 20 per cent of the Adjusted Total Capital and Reserves of the Company. As a result, the Manager may forgo investments that are highly leveraged, thereby presenting additional interest rate risk. The Group’s overall interest risks and day-to-day decision making are managed on an ongoing basis by the Manager in accordance with its internal policies. The Board of Directors is consulted on a quarterly basis, or more frequently as the case may be.
In respect of income-earning financial assets and interest-bearing financial liabilities, the following table indicates their effective inter-est rates at the balance sheet date analysed by contractual re-pricing date.
Cash and cash equivalents 110,341 - - 110,341Derivative financial instruments 16,845 - - 16,845Total assets 127,186 - - 127,186
LiabilitiesDerivative financial instruments (1,669) - - (1,669)Loans (160,079) - - (160,079)Total liabilities (161,748) - - (161,748)Total interest sensitivity gap (34,562) - - (34,562)
30 June 2010 Less than 1 month $’000
1-3 months$’000
3 months to 1 year $’000
Total$’000
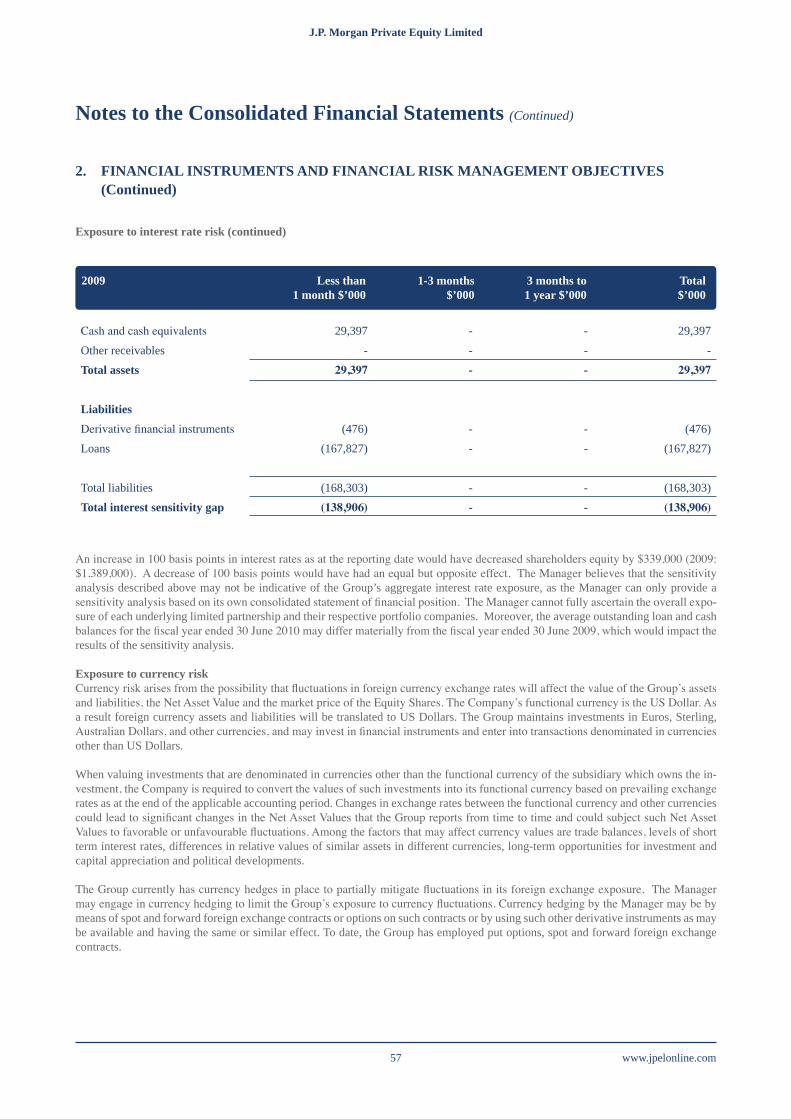
J.P. Morgan Private Equity Limited J.P. Morgan Private Equity Limited
www.jpelonline.com57
Cash and cash equivalents 29,397 - - 29,397Other receivables - - - -Total assets 29,397 - - 29,397
LiabilitiesDerivative financial instruments (476) - - (476)Loans (167,827) - - (167,827)
Total liabilities (168,303) - - (168,303)Total interest sensitivity gap (138,906) - - (138,906)
2009 Less than 1 month $’000
1-3 months$’000
3 months to 1 year $’000
Total$’000
Notes to the Consolidated Financial Statements (Continued)
2. FINANCIAL INSTRUMENTS AND FINANCIAL RISK MANAGEMENT OBJECTIVES
(Continued)
Exposure to interest rate risk (continued)
An increase in 100 basis points in interest rates as at the reporting date would have decreased shareholders equity by $339,000 (2009: $1,389,000). A decrease of 100 basis points would have had an equal but opposite effect. The Manager believes that the sensitivity analysis described above may not be indicative of the Group’s aggregate interest rate exposure, as the Manager can only provide a sensitivity analysis based on its own consolidated statement of financial position. The Manager cannot fully ascertain the overall expo-sure of each underlying limited partnership and their respective portfolio companies. Moreover, the average outstanding loan and cash balances for the fiscal year ended 30 June 2010 may differ materially from the fiscal year ended 30 June 2009, which would impact the results of the sensitivity analysis.
Exposure to currency riskCurrency risk arises from the possibility that fluctuations in foreign currency exchange rates will affect the value of the Group’s assets and liabilities, the Net Asset Value and the market price of the Equity Shares. The Company’s functional currency is the US Dollar. As a result foreign currency assets and liabilities will be translated to US Dollars. The Group maintains investments in Euros, Sterling, Australian Dollars, and other currencies, and may invest in financial instruments and enter into transactions denominated in currencies other than US Dollars.
When valuing investments that are denominated in currencies other than the functional currency of the subsidiary which owns the in-vestment, the Company is required to convert the values of such investments into its functional currency based on prevailing exchange rates as at the end of the applicable accounting period. Changes in exchange rates between the functional currency and other currencies could lead to significant changes in the Net Asset Values that the Group reports from time to time and could subject such Net Asset Values to favorable or unfavourable fluctuations. Among the factors that may affect currency values are trade balances, levels of short term interest rates, differences in relative values of similar assets in different currencies, long-term opportunities for investment and capital appreciation and political developments.
The Group currently has currency hedges in place to partially mitigate fluctuations in its foreign exchange exposure. The Manager may engage in currency hedging to limit the Group’s exposure to currency fluctuations. Currency hedging by the Manager may be by means of spot and forward foreign exchange contracts or options on such contracts or by using such other derivative instruments as may be available and having the same or similar effect. To date, the Group has employed put options, spot and forward foreign exchange contracts.
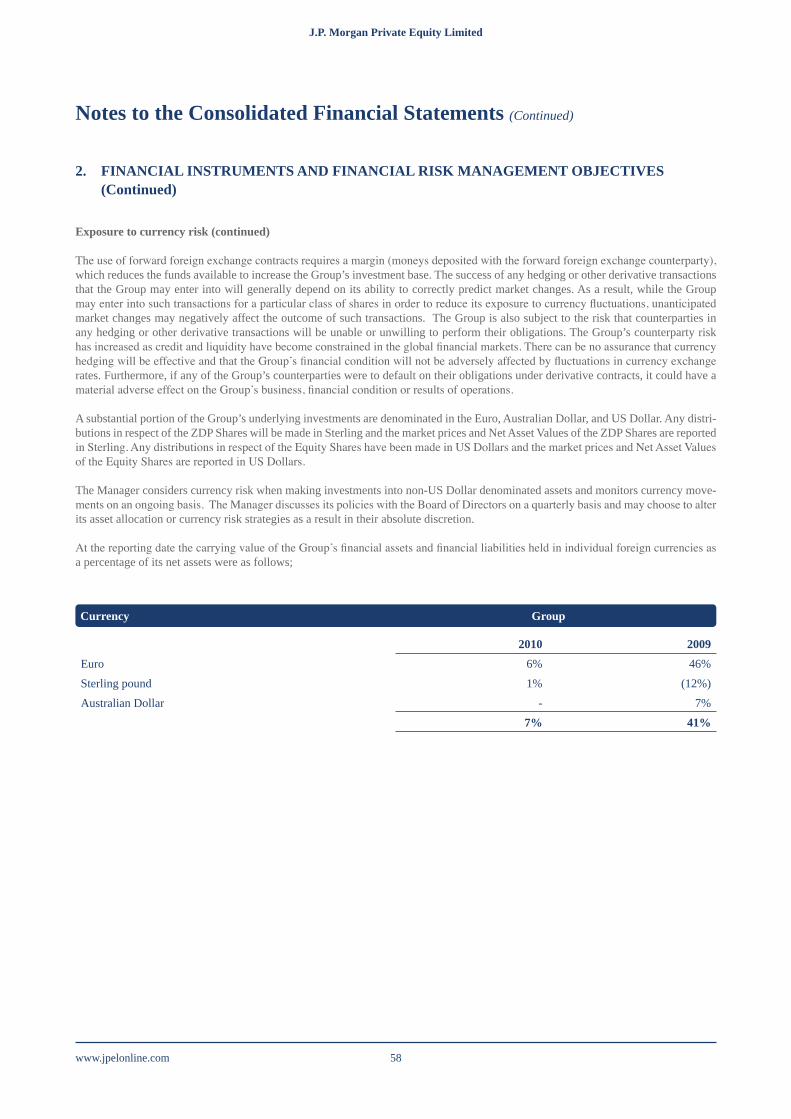
www.jpelonline.com 58
J.P. Morgan Private Equity Limited J.P. Morgan Private Equity Limited
2010 2009Euro 6% 46%Sterling pound 1% (12%)Australian Dollar - 7%
7% 41%
Currency Group
Notes to the Consolidated Financial Statements (Continued)
2. FINANCIAL INSTRUMENTS AND FINANCIAL RISK MANAGEMENT OBJECTIVES
(Continued)
Exposure to currency risk (continued)
The use of forward foreign exchange contracts requires a margin (moneys deposited with the forward foreign exchange counterparty), which reduces the funds available to increase the Group’s investment base. The success of any hedging or other derivative transactions that the Group may enter into will generally depend on its ability to correctly predict market changes. As a result, while the Group may enter into such transactions for a particular class of shares in order to reduce its exposure to currency fluctuations, unanticipated market changes may negatively affect the outcome of such transactions. The Group is also subject to the risk that counterparties in any hedging or other derivative transactions will be unable or unwilling to perform their obligations. The Group’s counterparty risk has increased as credit and liquidity have become constrained in the global financial markets. There can be no assurance that currency hedging will be effective and that the Group’s financial condition will not be adversely affected by fluctuations in currency exchange rates. Furthermore, if any of the Group’s counterparties were to default on their obligations under derivative contracts, it could have a material adverse effect on the Group’s business, financial condition or results of operations.
A substantial portion of the Group’s underlying investments are denominated in the Euro, Australian Dollar, and US Dollar. Any distri-butions in respect of the ZDP Shares will be made in Sterling and the market prices and Net Asset Values of the ZDP Shares are reported in Sterling. Any distributions in respect of the Equity Shares have been made in US Dollars and the market prices and Net Asset Values of the Equity Shares are reported in US Dollars.
The Manager considers currency risk when making investments into non-US Dollar denominated assets and monitors currency move-ments on an ongoing basis. The Manager discusses its policies with the Board of Directors on a quarterly basis and may choose to alter its asset allocation or currency risk strategies as a result in their absolute discretion.
At the reporting date the carrying value of the Group’s financial assets and financial liabilities held in individual foreign currencies as a percentage of its net assets were as follows;
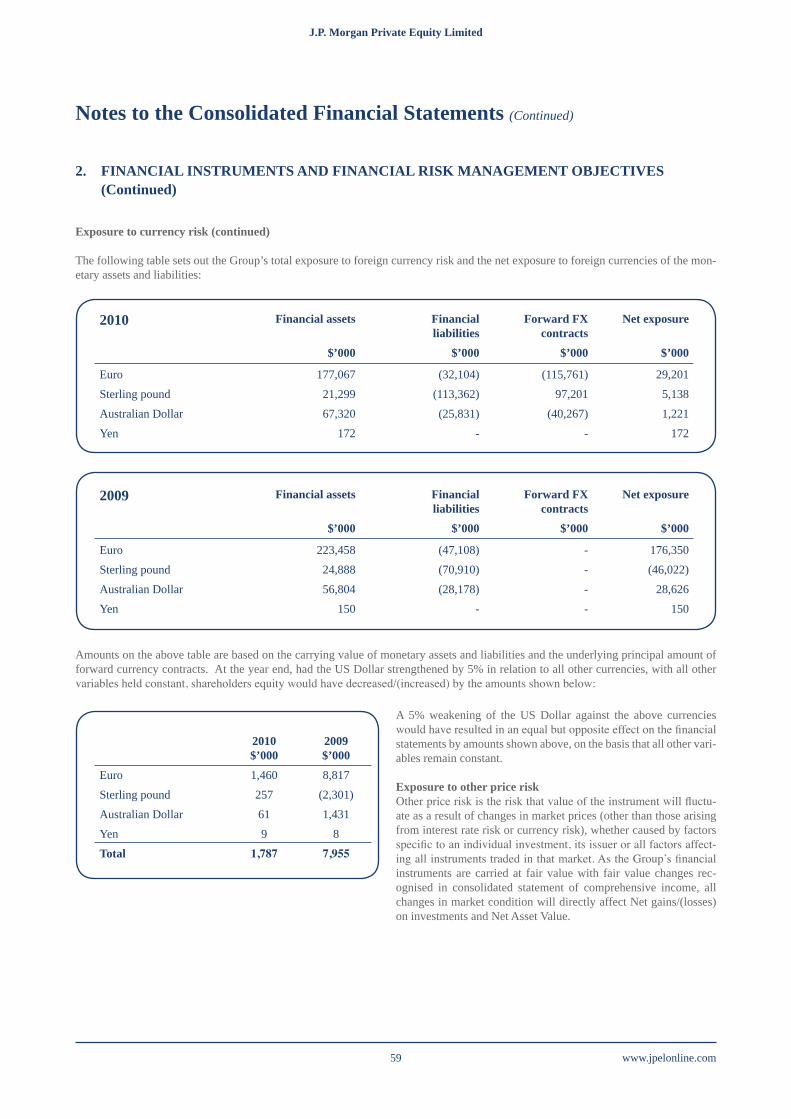
J.P. Morgan Private Equity Limited J.P. Morgan Private Equity Limited
www.jpelonline.com59
2010 Financial assets Financial liabilities
Forward FX contracts
Net exposure
$’000 $’000 $’000 $’000
Euro 177,067 (32,104) (115,761) 29,201Sterling pound 21,299 (113,362) 97,201 5,138Australian Dollar 67,320 (25,831) (40,267) 1,221Yen 172 - - 172
2009 Financial assets Financial liabilities
Forward FX contracts
Net exposure
$’000 $’000 $’000 $’000
Euro 223,458 (47,108) - 176,350Sterling pound 24,888 (70,910) - (46,022)Australian Dollar 56,804 (28,178) - 28,626Yen 150 - - 150
2010$’000
2009$’000
Euro 1,460 8,817Sterling pound 257 (2,301)Australian Dollar 61 1,431Yen 9 8Total 1,787 7,955
Notes to the Consolidated Financial Statements (Continued)
2. FINANCIAL INSTRUMENTS AND FINANCIAL RISK MANAGEMENT OBJECTIVES
(Continued)
Exposure to currency risk (continued)
The following table sets out the Group’s total exposure to foreign currency risk and the net exposure to foreign currencies of the mon-etary assets and liabilities:
Amounts on the above table are based on the carrying value of monetary assets and liabilities and the underlying principal amount of forward currency contracts. At the year end, had the US Dollar strengthened by 5% in relation to all other currencies, with all other variables held constant, shareholders equity would have decreased/(increased) by the amounts shown below:
A 5% weakening of the US Dollar against the above currencies would have resulted in an equal but opposite effect on the financial statements by amounts shown above, on the basis that all other vari-ables remain constant.
Exposure to other price riskOther price risk is the risk that value of the instrument will fluctu-ate as a result of changes in market prices (other than those arising from interest rate risk or currency risk), whether caused by factors specific to an individual investment, its issuer or all factors affect-ing all instruments traded in that market. As the Group’s financial instruments are carried at fair value with fair value changes rec-ognised in consolidated statement of comprehensive income, all changes in market condition will directly affect Net gains/(losses) on investments and Net Asset Value.
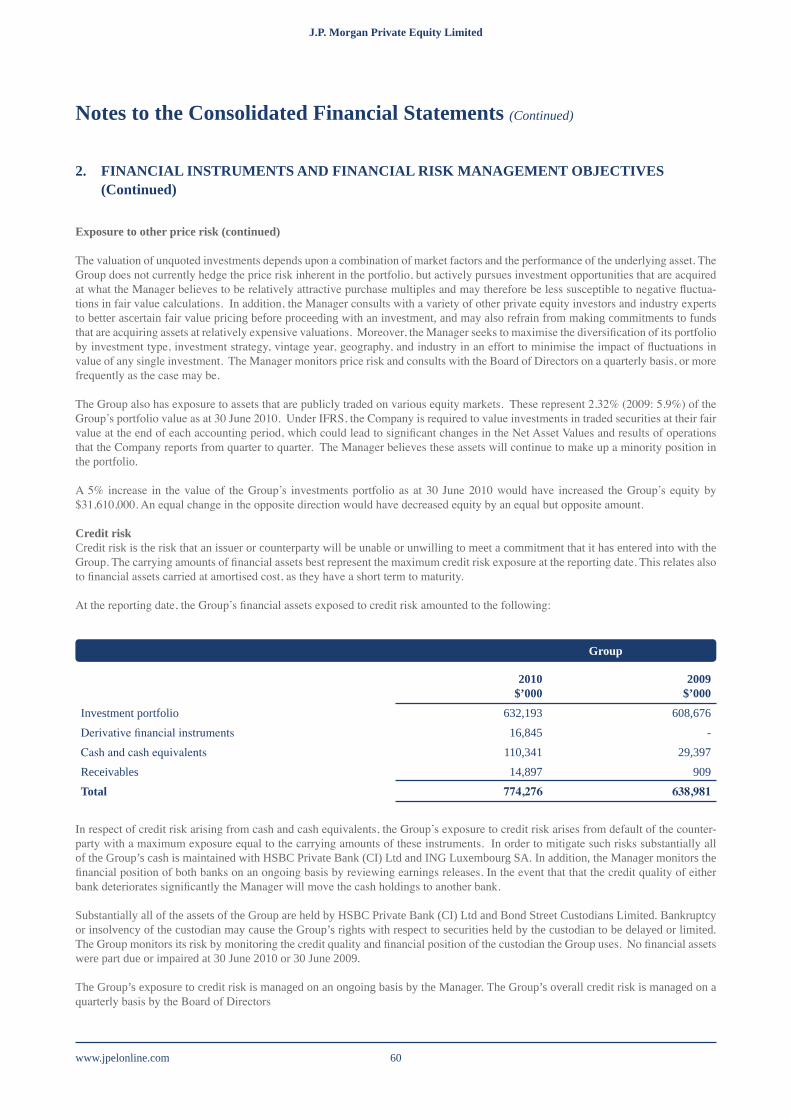
www.jpelonline.com 60
J.P. Morgan Private Equity Limited J.P. Morgan Private Equity Limited
Notes to the Consolidated Financial Statements (Continued)
2. FINANCIAL INSTRUMENTS AND FINANCIAL RISK MANAGEMENT OBJECTIVES
(Continued)
Exposure to other price risk (continued)
The valuation of unquoted investments depends upon a combination of market factors and the performance of the underlying asset. The Group does not currently hedge the price risk inherent in the portfolio, but actively pursues investment opportunities that are acquired at what the Manager believes to be relatively attractive purchase multiples and may therefore be less susceptible to negative fluctua-tions in fair value calculations. In addition, the Manager consults with a variety of other private equity investors and industry experts to better ascertain fair value pricing before proceeding with an investment, and may also refrain from making commitments to funds that are acquiring assets at relatively expensive valuations. Moreover, the Manager seeks to maximise the diversification of its portfolio by investment type, investment strategy, vintage year, geography, and industry in an effort to minimise the impact of fluctuations in value of any single investment. The Manager monitors price risk and consults with the Board of Directors on a quarterly basis, or more frequently as the case may be.
The Group also has exposure to assets that are publicly traded on various equity markets. These represent 2.32% (2009: 5.9%) of the Group’s portfolio value as at 30 June 2010. Under IFRS, the Company is required to value investments in traded securities at their fair value at the end of each accounting period, which could lead to significant changes in the Net Asset Values and results of operations that the Company reports from quarter to quarter. The Manager believes these assets will continue to make up a minority position in the portfolio.
A 5% increase in the value of the Group’s investments portfolio as at 30 June 2010 would have increased the Group’s equity by $31,610,000. An equal change in the opposite direction would have decreased equity by an equal but opposite amount.
Credit riskCredit risk is the risk that an issuer or counterparty will be unable or unwilling to meet a commitment that it has entered into with the Group. The carrying amounts of financial assets best represent the maximum credit risk exposure at the reporting date. This relates also to financial assets carried at amortised cost, as they have a short term to maturity.
At the reporting date, the Group’s financial assets exposed to credit risk amounted to the following:
2010 $’000
2009 $’000
Investment portfolio 632,193 608,676Derivative financial instruments 16,845 -Cash and cash equivalents 110,341 29,397Receivables 14,897 909Total 774,276 638,981
Group
In respect of credit risk arising from cash and cash equivalents, the Group’s exposure to credit risk arises from default of the counter-party with a maximum exposure equal to the carrying amounts of these instruments. In order to mitigate such risks substantially all of the Group’s cash is maintained with HSBC Private Bank (CI) Ltd and ING Luxembourg SA. In addition, the Manager monitors the financial position of both banks on an ongoing basis by reviewing earnings releases. In the event that that the credit quality of either bank deteriorates significantly the Manager will move the cash holdings to another bank.
Substantially all of the assets of the Group are held by HSBC Private Bank (CI) Ltd and Bond Street Custodians Limited. Bankruptcy or insolvency of the custodian may cause the Group’s rights with respect to securities held by the custodian to be delayed or limited. The Group monitors its risk by monitoring the credit quality and financial position of the custodian the Group uses. No financial assets were part due or impaired at 30 June 2010 or 30 June 2009.
The Group’s exposure to credit risk is managed on an ongoing basis by the Manager. The Group’s overall credit risk is managed on a quarterly basis by the Board of Directors

J.P. Morgan Private Equity Limited J.P. Morgan Private Equity Limited
www.jpelonline.com61
Notes to the Consolidated Financial Statements (Continued)
2. FINANCIAL INSTRUMENTS AND FINANCIAL RISK MANAGEMENT OBJECTIVES
(Continued)
Liquidity risk
The Group’s financial instruments primarily include investments in unlisted equity investments that are not publicly traded and there-fore may be illiquid. As a result the Group may not be able to liquidate some of its investments in these instruments at an amount close to their fair value should such liquidation be necessary to meet liquidity requirements, including the need to meet outstanding undrawn commitments.
The Group’s exposure to liquidity risk is actively managed and monitored on an ongoing basis by the Manager, and by the Board of Di-rectors on a quarterly basis. The Manager frequently consults with its underlying fund managers about upcoming capital requirements as well as potential exit and other monetisation events. Allocations to new investments take into consideration the near-term capital needs within the Group’s broader private equity portfolio. Where the Manager believes there may be upcoming liquidity requirements, it will take necessary action to ensure that adequate funds are available.
The Group’s liquidity may also be impacted by its existing tender offer facility. While any tender of shares is offered at the Board’s sole discretion, in the event that the facility is utilised, it may require the use of a material amount of excess cash that the Group may otherwise be able to invest in private equity or reduce outstanding indebtedness.
The Group has entered into a US$ 100,000,000 revolving loan facility agreement with Fortress Credit Corp. for up to four years which will provide the Group with both short-term and long-term liquidity. Per the credit agreement, the Group and the lender monitor the loan covenants on a quarterly basis. As at 30 June 2010, the Group was in compliance with all such covenants. The Group has entered into a Revolving Loan Facility with the Bank of Scotland. Per the credit agreement, the Group and the lender monitor the loan cov-enants on a quarterly basis. As at 30 June 2010, the Group was in compliance with all covenants.
The Group also maintains cash and cash equivalents in excess of what the Manager believes will be required in the coming quarters. The Group currently holds cash and cash equivalents of US$106.3 million. The Manager pursues an investment strategy with respect to all un-invested cash in the Company Portfolio that is designed to balance the need for appropriate liquidity to meet its present and future private equity commitment obligations with the desire to increase the returns of the Group Portfolio. The majority of available cash is invested in fixed deposits with rolling seven-day contracts.
The investment commitments presented in note 7 represent commitments to commit capital to underlying investments as such time as the managers of those assets request. The precise timing of future calls, and whether such calls will be made at all, is at the discretion of the investment managers of each individual asset within the investment portfolio.
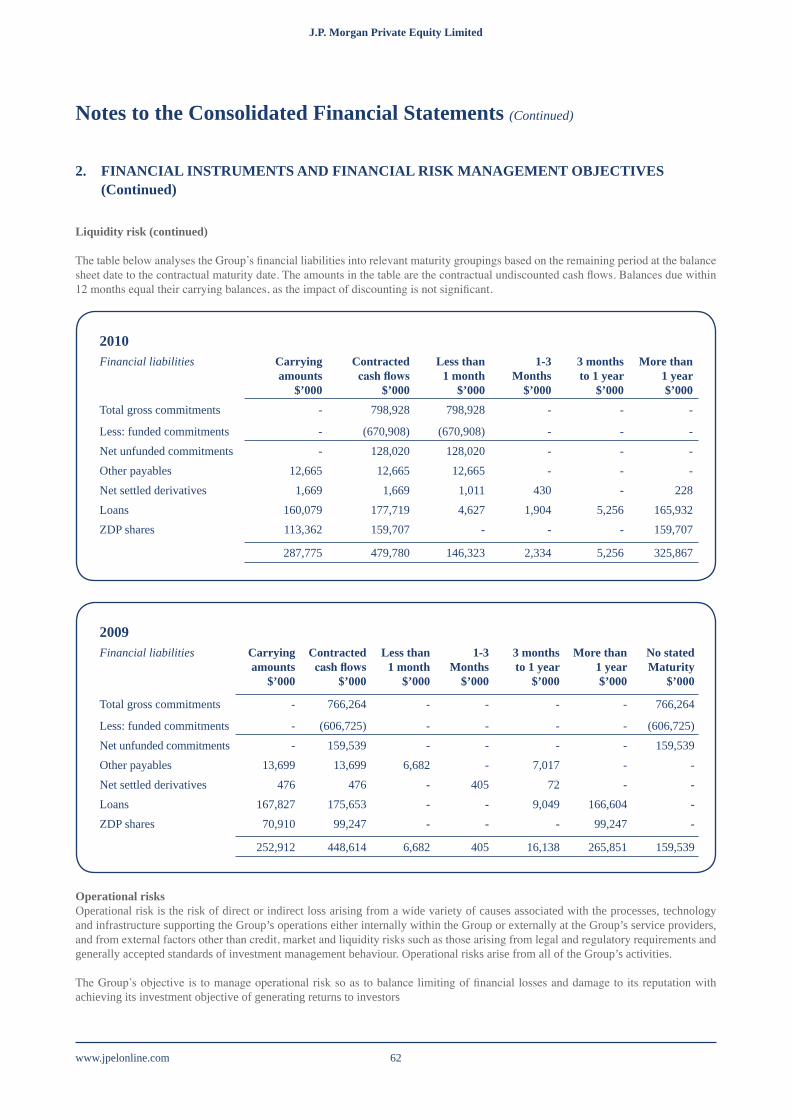
www.jpelonline.com 62
J.P. Morgan Private Equity Limited J.P. Morgan Private Equity Limited
Notes to the Consolidated Financial Statements (Continued)
2. FINANCIAL INSTRUMENTS AND FINANCIAL RISK MANAGEMENT OBJECTIVES
(Continued)
Liquidity risk (continued)
The table below analyses the Group’s financial liabilities into relevant maturity groupings based on the remaining period at the balance sheet date to the contractual maturity date. The amounts in the table are the contractual undiscounted cash flows. Balances due within 12 months equal their carrying balances, as the impact of discounting is not significant.
2010Financial liabilities Carrying
amounts $’000
Contracted cashflows
$’000
Less than 1 month
$’000
1-3 Months
$’000
3 months to 1 year
$’000
More than 1 year $’000
Total gross commitments - 798,928 798,928 - - -
Less: funded commitments - (670,908) (670,908) - - -Net unfunded commitments - 128,020 128,020 - - -Other payables 12,665 12,665 12,665 - - -Net settled derivatives 1,669 1,669 1,011 430 - 228Loans 160,079 177,719 4,627 1,904 5,256 165,932ZDP shares 113,362 159,707 - - - 159,707
287,775 479,780 146,323 2,334 5,256 325,867
2009Financial liabilities Carrying
amounts $’000
Contracted cashflows
$’000
Less than 1 month
$’000
1-3 Months
$’000
3 months to 1 year
$’000
More than 1 year $’000
No stated Maturity
$’000
Total gross commitments - 766,264 - - - - 766,264
Less: funded commitments - (606,725) - - - - (606,725)Net unfunded commitments - 159,539 - - - - 159,539Other payables 13,699 13,699 6,682 - 7,017 - -Net settled derivatives 476 476 - 405 72 - -Loans 167,827 175,653 - - 9,049 166,604 -ZDP shares 70,910 99,247 - - - 99,247 -
252,912 448,614 6,682 405 16,138 265,851 159,539
Operational risksOperational risk is the risk of direct or indirect loss arising from a wide variety of causes associated with the processes, technology and infrastructure supporting the Group’s operations either internally within the Group or externally at the Group’s service providers, and from external factors other than credit, market and liquidity risks such as those arising from legal and regulatory requirements and generally accepted standards of investment management behaviour. Operational risks arise from all of the Group’s activities.
The Group’s objective is to manage operational risk so as to balance limiting of financial losses and damage to its reputation with achieving its investment objective of generating returns to investors

J.P. Morgan Private Equity Limited J.P. Morgan Private Equity Limited
www.jpelonline.com63
Notes to the Consolidated Financial Statements (Continued)
2. FINANCIAL INSTRUMENTS AND FINANCIAL RISK MANAGEMENT OBJECTIVES
(Continued)
Operational risks (Continued)The primary responsibility for the development and implementation of controls over operational risk rests with the Board of Directors. This responsibility is supported by the development of overall standards for the management of operational risk, which encompasses the controls and processes at the service providers and the establishment of service levels with the service providers, in the following areas:• requirements for appropriate segregation of duties between various functions, roles and responsibilities• requirements for the reconciliation and monitoring of transactions• compliance with regulatory and other legal requirements• documentation of controls and procedures• requirements for the periodic assessment of operational risks faced, and the adequacy of controls and procedures to address the
risks identified• contingency plans• ethical and business standards• risk mitigation, including insurance where this is effective.The directors’ assessment over the adequacy of the controls and processes in place at the service providers with respect to operational risks is carried out via regular discussions with the service providers and a review of the service providers’ SAS 70 reports on internal controls, where available.
Other risksThe Company is exposed to various other risks with respect to its investments. A summary of these risks is as follows:
(a) Valuation riskAll valuations of the private equity funds and similar investments incorporated in the Group’s reported net asset value are made, in part, on valuation information provided by the managers of investments in the Company’s portfolio. Although the Manager evaluates all such information and data, the Manager is generally not in a position to confirm the completeness, genuineness or accuracy of such information or data. Moreover, financial reports typically provided to the Manager are provided only on a quarterly or half-yearly basis and generally are issued one to four months after the respective valuation dates. As a result of this delay, the valuations incorporated in the Group’s reported net asset value may from time to time fail to accurately state the true current aggregate value of the investments of the Group.
(b) Reliance on ManagerQuality and execution of management is key to a successful business development. The Group will be relying on the Manager and its ability to evaluate investment opportunities and to further develop the Company’s investments. The Manager exercises a central role in the investment decision process. Accordingly the returns of the Group will primarily depend on the performance and abilities of the Manager.
(c) Political and /or regulatory riskThe net asset value of the Group’s assets may be affected by uncertainties such as international political developments, changes in gov-ernmental policies, taxation, restrictions on foreign investment and currency repatriation, currency fluctuations and other developments in the laws and regulations of the countries in which the Company’s assets are invested.
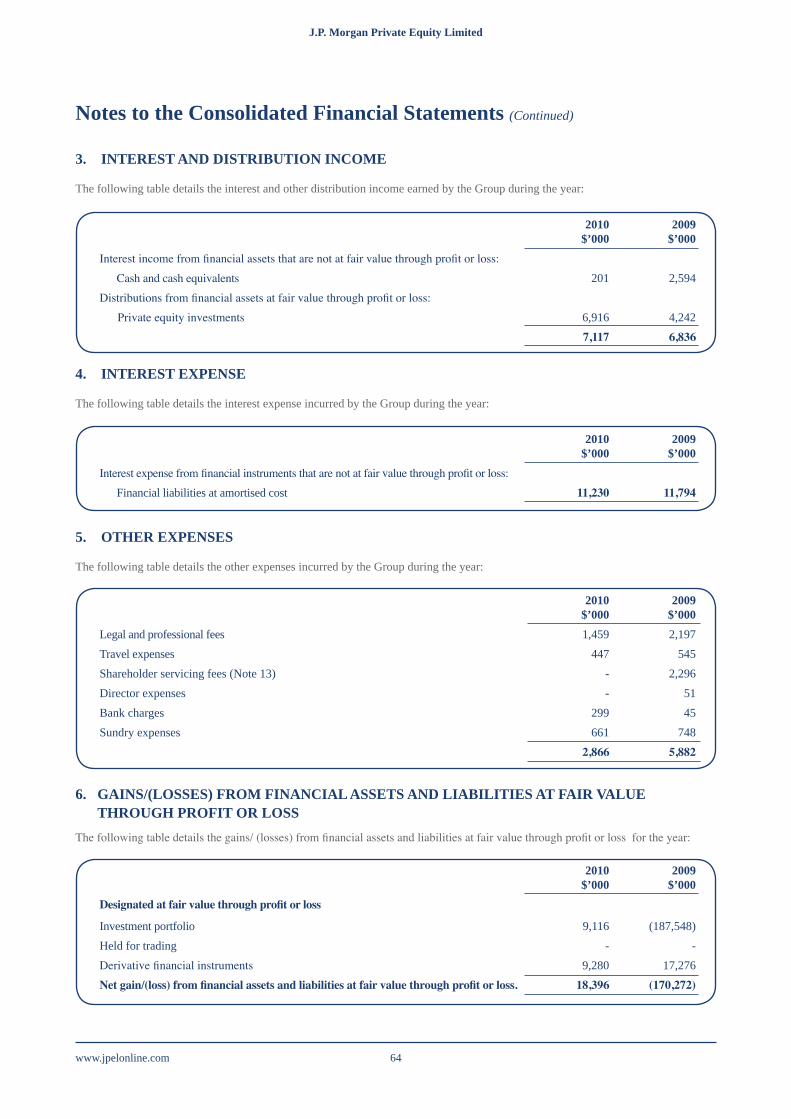
www.jpelonline.com 64
J.P. Morgan Private Equity Limited J.P. Morgan Private Equity Limited
2010$’000
2009$’000
Interest income from financial assets that are not at fair value through profit or loss: Cash and cash equivalents 201 2,594Distributions from financial assets at fair value through profit or loss: Private equity investments 6,916 4,242
7,117 6,836
2010$’000
2009$’000
Interest expense from financial instruments that are not at fair value through profit or loss: Financial liabilities at amortised cost 11,230 11,794
2010$’000
2009$’000
Legal and professional fees 1,459 2,197Travel expenses 447 545Shareholder servicing fees (Note 13) - 2,296Director expenses - 51Bank charges 299 45Sundry expenses 661 748
2,866 5,882
2010$’000
2009$’000
Designatedatfairvaluethroughprofitorloss
Investment portfolio 9,116 (187,548)Held for trading - -Derivative financial instruments 9,280 17,276Netgain/(loss)fromfinancialassetsandliabilitiesatfairvaluethroughprofitorloss. 18,396 (170,272)
Notes to the Consolidated Financial Statements (Continued)
3. INTEREST AND DISTRIBUTION INCOME
The following table details the interest and other distribution income earned by the Group during the year:
5. OTHER EXPENSES
The following table details the other expenses incurred by the Group during the year:
4. INTEREST EXPENSE
The following table details the interest expense incurred by the Group during the year:
6. GAINS/(LOSSES) FROM FINANCIAL ASSETS AND LIABILITIES AT FAIR VALUE
THROUGH PROFIT OR LOSSThe following table details the gains/ (losses) from financial assets and liabilities at fair value through profit or loss for the year:

J.P. Morgan Private Equity Limited J.P. Morgan Private Equity Limited
www.jpelonline.com65
Notes to the Consolidated Financial Statements (Continued)
7. INVESTMENTS
All investments are designated at fair value through profit or loss at initial recognition, therefore all gains and losses arise on invest-ments designated at fair value through profit or loss. Given the nature of the Group’s investments the fair value gains recognised in these financial statements are not considered to be readily convertible to cash in full at reporting date and therefore the movement in these fair values are treated as unrealised.
CommitmentsThe Group has committed to invest in certain private equity funds and investments. Such commitments are payable upon demand at the request of the Fund’s administrator or General Partner. As of 30 June 2010, the Group held interests in 165 unique fund interests and 8 co-investments, including private equity funds, direct co-investments and publicly traded equity securities and had unfunded commitments to private equity funds of $128,019,595 (2009:$159,539,000) that may be called by the underlying limited partner-ships.. In addition, the Group may make capital commitments to private equity funds in the future and may make purchases of exist-ing private equity funds in the secondary market, many of which will be subject to additional funding requirements.
The Group may employ an over-commitment strategy when making investments in private equity funds in order to maximize the amount of its capital that is invested at any given time. When an over-commitment strategy is employed, the aggregate amount of capital committed by the Group to private equity funds at a given time may exceed the aggregate amount of cash that the Group has available for immediate investment.
Because the managers of private equity funds will typically be permitted to make calls for capital contributions following the expira-tion of a relatively short notice period, employing an over-commitment approach requires the Group to time investments and manage available cash in a manner that allows the funding of its capital commitments when capital calls are made. The Manager is primarily responsible for managing the Groups’ cash and the timing of its investments. The Manager takes into account expected cash flows to and from its investments and amounts available from the issuance of notes under the Program when planning investment and cash management activities with the objective of seeking to ensure that the Group is able to honour its commitments to funds when they become due.
The Group believes it currently has sufficient liquidity to meet an over-commitment strategy.
The Group has established a number of investment holding vehicles that are held purely for purposes of holding the underlying investment in private equity funds. These special purpose entities are presented in detail below;
Name Country ofIncorporation
% Holding Principal activity
BSPEL Mezzanine Funding Limited Guernsey 100% Holding company BSPEL/Migdal Mezzanine Limited Guernsey 80% Holding company BSPEL Australia Limited Guernsey 100% Holding company Hunter Acquisition Limited Guernsey 72% Holding company Bear Stearns Global Turnaround Fund L.P. Delaware 100% Limited partnership BSPEL (Lux) S.a.r.l. Luxembourg 100% Holding company JPEL TF Limited Guernsey 100% Holding company Iberian Acquisition Holdings LLC Delaware 100% Holding company JPEL Convey Limited Guernsey 100% Holding company
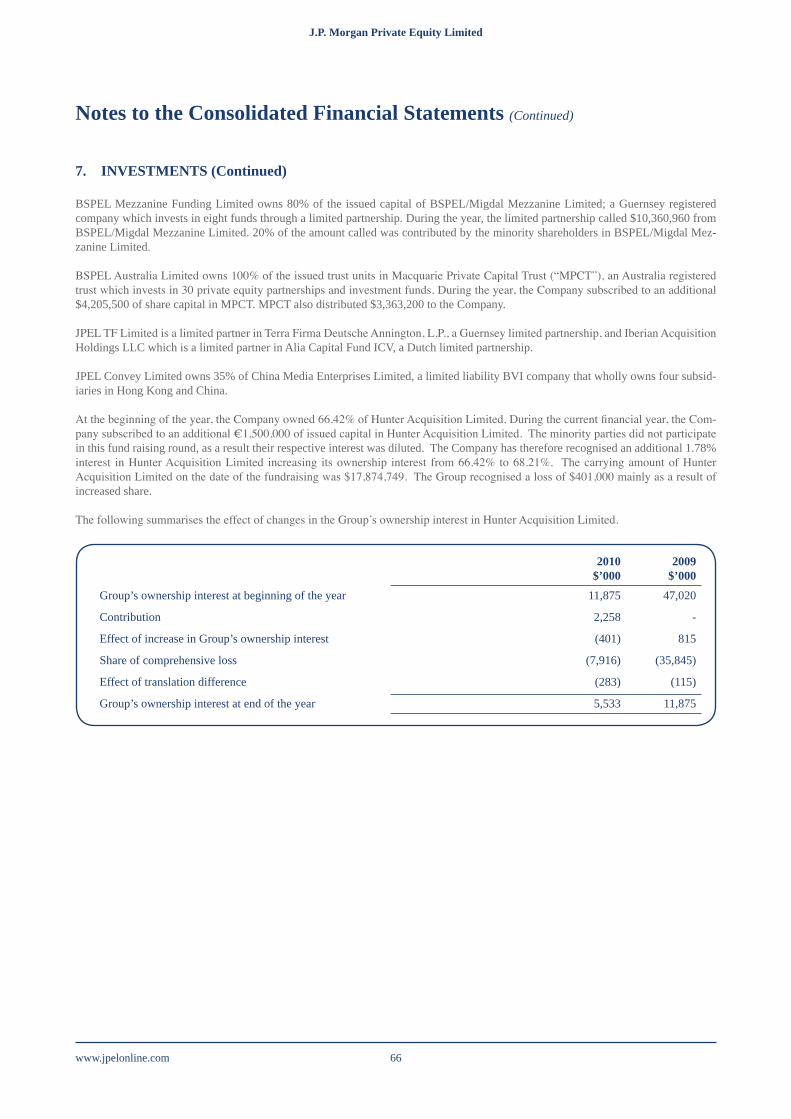
www.jpelonline.com 66
J.P. Morgan Private Equity Limited J.P. Morgan Private Equity Limited
2010$’000
2009$’000
Group’s ownership interest at beginning of the year 11,875 47,020
Contribution 2,258 -
Effect of increase in Group’s ownership interest (401) 815
Share of comprehensive loss (7,916) (35,845)
Effect of translation difference (283) (115)
Group’s ownership interest at end of the year 5,533 11,875
Notes to the Consolidated Financial Statements (Continued)
7. INVESTMENTS (Continued)
BSPEL Mezzanine Funding Limited owns 80% of the issued capital of BSPEL/Migdal Mezzanine Limited; a Guernsey registered company which invests in eight funds through a limited partnership. During the year, the limited partnership called $10,360,960 from BSPEL/Migdal Mezzanine Limited. 20% of the amount called was contributed by the minority shareholders in BSPEL/Migdal Mez-zanine Limited.
BSPEL Australia Limited owns 100% of the issued trust units in Macquarie Private Capital Trust (“MPCT”), an Australia registered trust which invests in 30 private equity partnerships and investment funds. During the year, the Company subscribed to an additional $4,205,500 of share capital in MPCT. MPCT also distributed $3,363,200 to the Company.
JPEL TF Limited is a limited partner in Terra Firma Deutsche Annington, L.P., a Guernsey limited partnership, and Iberian Acquisition Holdings LLC which is a limited partner in Alia Capital Fund ICV, a Dutch limited partnership.
JPEL Convey Limited owns 35% of China Media Enterprises Limited, a limited liability BVI company that wholly owns four subsid-iaries in Hong Kong and China.
At the beginning of the year, the Company owned 66.42% of Hunter Acquisition Limited. During the current financial year, the Com-pany subscribed to an additional €1,500,000 of issued capital in Hunter Acquisition Limited. The minority parties did not participate in this fund raising round, as a result their respective interest was diluted. The Company has therefore recognised an additional 1.78% interest in Hunter Acquisition Limited increasing its ownership interest from 66.42% to 68.21%. The carrying amount of Hunter Acquisition Limited on the date of the fundraising was $17,874,749. The Group recognised a loss of $401,000 mainly as a result of increased share.
The following summarises the effect of changes in the Group’s ownership interest in Hunter Acquisition Limited.
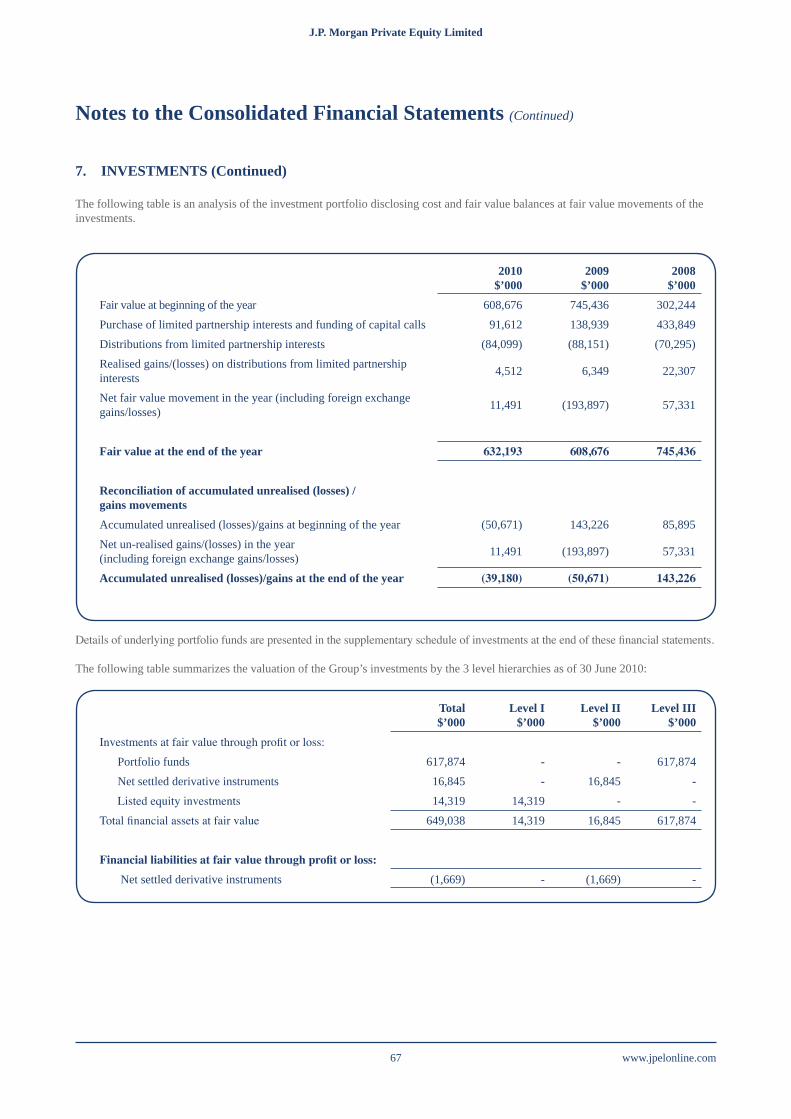
J.P. Morgan Private Equity Limited J.P. Morgan Private Equity Limited
www.jpelonline.com67
Total$’000
Level I$’000
Level II$’000
Level III$’000
Investments at fair value through profit or loss: Portfolio funds 617,874 - - 617,874 Net settled derivative instruments 16,845 - 16,845 - Listed equity investments 14,319 14,319 - -Total financial assets at fair value 649,038 14,319 16,845 617,874
Financialliabilitiesatfairvaluethroughprofitorloss: Net settled derivative instruments (1,669) - (1,669) -
2010$’000
2009$’000
2008$’000
Fair value at beginning of the year 608,676 745,436 302,244Purchase of limited partnership interests and funding of capital calls 91,612 138,939 433,849Distributions from limited partnership interests (84,099) (88,151) (70,295)Realised gains/(losses) on distributions from limited partnership interests 4,512 6,349 22,307
Net fair value movement in the year (including foreign exchange gains/losses) 11,491 (193,897) 57,331
Fair value at the end of the year 632,193 608,676 745,436
Reconciliation of accumulated unrealised (losses) / gains movementsAccumulated unrealised (losses)/gains at beginning of the year (50,671) 143,226 85,895Net un-realised gains/(losses) in the year (including foreign exchange gains/losses) 11,491 (193,897) 57,331
Accumulated unrealised (losses)/gains at the end of the year (39,180) (50,671) 143,226
Notes to the Consolidated Financial Statements (Continued)
7. INVESTMENTS (Continued)
The following table is an analysis of the investment portfolio disclosing cost and fair value balances at fair value movements of the investments.
Details of underlying portfolio funds are presented in the supplementary schedule of investments at the end of these financial statements.
The following table summarizes the valuation of the Group’s investments by the 3 level hierarchies as of 30 June 2010:
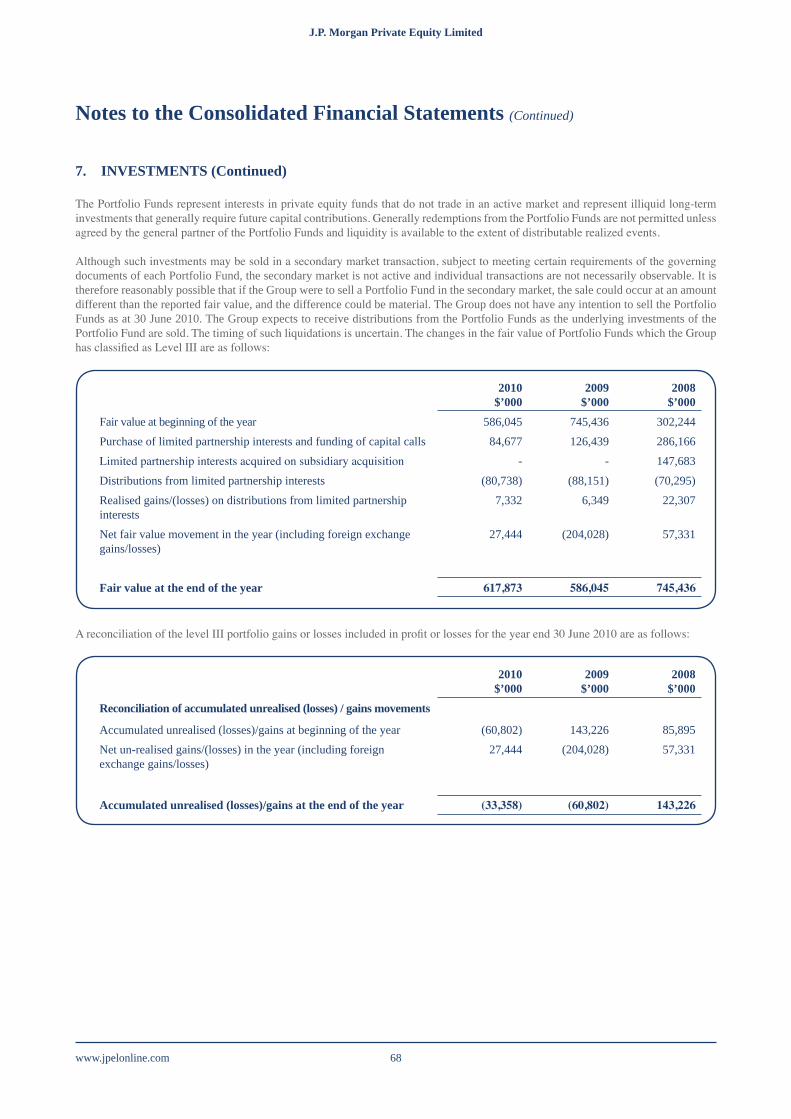
www.jpelonline.com 68
J.P. Morgan Private Equity Limited J.P. Morgan Private Equity Limited
Notes to the Consolidated Financial Statements (Continued)
7. INVESTMENTS (Continued)
The Portfolio Funds represent interests in private equity funds that do not trade in an active market and represent illiquid long-term investments that generally require future capital contributions. Generally redemptions from the Portfolio Funds are not permitted unless agreed by the general partner of the Portfolio Funds and liquidity is available to the extent of distributable realized events.
Although such investments may be sold in a secondary market transaction, subject to meeting certain requirements of the governing documents of each Portfolio Fund, the secondary market is not active and individual transactions are not necessarily observable. It is therefore reasonably possible that if the Group were to sell a Portfolio Fund in the secondary market, the sale could occur at an amount different than the reported fair value, and the difference could be material. The Group does not have any intention to sell the Portfolio Funds as at 30 June 2010. The Group expects to receive distributions from the Portfolio Funds as the underlying investments of the Portfolio Fund are sold. The timing of such liquidations is uncertain. The changes in the fair value of Portfolio Funds which the Group has classified as Level III are as follows:
2010$’000
2009$’000
2008$’000
Fair value at beginning of the year 586,045 745,436 302,244Purchase of limited partnership interests and funding of capital calls 84,677 126,439 286,166Limited partnership interests acquired on subsidiary acquisition - - 147,683Distributions from limited partnership interests (80,738) (88,151) (70,295)Realised gains/(losses) on distributions from limited partnership interests
7,332 6,349 22,307
Net fair value movement in the year (including foreign exchange gains/losses)
27,444 (204,028) 57,331
Fair value at the end of the year 617,873 586,045 745,436
2010$’000
2009$’000
2008$’000
Reconciliation of accumulated unrealised (losses) / gains movements
Accumulated unrealised (losses)/gains at beginning of the year (60,802) 143,226 85,895Net un-realised gains/(losses) in the year (including foreign exchange gains/losses)
27,444 (204,028) 57,331
Accumulated unrealised (losses)/gains at the end of the year (33,358) (60,802) 143,226
A reconciliation of the level III portfolio gains or losses included in profit or losses for the year end 30 June 2010 are as follows:
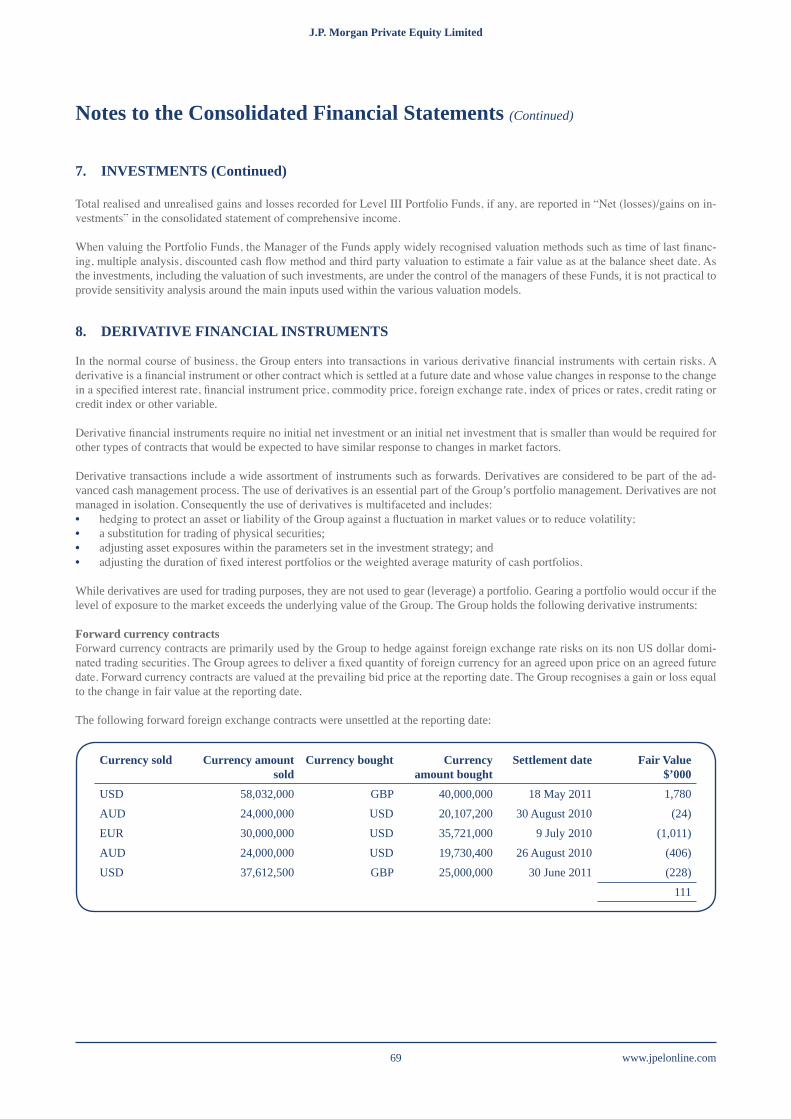
J.P. Morgan Private Equity Limited J.P. Morgan Private Equity Limited
www.jpelonline.com69
Notes to the Consolidated Financial Statements (Continued)
7. INVESTMENTS (Continued)
Total realised and unrealised gains and losses recorded for Level III Portfolio Funds, if any, are reported in “Net (losses)/gains on in-vestments” in the consolidated statement of comprehensive income.
When valuing the Portfolio Funds, the Manager of the Funds apply widely recognised valuation methods such as time of last financ-ing, multiple analysis, discounted cash flow method and third party valuation to estimate a fair value as at the balance sheet date. As the investments, including the valuation of such investments, are under the control of the managers of these Funds, it is not practical to provide sensitivity analysis around the main inputs used within the various valuation models.
8. DERIVATIVE FINANCIAL INSTRUMENTS
In the normal course of business, the Group enters into transactions in various derivative financial instruments with certain risks. A derivative is a financial instrument or other contract which is settled at a future date and whose value changes in response to the change in a specified interest rate, financial instrument price, commodity price, foreign exchange rate, index of prices or rates, credit rating or credit index or other variable.
Derivative financial instruments require no initial net investment or an initial net investment that is smaller than would be required for other types of contracts that would be expected to have similar response to changes in market factors.
Derivative transactions include a wide assortment of instruments such as forwards. Derivatives are considered to be part of the ad-vanced cash management process. The use of derivatives is an essential part of the Group’s portfolio management. Derivatives are not managed in isolation. Consequently the use of derivatives is multifaceted and includes:• hedging to protect an asset or liability of the Group against a fluctuation in market values or to reduce volatility;• a substitution for trading of physical securities;• adjusting asset exposures within the parameters set in the investment strategy; and• adjusting the duration of fixed interest portfolios or the weighted average maturity of cash portfolios.
While derivatives are used for trading purposes, they are not used to gear (leverage) a portfolio. Gearing a portfolio would occur if the level of exposure to the market exceeds the underlying value of the Group. The Group holds the following derivative instruments:
Forward currency contractsForward currency contracts are primarily used by the Group to hedge against foreign exchange rate risks on its non US dollar domi-nated trading securities. The Group agrees to deliver a fixed quantity of foreign currency for an agreed upon price on an agreed future date. Forward currency contracts are valued at the prevailing bid price at the reporting date. The Group recognises a gain or loss equal to the change in fair value at the reporting date. The following forward foreign exchange contracts were unsettled at the reporting date:
Currency sold Currency amount sold
Currency bought Currency amount bought
Settlement date Fair Value$’000
USD 58,032,000 GBP 40,000,000 18 May 2011 1,780AUD 24,000,000 USD 20,107,200 30 August 2010 (24)EUR 30,000,000 USD 35,721,000 9 July 2010 (1,011)AUD 24,000,000 USD 19,730,400 26 August 2010 (406)USD 37,612,500 GBP 25,000,000 30 June 2011 (228)
111
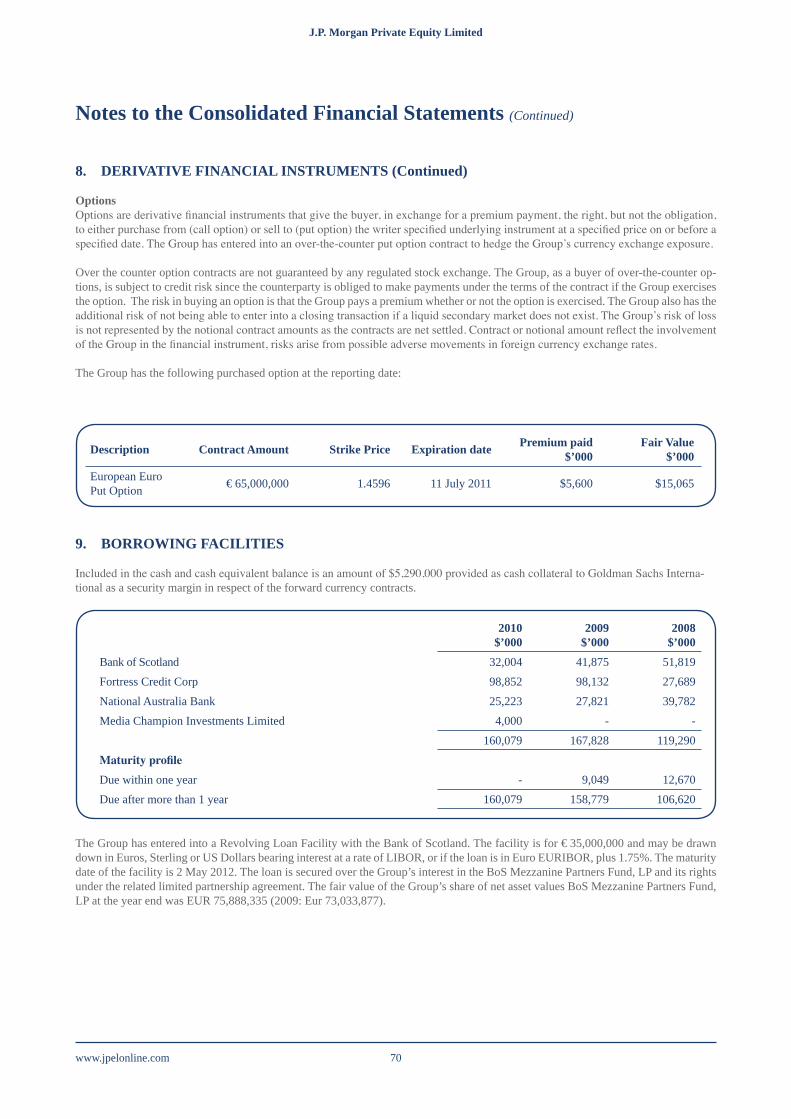
www.jpelonline.com 70
J.P. Morgan Private Equity Limited J.P. Morgan Private Equity Limited
Notes to the Consolidated Financial Statements (Continued)
8. DERIVATIVE FINANCIAL INSTRUMENTS (Continued)
OptionsOptions are derivative financial instruments that give the buyer, in exchange for a premium payment, the right, but not the obligation, to either purchase from (call option) or sell to (put option) the writer specified underlying instrument at a specified price on or before a specified date. The Group has entered into an over-the-counter put option contract to hedge the Group’s currency exchange exposure.
Over the counter option contracts are not guaranteed by any regulated stock exchange. The Group, as a buyer of over-the-counter op-tions, is subject to credit risk since the counterparty is obliged to make payments under the terms of the contract if the Group exercises the option. The risk in buying an option is that the Group pays a premium whether or not the option is exercised. The Group also has the additional risk of not being able to enter into a closing transaction if a liquid secondary market does not exist. The Group’s risk of loss is not represented by the notional contract amounts as the contracts are net settled. Contract or notional amount reflect the involvement of the Group in the financial instrument, risks arise from possible adverse movements in foreign currency exchange rates.
The Group has the following purchased option at the reporting date:
Description Contract Amount Strike Price Expiration date Premium paid$’000
Fair Value$’000
European Euro Put Option €65,000,000 1.4596 11 July 2011 $5,600 $15,065
9. BORROWING FACILITIES
Included in the cash and cash equivalent balance is an amount of $5,290,000 provided as cash collateral to Goldman Sachs Interna-tional as a security margin in respect of the forward currency contracts.
2010$’000
2009$’000
2008$’000
Bank of Scotland 32,004 41,875 51,819Fortress Credit Corp 98,852 98,132 27,689National Australia Bank 25,223 27,821 39,782Media Champion Investments Limited 4,000 - -
160,079 167,828 119,290MaturityprofileDue within one year - 9,049 12,670Due after more than 1 year 160,079 158,779 106,620
The Group has entered into a Revolving Loan Facility with the Bank of Scotland. The facility is for €35,000,000 and may be drawn down in Euros, Sterling or US Dollars bearing interest at a rate of LIBOR, or if the loan is in Euro EURIBOR, plus 1.75%. The maturity date of the facility is 2 May 2012. The loan is secured over the Group’s interest in the BoS Mezzanine Partners Fund, LP and its rights under the related limited partnership agreement. The fair value of the Group’s share of net asset values BoS Mezzanine Partners Fund, LP at the year end was EUR 75,888,335 (2009: Eur 73,033,877).
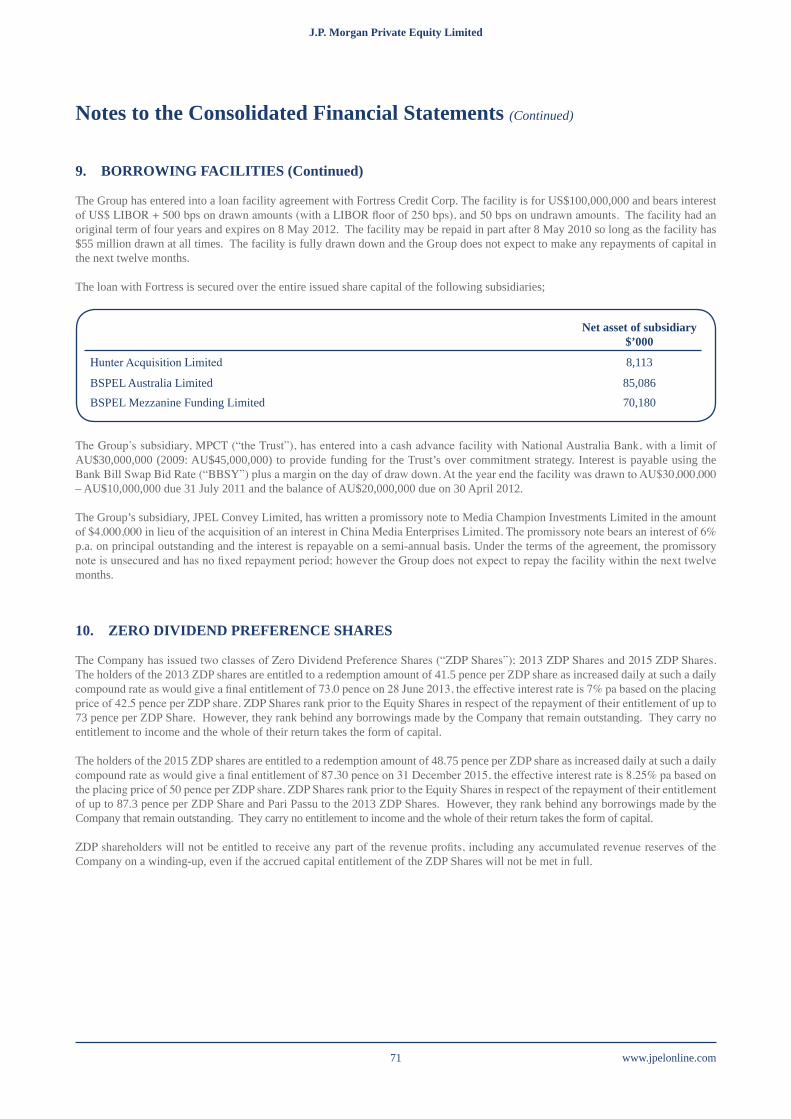
J.P. Morgan Private Equity Limited J.P. Morgan Private Equity Limited
www.jpelonline.com71
Notes to the Consolidated Financial Statements (Continued)
9. BORROWING FACILITIES (Continued)
The Group has entered into a loan facility agreement with Fortress Credit Corp. The facility is for US$100,000,000 and bears interest of US$ LIBOR + 500 bps on drawn amounts (with a LIBOR floor of 250 bps), and 50 bps on undrawn amounts. The facility had an original term of four years and expires on 8 May 2012. The facility may be repaid in part after 8 May 2010 so long as the facility has $55 million drawn at all times. The facility is fully drawn down and the Group does not expect to make any repayments of capital in the next twelve months.
The loan with Fortress is secured over the entire issued share capital of the following subsidiaries;
Net asset of subsidiary$’000
Hunter Acquisition Limited 8,113
BSPEL Australia Limited 85,086BSPEL Mezzanine Funding Limited 70,180
The Group’s subsidiary, MPCT (“the Trust”), has entered into a cash advance facility with National Australia Bank, with a limit of AU$30,000,000 (2009: AU$45,000,000) to provide funding for the Trust’s over commitment strategy. Interest is payable using the Bank Bill Swap Bid Rate (“BBSY”) plus a margin on the day of draw down. At the year end the facility was drawn to AU$30,000,000 – AU$10,000,000 due 31 July 2011 and the balance of AU$20,000,000 due on 30 April 2012.
The Group’s subsidiary, JPEL Convey Limited, has written a promissory note to Media Champion Investments Limited in the amount of $4,000,000 in lieu of the acquisition of an interest in China Media Enterprises Limited. The promissory note bears an interest of 6% p.a. on principal outstanding and the interest is repayable on a semi-annual basis. Under the terms of the agreement, the promissory note is unsecured and has no fixed repayment period; however the Group does not expect to repay the facility within the next twelve months.
10. ZERO DIVIDEND PREFERENCE SHARES
The Company has issued two classes of Zero Dividend Preference Shares (“ZDP Shares”); 2013 ZDP Shares and 2015 ZDP Shares. The holders of the 2013 ZDP shares are entitled to a redemption amount of 41.5 pence per ZDP share as increased daily at such a daily compound rate as would give a final entitlement of 73.0 pence on 28 June 2013, the effective interest rate is 7% pa based on the placing price of 42.5 pence per ZDP share. ZDP Shares rank prior to the Equity Shares in respect of the repayment of their entitlement of up to 73 pence per ZDP Share. However, they rank behind any borrowings made by the Company that remain outstanding. They carry no entitlement to income and the whole of their return takes the form of capital.
The holders of the 2015 ZDP shares are entitled to a redemption amount of 48.75 pence per ZDP share as increased daily at such a daily compound rate as would give a final entitlement of 87.30 pence on 31 December 2015, the effective interest rate is 8.25% pa based on the placing price of 50 pence per ZDP share. ZDP Shares rank prior to the Equity Shares in respect of the repayment of their entitlement of up to 87.3 pence per ZDP Share and Pari Passu to the 2013 ZDP Shares. However, they rank behind any borrowings made by the Company that remain outstanding. They carry no entitlement to income and the whole of their return takes the form of capital.
ZDP shareholders will not be entitled to receive any part of the revenue profits, including any accumulated revenue reserves of the Company on a winding-up, even if the accrued capital entitlement of the ZDP Shares will not be met in full.
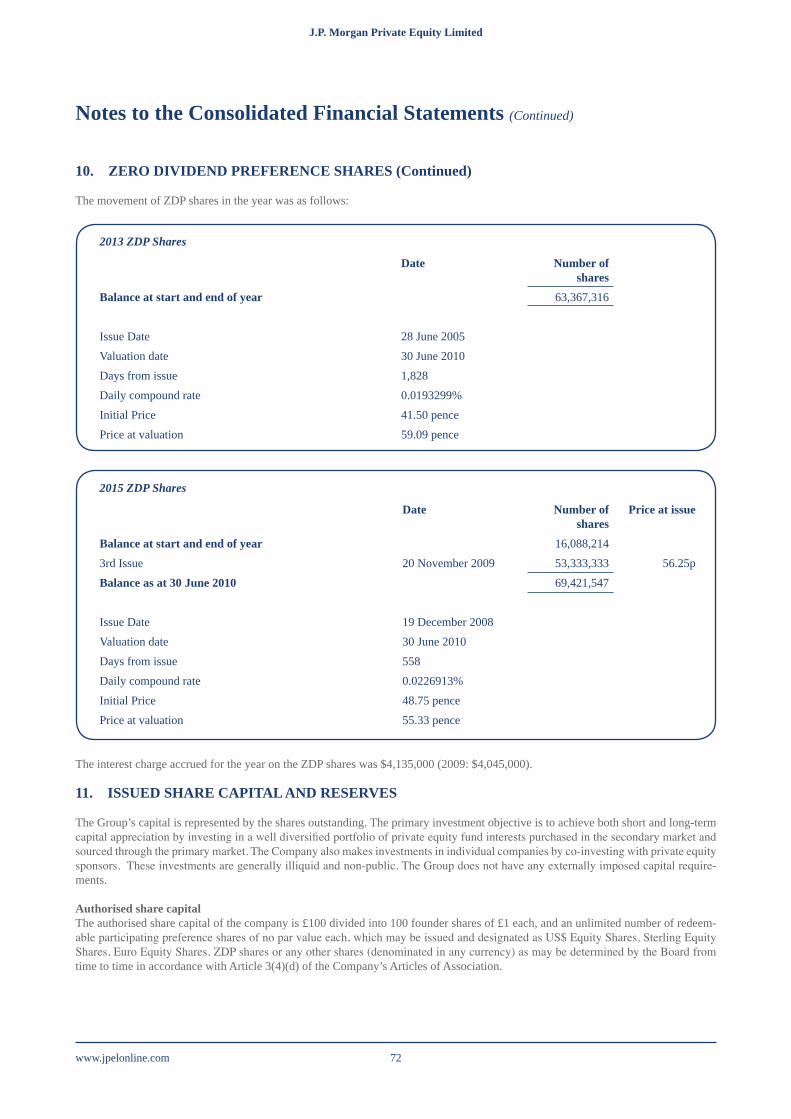
www.jpelonline.com 72
J.P. Morgan Private Equity Limited J.P. Morgan Private Equity Limited
Notes to the Consolidated Financial Statements (Continued)
10. ZERO DIVIDEND PREFERENCE SHARES (Continued)
The movement of ZDP shares in the year was as follows:
2013 ZDP Shares
Date Number of shares
Balance at start and end of year 63,367,316
Issue Date 28 June 2005Valuation date 30 June 2010Days from issue 1,828Daily compound rate 0.0193299%Initial Price 41.50 pencePrice at valuation 59.09 pence
2015 ZDP Shares
Date Number of shares
Price at issue
Balance at start and end of year 16,088,2143rd Issue 20 November 2009 53,333,333 56.25pBalance as at 30 June 2010 69,421,547
Issue Date 19 December 2008Valuation date 30 June 2010Days from issue 558Daily compound rate 0.0226913%Initial Price 48.75 pencePrice at valuation 55.33 pence
11. ISSUED SHARE CAPITAL AND RESERVES
The Group’s capital is represented by the shares outstanding. The primary investment objective is to achieve both short and long-term capital appreciation by investing in a well diversified portfolio of private equity fund interests purchased in the secondary market and sourced through the primary market. The Company also makes investments in individual companies by co-investing with private equity sponsors. These investments are generally illiquid and non-public. The Group does not have any externally imposed capital require-ments.
Authorised share capitalThe authorised share capital of the company is £100 divided into 100 founder shares of £1 each, and an unlimited number of redeem-able participating preference shares of no par value each, which may be issued and designated as US$ Equity Shares, Sterling Equity Shares, Euro Equity Shares, ZDP shares or any other shares (denominated in any currency) as may be determined by the Board from time to time in accordance with Article 3(4)(d) of the Company’s Articles of Association.
The interest charge accrued for the year on the ZDP shares was $4,135,000 (2009: $4,045,000).
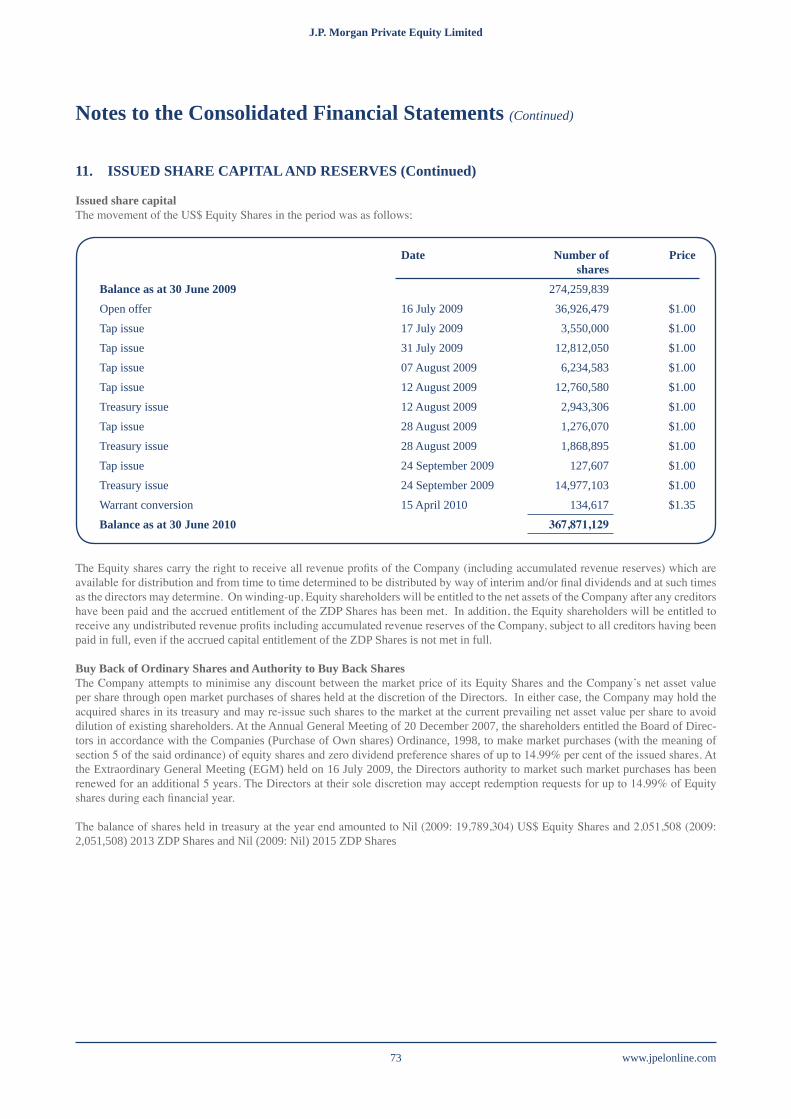
J.P. Morgan Private Equity Limited J.P. Morgan Private Equity Limited
www.jpelonline.com73
Notes to the Consolidated Financial Statements (Continued)
11. ISSUED SHARE CAPITAL AND RESERVES (Continued)
Issued share capitalThe movement of the US$ Equity Shares in the period was as follows;
Date Number of shares
Price
Balance as at 30 June 2009 274,259,839Open offer 16 July 2009 36,926,479 $1.00Tap issue 17 July 2009 3,550,000 $1.00Tap issue 31 July 2009 12,812,050 $1.00Tap issue 07 August 2009 6,234,583 $1.00Tap issue 12 August 2009 12,760,580 $1.00Treasury issue 12 August 2009 2,943,306 $1.00Tap issue 28 August 2009 1,276,070 $1.00Treasury issue 28 August 2009 1,868,895 $1.00Tap issue 24 September 2009 127,607 $1.00Treasury issue 24 September 2009 14,977,103 $1.00Warrant conversion 15 April 2010 134,617 $1.35Balance as at 30 June 2010 367,871,129
The Equity shares carry the right to receive all revenue profits of the Company (including accumulated revenue reserves) which are available for distribution and from time to time determined to be distributed by way of interim and/or final dividends and at such times as the directors may determine. On winding-up, Equity shareholders will be entitled to the net assets of the Company after any creditors have been paid and the accrued entitlement of the ZDP Shares has been met. In addition, the Equity shareholders will be entitled to receive any undistributed revenue profits including accumulated revenue reserves of the Company, subject to all creditors having been paid in full, even if the accrued capital entitlement of the ZDP Shares is not met in full.
Buy Back of Ordinary Shares and Authority to Buy Back SharesThe Company attempts to minimise any discount between the market price of its Equity Shares and the Company’s net asset value per share through open market purchases of shares held at the discretion of the Directors. In either case, the Company may hold the acquired shares in its treasury and may re-issue such shares to the market at the current prevailing net asset value per share to avoid dilution of existing shareholders. At the Annual General Meeting of 20 December 2007, the shareholders entitled the Board of Direc-tors in accordance with the Companies (Purchase of Own shares) Ordinance, 1998, to make market purchases (with the meaning of section 5 of the said ordinance) of equity shares and zero dividend preference shares of up to 14.99% per cent of the issued shares. At the Extraordinary General Meeting (EGM) held on 16 July 2009, the Directors authority to market such market purchases has been renewed for an additional 5 years. The Directors at their sole discretion may accept redemption requests for up to 14.99% of Equity shares during each financial year.
The balance of shares held in treasury at the year end amounted to Nil (2009: 19,789,304) US$ Equity Shares and 2,051,508 (2009: 2,051,508) 2013 ZDP Shares and Nil (2009: Nil) 2015 ZDP Shares
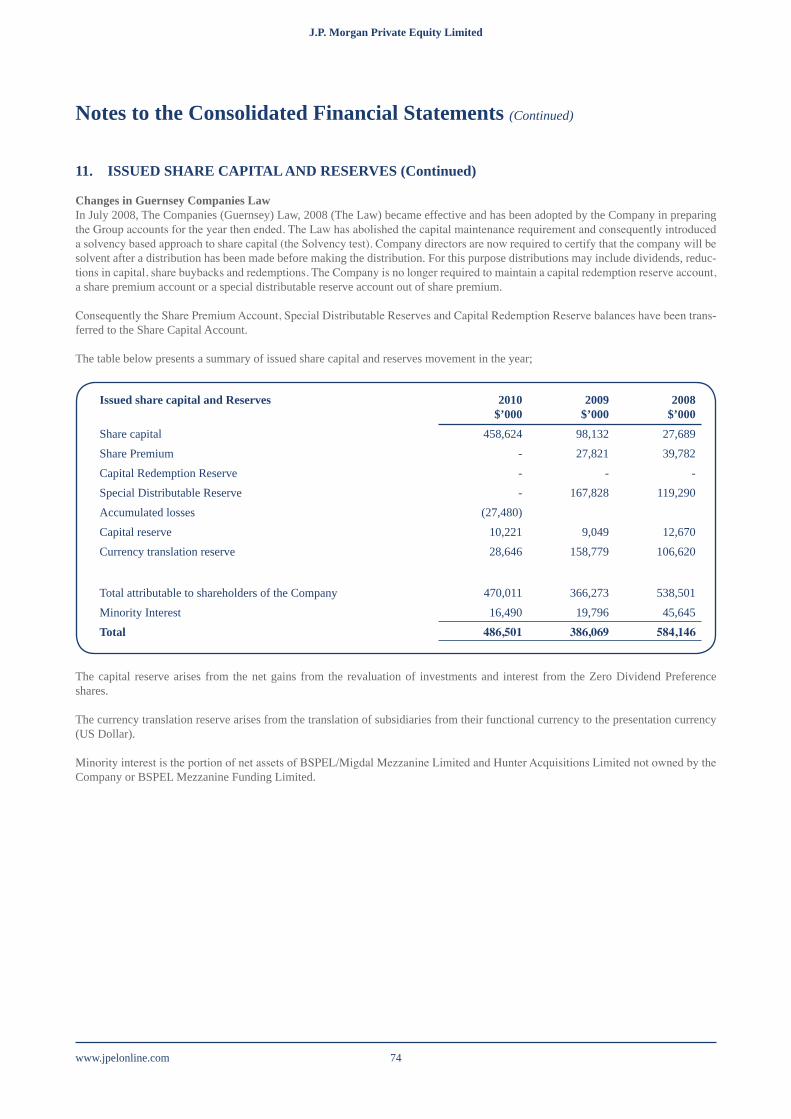
www.jpelonline.com 74
J.P. Morgan Private Equity Limited J.P. Morgan Private Equity Limited
Notes to the Consolidated Financial Statements (Continued)
11. ISSUED SHARE CAPITAL AND RESERVES (Continued)
Changes in Guernsey Companies LawIn July 2008, The Companies (Guernsey) Law, 2008 (The Law) became effective and has been adopted by the Company in preparing the Group accounts for the year then ended. The Law has abolished the capital maintenance requirement and consequently introduced a solvency based approach to share capital (the Solvency test). Company directors are now required to certify that the company will be solvent after a distribution has been made before making the distribution. For this purpose distributions may include dividends, reduc-tions in capital, share buybacks and redemptions. The Company is no longer required to maintain a capital redemption reserve account, a share premium account or a special distributable reserve account out of share premium.
Consequently the Share Premium Account, Special Distributable Reserves and Capital Redemption Reserve balances have been trans-ferred to the Share Capital Account.
The table below presents a summary of issued share capital and reserves movement in the year;
Issued share capital and Reserves 2010$’000
2009$’000
2008$’000
Share capital 458,624 98,132 27,689Share Premium - 27,821 39,782Capital Redemption Reserve - - -Special Distributable Reserve - 167,828 119,290Accumulated losses (27,480)Capital reserve 10,221 9,049 12,670Currency translation reserve 28,646 158,779 106,620
Total attributable to shareholders of the Company 470,011 366,273 538,501Minority Interest 16,490 19,796 45,645Total 486,501 386,069 584,146
The capital reserve arises from the net gains from the revaluation of investments and interest from the Zero Dividend Preference shares.
The currency translation reserve arises from the translation of subsidiaries from their functional currency to the presentation currency (US Dollar).
Minority interest is the portion of net assets of BSPEL/Migdal Mezzanine Limited and Hunter Acquisitions Limited not owned by the Company or BSPEL Mezzanine Funding Limited.
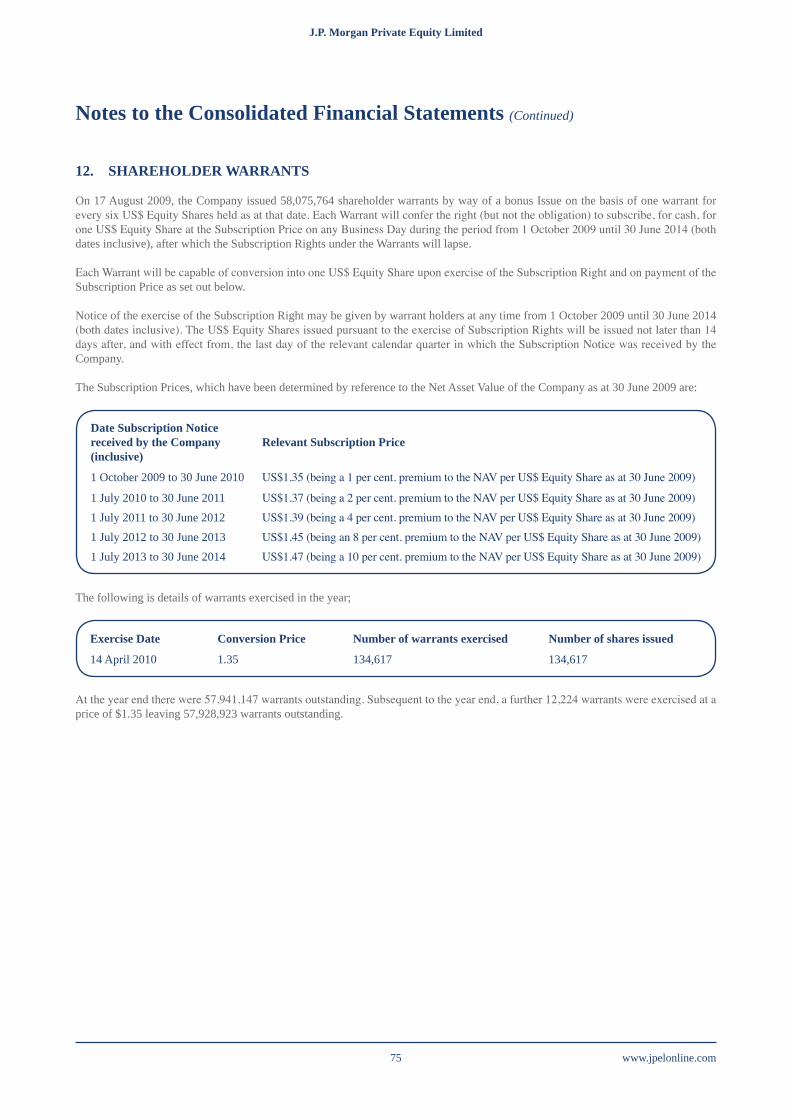
J.P. Morgan Private Equity Limited J.P. Morgan Private Equity Limited
www.jpelonline.com75
Notes to the Consolidated Financial Statements (Continued)
12. SHAREHOLDER WARRANTS
On 17 August 2009, the Company issued 58,075,764 shareholder warrants by way of a bonus Issue on the basis of one warrant for every six US$ Equity Shares held as at that date. Each Warrant will confer the right (but not the obligation) to subscribe, for cash, for one US$ Equity Share at the Subscription Price on any Business Day during the period from 1 October 2009 until 30 June 2014 (both dates inclusive), after which the Subscription Rights under the Warrants will lapse.
Each Warrant will be capable of conversion into one US$ Equity Share upon exercise of the Subscription Right and on payment of the Subscription Price as set out below. Notice of the exercise of the Subscription Right may be given by warrant holders at any time from 1 October 2009 until 30 June 2014 (both dates inclusive). The US$ Equity Shares issued pursuant to the exercise of Subscription Rights will be issued not later than 14 days after, and with effect from, the last day of the relevant calendar quarter in which the Subscription Notice was received by the Company.
The Subscription Prices, which have been determined by reference to the Net Asset Value of the Company as at 30 June 2009 are:
Date Subscription Notice received by the Company (inclusive)
Relevant Subscription Price
1 October 2009 to 30 June 2010 US$1.35 (being a 1 per cent. premium to the NAV per US$ Equity Share as at 30 June 2009)
1 July 2010 to 30 June 2011 US$1.37 (being a 2 per cent. premium to the NAV per US$ Equity Share as at 30 June 2009)1 July 2011 to 30 June 2012 US$1.39 (being a 4 per cent. premium to the NAV per US$ Equity Share as at 30 June 2009)1 July 2012 to 30 June 2013 US$1.45 (being an 8 per cent. premium to the NAV per US$ Equity Share as at 30 June 2009)1 July 2013 to 30 June 2014 US$1.47 (being a 10 per cent. premium to the NAV per US$ Equity Share as at 30 June 2009)
The following is details of warrants exercised in the year;
At the year end there were 57,941,147 warrants outstanding. Subsequent to the year end, a further 12,224 warrants were exercised at a price of $1.35 leaving 57,928,923 warrants outstanding.
Exercise Date Conversion Price Number of warrants exercised Number of shares issued
14 April 2010 1.35 134,617 134,617

www.jpelonline.com 76
J.P. Morgan Private Equity Limited J.P. Morgan Private Equity Limited
Notes to the Consolidated Financial Statements (Continued)
13. MATERIAL AGREEMENTS
The Manager, Bear Stearns Asset Management Inc. (“BSAM Inc.”) is entitled to a base management fee, payable monthly in arrears of 1.0% per annum of the Company’s total assets. The management fee due and payable the end of the year was $6,687,657 (2009: $6,064,260).
The Manager is also entitled to a performance fee if the aggregate Net Asset Value of the Equity Shares and the ZDP Shares at the end of the performance period exceeds (i) the aggregate Net Assets at the start of the performance period by more than 8 per cent and (ii) the highest previously recorded aggregate Net Asset Value of Equity and ZDP shares as at end of performance period of which perfor-mance fee was last paid.
The amount of such performance fee will be 7.5 per cent of the total increase in aggregate Net Asset Value above the performance hurdle. The performance fee paid during the year was $NIL (2009: $NIL).
Following the acquisition of an interest in China Media Enterprises Limited, the Group has entered into a performance agreement with Whale Capital Inc. Whale Capital Inc. is the sponsor of the Company’s investment in China Media Enterprises Limited and is not an affiliate of the Group. Pursuant to the performance agreement, in the event that the internal rate of return of the Group’s investment in China Media Enterprises Limited equals or exceeds 30% per annum, Whale Capital Inc. shall be entitled to a performance fee if the total capital gains exceeds two times of the investment amount. The performance fee shall be an amount equal to 20% of the total capital gain that is in excess of two times of the investment amount. The performance fee accrued during the year was $2,595,000 (2009: $NIL).
Hunter Acquisition Limited paid €500,000 in management fees to the manager of the HGX Private Equity Fund, LP. The manager of HGX Private Equity Fund, LP is not an affiliate of the Group
The Administrator, HSBC Management (Guernsey) Limited, is entitled to an annual fee in respect of administration and company secretarial services calculated on the Total Assets of the Company of 0.125% on the first $100 million, 0.1% on the next $50 million, 0.075% on the next $50 million and 0.05% on the balance subject to a minimum of $125,000. The fee is payable monthly in arrears. The administration fee due and payable at the end of the year was $446,893 (2009: $415,713).
Macquarie Investment Management Limited (“MIML”), the sub-investment manager of MPCT is entitled to a management fee payable quarterly in arrears and is calculated as 1.0% per annum of the Gross Asset Value. Gross value for any quarter means the total value of all the private equity assets of the combined portfolio held by MPCT. The management fee due and payable the end of the year was $1,067,838 (2009: $1,057,716).
MIML is also entitled to a performance fee on the return of MPCT as a single entity. The performance fee is calculated on distribu-tions, and is calculated as follows: Distributions of cash received (before any taxes that may be payable as a result of such distribution) through the disposition of, or dividends, interest or other income from or in respect of, the Combined Portfolio (“Distributions”) will be apportioned between the Manager and the Company in accordance with the following order of priority:
a) first, the Company will be entitled to 100% of the Distributions until the cumulative Distributions equal the Contributed Capital;b) second, the Company will be entitled to 100% of the Distributions until the cumulative Distributions under this clause (b)
are sufficient to provide the Company with an internal rate of return on the Company’s Contributed Capital of 8% per annum, compounded annually (the Preferred Return);
c) third, the Manager will be entitled to 50% of the Distributions until the cumulative Distributions are sufficient to provide the Man-ager in aggregate, by way of performance fee, 3.75% of the cumulative Distributions made pursuant to clause (b) and this clause (c) (“the Catch Up”);
d) fourth, the Company will be entitled to 92.5% of the cumulative Distributions, and the Manager will be entitled to 7.5% of the cumulative Distributions by way of performance fee, after the Distributions in clause (a), (b) and (c) (the Split)
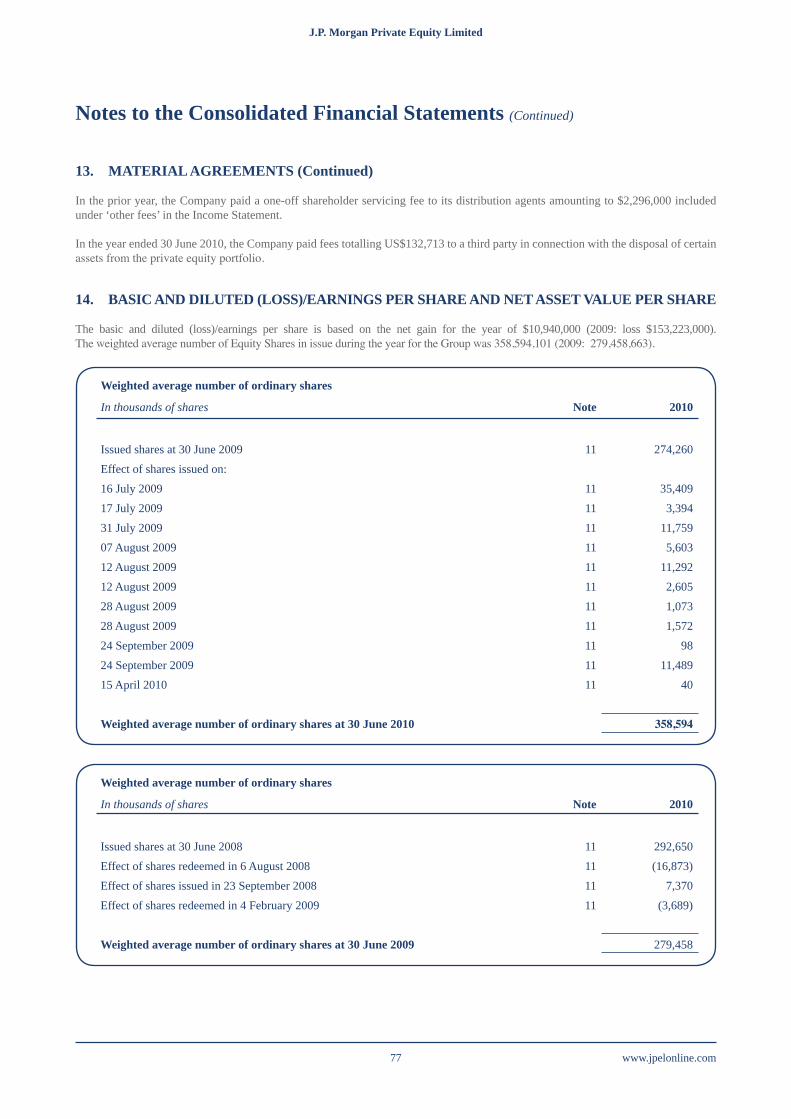
J.P. Morgan Private Equity Limited J.P. Morgan Private Equity Limited
www.jpelonline.com77
Notes to the Consolidated Financial Statements (Continued)
13. MATERIAL AGREEMENTS (Continued)
In the prior year, the Company paid a one-off shareholder servicing fee to its distribution agents amounting to $2,296,000 included under ‘other fees’ in the Income Statement.
In the year ended 30 June 2010, the Company paid fees totalling US$132,713 to a third party in connection with the disposal of certain assets from the private equity portfolio.
14. BASIC AND DILUTED (LOSS)/EARNINGS PER SHARE AND NET ASSET VALUE PER SHARE
The basic and diluted (loss)/earnings per share is based on the net gain for the year of $10,940,000 (2009: loss $153,223,000). The weighted average number of Equity Shares in issue during the year for the Group was 358,594,101 (2009: 279,458,663).
Weighted average number of ordinary shares
In thousands of shares Note 2010
Issued shares at 30 June 2009 11 274,260Effect of shares issued on:16 July 2009 11 35,40917 July 2009 11 3,39431 July 2009 11 11,75907 August 2009 11 5,60312 August 2009 11 11,29212 August 2009 11 2,60528 August 2009 11 1,07328 August 2009 11 1,57224 September 2009 11 9824 September 2009 11 11,48915 April 2010 11 40
Weighted average number of ordinary shares at 30 June 2010 358,594
Weighted average number of ordinary shares
In thousands of shares Note 2010
Issued shares at 30 June 2008 11 292,650Effect of shares redeemed in 6 August 2008 11 (16,873)Effect of shares issued in 23 September 2008 11 7,370Effect of shares redeemed in 4 February 2009 11 (3,689)
Weighted average number of ordinary shares at 30 June 2009 279,458

www.jpelonline.com 78
J.P. Morgan Private Equity Limited J.P. Morgan Private Equity Limited
Notes to the Consolidated Financial Statements (Continued)
14. BASIC AND DILUTED (LOSS)/EARNINGS PER SHARE AND NET ASSET VALUE PER SHARE (Continued)
The Net Asset Value per share is based on the Net Asset Value for the year of $470,011,000 (2009: $366,273,000; 2008: $538,501,000). The total number of Equity Shares in issue during the year for the Group was 367,871,129 (2009:274,259,839; 2008:292,650,909).
15. RELATED PARTY TRANSACTIONS
Mr. Duncan is a senior executive of J.P. Morgan Asset Management (UK) Limited, which has entered into an Advisory and Services agreement with the Group and is a subsidiary of JPMorgan Chase & Co. Mr. Getschow is a senior executive of Bear Stearns Asset Management Inc., the Manager to the Group and a subsidiary of JPMorgan Chase & Co.
Other than Christopher Spencer who owns 30,067 US$ Equity Shares, no other Director holds directly or indirectly shares in the Group.
From 1 January 2007 Mr. Ash is entitled to receive Directors fees of £25,000 per annum, Mr. Loudon and Mr. Spencer are each entitled to receive Directors fees of £20,000 per annum.
During the year further payments were made to each director for additional services provided. Each Director received a total of £20,000 in additional payments during the year. The total remuneration for Mr Ash was £45,000, Mr. Loudon and Mr. Spencer each received a total of £40,000 during the year.
16. POST BALANCE SHEET EVENTS
There have been no significant events between the year end and the date of approval of these accounts which would require a change to or disclosure in the accounts.
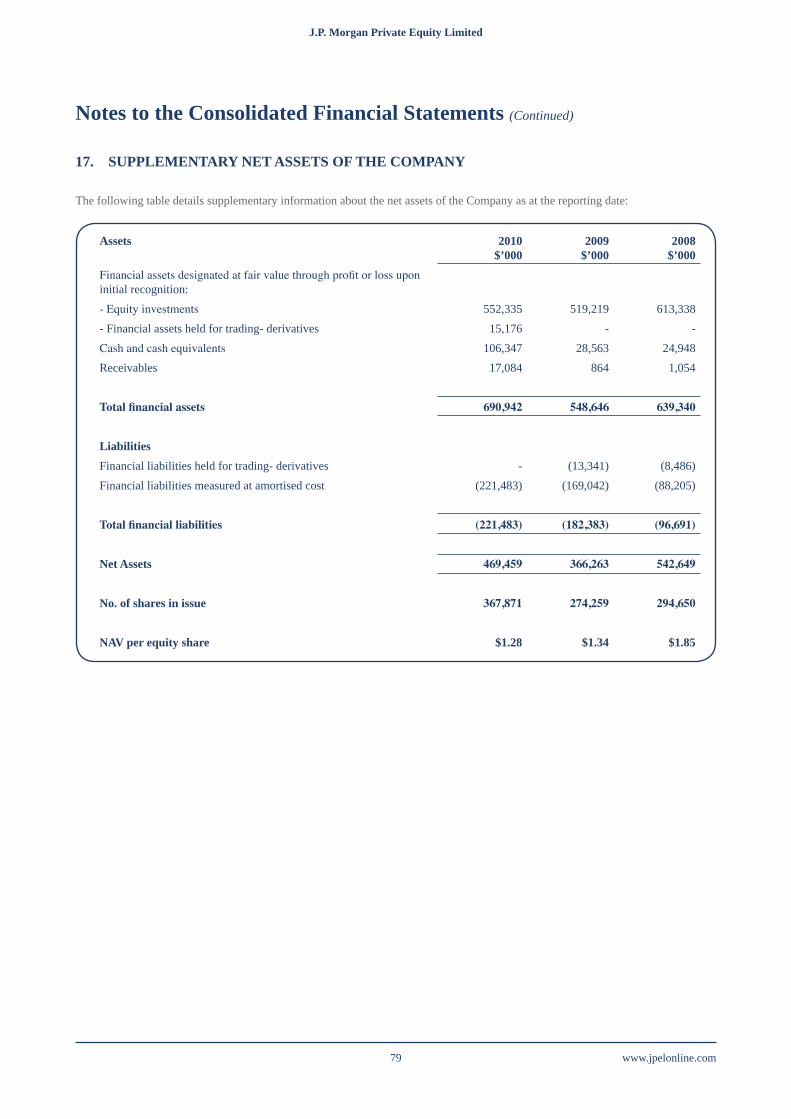
J.P. Morgan Private Equity Limited J.P. Morgan Private Equity Limited
www.jpelonline.com79
Notes to the Consolidated Financial Statements (Continued)
17. SUPPLEMENTARY NET ASSETS OF THE COMPANY
The following table details supplementary information about the net assets of the Company as at the reporting date:
Assets 2010$’000
2009$’000
2008$’000
Financial assets designated at fair value through profit or loss upon initial recognition:- Equity investments 552,335 519,219 613,338- Financial assets held for trading- derivatives 15,176 - -Cash and cash equivalents 106,347 28,563 24,948Receivables 17,084 864 1,054
Totalfinancialassets 690,942 548,646 639,340
LiabilitiesFinancial liabilities held for trading- derivatives - (13,341) (8,486)Financial liabilities measured at amortised cost (221,483) (169,042) (88,205)
Totalfinancialliabilities (221,483) (182,383) (96,691)
Net Assets 469,459 366,263 542,649
No. of shares in issue 367,871 274,259 294,650
NAV per equity share $1.28 $1.34 $1.85
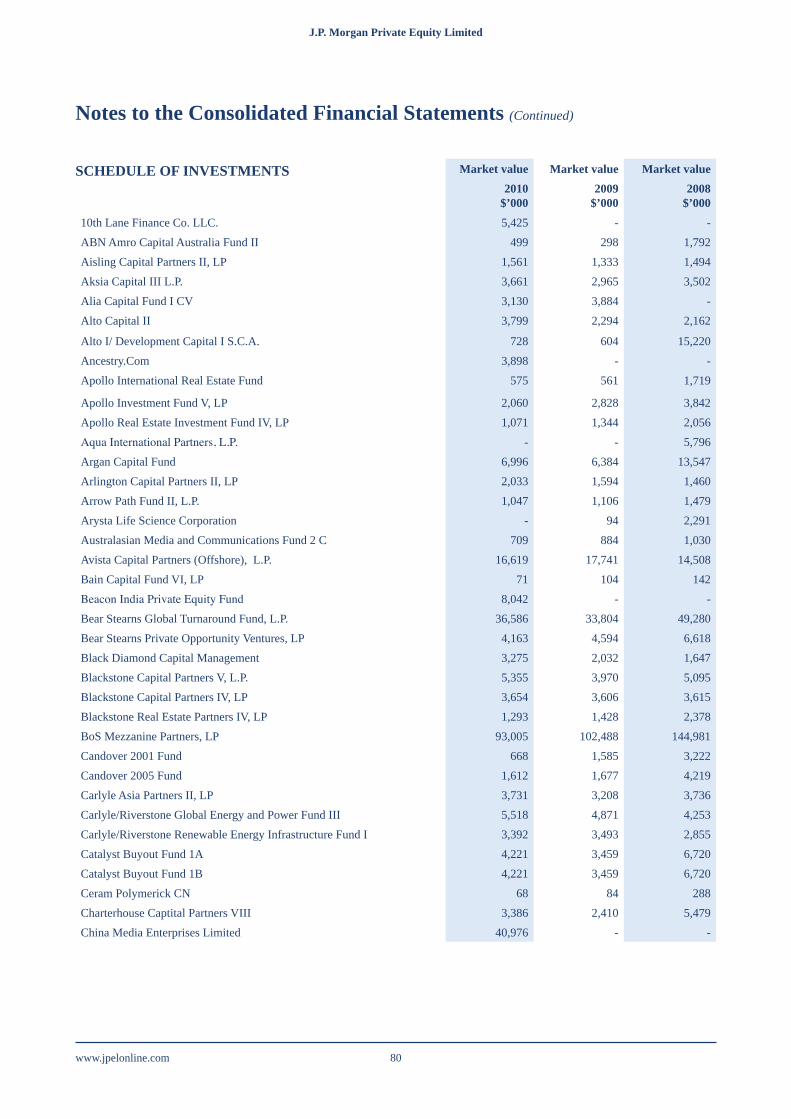
www.jpelonline.com 80
J.P. Morgan Private Equity Limited J.P. Morgan Private Equity Limited
Notes to the Consolidated Financial Statements (Continued)
SCHEDULE OF INVESTMENTS Market value Market value Market value2010
$’0002009
$’0002008
$’00010th Lane Finance Co. LLC. 5,425 - - ABN Amro Capital Australia Fund II 499 298 1,792 Aisling Capital Partners II, LP 1,561 1,333 1,494 Aksia Capital III L.P. 3,661 2,965 3,502 Alia Capital Fund I CV 3,130 3,884 - Alto Capital II 3,799 2,294 2,162
Alto I/ Development Capital I S.C.A. 728 604 15,220 Ancestry.Com 3,898 - - Apollo International Real Estate Fund 575 561 1,719
Apollo Investment Fund V, LP 2,060 2,828 3,842 Apollo Real Estate Investment Fund IV, LP 1,071 1,344 2,056 Aqua International Partners, L.P. - - 5,796 Argan Capital Fund 6,996 6,384 13,547 Arlington Capital Partners II, LP 2,033 1,594 1,460 Arrow Path Fund II, L.P. 1,047 1,106 1,479 Arysta Life Science Corporation - 94 2,291 Australasian Media and Communications Fund 2 C 709 884 1,030 Avista Capital Partners (Offshore), L.P. 16,619 17,741 14,508 Bain Capital Fund VI, LP 71 104 142 Beacon India Private Equity Fund 8,042 - - Bear Stearns Global Turnaround Fund, L.P. 36,586 33,804 49,280 Bear Stearns Private Opportunity Ventures, LP 4,163 4,594 6,618 Black Diamond Capital Management 3,275 2,032 1,647 Blackstone Capital Partners V, L.P. 5,355 3,970 5,095 Blackstone Capital Partners IV, LP 3,654 3,606 3,615 Blackstone Real Estate Partners IV, LP 1,293 1,428 2,378 BoS Mezzanine Partners, LP 93,005 102,488 144,981 Candover 2001 Fund 668 1,585 3,222 Candover 2005 Fund 1,612 1,677 4,219 Carlyle Asia Partners II, LP 3,731 3,208 3,736 Carlyle/Riverstone Global Energy and Power Fund III 5,518 4,871 4,253Carlyle/Riverstone Renewable Energy Infrastructure Fund I 3,392 3,493 2,855Catalyst Buyout Fund 1A 4,221 3,459 6,720Catalyst Buyout Fund 1B 4,221 3,459 6,720Ceram Polymerick CN 68 84 288Charterhouse Captital Partners VIII 3,386 2,410 5,479China Media Enterprises Limited 40,976 - -
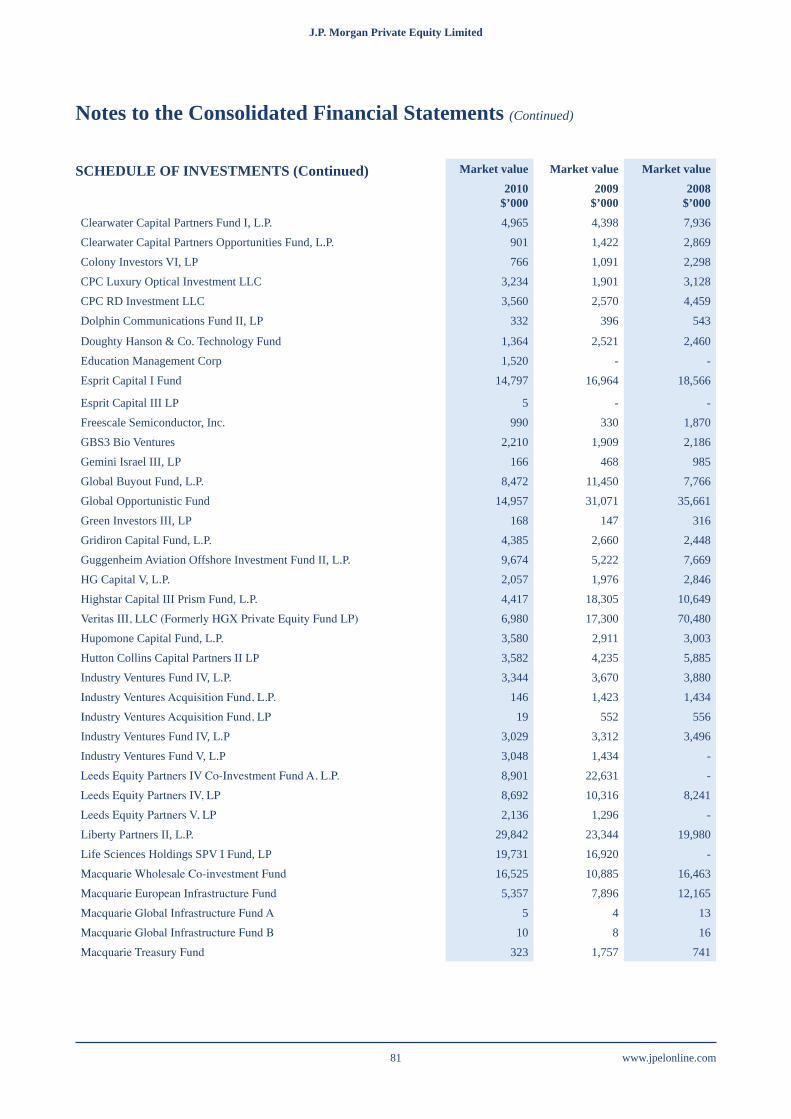
J.P. Morgan Private Equity Limited J.P. Morgan Private Equity Limited
www.jpelonline.com81
Market value Market value Market value2010
$’0002009
$’0002008
$’000Clearwater Capital Partners Fund I, L.P. 4,965 4,398 7,936Clearwater Capital Partners Opportunities Fund, L.P. 901 1,422 2,869Colony Investors VI, LP 766 1,091 2,298CPC Luxury Optical Investment LLC 3,234 1,901 3,128CPC RD Investment LLC 3,560 2,570 4,459Dolphin Communications Fund II, LP 332 396 543
Doughty Hanson & Co. Technology Fund 1,364 2,521 2,460Education Management Corp 1,520 - -Esprit Capital I Fund 14,797 16,964 18,566
Esprit Capital III LP 5 - -Freescale Semiconductor, Inc. 990 330 1,870GBS3 Bio Ventures 2,210 1,909 2,186Gemini Israel III, LP 166 468 985Global Buyout Fund, L.P. 8,472 11,450 7,766Global Opportunistic Fund 14,957 31,071 35,661Green Investors III, LP 168 147 316Gridiron Capital Fund, L.P. 4,385 2,660 2,448Guggenheim Aviation Offshore Investment Fund II, L.P. 9,674 5,222 7,669HG Capital V, L.P. 2,057 1,976 2,846Highstar Capital III Prism Fund, L.P. 4,417 18,305 10,649 Veritas III, LLC (Formerly HGX Private Equity Fund LP) 6,980 17,300 70,480Hupomone Capital Fund, L.P. 3,580 2,911 3,003Hutton Collins Capital Partners II LP 3,582 4,235 5,885Industry Ventures Fund IV, L.P. 3,344 3,670 3,880Industry Ventures Acquisition Fund, L.P. 146 1,423 1,434Industry Ventures Acquisition Fund, LP 19 552 556Industry Ventures Fund IV, L.P 3,029 3,312 3,496Industry Ventures Fund V, L.P 3,048 1,434 -Leeds Equity Partners IV Co-Investment Fund A, L.P. 8,901 22,631 -Leeds Equity Partners IV, LP 8,692 10,316 8,241Leeds Equity Partners V, LP 2,136 1,296 -Liberty Partners II, L.P. 29,842 23,344 19,980Life Sciences Holdings SPV I Fund, LP 19,731 16,920 -Macquarie Wholesale Co-investment Fund 16,525 10,885 16,463Macquarie European Infrastructure Fund 5,357 7,896 12,165Macquarie Global Infrastructure Fund A 5 4 13Macquarie Global Infrastructure Fund B 10 8 16Macquarie Treasury Fund 323 1,757 741
Notes to the Consolidated Financial Statements (Continued)
SCHEDULE OF INVESTMENTS (Continued)
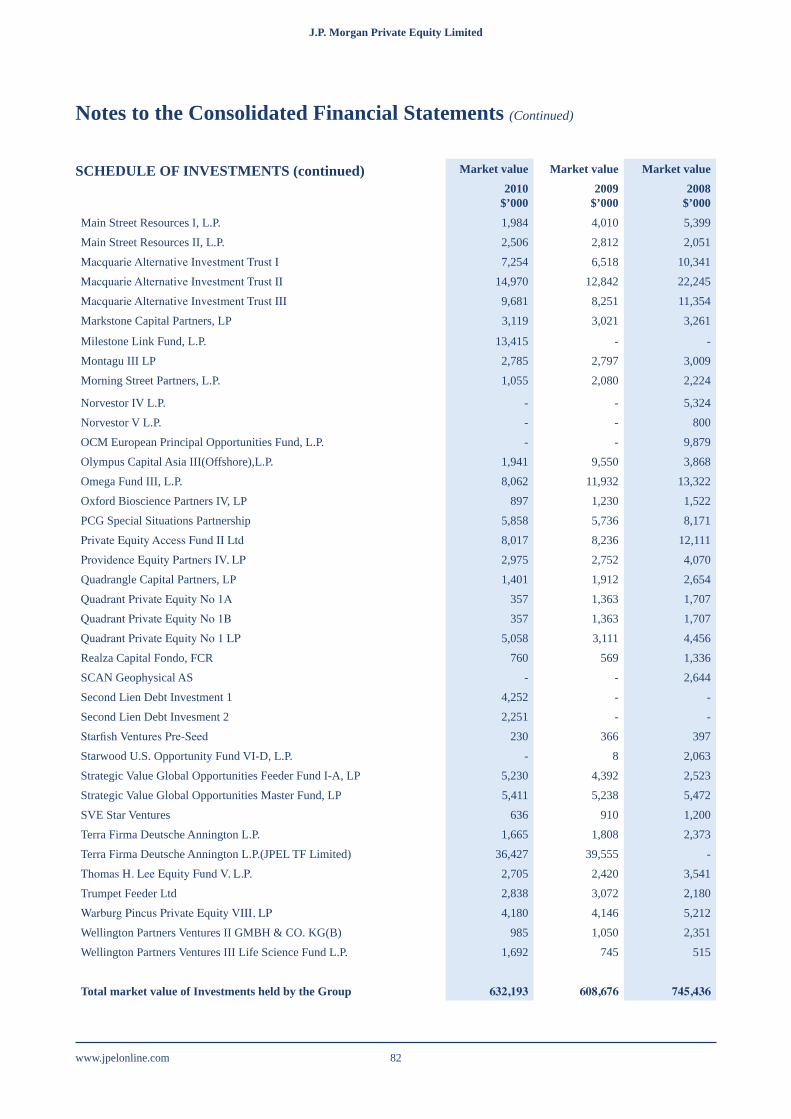
www.jpelonline.com 82
J.P. Morgan Private Equity Limited J.P. Morgan Private Equity Limited
Notes to the Consolidated Financial Statements (Continued)
SCHEDULE OF INVESTMENTS (continued) Market value Market value Market value2010
$’0002009
$’0002008
$’000Main Street Resources I, L.P. 1,984 4,010 5,399Main Street Resources II, L.P. 2,506 2,812 2,051Macquarie Alternative Investment Trust I 7,254 6,518 10,341Macquarie Alternative Investment Trust II 14,970 12,842 22,245Macquarie Alternative Investment Trust III 9,681 8,251 11,354Markstone Capital Partners, LP 3,119 3,021 3,261
Milestone Link Fund, L.P. 13,415 - -Montagu III LP 2,785 2,797 3,009Morning Street Partners, L.P. 1,055 2,080 2,224
Norvestor IV L.P. - - 5,324Norvestor V L.P. - - 800OCM European Principal Opportunities Fund, L.P. - - 9,879Olympus Capital Asia III(Offshore),L.P. 1,941 9,550 3,868Omega Fund III, L.P. 8,062 11,932 13,322Oxford Bioscience Partners IV, LP 897 1,230 1,522PCG Special Situations Partnership 5,858 5,736 8,171Private Equity Access Fund II Ltd 8,017 8,236 12,111Providence Equity Partners IV, LP 2,975 2,752 4,070Quadrangle Capital Partners, LP 1,401 1,912 2,654Quadrant Private Equity No 1A 357 1,363 1,707Quadrant Private Equity No 1B 357 1,363 1,707Quadrant Private Equity No 1 LP 5,058 3,111 4,456Realza Capital Fondo, FCR 760 569 1,336SCAN Geophysical AS - - 2,644Second Lien Debt Investment 1 4,252 - -Second Lien Debt Invesment 2 2,251 - -Starfish Ventures Pre-Seed 230 366 397Starwood U.S. Opportunity Fund VI-D, L.P. - 8 2,063Strategic Value Global Opportunities Feeder Fund I-A, LP 5,230 4,392 2,523Strategic Value Global Opportunities Master Fund, LP 5,411 5,238 5,472SVE Star Ventures 636 910 1,200Terra Firma Deutsche Annington L.P. 1,665 1,808 2,373Terra Firma Deutsche Annington L.P.(JPEL TF Limited) 36,427 39,555 -Thomas H. Lee Equity Fund V, L.P. 2,705 2,420 3,541Trumpet Feeder Ltd 2,838 3,072 2,180Warburg Pincus Private Equity VIII, LP 4,180 4,146 5,212Wellington Partners Ventures II GMBH & CO. KG(B) 985 1,050 2,351Wellington Partners Ventures III Life Science Fund L.P. 1,692 745 515
Total market value of Investments held by the Group 632,193 608,676 745,436

J.P. Morgan Private Equity Limited J.P. Morgan Private Equity Limited
www.jpelonline.com83
J.P. Morgan Private Equity Limited
DIRECTORS:
MANAGER(as to the Private Equity Portfolio):
ADMINISTRATOR AND COMPANY SECRETARY:
AUDITOR:
SOLICITORS TO THE GROUP(as to English and US law):
LEGAL ADVISERS TO THE GROUP(as to Guernsey Law):
REGISTRAR:
REGISTERED OFFICE:
Trevor Charles Ash (Chairman)Gregory GetschowJohn LoudonChristopher Paul Spencer
BEAR STEARNS ASSET MANAGEMENT INC.c/o J.P. Morgan Asset Management270 Park AvenueNew YorkNew York 10017United States of America
HSBC MANAGEMENT (GUERNSEY) LIMITEDArnold House St Julian’s AvenueSt Peter Port Guernsey GY1 3NF
KPMG Channel Islands Limited20 New StreetSt Peter PortGuernsey GY1 4AN
HERBERT SMITH LLPExchange HousePrimrose StreetLondon EC2A2HSUnited Kingdom
CAREY OLSEN7 New StreetSt Peter PortGuernsey GY1 4BZ
CAPITA IRG (CI) LIMITED2nd Floor1 Le TruchotSt Peter PortGuernsey GY1 4AE
Arnold House St Julian’s AvenueSt Peter Port Guernsey GY1 3NF


J.P. Morgan Private Equity LimitedArnold HouseSt Julian’s AvenueSt Peter PortGuernsey GY1 3NF