Embed Size (px)
Citation preview
NASA Contractor Report 187168
AIAA-91-2341
Numerical Simulation of Self-FieldMPD Thrusters
(NASA-CR-l<_7168) NUMFRICAL SIMULATION OF
SFLF-FI_L_ MPD TNRUSTCES _inal Report
(Sw_rdrup T_chnology) 37 p CSCL IZA
03/64
N01-29832
Uncles
0036900
Michael R. LaPointe
Sverdrup Technology, Inc.
Lewis Research Center Group
Brook Park, Ohio
August 1991
Prepared for
Lewis Research Center
Under Contract NAS3-25266
IXl/ ANational Aeronautics andSpace Administration
https://ntrs.nasa.gov/search.jsp?R=19910020518 2018-06-27T16:22:20+00:00Z


Numerical Simulation of Self-Field MPD Thrusters
Michael R. LaPointe
Sverdrup Technology, Inc.Lewis Research Center Group
Brook Park, Ohio 44142
Abstract
A fully two dimensional magnetohydrodyanamics code has been developed to predict self-field, steady-state
MPD thruster performance. The governing equations are outlined, and methods of solution are presented.
/vIodel predictions are compared with experimental data for two thruster geometries over a range of discharge
currents and mass flow rates. Model limitations are evaluated, and issues concerning quasi-steady versus
steady-state thruster comparisons are discussed.
Nomenclature
an finite difference coeffs.
b thrust coefficient (N/A 2)
/_ magnetic field (T)
e electric charge (C)
J_ electric field (V/m)
F thrust (N),'2
3 current density (A/m 2)
J discharge current (A)
kB Boltzmann const. (J/K)
m electron mass (kg)
M ion mass (kg)
rh mass flow rate (kg/s)
n number density (m -3)
p pressure (Pa)P power (W)
r= anode radius (m)
rc cathode radius (m)
R gas constant (J/K-mol)RM magnetic Reynolds number
mass flow ratio
S source term
T temperature (K)velocity (m/s)
v_= exhaust velocity (m/s)
V discharge voltage (V)
weighting factor
a ionization fraction (- 1)cq_ finite difference coeffs.
7,_ differential equation coeffs.
F_ differential equation coeffs.
77 viscosity (kg/m-s)
r/T thruster efficiency
rll ! frozen flow efficiencyrcr thermal conductivity (Watt/m-K)
A second coeff,of viscosity(kg/m-s)
Inh Coulomb logarithm
P-o permeability of free spacedensity function
p mass density (kg/m 3)
_r electrical conductivity (mho/m)
rc electron collision time (s)
¢ electric potential (V)@v viscous dissipation function
¢ magnetic field streamlineviscous force vector
w convergence factorwcc electron cyclotron frequency (s -t)
fl Hall parameter
I. Introduction
The magnetoplasmadynamic (MPD) thruster is an attractive candidate for orbit raising applications 1 as
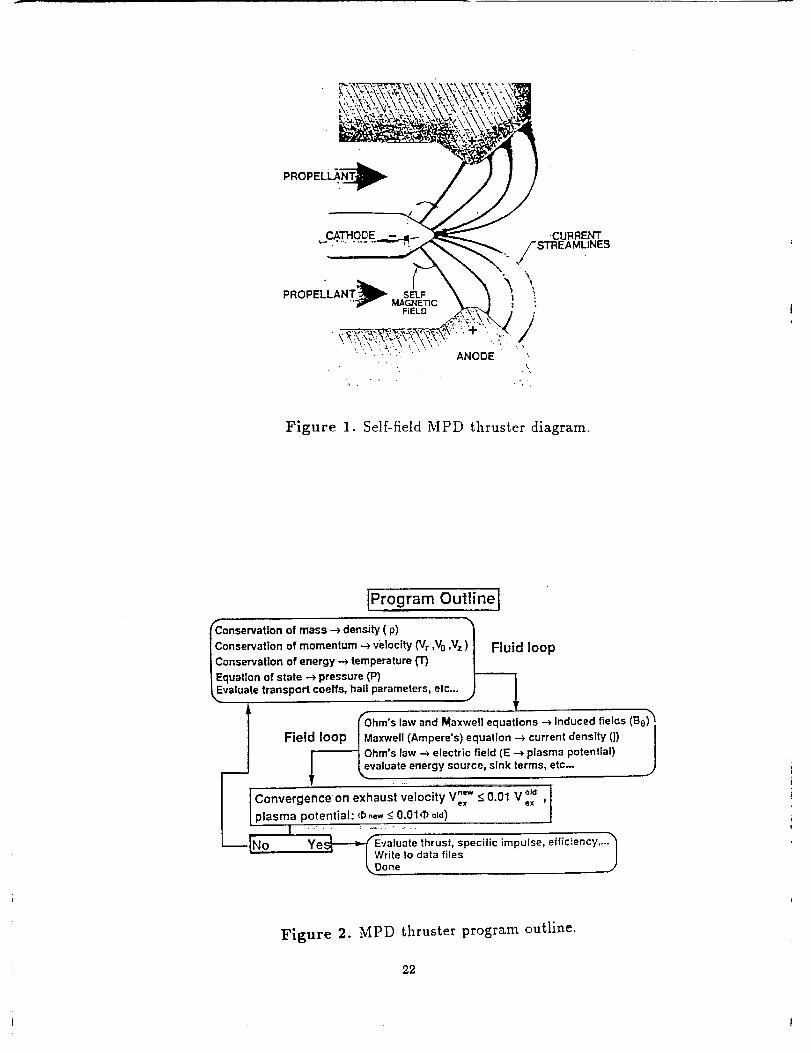
well as the high power, long duration missions envisioned by the national Space Exploration Initlative 2. Inits basic form, the MPD thruster consists of a cylindrical cathode surrounded by a concentric anode (Figure
1). An arc struck between the electrodes ionizes a gaseous propellant, and the interaction of the currentwith self-induced magnetic fields accelerates the plasma to produce thrust. Steady-state MPD thrusters have
been operated at power levels approaching 600 kW, while pulsed, quasi-steady devices have operated in the
megawatt range 3. The engine is robust, and designed to provide low, continuous thrust at specific impulsevalues between 1,000 and 10,000 s.
MPD thruster performance is currently limited by low thrust efficiency in the operating regimes of interest 3.
Applied magnetic fields 3'4 and flared electrodes s have been shown to influence MPD thruster efficiencyand specific impulse, but for reasons poorly understood at present. In addition, severe electrode erosion is
observed at high values of J2/rh, corresponding to the onset of voltage oscillations and unsteady thruster
operation. Several mechanisms have been proposed to explain the onset of oscillations, including anode mass
Starvation 6, flow choking due to enhanced back-EMF 7`s, and the triggering of electrothermal and gradient
instabilities as the plasma approaches full ionization 9-11. Different operating conditions may trigger one or
a combination of the proposed mechanisms, limiting thruster performance and lifetime.
Although MPD thrusters have undergone extensive experimental development since the early 1960's 3'1_, a
comprehensive theoretical analysis has been slowed by the complex nature of the coupled electromagnetic and
gasdynamic acceleration processes. Transient and steady-state numerical modeling using !-D, quasi-l-D, and
quasi-2-D approximations of the fluid magnetohydrodynamic equations have provided valuable insights intoself-field MPD thruster operation 13-_v, but they are by definition constrained in their ability to predict global
thruster performance. The removal of such limitations via fully 2-D and quasl-3-D modeling has recently
become practical with the emergence of high speed computational facilities, allowing model validation and
refinement using the existing experimental data base while in return establishing a theoretical basis to guide
further experimentation- - ............
A fully two dimensional, time dependent code for modeling self-field coaxial MPD thrusters is currentlyunder development at the University of Stuttgart 2s-a°. The model employs adaptive grid techniques for
enhanced spatial resolution near electrode surfaces and incorporates important second order effects such
as Hall currents, viscosity, and thermal conductivity. The plasma is assumed to be a fully ionized single
fluid, but separate electron and ion temperatures are calculated to provide more accurate estimates of the
thermal transport coefficients. The equations are cast into conservative finite volume form and iterated until
a steady state condition is reached. Results compare favorably with experimental tests of the Stuttgart ZT-1and ZT-2 cylindrical thrusters at low values of Jz/rh. However, the code and has not been fully tested at
values of JZ/rh which correspond to predominantly electromagnetic regimes of thruster operation 31. Because
the code is being developed specifically to support the Stuttgart self-field plasma accelerator activities, no
provision has been included for applied magnetic field effects 3_.
Applied magnetic field effects are included in a-cylindrical steady-state thruster code developed by Tanaka
and Kimura 33. The electromagnetic field equations are fully two dimensional, assuming axial symmetry forboth the current distribution and the imposed applied magnetic field. The equations describing the plasma
flow are based on a single-fluid, quasi-l-D approximation, however, and viscous effects are neglected. Inaddition, the Hall parameter and electrical conductivity are assumed constant throughout the simulation
region. The equations were written in a finite element formulation, and a Newton-Raphson iterative schemewas used to solve for the induced magnetic fields and current densities. Runge-Kutta algorithms were used to
evaluate the one dimensional flow equations, and the entire process was repeated until the induced magnetic
field and the plasma flow velocity coincided with their previous loop values. Calculations were performed at
dischargecurrents of 1000 A and 2000 A with a constant mass flow rate of 100 mg/s and applied magnetic
field values up to 0.2 T. Although not compared with specific experimental results, the model predicted
trends which had been observed experimentally 33.
A model which incorporates both self-field and applied magnetic field effects is currently being developed
at the NASA Lewis Research Center to support a wide range of experimental MPD thruster activities. The
fully 2-D steady-state code is based on the single fluid, single temperature MHD equations 34, which assume
axially symmetry but include azimuthal components of momentum, current density, and magnetic field.
Viscous effects and Hall terms are included, as are non-constant expressions for the electrical conductivity
and thermal conductivity. The plasma is currently assumed to be a fully (singly) ionized perfect gas. The
governing MHD equations are written in finite difference formulation and iteratively solved on a uniform
rectangular grid. The code is built using modular subroutines to allow for model expansion and refinement
with minimal algorithm reconstruction.
The self-field version of the NASA LeRC code is operational, and is discussed in Section II. Applied magnetic
field terms, which do not contribute to self-field thruster operation, are retained in the derivative equations
for completeness. Experimental comparisons with a coaxial, steady-state thruster and a flared, quasi-steadythruster are presented in Section III, and the paper concludes with a brief summary of results in Section IV.
II. MPD Thruster Model
The MPD thruster model presented below is based upon a single fluid, single temperature approxima-
tion of the steady-state magnetohydrodynamic (MHD) equations, written in cylindrical coordinates with
assumed symmetry about the centerline. Azimuthal components are retained, rendering the code fully two-
dimensional. The plasma is currently assumed to be fully, singly ionized, and is described by a perfect gas
equation of state.
The fluid description is appropriate for the density and temperature regimes of interest in MPD thrusteroperation 3s, although such a formulation precludes a detailed evaluation of electrode fall potentials, and
does not allow for potentially important kinetic effects such as plasma microinstabilities 36. These limitations
can be overcome by incorporating an electrode sheath model to provide boundary conditions for the fluid
code (which in turn provides boundary conditions for the sheath model), and by enveloping the effects ofmicroturbulence within modified expressions for the plasma transport coefficients. It is anticipated that such
refinements will be included as appropriate models become available.
The steady-state model is adequate for describing thruster behavior in regimes other than the brief transient
start-up period or the onset of plasma oscillations associated with thruster instabilities. The startup period
is, with proper design, a negligible fraction of the thruster lifetime and may be safely ignored in evaluating
steady-state thruster performance. To properly model the onset of thruster instabilities as they evolve fromsteady-state operation would require a time-dependent plasma kinetics model and significant computational
resources. An alternate and efficient near-term method is to develop separate models which predict regimes of
operation under which such instabilities might occur, and incorporate those predictions as limiting conditions
in the fluid code. MHD codes in turn can provide information on plasma conditions preceding the onset of
thruster instability, as starting conditions for the instability models. While no single code can hope to modelevery effect, a proper combination of models can provide the understanding necessary for successful MPD
thruster development.
With this brief introduction, the equations incorporated into the self-field MPD thruster model are presentedbelow.
IIa. Electromagnetic Field Equations.
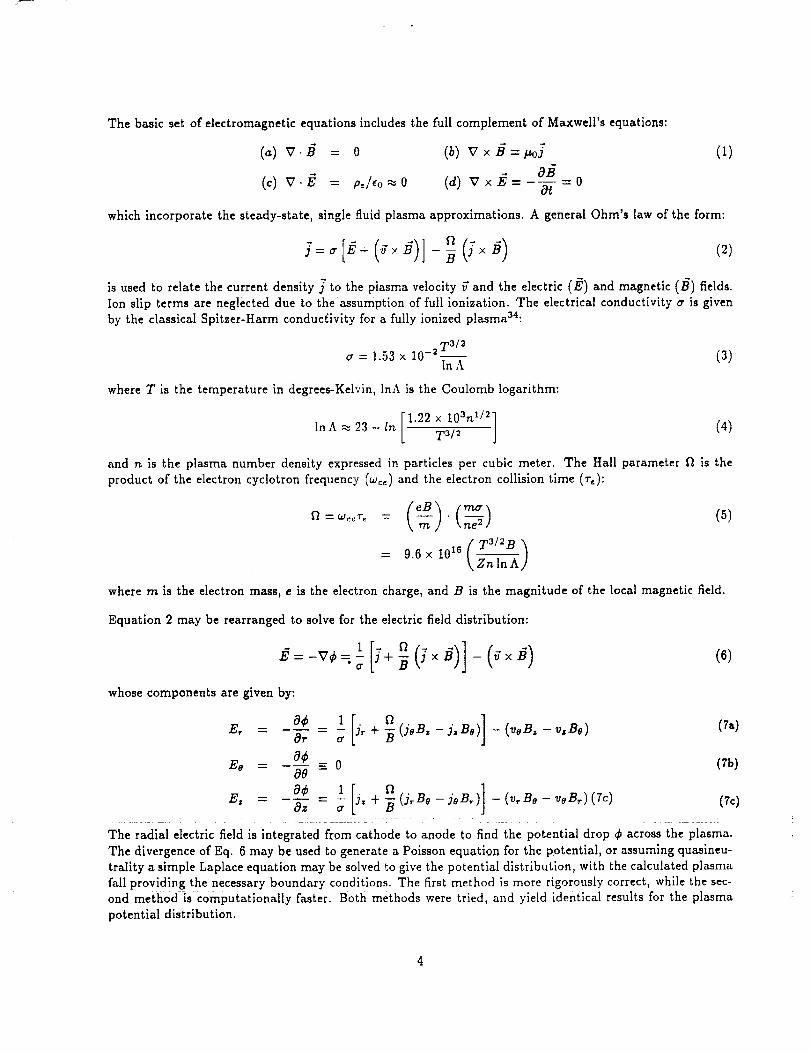
The basic set of electromagnetic equations includes the full complement of Maxwell's equations:
(_) v.¢ = 0 @)v×g=_,o]
- Ot
(1)
which incorporate the steady-state, single fluid plasma approximations. A general Ohm's law of the form:
is used to relate the current density j to the plasma velocity 0"and the electric (E) and magnetic (B) fields.
Ion slip terms are neglected due to the assumption of full ionization. The electrical conductivity a is givenby the classical Spitzer-Harm conduct!ivlty for a fully ionized plasma_4:
a = 1.53 x 10 -2T_/2 (3)InA
where T is the temperature in degrees-Kelvln, lnA is the Coulomb logarithm:
lnA._ 23_ ln [ 1.22 × 10³nl/2]T3/2 (4)
and ll is the plasma number density expressed in particles per cubic meter. The Hall parameter fl is the
product of the electron cyclotron frequency (w_,) and the electron collision time (r,):
+= 9.6 x 10¹⁶ ( T3/2B
t,z--ZiT_X/
where rn is the electron mass, e is the electron charge, and B is the magnitude of the local magnetic field.
Equation 2 may be rearranged to solve for the electric field distribution:
)]( <o/whose components are given by:
a+ ,[j,+o ]E, -- Or _ -_ (joB, - j=Bo) - (roB= - v=Bo) (Ta)
Eo - 0¢ = 0 (Tb)08
--[° ]0¢ 1 j= + (j, Bo - joB_) - (v_Bo - roB,) (7c) (7c)E, - Oz - _ -B
The radial electric field is integrated from cathode to anode to find the potential drop ¢ across the plasma.
The divergence of Eq. 6 may be used to generate a Poisson equation for the potential, or assuming quasineu-
trality a simple Laplace equation may be solved to give the potential distribution, with the calculated plasma
fall providing the necessary boundary conditions. The first method is more rigorously correct, while the sec-
ond method is computationally faster. Both methods were tried, and yield identical results for the plasma
potential distribution.
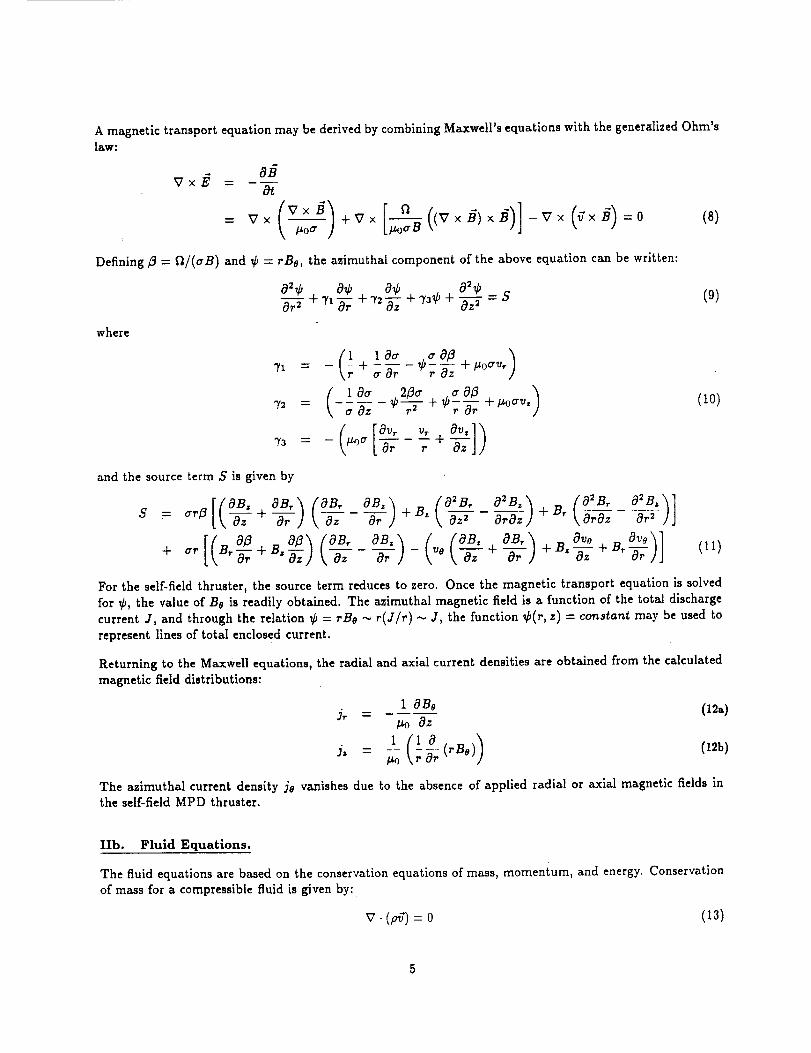
A magnetic transportequation may be derivedby combining Maxwell's equationswith the generalizedOhm's
law:
vx_
(8)
Defining/3 = fl/(aB) and ¢ = rBe, the azimuthal component of the above equation can be written:
02¢ 0¢ 0¢ 02¢Or---T +71_r + 72_-7_ +73¢ + _ = S
(9)
where
( 1 0a 2/3cr ¢c. c3_3 )72 = a Oz _--_-i- + r Or + poaV,
7s = - \lzo_ [ Or r + Oz J )
(zo)
and the source term S isgiven by
[foB. oB, s = _,#t\-_g +-_-,] k a,
+ err B'-_r +B'_z \_z
Or + B, k az2 araz + B, \ 6_-z o_2 ] j
(ii)
For the self-field thruster, the source term reduces to zero. Once the magnetic transport equation is solved
for ¢, the value of Be is readily obtained. The azimuthal magnetic field is a function of the total discharge
current J, and through the relation ¢ = rBe ". r(J/r) ... J, the function ¢(r, z) = constant may be used to
represent lines of total enclosed current.
Returning to the Maxwell equations, the radial and axial current densities are obtained from the calculated
magnetic field distributions:
I OBs (i2a)h =#o 82
l (1 0 (rBe)) (12b)J" - _o ;0-;:
The a_.imuthal current density js vanishes due to the absence of applied radial or axial magnetic fields in
the self-field MPD thruster.
IIb. Fluid Equations.
The fluid equations are based on the conservation equations of mass, momentum, and energy. Conservation
of mass for a compressible fluid is given by:
V-(p,7) = 0 (13)

which can be written:
a (,._) a(,.p_,)+ - o (i4)Or Oz
where p is the plasma mass density.form:
0_vT 0_,0--7-+ a--i- = o (i5)
which is solved for _, from which the value of p is determined.
Momentum. The conservation of momentum, including viscosity, is expressed in vector form as:
p(_. V)_= -Vp+ (; x B) + ¢ (16)
where p is the plasma pressure and k_ is the viscous force vector:
2 [V_+V(V _]+2(Vq V)_+V_×(V×_ (17)¢= -_V [_ (V ._)] + _
The viscosity 7?for a fully ionized plasma is given by3Z:
10S.' A \---_ ]
where M is the ion mass, m is the electron mass, e is the electron charge, kB is Boltzmann's constant, n_=l
for a singly ionized plasma, and, for a fully ionized gas (a = 1),
.4=2 ln(l+c_ 2) l+a2 =0.386
Defining _ = rp, the mass conservation equation takes the simplified
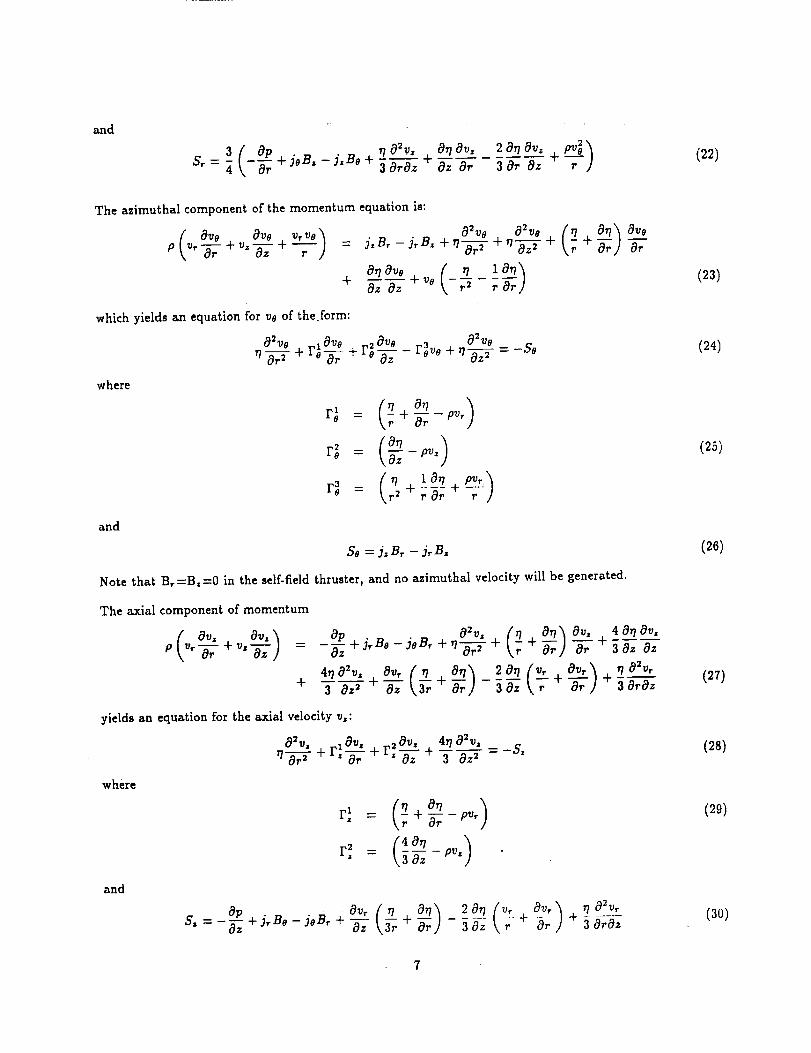
The radial component of the momentum equation is used to solve for the radial velocity v_:
P\ Or +"'-_'; - (4_ 2c9_) 4cgvr(_ 0_1)= -a_+(J°B'-J'B°)-_ra_ _7i+_ +_-_7 +_
Ov_ 077 47702v_ c92v_ _ O_v, cgrl0_, 2 0_ Or,+ 0--[ az + T Or---i- + 'rO_5-z2+ 3 Oraz + az Or 3 Or Oz
Equation (19) is recast in the form:
0__, 1Ov_ 20r_ 3
where
r_ = + Or
r_ =
r_ = + _]
- ST
(19)
(20)
(2i)
and
3 --_+JoB=-j=Bo+3OrOz +Oz Or Or Oz +&=4 -_ 3 (22)
( &o &o y._)
+
which yields an equation for uo of the form:
The azimuthal component of the momentum equation is:
o--;0-7+ _° ,_ 7_
where
and
0%o _lOvo Ovo _ r_z,o+ 0%0_-gj= + ro_7 + r_ T; _T;i-,== -so
C_q- pv_ )
r_ = + ,.--_;+
so= j=B, - j,B=
Note that B,=B==0 in the self-field thruster, and no azimuthal velocity will be generated.
The axial component of momentum
+
Op Oar= (_ Or?) ov= 4 &? o_=-O"-_+JrB°-j°B_ +rl'_'Fr _ + + 07r "_-r + 30z Oz
ToT+T; _ + T, - __ + ar J + _ O,oz
yields an equation for the axial velocity v=:
0%, iO,a, = Or=v-gj + r,_- + r,_-, +
where
r_ = + g_ - p_"
Oz --pv=
and
(23)
(24)
(25)
(26)
(2r)
(28)
(2g)
(30)
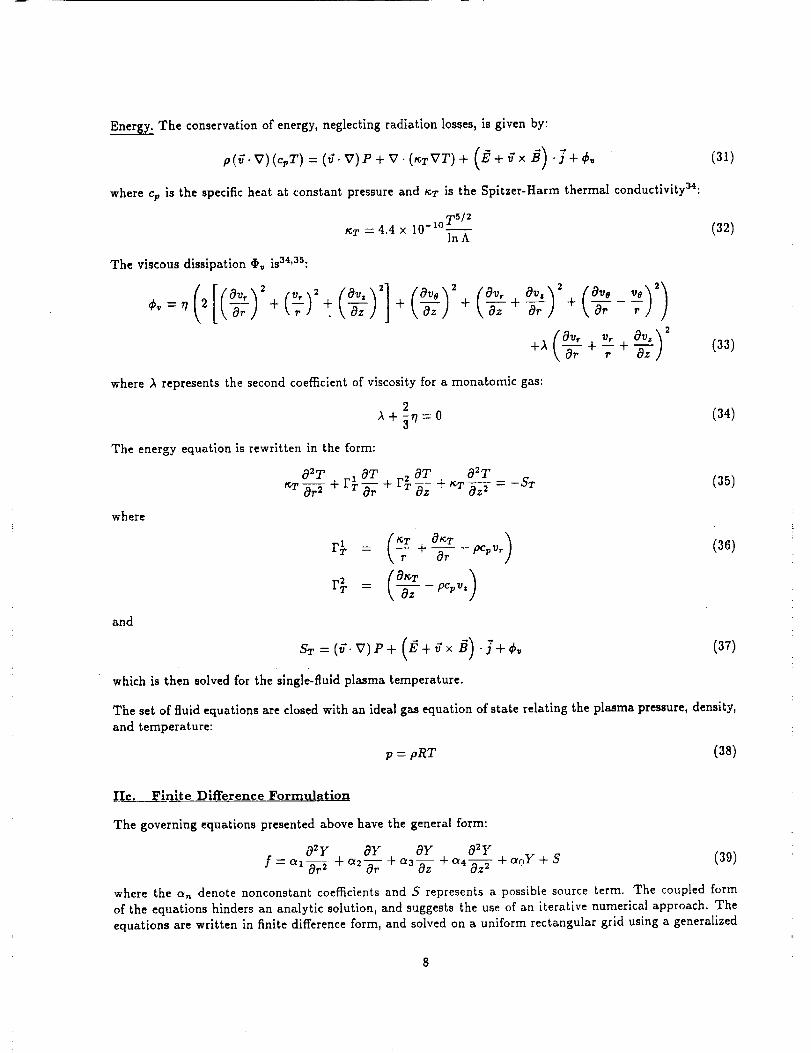
The conservation of energy, neglecting radiation losses, is given by:
p(,Y.V)(cvT ) : (g. V)P + V. (_;TVT)+ (E+ ff x B)" j+ _b,
where % is the specific heat at constant pressure and _T is the Spitzer-Harm thermal conductivity_4:
_;T : 4.4 x 10 -I°T5/2lnA
The viscous dissipation ¢I,, is34'35:
_'=" _,=L_O,] +(_)=+_,Oz] j+_,o=] +\0_ + 8,.1 +\Or
+_\a, +7+_;]
where A represents the second coefficient of viscosity for a monatomic gas:
2
_+_?:0
The energy equation is rewritten in the form:
02T -10T -20T 02Tr,.,r_r 2 + rT _-_r + FT _ z + _T _--Z-_z2 = --ST
where
)r_ : + _ - _,,,,
(°-, _pc_,)r_ : \ a,
and
(31)
(32)
(33)
(34)
(35)
(36)
ST= (_"V)e+ "1_+_×_)" (37)
which is then solved for the single-fluid plasma temperature.
The set of fluid equations are closed with an ideal gas equation of state relating the plasma pressure, density,
and temperature:
p = pRT (38)
_IIe.______F_nite Difference Formulation
The governing equations presented above have the general form:
02Y OY OY O_Y
f = c_x_-_r2 4- c_2-_r + a3_ z 4- a4 Oz----T +aoY + S (39)
where the a,_ denote nonconstant coefficients and S represents a possible source term. The coupled form
of the equations hinders an analytic solution, and suggests the use of an iterative numerical approach. The
equations are written in finite difference form, and solved on a uniform rectangular grid using a generalized
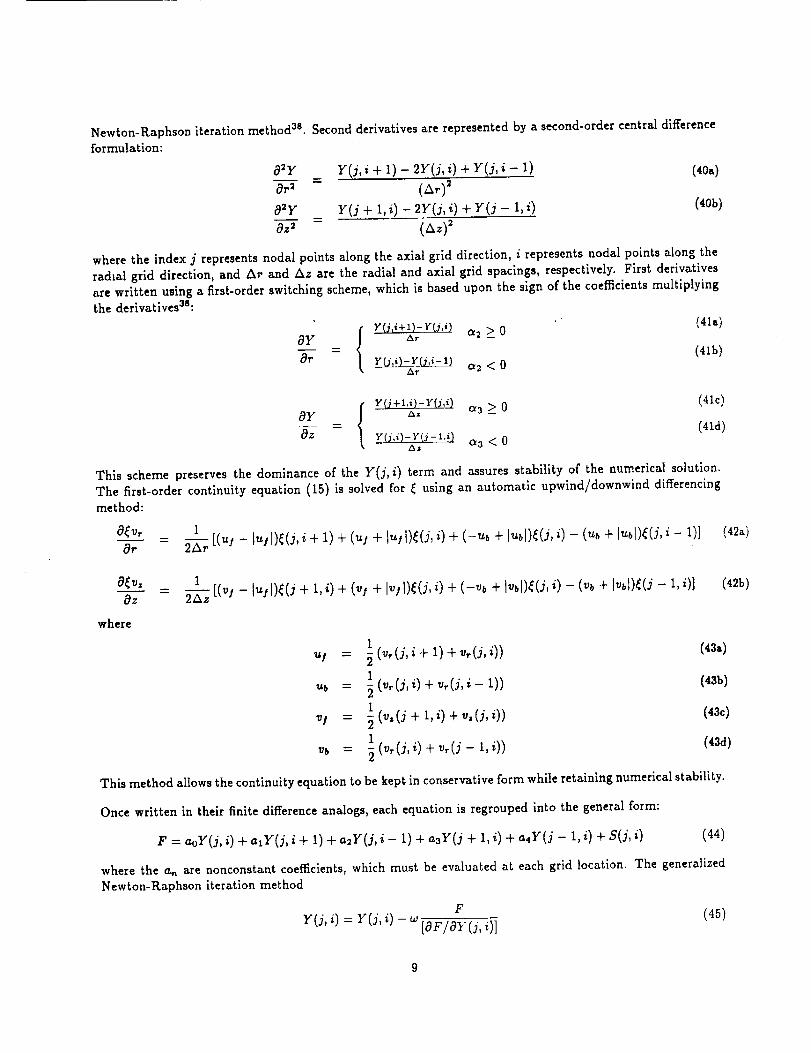
Newton-Raphsoniteration method 3s. Second derivatives are represented by a second-order central differenceformulation:
O_Y _ Y(j,i + l)- 2Y(j,i) + Y(j,i-1) (40a)
Or2 (i,,,,) 2
02y Y(j + 1, i) - 2Y(j, i) + Y(j - 1, i) (40b)
Oz_ - (Az) 2
where the index j represents nodal points along the axial grid direction, i represents nodal points along the
radxal grid direction, and Ar and Az are the radial and axial grid spacings, respectively. First derivatives
are written using a first-order switching scheme, which is based upon the sign of the coefficients multiplyingthe derivatives3S:
Y(_i-t-1)-Y(3,i) "' (41a)
OY ,w "2 > 0
Or - y [/A)_v_y__ (41b)
y(_÷l,i)--Y(j,i) (41c)
OY Az _3 > 0
-- (41d)Oz Y(j.i)-Y(j-l.i) _3 < 0
,xz
This scheme preserves the dominance of the Y(j, i) term and assures stability of the numerical solution.The first-order continuity equation (15) is solved for _ using an automatic upwind/downwind differencingmethod:
O_vT
_P
1
2At [(ul - I_Jl)_(J' £ + 1) + (u/+ lull)_(j, i) + (-Ub + t_bl)_(j, £) - (Ub 4- lUbl)_(j, i - 1)] (42a)
8(v.
Oz
where
12zx_ [(vj - lujl)((J + 1, i) + (vj + Iv11)_(j,i) + (--Vb+ lVbl)_(j, i) - (Vb+ I_'bl)((J -- l, i)]
1
1_b = _ (w(j, i) + _,(j, i - 1)) (4sb)
1v/ -- _(v,(j+l,i)+v,(j,i)) (43c)
1
Vb "- _(vr(j,i)-I-vT(j-- 1, i)) (43d)
kept in conservative form while retaining numerical stability.This method allows the continuity equation to be
(42b)
Once written in their finite difference analogs, each equation is regrouped into the general form:
F = aoY(j, i) + atY(j, i + 1) + a_Y(j, i - 1) + a3Y(j + 1, i) + a4Y(j - 1, i) + S(j, i) (44)
where the a_ are nonconstant coefficients, which must be evaluated at each grid location. The generalized
Newton-Raphson iteration method
F
Y(j, i) = Y(j, i) - ,,, [OF/OY(j, i)] (45)
is then used to iteratlvely solve each finite difference equation. An over-relaxation factor w is used to speed
convergence; its value lies between 1 and 2, and was determined through trial and error for each equation
being solved.
Program execution is presented schematically in Figure 2. The fixed grid is divided into 50 radial by 100
axial nodes, and each equation is iterated first in the axial and then in the radial direction until a relative
convergence criteria is satisfied (typically to within a tolerance of 10-4). The process is repeated for each
equation in turn, and the entire loop through the full set of equations is repeated until the exhaust velocity
and plasma potential have each converged to within 1% of their previous loop values.
Mass flow conservation is checked by numerically integrating pv, radially along the thruster inlet and again
at the thruster exit plane. Mass flow rates at the exit plane were initially found to be off by 15-20%, a
consequence of the finite difference formulation employed; similar results have been reported for the Stuttgartfinite difference MPD codes 2s'_°. In an attempt to improve mass flow conservation, a weighting scheme was
incorporated into the finite difference solution of the continuity equation. Equations (43) were replaced by:
u! = (vr(j,i+ 1)+ vr(j,i)ffa)/(1 + _) (46a)
Ub = (v,-(j,i) + _]r(j,i-- 1)_)/(1 + _) (46b)
v/ = (v_(j + 1, i) + v_(j,i)da)/(1 ÷ _) (46c)
vb = (vr(j,i) + v_(j - 1,i)_)/(1 ÷ _b) (46d)
where tb is a weighting factor, initially set to unity. After each loop through the continuity equation, theratio _ of the mass flow at the thruster inlet plane to the mass flow at the exit plane was calculated and the
weighting factor modified according to:
= _ (47)
The continuity equation was then reiterated untlfthe mass flow ratio ._ = 1 4- 0.01. Although the value of
the weighting factor changes over each loop, the actual velocities are not altered and the calculated mass
flow rates can be brought int 2 close agreement.
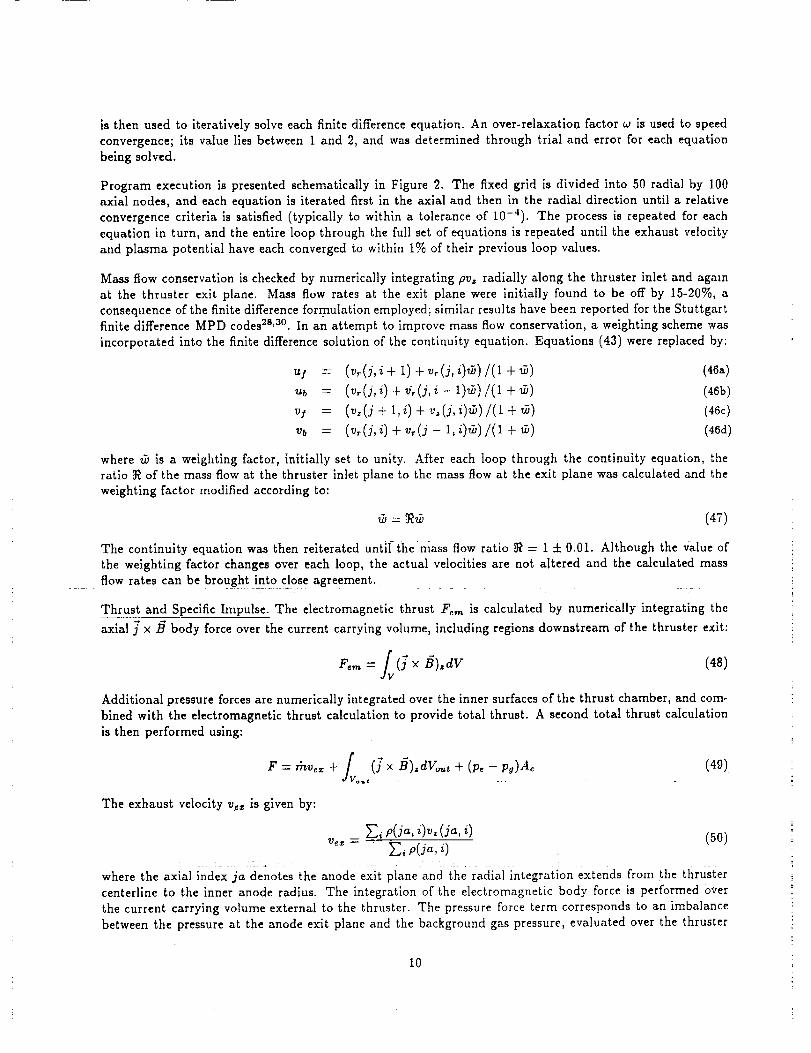
Thrust and Specific Impulse. The electromagnetic thrust F_,,_ is calculated by numerically integrating the
axial )" ×/_ body force over the current carrying volume, including regions downstream of the thruster exit:
= fv(g × g).dY (4S)
Additional pressure forces are numerically integrated over the inner surfaces of the thrust chamber, and com-
bined with the electromagnetic thrust calculation to provide total thrust. A second total thrust calculation
is then performed using:
F = rhvez + / (f x ,B)_dVo_., + (Pe - pg)A_ (49)4Vo_,
The exhaust velocity v_ is given by:
)'_, p(ja, i)vz (ja, i) (50)
where the axial index ja denotes the anode exit plane and the radial integration extends from the thruster
centerline to the inner anode radius. The integration of the electromagnetic body force is performed over
the current carrying volume external to the thruster. The pressure force term corresponds to an imbalance
between the pressure at the anode exit plane and the background gas pressure, evaluated over the thruster
10
exitareaA_. The complementary thrust calculation methods provide an independent check on the total
thrust, and allow estimates to be made of the various thrust components.
IId. Starting Values and Boundary Conditions
Primary input into the code consists of the discharge current, propellant ion mass (amu), and propellant mass
flow rate. Secondary input defines code options, such as maximum bulk electrode temperatures, background
gas pressures, and initial estimates for the plasma transport coefficients. Bulk electrode temperatures are
typically set at 3000 K, and electrode surface temperatures are then evaluated by averaging the temper-ature immediately above the electrode surface with the bulk electrode temperature, providing a smoother
temperature transition between the electrode surface and the hot plasma. Background gas pressures are setbetween 1.3x 10 -2 and 1.3x 10 -4 Pa (10 -4 and 10 -6 torr, respectively). No appreciable difference is found
in calculated thruster performance using either background pressure value.
The inlet velocity v0 is assumed to be sonic and uniform at the backplate. The inlet density Po is assumedto be uniform and is calculated from the 1-D continuity equation, rh = povoAo, where A0 is the exposed
backplate surface area. Radial and azimuthal velocities are initially set to zero, and are defined by symmetry
to remain zero along the centerline. Initial temperatures throughout the calculation region are set to the
bulk electrode temperatures. Initial velocities and densities in the calculation region are set to their values
at the backplate. A no-slip velocity condition is employed at all insulator and electrode surfaces.
Electric fields at insulator surfaces are set equal to zero. Electric fields which enter perpendicular to electrode
surfaces satisfy the condition OE,_/OCt=O, where 7%denotes a unit vector normal to the surface. Electric fields
lying along electrode surfaces are set to zero, consistent with the electrodes being equipotential surfaces. The
magnetic stream line ¢ is set equal to -/_oJ/(27r) along the backplate, zero along the centerline, and is assumedto be continuous at both the outer radial grid boundary and and downstreaha axial grid boundary. Setting
¢=0 at the thruster exit plane prevents current from blowing out of the thruster, while setting ¢--0 at the
downstream grid boundary artificially compresses the current blown downstream.
IIe. Stability and Performance
Steep radial pressure gradients, typically caused by a combination of high densities and sharp temperature
gradients near the cathode tip, may cause the code to become unstable. Negative radial pressure gradients
near the plume centerline can drive the radial velocity positive, causing the centerline density to plummetand the local Hall parameter to skyrocket. This effect can propagate into the field equations, precipitating
numerical instabilities from which the steady-state code cannot recover. This problem is currently handled
by under-relaxing the pressure gradient terms during the first several iterations, allowing the flow and
discharge pattern to stabilize before the pressure gradient terms are brought up to their full values. A more
elegant solution, currently under investigation, is to use nonuniform or multigrid algorithms to refine the
computational mesh near the electrode surfaces, allowing the sharp gradients to be handled more effectively.
To shorten loop convergence times, the temperature and velocity components are averaged with their previous
loop values. This damps out minor fluctuations as a solution is approached, allowing more rapid loop
convergence. Tests performed with and without smoothing yield identical results. Model convergence with
smoothing is typically obtained within 10-12 loops through the equations, requiring approximately 45 CPU
minutes on a VAX-9000 computer. The code has not yet been optimized for a CRAY computing system.
III. Comparison with Experiment
The self-field model was compared with published experimental results for the University of Stuttgart coaxialZT-1 MPD thruster 39 and for the Princeton University half-scale flared anode thruster (HSFAT) 40. The ZT-
11
1thrusteranodeis segmented,allowinganodecurrentdistributionsto beevaluatedduringsteadystateoperation.In addition,the thrusterhasbeennumericallymodeledby Slezionae_ al. _s, allowing direct
comparisons between the Stuttgart and NASA LeRC codes. The HSFAT was chosen to test the accuracywith which a fixed numerical grid can model a flared thruster geometry, while the extensive experimental
data which exists for the HSFAT 4°'41 provides an excellent opportunity to exercise the code over a wide
range of currents and mass flow rates.
IIIa. ZT-1 Thruster Comparisons
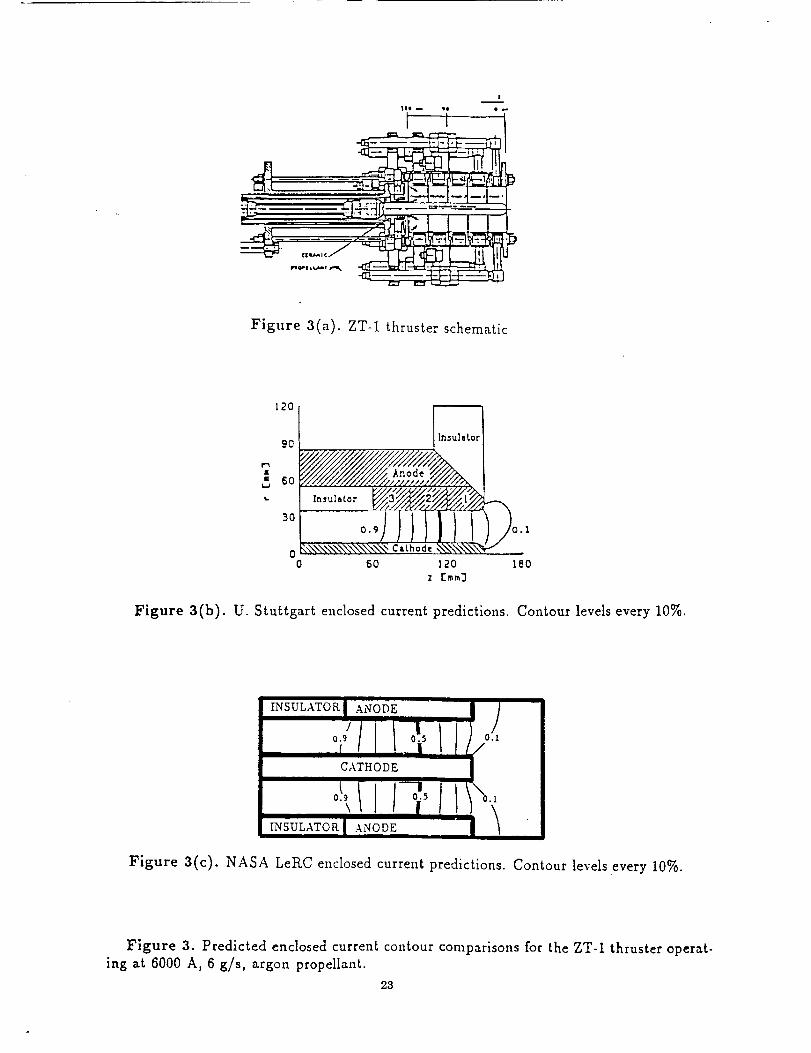
The University of Stuttgart ZT-1 MPD thruster is a cylindrical, steady-state, water-cooled research device
with a 2% thoriated tungsten cathode and a segmented copper anode (Figure 3a). The two segments closest
to the backplate are electrically isolated, with the remaining three rings connected to form the anode. The
backplate is made of copper, and is electrically isolated from the electrodes. Propellant gas may be introduced
through a backplate annulus surrounding either the cathode or the anode, or the flow may be split and sent
through both injector rings. The anode inner diameter is 7.0 cm and has a total length of 15 cm, including
the insulated anode segments. The cathode is 1.8 cm in diameter, and for the comparison below has an
exposed length of 15 cm within the thrust chamber.
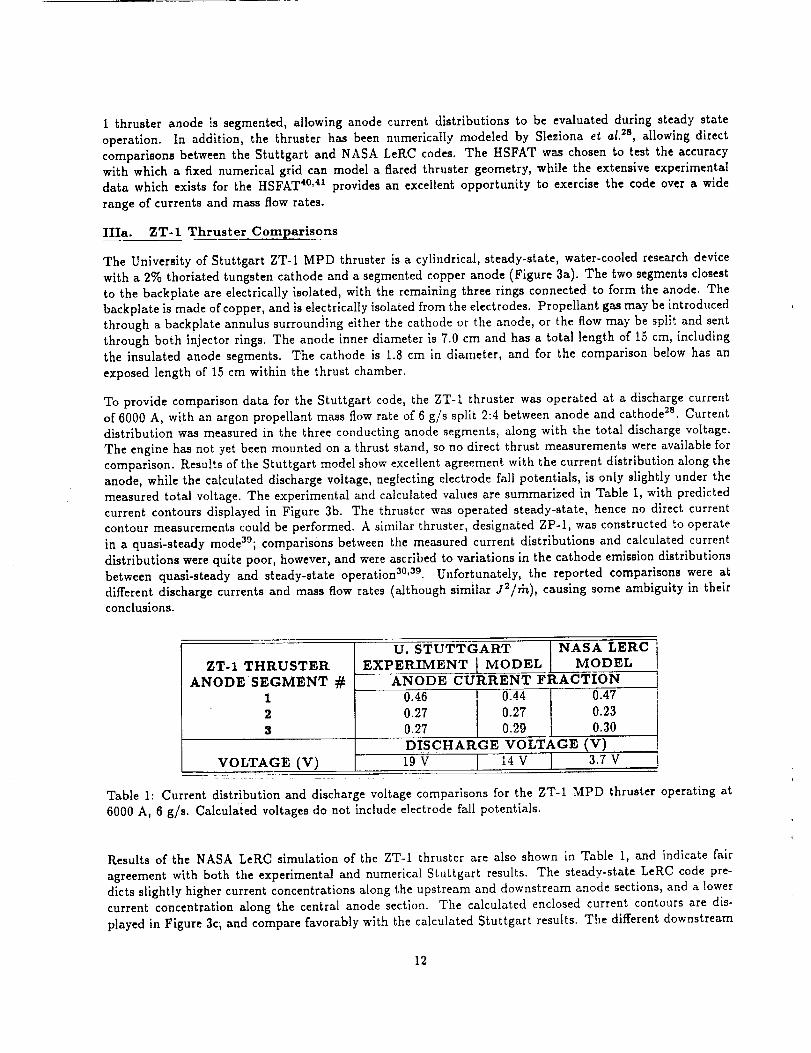
To provide comparison data for the Stuttgart code, the ZT-I thruster was operated at a discharge current
of 6000 A, with an argon propellant mass flow rate of 6 g/s split 2:4 between anode and cathode 2s. Currentdistribution was measured in the three conducting anode segments, along with the total discharge voltage.
The engine has not yet been mounted on a thrust stand, so no direct thrust measurements were available for
comparison. Results of the Stuttgart model show excellent agreement with the current distribution along theanode, while the calculated discharge voltage, neglecting electrode fall potentials, is only slightly under the
measured total voltage. The experimental and calculated values are summarized in Table 1, with predicted
current contours displayed in Figure 3b. The thruster was operated steady-state, hence no direct currentcontour measurements could be performed. A similar thruster, designated ZP-1, was constructed to operate
in a quasi-steady mode39; comparisons between the measured current distributions and calculated current
distributions were quite poor, however, and were ascribed to variations in the cathode emission distributions
between quasl-steady and steady-state operation 3°'39. Unfortunately, the reported comparisons were at
different discharge currents and mass flow rates (although similar J_/rh), causing some ambiguity in theirconclusions.
ZT-1 THRUSTER
ANODE SEGMENT #1
2
3
VOLTAGE (V)
U. STUTTGART I NASA LERC
EXPERIMENT I MODEL I MODELANODE CURRENT FRACTION
0.27 0.27 0.230.27 0.29 0.30DISCHARGE VOLTAGE (V)
19V [ 14V [ 3.7V
Table 1: Current distribution and discharge voltage comparisons for the ZT-1 MPD thruster operating at
6000 A, 6 g/s. Calculated voltages do not include electrode fall potentials.
Results of the NASA LeRC simulation of the ZT-1 thruster are also shown in Table 1, and indicate fair
agreement with both the experimental and numerical Stuttgart results. The steady-state LeRC code pre-dicts slightly higher current concentrations along the upstream and downstream anode sections, and a lower
current concentration along the central anode section. The calculated enclosed current contours are dis-
played in Figure 3c, and compare favorably with the calculated Stuttgart results. The different downstream
12
attachmentsshownin Figures3b and 3c are a result of the boundary conditions used on the anode face.
The Stuttgart model assumes a partially insulated anode face, which forces the current to reattach near the
anode lip. In Figure 3c, the anode face is left uninsulated, and the downstream current does not appear to
reattach within the simulated region.
The plasma potential calculated with the LeRC code is substantially lower than the total measured voltage,
reaching only 3.7 volts, or roughly 20% of the discharge voltage. The plasma drop, calculated by radially
integrating Equation 7a from cathode to anode, does not include the electrode fall voltages or any plasma
ionization penalties; however, neither does the Stuttgart calculation, which comes remarkably close to match-
ing the full discharge voltage. The reason for this discrepancy lies in the different expressions used for theelectrical conductivity. The average electrical conductivity calculated by the Stuttgart code is 29 2000-2500
mho/m within the thruster, while the average value calculated in the NASA LeRC model is approximately
6000 mho/m within the thruster. The calculated plasma potential is inversely proportional to the conduc-
tivity (Equation ?a), which results in the higher potential calculated by the Stuttgart model. Resolving this
issue will require better approximations for the plasma transport coefficients, as well as a sheath model to
accurately calculate electrode fall contributions to the total voltage drop.
Calculated thrust values were not reported for the ZT-1 thruster under the assumed operating conditions.
A thrust of approximately 28 N, including 14 N of electromagnetic thrust, was calculated by the Stuttgart
code 2s for the ZT-1 thruster using a discharge current of 10 kA and an argon mass flow rate of 6 g/s. The
LeRC code was operated with these same parameters to verify the thrust calculation routine. The total
calculated thrust was 27 N, with 13 N of electromagnetic thrust, in good agreement with the Stuttgart
predictions. For the ZT-1 thruster operating at a discharge current of 6 kA, the LeRC code calculated a
total thrust of approximately 11 N, with 4.7 N of electromagnetic thrust. The corresponding specific impulse
is approximately 185 s. Using the measured discharge voltage of 19 volts at 6000 A and the calculated thrust
of 11 N, the estimated efficiency of the ZT-[ thruster under the given operating conditions is approximately
9%.
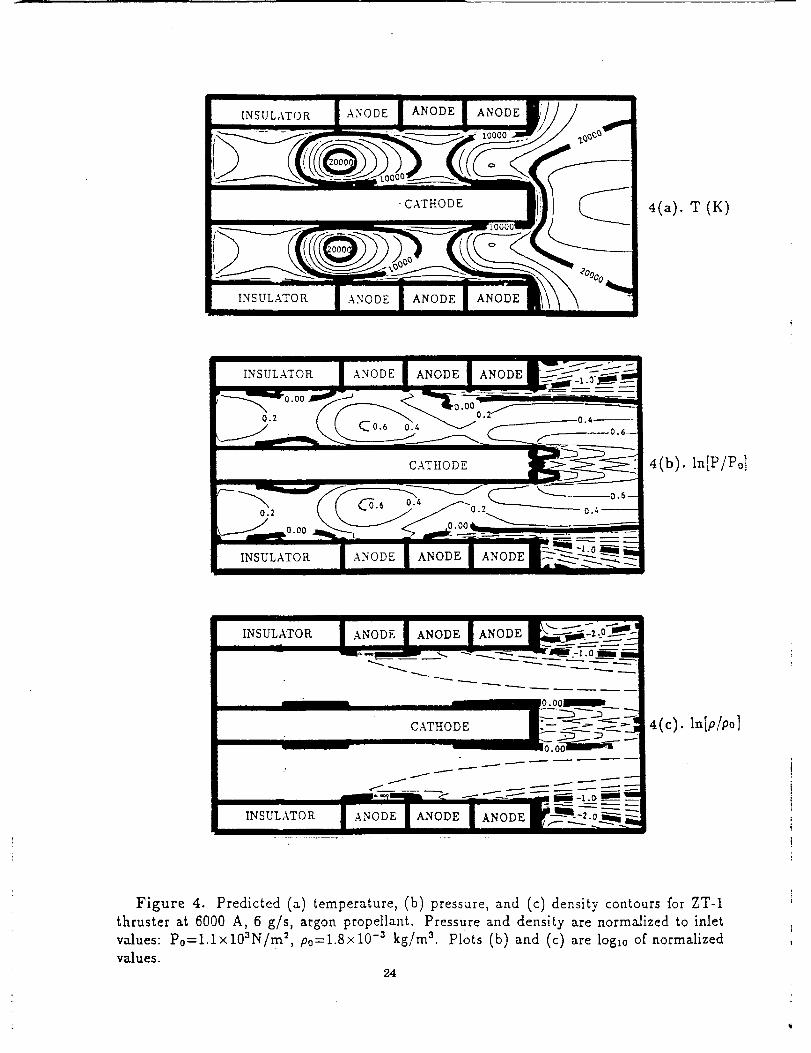
Temperature, pressure, and density contours calculated with the NASA LeRC code are displayed for the ZT- 1
thruster in Figures 4(a) through 4(c). The pressure and density contours are normalized to their average inlet
values and plotted as logl0[P/Po] and loglo[P/p0], respectively, to bring out details in the exhaust plume.
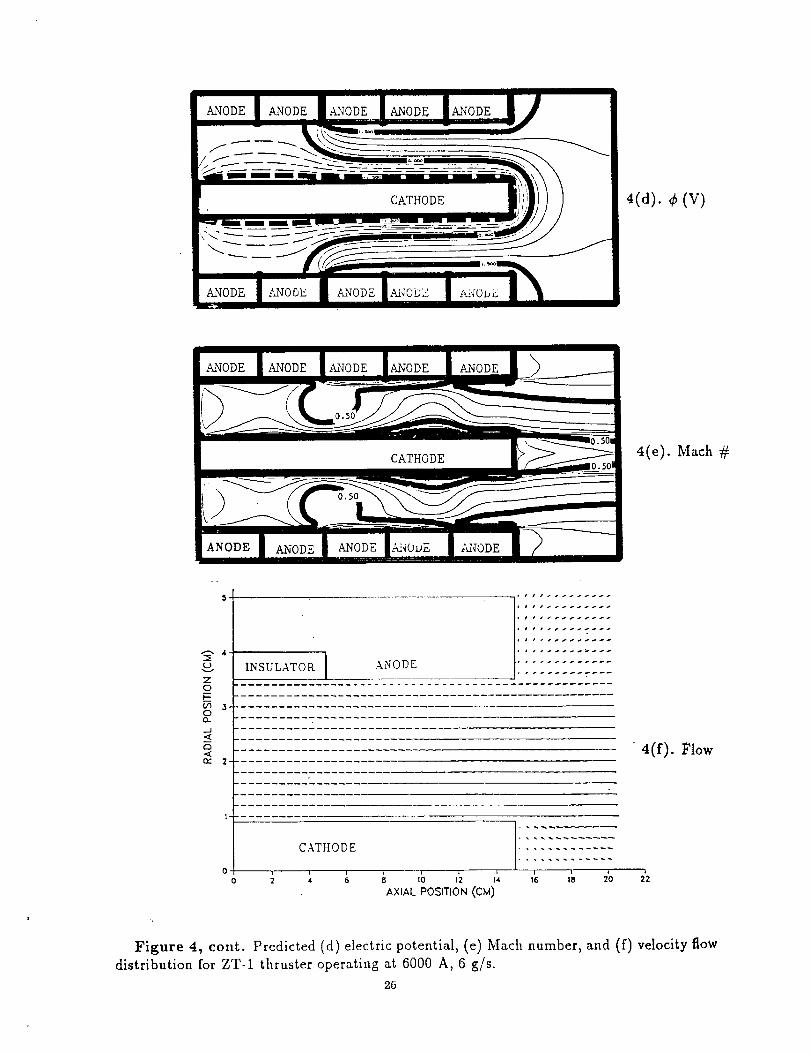
Electric equipotentials are plotted in Figure 4d, showing equipotential line convergence at the interface
between the insulating and conducting anode segments, and at the inlet where the cathode penetrates the
insulating backplate. Local Mach number contours are displayed in Figure 4e, and the velocity flow fieldis shown in Figure 4f. Of particular interest is the high temperature interelectrode region shown in Figure
4a; a similar temperature increase was observed in the Stuttgart modeling results _s'_9. The convergence of
equipotential lines along the junction of the insulated and conducting anode segments indicates a region ofstrong electric fields, and a plausible explanation for the increased temperature is localized Joule heating (cf
Equation 3l). To test this hypothesis, a second numerical run was performed for the ZT-1 thruster using
identical operating conditions, but with the insulated segments replaced by conducting anode segments.
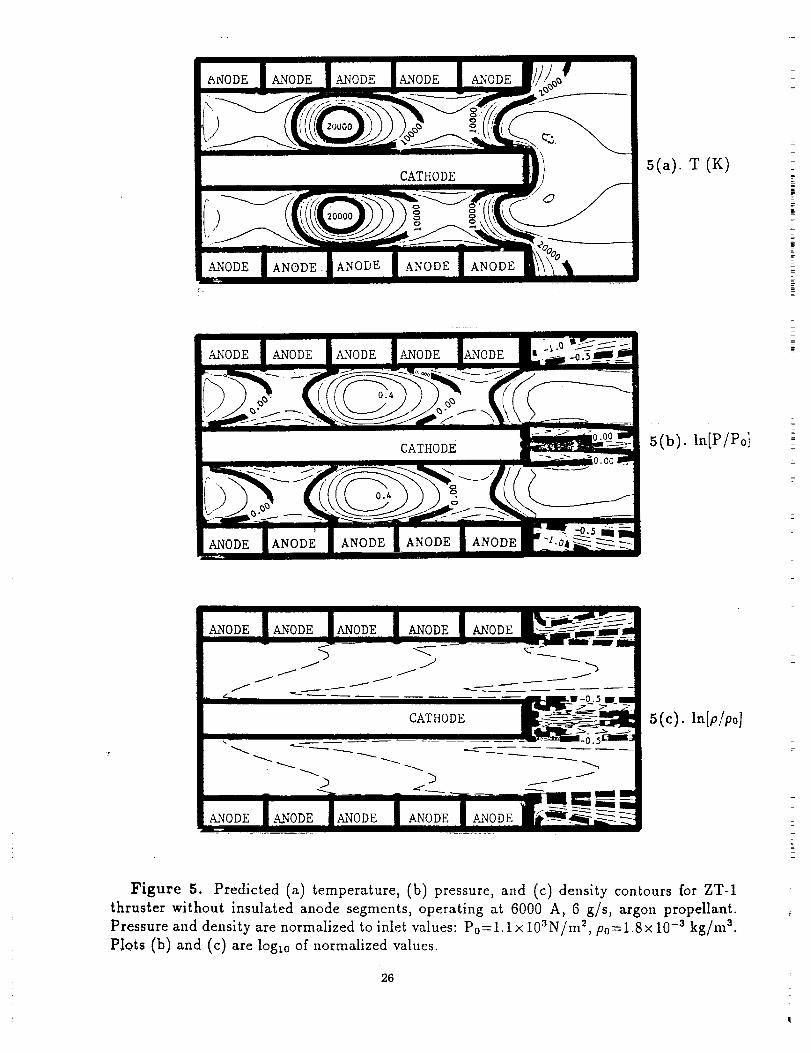
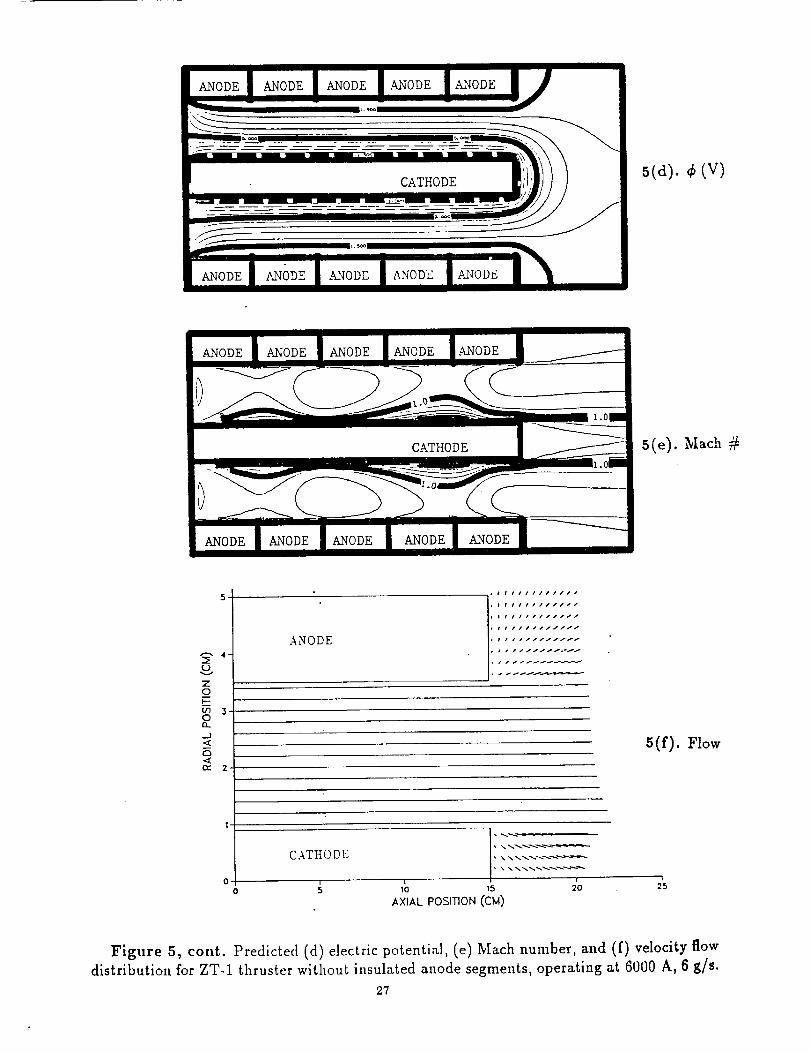
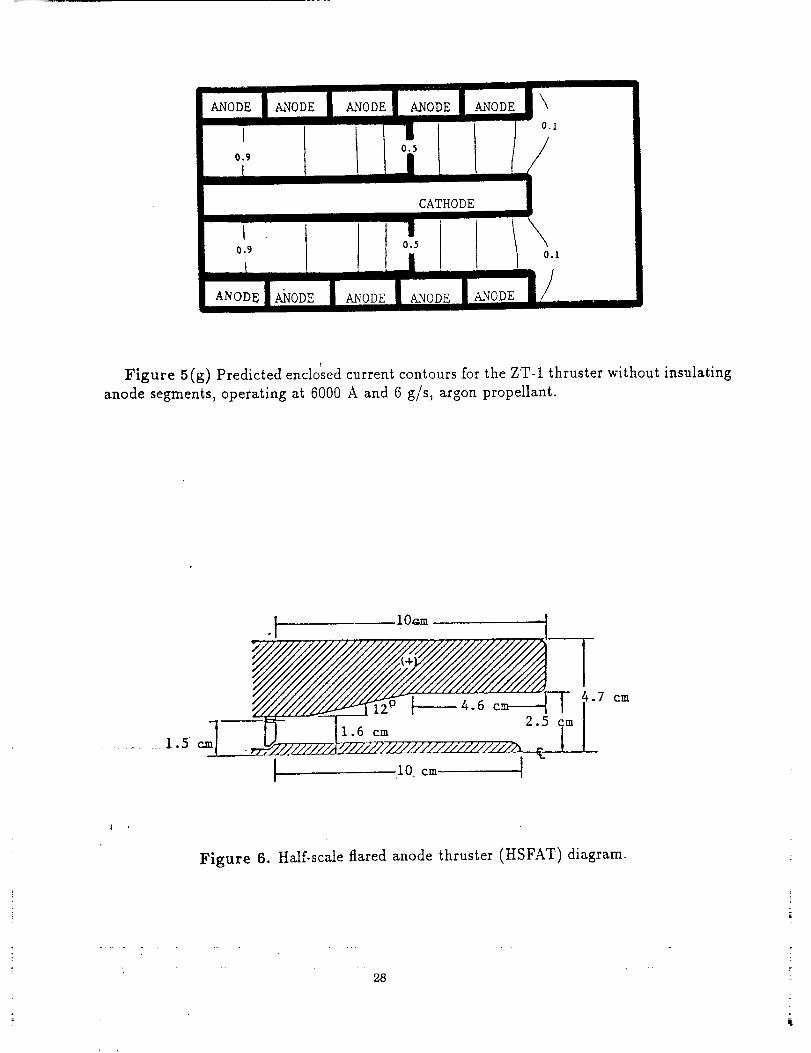
Results are shown in Figures 5a through 5f, with the enclosed current contours displayed in Figure 5g.
The high temperature interelectrode region appears in nearly the same location with approximately thesame temperature as in the ZT-1 thruster with insulating segments. The high temperature region is thus
not a result of localized :Joule heating near the insulator/electrode interface, but is generic to the ZT-1
thruster geometry under the assumed operating conditions. Further modeling would be useful to determinehow different mass flow rates and discharge currents affect the interelectrode temperature distribution, and
whether the localized increase in temperature can be reduced by changing the anode radius or the thruster
length. A combination of experiment and simulation could determine the effect of the high temperature
anomaly on electrode erosion, and produce design modifications which may mitigate the severe upstreamcathode erosion observed in the ZT-1 thruster 42.
Temperatures are also observed to increase in the flow exhaust region, with maximum temperatures occuring
13
downstream of the thruster exit plane. The corresponding pressure distributions (Figures 4b and 5b) showincreased pressures at locations of increased temperature, both within the chamber and downstream of the
cathode tip. The pressure distribution for the ZT-1 thruster with insulating segments is somewhat more
complex than the ZT-1 without insulators, indicating a pressure rise slightly upstream of the anode exitplane compared with a relatively smooth pressure transition in the ZT-1 without insulators. Mach number
contours (Figures 4e and 5e) show the flow is more smoothly accelerated in the ZT-1 without insulators,although some flow deceleration occurs in the high pressure interelectrode region for both cases. Smoother
flow is also shown in the velocity vector diagrams (Figures 4f and 5f), which display an interesting difference
in the exhaust velocity profiles for the two cases. Calculated thrust values were 11.1 N for each case, including4.7 N of electromagnetic thrust.
The ZT-1 thruster comparisons allow the self-field model to be tested against experimental and independent
numerical results, and provide some confidence that the code can accurately predict major aspects of steady-
state MPD thruster performance. However, the disparity in predicted plasma vo[tages underscores the
need for accurate electrode sheath models and improved expressions for the plasma transport coefficients in
calculating total discharge voltages. The prediction of a high temperature region occuring within the ZT-I
thruster channel, and the possible correlation of this region with a measured increase in cathode erosion,
reiterate the need for a balanced experimental and numerical approach in evaluating MPD thruster dynamics.
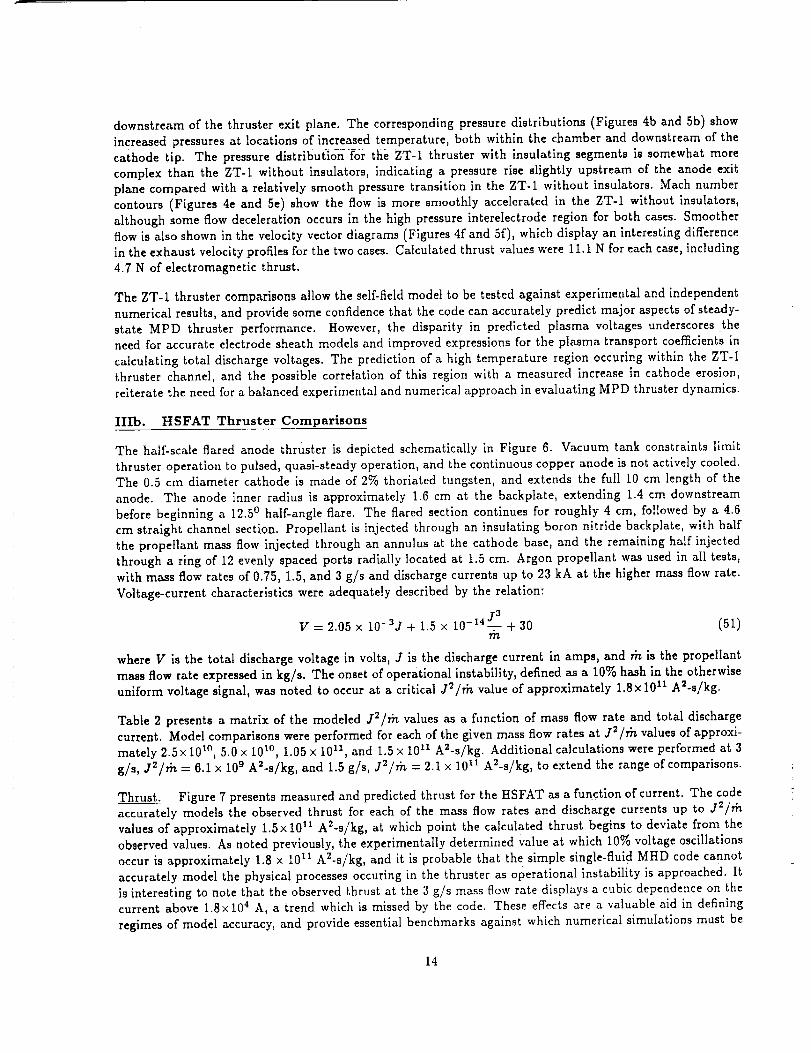
IIIb. HSFAT Thruster Comparisons
The half-scale flared anode thruster is depicted schematically in Figure 6. Vacuum tank constraints limit
thruster operation to pulsed, quasi-steady operation, and the continuous copper anode is not actively cooled.
The 0.5 cm diameter cathode is made of 2% thoriated tungsten, and extends the full 10 cm length of theanode. The anode inner radius is approximately 1.6 cm at the backplate, extending 1.4 cm downstream
before beginning a 12.5 ° half-angle flare. The flared section continues for roughly 4 cm, followed by a 4.6
cm straight channel section. Propellant is injected through an insulating boron nitrlde backplate, with half
the propellant mass i_ow injected through an annulus at the cathode base, and the remaining half injected
through a ring of 12 evenly spaced ports radially located at 1.5 cm. Argon propellant was used in all tests,
with mass flow rates of 0.75, 1.5, and 3 g/s and discharge currents up to 23 kA at the higher mass flow rate.
Voltage-current characteristics were adequately described by the relation:
V 2.05 x 10⁻³J + 1.5 × 10 -14J3= -=- + 30 (51)rn
where V is the total discharge voltage in volts, J is the discharge current in amps, and rh is the propellant
mass flow rate expressed in kg/s. The onset of operational instability, defined as a 10% hash in the otherwise
uniform voltage signal, was noted to occur at a critical J2/rh value of approximately 1.8 x 10¹¹ A_-s/kg.
Table 2 presents a matrix of the modeled J2/Th values as a function of mass flow rate and total discharge
current. Model comparisons were performed for each of the given mass flow rates at J2/rh values of approxi-mately 2.5x 10 I°, 5.0 x 10 l°, 1.05 x 10¹¹, and 1.5 × I011 A2-s/kg. Additional calculations were performed at 3
g/s, J2/rh = 6.1 × 10⁹ A2-s/kg, and 1.5 g/s, J2/rh = 2.1 × 10¹¹ A2-s/kg, to extend the range of comparisons.
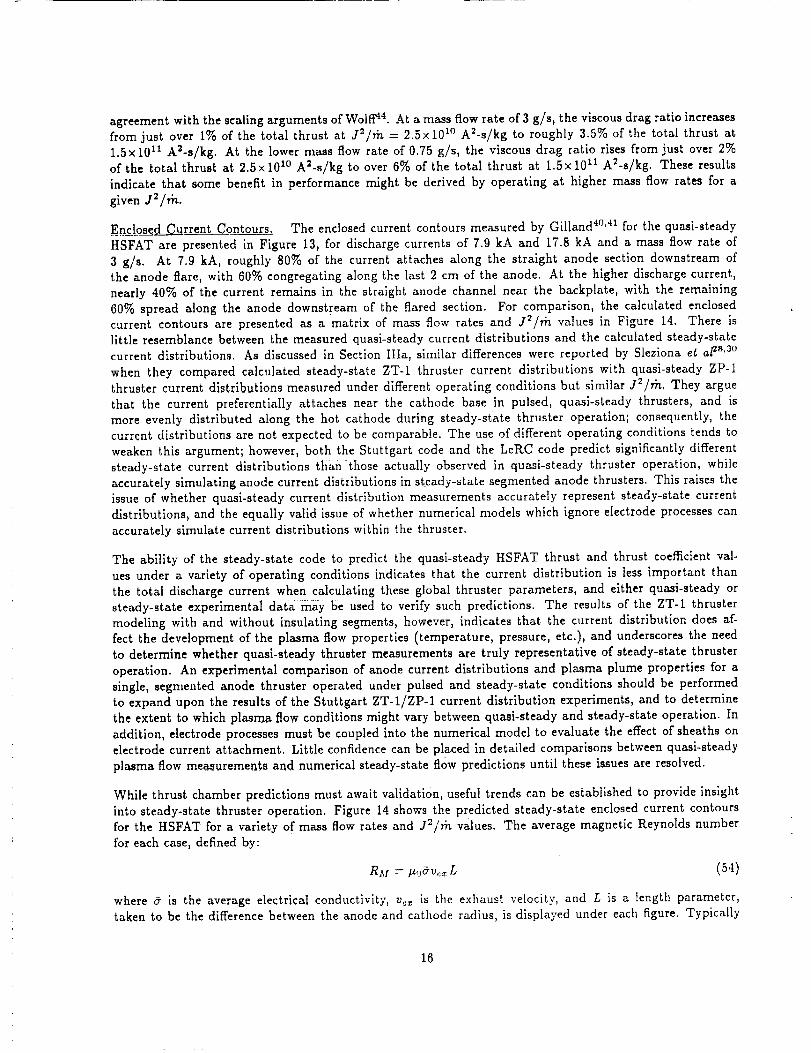
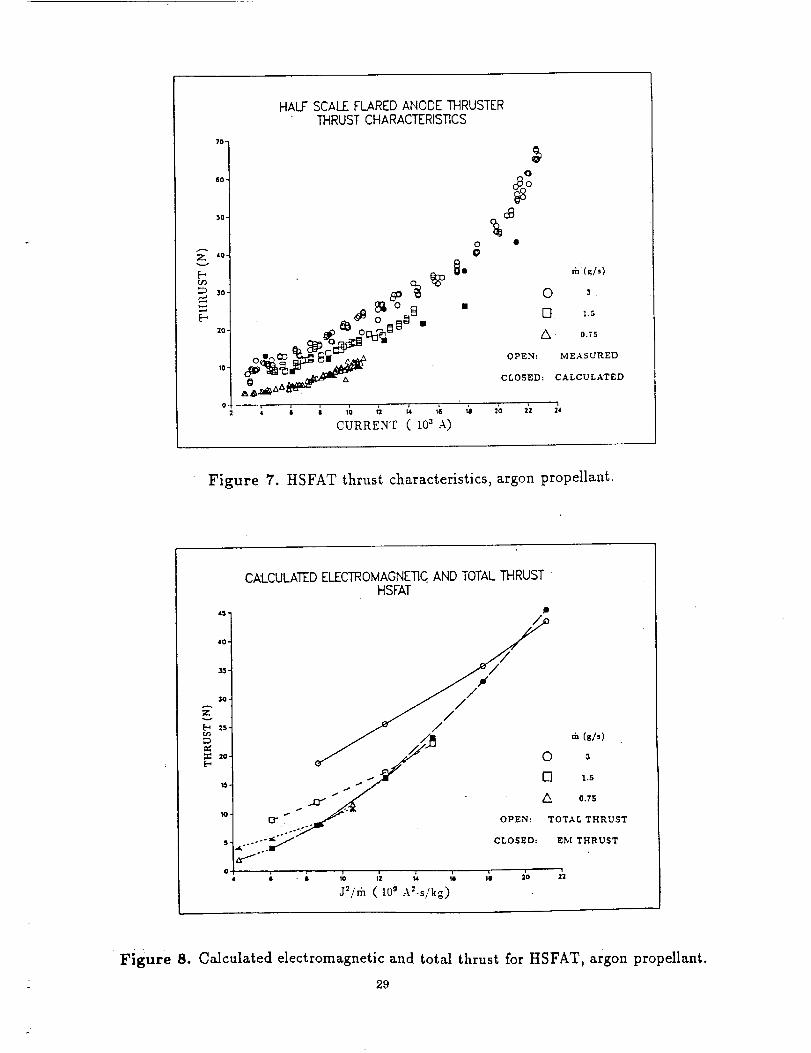
Thrust. Figure 7 presents measured and predicted thrust for the HSFAT as a function of current. The code
accurately models the observed thrust for each of the mass flow rates and discharge currents up to J2/rh
values of approximately 1.5× 10¹¹ A2-s/kg, at which point the calculated thrust begins to deviate from the
observed values. As noted previously, the experimentally determined value at which 10% voltage oscillations
occur is approximately 1.8 × 10¹¹ A2-s/kg, and it is probable that the simple single-fluid MHD code cannot
accurately model the physical processes occuring in the thruster as operational instability is approached. It
is interesting to note that the observed thrust at the 3 g/s mass flow rate displays a cubic dependence on thecurrent above 1.8× 10⁴ A, a trend which is missed by the code. These effects are a valuable aid in defining
regimes of model accuracy, and provide essential benchmarks against which numerical simulations must be
14
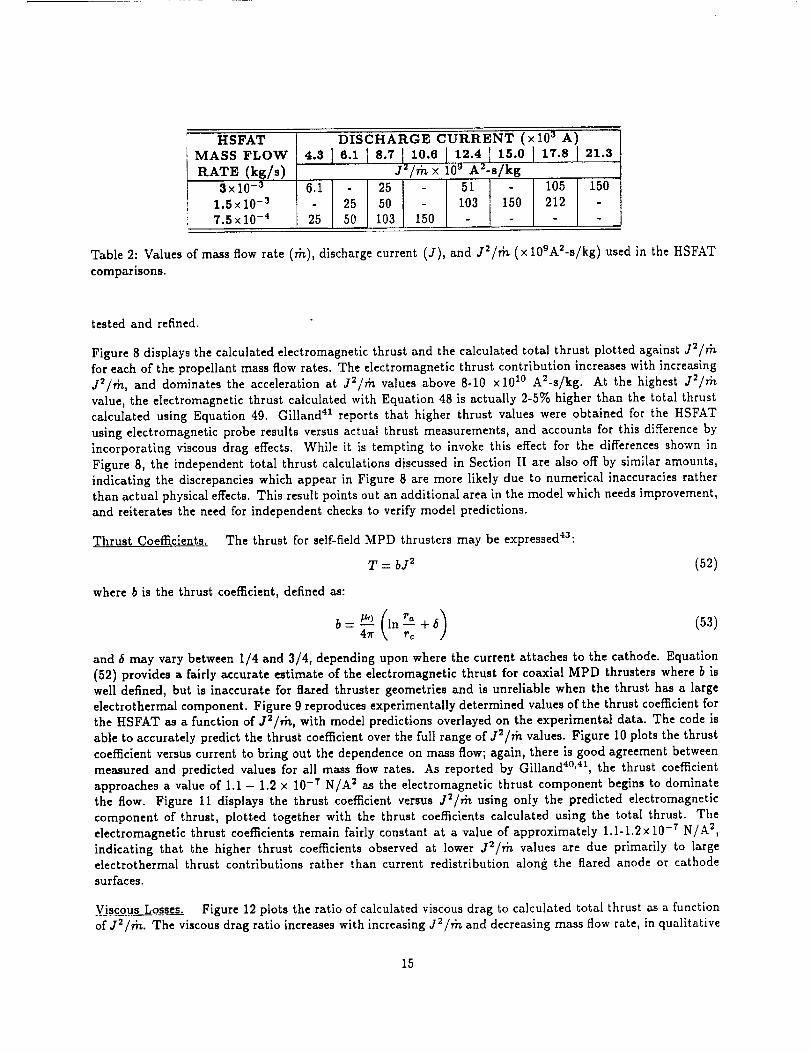
Table 2: Values
comparisons.
HSFAT DISCHARGE CURRENT (x 103 A)
i MASS FLOW 4.3 [ 6.1 [ 8.7j_t0.6 ] 12.4 ] 15.0 ] 17.8 I 21.3i RATE (kg/s) 'r_x 109 A2-s/kg
t 3x10⁻³ 6.1 25 51 - 105 1501.5x10 -3 25 50 103 150 212
7.5×10 -4 25 50 103 150 - - -
ofmass flow rate (m), dischargecurrent(J), and J2/rfi,(x 109A2-s/kg) used in the HSFAT
testedand refined.
Figure 8 displaysthe calculatedelectromagneticthrustand the calculatedtotalthrustplottedagainstJ2/r_
foreach ofthe propellantmass flow rates.The electromagneticthrustcontributionincreaseswith increasing
J2/ri_,and dominates the accelerationat j2/m values above 8-10 x 10I° A2-s/kg. At the highestJZ/m
value,the electromagneticthrustcalculatedwith Equation 48 isactually2-5% higher than the totalthrust
calculatedusing Equation 49. Gilland41 reportsthat higher thrust values were obtained for the HSFAT
using electromagneticprobe resultsversus actualthrustmeasurements, and accounts for thisdifferenceby
incorporating viscousdrag effects.While itistempting to invoke this effectfor the differencesshown in
Figure 8, the independent totalthrustcalculationsdiscussedin Section IIare alsooffby similaramounts,
indicatingthe discrepancieswhich appear in Figure 8 are more likelydue to numerical inaccuraciesrather
than actualphysicaleffects.This resultpointsout an additionalarea inthe model which needs improvement,
and reiteratesthe need forindependent checksto verifymodel predictions.
Thrust Coefficients. The thrust for self-field MPD thrusters may be expresseda3:
T = bJ2 (52)
where b is the thrust coefficient, defined as:
/_0( r, )b= _ In---{-6 (53)Pc
and 6 may vary between 1/4 and 3/4, depending upon where the current attaches to the cathode. Equation
(52) provides a fairly accurate estimate of the electromagnetic thrust for coaxial MPD thrusters where b iswell defined, but is inaccurate for flared thruster geometries and is unreliable when the thrust has a large
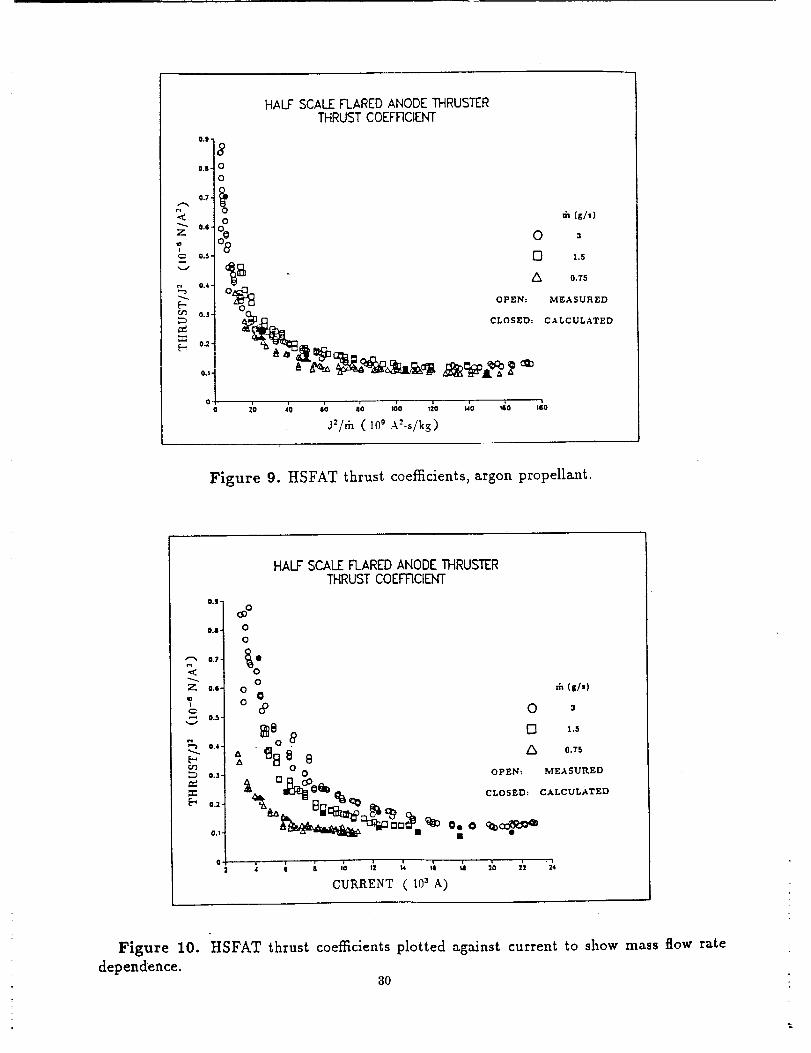
electrothermal component. Figure 9 reproduces experimentally determined values of the thrust coefficient for
the HSFAT as a function of J2/Cn, with model predictions overlayed on the experimental data. The code is
able to accurately predict the thrust coefficient over the full range of J_/_n values. Figure 10 plots the thrust
coefficient versus current to bring out the dependence on mass flow; again, there is good agreement between
measured and predicted values for all mass flow rates. As reported by Gilland 4°'41, the thrust coefficient
approaches a value of 1.1 - 1.2 × 10 -T N/A s as the electromagnetic thrust component begins to dominate
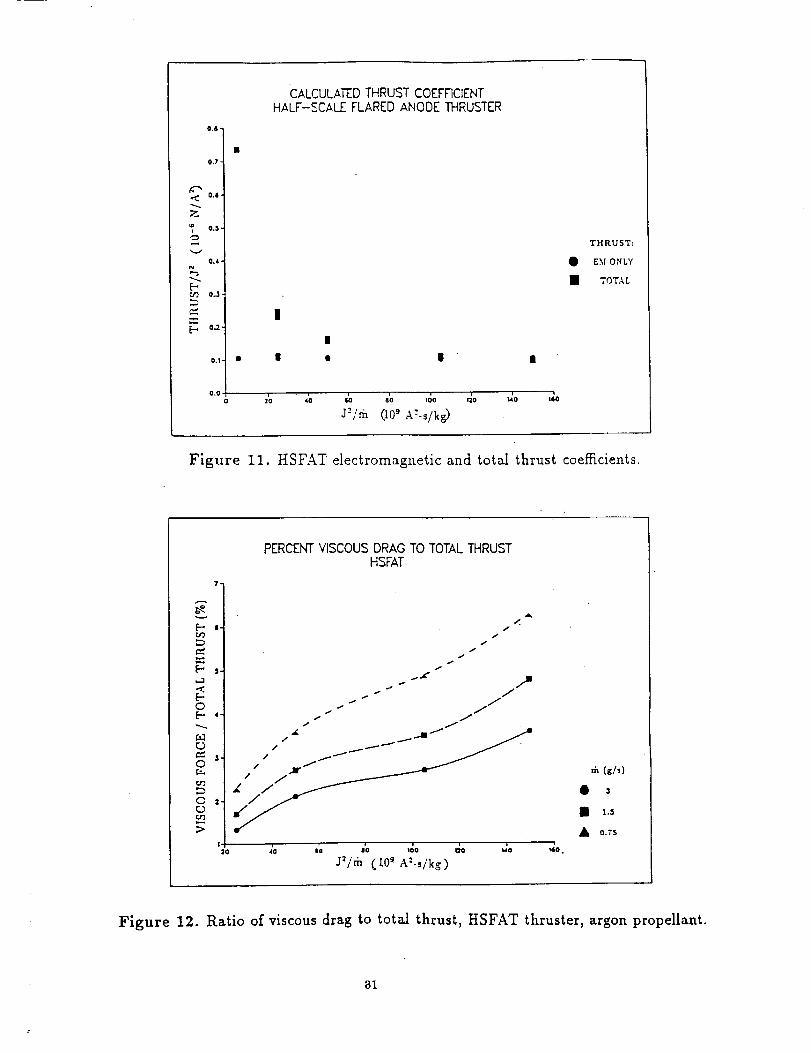
the flow. Figure 11 displays the thrust coefficient versus J_/rh using only the predicted electromagnetic
component of thrust, plotted together with the thrust coefficients calculated using the total thrust. The
electromagnetic thrust coefficients remain fairly constant at a value of approximately 1.1-1.2 × 10 -7 N/A 2,
indicating that the higher thrust coefficients observed at lower J2/_n values are due primarily to largeelectrothermal thrust contributions rather than current redistribution along the flared anode or cathode
surfaces.
Viscous Losses. Figure 12 plots the ratio of calculated viscous drag to calculated total thrust as a function
of J2/rh. The viscous drag ratio increases with increasing J_/rh and decreasing mass flow rate, in qualitative
15
agreement with the scalingarguments ofWoli_ 4.At a mass flowrateof3 g/s,the viscousdrag ratioincreases
from just over I% of the totalthrustat J2/rh --2.5)<101°A2-s/kg to roughly 3.5% of the totalthrust at
1.5xi011 A2-s/kg. At the lower mass flow rate of 0.75 g/s, the viscousdrag ratiorisesfrom just over 2%
of the totalthrustat 2.5× 101° A2-s/kg to over 6% of the totalthrust at 1.5×10¹¹ A_-s/kg. These results
indicatethat some benefitin performance might be derived by operating at higher mass flow ratesfor a
given J2/rb..
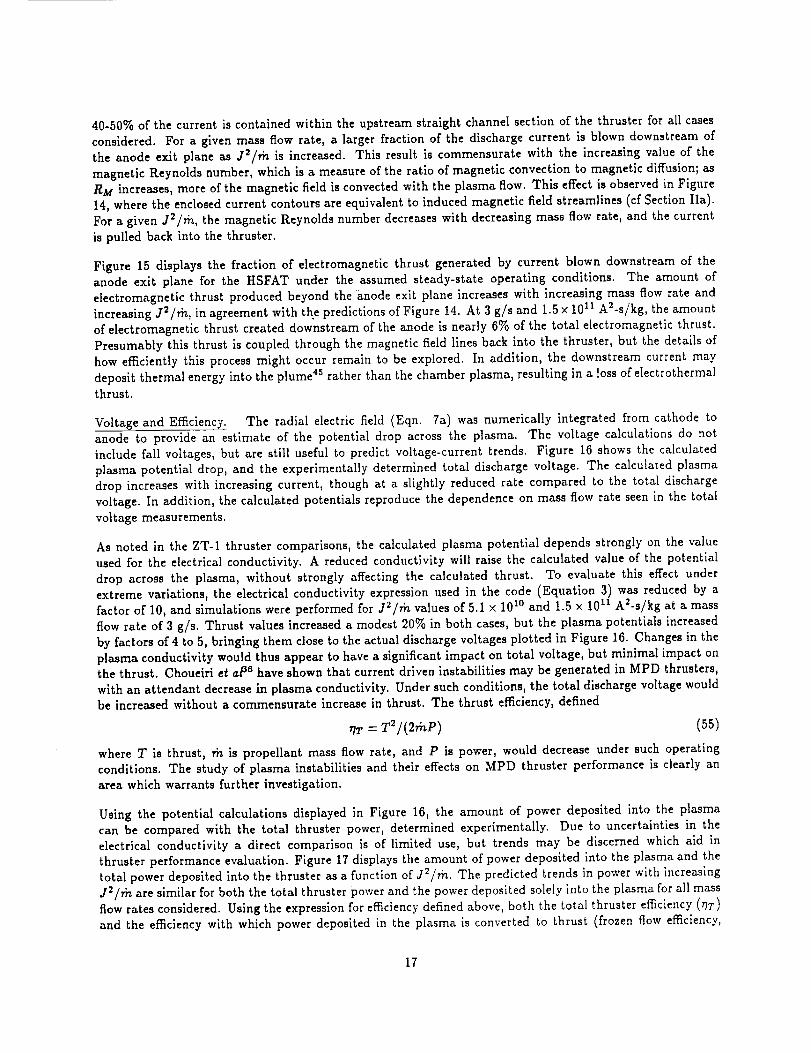
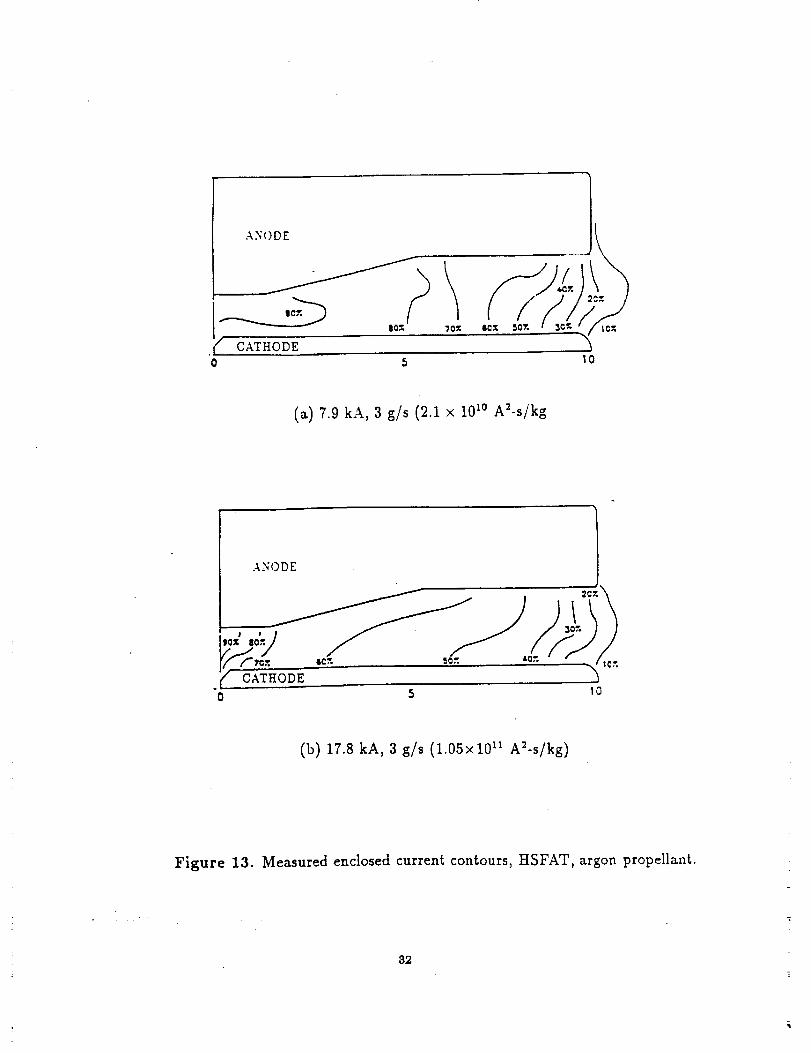
E_n.clolcd_C__rrentContours. The enclosed currentcontours measured by Gilland4°'41forthe quasi-steady
HSFAT are presented in Figure 13, for dischargecurrentsof 7.9 kA and 17.8 kA and a mass flow rate of
3 g/s. At 7.9 kA, roughly 80% of the currentattaches along the straightanode sectiondownstream of
the anode flare,with 60% congregating along the last2 cm of the anode. At the higherdischargecurrent,
nearly 40% of the current remains in the straightanode channel near the backplate,with the remaining
60% spread along the anode downstream of the flaredsection. For comparison, the calculatedenclosed
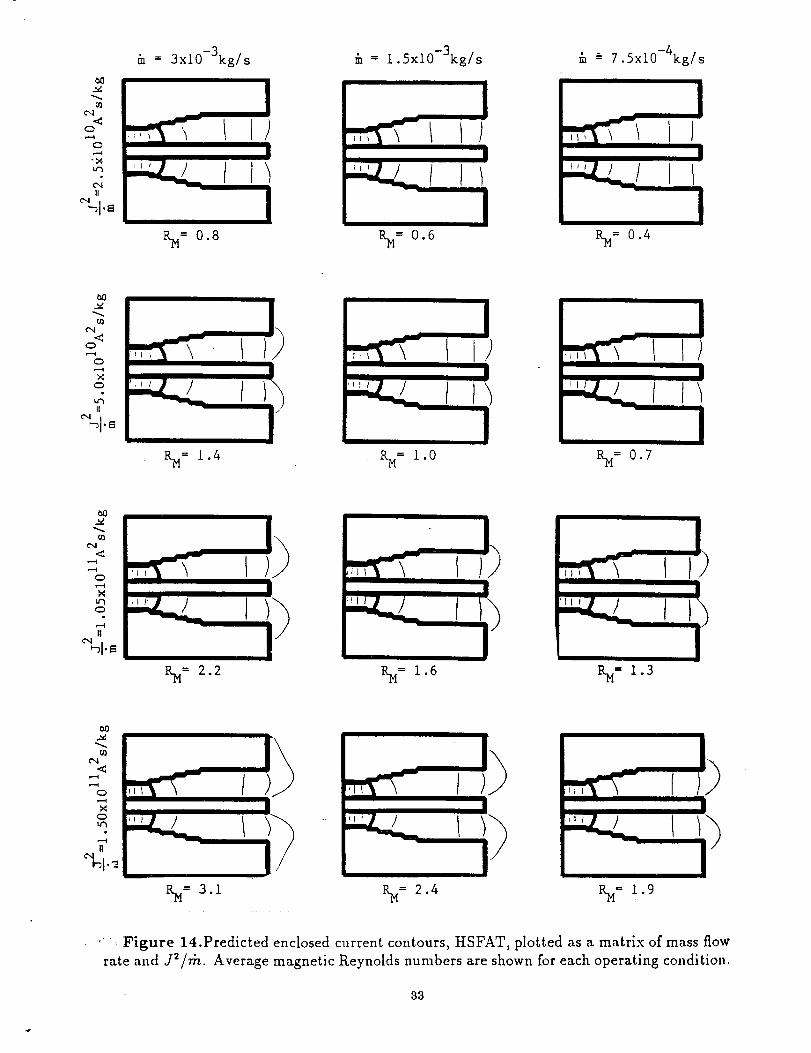
current contours are presented as a matrix of mass flow rates and J2/rh values in Figure 14. There is
littleresemblance between the measured quasi-steadycurrentdistributionsand the calculatedsteady-state
current distributions.As discussedin SectionIIla,similardifferenceswere reported by Sleziona e_ a/_s'3°
when they compared calculatedsteady-stateZT-I thruster current distributionswith quasl-steadyZP-I
thrustercurrentdistributionsmeasured under differentoperating conditionsbut similarJ2/rh. They argue
that the current preferentiallyattaches near the cathode base in pulsed, quasl-steadythrusters,and is
more evenly distributedalong the hot cathode during steady-statethruster operation; consequently,the
currentdistributionsare not expected to be comparable. The use ofdifferentoperating conditionstends to
weaken thisargument; however, both the Stuttgartcode and the LeRC code predictslgniflcantlydifferent
steady-statecurrent distributionsthan those actuallyobserved in quasi-steady thrusteroperation,while
accuratelysimulatinganode currentdistributionsinsteady-statesegmented anode thrusters.This raisesthe
issueof whether quasi-steadycurrentdistributionmeasurements accuratelyrepresentsteady-statecurrent
distributions,and the equallyvalidissueof whether numerical models which ignore electrodeprocessescan
accuratelysimulate currentdistributionswithin the thruster.
The abilityof the steady-statecode to predictthe quasl-steadyHSFAT thrust and thrustcoefficientval-
ues under a varietyof operating conditionsindicatesthat the current distributionislessimportant than
the totaldischarge current when calculatingthese global thrusterparameters, and eitherquasi-steadyor
steady-stateexperimental data may be used to verifysuch predictions.The resultsof the ZT-I thruster
modeling with and without insulatingsegments, however, indicatesthat the current distributiondoes af-
fectthe development of the plasma flow properties(temperature,pressure,etc.),and underscoresthe need
to determine whether quasl-steadythrustermeasurements are trulyrepresentativeof steady-statethruster
operation. An experimental comparison ofanode currentdistributionsand plasma plume propertiesfor a
single,segmented anode thrusteroperated under pulsed and steady-stateconditionsshould be performed
to expand upon the resultsof the StuttgartZT-I/ZP-I currentdistributionexperiments,and to determine
the extent to which plasma flow conditionsmight vary between quasi-steadyand steady-stateoperation.In
addition,e|ectrodeprocessesmust be coupled intothe numerical model to evaluate the effectofsheaths on
electrodecurrentattachment. Littleconfidencecan bc placed indetailedcomparisons between quasi-steady
plasma flow measurements and numerical steady-statefl0w predictionsuntilthese issuesare resolved.
While thrustchamber predictionsmust await validation,usefultrends can be establishedto provideinsight
into steady-statethrusteroperation. Figure 14 shows the predictedsteady-stateenclosed currentcontours
for the HSFAT fora varietyof mass flow ratesand J_/m values.The average magnetic Reynolds number
foreach case,definedby:
RM ---#,j_v_L (54)
where 5" is the average electrical conductivity, vc_ is the exhaust velocity, and L is a length parameter,taken to be the difference between the anode and cathode radius, is displayed under each figure. Typically
16
40-50%of the current is contained within the upstream straight channel section of the thruster for all cases
considered. For a given mass flow rate, a larger fraction of the discharge current is blown downstream of
the anode exit plane as J2/rh is increased. This result is commensurate with the increasing value of the
magnetic Reynolds number, which is a measure of the ratio of magnetic convection to magnetic diffusion; as
RM increases, more of the magnetic field is convected with the plasma flow. This effect is observed in Figure
14, where the enclosed current contours are equivalent to induced magnetic field streamlines (of Section IIa).For a given J2/rh, the magnetic Reynolds number decreases with decreasing mass flow rate, and the current
is pulled back into the thruster.
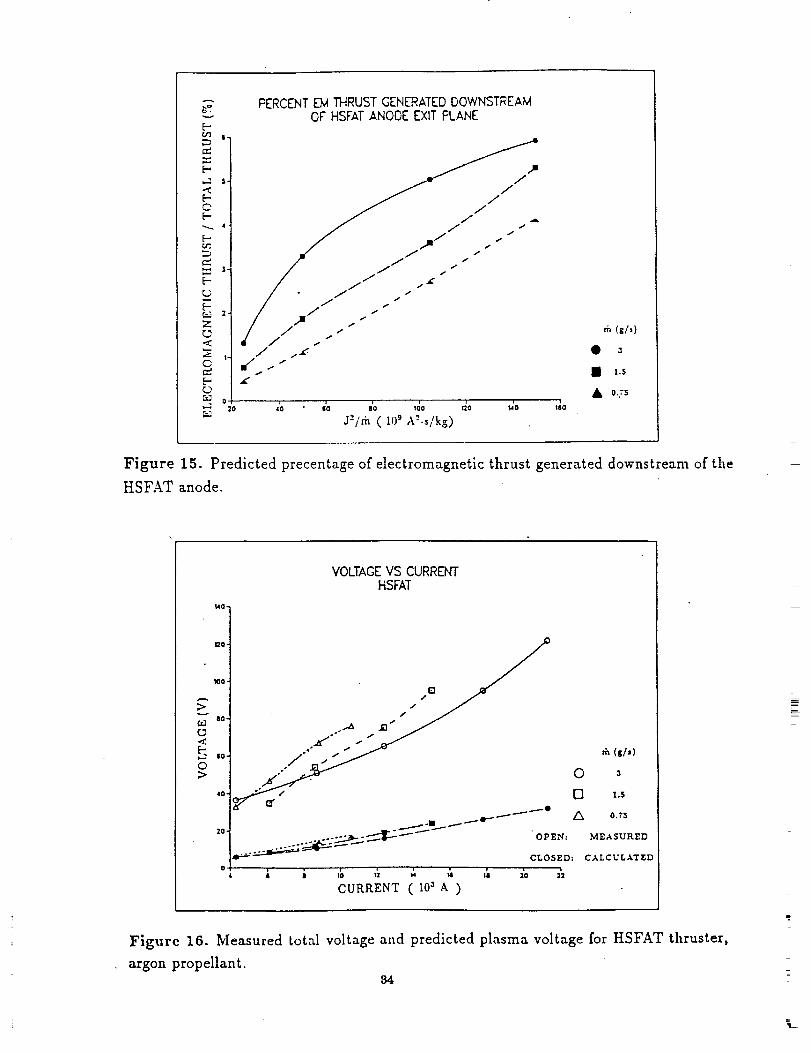
Figure 15 displays the fraction of electromagnetic thrust generated by current blown downstream of theanode exit plane for the HSFAT under the assumed steady-state operating conditions. The amount of
electromagnetic thrust produced beyond the anode exit plane increases with increasing mass flow rate and
increasing J2/rh, in agreement with the predictions of Figure 14. At 3 g/s and 1.5 × 10¹¹ AZ-s/kg, the amount
of electromagnetic thrust created downstream of the anode is nearly 6% of the total electromagnetic thrust.
Presumably this thrust is coupled through the magnetic field lines back into the thruster, but the details of
how efficiently this process might occur remain to be explored. In addition, the downstream current may
deposit thermal energy into the plume 45 rather than the chamber plasma, resulting in a loss of electrothermalthrust.
Voltage and Efficiency. The radial electric field (Eqn. 7a) was numerically integrated from cathode toanode to provide an estimate of the potential drop across the plasma. The voltage calculations do not
include fall voltages, but are still useful to predict voltage-current trends. Figure 16 shows the calculated
plasma potential drop, and the experimentally determined total discharge voltage. The calculated plasma
drop increases with increasing current, though at a slightly reduced rate compared to the total discharge
voltage. In addition, the calculated potentials reproduce the dependence on mass flow rate seen in the total
voltage measurements.
As noted in the ZT-1 thruster comparisons, the calculated plasma potential depends strongly on the value
used for the electrical conductivity. A reduced conductivity will raise the calculated value of the potential
drop across the plasma, without strongly affecting the calculated thrust. To evaluate this effect under
extreme variations, the electrical conductivity expression used in the code (Equation 3) was reduced by afactor of 10, and simulations were performed for J2/rh values of 5.1 x 101° and 1.5 × 10¹¹ A2-s/kg at a mass
flow rate of 3 g/s. Thrust values increased a modest 20% in both cases, but the plasma potentials increased
by factors of 4 to 5, bringing them close to the actual discharge voltages plotted in Figure 16. Changes in the
plasma conductivity would thus appear to have a significant impact on total voltage, but minimal impact onthe thrust. Choueiri et a_ 6 have shown that current driven instabilities may be generated in MPD thrusters,
with an attendant decrease in plasma conductivity. Under such conditions, the total discharge voltage would
be increased without a commensurate increase in thrust. The thrust efficiency, defined
where T is thrust, rh is propellant mass flow rate, and P is power, would decrease under such operating
conditions. The study of plasma instabilities and their effects on MPD thruster performance is clearly an
area which warrants further investigation.
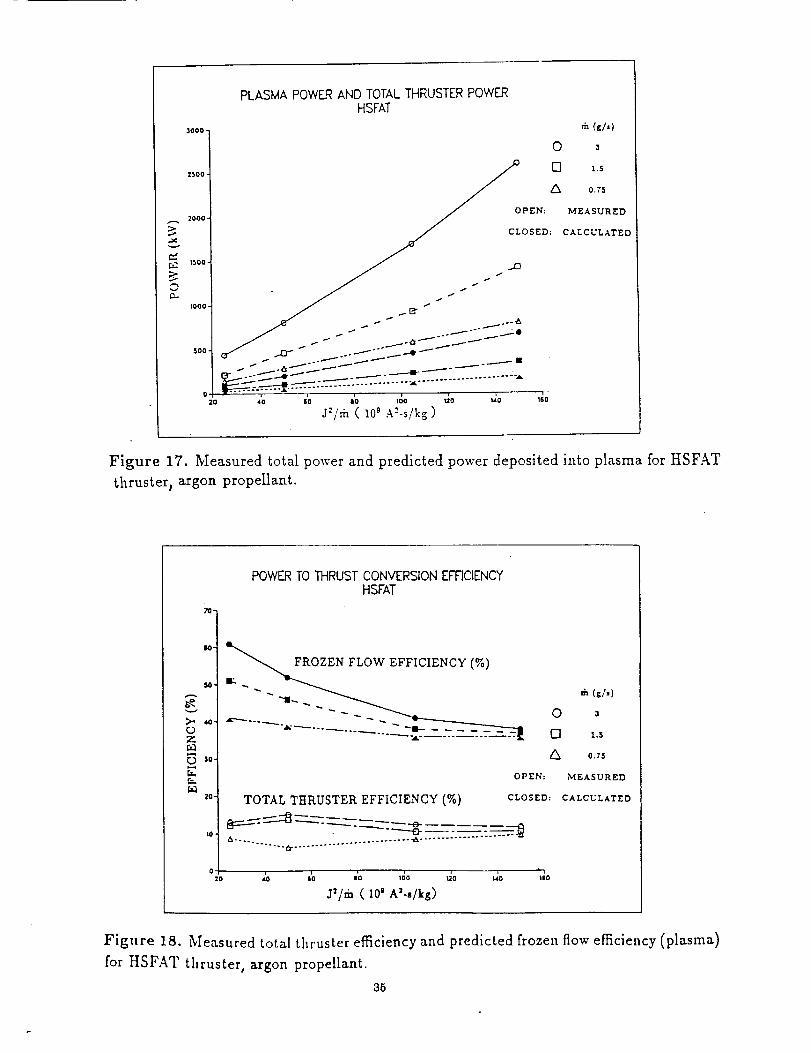
Using the potential calculations displayed in Figure 16, the amount of power deposited into the plasma
can be compared with the total thruster power, determined experimentally. Due to uncertainties in the
electrical conductivity a direct comparison is of limited use, but trends may be discerned which aid inthruster performance evaluation. Figure 17 displays the amount of power deposited into the plasma and the
total power deposited into the thruster as a function of J2/rh. The predicted trends in power with increasing
J2/rh are similar for both the total thruster power and the power deposited solely into the plasma for all mass
flow rates considered. Using the expression for efficiency defined above, both the total thruster efficiency (r_T)
and the efficiency with which power deposited in the plasma is converted to thrust (frozen flow efficiency,
17
7711), can be separately evaluated. Figure 18 displays the experimentally evaluated thruster efficiency and
the calculated frozen flow efficiency. The total thruster efficiency stays fairly fiat in the 5-15% range, with
the higher mass flow rates providing slightly higher thruster efficiencies. The frozen flow efficiencies are
highest at the lower JZ/rh values, ranging from 40% at rh=l.5 g/s to 60% at rh=3 g/s. The frozen flowefficiencies decline with increasing J2/rh, leveling out at a value around 37% at the higher J2/rh values.
Assuming a smaller value for the electrical conductivity would result in even lower frozen flow efficiencies,
because the amount of power deposited in the plasma would increase without significantly increasing thethrust. These results, while subject to the numerous approximations made in the model, predict that low
frozen flow efficiencies will limit self-field MPD thruster performance. The impact of thruster geometry and
propellant species on the frozen flow efficiency is under investigation.
IV. Concluding Remarks.
A two dimensional magnetohydrodyanamics code has been developed to predict steady-state MPD thruster
performance. The governing equations and corresponding methods of solution were outlined and discussed.
Experimental comparisons were used to evaluate model calculations for two thruster geometries over a range
of discharge currents and propellant mass flow rates. The self-field model accurately predicted thruster
performance up to j2/rh values slightly below the onset of measured voltage instabilities. Methods to
improve code performance have been outlined and discussed. Nonuniform grids should be incorporated to
better model the sharp spatial gradients in temperature and pressure near the electrode surfaces. Improved
estimates for the plasma transport coefficients and accurate electrode sheath models must be incorporated toaccurately predict plasma potentials and total discharge voltages. Issues concerning the use of quasi-steady
thruster data to verify steady-state model predictions must be addressed.
Acknowledgements
The author thanks his colleagues in the Low Thrust Propulsion Branch, NASA Lewis Research Center,
for several useful discussions concerning the physics of MPD thrusters. Special thanks to Jim Gilland for
providing his original experimental data for the HSFAT numerical comparisons.
References
1. Seikel, G. R., York, T. M., and Condit, W. C., "Applied-Field Magnetoplasmdynamic Thrusters for Orbit-
Raising Missions", in Orbit-Raising and Maneuvering Propulsion: Research Status and Needs, Caveny, L. H.
(ed), Progress in Astronautics and Aeronautics, vol. 89, 1984, pp. 260-286.
2. Gilland, J. H., Myers, R. M., and Patterson, M. J., "Multimegawatt Electric Propulsion System De-
sign Considerations", AIAA Paper No. 90-2552, presented at the 21 _t International Electric PropulsionConference, July 18-20, 1990, Orlando, FL.
3. Sovey, J. S. and Mantenleks, M. A., "Perfromance and Lifetime Assessment of MPD Arc Thruster Tech-
nology", AIAA Paper No. 88-3211, presented at the 24 tu Joint Propulsion Conference, July 11-13, 1988,
Boston, MA.
4. Myers, R. M., Mantenieks, M. A., and Sovey, J. S., "Geometric Effects in Applied-Field MPD Thrusters",
AIAA Paper No. 90-2669, presented at the 21 ,t International Electric Propulsion Conference, .July 18-20,
1990, Orlando, FL.
18
5. Tahara,H.,Yasui,H.,Kagaya,Y.,andYoshikawa,T., "ExperimentalandTheoreticalResearchesonArcStructurein a Self-FieldThruster",AIAA PaperNo.87-1093,presentedat the19th International Electric
Propulsion Conference, May 11-13, 1987, Colorado Springs, CO.
6. Hugel, H., "Effect of Self-Magnetic Forces on the Anode Mechanism of a High Current Discharge", IEEE
Transactions on Plasma Science, PS-8(4), December 1980, pp. 437-442.
7. Lawless, J. L. and Subramaniam, V. V., "Theory of Onset in Magnetoplasmadynamic Thrusters", J.
Propulsion and Power, 3(2), March-April 1987, pp. 121-127.
8. Subramaniam, V. V. and Lawless, J. L., "Electrode-Adjacent Boundary Layer Flow in Magnetoplasma-
dynamic Thrusters", Phys. Fluids, 31(1), January 1988, pp. 201-209.
9. Niewood, E., Preble, J., Hastings, D., and Martinez-Sanchez, M., "Electrothermal and Modified TwoStream Instabilities in MPD Thrusters", AIAA Paper No. 90-2607, presented at the 21 't International
Electric Propulsion Conference, July 18-20, 1990, Orlando, FL.
10. Rempfer, D., Auweter-Kurtz, M., Kaeppeler, H. J., and Maurer, M., "Investigation of Instabilities inMPD Thruster Flows Using a Linear Dispersion Relation", IEPC Paper No. 88-071, presented at the 20 eh
International Electric Propulsion Conference, October 3-6, 1988, Garmisch-Partenkirchen, W. Germany.
11. Wagner, H. P., Auweter-Kurtz, M., Roesgen, T., Messerschmid, E. W., and Kaeppeler, H. J., "Gradient
Driven Instabilities in Stationary MPD Thruster Flows", AIAA Paper No. 90-2603, presented at the 21 't
International Electric Propulsion Conference, July 18-20, 1990, OrIando, FL.
12. Nerheim, N. M. and Kelley, A. J., "A Critical Review of the State-of-the Art of the MPD Thrustor",
AIAA Paper No. 67-688, presented at the AIAA Electric Propulsion and Plasmadynamics Conference,
September 11-13, 1967,Colorado Springs, CO.
13. Martinez-Sanchez, M. and Hastings, D., "Physical Processes in MPD Plasmas", AFOSR-TR-89-1275,
Final Report to AFOSR/NA, July 19, 1989.
14. Morozov, A. I., "Principle of Coaxial (Quasi-)Steady-State Plasma Accelerators", Soy. I. Plasma Phys.,
16(2), February 1990, pp. 69-78.
15. Niewood, E. and Martinez-Sanchez, M., "Quasi One-Dimensional Numerical Simulation of Magnetoplas-
madynamic Thrusters", AIAA Paper No. 90-2604, presented at the 21 't International Electric PropulsionConference, July 18-20, 1990, Orlando, FL.
16. Auweter-Kurtz, M., Kurtz, H. L., Schrade, H. O., and Sleziona, P. C., "Numerical Modeling of the
Flow Discharge in MPD Thrusters", AIAA Paper No. 87-1091, presented at the 19 th International Electric
Propulsion Conference, May 11-13, 1987, Colorado Springs, CO.
17. Auweter-Kurtz, M., Glaser, S. F., Kurtz, H. L., Schrade, H. O., and Sleziona, P. C., "An Improved Codefor Nozzle Type Steady State MPD Thrusters", IEPC Paper No. 88-040, presented at the 20 th International
Electric Propulsion Conference, October 3-6, 1988, Garmisch-Partenkirchen, W. Germany.
t8. Kurtz, H. L., Auweter-Kurtz, M., and Schrade, H. O., "Self-field MPD Thruster Design - Experimentaland Theoretical Investigations", AIAA Paper No. 85-2002, presented at the 18 th International Electric
Propulsion Conference, 1985, Alexandria, VA.
19
19. Krulle,G., "TheoreticalTreatmentof Current,MassFlow,andRelatedDistributionsinMPDPlumes",AIAA PaperNo. 72-501,presentedat theAIAA 9th Electric Propulsion Conference, April 17-19, 1972,
Bethesda, MD.
20. Chanty, J. M. G. and Martinez-Sanchez, M., "Two-Dimensional Numerical Simulation of MPD Flows",
AIAA Paper No. 87-1090, presented at the 19 th International Electric Propulsion Conference, May 11-13,
1987, Colorado Springs, CO.
21. Tahara, H., Yaasui, H., Kagaya, Y., and Yoshikawa, T., "Experimental and Theoretical Researches onArc Structure in a Self-Field Thruster", AIAA Paper No. 87-1093, presented at the 19 th International
Electric Propulsion Conference, May 11-13, 1987, Colorado Springs, CO.
22. Minakuchi, H. and Kuriki, K., "M'agnetoplasmadynamic Analysis of Plasma Acceleration", AIAA Paper
No. 84-06, presented at the 17 th International Electric Propulsion Conference, May 28-31, 1984, Tokyo,
Japan.
23. Martinez-Sanchez, M., "Structure of Self-Field Accelerated Plasma Flows", J. Propulsion and Power,
7(1), Jan-Feb 1991, pp.56-64.
24. Kurikl, K., Kunil, Y., and Shimizu, Y., "Idealized Model for Plasma Acceleration in an _MHD Channel",
AIAA Journal, 21(3), March 1983, pp. 322-326.
25. Park, W. and Choi, D., "Numerical Analysis of MPD Arcs for Plasma Acceleration", IEEE Transactions
on Plasma Science, PS-15(5), October 1987.
26. Sleziona, P. C., Auweter-Kurtz, M., Schrade, H. O., and Wegrnann, T., "Comparison of Numerical and
Experimental Investigations of Nozzle Type MPD Accelerators", AIAA Paper No. 90-2663, presented at the
21 °t International Electric Propulsion Conference, July 18-20, 1990, Orlando, FL.
27. Seals, R. K. and Hassan, H. A., "Analysis of MPD Arcs with Nonequilibrium Ionization", AIAA Journal,
bf 6(12), December 1968, pp. 2273-2278.
28. Sleziona, P. C., Auweter-Kurtz, M., and Schrade, H. O., "Numerical Codes for Cylindrical MPDThrusters", IEPC Paper No. 88-038, presented at the 20 th International Electric Propulsion Conference,
October 3-6, 1988, Garmisch-Partenkirchen, W. Germany.
29. Mayer, W., "Numerische Berechnung der Stremung im Zylindrischen MPD-Triebwerk mlt einen Finiten-
Volumen-Verfahren", Universitat Stuttgart, Dec 1989, Dissertation pp. 1-62, W. Germany.
30. Sleziona, P. C., Auweter-Kurtz, M., and Schrade, H. O., "Numerical Evaluation of MPD Thrusters",
AIAA Paper No. 90-2602, presented at the 21 't International Electric Propulsion Conference, July 18-20,
1990, Orlando, FL.
31. Slezlona, P.C., Universitat Stuttgart, Germany; personal communication, August, 1990.
32. Auweter-Kurtz, M., Universitat Stuttgart, Germany; personal communication, March, 1991.
33. Tanaka, M. and Kimura, I., "Current Distribution and Plasma Acceleration in MPD Arcjets with Applied
Magnetic Fields", J. Propulsion and Power, 4(5), Sept-Oct 1988, pp. 428-436.
2O
34. Sutton,G.W.andSherman,A.,Engineering Magnetohydrod!mamics, McGraw-Hill Book Co., New York,1965.
35. Hughes, W. F. and Young, F. J., The Electromagnetodynamics of Fluids, J. Wiley & Sons, pub., New
York, 1968, pp. 5-7.
36. Choueiri, E. Y., Kelley, A. J., and Jahn, R. G. ,"Current Driven Instabilities of an Electromagnetically
Accelerated Plasma", IEPC Paper No. 88-042, presented at the 20 _h International Electric Propulsion
Conference, October 3-6, 1988, Garmisch-Partenkirchen, W. Germany.
37. Cambel, A. B., Plasma Physics and Magnetofluidmechanics, McGraw-Hill Book Co., New York, 1963.
38. Greenspan, D. G., Discrete Numerical Methods in Physics and Engineering, Academic Press, New York,1974.
39. Kurtz, H. L., Auweter-Kurtz, M., Glocker, B., Habiger, H., Merke, W., and Schrade, H. O., "CylindricalSteady-State MPD Thruster", IEPC paper 88-025, presented at the 20 th International Electric Propulsion
Conference, October 3-6, 1988, Garmisch-Partenkirchen, W. Germany.
40. Gilland, J. H., Kelley, R. A., and Jahn, R. G., "MPD Thruster Scaling", AIAA Paper No. 87-0997,
presented at the 19 th International Electric Propulsion Conference, May 11-t3, 1987, Colorado Springs, CO.
41. Gilland, J. H., "The Effect of Geometrical Scale Upon MPD Thruster Behavior", M.S. Thesis No. 1811-
T, Department of Mechanical and Aerospace Engineering, Princeton University, Princeton, N J, March 1988.
42. Auweter-Kurts, M., Glocker, B:, Kurtz, H. L., Loesener, O., Schrade, H. O., Tubanos, N., Wegmann, T.,
Willer, D., and Polk, J., "Cathode Phenomena in Plasma Thrusters", AIAA Paper No. 90-2662, presentedat the 21 *t International Electric Propulsion Conference, July 18-20, 1990, Orlando, FL.
43. Jahn, R. G., Physics of Electric Propulsion, McGraw-Hill Book Co., New York, 1968, pp. 241-246.
44. Wolff, M., "A High Performance MPD Thruster", M.S.E. Thesis, Princeton University, Princeton, N.],Oct. 1983.
45. Myers, R. M., "Plume Characteristics of MPD Thrusters: A Preliminary Examination", AIAA PaperNo. 89-2832, presented at the 25 *h Joint Propulsion Conference, July 10-14, 1989, Monterey, CA. NASA
CR-185130, September 1989.
21
PROPELL_NT'_
CATHODE CURRENT
-__.. /STREAMLINES% ,_--
F,ELO ..?:_.-_'_4; :"
" "".":'"" ANODE " i
- . , .
Figure 1. Self-field MPD thruster diagram.
lProgram Outline I
(Conservation of mass .-', density(p)
l Conservation of momentum --->velocity (Vr ,Vo ,Vz) ] Fluid loopI Conservation of energy --> temperature (m)
I Equation of state --> pressure (P)
LEvaluate transport coeffs, hall parameters, etc... ) /
Field loop I Maxwell (Ampere's) equation -_ current density (l)JOhm s law --> electric field (E --_ plasma potential)
valuate energy source, sink terms, etc-.
[i rConvergence on exhaust velocity V_* < 0.01 V oJdeI¢ ;
l Iplasmapotentiah_._,,_<0.01_o_d)
L[No [ Ve S_'_rEvaluate" \l DoneWriteto datathrust'filesSpecificimpulse, efficiency,... 1
Figure 2. MPD thruster program outline.
22
!
Figure 3(a). ZT-1 thruster schematic
IE
_,J
120
9O
6O
3O o J.oJ. o.0
0 60 120
Z Cmm]
1
180
Figure 3(b). U. Stuttgart enclosed current predictions. Contour levels every 10%.
Figure 3(c). NASA LeRC enclosed current predictions. Contour levels every 10%.
Figure 3. Predicted enclosed current contour comparisons for the ZT-1 thruster operat-ing at 6000 A, 6 g/s, argon propellant.
28
• CATHO "i
-,
4(a). T (K)
4(b). ln[P/Po]
INSULATOR
i il
I I
INSULATORii
ri i i _.0¢
CATHODE ,-- _ -__ j
_-3.0C- :"
4(c), ln[p/po]
Figure 4. Predicted (a) temperature, (b) pressure, and (c) density contours for ZT-1
thruster at 6000 A, 6 g/s, argon propellant. Pressure and density are normalized to inlet
values: Po=l.lxl0aN/m =, po=l.8×10 -a kg/m a. Plots (b) and (c) are loglo of normalizedvalues.
24
4(d). ¢ (V)
4(e). Mach #
4
Z
o
o0.-
.._I_C
#SJ_rs_sJ_
INSULATOR j ANODE ............
CATHODE If" i l
16 18 200 2 4 6 8 10 12 14 22
AXIALPOSITION(cM)
4(f). Flow
Figure 4, cont. Predicted (d) electric potential, (e) Mach number, and (f) velocity flow
distribution for ZT-1 thruster operating at 6000 A, 6 g/s.
2B
5(a). T (K)
,i
ANODE ANODE ANODE ANODE ANODE _ "_ _ -_J
_ , _ r _ _- '_ _i _ : _ " _ _
CATHODE -- -
_DE I, ANODE | ANODE | ANODE _'_.0_-.,_
5(b). ln[P/Po]
CATHODE 5(c). In[p/po]
Figure 5. Predicted (a) temperature, (b) pressure,and (c) density contours for ZT-I
thruster without insulated anode segments, operating at 6000 A, 6 g/s, argon propellant.
Pressure and density are normalized to inletvalues:P0=l.l x 103N/m =,p0=l.Sx 10-3 kg/m _.
Plots (b) and (c) are loglo of normalized values.
26
s(d). _ (V)
ANODE ANODE ANODE ANODE ANODE [
CATHODE
ANODE ANODE ANODE ANODE ANODE
5(e). Mach #
5-
_-- 4-
v
Z
O
3Oa_
_J
<f
O
rv 2
ANODE
tlsllJJll//s
tlstttsSs/Is
IIIIISSSSIS_
II11SS111tll
I
• Ji .° IS ISJS _
CATHODE
5(f). Flow
0 5 25i0 15
AXIAL POSITION(CM)
Figure 5, cont. Predicted (d) electric potential, (e) !_l"ach number, and (f) velocity flow
distribution for ZT-1 thruster without insulated anode segments, operating at (3000 A, 6 g/s.
27
ANODE
t0.9
ANODE ANODE _NODE
I0.9ANODE ANODE ANODE
CATHODE
ANODE ANODE
Figure 5(g) Predicted enclo'sed current contours for the ZT-1 thruster without insulating
anode segments, operating at 6000 A and 6 g/s, argon propellant.
!.I
10_m
!.7 cm
2.5 cm I1.6 cm [_////////////////,L&_ ,7_ .
.10 cm- I
Figure 6. Half-scale flared anode thruster (HSFAT) diagram.
28
70-
|0-
50-
Z" 40-v
u9
E-2{I-
I0-
O l2
HALF SCALE FLAREDANODE THRUSTERTHRUSTCHARACTERISTICS
o9%
_o •
_o_ _ • /_ " 0.75
0 OPEN: MEASURED
]t_ _ " CLOSED: CALCULATED
A
CURRENT ( i0_ A)
Figure 7. HSFAT thrust characteristics, argon propellant.
CAtCULATED ELECTROMAGNETIC AND TOTAL THRUSTHSFAT
4_ m D
'°i3o]
E
_2_ 1 _/" /// = (,/,)
1:9" _ OPEN: TOTAL THRUST
...... _ CLOSED: EM THRUST,_J "°'_"'"
J:,/rh ( 10_ A--s/kg)
Figure 8. Calculated electromagnetic and total thrust for HSFAT,
29
argon propellant.
HALF SCALE FLARED ANODE THRUSTERTHRUST COEFFICIENT
0.| ",
8os-I 0
0
,," o
"_" o.*'l C°Z )
c?i
"-" .e, 0.4 "t
b.m o.-_q
ew
o.+-4
(e/s)
0 3
[] 1.5
,/_ 0.75
OPEN: MEASURED
CLOSED: CALCULATED
o I ' ,:o ,"oo _o ,'o ,'o & _, ,_ -o
J'/m ( i0" .A-'-s/kg)
Figure 9. HSFAT thrust coemcients, argon propellant.
O-|-I
o.i-!I
0.7-1I,t
i_ o._-I
1
,'-' 0.._"I
r,lO.4H
0.I-
HALF SCALE FLARED ANODE THRUSTERTHRUST COEFFICIENT
Figure 10.
dependence.
o
o
o
o m (s/')o •
o DO 0
_e 0 1.50,9
" _88 @ S _ O.TSO 0 OPEN: MEASURED
i I'I_o_ . CLOSED: CALCULATED
0 "
CURRENT ( 10aA)
HSFAT thrust coefllcients plotted against current to show mass flow rate
80
,¢-,,..,.¢
T
P,l
[..-,
w--.[...,
OJ"l
0.7-'[,
0.6..4
o+
0 x .I
0,.2 ..
o.1-
0.0
o
CALCULATED THRUST COEFFICIENTHALF-SCALE FLARED ANODE THRUSTER
l
• l • l I
,'o Zo +'o .'o ,,_o rio Go .,_o,,,j/ •J',m (109 A2-s/kg)
THRUST:
• [_I O_LY
• TOTAL
Figure 11. HSFAT electromagnetic and total thrust coefEcients
PERCENT VISCOUS DRAG TO TOTAL THRUSTHSFAT
[-,
©E-"
0
0
0[.3
i
z_
A
J
J
J
/
J
i J/ j .
" 7
X_ • 3• 0.T5
Sl•o ;o ,; ;o ,_o _o do ,_o.
a'l,k ( tO+' a'-+/kg)
Figure 12. Ratio of viscous drag to total thrust, HSFAT thruster, argon propellant.
81
AN_)DE
/ CATHODE
0 5 I 0
(a) 7.9 kA, 3 g/s (2.1 x 101° Ats/kg
ANODE
,oL,o'...)I /_?az it,'.
/ CATHODE
"0 5 IO
(b) 17.8 kA, 3 g/s (1.05xlO n A2-s/kg)
Figure 13. Measured enclosed current contours, HSFAT, argon propellant.
82
C_0
¢q
O,--d
t¢3
¢qII
= 3xl0-3kg/s = 1.5xl0-3kg/s
RM= 0.8 RM= 0.6 RM= 0.4
m 7.Sxl0-4kg/s
_0
¢q
O
ED
II
RM 1.4 RM: 1.0 RM: 0.7
¢q
<
Oo
I!
RM: 2.2 RM= 1.6 RM: 1.3
¢,q
II
• .I
i_i= 3.1 RM= 2.4 RM= 1.9
" _-Figure 14.Predicted enclosed current contours, HSFAT, plotted as a matrix of mass flow
rate and J2/rh. Average magnetic Reynolds numbers are shown for each operating condition.
88
PERCENT EM THRUST GENERATED DOWNSTREAMOF HSFATANODE EXITPLANE
E-
• ,t
0
L
/'/ .i I
<
C I
E- I._
lOO _0
J-_/m ( lo' A_--_/kg)
r_ (zl,)
• 3
• 1.5
• 0.rs
Figure 15. Predicted precentage of electromagnetic thrust generated downstream of the
HSFAT anode.
>v
r.,.l
<
O>
1,10-,
120
I00
80.
i0.
o
VOLTAGE VS CURRENq"HSFAT
I
., .. rh (_;/')
[] 1.5
_ e......- ---" ''" '''- @ _ 0.1"$
.....--_._-: _-------_---'-" op_.- MEASUreD_" "_ CLOSED: CALCULATED
CURRENT (103 A )
Figure 16. Measured total voltage and predicted plasma voltage for HSFAT thruster,
argon propellant.34
_t
Oe--,
3000
2_00
2000 -
1500 -
OOit50
20
PLASMA POWERAND TOTALTHRUSTERPOWERHSFAT
,_ (g/,)
0
0 1.$
0.7,5
PEN: MEASURED
// :OSED: CALCULATED
. _ ......_D
-_2.11f . ... _ - - IL::_ _
if--" -_: ----=!_.... --_- --: .................... :_'"
410 i0 80 I00 120 I_.0 160
,]:/,-b. ( lo9 A-%/kg )
Figure 17. Measured total power and predicted power deposited into plasma for HSFAT
thrusterj argon propellant.
POWERTO THRUSTCONVERSIONEFFICIENCYHSFAT
.*°' _CIENCY. (%).-. _ (gl,}
_ 0 -,
r.D "_"'"--"--.b.-_ .... - _ _ _ E] I.,5Z
30 A 0.;5
['_ OPEN: MEASUREDf_
2o TOTAL THRUSTER EFFICIENCY (%) CLOSED: CALCUL*TED
,o _--= _--_-__--: _- _--:___._ ...................... _ ........................... "_. ............
0 i ,
J'l= ( i0' A'-,/_g)
Figure 18. /VIeasured total thruster efficiency and predicted frozen flow e_ciency (plasma)
for HSFAT thruster, argon propellant.
85
N/ ANaflon_ Aerormu_csandSpace Administration
Report Documentation Page
1. Report No. NASA CR-187168 2. Government Accession No.
AIAA- 91-2341
4. Tdle and Subtitle
Numerical Simulation of Self-Field MPD Thrusters
7. Author(s)
Michael R. LaPointe
9. Performing Organization Name and Address
Sverdrup Technology, Inc.Lewis Research Center Group
2001 Aerospace ParkwayBrook Park, Ohio 44142
12. Sponsoring Agency Name and Address
National Aeronautics and Space AdministrationLewis Research Center
Cleveland, Ohio 44135-3191
3. Recipient's Catalog No.
5. Report Date
6. Performing Organization Code
8, Performing Organization Report No.
E- 6440
10. Work Unit No.
506-42-31
11. Contract or Grant No.
NAS3 - 25266
13, Type of Report end Period Covered
Contractor ReportFinal
14. Sponsoring Agency Code
t5. Supplementary Notes
Project Manager, James S. Sovey, Space Propulsion Technology Division, NASA Lewis Research Center,
(216) 433 -2420. Prepared for the 27th Joint Propulsion Conference cosponsored by the AIAA, SAE, ASMEand ASEE, Sacramento, California, June 24-27, 1991.
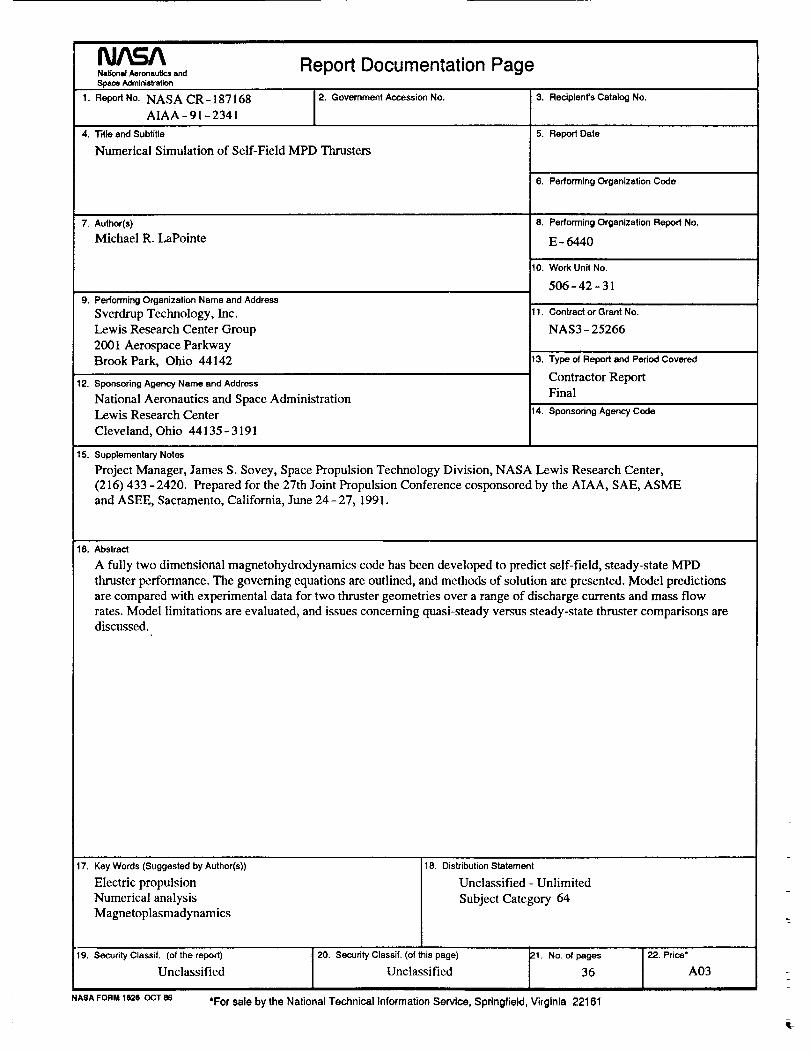
16. Abstract
A fully two dimensional magnetohydrodynamics code has been developed to predict self-field, steady-state MPD
thruster performance. The governing equations are outlined, and methods of solution are presented. Model predictionsare compared with experimental data for two thruster geometries over a range of discharge currents and mass flow
rates. Model limitations are evaluated, and issues concerning quasi-steady versus steady-state thruster comparisons arediscussed.
17. Key Words (Suggested by Author(s))
Electric propulsion
Numerical analysisMagnetoplasmadynamics
18. Distribution Statement
Unclassified - Unlimited
Subject Category 64
19. Security Classif. (of the report) 20. Secud'ty'Ciassii_"(of this page) 21. No. of pages
Unclassified Unclassified 36
I ]T ! m
NASAFORM1§26OCT86 *For sale bythe National TechnicalInformationService, Springfield, Virginia 22161
22. Price*
A03
(-