Embed Size (px)
Citation preview
IT Services Availability Management
T.A. Critchley Ph. D.
The Management, Design, Theory and Practice of 'Keeping the IT Service on the Road ' ; a Source Book
for IT management, IT gurus, Computer Science Students and their instructors ; Instruction in the
Basics for any people who know less about this topic than I do.
Failure When Your Best Isn't Good enough
Availability Management Part I
PART I
AN AVAILABILITY PRIMER
'theirs not to reason why, theirs but to do and die ....' 1
1 Alfred Lord Tennyson, 'The Charge of the Light Brigade'.
In the 1960s I was teaching physics at a night class, subject refractive index µ. I was sailing along on the topic, throwing sin i and sin r about like confetti, when a student stopped me and asked 'So what? Who cares?'. I realised then that the student had taught me one of the most important things about teaching and writing - the 'so what' test. I explained the importance of µ in optics and optical devices of many kinds - he was placated and peace was restored. In this Part of the book, we cover some of the basic concepts of reliability and availability and, more importantly, the 'why' of seeking high availability. Several concepts are mentioned briefly initially but are covered in more detail later in the book or through external sources referenced. This might be in a later section or an Appendix, particularly the Terminology section. I believe this is the best way to learn - looking at something from different perspectives over a period instead of wading through the same detail time after time. It is akin to learning the layout of a town by examining it from different viewpoints (car, walking, helicopter, map, talking to a resident) instead of tramping up and down the High Street all day long. It works, believe me. As a result, there is some repetition in this book, mainly deliberate, to introduce a topic, expand upon it and, in the main, provide references for it. For any accidental repetition, my apologies.
Availability Management Chapter 1
CHAPTER 1
Preamble: A View From 30,000 Feet Do you know ...? 1. The difference between resilience and reliability? 2. How to calculate the increase in reliability by adding a parallel component? 3. How to break up a server/network combination into physical domains for availability
calculations? 4. What percentage of (recorded) outages are due to hardware failure? 5. What non-hardware factors cause outages? Can you name a dozen? 6. How a system can be ‘down’ when all components are working? 7. The full breadth of what needs to be considered when designing and operating high
availability services? 8. Enough about high availability to mentor someone in it? To tutor your boss? 9. What Lusser says about series components and reliability? 10. What Amdahl's/Gunther's/Gustafson's Laws all about? If your answer to all the questions is yes, read no further and go out and play golf or drink beer (or both). If any answers are no, please read on.
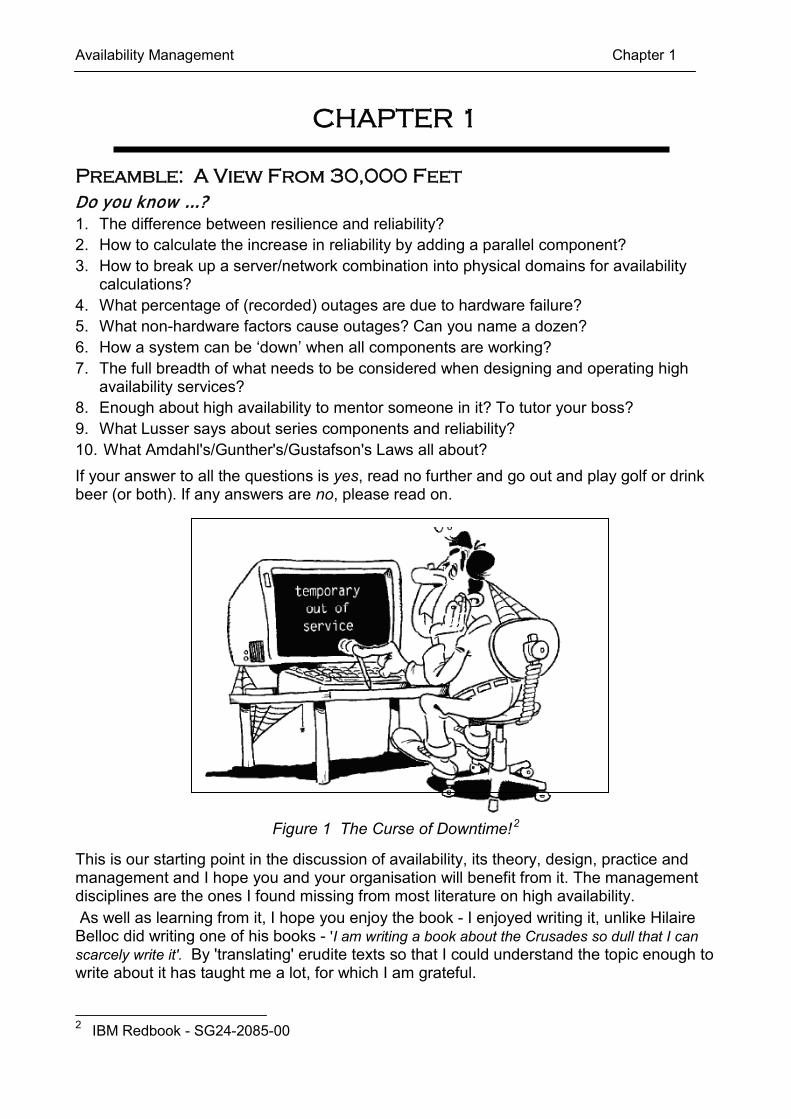
Figure 1 The Curse of Downtime!
2
This is our starting point in the discussion of availability, its theory, design, practice and management and I hope you and your organisation will benefit from it. The management disciplines are the ones I found missing from most literature on high availability. As well as learning from it, I hope you enjoy the book - I enjoyed writing it, unlike Hilaire Belloc did writing one of his books - 'I am writing a book about the Crusades so dull that I can scarcely write it'. By 'translating' erudite texts so that I could understand the topic enough to write about it has taught me a lot, for which I am grateful. 2 IBM Redbook - SG24-2085-00
Availability Management Chapter 1
Availability in Perspective Availability seems an obvious entity to comprehend. In IT terms, it is a presence of a working component or system and performing its job as specified. It has two connotations;
• is it working or not ? • what percentage of time is it working according to specification? • what specification is classed as working?
Murphy's Law of Availability This apparently immutable law, often called 'The 4th Law of Thermodynamics', states 'If anything can go wrong, it will'. Hopefully, since the Law is probabilistic, this book will help to minimise the impact of this law, certainly in the case of IT services and supporting systems. See Appendix 1 for the relationship between Murphy's and Sod's Laws.
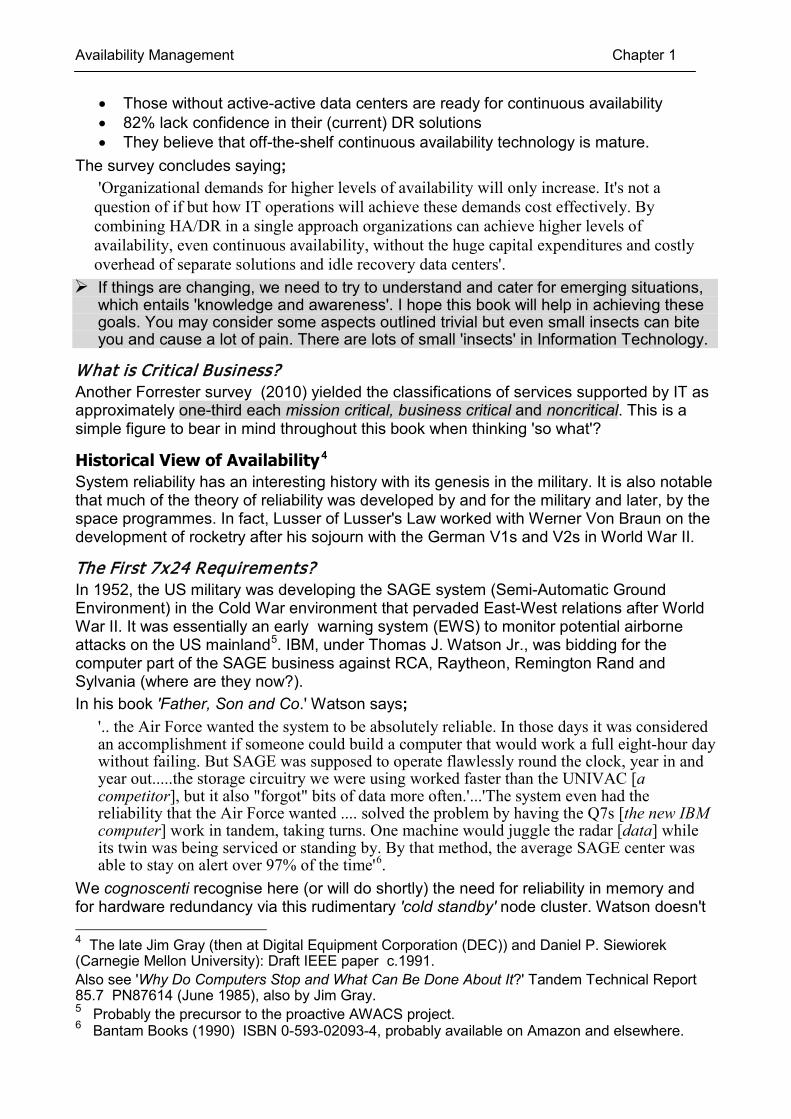
Availability 'Drivers' in Flux Until recently, the focus on high availability was hardware and software. There is a change in the need for high availability, and the reasons for lack of it, as perceived by businesses and reported in a paper by Forrester Research. It is dated February 2013 and titled 'How Organizations are Improving Business Resiliency With Continuous IT Availability' 3. The report indicates a shift in the types of risks which businesses see as affecting the availability of their applications and services. These are outlined below, the result of surveying 246 global 'business continuity decision makers'.
Driver of Increased Risk [to Availability] % of Responses Increased reliance on technology 48 Business complexity of our organisation 37 Frequency/intensity of natural disasters/weather 36 Increased reliance on third parties 33 Increased regulatory requirements 26 Increased threat of cyber attacks 25 Age of facility/data center infrastructure 16 Geographic distribution of our organization 15 Financial instability 14 Political and social instability 12 Power and fuel shortages/scarcity/outages 7 Increased frequency/risk of epidemics/pandemics 5 Other 5
Table 1 Top Risks to Business Services Availability
The outcome of these concerns is as follows; • Upgrading Business Continuity (BC)/Disaster Recovery (DR) is seen as a top IT
priority (61% say 'high/critical') • Improving BC/DR drives the adoption of x86 virtualization (55% say 'very important') • Many organizations have already adopted active-active configurations (see
Clusters) • Continuous availability achieves both operational and financial benefits
3 http://www.emc.com/collateral/analyst-report/forrester-improve-bus-resiliency-continuous-it-avail-ar.pdf - commissioned by EMC Corporation.
Availability Management Chapter 1
• Those without active-active data centers are ready for continuous availability • 82% lack confidence in their (current) DR solutions • They believe that off-the-shelf continuous availability technology is mature.
The survey concludes saying; 'Organizational demands for higher levels of availability will only increase. It's not a question of if but how IT operations will achieve these demands cost effectively. By combining HA/DR in a single approach organizations can achieve higher levels of availability, even continuous availability, without the huge capital expenditures and costly overhead of separate solutions and idle recovery data centers'.
If things are changing, we need to try to understand and cater for emerging situations, which entails 'knowledge and awareness'. I hope this book will help in achieving these goals. You may consider some aspects outlined trivial but even small insects can bite you and cause a lot of pain. There are lots of small 'insects' in Information Technology.
What is Crit ical Business? Another Forrester survey (2010) yielded the classifications of services supported by IT as approximately one-third each mission critical, business critical and noncritical. This is a simple figure to bear in mind throughout this book when thinking 'so what'?
Historical View of Availability
4
System reliability has an interesting history with its genesis in the military. It is also notable that much of the theory of reliability was developed by and for the military and later, by the space programmes. In fact, Lusser of Lusser's Law worked with Werner Von Braun on the development of rocketry after his sojourn with the German V1s and V2s in World War II.
The First 7x24 Requirements? In 1952, the US military was developing the SAGE system (Semi-Automatic Ground Environment) in the Cold War environment that pervaded East-West relations after World War II. It was essentially an early warning system (EWS) to monitor potential airborne attacks on the US mainland5. IBM, under Thomas J. Watson Jr., was bidding for the computer part of the SAGE business against RCA, Raytheon, Remington Rand and Sylvania (where are they now?). In his book 'Father, Son and Co.' Watson says;
'.. the Air Force wanted the system to be absolutely reliable. In those days it was considered an accomplishment if someone could build a computer that would work a full eight-hour day without failing. But SAGE was supposed to operate flawlessly round the clock, year in and year out.....the storage circuitry we were using worked faster than the UNIVAC [a competitor], but it also "forgot" bits of data more often.'...'The system even had the reliability that the Air Force wanted .... solved the problem by having the Q7s [the new IBM computer] work in tandem, taking turns. One machine would juggle the radar [data] while its twin was being serviced or standing by. By that method, the average SAGE center was able to stay on alert over 97% of the time'6.
We cognoscenti recognise here (or will do shortly) the need for reliability in memory and for hardware redundancy via this rudimentary 'cold standby' node cluster. Watson doesn't 4 The late Jim Gray (then at Digital Equipment Corporation (DEC)) and Daniel P. Siewiorek (Carnegie Mellon University): Draft IEEE paper c.1991. Also see 'Why Do Computers Stop and What Can Be Done About It?' Tandem Technical Report 85.7 PN87614 (June 1985), also by Jim Gray. 5 Probably the precursor to the proactive AWACS project. 6 Bantam Books (1990) ISBN 0-593-02093-4, probably available on Amazon and elsewhere.
Availability Management Chapter 1
say anything about how the data was shared in those pre-SAN, pre-NAS and pre-switch days, or how fast the switchover time was, but they blazed the system 'availability' trail nevertheless.
Jim Gray had to say about the 'old days': ‘Computers built in the late 1950's offered twelve-hour mean time to failure. A maintenance staff of a dozen full-time customer engineers could repair the machine in about eight hours. This failure-repair cycle provided 60% availability. The vacuum tube and relay components of these computers were the major source of failures; they had lifetimes of a few months. Therefore, the machines rarely operated for more than a day without interruption. Many fault detection and fault masking techniques used today were first used on these early computers. Diagnostics tested the machine. Self-checking computational techniques detected faults while the computation progressed. The program occasionally saved (checkpointed) its state on stable media. After a failure, the program read the most recent checkpoint, and continued the computation from that point. This checkpoint/restart technique allowed long-running computations to be performed by machines that failed every few hours’.
Things have certainly changed since then but my main thesis in this document is that ‘man cannot live by hardware alone’, a view supported by the Forrester survey outlined above. Logical errors and general ‘finger trouble’ (by liveware) will sometimes outsmart any ‘NeverFallsOver’ and ‘Semper Availabilis’ vendors' hardware and software products. The ham-fisted or under-skilled operator can knock almost any system over. A new up-and-coming contender for 'tripping up' systems is malware which is now increasingly recognised as a potential menace, not only to service availability, but to an organisation's data, confidentiality, finances and reputation.
Historical Availability Scenarios Power-on Self Test (POST) This series of diagnostic tests is run automatically by a device when the power is turned on. Today, it can apply to BIOS, SANs, mainframes and many other devices and systems. POST normally creates a log of errors for analysis and, in most cases, will not start any software until any problems are cleared. This is sometimes called Built-In Self Test (BIST).
Other Diagnostics In my time at IBM, I saw many advances in the tools and techniques used by engineers for maintenance and diagnostic exercises. Originally, the engineers (called customer engineers or CEs then) used masses of A2 (42cm x 60cm) diagrams in over-sized books, several of them kept in a hangar-sized metal bookcase in the machine room. They pored over these tomes whilst examining the innards of a machine with electrical probes, multi-meters and screwdrivers plus a few raised digits and swear words. The latter items will not be found in the terminology Appendix of this book but the reader will guess them anyway. This could be a time-consuming exercise, as well as a strain on the engineer’s back in lifting these books and make his eyes myopic trying to read incredibly complex diagrams. Taking a whole day to diagnose and fix a failure was not the norm but it was not unusuaI either. I can see those books now in my mind’s eye and remain thankful that I did not have to use them in my work as a systems engineer. These techniques did little to expose ‘soft’ errors which might eventually become ‘hard’ errors, possibly causing outages later. I remember meetings with customers where the IBM CE would summarise the latest hardware diagnostics and agree on a date and time
Availability Management Chapter 1
for maintenance, or perhaps repair/replace activity, for components exhibiting higher than expected 'soft' error rates, sometimes called 'transient' errors. In later years, these cumbersome diagnostic methods and books were replaced by MDs (Maintenance Devices), the equivalent of the clever diagnostic tools used in modern cars, but pre-Java. They shortened the diagnostic time and hence were a considerable boon to system availability and to the health of the engineer. Just to complete the picture, I was told by one engineer that there was an MD to diagnose a failing MD and so on! I should have known.
Component Repair Repair could also be a time-consuming process which was eventually superseded by Field Replaceable Units (FRUs), where failing items were replaced in situ (where possible) and the offending part taken away for repair, or to be scrapped. The part, if repairable, could then be used again on the same system or elsewhere7. FRUs installed by the customer are called CRUs (Customer Replaceable Units), a fairly recent innovation. It is current modular system designs which make a replaceable units philosophy possible. To be cost effective, FRUs needed to be of a size that could be easily replaced and, if necessary, discarded if they could not be repaired after removal. This necessitates a granular approach to the system design but then more components making up a system means more things to go wrong.
In-flight Diagnostics Later versions of the hardware and operating systems offered diagnostic recording and warning features which could be used either retrospectively (for example, for identifying soft errors) or as an operational warning of potentially failing parts or components as work was in progress. A sophisticated level of self-test and diagnostics is implemented in hardware systems which offer fault tolerance (ft). These include Stratus and HP Nonstop, a system initially marketed by Tandem before their acquisition by HP (see Chapter 8). Modern systems have these and other RAS features (see next section) which considerably enhance availability figures and are rarely unique to any one vendor. One characteristic of in-flight diagnostics is that the errors they detect can be either logged, flagged in real time to IT operations or bypassed using fault tolerant recovery techniques.
Summary We have seen the early attempts to specify what causes our computers to fall over and to address the issues in various ways. The tackling of this problem is evolutionary and made very necessary by the consequences of failure to business and other systems. I can't think of any business today that isn't totally dependent on Information Technology to run the whole operation or dependent on someone who is, such as a supplier. Some enterprises only address the high availability and disaster recovery aspects of running their IT when they get their fingers burned and for some, those burns are fatal. Funding IT is like paying for an insurance policy on your house - you hope you won't need it but when your house burns down you're are glad you took the policy out. Even if an enterprise decides to spend on these aspects of IT, they may either get it wrong or overspend with overkill 'just to be on the safe side'. That's where knowing what you are doing comes in useful! Many years ago, UK electricity boards built their networks using components, such as transformers, with large amounts of redundancy and capacity in them 'just in case' and to 7 Contracts and consumer law permitting. There are often strictures on using and describing 'reworked' parts in systems as 'new'.
Availability Management Chapter 1
save continually upgrading them as the load grew. Today, costs are such that networks are designed and provisioned using power systems analysis tools to design and install equipment with the ratings to do the job and have enough spare capacity to handle projected growth. These power systems planning tools and the effort involved in using them are more than covered by cost savings from quality network design and component usage. I know this because I spent several years of my IBM 'life' working with and in public utilities.
Planning, quality design, implementation and operations reap their own rewards and this applies in IT as well as in other service areas like utilities.
Remember: The three components of services - people, products and processes - are like the three musketeers. All for one and one for all.
Availability Management Chapter 2
CHAPTER 2
Reliability and Availability These two concepts are talked about, written about, equated with each other and given superstar status but, in the main, remain somewhat one-dimensional concepts. In the rest of this chapter, and the remainder of the book, I hope to show that these concepts, particularly availability, have other dimensions and interpretations.
Reliability and Availability Reliability represents the probability of components, parts and systems to perform their required functions for a desired period of time, without failure, in specified environments with a desired confidence. Reliability, in itself, does not account for any repair actions that may take place. Reliability accounts for the time that it will take the component, part or system to fail while it is operating. It does not reflect how long it will take to get the unit under repair back into working condition and is often qualitative - 'this car is much more reliable than my last one'. This is usually based on how long it spent in the repair and servicing states. Availability , to continue the car analogy, is how long the car is in working order and how long you can travel before it fails, measured operational and usage times respectively (see Figure 2). These you will mentally note as the time between failures and how long it takes you to get the car back on the road.
Introduction to RAS 'Reliability, availability, and serviceability (RAS) is a computer hardware engineering term. The phrase was originally used by IBM as a term to describe the robustness of their mainframe computers. The concept is often known by the acronym RAS' (Wikipedia). IBM did not 'invent' RAS, but they put heavy emphasis on it on the announcement of System/370 in 1970. They started to put robust features into succeeding mainframes to increase their ability to stay operational, then coined the acronym 'RAS' for the outcome. RAS is evolving and the concept has been adopted by all hardware vendors and has now spread to software. Computers designed with higher levels of RAS have a multitude of features that protect data integrity and help them stay available for long periods of time without failure - this data integrity and uptime is a particular selling point for mainframes and fault-tolerant systems, despite their being more expensive. In fact, Reliability and Availability characteristics could be developed for liveware. Note that reliability and availability do not have a one-to-one or a mathematical
relationship that is universal (like Ohm's Law V=IR or Einstein's E = mc2). It is perfectly possible for component 1 to be less reliable than component 2 but deliver better availability. This might occur when failures of 1 can be diagnosed and repaired much more quickly than those of 2 so that overall, the total outage time of 1 can be less than that of 2. Hence the availability of 1, A %, is greater than that of 2, B % even though reliability of 1, R1 is worse than that of 2, R2 . Another way that less reliable components can 'win' the availability contest is by
Availability Management Chapter 2
using redundancy (duplicate components), like the original RAID designs, but redundancy comes at a cost.
See 'Availability Architectures' in Chapter 4 for a discussion of RAS features. Before we get into the body of this book, I'll outline some major areas which we will deal with in more detail later - a true view from 30,000 feet, part of the process of learning via different viewpoints and angles.
RAS Moves Beyond Hardware An Intel document dated 2005 lists the following as things that help RAS as well as pure hardware (my comments are generally inserted [like this] throughout this book):
• Highly reliable platforms [hardware, firmware and software] • Extensive hardware and software testing [vendor, user] • Rigorous change management [supports my and others' theses that
'VOLATILITY' can mean 'OUTAGE'] • Redundant architectures [taken as read but only where needed] • Highly trained staff [liveware issues loom large in outages as we will see] • Well-established emergency procedures [runbooks, day-to-day and DR]
We now need to add at least some mention of 'security' which can affect the 'A' in RAS significantly these days, as do the other elements above.
☺ http://www.intel.com/content/dam/www/public/us/en/documents/white-papers/reliability-availability-and-serviceability-for-the-always-on-enterprise-paper.pdf
This excellent paper contains a RAS table and detailed Glossary of RAS. The RAS discussion in Chapter 3 of this book is generic and does not imply that all vendors have all the features mentioned in their RAS environment. An Aside: I was reading an article about these things and its author, who was obviously knowledgeable, issued the ‘so what’ comment about RAS features. In my mind, the ‘so what’ is that the customer would like to know they are there, rather like knowing that there are safety features and procedures on aircraft without understanding them in detail. Basic RAS is the best platform to build on. This knowledgeable author was not necessarily a wise author in my view.
Availability: A Lightning Overview Reliability is denoted mathematically R(t), a function of time described by a graph of some shape which we will see shortly. At some time in the life of an item, its Reliability can be assumed as constant to allow calculations to be made as we wallow at the bottom of the ubiquitous 'bathtub' curve (see Chapter 5 under 'Availability Concepts').
Some Definit ions ..of RELIABILITY and AVAILABILITY. These may seem superfluous but they often come in useful when arguing with people about system availability.... often boring but a good 'anchor point' start to an important topic. Skip them if you don't like definitions. IEEE 8: Reliability. The ability of a system or component to perform its required functions under stated conditions for a specified period of time. 8 IEEE 90
Availability Management Chapter 2
IEEE: Availability. The degree to which a system or component is operational and accessible when required for use. ITU-T 9: Reliability. The ability of an item to perform a required function under given conditions for a given time period. ITU-T: Availability. The ability of an item to be in a state to perform a required function at a given instant of time or at any instant of time within a given time interval, assuming that external resources, if required, are provided. In these definitions, an ‘item’ may be a circuit board, a component thereof, a LAN or even a whole server configuration and its associated network(s). Oxford English Dictionary: Reliability. The quality of being reliable, reliableness.
Reliable: That may be relied upon; in which reliance or confidence may be put; trustworthy, safe, sure.
These are all 'prose' definitions. None of them, although comprehensible, imply any quantitative properties of these two concepts.
Quantitative Availability
Reliability of an ‘item’ can be quantified by an equation (see Appendix 4) and is a function of MTBF 10 whereas availability is not a fixed function of the ‘item’ but varies depending on the reliability of the ‘item(s)’ and the time taken to diagnose a problem and correct it. It is a function of MTBF and other parameters.
For the moment, let us take the number A representing availability as; Time Working
Time Working + Time Not Working
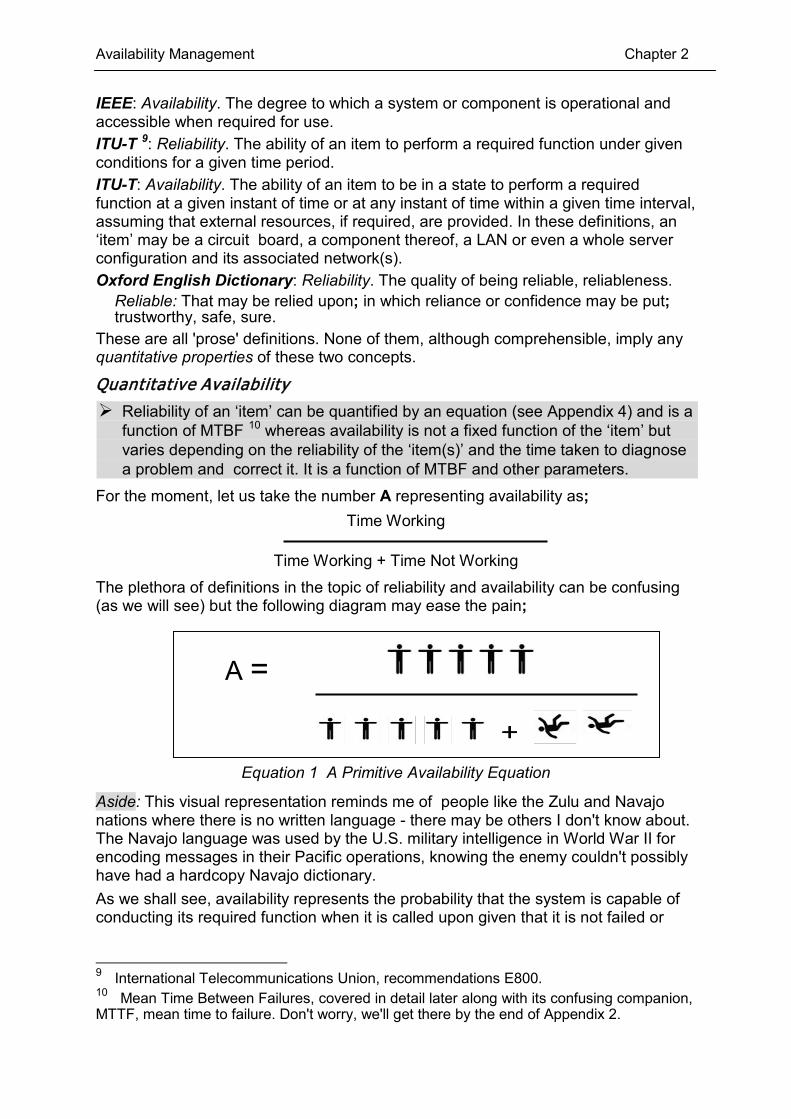
The plethora of definitions in the topic of reliability and availability can be confusing (as we will see) but the following diagram may ease the pain;
A =
Equation 1 A Primitive Availability Equation
Aside: This visual representation reminds me of people like the Zulu and Navajo nations where there is no written language - there may be others I don't know about. The Navajo language was used by the U.S. military intelligence in World War II for encoding messages in their Pacific operations, knowing the enemy couldn't possibly have had a hardcopy Navajo dictionary. As we shall see, availability represents the probability that the system is capable of conducting its required function when it is called upon given that it is not failed or
9 International Telecommunications Union, recommendations E800. 10 Mean Time Between Failures, covered in detail later along with its confusing companion, MTTF, mean time to failure. Don't worry, we'll get there by the end of Appendix 2.
Availability Management Chapter 2
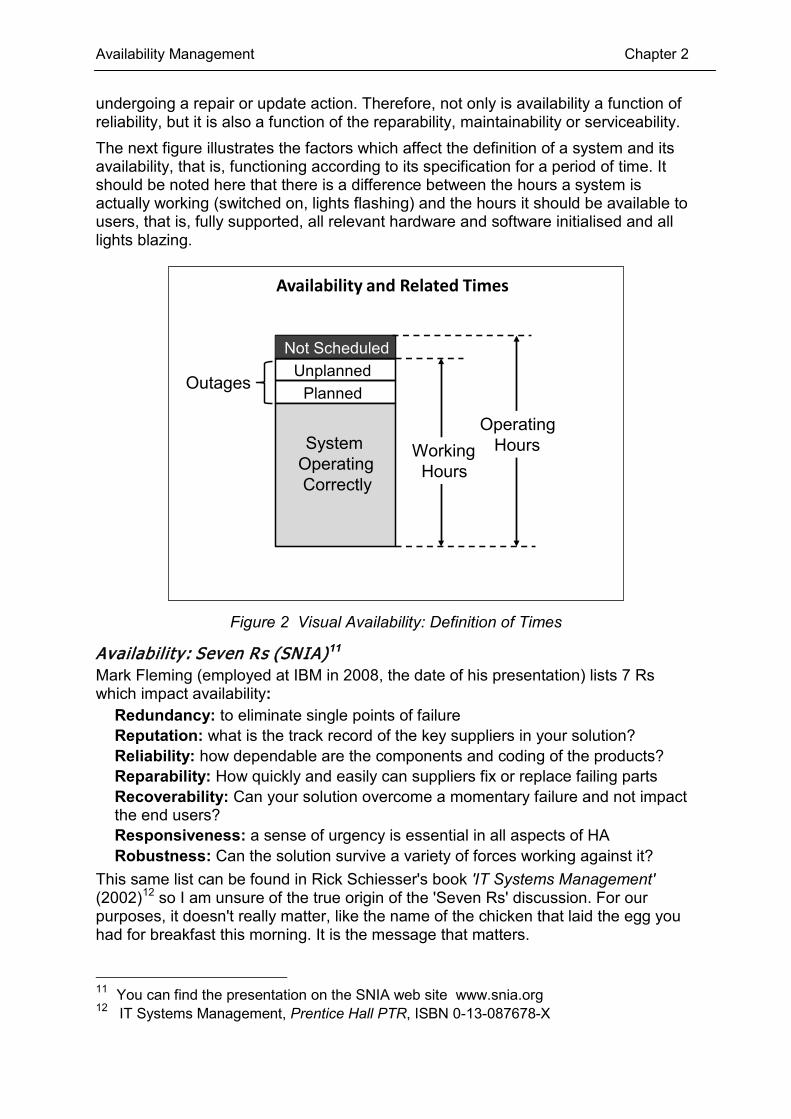
undergoing a repair or update action. Therefore, not only is availability a function of reliability, but it is also a function of the reparability, maintainability or serviceability. The next figure illustrates the factors which affect the definition of a system and its availability, that is, functioning according to its specification for a period of time. It should be noted here that there is a difference between the hours a system is actually working (switched on, lights flashing) and the hours it should be available to users, that is, fully supported, all relevant hardware and software initialised and all lights blazing.
Availability and Related Times
Not ScheduledUnplanned
Planned
SystemOperatingCorrectly
Operating HoursWorking
Hours
Outages
Figure 2 Visual Availability: Definition of Times
Availability: Seven Rs (SNIA) 11 Mark Fleming (employed at IBM in 2008, the date of his presentation) lists 7 Rs which impact availability:
Redundancy: to eliminate single points of failure Reputation: what is the track record of the key suppliers in your solution? Reliability: how dependable are the components and coding of the products? Reparability: How quickly and easily can suppliers fix or replace failing parts Recoverability: Can your solution overcome a momentary failure and not impact the end users? Responsiveness: a sense of urgency is essential in all aspects of HA Robustness: Can the solution survive a variety of forces working against it?
This same list can be found in Rick Schiesser's book 'IT Systems Management' (2002)12 so I am unsure of the true origin of the 'Seven Rs' discussion. For our purposes, it doesn't really matter, like the name of the chicken that laid the egg you had for breakfast this morning. It is the message that matters.
11 You can find the presentation on the SNIA web site www.snia.org 12 IT Systems Management, Prentice Hall PTR, ISBN 0-13-087678-X
Availability Management Chapter 2
I put this in here because it is a useful memory jogger and even if you can't name all the components, at least you know you have seven to find! Comment: With due respect to Mark, SNIA and Rick, I would add to and expand
upon a few of their Rs: Resilience: add as a measure of the ability and speed of recovery (a la the resilient boxer, who is able to get up and resume the fight where he left off after a knockdown). Reputation: to Mark's words above in this category I would add your own organisation's reputation in avoiding commercial failures which impact existing customers and web site failures which deter would-be customers. Reparability: how soon can you do the problem determination (what and where) to decide which supplier or third party to ring if needed? In addition, for customer replaceable FRUs (CRUs), what stock do you keep onsite? A few hours driving to fetch an FRU will blow availability targets into the middle of the following week. ROI: Return On Investment. You will probably be asked to justify any extra expenditure or, put another way, say what will it cost the organisation if we DON'T put this scheme in place and we get caught out?
Moral: On the last point about ROI; twenty five years ago, a very senior IT manager in a customer I looked after had a grand plan for a new data centre. He was warned by an experienced external data centre person that he should prepare a cost case when he presented his grand plan to the Board as they would probably ask for such a thing. He didn't and they did! The situation then rebounded however; he rang me and asked me to help prepare a cost case! Panic! I rang around IBM data centre personnel and, with their help, managed to put together a cost case involving productivity (IT staff/unit of power), software and other savings associated with centralisation and modernisation. I used the costs of the support staff per unit of power (the IBM RPP - relative processor power, then the 370/158) - IBM had 0.8 people/RPP, the customer at that time 1.8 per RPP. IBM was aiming for 0.2 people per RPP and I think we used the 0.8 figure as the benchmark for the customer's potential savings! Someone in your organisation will ask the very same question about YOUR grand plans - HA, DR or any other. You will need some sort of financial case involving TCO (see Appendix 3) and benefits.
Availability and Change Assume for the moment that we have a basic understanding of what availability means to an installation. It seems unfair to some people that other organisations have a better IT system availability than their organisation has and they wonder why. Well, aside from breaking the 'rules' which we will cover in this book, there is a factor which has occurred to me many times when reading about system 'failures'. This is the fact that some organisations have rapidly changing operations and/or business requirements, such as changing parameters related to time, disk space and other entities when carrying out day to day work. They may also have system and application changes which might affect the potential availability of systems and data adversely. Then there are software patches - system and application - including microcode and embedded code - across system(s) and networks.
Availability Management Chapter 2
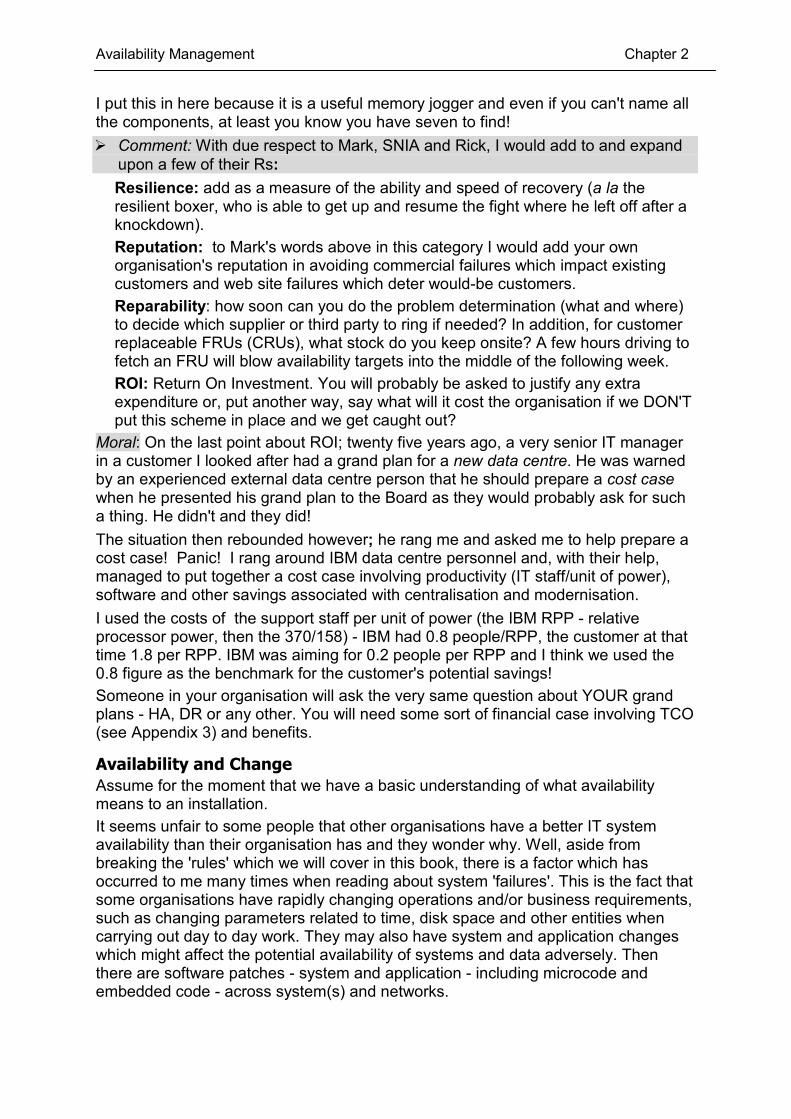
Rapid change offers many opportunities for errors in implementing it and, in my view, can cause outages of the 'liveware' kind. Note that there are permanent changes, such as patches and hardware additions, and transient ones, such as batch job parameters. The 'change ' graph below assumes all other things are equal (ceteris paribus) apart from the operations volatility factor. I think most people know what data centre 'volatility' is, where changes to runtime parameters, job mixes and scheduling changes to suit business circumstances. Change management is not the whole answer to this issue, although it will smooth the path. Human error can still occur in the best change management schemes. Adding extra users to an existing system is also a change factor which can sometimes have unforeseen consequences. This is common occurrence, often done furtively, but rarely figures in change management discussions and activity. Look at the diagram below. It shows schematically the relationship between the 'velocity' of change and hence potential unavailability. The H, M and L in the diagram are relative; they might be, for example, 99.99, 99.5 and 99% respectively. They are there to illustrate my thesis that, other things being equal, volatility of systems, processes and the work that runs on them can mean less availability in some circumstances.
Why are Some More Available Than Others?
Availability
System Volatility
H
H
M
ML
L
Volatility = Speed of Operations Change
or Operations Complexity
Figure 3 Availability and Effects of Change
One might add to the volatility axis a factor representing the ability to back out changes which is a vital component of Change Management and hence availability. In pseudo-mathematical expression, this might be written as follows, where V = volatility, that non-availability might be some function of the two volatilities; operations and system changes:
Non-Availability (system/data) = f (VOPS, VCHNG)
Change All Around Us
Availability Management Chapter 2
All change has the potential to cause failure or adverse results of some sort. The old DP (Data Processing) bureaus would qualify as volatile environments because of the often wild mixes of work they were asked to undertake by a bewildering array of customers. For example, the USAAF base at Burtonwood, near Manchester and other local businesses used an IBM bureau facility for their changing payroll and we hope the airmen and their support staff got paid OK! I know about this volatile environment, because I was there. The old adage 'if it ain't broke, don't fix it' was aimed at maintaining the status quo in the sure knowledge that change can often mean problems, some of which may be irreversible (the Humpty Dumpty syndrome). Unfortunately, 'not fixing' is not always possible. This 'change can equal outage' concept was also supported in a webinar given by Continuity Software on 6th December 2012, except the vertical axis in their graph would be entitled 'Potential Downtime and Data Loss' and the H, M and L tags reversed. The conclusions are the same however.
What I am saying here about change is also supported by an ORSYP survey (2012) on 'change' and one by Forrester Consulting/Zenoss on IT Monitoring (August 2013), whose conclusions are outlined in the next section.
Software: Effect of Change The volume of change to software for fault correction and maintenance can have a similar effect on reliability as other changes we have noted here. The need for strict change control here should be self evident as the JAFLOC syndrome ('it's Just A Few Lines of Code') can cause havoc. We are not just talking about application software here but any software supporting applications. Major upgrades to the latter software would normally be subject to rigorous testing and verification but apparently minor changes, say to a communications table, can be a source of outages. Incorrectly installed upgrades/patches can cause outages. Cautionary Tale: I saw this happen in a major chemical company where a VTAM (telecommmunications) table was altered by the company's communications people without going through the change control procedures. The change clashed with other, valid changes and brought the system down. It involved IBM software customer engineers in hours of work trying to locate the problem, believing it to be an IBM issue. Eventually, the internal communications people owned up to the fact and the problem was solved quickly. I know about this because I was the IBM Systems Engineer on that account but I was found 'not guilty' of being an accessory in the 'crime'.
Operations: Effect of Change The study by ORSYP13 on 'pain' in IT operations produced several issues and suggestions which are germane to our discussion of availability, or the possible lack of it. The survey questioned a sample base of worldwide organisations, ranging from major banks and financial institutions to retailers, and aimed to uncover which factors caused the most frustration for those organisations in managing their IT operations. To fully understand the methodology and riders, you should consult the white paper. 13 www.orsps.com 'Information Technology Operations Pain Report Management' 2012 (White Paper). Extracts here are reproduced with the kind permission of ORSYP.
Availability Management Chapter 2
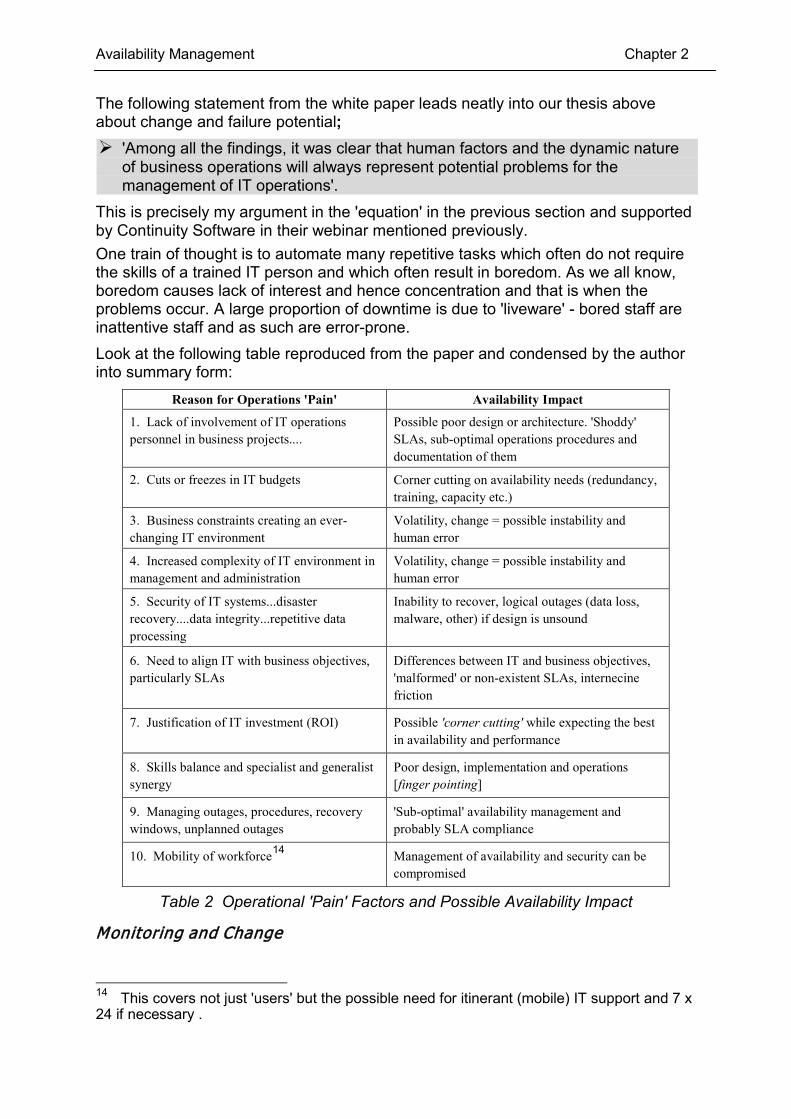
The following statement from the white paper leads neatly into our thesis above about change and failure potential; 'Among all the findings, it was clear that human factors and the dynamic nature
of business operations will always represent potential problems for the management of IT operations'.
This is precisely my argument in the 'equation' in the previous section and supported by Continuity Software in their webinar mentioned previously. One train of thought is to automate many repetitive tasks which often do not require the skills of a trained IT person and which often result in boredom. As we all know, boredom causes lack of interest and hence concentration and that is when the problems occur. A large proportion of downtime is due to 'liveware' - bored staff are inattentive staff and as such are error-prone. Look at the following table reproduced from the paper and condensed by the author into summary form:
Reason for Operations 'Pain' Availability Impact
1. Lack of involvement of IT operations personnel in business projects....
Possible poor design or architecture. 'Shoddy' SLAs, sub-optimal operations procedures and documentation of them
2. Cuts or freezes in IT budgets Corner cutting on availability needs (redundancy, training, capacity etc.)
3. Business constraints creating an ever-changing IT environment
Volatility, change = possible instability and human error
4. Increased complexity of IT environment in management and administration
Volatility, change = possible instability and human error
5. Security of IT systems...disaster recovery....data integrity...repetitive data processing
Inability to recover, logical outages (data loss, malware, other) if design is unsound
6. Need to align IT with business objectives, particularly SLAs
Differences between IT and business objectives, 'malformed' or non-existent SLAs, internecine friction
7. Justification of IT investment (ROI) Possible 'corner cutting' while expecting the best in availability and performance
8. Skills balance and specialist and generalist synergy
Poor design, implementation and operations [finger pointing]
9. Managing outages, procedures, recovery windows, unplanned outages
'Sub-optimal' availability management and probably SLA compliance
10. Mobility of workforce14 Management of availability and security can be compromised
Table 2 Operational 'Pain' Factors and Possible Availability Impact
Monitoring and Change
14 This covers not just 'users' but the possible need for itinerant (mobile) IT support and 7 x 24 if necessary .
Availability Management Chapter 2
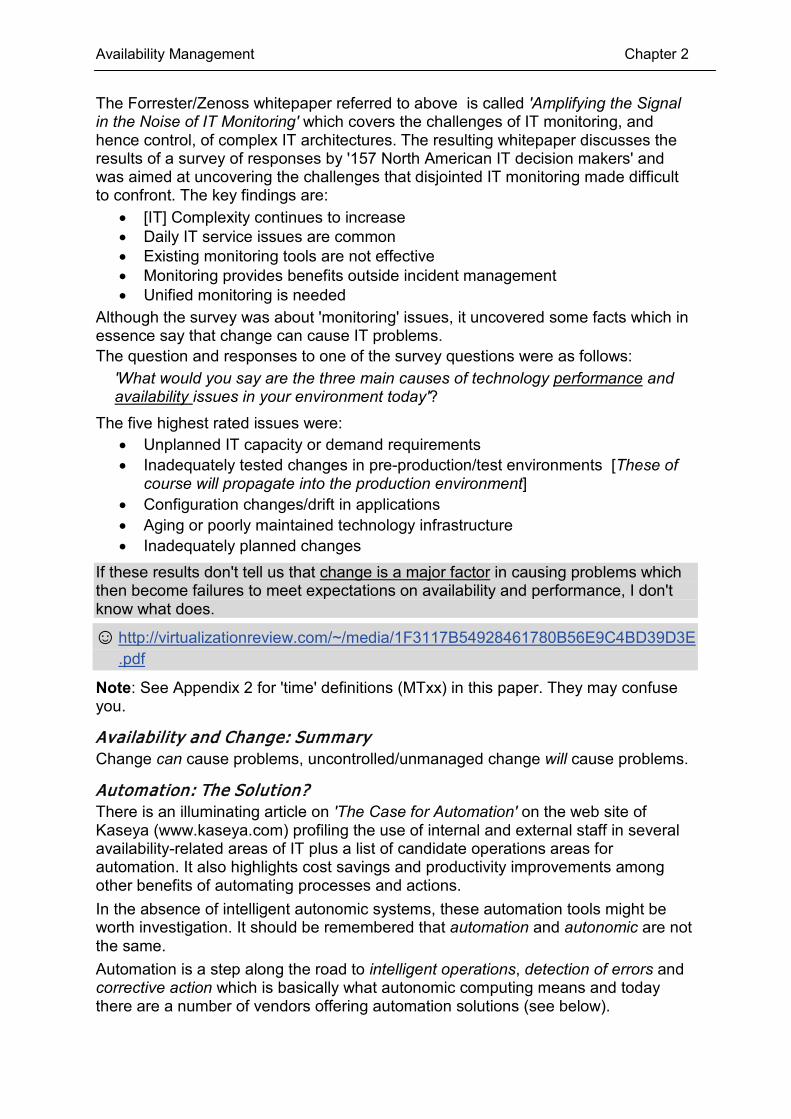
The Forrester/Zenoss whitepaper referred to above is called 'Amplifying the Signal in the Noise of IT Monitoring' which covers the challenges of IT monitoring, and hence control, of complex IT architectures. The resulting whitepaper discusses the results of a survey of responses by '157 North American IT decision makers' and was aimed at uncovering the challenges that disjointed IT monitoring made difficult to confront. The key findings are:
• [IT] Complexity continues to increase • Daily IT service issues are common • Existing monitoring tools are not effective • Monitoring provides benefits outside incident management • Unified monitoring is needed
Although the survey was about 'monitoring' issues, it uncovered some facts which in essence say that change can cause IT problems. The question and responses to one of the survey questions were as follows:
'What would you say are the three main causes of technology performance and availability issues in your environment today'?
The five highest rated issues were: • Unplanned IT capacity or demand requirements • Inadequately tested changes in pre-production/test environments [These of
course will propagate into the production environment] • Configuration changes/drift in applications • Aging or poorly maintained technology infrastructure • Inadequately planned changes
If these results don't tell us that change is a major factor in causing problems which then become failures to meet expectations on availability and performance, I don't know what does.
☺ http://virtualizationreview.com/~/media/1F3117B54928461780B56E9C4BD39D3E.pdf
Note: See Appendix 2 for 'time' definitions (MTxx) in this paper. They may confuse you.
Availability and Change: Summary Change can cause problems, uncontrolled/unmanaged change will cause problems.
Automation: The Solution? There is an illuminating article on 'The Case for Automation' on the web site of Kaseya (www.kaseya.com) profiling the use of internal and external staff in several availability-related areas of IT plus a list of candidate operations areas for automation. It also highlights cost savings and productivity improvements among other benefits of automating processes and actions. In the absence of intelligent autonomic systems, these automation tools might be worth investigation. It should be remembered that automation and autonomic are not the same. Automation is a step along the road to intelligent operations, detection of errors and corrective action which is basically what autonomic computing means and today there are a number of vendors offering automation solutions (see below).
Availability Management Chapter 2
Data Centre Automation The case for automation of monitoring alerts and operational IT tasks often revolves around human factors - mistakes caused boredom and lack of concentration in people performing these often mundane tasks. The consequences of mistakes in tasks related to mission-critical systems can be severe. The question soon will be not 'shall we automate' but 'what shall we automate safely'? in an attempt to mitigate the effects of change and human 'frailty' in increasingly complex and volatile IT system environments. If a well-defined task is being carried out on a regular basis, then it is a candidate for automation. Similarly, if staff turnover or reassignment is such that constant training and documentation updates are required, then automation may be a solution. There is of course the usual check and balance - what time and expense will it incur and will time and money savings accrue from that automation? More importantly, will it reduce or eliminate failures and SLA non-compliance, particularly those in critical systems?
☺ See http://go.veeam.com/wpg-backup-resseler-bringing-automation-to-datacenter-ty.html?aliId=96241185
Automation Vendors There are several vendors who tout automation tools, including ORSYP, Veeam (see reference above) and IBM. They have useful articles on their web sites. In addition, another article 'IT Process Automation: Moving From Basics to Best Practices', written by Gartner Group for HP, identifies three elements which might inhibit the development of IT Process Automation solutions;
• lack of IT organisational maturity15 and appropriate skills • non-standard IT infrastructures (software and hardware) impede the
achievement of IT Process Automation • the costs of development, implementation and administration
The Gartner/HP paper also lists the following as a sample vendor list for IT Process Automation; BMC Software, CA Technologies, Cisco, HP, iWave Software, Microsoft, NetIQ, Network Automate, UC4 Software and VMware. Finally, on this topic of CHANGE, a last quote:
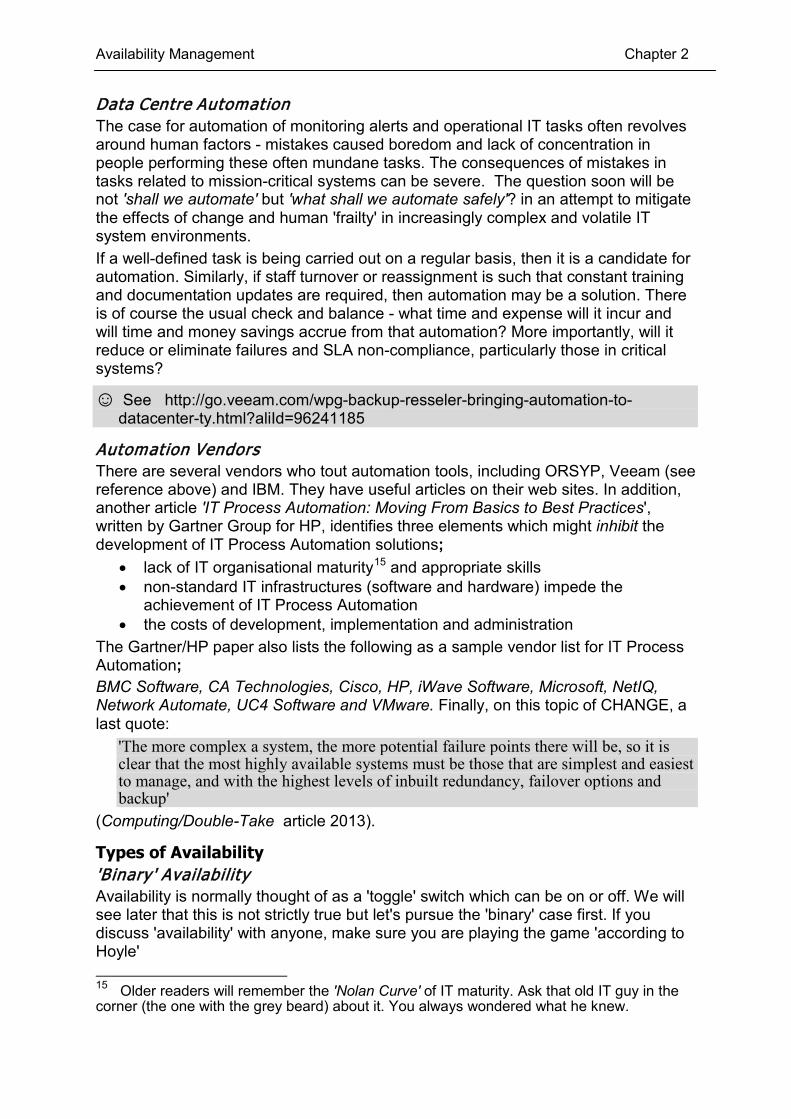
'The more complex a system, the more potential failure points there will be, so it is clear that the most highly available systems must be those that are simplest and easiest to manage, and with the highest levels of inbuilt redundancy, failover options and backup'
(Computing/Double-Take article 2013).
Types of Availability 'B inary' Availability Availability is normally thought of as a 'toggle' switch which can be on or off. We will see later that this is not strictly true but let's pursue the 'binary' case first. If you discuss 'availability' with anyone, make sure you are playing the game 'according to Hoyle' 15 Older readers will remember the 'Nolan Curve' of IT maturity. Ask that old IT guy in the corner (the one with the grey beard) about it. You always wondered what he knew.
Availability Management Chapter 2
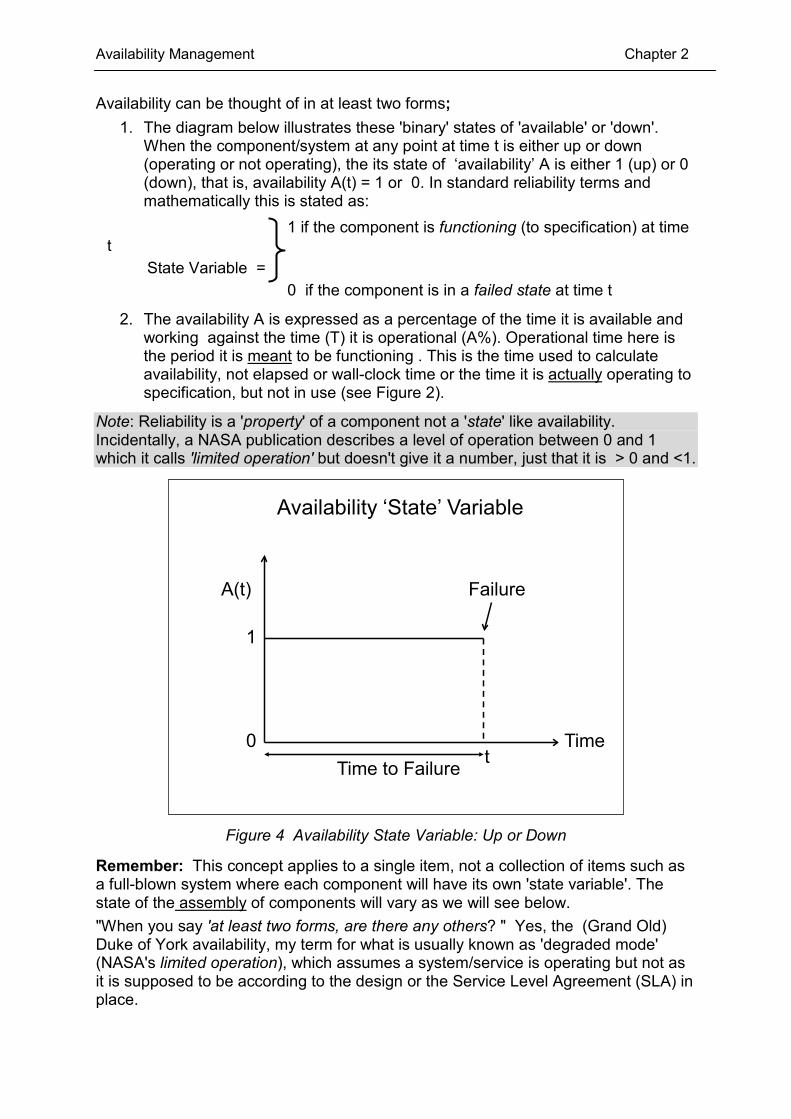
Availability can be thought of in at least two forms;
1. The diagram below illustrates these 'binary' states of 'available' or 'down'. When the component/system at any point at time t is either up or down (operating or not operating), the its state of ‘availability’ A is either 1 (up) or 0 (down), that is, availability A(t) = 1 or 0. In standard reliability terms and mathematically this is stated as:
1 if the component is functioning (to specification) at time t State Variable = 0 if the component is in a failed state at time t
2. The availability A is expressed as a percentage of the time it is available and working against the time (T) it is operational (A%). Operational time here is the period it is meant to be functioning . This is the time used to calculate availability, not elapsed or wall-clock time or the time it is actually operating to specification, but not in use (see Figure 2).
Note: Reliability is a 'property' of a component not a 'state' like availability. Incidentally, a NASA publication describes a level of operation between 0 and 1 which it calls 'limited operation' but doesn't give it a number, just that it is > 0 and <1.
A(t)
1
0
Failure
tTime
Time to Failure
Availability ‘State’ Variable
Figure 4 Availability State Variable: Up or Down
Remember: This concept applies to a single item, not a collection of items such as a full-blown system where each component will have its own 'state variable'. The state of the assembly of components will vary as we will see below. "When you say 'at least two forms, are there any others? " Yes, the (Grand Old) Duke of York availability, my term for what is usually known as 'degraded mode' (NASA's limited operation), which assumes a system/service is operating but not as it is supposed to be according to the design or the Service Level Agreement (SLA) in place.
Availability Management Chapter 2
This, incidentally, hammers home the importance of SLAs. No SLA means nobody cares how the service performs or how long it operates for. This is called anarchy.
‘Duke of York ’ Availability In the verse about our Grand Old Duke marching his 10,000 men up and down a hill, there are the lines:
‘When they were up they were up And when they were down they were down And when they were only half way up They were neither up nor down’
The last line sounds better poetry than 'they were neither state 1 nor state 0' and the diagram to the right of the verse represents 'Duke of York' or degraded operations. This situation can be applied to services which are neither up nor down but are forced by some component failure to operate in degraded mode in functionality, performance or some other important, agreed aspect of the service, probably via an SLA. This mode of operation needs to be considered carefully in CFIA studies, particularly in relation to any SLAs in force for the service in question. Degraded service may also apply to disaster recovery plans (DR) where a complete service cannot be supported by the DR configuration and some less critical services and applications may have to be 'sacrificed' in the short term while total recovery of the primary site takes place. This is a business decision, based on a business impact analysis (BIA). The concept of failed (state 0) components and operating (state 1) components becomes a little more complicated when there are several components operating together. Consider the following failure hierarchy;
• Failure of part of a component: State 1 going to state 0 • Failure of a component: State 1 going to state 0 • Failure of part of a set of components (system). State ? • Failure within a system with software (service). State ?
The answer to the third statement above is it depends if the whole system (service) can still operate and deliver the 'goods', in which case it earns a '1'. However, if it can still deliver but in a degraded mode which fails to meet its SLA, then the users would class it as state '0', even though to a hardware/software purist it is state >0 but <1. Answer? It all depends on expectations and expectations are the province of SLAs.
Hierarchy of Failures The diagram below serves three purposes;
1. it demonstrates the hierarchy of elements in a service, each of which can have a state of 0 or 1 (down or up). The service illustrated comprises hardware, system software, middleware tools and implies some other items. Each cascades down into component parts and the illustration shows the hardware parts explosion.
2. it can be a useful visual tool in performing Component Failure Impact Analysis (CFIA), dealt with later in the book, along with the discussion of the
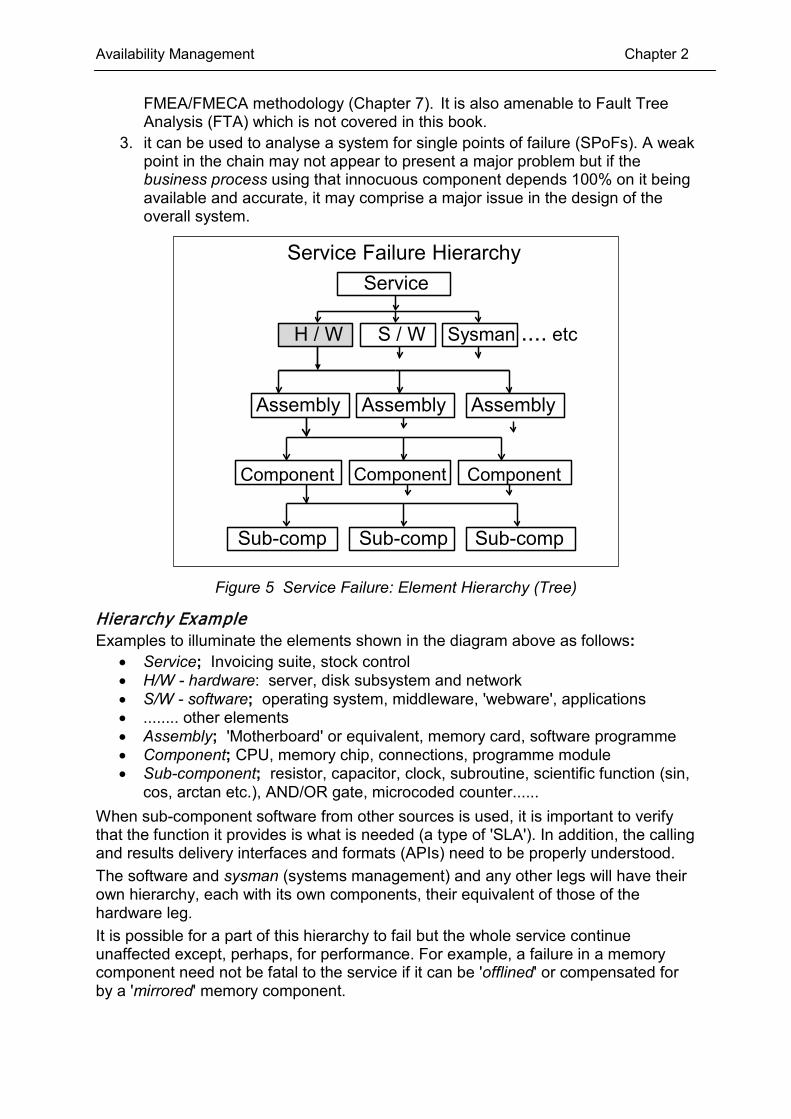
Availability Management Chapter 2
FMEA/FMECA methodology (Chapter 7). It is also amenable to Fault Tree Analysis (FTA) which is not covered in this book.
3. it can be used to analyse a system for single points of failure (SPoFs). A weak point in the chain may not appear to present a major problem but if the business process using that innocuous component depends 100% on it being available and accurate, it may comprise a major issue in the design of the overall system.
Service Failure HierarchyService
H / W S / W Sysman .... etc
Assembly Assembly Assembly
Component Component Component
Sub-comp Sub-comp Sub-comp
Figure 5 Service Failure: Element Hierarchy (Tree)
Hierarchy Example Examples to illuminate the elements shown in the diagram above as follows:
• Service; Invoicing suite, stock control • H/W - hardware: server, disk subsystem and network • S/W - software; operating system, middleware, 'webware', applications • ........ other elements • Assembly; 'Motherboard' or equivalent, memory card, software programme • Component; CPU, memory chip, connections, programme module • Sub-component; resistor, capacitor, clock, subroutine, scientific function (sin,
cos, arctan etc.), AND/OR gate, microcoded counter......
When sub-component software from other sources is used, it is important to verify that the function it provides is what is needed (a type of 'SLA'). In addition, the calling and results delivery interfaces and formats (APIs) need to be properly understood. The software and sysman (systems management) and any other legs will have their own hierarchy, each with its own components, their equivalent of those of the hardware leg. It is possible for a part of this hierarchy to fail but the whole service continue unaffected except, perhaps, for performance. For example, a failure in a memory component need not be fatal to the service if it can be 'offlined' or compensated for by a 'mirrored' memory component.
Availability Management Chapter 2
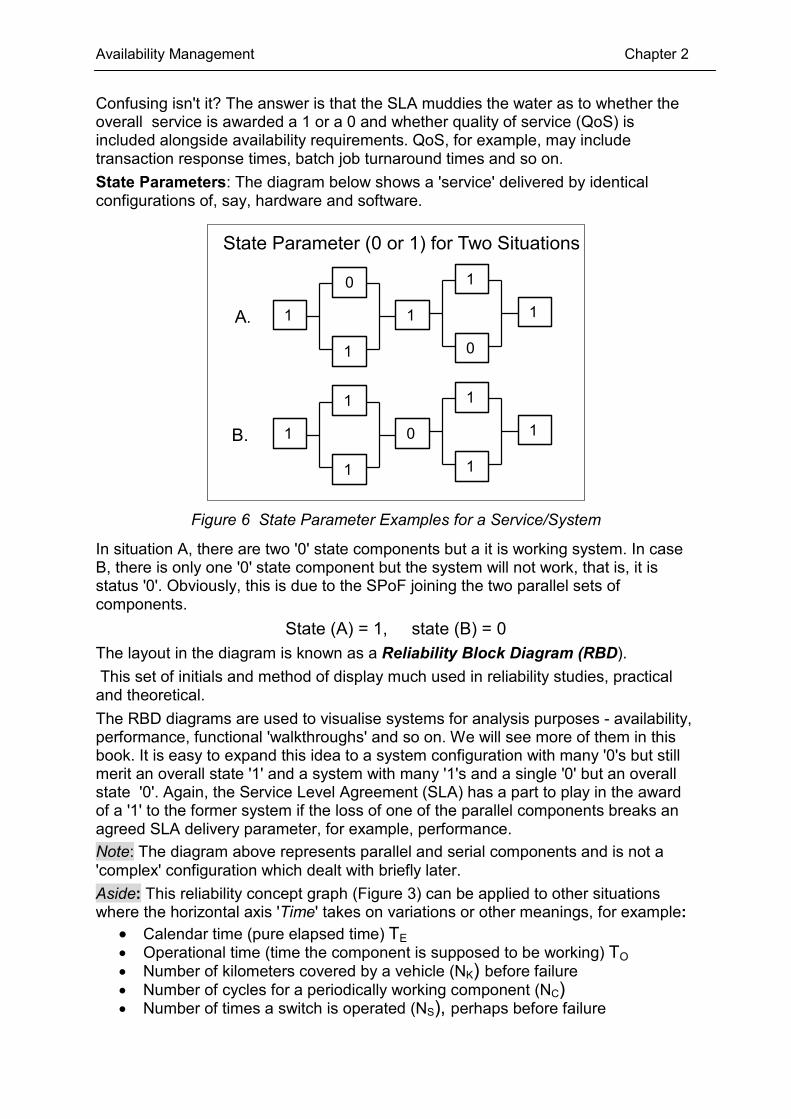
Confusing isn't it? The answer is that the SLA muddies the water as to whether the overall service is awarded a 1 or a 0 and whether quality of service (QoS) is included alongside availability requirements. QoS, for example, may include transaction response times, batch job turnaround times and so on. State Parameters: The diagram below shows a 'service' delivered by identical configurations of, say, hardware and software.
State Parameter (0 or 1) for Two Situations
1
11
0
1
0
1
1
11
1
0
1
1
A.
B.
Figure 6 State Parameter Examples for a Service/System
In situation A, there are two '0' state components but a it is working system. In case B, there is only one '0' state component but the system will not work, that is, it is status '0'. Obviously, this is due to the SPoF joining the two parallel sets of components.
State (A) = 1, state (B) = 0 The layout in the diagram is known as a Reliability Block Diagram (RBD). This set of initials and method of display much used in reliability studies, practical and theoretical. The RBD diagrams are used to visualise systems for analysis purposes - availability, performance, functional 'walkthroughs' and so on. We will see more of them in this book. It is easy to expand this idea to a system configuration with many '0's but still merit an overall state '1' and a system with many '1's and a single '0' but an overall state '0'. Again, the Service Level Agreement (SLA) has a part to play in the award of a '1' to the former system if the loss of one of the parallel components breaks an agreed SLA delivery parameter, for example, performance. Note: The diagram above represents parallel and serial components and is not a 'complex' configuration which dealt with briefly later. Aside: This reliability concept graph (Figure 3) can be applied to other situations where the horizontal axis 'Time' takes on variations or other meanings, for example:
• Calendar time (pure elapsed time) TE • Operational time (time the component is supposed to be working) TO • Number of kilometers covered by a vehicle (NK) before failure • Number of cycles for a periodically working component (NC) • Number of times a switch is operated (NS), perhaps before failure
Availability Management Chapter 2
• Number of rotations of a bearing (NR), perhaps before failure The term 'availability' when applied to 'hours of supported service' must not be confused with the definitions above. An application or service which is only offered for 100 hours per week has, on our definition, an availability of 100/168 or about 60%, which is patently not true. Within that 100 hours, the definitions above DO apply, that is, 'what percentage of that 100 hours is it available for work at a satisfactory level'? In the rest of this paper we will talk mainly in terms of the second option, which is discussed in detail later and re-discussed, taken to pieces and reassembled in Appendix 2.
Types of Non-Availability (Outages) This might seem a superfluous section, but wait. There are two basic classes of outage; 1. physical, where something fails to operate. It might be hardware or software,
directly or because of some external event like a flood. The failure may or may not impact the system or service that it supports. A hardware example of a non-impacting failure is the demise of one component of a parallel pair, where the surviving component continues to function and support the system or service. A software example is where an operating system or OLTP system fails but is compensated for by the invocation of a 'shadow' system, such as IBM's CICS XRF (eXtended Recovery Facility)16.
2. logical, where nothing has failed but something prevents the system or service from operating properly or at all. Examples of this are extremely poor performance or some sort of system limit parameter that impacts the system or service, either totally or partially.
There might conceivably be a combination of these two scenarios. Examples of these might be where certain key parameters specifying system resource limits (or ceilings) are exceeded - maxprocs, bufno, bufsize, maxusers and so on. If these parameters can be altered dynamically (without impacting system operation), then the service recovery can be swift; if not, then a reboot/re-IPL may be needed after altering the 'offending' parameters. The latter case will involve a service outage. Outage causes which are repaired quickly does not necessarily mean short downtime. It may be that the system needs to 'ramp up' or perform some extra work to get up to speed (see ramp up in Appendix 1 and near the end of Appendix 2 for the equivalent MTTV terminology used by Forrester).
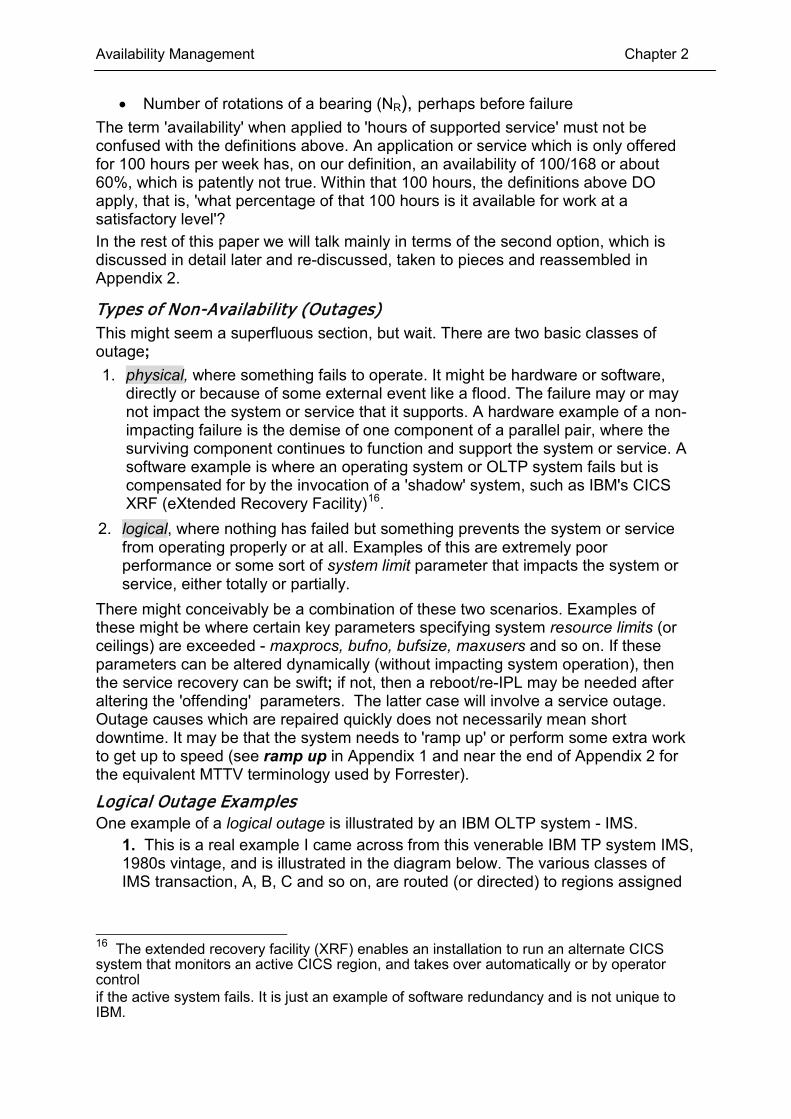
Logical Outage Examples One example of a logical outage is illustrated by an IBM OLTP system - IMS.
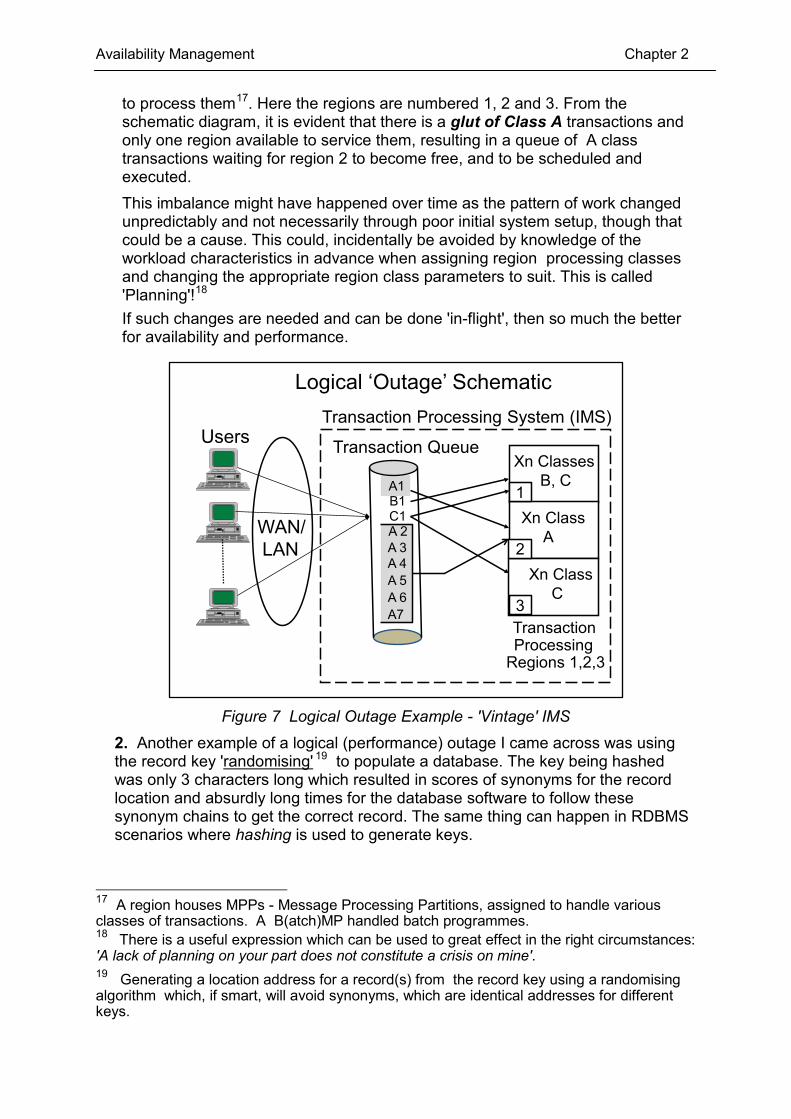
1. This is a real example I came across from this venerable IBM TP system IMS, 1980s vintage, and is illustrated in the diagram below. The various classes of IMS transaction, A, B, C and so on, are routed (or directed) to regions assigned
16 The extended recovery facility (XRF) enables an installation to run an alternate CICS system that monitors an active CICS region, and takes over automatically or by operator control if the active system fails. It is just an example of software redundancy and is not unique to IBM.
Availability Management Chapter 2
to process them17. Here the regions are numbered 1, 2 and 3. From the schematic diagram, it is evident that there is a glut of Class A transactions and only one region available to service them, resulting in a queue of A class transactions waiting for region 2 to become free, and to be scheduled and executed. This imbalance might have happened over time as the pattern of work changed unpredictably and not necessarily through poor initial system setup, though that could be a cause. This could, incidentally be avoided by knowledge of the workload characteristics in advance when assigning region processing classes and changing the appropriate region class parameters to suit. This is called 'Planning'!18 If such changes are needed and can be done 'in-flight', then so much the better for availability and performance.
UsersXn Classes
B, C
Xn ClassA
Xn ClassC
A1B1C1
A 3 A 2
A 4
A7
A 5A 6
Transaction Queue
Transaction Processing
Regions 1,2,3
Transaction Processing System (IMS)
Logical ‘Outage’ Schematic
1
2
3
WAN/LAN
Figure 7 Logical Outage Example - 'Vintage' IMS
2. Another example of a logical (performance) outage I came across was using the record key 'randomising'
19 to populate a database. The key being hashed was only 3 characters long which resulted in scores of synonyms for the record location and absurdly long times for the database software to follow these synonym chains to get the correct record. The same thing can happen in RDBMS scenarios where hashing is used to generate keys.
17 A region houses MPPs - Message Processing Partitions, assigned to handle various classes of transactions. A B(atch)MP handled batch programmes. 18 There is a useful expression which can be used to great effect in the right circumstances: 'A lack of planning on your part does not constitute a crisis on mine'. 19 Generating a location address for a record(s) from the record key using a randomising algorithm which, if smart, will avoid synonyms, which are identical addresses for different keys.
Availability Management Chapter 2
The message here is that non-availability is not a simple concept and a simple matter of 'is it working or is it not?' Availability is really a matter of 'is the service working as it should do to support me and if it isn't, it isn't available'. Period.
This is the origin of the Service Level Agreement (SLA) which, in general, specifies that the user wants a service to not only function, but to function within certain metrics involving parameters which he specifies and which are important to the business. These metrics might include hours of service, performance characteristics and others. In the case above (Figure 7), this performance metric was not explicitly specified but was raised to red alert when it happened because it was so bad.
Planning for Availability and Recovery 'If you fail to plan, you plan to fail'. (Benjamin Franklin, US polymath and politician)
Why Bother? Practically all businesses rely to a great degree on Information Technology and most could not function at all without it. It is vitally important then that if the IT support is not forthcoming (for whatever reason), the business can continue to function to a similar or lesser degree. That act of 'carrying on' is known simply as Business Continuity. Being unable to carry on has disastrous effects on some businesses in terms of financial losses, customer satisfaction and other deleterious consequences. These are outlined elsewhere in this book and in articles and papers all over the Internet. Although this book does not aim to cover aspects of total system recovery, it is instructive to look at the connection between planning for availability and subsequent recovery after major incidents which 'take out' the normal IT operating environment. One aspect of availability planning and management is 'what data and facilities do we put aside in our IT bank account for that rainy day'?
What is a Business Continuity P lan (BCP)? 20 A programme of activity which develops, exercises and maintains plans to enable an organization to:
• Respond to a major disruption with minimum harm to life and resources • Recover, resume and restore functions on a timescale that will ensure
continuing viability of the organisation involved • Provide crisis communications to all stakeholders (i.e. almost everyone
connected in any way). This includes an IT disaster recovery plan as a subset but also needs to cover temporary locations for displaced staff, emergency IT facilities (screens, desks, fax machines etc.), communication with non-IT facilities, third parties and so on. It is no mean exercise. I have seen BC documentation and would not attempt to lift it for fear of lumbar damage. The plan usually takes input from mainly stakeholders and, among other things, the Business Impact Analysis (BIA - see below). If you don't have one, you emulate the man falling from a skyscraper who says halfway down 'so, far, so good'.
20 See Disaster Recovery Journal http://www.drj.com/ for information and glossary.
Availability Management Chapter 2
There are some wonderful tales of businesses 'competing' for a Darwin award for BCP failures in the paper;
☺ http://www.webtorials.com/main/resource/papers/delphi/paper7/DR_Darwin_Awards.pdf
One of these, a part of a BCP, is reproduced here, and is entitled 'We Powered What?'.
'One of the smaller telephone companies built a network operations center for their infrastructure transmission facilities. One day they discovered there was no backup power available at the site. Nothing had happened, they were planning ahead. The backup power was installed and demonstrated successfully. Eventually there was a power failure, but the equipment that was to be powered did not work. The electrical outputs were color coded to show where the backup power was connected. Unfortunately they got the color codes reversed. The only thing that worked after the power failure was the Christmas tree.'
Moral: Test it out and produce an RBD.
What is a Business Impact Analysis (BIA)? A Business Impact Analysis assesses the consequences of disruption of a business function and process and gathers information needed to develop recovery strategies. Potential loss scenarios should be identified during the risk assessment (problem vs. probability of it occurring). There are many possible disruption scenarios to consider, or even dream up, and assess their impact on the business – financial, image, share price and so on. This exercise is ideal for a Delphi technique session (see Chapter 7). The exercise should be carried out for each business unit21 and documented. Examples of SBUs are Invoicing, Payroll, Payments, Ledgers and so on, some more important than others and needing separate considerations in ensuring affordable availability. Some terminology used in BIA relates to 'tiers' which are classifications of what downtime an application can tolerate without severe business impact. Typically they might look as follows;
• Tier 0 - 1 hour or less can be tolerated • Tier 1 - 4 hours downtime is tolerable • Tier 2 - Extended downtime of a day or more is tolerable • Tier 3 - Flexible but probably with a maximum, say, of 'x' days
(Don't confuse these 'tiers' with those describing the position of data as online, near-line and so on which is 'data tiering' or 'hierarchical data placement') This gives some discrete structure to the exercise which would otherwise be difficult with an amorphous mass of services and applications. Which tier anything belongs to is a business decision, with the usual proviso 'if you can't pay for it, you can't have it.'
What is Disaster Recovery (DR)? This book is not mainly about Business Continuity (BC) or Disaster Recovery but availability, or lack of it, although design for availability must take into account the
21 Often called SBUs or Strategic Business Units.
Availability Management Chapter 2
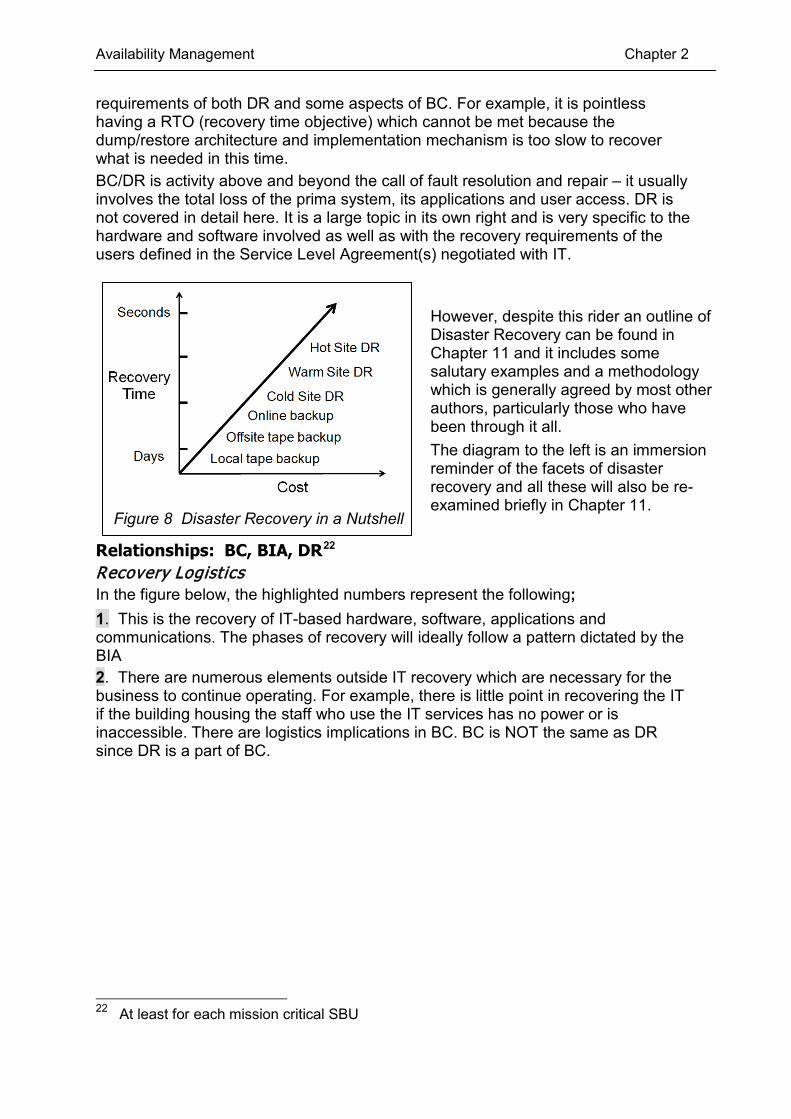
requirements of both DR and some aspects of BC. For example, it is pointless having a RTO (recovery time objective) which cannot be met because the dump/restore architecture and implementation mechanism is too slow to recover what is needed in this time. BC/DR is activity above and beyond the call of fault resolution and repair – it usually involves the total loss of the prima system, its applications and user access. DR is not covered in detail here. It is a large topic in its own right and is very specific to the hardware and software involved as well as with the recovery requirements of the users defined in the Service Level Agreement(s) negotiated with IT.
Figure 8 Disaster Recovery in a Nutshell
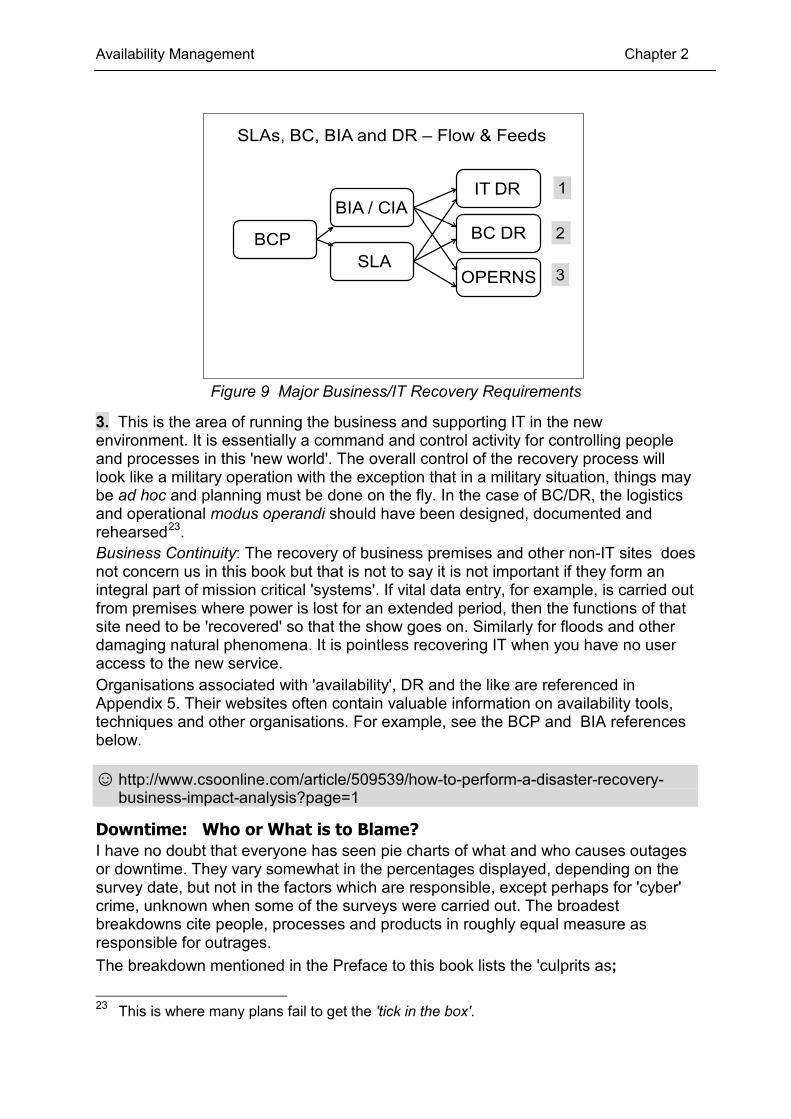
Relationships: BC, BIA, DR22 Recovery Logistics In the figure below, the highlighted numbers represent the following;
1. This is the recovery of IT-based hardware, software, applications and communications. The phases of recovery will ideally follow a pattern dictated by the BIA 2. There are numerous elements outside IT recovery which are necessary for the business to continue operating. For example, there is little point in recovering the IT if the building housing the staff who use the IT services has no power or is inaccessible. There are logistics implications in BC. BC is NOT the same as DR since DR is a part of BC.
22 At least for each mission critical SBU
However, despite this rider an outline of Disaster Recovery can be found in Chapter 11 and it includes some salutary examples and a methodology which is generally agreed by most other authors, particularly those who have been through it all. The diagram to the left is an immersion reminder of the facets of disaster recovery and all these will also be re-examined briefly in Chapter 11.
Availability Management Chapter 2
SLAs, BC, BIA and DR – Flow & Feeds
BCPSLA
BIA / CIAIT DR
BC DR
OPERNS 3
2
1
Figure 9 Major Business/IT Recovery Requirements
3. This is the area of running the business and supporting IT in the new environment. It is essentially a command and control activity for controlling people and processes in this 'new world'. The overall control of the recovery process will look like a military operation with the exception that in a military situation, things may be ad hoc and planning must be done on the fly. In the case of BC/DR, the logistics and operational modus operandi should have been designed, documented and rehearsed23. Business Continuity: The recovery of business premises and other non-IT sites does not concern us in this book but that is not to say it is not important if they form an integral part of mission critical 'systems'. If vital data entry, for example, is carried out from premises where power is lost for an extended period, then the functions of that site need to be 'recovered' so that the show goes on. Similarly for floods and other damaging natural phenomena. It is pointless recovering IT when you have no user access to the new service. Organisations associated with 'availability', DR and the like are referenced in Appendix 5. Their websites often contain valuable information on availability tools, techniques and other organisations. For example, see the BCP and BIA references below.
☺ http://www.csoonline.com/article/509539/how-to-perform-a-disaster-recovery-business-impact-analysis?page=1
Downtime: Who or What is to Blame? I have no doubt that everyone has seen pie charts of what and who causes outages or downtime. They vary somewhat in the percentages displayed, depending on the survey date, but not in the factors which are responsible, except perhaps for 'cyber' crime, unknown when some of the surveys were carried out. The broadest breakdowns cite people, processes and products in roughly equal measure as responsible for outrages. The breakdown mentioned in the Preface to this book lists the 'culprits as;
23 This is where many plans fail to get the 'tick in the box'.
Availability Management Chapter 2
• Hardware: Everyone knows what this is • Software: Covers non-embedded software of all kinds - application and
system • Ambientware: The working environment of servers (ecosystem), disks and so
on • Embedded Software/Microcode: Built into hardware normally but 'code'
nonetheless • Liveware: or people. People make mistakes and people in IT are no
exception. They can err in minute to minute operations or in producing erroneous code or procedures which are used in production
• Malware: Trojan horses, viruses, botnets, distributed denial of service (DDoS) and the whole gamut of 'gremlins' which can cripple an IT system and/or its data
• Natureware: Tornados, hurricanes, earthquakes, snow, floods, tsunami, terrorism, disaffected employees (yes) and so on
• Vapourware: Has no impact on availability if you ignore it24. Each of these, apart from vapourware, has an effect on availability and should be the headings under which plans are made - plus estimating the probability of a particular occurrence multiplied by the business impact of that occurrence. This will be covered a little later when showing the flow of activities in availability planning and, incidentally, in almost any IT project you undertake.
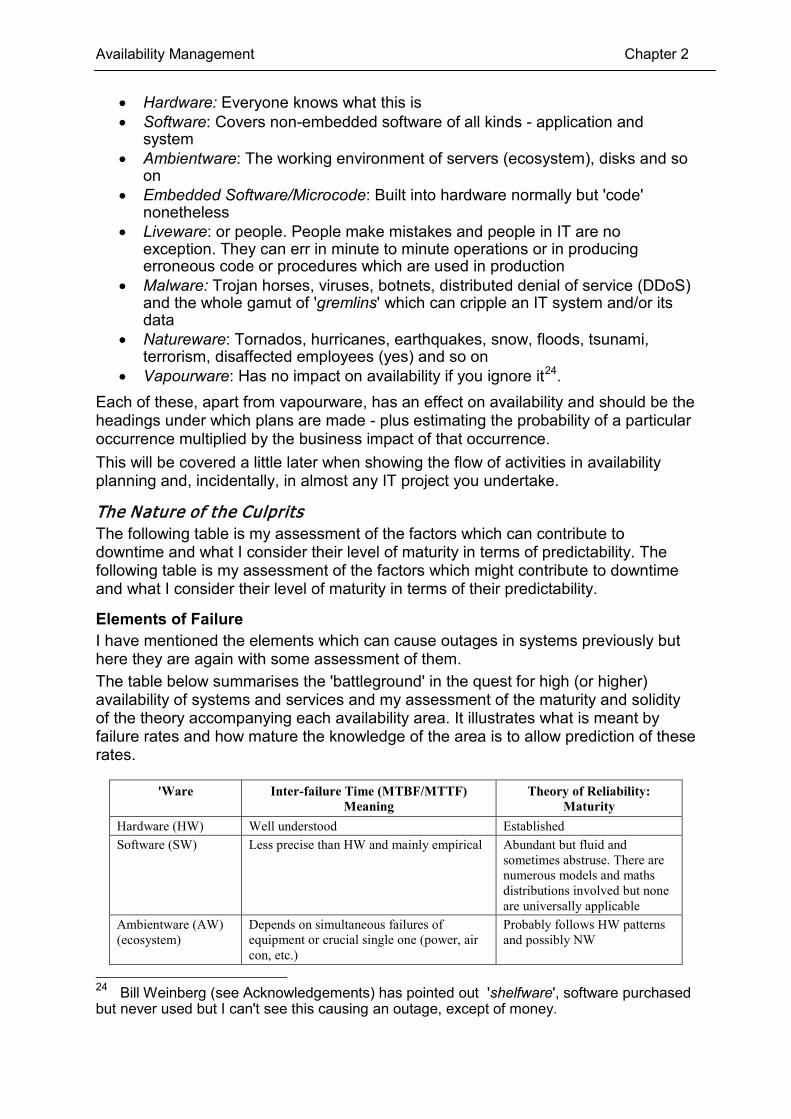
The Nature of the Culprits The following table is my assessment of the factors which can contribute to downtime and what I consider their level of maturity in terms of predictability. The following table is my assessment of the factors which might contribute to downtime and what I consider their level of maturity in terms of their predictability.
Elements of Failure I have mentioned the elements which can cause outages in systems previously but here they are again with some assessment of them. The table below summarises the 'battleground' in the quest for high (or higher) availability of systems and services and my assessment of the maturity and solidity of the theory accompanying each availability area. It illustrates what is meant by failure rates and how mature the knowledge of the area is to allow prediction of these rates.
'Ware Inter-failure Time (MTBF/MTTF) Meaning
Theory of Reliability: Maturity
Hardware (HW) Well understood Established Software (SW) Less precise than HW and mainly empirical Abundant but fluid and
sometimes abstruse. There are numerous models and maths distributions involved but none are universally applicable
Ambientware (AW) (ecosystem)
Depends on simultaneous failures of equipment or crucial single one (power, air con, etc.)
Probably follows HW patterns and possibly NW
24 Bill Weinberg (see Acknowledgements) has pointed out 'shelfware', software purchased but never used but I can't see this causing an outage, except of money.
Availability Management Chapter 2
Embedded SW or Microcode)
Understood and probably long if testing is adequate. It usually is because of the nature of the code.
Probably follows the software pattern although microcode usually comprises less code. Embedded code can be millions of lines.
Malware (MW) Variable MTBO(occurrences) decreasing and frequency depends on system vulnerability and benefit to miscreant of system 'penetration'. On the increase in numbers and severity, especially high bandwidth DDoS.
Non-existent as far as I know though it may be 'according to Hoyle' possibility. Its frequency and damage potential is increasing year on year.
Natureware (NW) Variable MTBO and nasty NW geographical areas should be avoided if possible or backup sites in a 'friendly' NW environment
Ways of predicting these phenomena developing - some are well known enough to avoid data centres in certain areas of the world
Table 3 Availability Theory: Its Maturity for the Various 'Wares'
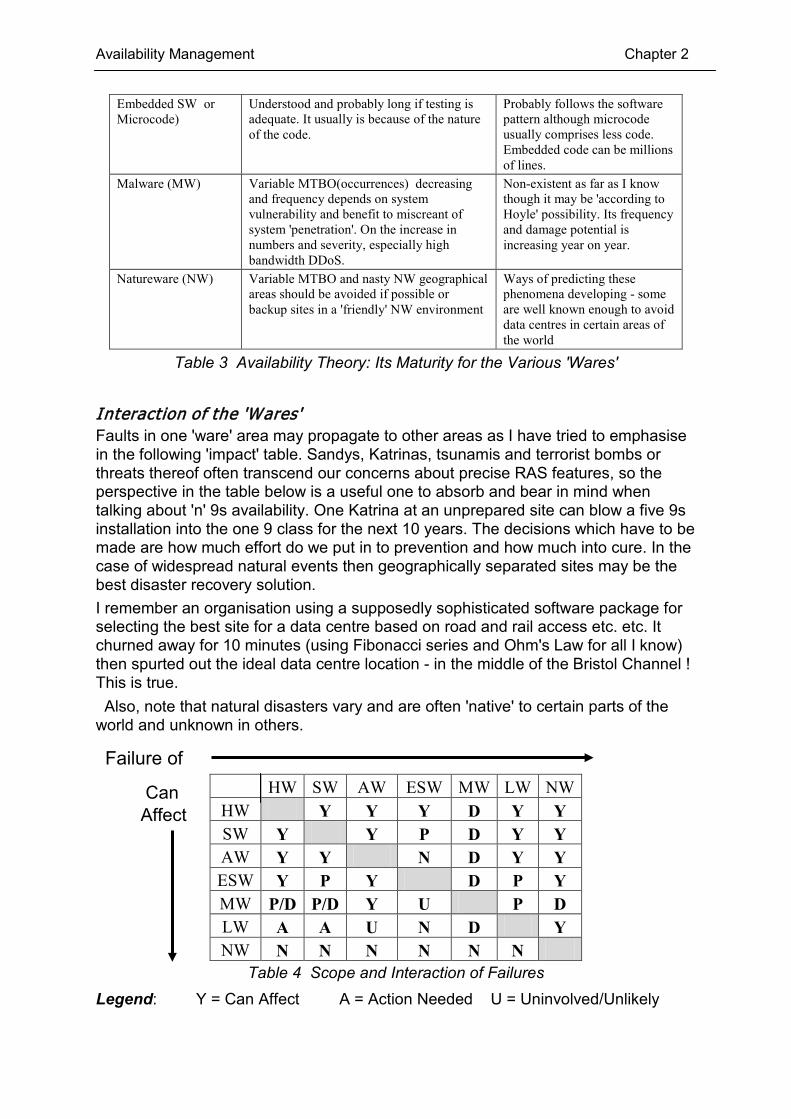
Interaction of the 'Wares' Faults in one 'ware' area may propagate to other areas as I have tried to emphasise in the following 'impact' table. Sandys, Katrinas, tsunamis and terrorist bombs or threats thereof often transcend our concerns about precise RAS features, so the perspective in the table below is a useful one to absorb and bear in mind when talking about 'n' 9s availability. One Katrina at an unprepared site can blow a five 9s installation into the one 9 class for the next 10 years. The decisions which have to be made are how much effort do we put in to prevention and how much into cure. In the case of widespread natural events then geographically separated sites may be the best disaster recovery solution. I remember an organisation using a supposedly sophisticated software package for selecting the best site for a data centre based on road and rail access etc. etc. It churned away for 10 minutes (using Fibonacci series and Ohm's Law for all I know) then spurted out the ideal data centre location - in the middle of the Bristol Channel ! This is true. Also, note that natural disasters vary and are often 'native' to certain parts of the world and unknown in others.
HW SW AW ESW MW LW NW HW Y Y Y D Y Y SW Y Y P D Y Y AW Y Y N D Y Y ESW Y P Y D P Y MW P/D P/D Y U P D LW A A U N D Y NW N N N N N N
Table 4 Scope and Interaction of Failures Legend: Y = Can Affect A = Action Needed U = Uninvolved/Unlikely
Failure of
Can Affect
Availability Management Chapter 2
D = Doesn't matter P = Possibly N = No Impact HW = Hardware SW = Software AW = Environment/Ecosystem ESW = Embedded /microcode MW= Malware LW = Liveware NW = Nature/Acts of God
Summary In this chapter we have looked at an overview of availability, both as a concept and as a number and its related property, reliability. We've seen something of the environment of availability - its 'history', service delivery, elementary mathematics and the factors which influence the availability of systems and services and each other. We have outlined the fact, still not recognised by some 'informed' people, that there is more to availability than hardware - whole host of things and sub-things with subtle shades and nuances ready to trip up the unwary. We have also defined some terms related to availability to set the scene for later discussions. A key understanding which should come out of this chapter is that there are different kinds of outages - physical and logical together with shades of degradation of service. The yardstick by which availability is measured is enshrined in the Service Level Agreement (SLA). I hope you got though this chapter unscathed and go on to enjoy the rest of the book. I feel it is more productive in HA design that one feels comfortable with the subject of availability than by slavishly following prescriptive checklists, although they do have their place in aiding, rather than leading you. It is rather like wearing a well-made bespoke suit as opposed to one borrowed from a neighbour - you feel far more comfortable in the former outfit.