Embed Size (px)
DESCRIPTION
Academic
Citation preview
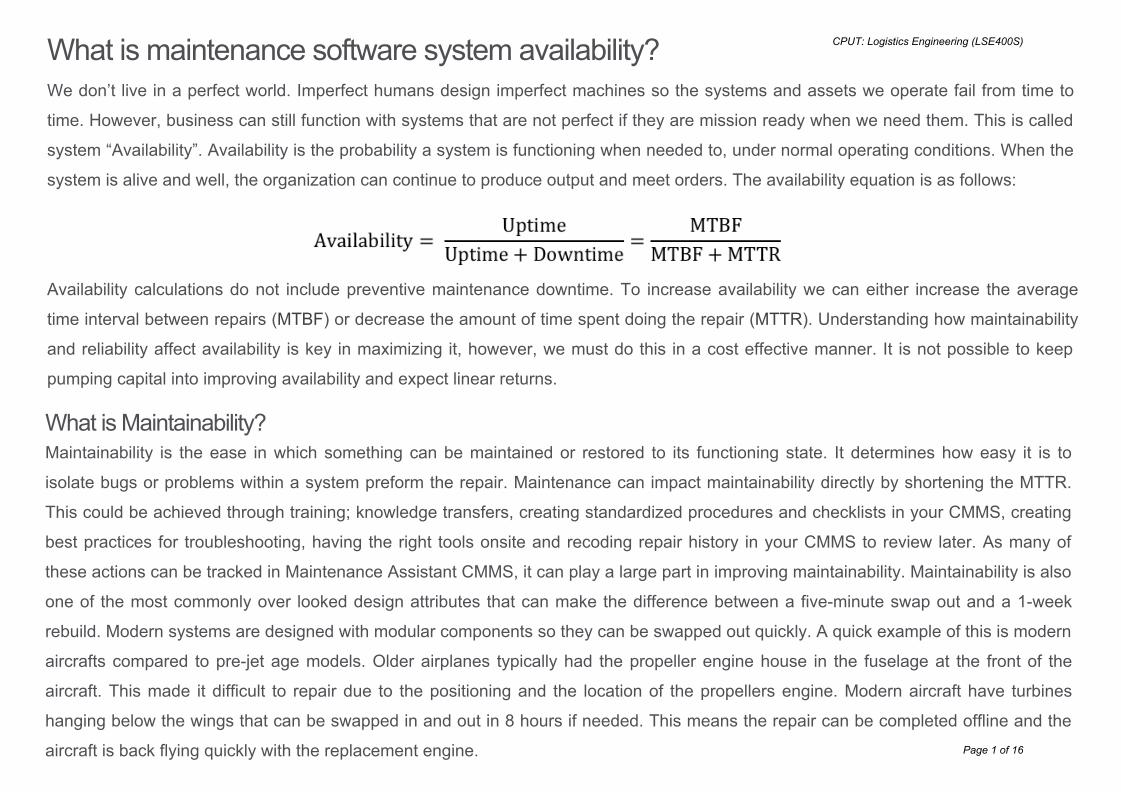
What is maintenance software system availability?We don’t live in a perfect world. Imperfect humans design imperfect machines so the systems and assets we operate fail from time to
time. However, business can still function with systems that are not perfect if they are mission ready when we need them. This is called
system “Availability”. Availability is the probability a system is functioning when needed to, under normal operating conditions. When the
system is alive and well, the organization can continue to produce output and meet orders. The availability equation is as follows:
Availability calculations do not include preventive maintenance downtime. To increase availability we can either increase the average
time interval between repairs (MTBF) or decrease the amount of time spent doing the repair (MTTR). Understanding how maintainability
and reliability affect availability is key in maximizing it, however, we must do this in a cost effective manner. It is not possible to keep
pumping capital into improving availability and expect linear returns.
What is Maintainability?Maintainability is the ease in which something can be maintained or restored to its functioning state. It determines how easy it is to
isolate bugs or problems within a system preform the repair. Maintenance can impact maintainability directly by shortening the MTTR.
This could be achieved through training; knowledge transfers, creating standardized procedures and checklists in your CMMS, creating
best practices for troubleshooting, having the right tools onsite and recoding repair history in your CMMS to review later. As many of
these actions can be tracked in Maintenance Assistant CMMS, it can play a large part in improving maintainability. Maintainability is also
one of the most commonly over looked design attributes that can make the difference between a five-minute swap out and a 1-week
rebuild. Modern systems are designed with modular components so they can be swapped out quickly. A quick example of this is modern
aircrafts compared to pre-jet age models. Older airplanes typically had the propeller engine house in the fuselage at the front of the
aircraft. This made it difficult to repair due to the positioning and the location of the propellers engine. Modern aircraft have turbines
hanging below the wings that can be swapped in and out in 8 hours if needed. This means the repair can be completed offline and the
aircraft is back flying quickly with the replacement engine.
CPUT: Logistics Engineering (LSE400S)
Page 1 of 16

predict and generally more accurate but reliability has a bigger impact on availability. Long periods of improved reliability will lead to
increased availability. Maintenance doesn’t impact availability directly; rather it indirectly impacts availability through maintainability and
reliability.
Cost Versus AvailabilityUnderstanding how properly functioning systems and assets contribute to the bottom line is crucial in recognizing how important asset
availability is to an organization. Ask any CEO or accountant how they measure how effective their maintenance function is and they will
say cost - how much are we paying our maintenance guys and how much are they spending on parts and materials to keeping our
assets operating. Today’s environment calls for a more forward-looking approach. Rather than examine costs in the past, organizations
need to be
able to predict outcomes. Take the airline industry for example; airlines only make money when their aircraft are in the air. By improving
reliability and maintainability, it will have a direct impact on availability going forward, and thus the profitability of the business.
Try it out for yourself before committing. Check out the Version 5 test-drive on our homepage and see how Version 5 can improve the
way you do maintenance today.
A brief summary of Reliability
System reliability is essentially the probability that the asset will be able to execute a failure free operation for a managed period of time
within normal operating conditions. When reliability gets out of control, it can lead to a domino effect that engulfs the organization. For
example, it can lead to increase in stock outs; costly emergency parts orders, missed PM’s, collateral damage, manpower shortages and
ultimately missed orders. Maintenance can impact reliability by increasing the time lag between repairs. This can be achieved by
optimizing the preventive maintenance program on an asset or the system. The easiest way is to include steps to proactively perform
inspections so issues are spotted before they turn into something more serious. The common way to measure reliability is MTBF, which
refers to the average time the asset functions normally before it fails. Maintainability rates are easier to
CPUT: Logistics Engineering (LSE400S)
Page 2 of 16
What is Mean Time Between Fail?Mean time between failures is an important metric where the failure rate of assets needs to be managed. It is the average time lapsed
between breakdowns of a system. In other words, it is the average time the system or component functions between breakdowns. For
mission critical or complex repairable assets such as generators, tankers or airplanes, MTBF becomes an important indicator of
expected performance. It has also become a fundamental component in the design of safe systems and equipment. MTBF does not
take into account any scheduled maintenance such as recalibrations, lubrications or preventive parts replacements. Whereas MTTR
affects availability, MTBF affects availability and reliability.
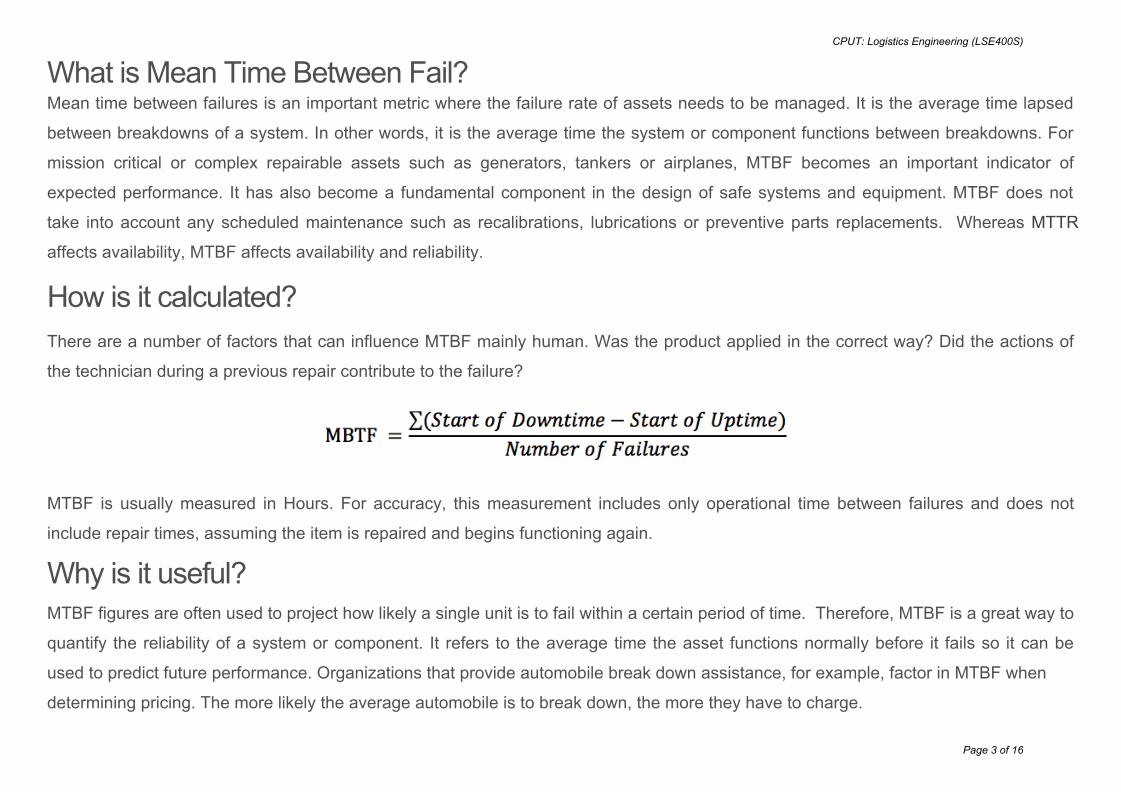
How is it calculated?There are a number of factors that can influence MTBF mainly human. Was the product applied in the correct way? Did the actions of
the technician during a previous repair contribute to the failure?
MTBF is usually measured in Hours. For accuracy, this measurement includes only operational time between failures and does not
include repair times, assuming the item is repaired and begins functioning again.
Why is it useful?MTBF figures are often used to project how likely a single unit is to fail within a certain period of time. Therefore, MTBF is a great way to
quantify the reliability of a system or component. It refers to the average time the asset functions normally before it fails so it can be
used to predict future performance. Organizations that provide automobile break down assistance, for example, factor in MTBF when
determining pricing. The more likely the average automobile is to break down, the more they have to charge.
CPUT: Logistics Engineering (LSE400S)
Page 3 of 16
How do you measure MTBF in MA CMMS?Manufacturers may provide the predicted MTBF for system or component to indicate its expected reliability based on intensive testing.
But is the manufacturers predicted MTBF relevant? The calculation could be based on data from newer generations and technologies
while your organization runs an older model. For a more accurate representation of MTBF, we need an estimation based on actual field
data. It is possible to pull MTBF for your particular assets data directly from your Maintenance Assistant CMMS. When an asset goes
down for repair, simply select the reason that accurately describes the situation. Reasons to set an asset offline can be configured in the
lookup tables in the settings section. When the repair is complete, log the system back up to production. This online/offline data is then
used to calculate MTBF. MTBF can also be useful in determining the frequency of inspections or preventive replacements. If your system
is failing for the same reasons, you could use the MTBF data to introduce some preventive actions such as greasing, inspections,
calibrations, preventive repairs etc. MTBF is also a important reliability metric and can influence the design of newer systems. Quality
driven manufacturers track failure modes and defects so they can eliminate them from the design process going forward, improving
MTBF over time.
Welcome to Advanced CMMS Metrics. Over the next few weeks, we’re going to look at those advanced metrics that we can use to
optimize your maintenance operations. In particular, we’ll discuss what the metrics mean and how they can be calculated using
Maintenance Assistant CMMS. In the first blog of the series, we’ll take a look at Mean Time to Repair (MTTR).
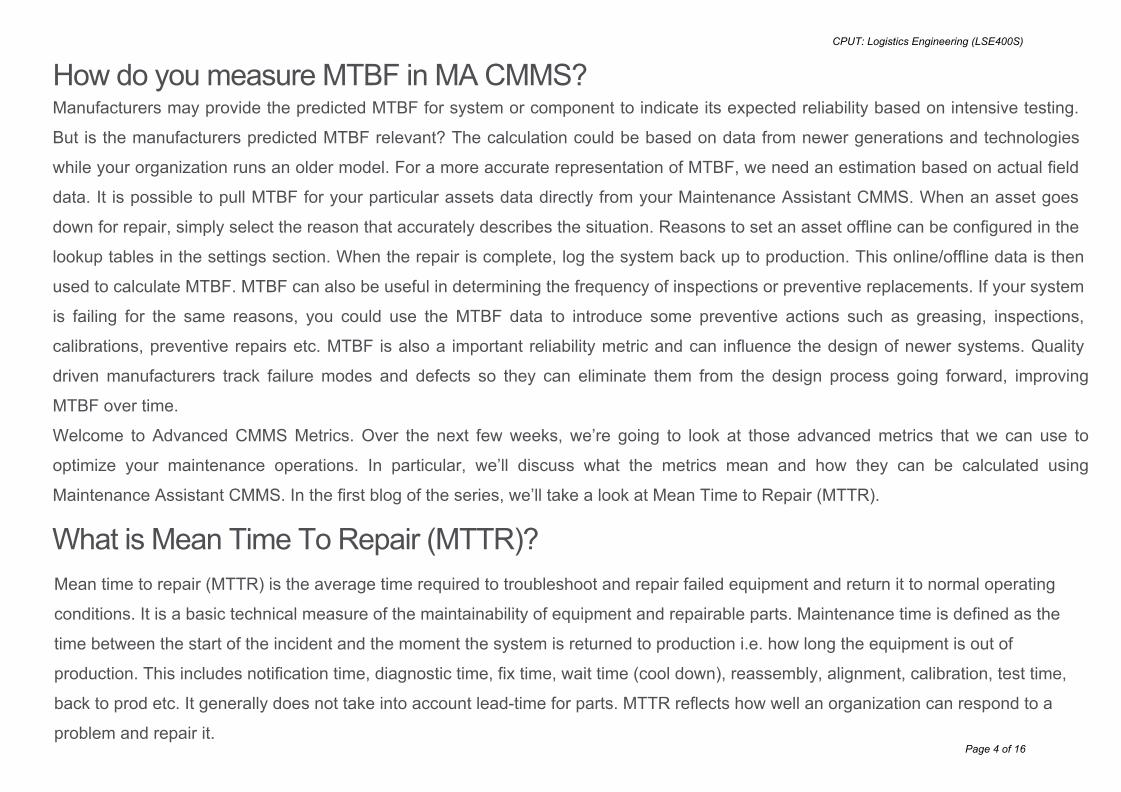
What is Mean Time To Repair (MTTR)?
CPUT: Logistics Engineering (LSE400S)
Mean time to repair (MTTR) is the average time required to troubleshoot and repair failed equipment and return it to normal operating
conditions. It is a basic technical measure of the maintainability of equipment and repairable parts. Maintenance time is defined as the
time between the start of the incident and the moment the system is returned to production i.e. how long the equipment is out of
production. This includes notification time, diagnostic time, fix time, wait time (cool down), reassembly, alignment, calibration, test time,
back to prod etc. It generally does not take into account lead-time for parts. MTTR reflects how well an organization can respond to a
problem and repair it.Page 4 of 16

How is Mean Time to Repair (MTTR) Calculated?Expressed mathematically, it is the total maintenance time divided by the total number of maintenance actions over a specific period.
Over the lifetime of an asset, each failure will vary depending on the severity of the issue. Some issues will require a simple parts swap
while others could take days to diagnose and repair. The frequency V repair time plot follows the lognormal distribution. We will have a
large number of repairs that are quick to repair, and a small number that take much longer.
Why is MTTR Important?For mission critical equipment, MTTR can have a dramatic effect on the organization’s bottom line. Taking too long to repair equipment
can mean product scrap, missed orders and soured business relationships. To limit the impact of MTTR, organizations have their own
maintenance teams, hold spare parts onsite or run parallel production lines.
How do you measure MTTR in MA CMMS?Every time a system is logged down for repair in Maintenance Assistant, the timestamp is logged in the database. The CMMS tracks the
repair time until the system is returned online back to production. It is then possible to run the MTTR reports to see how it trends over
time. If you break up the downtime further into sub components such as waiting technician, waiting part, under repair etc. you can
extract a very accurate calculation of MTTR.
CPUT: Logistics Engineering (LSE400S)
Page 5 of 16

What can MTTR tell you?Prediction of the number of hours that a system or component will be unavailable whilst undergoing maintenance is of vital importance in
reliability and availability studies. MTTR yields a lot of information that can help reliability engineers make informed decisions such as
repair or replace, hire, optimize maintenance schedules, store parts onsite or switch parts strategy. For example, as the system ages, it
may take longer to repair systems. MTTR will trend upwards prompting the repair versus replace decision.
You can also use MTTR to predict performance or the life cycle cost of new systems. Equipment manufacturers are now using a
modular design philosophy so parts or sub assemblies can be swapped out quickly and easily. Consider being faced with a purchasing
decision that involves 2 similar systems - one has a higher MTTR because repairable items are difficult to remove due to their location.
The additional time and costs to maintain should be factored into the life of the system to simplify the purchasing decision.
Manufacturers also use MTTR to justify redesigning or improving systems.
For an accurate calculation of MTTR, we must make the following assumptions:
One technician performs all tasks sequentially.
Appropriately trained personnel perform the maintenance.
Should you Focus on Asset Availability or Cost Reduction? Is this a question that is asked regularly in your organization? For many maintenance managers, asset management is a delicate balancing act between maximizing availability while lowering maintenance costs. Asset Availability and reliability are closely connected and discussed in a previous blog entitled How do Maintainability and Reliability affect Availability. In a nutshell, you can achieve better availability with betterreliability. Traditionally, maintenance has been viewed as a cost center in an organization; it costs money to hire maintenance technicians and purchase the spare parts to keep systems running smoothly. When things are good, orders are flying out the door so money is thrown at maintenance to ensure equipment availability is maximized. We run large inefficient maintenance teams, spare parts and specialist tooling are same day or vendors are called in out of office at premium rates so equipment is back to production as soon as possible. However, when orders drop, maintenance budgets are cut and the same level of asset availability is impossible to maintain. Systems are left down for longer periods until repairs can be completed economically. It is easy to visualize in the following graph:
CPUT: Logistics Engineering (LSE400S)
Page 6 of 16

CPUT: Logistics Engineering (LSE400S)
Page 7 of 16

Reliability costs are the business costs of unreliable systems. If you perform little or maintenance, your assets will become unreliable and
you may produce defective parts, you’ll miss important orders or you’ll consume more energy. There can also be other costs of
unreliable systems like environmental and occupational health and safety costs. The net result is poor customer satisfaction and lost
customers.
Maintenance costs are the cost of doing maintenace; be that reactive or preventive maintenance. If you perform more maintenance, or
spend more on maintenance such as holding spares, you may get better reliability and hence availability but your costs in doing so
increase disproportionally to the increase in availability. A 1% increase in availability does not mean a 1% increase in maintenance cost.
For example, you can increase the service interval of your car and it will make very little difference to reliability. It follows the law of
diminishing returns. So, the most cost effective situation is to operate at the lowest point on the total cost curve.
Page 8 of 16
CPUT: Logistics Engineering (LSE400S)

CPUT: Logistics Engineering (LSE400S)
Page 9 of 16
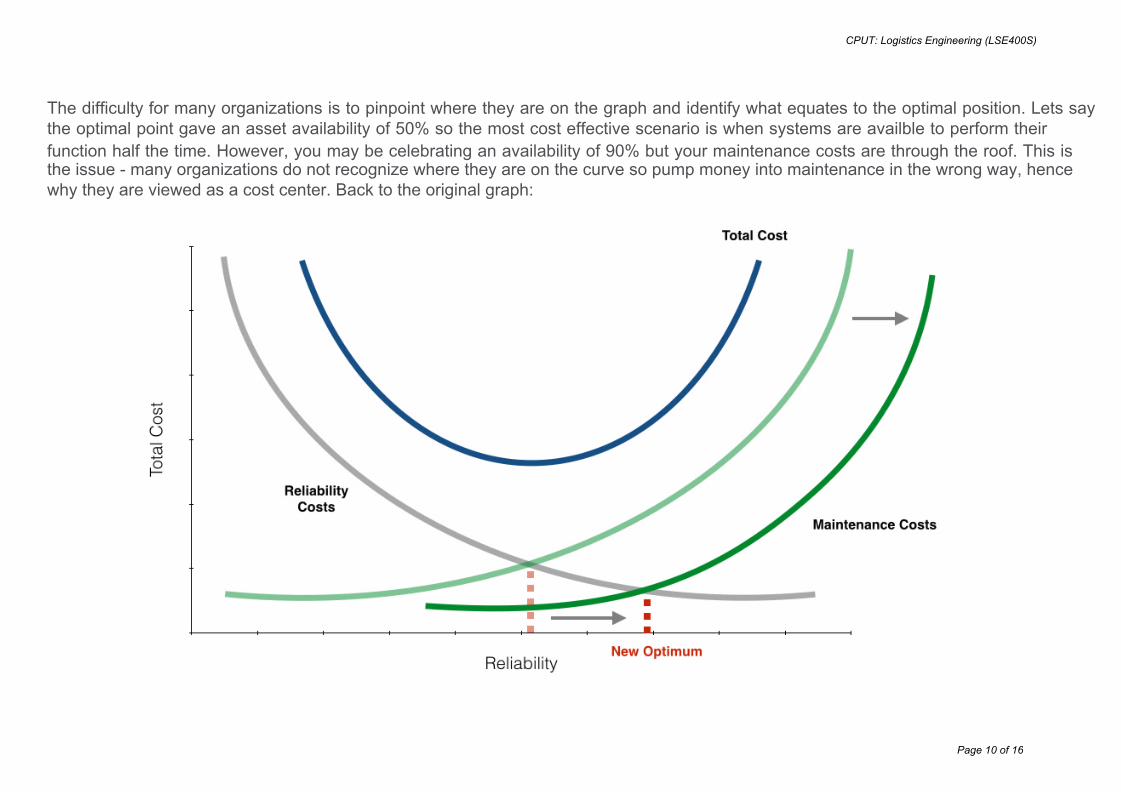
The difficulty for many organizations is to pinpoint where they are on the graph and identify what equates to the optimal position. Lets say the optimal point gave an asset availability of 50% so the most cost effective scenario is when systems are availble to perform their function half the time. However, you may be celebrating an availability of 90% but your maintenance costs are through the roof. This is the issue - many organizations do not recognize where they are on the curve so pump money into maintenance in the wrong way, hence why they are viewed as a cost center. Back to the original graph:
Page 10 of 16
CPUT: Logistics Engineering (LSE400S)
The solution is to shift the maintenance cost curve to the right bychanging the way you do maintenance. In effect, you need to reduce related costs while maintaining or improving reliability. This key is to be smarter about how you manage your assets and maintenance resources such as knowledge, labor and supplies. How do you do this?
1. Switch from reactive to proactive maintenance. Reactive maintenance costs 3-9x times more than planned maintenance so switching to a proactive way of doing maintenance can dramatically reduce your costs while delivering better reliability.
2. Track your maintenance activities in a CMMS like Maintenance Assistant. A CMMS is a great way to centralize your maintenance activities.
3. Smarter inventory management can minimize stock on hand; reducing associated carrying costs and limiting the impact of part obsolescence, freeing up much needed capital and increasing value for a company.
4. Consider condition-based maintenance on critical assets in your production facility so issues are highlighted before they turn into something more serious. Use MA Monitoring to connect your systems directly to your CMMS and trigger work orders the moment safe operating limits are breached. MA Monitoring enables real-time work orders and notifications to be created from the meters, triggers, alerts, alarms and state data provided by equipment and control monitoring systems.
5. Conduct ongoing training for your maintenance staff. Courses like CMRP will teach them best practices and help them better understand how to meet your reliability and cost goals.
6. Improve your occupational health and safety policies - Maintenance related incidents that injure personnel, damage equipment or have a negative affect on the environment will increase expenditure through litigation or imposed government penalties.
These are just a few examples of what you can do to improve the way you manage your assets and strive world-class availability of
90%+. In time, maintenance at your organization will evolve from a cost center to a value center, driving added value to the bottom line.
In the final graph below, we have shifted the maintenance cost curve to the right by doing smarter maintenace. The net result is greater
asset reliability at a lower cost. Check out the Version 5 test-drive on our homepage and see how Version 5 can improve the way you do
maintenance today.
CPUT: Logistics Engineering (LSE400S)
Page 11 of 16

CPUT: Logistics Engineering (LSE400S)
Page 12 of 16

What is Overall Equipment Effectiveness (OEE)?Overall Equipment Effectiveness is essentially how available your equipment is, how it performs versus its spec and what kind of quality
it produces. OEE can be used to monitor the efficiency of your manufacturing processes and to help identify areas of improvement. In
practice, OEE is calculated as the product of its three contributing factors:
OEE = Availability x Performance x QualityAvailability = The system is functioning when it is needed. Performance = A
measure of system throughput divided by its maximum throughput. Quality = The
number of good units divided by total units started.
OEE excludes planned shutdowns such as preventive maintenance, holiday shutdowns and periods when there are no orders to
produce. When you subtract this planned downtime from total plant operating time, you are left with planned production time. OEE is
calculated on planned production time. The ideal manufacturing facility, is one that produces the best product, as quickly as possible,
with no unscheduled down time. This is an OEE of 100% which is difficult, if not impossible to achieve. For discrete manufacturing
plants, world class OEE is generally considered being 85% or better, however, the average OEE score is ~60%.
What is OEE Used For?OEE is a good indicator of machine or system productivity. It can also give insights into the behaviours of personnel maintaining the
system. A bad maintenance technician will spend the day running around putting our fires. They’ll fix the problem but they won’t prevent
it from happening again. A good maintenance technician will perform regular inspections to spot failures before they occur, perform
recurring scheduled maintenance and put in measures to prevent further failure reoccurrence; resulting in less machine-related
downtime. OEE also provides a way of measuring the success of manufacturing, productivity or lean initiatives such as TPM.
CPUT: Logistics Engineering (LSE400S)
Page 13 of 16

When you identify the 3 different elements that make up OEE, it is easier to identify where improvements are possible and where to put
your focus. If availability is the focus, then you can run downtime reports in Maintenance Assistant CMMS and identify which issues are
causing the majority of the system stoppages. In reality, OEE measures the losses that affect your equipment. The 6 big losses are:
- Equipment failures
- Setup and adjustment time due to product changeover
- Idling or minor stoppages - jams, misfeeds, sensor errors etc.
- Reduced speed due to rough running or equipment wear
- Defects in operation or process
- Startup or reduced yield
CPUT: Logistics Engineering (LSE400S)
Page 14 of 16

Edge Ahead by Measuring Your OEEIn today’s fast pace economy, manufacturing organizations need to find ways of creating a competitive advantage over their
competition.Efficiency is one area that every manufacturing plant can improve on and the best way to measure efficiency is with OEE. If you don’t know your overall equipment effectiveness, then you don’t know how efficient your plant is but more importantly, you don’t
know how efficient your plant could be. You can calculate the availability element of the OEE equation using MA CMMS, but as you can
see from the table above, maintenance activities can impact all 3 elements of OEE. A preventive maintenance solution like Maintenance
Assistant CMMS is the ideal tool to track your schedule maintenance and inspections so issues can be identified before they turn into
something more serious. According to David Berger of Plant Services, a CMMS could deliver a 10% increase in availability, a 5%
increase in throughput and a 5% increase in quality of output. With a fully functioning CMMS, coupled with a preventive maintenance
philosophy, these gains result in a significant improvement in OEE and hence the company financials.
Preventative Maintenance Compliance (PM Compliance)Preventative Maintenance (PM) is taking precautionary and proactive steps against unscheduled equipment downtime and other
avoidable failures. The purpose of the PM is to institute scheduled inspections so that defects can be spotted before they evolve into
something more severe. Therefore, it is important to complete these PM’s and to complete them on time. Your preventive maintenance
compliance (sometimes referred to as PM Compliance or PMC) score is the percentage of scheduled PM work orders that get done in a
defined time interval.
Steps:- Define the preventive maintenance schedule and tasks for each asset
- Conduct the preventive maintenance at the defined interval
- Measure the percentage of the PM work-orders completed in the defined interval.
That is your PMC score
Example:Week 1 5 PM work orders scheduled, 4 completed
Week 2 5 PM work orders scheduled, 1 completed
Week 3 5 PM work orders scheduled, 5 completed
Week 4 5 PM work orders scheduled, 4 completed
Your PMC score = (4+1+5+4)/(5+5+5+5)= 0.7 or 70% for the Month
CPUT: Logistics Engineering (LSE400S)
Page 15 of 16
How do you Measure PM Compliance?
If you’re still using the white board or excel, it is next to impossible to get an accurate indicator of PM compliance. Saying that, without a
CMMS it is next to impossible to adequately track any maintenance metrics or costs! The easiest way to calculate your PM compliance is
using your Maintenance Assistant CMMS. It is quite common for organizations to use the PMC metrics to measure maintenance
performance although PM compliance gets a mixed reception from operations managers. PM compliance could be 100% yet system
downtime could still be a major issue. This is because the formula only measures whether the PM was complete or not, regardless if it
was weeks late. Therefore, you should work to the 10% rule of preventive maintenance. As I mentioned, the 10% rule states that a
preventive maintenance action should be completed within 10% of the scheduled maintenance interval. For example, a quarterly PM
every 90 days, should be completed within 9 days of the due date or it is out of compliance. The 10% rule helps keep your PM intervals
constant, reducing the time variable variation, thus improving reliability.
If done correctly, measuring PM compliance and charting that against unscheduled breakdowns and costs is an excellent way to
determine if your PM program is working for you or if it needs to be adjusted with either more frequent PMS or longer PMS to balance
uptime, productivity, maintenance costs, reliability and asset life.
CPUT: Logistics Engineering (LSE400S)
Page 16 of 16