Embed Size (px)
Citation preview
2013 Financial Services IT Availability and Business Continuity Benchmark Survey Published by
© Continuity Software, 2013 2
Executive Summary
This benchmark survey presents service availability metrics and related corporate practices that allow business continuity, disaster recovery, and IT specialists to compare their organization’s performance and practices to their peers.
The results presented here are based on responses from 55 professionals from financial services organizations collected through an online survey.
Some of the key findings of the survey include:
• Most organizations have commendable service availability goals for mission-critical systems: 89% have an availability goal of >99.76% (less than 22 hours of downtime a year), 67% have a goal of higher than 99.91% availability (less than 8 hours of downtime a year), and 25% have a goal of 99.99% availability (less than one hour of downtime a year).
• At the same time, financial services organizations are among the worst-performing sectors in terms of service
availability. 41% of the organizations surveyed did not meet their own service availability goals for mission-critical systems in 2012.
• Less than half the organizations (42%) conduct a complete disaster recovery test annually or more often, and as many as 26% don’t ever conduct a complete test. Organizations with high confidence in disaster recovery testing are 57% more likely to conduct such a test once every six months or more often.
• 73% of the respondents run some mission-critical applications in a private cloud environment, while 30% run such applications in the public cloud. At the same time, just about half of these organizations (51%) have a disaster recovery solution for their cloud systems and 37% have no process in place to test the reliability of their private cloud systems.
© Continuity Software, 2013 3
Table of Contents
What Drives Service Availability Goals? ........................................................................................................................................... 4
Strategies and Tools to Ensure Service Availability .................................................................................................................... 5
How Effective are These Strategies and Tools? ............................................................................................................................. 6
Top Challenges in Ensuring Service Availability .......................................................................................................................... 7
Service Availability Goals ........................................................................................................................................................................ 8
Service Availability: The Reality ............................................................................................................................................................ 9
What Were the Causes for Outages? ................................................................................................................................................. 10
Which Industries Experience the Most Downtime? ................................................................................................................... 11
How Often Does Disaster Recovery Testing Take Place?......................................................................................................... 12
What Are the Top Challenges in Disaster Recovery Testing? ................................................................................................ 13
Confidence in Disaster Recovery Testing ...................................................................................................................................... 14
Organization with High Confidence in Disaster Recovery Testing Conduct Testing More Often .......................... 15
Disaster Recovery / Failover Capacity ........................................................................................................................................... 16
Mission-critical in the Cloud ............................................................................................................................................................... 17
Private Cloud Disaster Recovery and Availability Testing ...................................................................................................... 18
Disaster Recovery and High Availability for Cloud Applications ......................................................................................... 19
Respondent Demographics .................................................................................................................................................................. 20
Sign up for a Service Availability Assessment ............................................................................................................................. 22
© Continuity Software, 2013 4
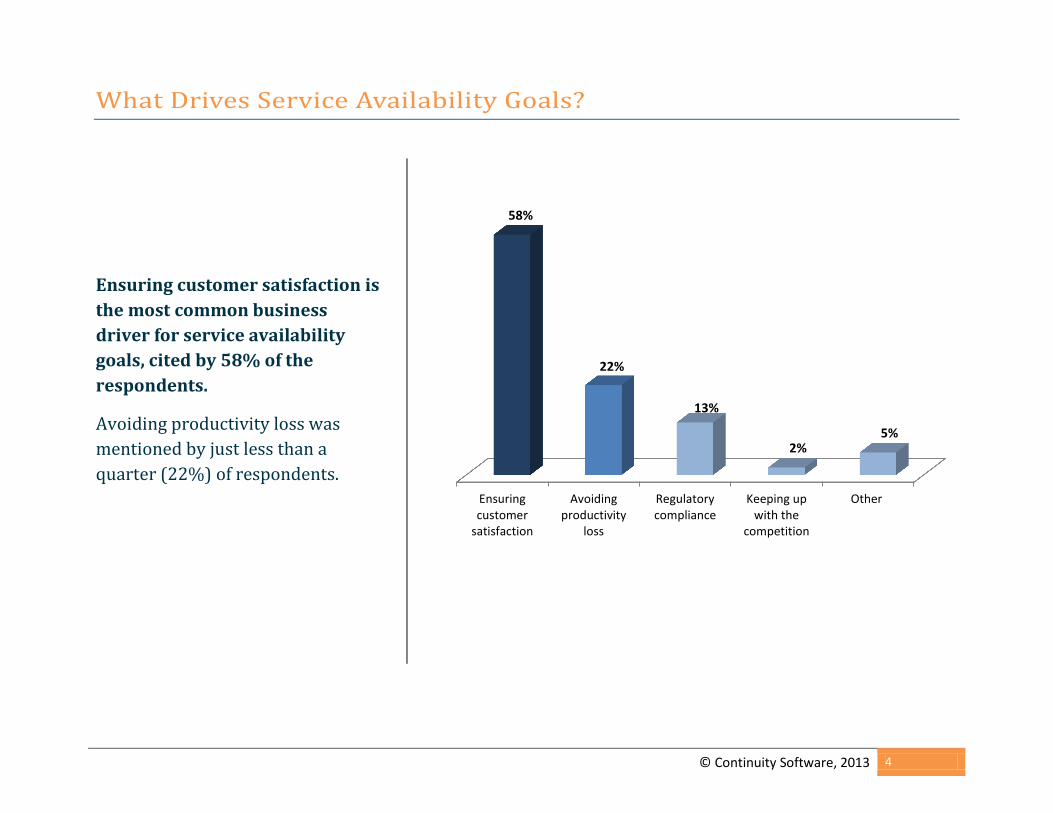
What Drives Service Availability Goals?
Ensuring customer satisfaction is the most common business driver for service availability goals, cited by 58% of the respondents.
Avoiding productivity loss was mentioned by just less than a quarter (22%) of respondents.
Ensuringcustomer
satisfaction
Avoidingproductivity
loss
Regulatorycompliance
Keeping upwith the
competition
Other
58%
22%
13%
2% 5%
© Continuity Software, 2013 5
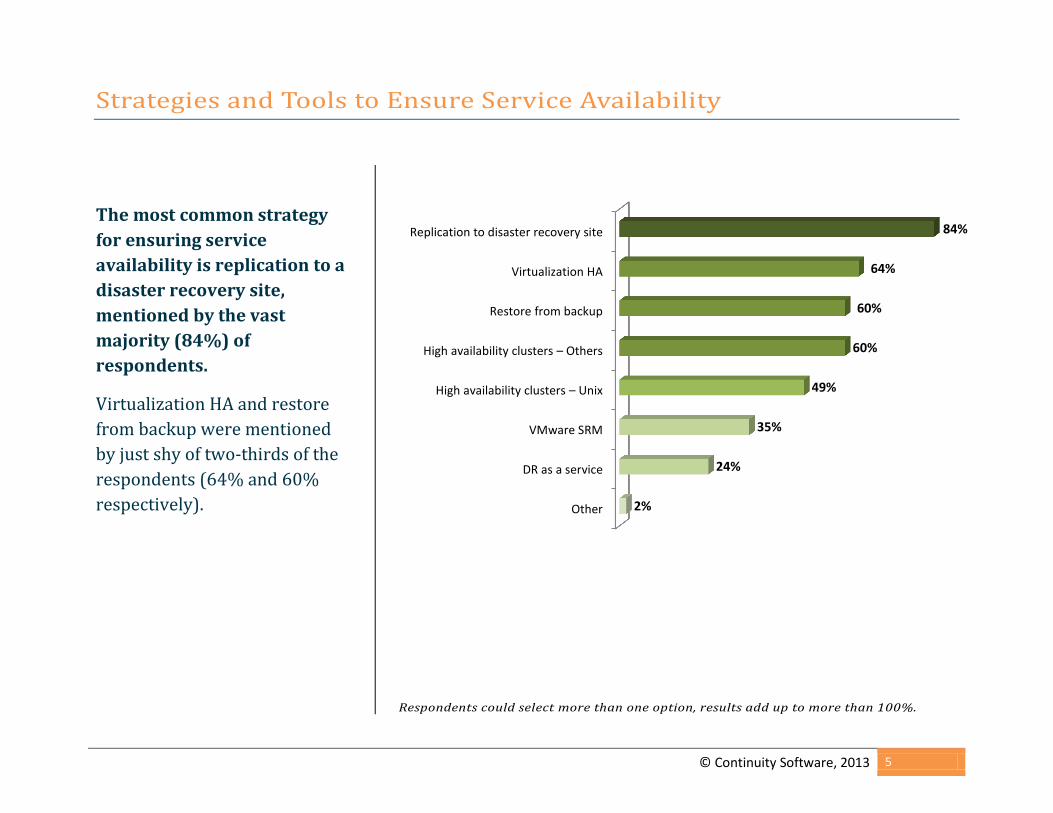
Strategies and Tools to Ensure Service Availability
The most common strategy for ensuring service availability is replication to a disaster recovery site, mentioned by the vast majority (84%) of respondents.
Virtualization HA and restore from backup were mentioned by just shy of two-thirds of the respondents (64% and 60% respectively).
Respondents could select more than one option, results add up to more than 100%.
Other
DR as a service
VMware SRM
High availability clusters – Unix
High availability clusters – Others
Restore from backup
Virtualization HA
Replication to disaster recovery site
2%
24%
35%
49%
60%
60%
64%
84%
© Continuity Software, 2013 6
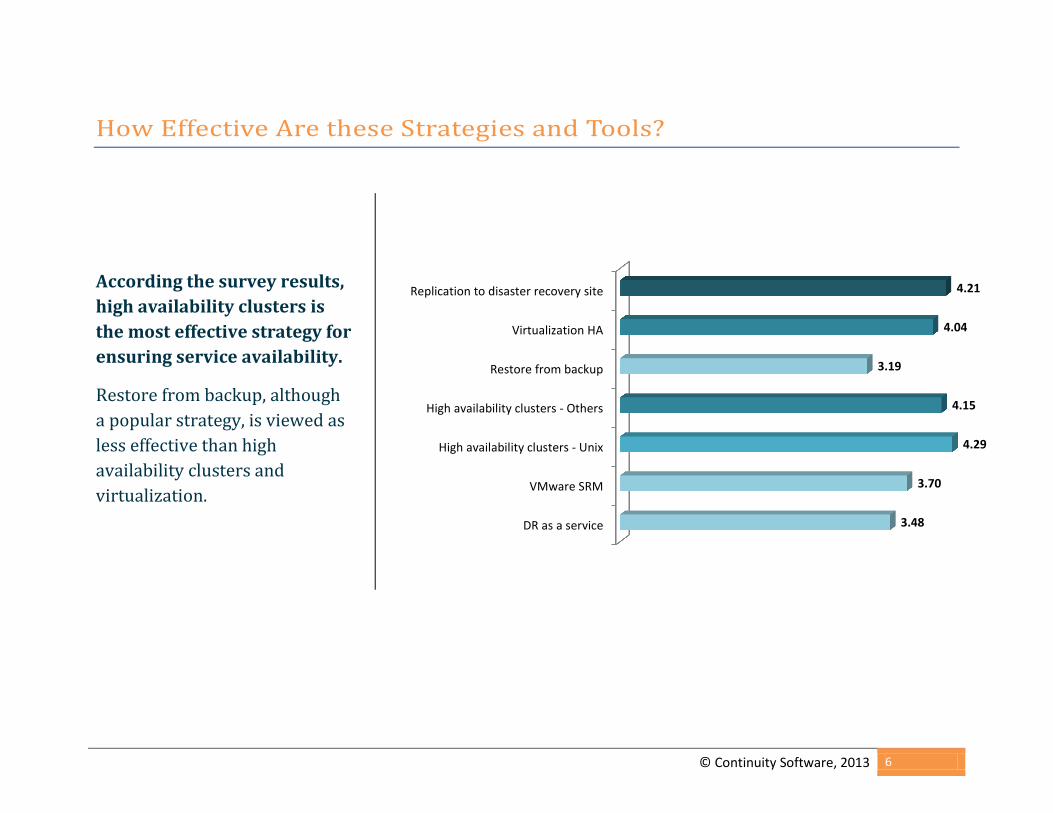
How Effective Are these Strategies and Tools?
According the survey results, high availability clusters is the most effective strategy for ensuring service availability.
Restore from backup, although a popular strategy, is viewed as less effective than high availability clusters and virtualization.
DR as a service
VMware SRM
High availability clusters - Unix
High availability clusters - Others
Restore from backup
Virtualization HA
Replication to disaster recovery site
3.48
3.70
4.29
4.15
3.19
4.04
4.21
© Continuity Software, 2013 7
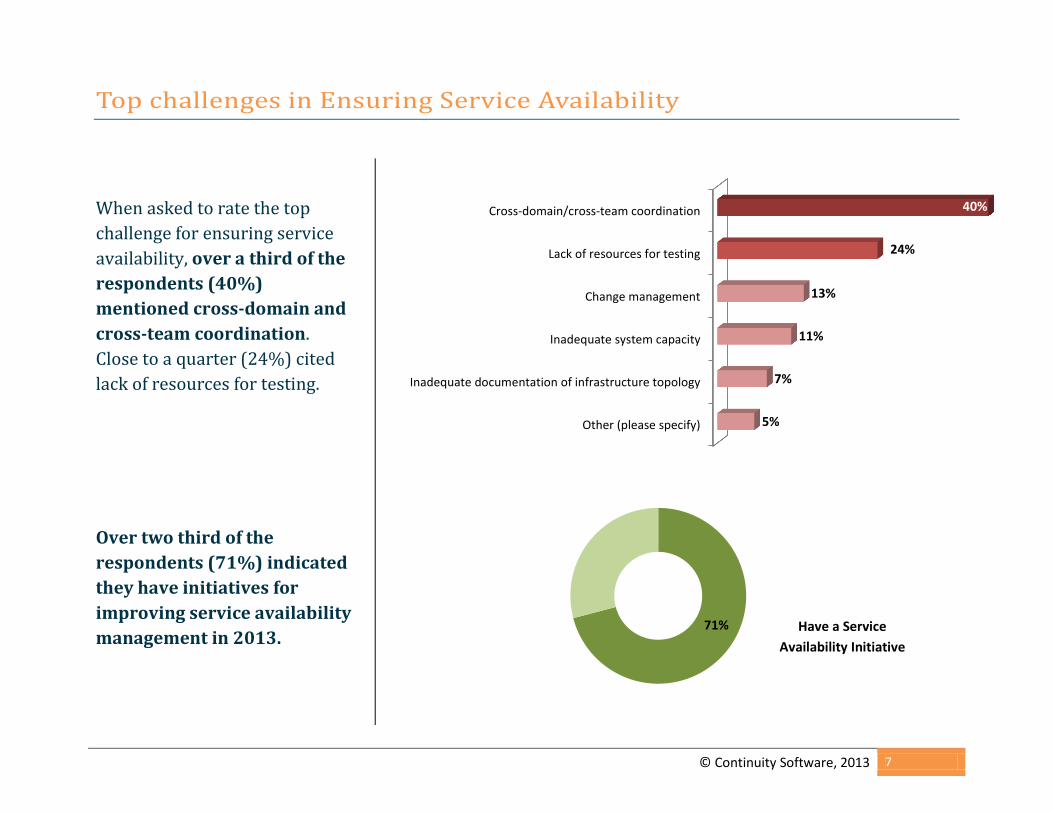
Top challenges in Ensuring Service Availability
When asked to rate the top challenge for ensuring service availability, over a third of the respondents (40%) mentioned cross-domain and cross-team coordination. Close to a quarter (24%) cited lack of resources for testing.
Over two third of the respondents (71%) indicated they have initiatives for improving service availability management in 2013.
Other (please specify)
Inadequate documentation of infrastructure topology
Inadequate system capacity
Change management
Lack of resources for testing
Cross-domain/cross-team coordination
5%
7%
11%
13%
24%
40%
71% Have a Service Availability Initiative
© Continuity Software, 2013 8
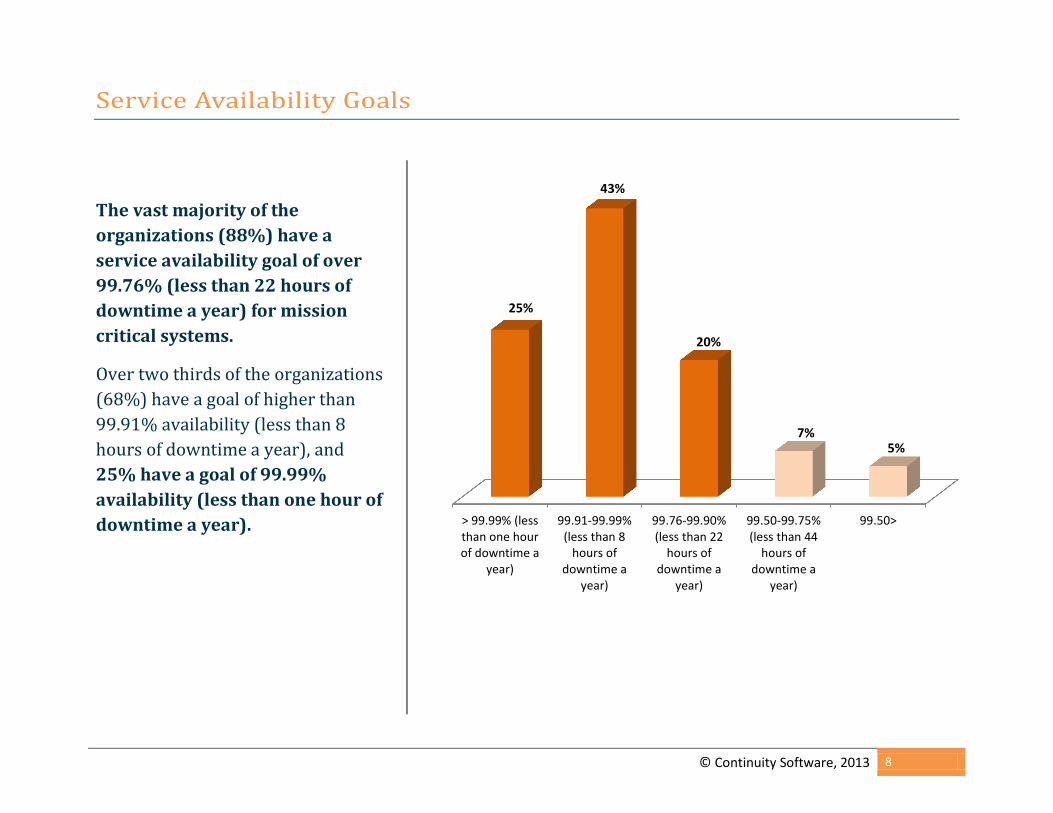
Service Availability Goals
The vast majority of the organizations (88%) have a service availability goal of over 99.76% (less than 22 hours of downtime a year) for mission critical systems.
Over two thirds of the organizations (68%) have a goal of higher than 99.91% availability (less than 8 hours of downtime a year), and 25% have a goal of 99.99% availability (less than one hour of downtime a year).
> 99.99% (lessthan one hourof downtime a
year)
99.91-99.99%(less than 8
hours ofdowntime a
year)
99.76-99.90%(less than 22
hours ofdowntime a
year)
99.50-99.75%(less than 44
hours ofdowntime a
year)
99.50>
25%
43%
20%
7% 5%
© Continuity Software, 2013 9
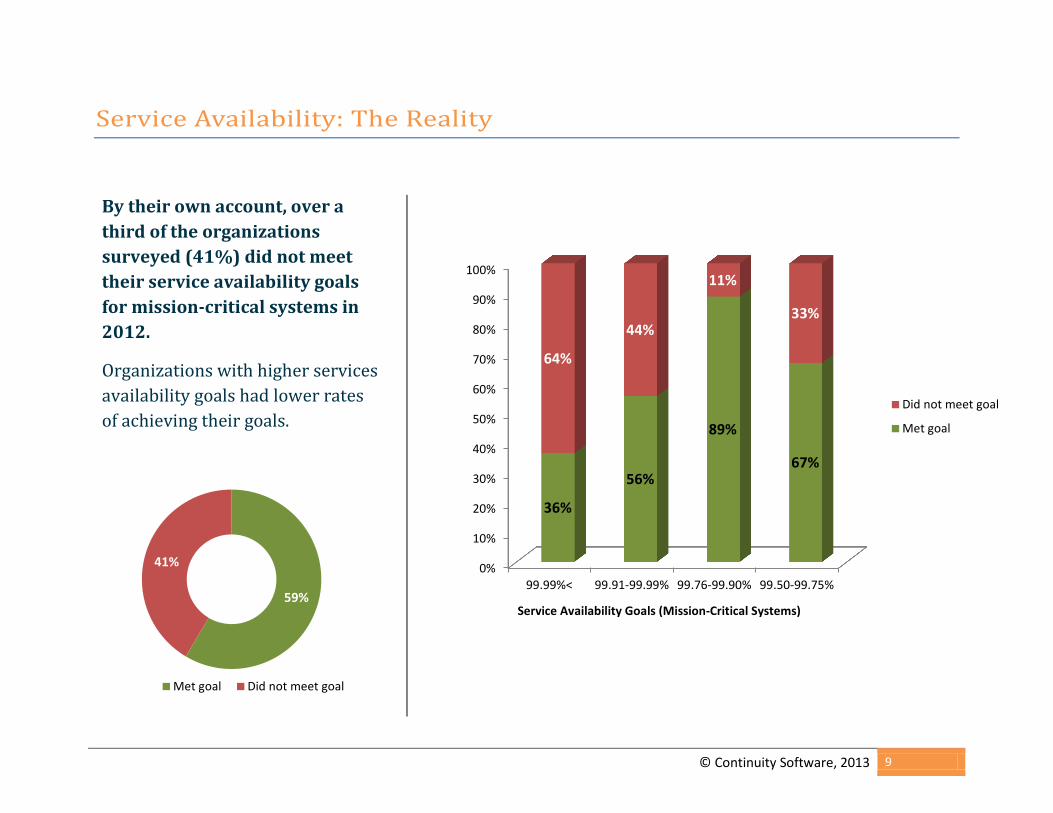
Service Availability: The Reality
By their own account, over a third of the organizations surveyed (41%) did not meet their service availability goals for mission-critical systems in 2012.
Organizations with higher services availability goals had lower rates of achieving their goals.
59%
41%
Met goal Did not meet goal
0%
10%
20%
30%
40%
50%
60%
70%
80%
90%
100%
99.99%< 99.91-99.99% 99.76-99.90% 99.50-99.75%
36%
56%
89%
67%
64%
44%
11%
33%
Did not meet goal
Met goal
Service Availability Goals (Mission-Critical Systems)
© Continuity Software, 2013 10
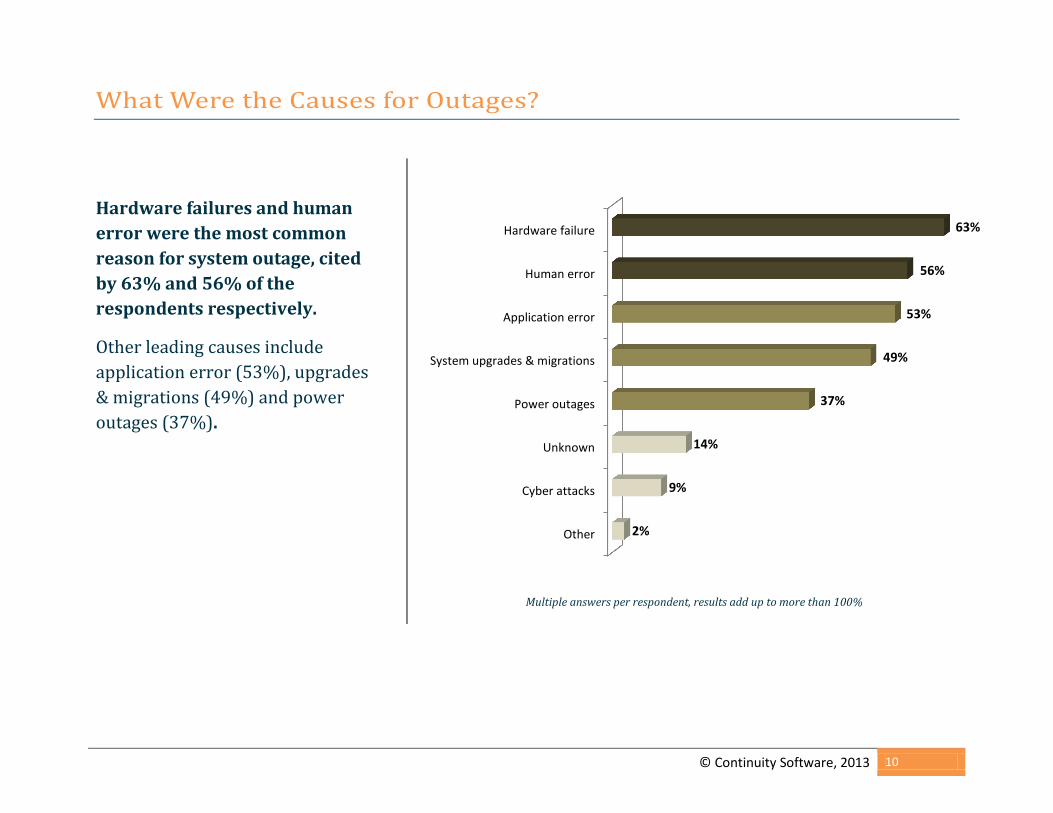
What Were the Causes for Outages?
Hardware failures and human error were the most common reason for system outage, cited by 63% and 56% of the respondents respectively.
Other leading causes include application error (53%), upgrades & migrations (49%) and power outages (37%).
Multiple answers per respondent, results add up to more than 100%
Other
Cyber attacks
Unknown
Power outages
System upgrades & migrations
Application error
Human error
Hardware failure
2%
9%
14%
37%
49%
53%
56%
63%
© Continuity Software, 2013 11
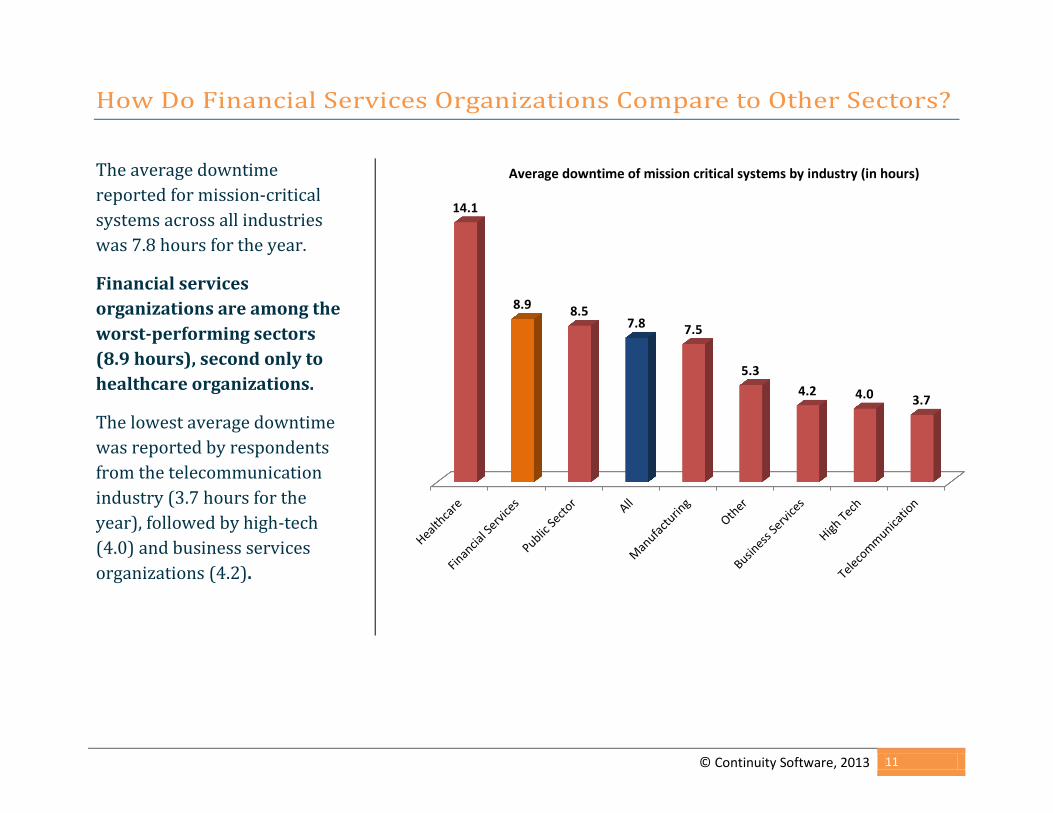
How Do Financial Services Organizations Compare to Other Sectors?
The average downtime reported for mission-critical systems across all industries was 7.8 hours for the year.
Financial services organizations are among the worst-performing sectors (8.9 hours), second only to healthcare organizations.
The lowest average downtime was reported by respondents from the telecommunication industry (3.7 hours for the year), followed by high-tech (4.0) and business services organizations (4.2).
14.1
8.9 8.5 7.8 7.5
5.3 4.2 4.0 3.7
Average downtime of mission critical systems by industry (in hours)
© Continuity Software, 2013 12
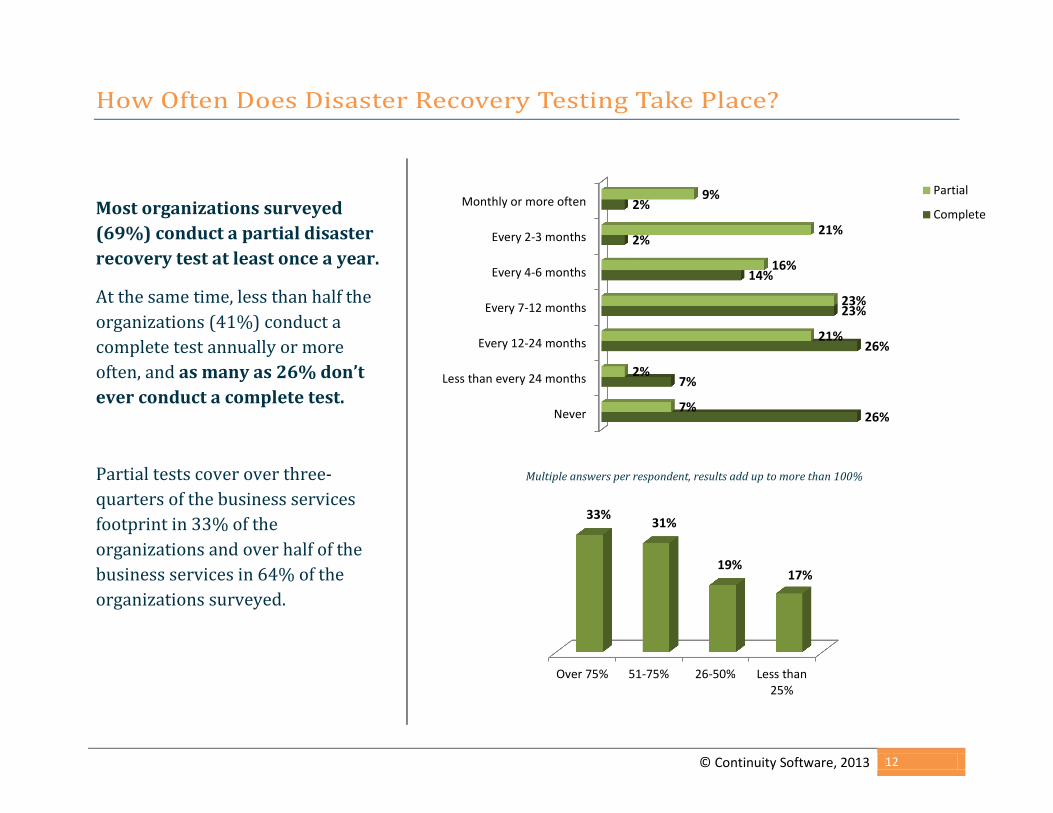
How Often Does Disaster Recovery Testing Take Place?
Most organizations surveyed (69%) conduct a partial disaster recovery test at least once a year.
At the same time, less than half the organizations (41%) conduct a complete test annually or more often, and as many as 26% don’t ever conduct a complete test.
Partial tests cover over three-quarters of the business services footprint in 33% of the organizations and over half of the business services in 64% of the organizations surveyed.
Multiple answers per respondent, results add up to more than 100%
Never
Less than every 24 months
Every 12-24 months
Every 7-12 months
Every 4-6 months
Every 2-3 months
Monthly or more often
26%
7%
26%
23%
14%
2%
2%
7%
2%
21%
23%
16%
21%
9% Partial
Complete
Over 75% 51-75% 26-50% Less than25%
33% 31%
19% 17%
© Continuity Software, 2013 13
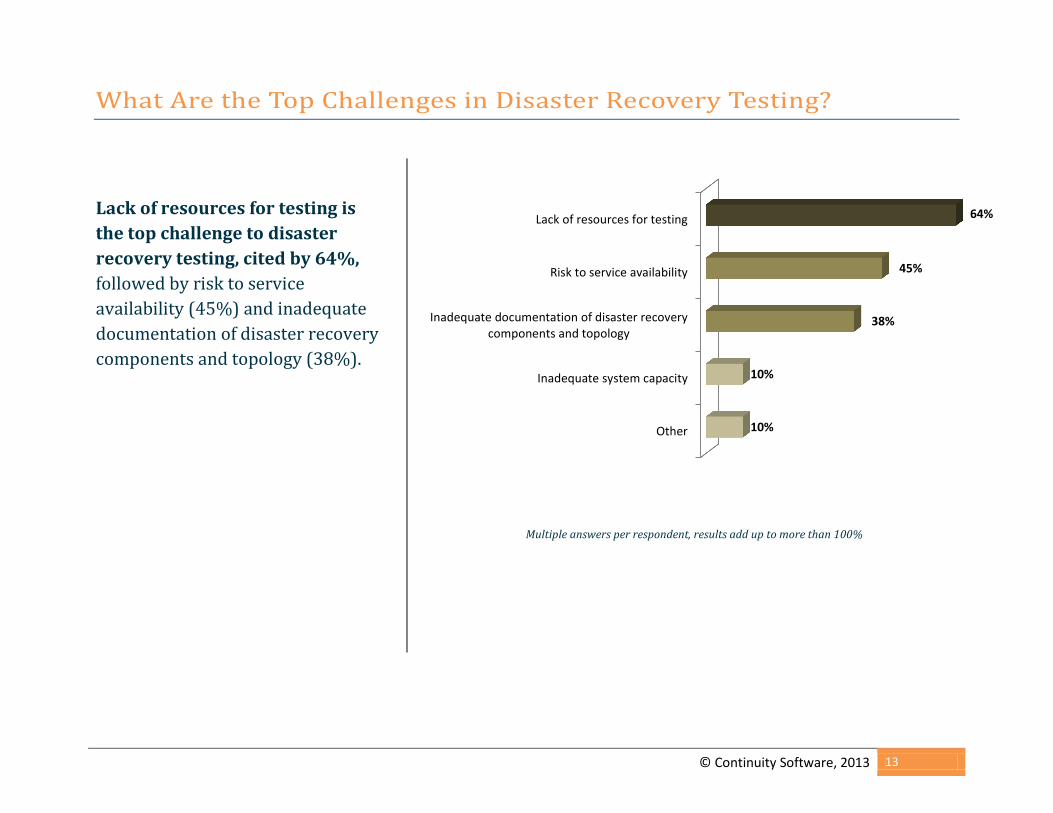
What Are the Top Challenges in Disaster Recovery Testing?
Lack of resources for testing is the top challenge to disaster recovery testing, cited by 64%, followed by risk to service availability (45%) and inadequate documentation of disaster recovery components and topology (38%).
Multiple answers per respondent, results add up to more than 100%
Other
Inadequate system capacity
Inadequate documentation of disaster recoverycomponents and topology
Risk to service availability
Lack of resources for testing
10%
10%
38%
45%
64%
© Continuity Software, 2013 14
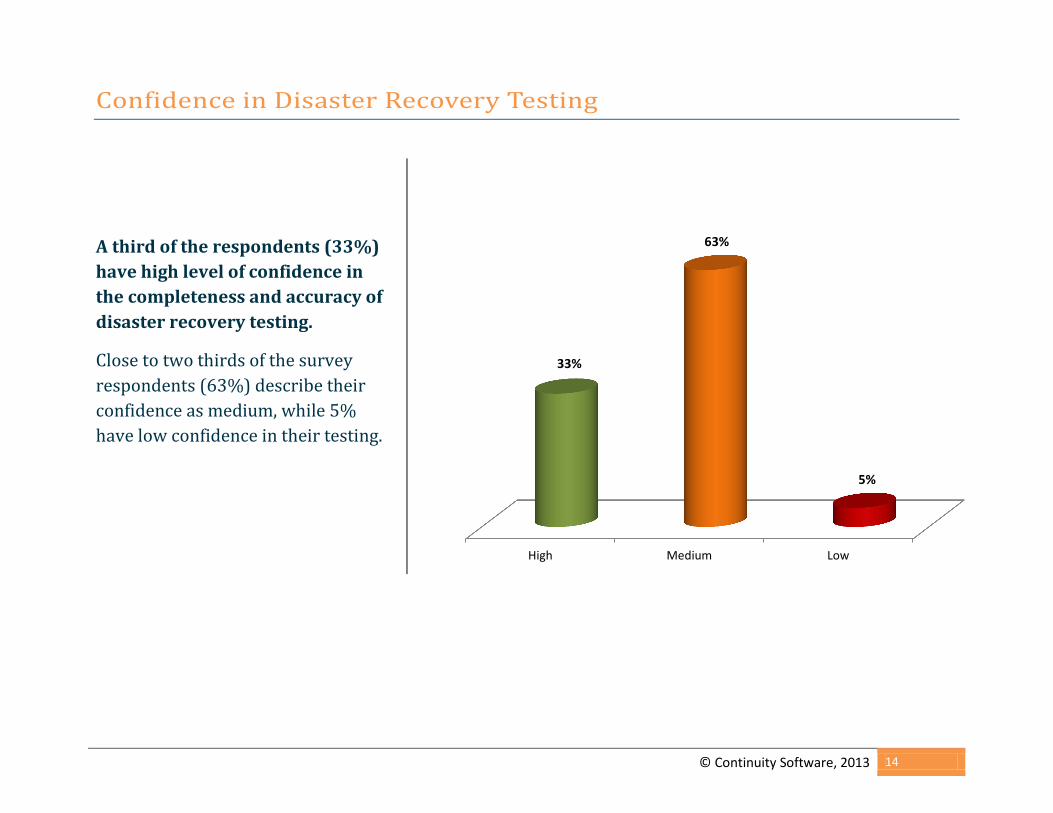
Confidence in Disaster Recovery Testing
A third of the respondents (33%) have high level of confidence in the completeness and accuracy of disaster recovery testing.
Close to two thirds of the survey respondents (63%) describe their confidence as medium, while 5% have low confidence in their testing.
High Medium Low
33%
63%
5%
© Continuity Software, 2013 15
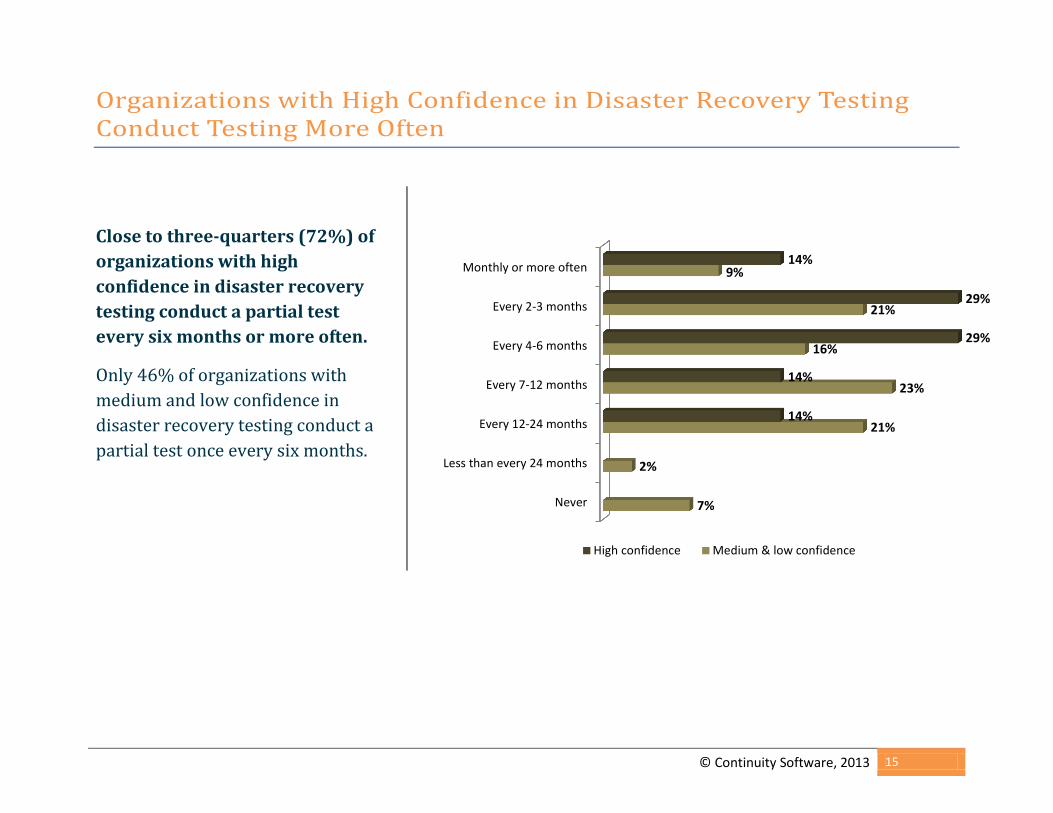
Organizations with High Confidence in Disaster Recovery Testing Conduct Testing More Often
Close to three-quarters (72%) of organizations with high confidence in disaster recovery testing conduct a partial test every six months or more often.
Only 46% of organizations with medium and low confidence in disaster recovery testing conduct a partial test once every six months.
Never
Less than every 24 months
Every 12-24 months
Every 7-12 months
Every 4-6 months
Every 2-3 months
Monthly or more often
7%
2%
21%
23%
16%
21%
9%
14%
14%
29%
29%
14%
High confidence Medium & low confidence
© Continuity Software, 2013 16
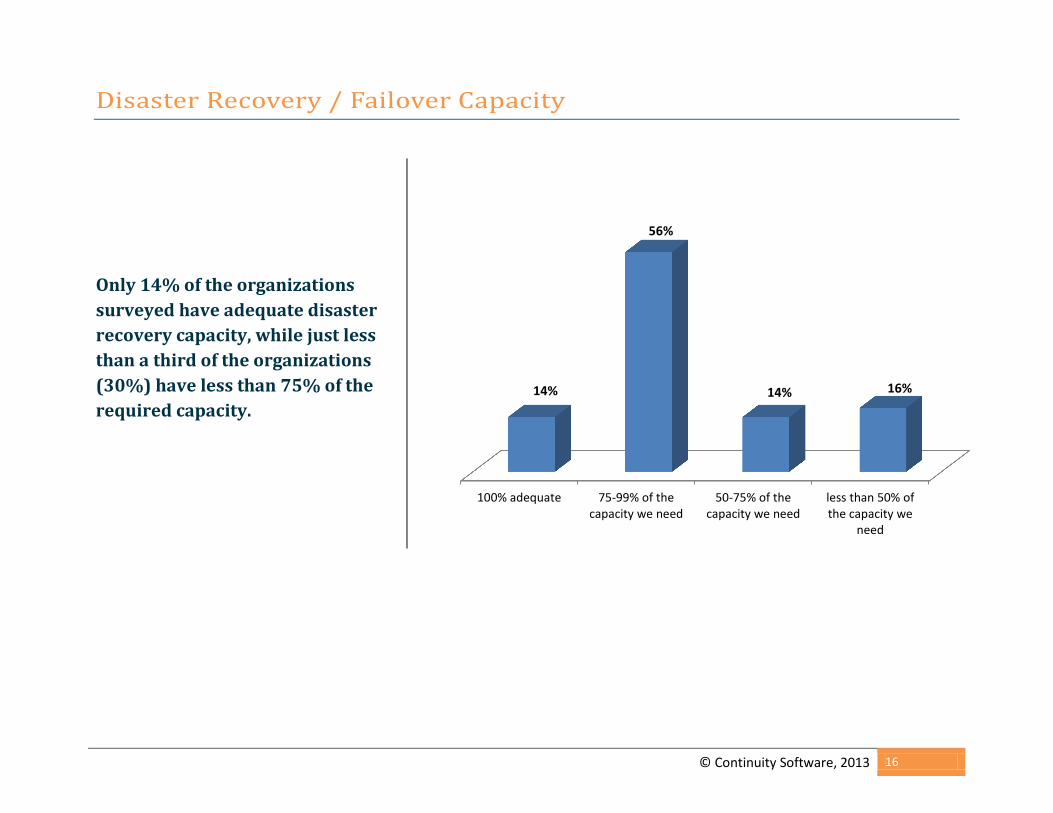
Disaster Recovery / Failover Capacity
Only 14% of the organizations surveyed have adequate disaster recovery capacity, while just less than a third of the organizations (30%) have less than 75% of the required capacity.
100% adequate 75-99% of thecapacity we need
50-75% of thecapacity we need
less than 50% ofthe capacity we
need
14%
56%
14% 16%
© Continuity Software, 2013 17
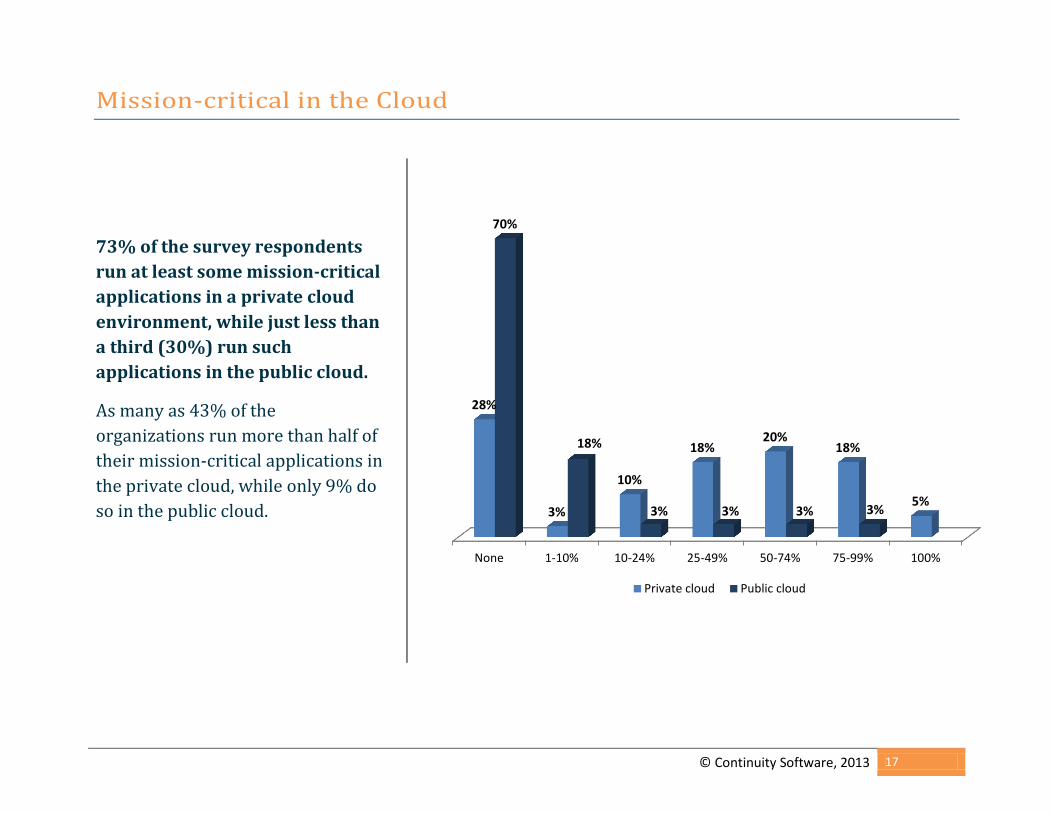
Mission-critical in the Cloud
73% of the survey respondents run at least some mission-critical applications in a private cloud environment, while just less than a third (30%) run such applications in the public cloud.
As many as 43% of the organizations run more than half of their mission-critical applications in the private cloud, while only 9% do so in the public cloud.
None 1-10% 10-24% 25-49% 50-74% 75-99% 100%
28%
3%
10%
18% 20%
18%
5%
70%
18%
3% 3% 3% 3%
Private cloud Public cloud
© Continuity Software, 2013 18
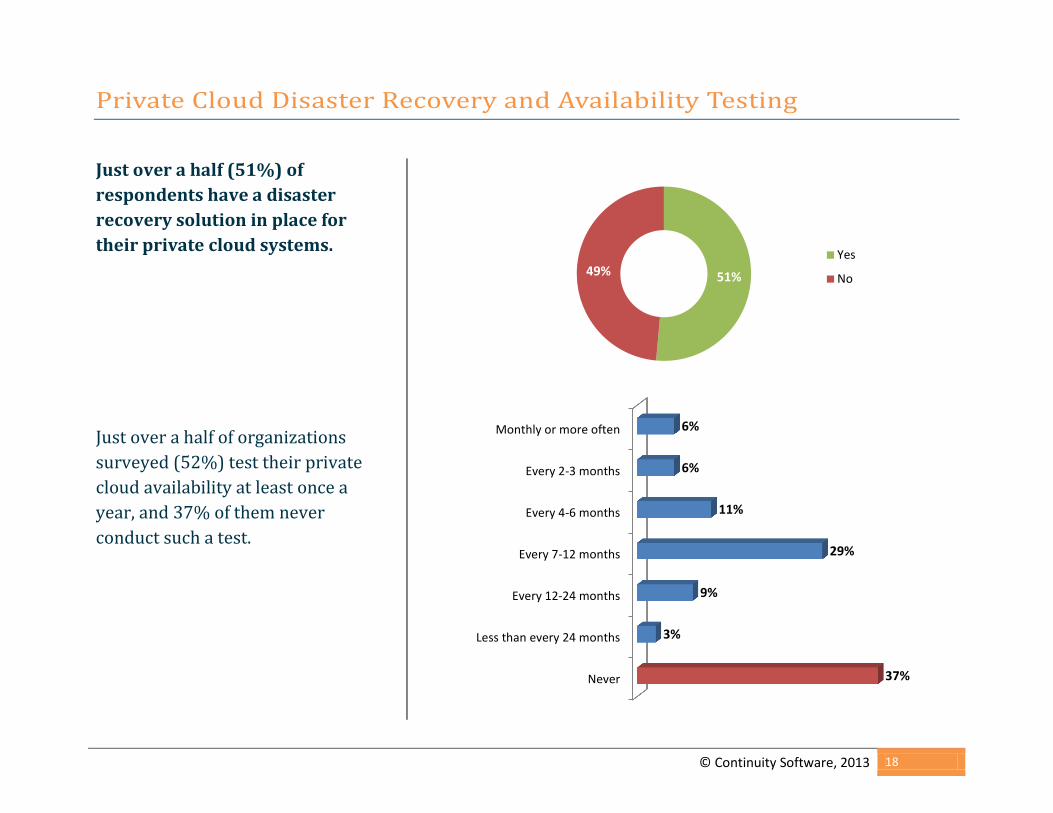
Private Cloud Disaster Recovery and Availability Testing
Just over a half (51%) of respondents have a disaster recovery solution in place for their private cloud systems.
Just over a half of organizations surveyed (52%) test their private cloud availability at least once a year, and 37% of them never conduct such a test.
51% 49% Yes
No
Never
Less than every 24 months
Every 12-24 months
Every 7-12 months
Every 4-6 months
Every 2-3 months
Monthly or more often
37%
3%
9%
29%
11%
6%
6%
© Continuity Software, 2013 19
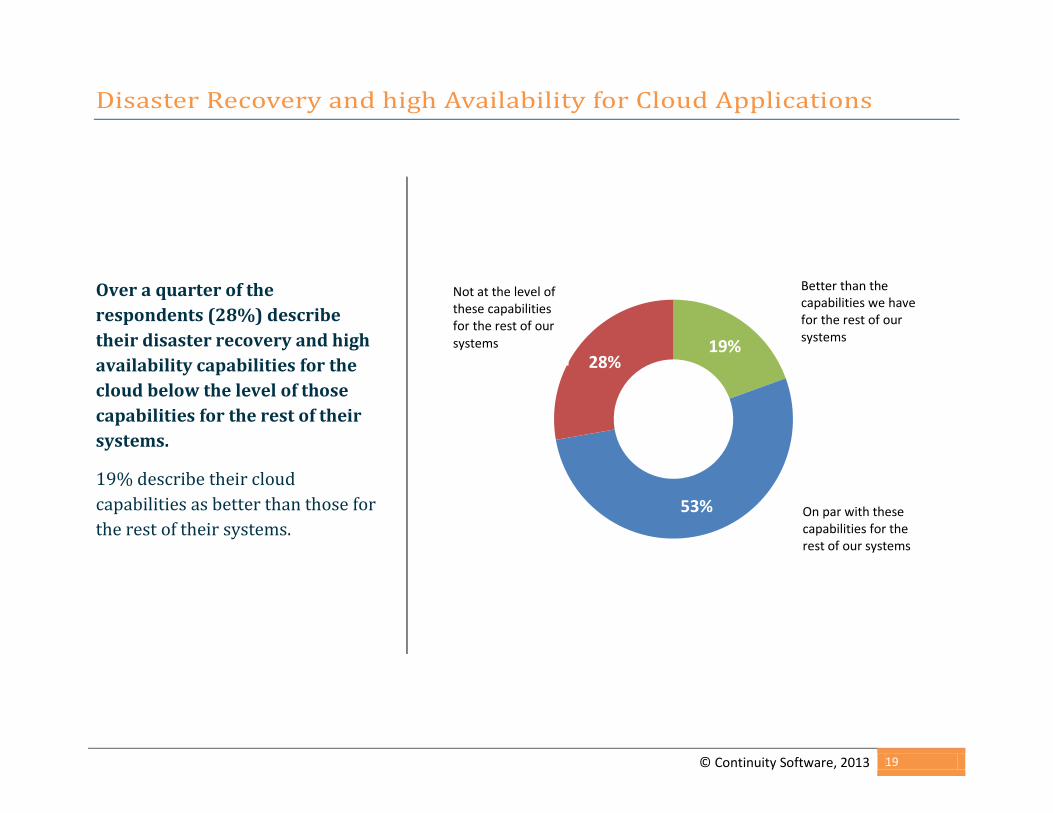
Disaster Recovery and high Availability for Cloud Applications
Over a quarter of the respondents (28%) describe their disaster recovery and high availability capabilities for the cloud below the level of those capabilities for the rest of their systems.
19% describe their cloud capabilities as better than those for the rest of their systems.
19%
53%
28%
On par with these capabilities for the rest of our systems
Better than the capabilities we have for the rest of our systems
Not at the level of these capabilities for the rest of our systems
© Continuity Software, 2013 20
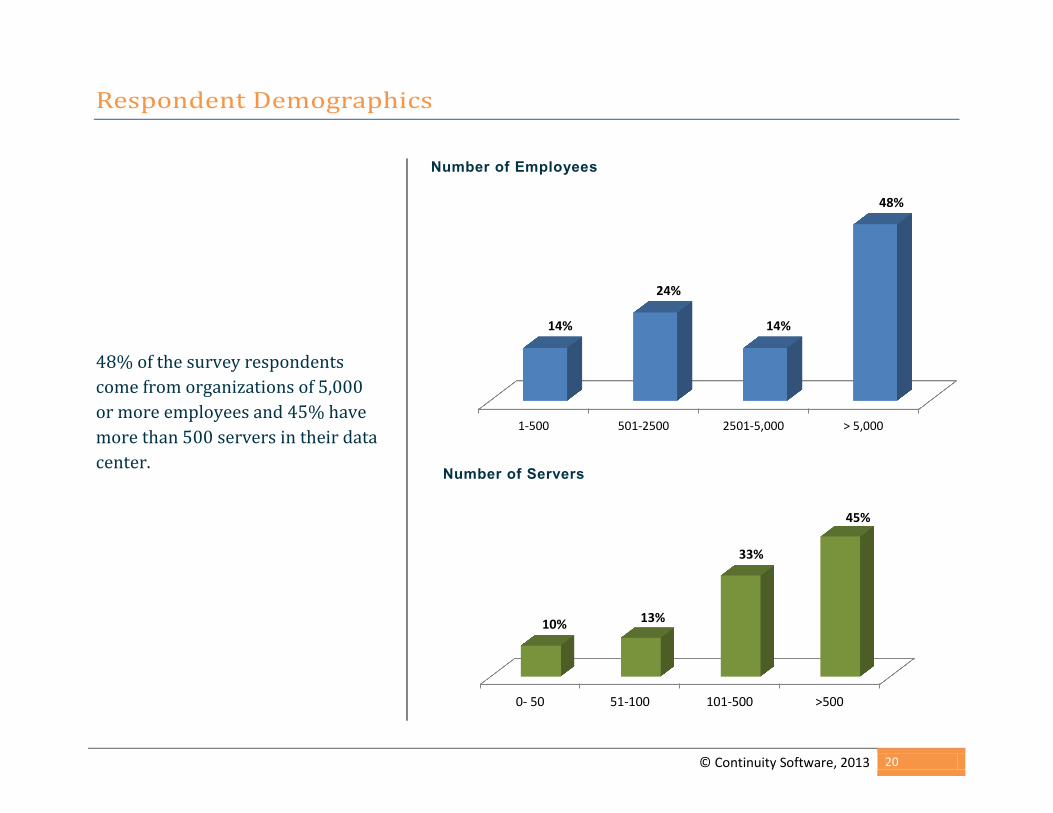
Respondent Demographics
48% of the survey respondents come from organizations of 5,000 or more employees and 45% have more than 500 servers in their data center.
Number of Employees
Number of Servers
1-500 501-2500 2501-5,000 > 5,000
14%
24%
14%
48%
0- 50 51-100 101-500 >500
10% 13%
33%
45%
© Continuity Software, 2013 21
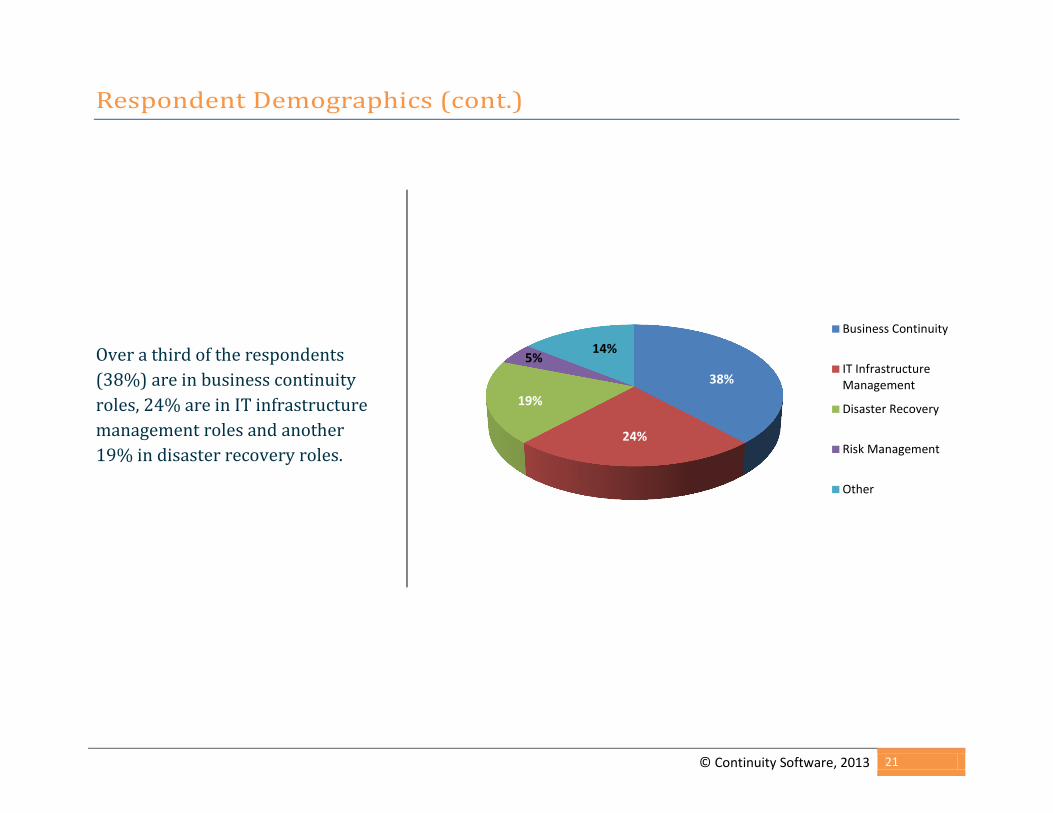
Respondent Demographics (cont.)
Over a third of the respondents (38%) are in business continuity roles, 24% are in IT infrastructure management roles and another 19% in disaster recovery roles.
38%
24%
19%
5% 14%
Business Continuity
IT InfrastructureManagement
Disaster Recovery
Risk Management
Other
© Continuity Software, 2013 22
Sign up for a Service Availability Assessment
• Find hidden risks that can jeopardize your data center
• Test your environment against a database of 5,000+ documented availability risks
• Get actionable recommendations that will help you eliminate availability risks before they impact your business
100% of the companies that have performed the assessment uncovered vulnerabilities that were previously undetected! Sign up today
About Continuity Software Continuity Software is a leading provider of Service Availability Management solutions. Our software helps many of the world’s largest organizations mitigate downtime and data loss risks by monitoring production and remote replication environments to detect hidden vulnerabilities and gaps. Using our solutions, you will be confident your service availability and data protection goals can be met on a consistent basis. For more information Website: www.continuitysoftware.com Email: [email protected] Tel: 1-888-782-8170 or +1-646.216.8628