Embed Size (px)
Citation preview
Electronic copy available at: http://ssrn.com/abstract=1589731
ISSN 1045-6333
HARVARD JOHN M. OLIN CENTER FOR LAW, ECONOMICS, AND BUSINESS
LEARNING AND THE DISAPPEARING ASSOCIATION BETWEEN GOVERNANCE AND RETURNS
Lucian A. Bebchuk, Alma Cohen, and Charles C. Y. Wang
Discussion Paper No. 667
04/2010
Harvard Law School Cambridge, MA 02138
This paper can be downloaded without charge from:
The Harvard John M. Olin Discussion Paper Series: http://www.law.harvard.edu/programs/olin_center/
The Social Science Research Network Electronic Paper Collection:
http://ssrn.com/abstract=1589731
This paper is also a discussion paper of the John M. Olin Center's Program on Corporate Governance
Electronic copy available at: http://ssrn.com/abstract=1589731
Learning and the Disappearing
Association between Governance and Returns
Lucian A. Bebchuk,* Alma Cohen,** and Charles C.Y. Wang***
Abstract In an important and influential work, Gompers, Ishii, and Metrick (2003) show that a
trading strategy based on an index of 24 governance provisions (G-Index) would have earned abnormal returns during the 1991-1999 period, and this intriguing finding has attracted much attention ever since it was reported. We show that the G-Index (as well as the E-Index based on a subset of the six provisions that matter the most) was no longer associated with abnormal returns during the period of 2000-2008, or any sub-periods within it, and we provide evidence consistent with the hypothesis that the disappearance of the governance-returns association was due to market participants’ learning to appreciate the difference between firms scoring well and poorly on the governance indices. Consistent with the learning hypothesis, we document that (i) attention to corporate governance from the media, institutional investors, and researchers has exploded in the beginning of the 2000s and remained on a high level since then, and (ii) until the beginning of the 2000s, but not subsequently, market participants were more positively surprised by the earning announcements of good-governance firms than by those of poor-governance firms. Our results are robust to excluding new economy firms or to focusing solely on firms in non-competitive industries. While the G and E indices could no longer generate abnormal returns in the 2000s, their negative association with Tobin’s Q persists and they thus remain valuable tools for researchers, policymakers, and investors.
Keywords: Corporate governance, governance indices, shareholder rights, entrenchment, market efficiency, learning, abnormal returns, earning announcements, analyst forecasts, IRRC provisions, behavioral finance, asset pricing. JEL Classification: D03, G10, G12, G30, G34, K22
* Harvard Law School and NBER. ** Tel-Aviv University Eitan Berglas School of Economics, Harvard Law School, and NBER. *** Stanford University Department of Economics. For financial support, we would like to thank the John M. Olin Center for Law, Economics, and Organization.
Electronic copy available at: http://ssrn.com/abstract=1589731
1. Introduction
In a seminal paper, Gompers, Ishii and Metrick (2003) (hereinafter GIM) identified a
governance-based trading strategy that would have produced abnormal profits during the period
1990-1999. This strategy was based on a G-Index that GIM constructed on the basis of 24
governance provisions that weaken shareholder rights. These intriguing findings have attracted a
great deal of attention ever since they were first reported, and the G index (as well as the E index
that is based on a subset of these 24 provisions (Bebchuk, Cohen, and Ferrell (2009)) has been
extensively used. As of March 2010, the GIM study has about 800 citations on SSRN.
In this paper, we contribute to understanding GIM’s celebrated results concerning the
association between governance and abnormal returns. We show that the G-Index (as well as the
E-Index) was no longer associated with abnormal returns during the period of 2000-2008 (or any
sub-periods within it) and we provide evidence consistent with the hypothesis that the
disappearance of the governance-returns association was due to market participants’ learning to
appreciate the difference between well-governed and poorly-governed firms. Our analysis
highlights the changes over time in market participants’ attention both to corporate governance
in general and to differences between good-governance and poor-governance firms, as well as
the role that such changes played in incorporating governance into market prices. Our findings
are consistent with market learning about the benefits of governance being responsible both for
the governance-return association during the 1990s and for its subsequent disappearance.
GIM suggested that governance provisions – or the characteristics of firms’ governance and
culture that they reflect – are associated with lower firm value and performance. In particular,
GIM showed that higher G-Index scores are associated with lower industry-adjusted Q, lower
profits, lower sales growth, and more corporate acquisitions. Subsequent work found additional
links between the G and E indices and firm performance. For example, Masulis, Wang and Xie
(2007) find that worse G-Index and E-Index scores are correlated with worse acquisition
decisions (as measured by the stock market returns accompanying acquisition announcements),
Dittmar and Mahrt-Smith (2007) finds that worse such scores are correlated with a less valuable
use of cash holdings.
That the G-Index and E-Index are associated with lower firm value and worse firm
performance, however, does not imply that these indices should be associated with abnormal
stock returns. To the extent that market prices already reflect fully the differences between well-
1

governed and poorly-governed firms, trading on the basis of the governance indices should not
be expected to yield abnormal profits.
One possible explanation for the GIM findings is that governance is correlated with some
common risk factor that is not captured by the standard four-factor model used by GIM to
calculate abnormal returns (Core et al. (2006), Cremers et al. (2009)). Under this explanation,
governance can be expected to continue to play a role in cross-sectional regressions of returns as
long as the common risk factor correlated with governance continues to have such a role.
An alternative explanation, which was noted by GIM, is that investors in 1990 did not fully
appreciate the differences between firms with good and bad governance scores. The legal
developments that shaped the significance of the G-Index provisions took place largely during
the 1980s, which was also when many of these provisions were adopted. In 1990, investors
might not yet have had sufficient experience to be able to forecast the expected difference in
performance between well-governed and poorly-governed firms. Under the “learning”
hypothesis, the association between governance indices and returns during the 1990s was
expected to continue only up to the point at which a sufficient number of market participants
would learn to appreciate fully the differences between well-governed and poorly-governed
firms. Noting the empirical evidence that lengthy intervals are sometimes necessary even for
information that is relatively tangible to be incorporated in prices,1 GIM suggested that it was
not possible at the time of their article to forecast when such a process of price adjustment would
be completed.
We begin by documenting that the association between governance and returns did not
persist after the period for which it was identified by GIM. Using the exact methods employed
by GIM for 1990-1999, we find that this association did not exist during 2000-2008. Indeed, we
show that, even though trading based on either the G-Index or E-Index would have produced
positive abnormal return during most of the four-year periods beginning sometime during the
period 1991-1998, such strategies would not have produced abnormal returns during any four-
year period beginning in 1999 or later. Core et al. (2006) noted that the GIM strategy did not
1 GIM cited in this connection the evidence that earnings surprises (Bernard and Thomas (1989)), dividend omissions (Michaely, Thaler, and Womack (1995)), and stock repurchases (Ikenberry, Lakonishok, and Vermaelen (1995)) have long-term drift following the event, and noted that all seem to be relatively simple pieces of information compared with governance structures.
2

produce abnormal returns during the four-year period 2000-2003, but were naturally cautious
about drawing inferences from the relatively short period they examined and did not devote
much attention to the change or seek to explain it. The robust findings we find for a period of
similar length to the one studied by GIM enable us to conclude that the documented governance-
returns association did not persist.
Furthermore, our principal contribution is in explaining both the association between
governance and returns during the 1990s and its subsequent disappearance. Our paper is the first
to focus on post-2000 changes – changes not only in the association between governance and
returns but also changes in the attention to governance in general and, in particular, the ability of
market participants to appreciate the differences between well-governed and poorly-governed
firms. In particular, we provide evidence that is consistent with a learning hypothesis under
which it took markets some time to appreciate sufficiently the differences among firms that are
well-governed and poorly-governed as reflected in the governance indices. As long as this
process was incomplete, but not afterwards, trading based on these differences could produce
abnormal returns.
The learning by market participants could have involved – though not necessarily – learning
about the significance of the governance provisions. Some market participants might have
learned to appreciate that certain governance provisions are associated with how firms are
governed. But other market participants might have directly identified that some firms are well-
governed without making a connection between their good governance and their governance
provisions. Some market participants might even have learned both to appreciate the significance
of some governance provisions as well as to directly identify differences between how well-
scoring and poorly-scoring (in terms of the governance indices) firms are governed. For our
purposes, the learning hypothesis involves market participants, in the aggregate, coming to
appreciate the difference between firms that score well and poorly on the governance indices
regardless of whether all or some of these participants made use of all the components of the
indices themselves.
We begin our investigation of the learning hypothesis by documenting how attention to
governance by the media, institutional investors, and academic researchers jumped sharply in the
beginning of the 2000s to historically high levels and remained there. The number of media
articles about governance, and the number of resolutions about corporate governance submitted
by institutional investors (many of which focused on key provisions of the governance indices),
3
both rose several fold in 2001-2002 and subsequently remained at much higher levels than
earlier. Academic research, proxied in any given year both by the number of journal publications
on corporate governance and NBER discussion papers in the area, also rose sharply around this
point in time, rising steadily from the late 1990s and reaching and staying at levels that were far
higher than those prevailing during the 1990s. The GIM paper itself was issued as an NBER
discussion paper (and received significant media coverage) in 2001. Given that all of our
measures of attention reached very high levels by 2002, we proceed to test the hypothesis that,
by the end of 2001, markets had sufficiently absorbed the governance differences reflected in the
G-Index and the E-Index.
To do so we examine whether, after 2001, market participants had a better appreciation of the
differences between well-governed firms and poorly-governed firms in terms of their expected
future profitability. In examining whether markets learned to differentiate better between well-
governed and poorly-governed firms when forecasting future profitability, we examine the extent
to which markets were differentially surprised by earning announcements as proxied by (i) the
abnormal reactions accompanying earning announcements, and (ii) analyst forecast errors.
Consistent with the learning hypothesis, we find a marked difference between the 1990-2001
period and the post-2001 period. During the 1990-2001 period, but not during the 2001-2008
period, the earning announcements of good-governance firms were more likely than the earning
announcements of poor-governance firms both (i) to be accompanied with more positive
abnormal stock returns, and (ii) to produce a meaningful positive surprise relative to the median
analyst forecast. Our analysis here extends the work of Core et al. (2006) and Giroud and
Mueller (2008), who examined (with mixed results) whether the GIM findings were due to
markets’ forecasting errors about the difference between good-governance and poor-governance
firms, but which did not consider whether such forecasting errors changed over time during the
1990-2008 period.2
2 While we focus on the differences between 1990-2001 and the period following it, we do not have the data to study how the 1990-2001 period differed from the period preceding it. Cremers and Ferrell (2009) introduce a new dataset of governance provisions from the pre-1990 period and suggest that the association between governance and returns during the pre-1990 period, when legal rules making entrenching provisions more consequential were developed, was especially strong.
4
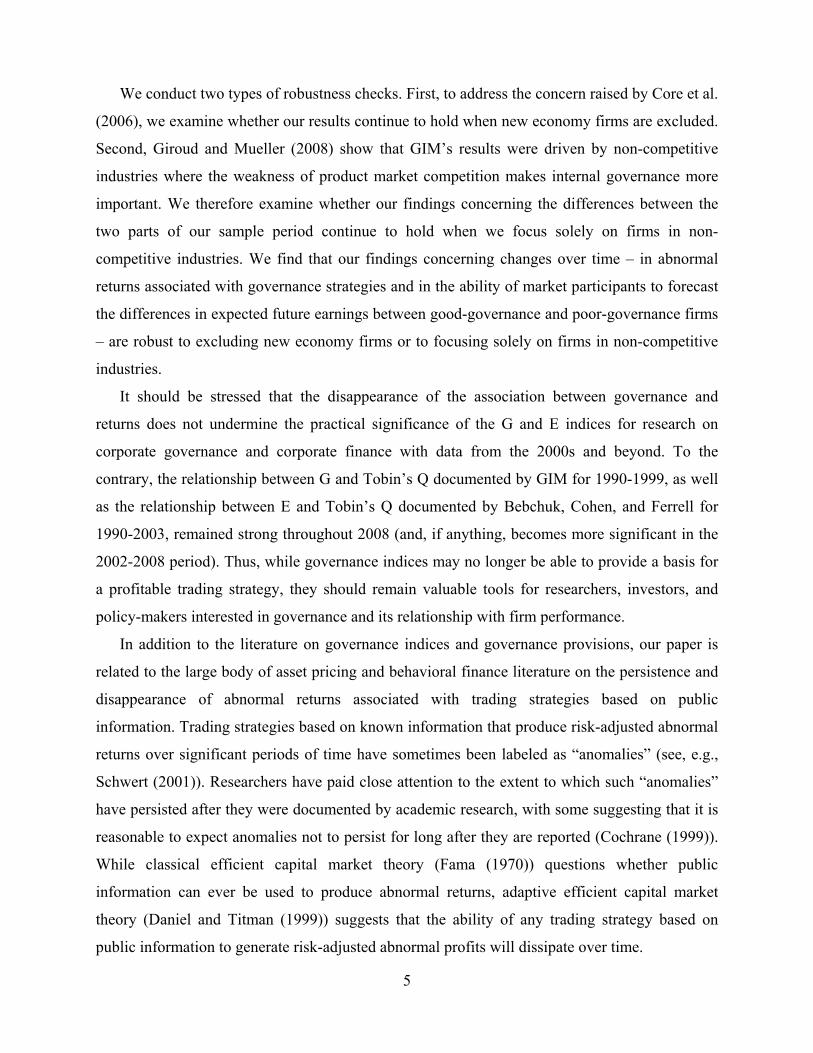
We conduct two types of robustness checks. First, to address the concern raised by Core et al.
(2006), we examine whether our results continue to hold when new economy firms are excluded.
Second, Giroud and Mueller (2008) show that GIM’s results were driven by non-competitive
industries where the weakness of product market competition makes internal governance more
important. We therefore examine whether our findings concerning the differences between the
two parts of our sample period continue to hold when we focus solely on firms in non-
competitive industries. We find that our findings concerning changes over time – in abnormal
returns associated with governance strategies and in the ability of market participants to forecast
the differences in expected future earnings between good-governance and poor-governance firms
– are robust to excluding new economy firms or to focusing solely on firms in non-competitive
industries.
It should be stressed that the disappearance of the association between governance and
returns does not undermine the practical significance of the G and E indices for research on
corporate governance and corporate finance with data from the 2000s and beyond. To the
contrary, the relationship between G and Tobin’s Q documented by GIM for 1990-1999, as well
as the relationship between E and Tobin’s Q documented by Bebchuk, Cohen, and Ferrell for
1990-2003, remained strong throughout 2008 (and, if anything, becomes more significant in the
2002-2008 period). Thus, while governance indices may no longer be able to provide a basis for
a profitable trading strategy, they should remain valuable tools for researchers, investors, and
policy-makers interested in governance and its relationship with firm performance.
In addition to the literature on governance indices and governance provisions, our paper is
related to the large body of asset pricing and behavioral finance literature on the persistence and
disappearance of abnormal returns associated with trading strategies based on public
information. Trading strategies based on known information that produce risk-adjusted abnormal
returns over significant periods of time have sometimes been labeled as “anomalies” (see, e.g.,
Schwert (2001)). Researchers have paid close attention to the extent to which such “anomalies”
have persisted after they were documented by academic research, with some suggesting that it is
reasonable to expect anomalies not to persist for long after they are reported (Cochrane (1999)).
While classical efficient capital market theory (Fama (1970)) questions whether public
information can ever be used to produce abnormal returns, adaptive efficient capital market
theory (Daniel and Titman (1999)) suggests that the ability of any trading strategy based on
public information to generate risk-adjusted abnormal profits will dissipate over time.
5
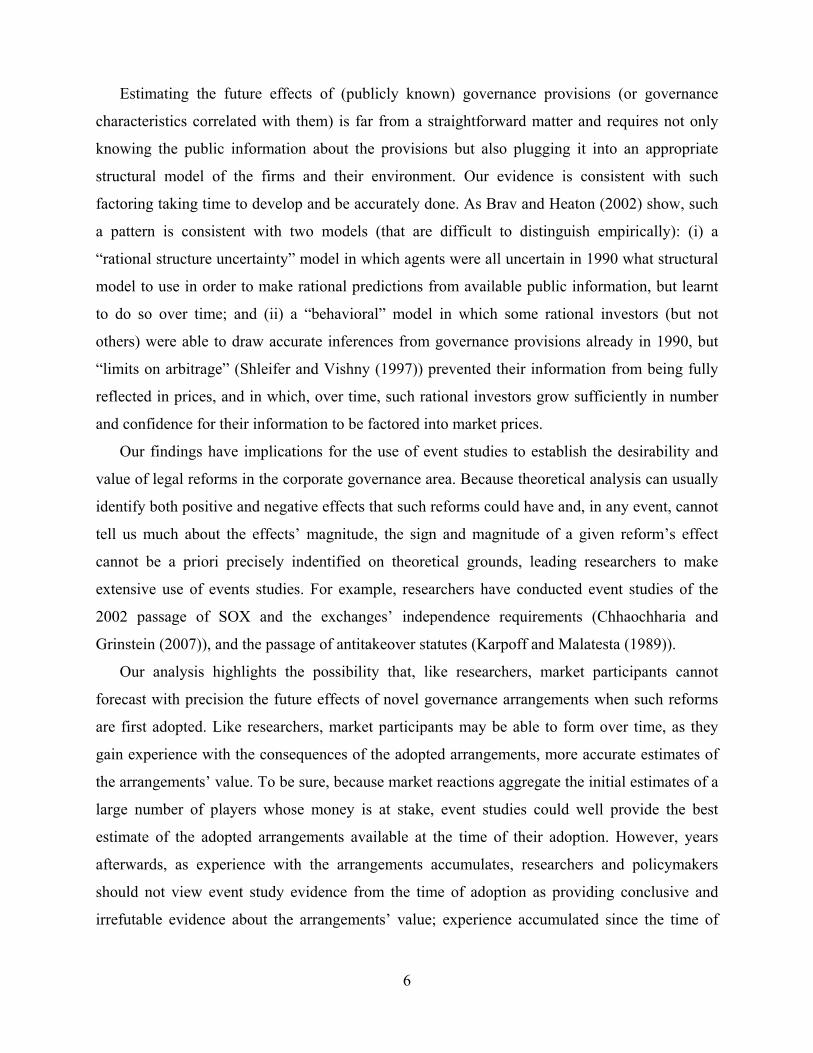
Estimating the future effects of (publicly known) governance provisions (or governance
characteristics correlated with them) is far from a straightforward matter and requires not only
knowing the public information about the provisions but also plugging it into an appropriate
structural model of the firms and their environment. Our evidence is consistent with such
factoring taking time to develop and be accurately done. As Brav and Heaton (2002) show, such
a pattern is consistent with two models (that are difficult to distinguish empirically): (i) a
“rational structure uncertainty” model in which agents were all uncertain in 1990 what structural
model to use in order to make rational predictions from available public information, but learnt
to do so over time; and (ii) a “behavioral” model in which some rational investors (but not
others) were able to draw accurate inferences from governance provisions already in 1990, but
“limits on arbitrage” (Shleifer and Vishny (1997)) prevented their information from being fully
reflected in prices, and in which, over time, such rational investors grow sufficiently in number
and confidence for their information to be factored into market prices.
Our findings have implications for the use of event studies to establish the desirability and
value of legal reforms in the corporate governance area. Because theoretical analysis can usually
identify both positive and negative effects that such reforms could have and, in any event, cannot
tell us much about the effects’ magnitude, the sign and magnitude of a given reform’s effect
cannot be a priori precisely indentified on theoretical grounds, leading researchers to make
extensive use of events studies. For example, researchers have conducted event studies of the
2002 passage of SOX and the exchanges’ independence requirements (Chhaochharia and
Grinstein (2007)), and the passage of antitakeover statutes (Karpoff and Malatesta (1989)).
Our analysis highlights the possibility that, like researchers, market participants cannot
forecast with precision the future effects of novel governance arrangements when such reforms
are first adopted. Like researchers, market participants may be able to form over time, as they
gain experience with the consequences of the adopted arrangements, more accurate estimates of
the arrangements’ value. To be sure, because market reactions aggregate the initial estimates of a
large number of players whose money is at stake, event studies could well provide the best
estimate of the adopted arrangements available at the time of their adoption. However, years
afterwards, as experience with the arrangements accumulates, researchers and policymakers
should not view event study evidence from the time of adoption as providing conclusive and
irrefutable evidence about the arrangements’ value; experience accumulated since the time of
6
adoption might lead markets to revise their initial estimates, and researchers and policy-makers
should similarly be prepared to use such experience to adjust estimates based on event studies.
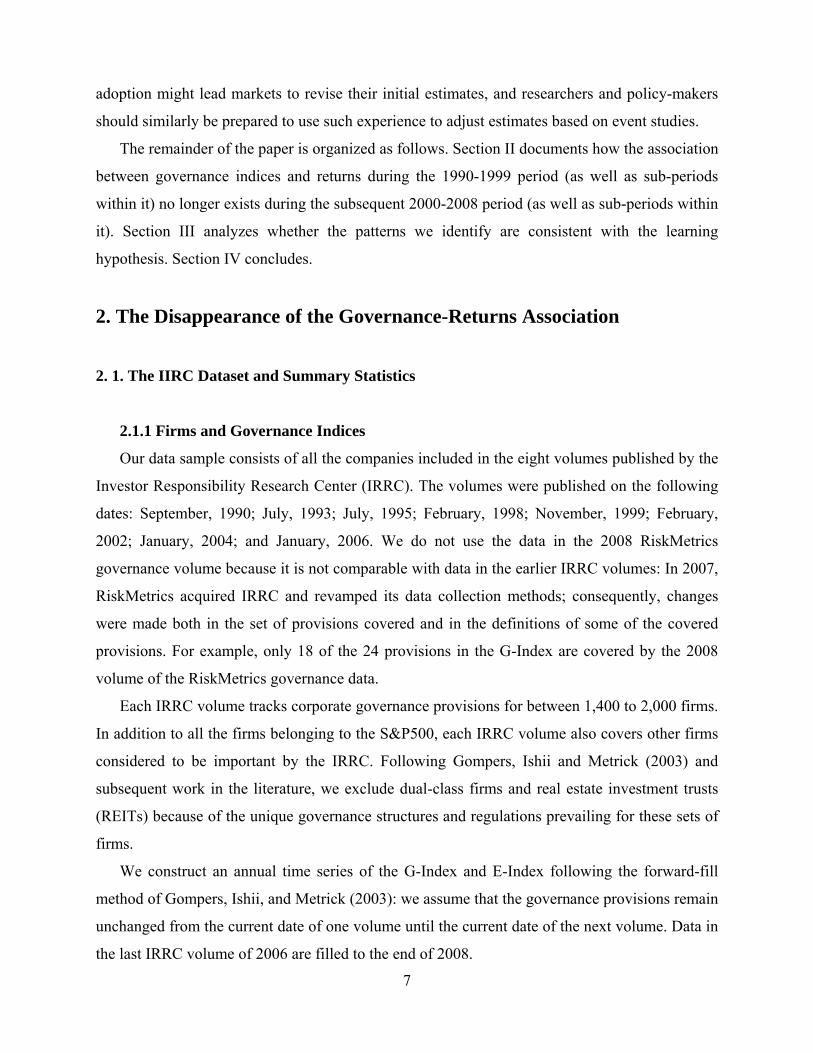
The remainder of the paper is organized as follows. Section II documents how the association
between governance indices and returns during the 1990-1999 period (as well as sub-periods
within it) no longer exists during the subsequent 2000-2008 period (as well as sub-periods within
it). Section III analyzes whether the patterns we identify are consistent with the learning
hypothesis. Section IV concludes.
2. The Disappearance of the Governance-Returns Association
2. 1. The IIRC Dataset and Summary Statistics
2.1.1 Firms and Governance Indices
Our data sample consists of all the companies included in the eight volumes published by the
Investor Responsibility Research Center (IRRC). The volumes were published on the following
dates: September, 1990; July, 1993; July, 1995; February, 1998; November, 1999; February,
2002; January, 2004; and January, 2006. We do not use the data in the 2008 RiskMetrics
governance volume because it is not comparable with data in the earlier IRRC volumes: In 2007,
RiskMetrics acquired IRRC and revamped its data collection methods; consequently, changes
were made both in the set of provisions covered and in the definitions of some of the covered
provisions. For example, only 18 of the 24 provisions in the G-Index are covered by the 2008
volume of the RiskMetrics governance data.
Each IRRC volume tracks corporate governance provisions for between 1,400 to 2,000 firms.
In addition to all the firms belonging to the S&P500, each IRRC volume also covers other firms
considered to be important by the IRRC. Following Gompers, Ishii and Metrick (2003) and
subsequent work in the literature, we exclude dual-class firms and real estate investment trusts
(REITs) because of the unique governance structures and regulations prevailing for these sets of
firms.
We construct an annual time series of the G-Index and E-Index following the forward-fill
method of Gompers, Ishii, and Metrick (2003): we assume that the governance provisions remain
unchanged from the current date of one volume until the current date of the next volume. Data in
the last IRRC volume of 2006 are filled to the end of 2008.
7

We follow the construction of the G-Index (which is based on 24 IRRC provisions) defined
by GIM and the construction of the E-Index (which is based on 6 provisions) defined by
Bebchuk, Cohen, and Ferrell (2009). Because the provisions in these indices restrict shareholder
rights, a high score is viewed as representing worse governance. Following GIM, we define
Democracy (G) firms and Dictatorship (G) firms as firms that have especially good governance
and especially bad governance, respectively, based on the extremes of the G-Index. In particular,
Democracy (G) firms are those whose G-Index score is 5 or lower, and Dictatorship (G) firms
are those whose G-Index score is 14 or higher. In an analogous fashion, we create groups of
firms whose scores are the very best and the very worst using the E-Index: we define Democracy
(E) firms and Dictatorship (E) firms to be those with E-Index scores of 0 and E-Index scores of 5
or more, respectively.
Table I, Panel A reports summary statistics concerning the governance indices. Rows (1)-(4)
report a volume-by-volume breakdown of the G and E Index, and the percentage of the firms in
each volume that are Democracy or Dictatorship firms using either the G-Index or the E-Index.
2.1.2 Returns on Governance Portfolios
Following GIM, we construct governance portfolios based on holding long Democracy firms
and shorting Dictatorship firms. Portfolios are rebalanced at the beginning of each month and
governance data is updated whenever information in a new IRRC volume becomes available.
The trading strategy is conducted for 220 months from September 1990, the first publication date
of IRRC volumes, until December of 2008. We match each firm’s monthly governance data
with its monthly returns (including dividends) from CRSP, then construct both a market-value-
weighted portfolio and an equal-weighted portfolio.
Table I, Panel B reports the average raw (unadjusted for risk) monthly portfolio returns from
the four governance trading strategies – value- and equal-weighted, using G-Index and E-Index –
between each pair of successive IRRC volumes. These statistics indicate that average monthly
portfolio returns are high during the September 1990-December 1999 period examined by GIM,
but drop precipitously in the latter half of our sample period (the January 2000-December 2008
period). This pattern holds whether the governance strategy used the G-Index or the E-Index and
whether it uses value-weighted or equal-weighted portfolios.
8

2.2. Governance Indices and Abnormal Stock Returns
The above summary statistics on the raw monthly returns produced by the governance-based
strategies do not account for their associations with systematic risks. To test whether the
governance based strategies yield risk-adjusted abnormal returns, we follow the method used by
Gompers, Ishii, and Metrick (2003) and use the four-factor model based on the three factors of
Fama-French (1993) augmented by the momentum factor of Carhart (1997). In particular, we
divide the sample period into the two periods 1990-1999 and 2000-2008, where the former
matches the period studied by GIM. For each period, we run a regression of monthly portfolio
returns on the four-factors. We display the results in Panel A of Table II.
For the first period of 1990-1999, we find economically and statistically significant abnormal
returns for all four trading strategies. For example, the value-weighted (equal-weighted) portfolio
formed on the G-Index produces average abnormal monthly returns of 72.2 (48.7) basis points,
with statistical significance at the 1% (5%) level. Our results replicate those in GIM, who report
the value- (equal-) weighted monthly portfolio return over the same period of 72 (45) basis
points.
The results for the second period of 2000-2008 are strikingly different. For this period, both
the equal and value-weighted portfolios based on the G-Index produce average monthly
abnormal returns that are statistically indistinguishable from 0. Similarly, the value-weighted
portfolios based on the E-Index produce average monthly abnormal returns that are statistically
indistinguishable from 0. The equal-weighted portfolios based on the E-Index still produce a
positive return but with weakened significance. Thus, combined with our findings in the raw
portfolio returns, the profitability of trading strategies based on the G-Index and the E-Index,
either adjusted or unadjusted for risk factors, appears to wane in the 2000s.
As a robustness check, we examine whether the above results, for the 1990s or for the 2000s,
are driven by certain sub-periods. To be able to perform tests with a meaningful statistical power,
we focus on four-year (48 months) periods. (Results using all three-year sub-periods and all five-
year sub-periods are similar). In particular, we examine all fifteen 4-year (48 month) sub-periods
starting in January of each calendar year, from 1991 to 2005. Panel B of Table II displays the
results.
The results indicate that there is a marked difference between the eight 4-year sub-periods
beginning earlier than 1999 and the seven 4-year sub-periods beginning in 1999 or later. For
periods beginning prior to 1999, the governance-based strategies generate positive and
9
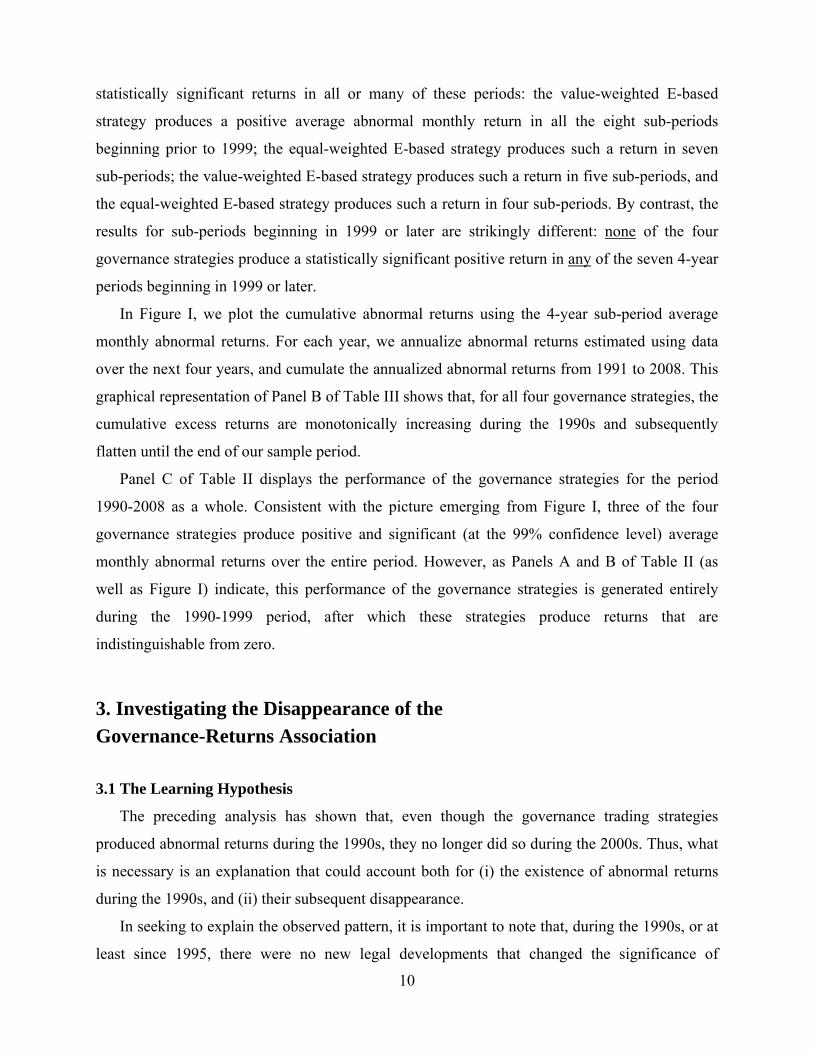
statistically significant returns in all or many of these periods: the value-weighted E-based
strategy produces a positive average abnormal monthly return in all the eight sub-periods
beginning prior to 1999; the equal-weighted E-based strategy produces such a return in seven
sub-periods; the value-weighted E-based strategy produces such a return in five sub-periods, and
the equal-weighted E-based strategy produces such a return in four sub-periods. By contrast, the
results for sub-periods beginning in 1999 or later are strikingly different: none of the four
governance strategies produce a statistically significant positive return in any of the seven 4-year
periods beginning in 1999 or later.
In Figure I, we plot the cumulative abnormal returns using the 4-year sub-period average
monthly abnormal returns. For each year, we annualize abnormal returns estimated using data
over the next four years, and cumulate the annualized abnormal returns from 1991 to 2008. This
graphical representation of Panel B of Table III shows that, for all four governance strategies, the
cumulative excess returns are monotonically increasing during the 1990s and subsequently
flatten until the end of our sample period.
Panel C of Table II displays the performance of the governance strategies for the period
1990-2008 as a whole. Consistent with the picture emerging from Figure I, three of the four
governance strategies produce positive and significant (at the 99% confidence level) average
monthly abnormal returns over the entire period. However, as Panels A and B of Table II (as
well as Figure I) indicate, this performance of the governance strategies is generated entirely
during the 1990-1999 period, after which these strategies produce returns that are
indistinguishable from zero.
3. Investigating the Disappearance of the Governance-Returns Association
3.1 The Learning Hypothesis
The preceding analysis has shown that, even though the governance trading strategies
produced abnormal returns during the 1990s, they no longer did so during the 2000s. Thus, what
is necessary is an explanation that could account both for (i) the existence of abnormal returns
during the 1990s, and (ii) their subsequent disappearance.
In seeking to explain the observed pattern, it is important to note that, during the 1990s, or at
least since 1995, there were no new legal developments that changed the significance of
10
governance provisions in place and could by themselves produce abnormal returns associated
with these provisions. During the 1980s, the Delaware courts issued rulings, culminating with the
Delaware Supreme Court’s 1990 decision in Paramount Communications v. Time, Inc.,
expanding the power of boards to use governance provisions to “just say no” to acquisition offers
they view as undesirable. One could perhaps view the 1995 Unitrin decision of the Delaware
Supreme Court as clarifying the board’s power to just say no, but even in such a case there can
be little disagreement that there were no subsequent legal changes during the 1990s, and it is thus
difficult to explain the abnormal returns associated with the G-Index and the E-Index during the
4-year periods of 1996-2000, 1997-2001, and 1998-2002 as the product of legal changes.
For this reason, GIM and subsequent work viewed the association between the G-Index and
returns identified by GIM for the 1990s as being due to (i) an association between governance
and a common risk factor that is not captured by the four-factor model, or (ii) an inability by
market participants in 1990, facing a landscape of provisions and applicable rules that had
substantially evolved and changed during the 1980s, to forecast accurately the significance of
governance for the expected future performance of firms.3 Our finding that the identified
association did not persist after the 1990s raises the question of whether any of the two
explanations offered for the existence of the associations during the 1990s could also explain the
subsequent disappearance of the association.
In this section, we investigate the possibility that the observed pattern is due to explanation
(ii). In particular, under the learning hypothesis that we investigate below, market prices in the
1990s had not yet precisely priced the expected effects of the differences between well-governed
and poorly-governed firms on future profitability, but over time a sufficient number of market
participants have learned to appreciate the significance of these differences, making trading on
the basis of such differences no longer profitable.
The learning hypothesis accepts that it might have been difficult for market participants to
forecast precisely how governance provisions would overall affect the future performance of
firms. This overall effect combines many effects, some of which go in opposite directions, which
in turn depend on how provisions interact with each other and with legal rules. Forecasting this
3 Explanation (i) was favored by Core et al. (2006) and Cremers et al. (2009). Explanation (ii) seems to have been favored by GIM.
11

overall effect on a priori theoretical grounds was clearly difficult. Furthermore, even assuming
that some arbitrageurs of superior ability were able to make precise predictions in this
connection, their activities might not have been sufficient to get the market prices of IRRC firms
to fully reflect their forecasts: the firms in the IRRC universe represent the lion’s share of the US
capital markets, and there are limits to the amount of capital any arbitrageur can commit to a
given long-term trading strategy (Shleifer and Vishny (1990)).
While market prices in 1990 might not have reflected a precise forecast of the differences
between good-governance and poor-governance firms in terms of future performance, market
participants might have gained over time a better appreciation of these differences. Under the
learning hypothesis, the association between the governance indices and abnormal returns ceases
to exist once market participants with sufficient capital have gained sufficient appreciation of
these differences for market prices to reflect such appreciation, which in turn makes it no longer
possible to profit by trading on the basis of the governance indices.
In this section we explore the possibility that the learning hypothesis can explain both the
association between governance indices and returns and its subsequent disappearance. We first
document the big jump occurring in the beginning of the 2000s in the attention paid to
governance by a broad range of players – the media, institutional investors, and academic
researchers (section 3.2). With this in mind, we then revisit our results on abnormal returns
(section 3.3). Subsequently, to examine whether market participants made governance-related
expectational errors during the learning period but not afterwards, we examine market reactions
to earning announcements (section 3.4) as well as analyst surprises by such announcements
(section 3.5). We next verify that our results are robust to excluding new economy firms or firms
from competitive industries (section 3.6). We conclude by documenting that (consistent with the
learning hypothesis) the relationship between governance and Tobin’s Q persists after 2001
(section 3.7).
3.2 The Jump in Attention to Governance
We begin by looking at several quantitative measures that reflect the evolution over time in
the attention paid to governance by participants in the market and the environment in which it
operates. Below we examine in turn the attention paid to governance by the media, institutional
investors, and academic researchers. In all cases, we find that the level of attention rose in the
12
beginning of the 2000s to levels much higher than those of the 1990s and subsequently remained
high until the end of our sample period.
3.2.1 The Media
We begin by looking at references in the media to corporate governance. Media references to
and coverage of corporate governance may be relevant for two reasons: greater attention by
journalists to governance issues may be a mechanism for information diffusion, influencing
market participants and leading them to pay more attention to such issues; and, given that
journalists talk with and write for market participants, the media coverage may also partly reflect
(rather than bring about) a greater interest in these issue on the part of market participants.
To obtain a quantitative proxy for the media interest in governance, we search through Lexis-
Lexis Academic and tally, in each calendar year, the number of unique newspaper articles, wires,
and publications that reference the word “corporate governance.” Figure II(A) graphs three time
series representing the number of governance-related articles from three sets of media sources –
(i) major world publications, (ii) U.S. newspapers and wires, and (iii) a selected number of
widely followed newspapers, namely, USA Today, NYTimes, Washington Post, and the
Financial Times. In each series we normalize the number of articles and publications by their
1990 values. All three series exhibit a slow, gradual increase during the 1990s, then a steep jump
from 2001 to 2002, with interest subsequently remaining at a level much higher than during the
1990s.
3.2.2 Institutional Investors
We collect the total number of corporate governance shareholder resolutions submitted by
institutional investors in each proxy season since 1990 from the annual proxy season reviews of
Georgeson Shareholder; all values are normalized by the 1990 counts. We plot the time series in
Figure II(B).
Here we see that the incidence of such shareholder proposals fluctuates between 1990 and
2002, rising steeply in the 2003 proxy season and subsequently remaining at levels that are
substantially higher than those prevailing prior to the sharp rise. Because shareholder proposals
need to be submitted substantially early in advance of the shareholder meeting, proposals for the
proxy season of 2003 were largely submitted in 2002. Thus, Figure II(B) reflects a sharp rise in
13
attention given to corporate governance already taking place in 2002, in the form of a rising
tendency of institutional investors to submit corporate governance proposals.
Indeed, (Georgeson (2003)) lists all the corporate governance proposals submitted by
institutional investors for vote during the 2003 proxy season, and a review of this list reveals that
some of the most common types of proposals, and the ones attracting most support from
shareholders in shareholder votes, were ones focusing on key provisions of the E-Index and the
G-Index. In particular, a substantial fraction of all the corporate governance proposals submitted
by institutions and voted upon during the 2003 proxy season concerned staggered boards, poison
pills, or golden parachutes – all elements of the E-Index (as well, of course, as of the broader G-
Index). Furthermore, each of these three types of proposals attracted on average a majority of the
votes cast by shareholders.
3.2.3 Academic Research
We next look at the attention paid to governance by academic researchers. Academic
research can provide market participants with ideas and findings that are directly relevant to the
choices they make, and it can also influence the choice of issues to which they pay attention.
We first search through various social science databases via Business Source Complete,
which covers over 1300 business-related academic journals, magazines, and trade publications4,
to enumerate the number of academic journal articles published from 1990 to 2008 that reference
the term “corporate governance” in the abstract or in author-supplied-keywords. Figure III(A)
plots two time series, one (solid line) showing the total number of academic journal papers
referencing “corporate governance” in the abstract or keyword, and the other (dashed line)
normalizes the first series by the total number of academic papers in the databases that we search
through in each year. Both series exhibit the same time-series pattern: there is a monotonic and
gradual increase in the number of corporate governance papers from 1990 to 2001, a very sharp
increase in the number of papers between 2001 and 2003, followed by a subsequent leveling off
that keeps the number of papers each year at a much higher level than during the 2001-2003
sharp rise.
4 For a list of journals included, see http://www.ebscohost.com/titleLists/bth-journals.htm
14
Academic papers are often published a significant time after they are written and first
circulated (as most academic readers of this paper probably painfully recognize). Researchers
affiliated with the NBER issue and circulate completed studies in this form, often significantly
before their papers are published. We therefore look at the NBER working paper database and
search for a number of newly issued working papers that reference the term “corporate
governance.” Figure III(B) reports in time series the number of new governance-related working
papers that are posted on the NBER working paper database in each year; the solid line plots the
total number of governance related working papers, and the dotted line normalizes the number of
corporate governance working papers by the total number of working papers posted on the
NBER database in each year. Both series reveal identical time trends, showing that research on
corporate governance rose sharply from 1998 to 2004, and that it remained subsequently at a
much higher level than prior to its sharp rise from 1998 to 2004.
Overall, we see that the attention paid by academic researchers to governance has risen
considerably around the 2001-2002 period in which interest from non-academics (the media and
institutional investors) rose sharply. The substantial increase in the level of academic interest was
spread over a somewhat longer period, starting to climb even before the jump in attention by the
media and institutions, and continued climbing a bit after this jump.
Finally, it is worth noting the timing of the GIM study itself. The study was issued as an
NBER discussion paper on August 2001, and its findings were already noted by the media in the
fall of 2001. The New York Times dedicated its trading strategies column, and the Financial
Times dedicated its Global Investing column, to reporting about the abnormal returns associated
with GIM’s governance strategies.5
3.2.4 Back to the Learning Hypothesis
We have documented above that the attention paid to governance by both the media and
institutional investors rose sharply in 2002. Interest by academics had been already rising for
several years by then, and continued rising during this period (as well as a bit afterwards). The
5 See Alison Beard, “Shareholder-Friendly Companies Outperform,” Financial Times, November 9, 2001; Mark Hulbert, “Who Best Protects Shareholders? The Shareholders,” New York Times, November 4, 2001.
15
sharp rise in attention to governance from the media and institutional investors might have been
due to the “shock” created by the governance scandals of Enron, Worldcom and others, and to
the accompanying governance reforms (SOX and the new listing requirements). The preceding
and accompanying rise in academic research on the subject might have further contributed to the
increased attention to governance. Whatever are the reasons for the increased attention to
governance, the patterns displayed above make it clear that among media journalists, institutional
investors, and academic researchers, the levels of interest in governance from at least 2002 on
were considerably higher than those prevailing during most of the 1990s.
With any learning process, there is no reason to expect that it ever reaches a point in which
all market participants recognize the significance of certain factors. What is important is its
reaching a point in which profits from trading based on this factor are no longer possible because
a sufficient number of market players with sufficient capital have recognized the issue. Given
that we have documented that the level of interest in governance in several important sets of
players reached historically high levels by 2002, we test below the hypothesis that, by the end of
2001, sufficient learning had taken place for market prices to internalize the significance of
governance sufficiently for abnormal profits based on the governance indices to be no longer
possible. We find below evidence that is consistent with this hypothesis.
3.3 Learning about Governance: Revisiting Abnormal Returns
We first revisit the abnormal returns to corporate governance trading strategies described in
Section 2.2, and test the hypothesis that sufficient learning about the significance of governance
occurred by the end of 2001, by examining and comparing the abnormal returns to governance
portfolios for the 1991-2001 period and the post-2001 period of 2002-2008. To test this
hypothesis we again run regressions of the monthly returns of each governance strategy on the
four factors, but this time add a time dummy, labeled “POST,” indicating whether the time
period is after 2001:
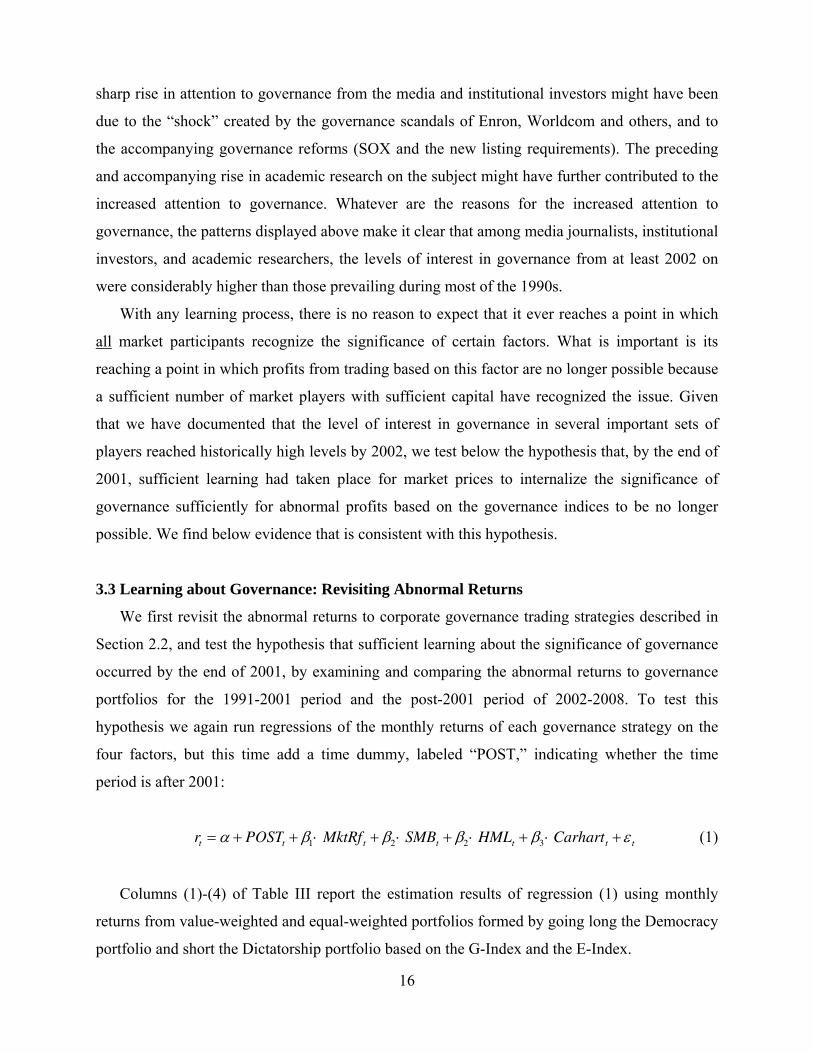
rt = α + POSTt + β1⋅ MktRft + β2 ⋅ SMBt + β2 ⋅ HMLt + β3 ⋅ Carhartt +ε t (1)
Columns (1)-(4) of Table III report the estimation results of regression (1) using monthly
returns from value-weighted and equal-weighted portfolios formed by going long the Democracy
portfolio and short the Dictatorship portfolio based on the G-Index and the E-Index.
16
We find that all four trading strategies produce an average monthly alpha that is
economically and statistically significant (at the 5% level) during the period 1990-2001. For our
purposes, what is of special interest is the sum of the Alpha and POST variables, which reflects
the post-2001 average monthly alpha. In all the columns, applying an F-test to the sum of the
Alpha variable and the POST variable shows that, for the period 2002-2008, none of the four
portfolios produces abnormal returns that are statistically different from 0. Specifically, the G-
Index (E-Index) value-weighted portfolio produces 60.7 (99) basis points in the pre-period; the
difference in the post-period abnormal monthly returns is very close in magnitude and
statistically significant at the 5% (1%) level at -81.2 (-99.9) basis points, resulting in a post-
period abnormal monthly return that is statistically no different from zero. The G-Index (E-
Index) equal-weighted portfolio produces abnormal monthly returns of 48 (59.1) basis points in
the pre-period which is statistically significant at the 5% (1%) level; F-test results show again
that abnormal returns in the post-2001 period are not statistically different from zero.
In untabulated results we also estimate a fully interacted model, i.e. each variable including
the constant is interacted with the post-2001 dummy, which allows the portfolio loadings on the
four factors to differ between the pre- and post-2001 periods. Results from the fully interacted
model are qualitatively and statistically similar to those presented here.
3.4 Market Reactions to Earnings Announcements
Following the approach introduced by LaPorta et al (1997) for testing for markets’ failure to
forecast differences in future profitability among firms, we turn to examine market reactions to
earnings announcements both during 1990-2001 and during 2002-2008. To the extent that
market participants did not during the first period fully appreciate differences between well-
governed and poorly-governed firms, the market’s expectation of future earnings should be
expected not to have given sufficient weight to the difference between good-governance and
poor-governance firms. Accordingly, during the 1990-2001 period, the market could be expected
to be more positively surprised by the earning announcements of good-governance firms than by
those of poor-governance firms. In contrast, to the extent that market participants in the
aggregate had by the end of 2001 sufficiently learned to appreciate the difference between good-
governance and poor-governance firms, we should see during the post-2001 period no
association between governance indices and market surprises around earnings announcements.
17
We construct a dataset of quarterly earnings announcements data for firms in the IRRC
dataset. Earnings announcements are obtained from I/B/E/S, for which we require each
announcement to have at least one analyst forecast 30 days prior to the announcement, to have
coverage in Compustat, and have returns data in CRSP. The resulting sample includes 91,101
earnings announcements from September 1990 to December 2008. Announcement dates are
obtained by combining I/B/E/S and Compustat; following DellaVigna and Pollet (2009), in cases
where I/B/E/S and Compustat announcement dates differ, we assign the announcement date to be
the earlier of the two dates.6
Around these announcement dates we compute stock returns. Following prior work (see, for
example, Core et al. (2006)), we consider the following earnings announcement return windows:
from 20, 10, 5, 3, and 1 trading days prior to the earnings announcement until 1 day after the
announcement. In addition to raw returns, we also calculate risk-adjusted excess returns as
described below.
Following Giroud and Mueller (2008), we exclude from our regressions firms that are
followed by less than 5 analysts. Firms in the IRRC dataset are covered on average by 9 analysts,
and the excluded firms constitute less than 4.7% of the total market capitalization of IRRC firms.
Firms followed by a significant number of analysts are the ones that attract significant attention
from market participants and thus those with respect to which learning is more likely to occur.
Our results continues to hold, but their statistical significance weakens somewhat, if we include
firms that are followed by less than five analysts.
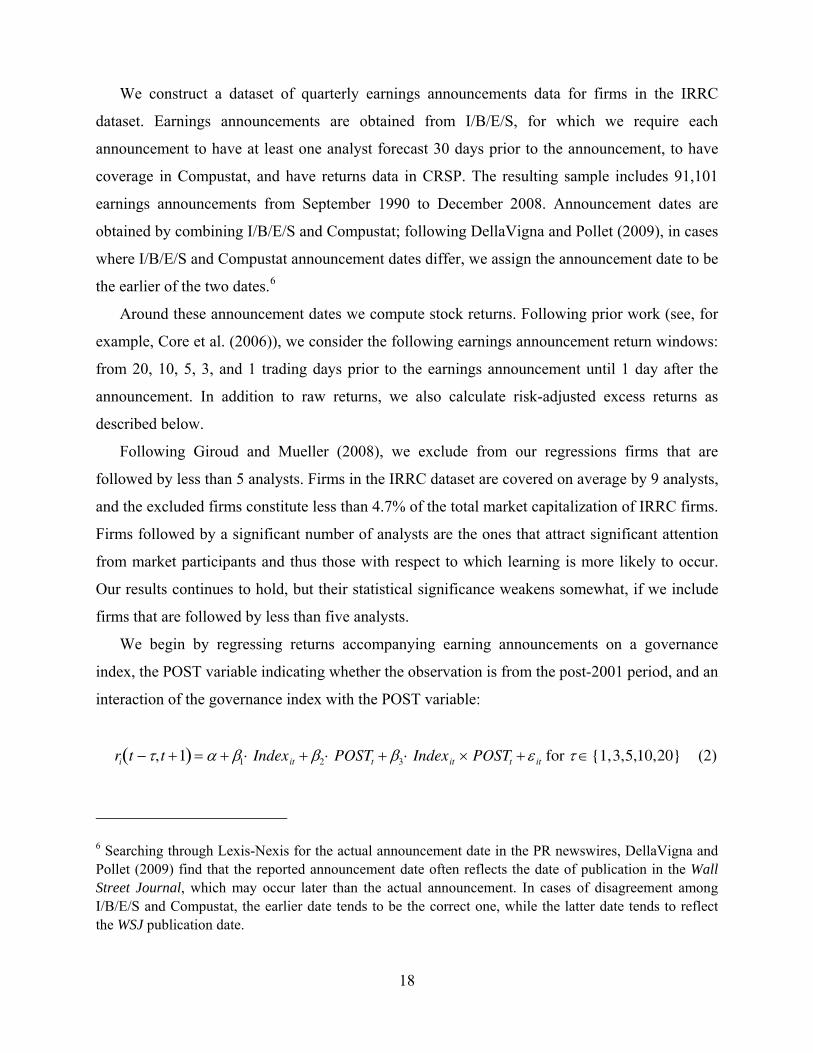
We begin by regressing returns accompanying earning announcements on a governance
index, the POST variable indicating whether the observation is from the post-2001 period, and an
interaction of the governance index with the POST variable:
ri t −τ, t +1( ) = α + β1⋅ Indexit + β2 ⋅ POSTt + β3 ⋅ Indexit × POSTt +ε it for τ ∈{1,3,5,10,20} (2)
6 Searching through Lexis-Nexis for the actual announcement date in the PR newswires, DellaVigna and Pollet (2009) find that the reported announcement date often reflects the date of publication in the Wall Street Journal, which may occur later than the actual announcement. In cases of disagreement among I/B/E/S and Compustat, the earlier date tends to be the correct one, while the latter date tends to reflect the WSJ publication date.
18
Under the learning hypothesis we are testing, we expect to see i) higher returns around the
announcements of good-governance firms during 1990-2001 (β1 < 0), and ii) no association
between governance and announcement returns during the post-2001 period (β1 + β3 = 0).
Columns (1)-(5) of Table IV Panel A (B) report pooled OLS estimation results using the G-
Index (E-Index). Each column looks at returns in one of the five windows of different lengths we
examine. To account for possible autocorrelation in quarterly earnings surprises (e.g., see
Bernard and Thomas (1989) and (1990)), we report Newey-West (1987) heteroskedasticicity and
autocorrelation robust standard errors, using a four quarter lag.
In all ten regressions, we find that the coefficient of the governance index used is negative
and statistically significant (at 99% significance in eight out of the ten regressions). Thus,
whether using the G or E Index, and whatever window around the earning announcement is used,
the evidence is consistent with the hypothesis that market participants were more positively
surprised by the earning announcements of good-governance firms than by the announcements of
poor-governance firms during the period 1990-2001.7
Furthermore, in all ten regressions, the coefficient of the interaction term between the POST
variable and the governance index used is positive and significant (at 99% significance in nine
out of the ten regressions). This evidence is consistent with a post-2001 erosion in the differential
between good-governance and poor-governance firms in terms of generating positive market
surprises by earning announcements.
Furthermore, in most of the regressions, the coefficient of the interaction terms is similar in
magnitude to the coefficient on the governance index used in the regressions. In nine of the ten
regressions, F-test results show that the relationship between governance and earnings surprises
post-2001, β1 + β3, is statistically no different from 0. Thus, the evidence is consistent with the
hypothesis that, by the end of 2001, the market had developed sufficiently accurate expectations
for how differences between good-governance and poor-governance firms can be expected to
manifest themselves in earning announcements.
7 Examining the difference during 1990-1999 between the returns accompanying earning announcements of good-governance firms and those of poor-governance firms, Core et al. (2006) obtain findings with the same sign as ours but without statistical significance. Unlike our analysis, their analysis aggregates all the returns accompanying earning announcements of firms with a given G-Index score (which reduces statistical power) and does not exclude firms followed by less than 5 analysts.
19
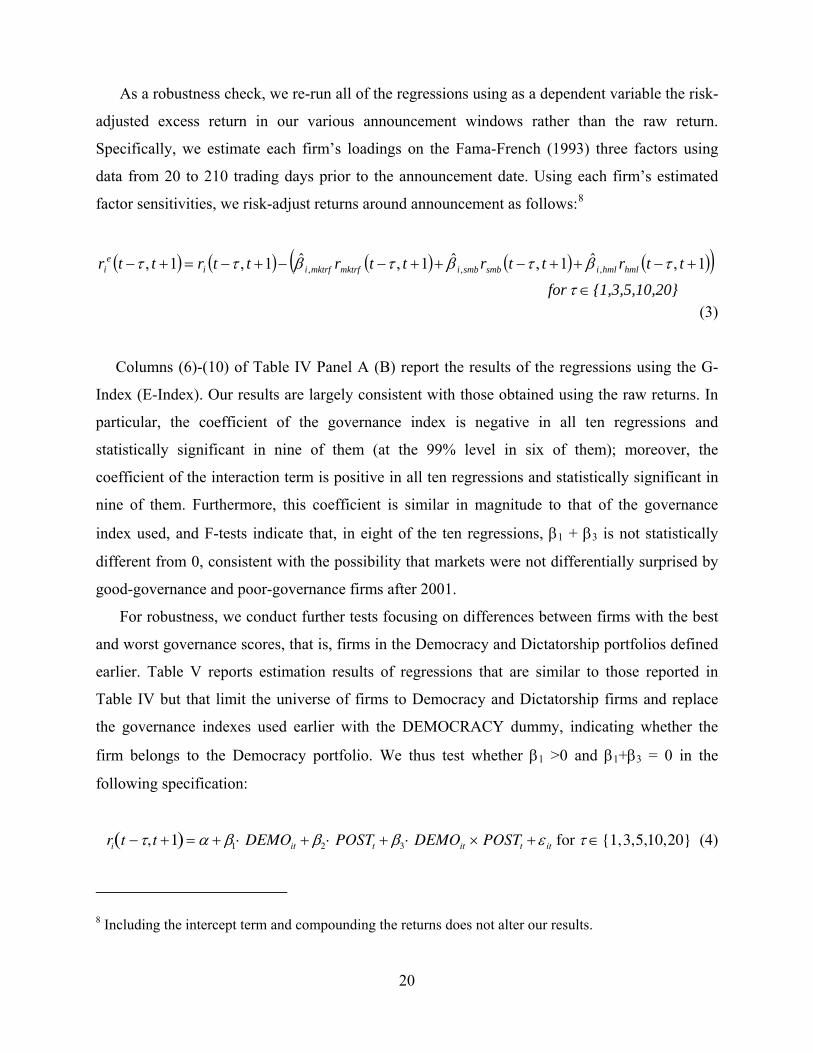
As a robustness check, we re-run all of the regressions using as a dependent variable the risk-
adjusted excess return in our various announcement windows rather than the raw return.
Specifically, we estimate each firm’s loadings on the Fama-French (1993) three factors using
data from 20 to 210 trading days prior to the announcement date. Using each firm’s estimated
factor sensitivities, we risk-adjust returns around announcement as follows:8
( ) ( ) ( ) ( ) ( )( )20}{1,3,5,10, for
ttrttrttrttrttr hmlhmlismbsmbimktrfmktrfiie
i
∈
+−++−++− −+−=+−
τ
τβτβτβττ 1,ˆ1,ˆ1,ˆ1,1, ,,,
(3)
Columns (6)-(10) of Table IV Panel A (B) report the results of the regressions using the G-
Index (E-Index). Our results are largely consistent with those obtained using the raw returns. In
particular, the coefficient of the governance index is negative in all ten regressions and
statistically significant in nine of them (at the 99% level in six of them); moreover, the
coefficient of the interaction term is positive in all ten regressions and statistically significant in
nine of them. Furthermore, this coefficient is similar in magnitude to that of the governance
index used, and F-tests indicate that, in eight of the ten regressions, β1 + β3 is not statistically
different from 0, consistent with the possibility that markets were not differentially surprised by
good-governance and poor-governance firms after 2001.
For robustness, we conduct further tests focusing on differences between firms with the best
and worst governance scores, that is, firms in the Democracy and Dictatorship portfolios defined
earlier. Table V reports estimation results of regressions that are similar to those reported in
Table IV but that limit the universe of firms to Democracy and Dictatorship firms and replace
the governance indexes used earlier with the DEMOCRACY dummy, indicating whether the
firm belongs to the Democracy portfolio. We thus test whether β1 >0 and β1+β3 = 0 in the
following specification:
ri t −τ, t +1( ) = α + β1⋅ DEMOit + β2 ⋅ POSTt + β3 ⋅ DEMOit × POSTt +ε it for τ ∈{1,3,5,10,20} (4)
8 Including the intercept term and compounding the returns does not alter our results.
20
The organization of Table V follows the format of Table IV and the results are similar. The
coefficient of DEMOCRACY is negative in all regressions and statistically significant in most of
them, consistent with the market being more positively surprised by the earning announcements
of Democracy firms than by those of Dictatorship firms during 1990-2001. At the same time, F-
tests show that in all regression specifications β1 + β3 is not statistically significant from 0,
consistent with market participants’ no longer being differentially surprised by those two types
of firms after 2001. In sum, our findings in Table V, as well as the preceding Table IV, are
consistent with the learning hypothesis that (i) during 1990-2001 the market did not fully absorb
the significance of the provisions in the governance indices and was consequently more
positively surprised by the earning announcements of good-governance firms than by those of
poor-governance firms, and (ii) after 2001, market participants sufficiently recognized the
difference between good-governance and bad-governance firms so that they were not
differentially surprised by the earning announcements of these different types of firms.
3.5 Analyst Forecast Surprises
If the market was more likely to be positively surprised by the earnings announcements of
some firms, one might also wonder whether analysts were also more positively surprised by the
announcements of such firms. Because there is evidence indicating that the I/B/E/S data on
analysts may not be fully reliable (see, e.g., Ljungqvist et al. (2008)), and because stock prices
and stock prices over time are determined by market participants in the aggregate rather than
analysts, we believe that tests based on differences between earning announcements and analyst
forecasts are likely to be less telling than tests based on market reactions reflected in stock
returns. Nonetheless, we complement our analysis of such market reactions with an analysis of
the relationship between analyst surprises and governance scores in different periods.
We use data about analyst forecasts from I/B/E/S as in the previous section, and we again
exclude firms that are followed by fewer than three analysts. We continue to use quarterly
earning announcements, and match them with the corresponding analyst forecasts. We define
“consensus forecasted earning” as the median analyst forecast on the closest date prior to the last
day of the fiscal period, and define the variable “SURPRISE” as equal to the actual earnings
announced by a firm minus the consensus forecasted earnings divided by the stock price 5 days
prior to the announcement date.
21
Since this variable can be quite noisy, we follow the approach of Campbell, Lo, and
McKinley (1997) and use discretized variables that take three values depending on whether there
is a meaningful positive surprise, a meaningful negative surprise, or no meaningful surprise.
First, we use NEWS1, which takes on 3 values representing good/no/bad news: it is equal to 1 if
SURPRISE is greater than 5%, is equal to 0 if SURPRISE is between -5% to 5%, and is equal to
-1 if SURPRISE is less than -5%. Second, we use NEWS2, which also takes on 3 values
representing good/no/bad news: NEWS2 is equal to 1 if SURPRISE is greater than 10%, 0 if
SURPRISE is between -10% to 10%, and is equal to -1 if SURPRISE is less than -10%.
For each of the NEWS1 and NEWS2 variables, we estimate an ordered probit using as
explanatory variables a governance variable (E-Index, G-Index, DEMOCRACY(G) or
DEMOCRACY (E)), the POST variable for observations after 2001, and an interaction of the
governance variable and the POST variable. Results of the ordered probit estimation are reported
in Table VI.
In general, we find evidence that is consistent with the findings in Tables IV and V based on
surprises captured in market reactions to earning announcements. Specifically, we find that
better-governed firms are more likely to have good surprises (positive news), and vice versa. The
coefficients of the governance variables are negative in all regressions, and statistically
significant in six out of the eight regressions. This finding is consistent with the possibility that,
during the 1990-2001 period, earning announcements of good-governance firms were more
likely to represent a meaningful positive surprise relative to analyst forecasts than the
announcements of poor-governance firms.9
Furthermore, examining the sum of the coefficient of the governance variable and the
variable interacting governance with POST, F-tests indicate that in most regressions the
9 Examining the difference between good-governance firms and poor-governance firms in terms of analyst surprises during 1990-1999, Core et al. (2006) obtain findings with the same sign as ours but without statistical significance. Unlike our analysis, their analysis does not focus just on meaningful surprises (which we do by using discretized variables following Campbell, Lo, and MacKinley (1997), does not exclude firms followed by less than 5 analysts, uses the annual analyst forecasts rather than the quarterly forecasts which we use, and does not use data about analyst surprises after 1999. Giroud and Mueller (2008), excluding firms followed by less than 5 analysts, obtain results consistent with those we obtain for the 1990-2001 period. None of these studies considers differences between the period before and after the end of 2001, which is the focus of our analysis in this subsection.
22
associations between surprises and governance is statistically no different from 0 in the post-
2001 period. This is consistent with the possibility that, after 2001, good-governance firms were
no longer more likely to generate meaningful analyst surprises than poor-governance firms.
Thus, as with market surprises around earnings announcements, the evidence discussed in
this section is also consistent with the hypothesis that, by the end of 2001, market players have
internalized the difference between good-governance and poor-governance firms (as those firms
are defined by the governance indices).
3.6 Robustness Checks: Excluding New Economy Firms and Competitive Industries
Our results through this Section have been consistent with the existence of differences
between the 1990-2001 period and the 2002-2008 period. We now turn to examine whether our
findings are robust to excluding two types of firms.
First, Core et al. (2006) suggest that GIM’s results might have been partly driven by new
economy firms. It might similarly be asked whether the differences we identify between the two
periods are partly driven by the new economy firms which fared so differently in these two
periods. To examine this possibility, we repeat all of our tests after excluding new economy
firms. We use the classification of new economy firms used by Murphy (2003) (who in turn
followed the approach of Anderson et al. (2000)). In untabulated results, we also repeat all our
tests excluding new economy firms as classified by Hand (2003) (a classification which excludes
fewer firms), and we obtain similar results.
Second, Giroud and Mueller (2008) report that GIM’s results were driven by firms in non-
competitive industries, where the lack of product market competition makes internal governance
especially important. They suggest that the benefits of governance which were unappreciated by
investors in 1990 were concentrated in such firms. Accordingly, it might be asked whether the
patterns consistent with learning that we identify continue to hold when one focuses solely on
firms in non-competitive industries.
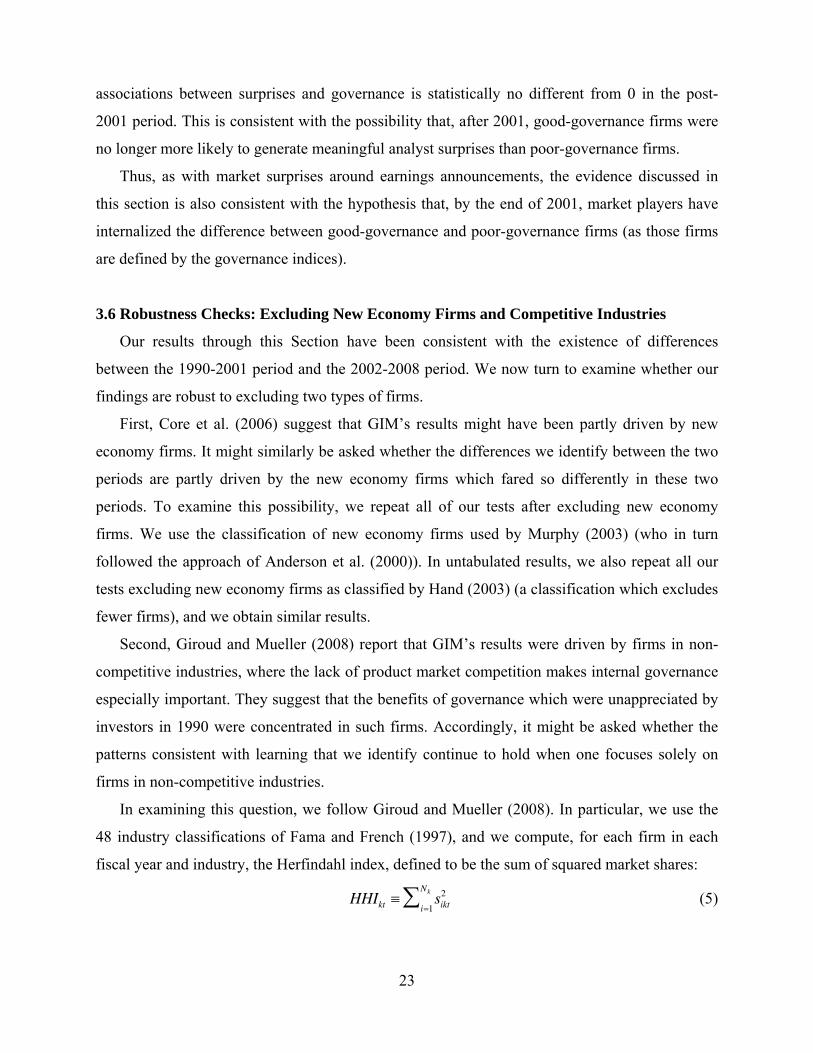
In examining this question, we follow Giroud and Mueller (2008). In particular, we use the
48 industry classifications of Fama and French (1997), and we compute, for each firm in each
fiscal year and industry, the Herfindahl index, defined to be the sum of squared market shares:
HHIkt ≡ sikt2
i=1
Nk∑ (5)
23
where sikt is the market share of firm i in industry j in year t, and market shares are defined using
sales. The computation of HHI requires the entire Compustat universe; however, in our tests we
define terciles of HHI in a given point in time among firms in the democracy and dictatorship
portfolios, respectively. That is, in a given point in time we divide the Democracy and
Dictatorship portfolios into three equal-sized portfolios based on terciles of HHI, following
Giroud and Mueller (2008); to test whether our results hold for the firms in the least competitive
firms, we remove the lowest tercile and the lowest two terciles of firms from the Democracy and
Dictatorship portfolios respectively.
Table VII displays the results of the robustness tests we conducted. Panel A of Table VII
conducts robustness tests for our results on abnormal returns (Table IV). We find that by
excluding new economy firms or firms in more competitive industries, we still obtain consistent
and persistent evidence that after 2001 there is a statistically and economically significant
decline in the abnormal returns generated by trading on corporate governance indices. For each
of the three cuts of the data (excluding new economy firms, excluding the lowest HHI tercile
firms among the Democracy and Dictatorship portfolio firms respectively, and excluding the
lowest two HHI tercile firms among the Democracy and Dictatorship portfolio firms
respectively), we consider abnormal returns from going long(short) on Democracy(Dictatorship)
firms, defined by E and G, both using market-value-weighted and equal-weighted portfolios.
Altogether, we conduct in this way a total of 3x2x2 = 12 robustness tests. In 11 of the 12 tests of
Panel A, we find statistically significant average monthly abnormal returns from 1990 to 2001.
Moreover, in all the 12 tests of Panel A, F-tests indicate that after 2001 average abnormal returns
are statistically indistinguishable from 0.
Panel B of Table VII conducts robustness tests for our results relating earnings
announcement returns to governance indices (Table V). While we only report results from a
window of five trading days prior to until one day after the earnings announcement date,
robustness tests using all other windows considered in Table V are similar. For each of the three
cuts of data and for Democracy(Dictatorship) definitions based on G and E, we consider raw
returns as well as returns in excess of Fama-French three factors, totaling 3x2x2 = 12 robustness
tests. All 12 robustness tests in Panel B of Table VIII indicate that the market is more positively
surprised by good-governance firms than bad-governance firms during the period 1990-2001.
Moreover, in all 12 tests we find that, after 2001, there is no statistically significant difference in
24
the market’s reaction around earnings announcements of good-governance versus bad-
governance firms.
Finally, Panel C of Table VII conducts robustness tests for our results relating analyst
surprises to governance indices (Table VI). Here, we re-run the regressions of Table VI for each
of the three cuts of the data, for Democracy(Dictatorship) firms based on G and E definitions, as
well as the two news variables (NEWS1 and NEWS2) used in Table VI, totaling 3x2x2 = 12
robustness tests. In all 12 tests we find that analysts are more likely to be positively surprised by
good-governance firms during the period 1990-2001, though only 7 of the 12 tests show
statistical significance at the 5% level. On the other hand, after 2001, this relationship no longer
holds in 11 of the 12 robustness tests.
We thus conclude that our results concerning the differences between the 1990-2001
period and the 2002-2008 period – in terms of the abnormal returns associated with trading
strategies based on the G and E indices, of how good-governance and poor-governance firms
differed in the abnormal returns accompanying earning announcements, and of how these two
types of firms varied in producing positive analyst surprises – are robust both to excluding new
economy firms and focusing solely on firms in non-competitive industries.
3.7 The Persistence of the Association between Governance and Tobin’s Q
That governance indices were no longer associated with abnormal returns during the post-
2001 period does not imply that these indices were also no longer associated with firm value and
performance during this period. We therefore turn to examine whether the association between
the governance indices and firm value documented by prior work has persisted during the 2001-
2008 period.
Tobin’s Q has long been used in the governance literature as a key measure of firm value and
performance.10 Gompers, Ishii and Metrick (2003) report a strong and negative association
between the G-Index and Tobin’s Q from 1990 to 1999. Bebchuk, Cohen, and Ferrell (2009) find
a strong and negative association between the E-Index and Tobin’s Q from 1992 to 2002. We
10 See, e.g., Demsetz and Lehn (1985), Morck et al. (1988), McConnell and Servaes (1990), Lang and Stulz (1994), and LaPorta et al (2002).
25
check below whether the negative association between these indices and Tobin’s Q persisted in
later years.
Following prior work, we use the definition of Tobin’s Q in Kaplan and Zingales (1997),
who define Tobin’s Q as the market value of assets divided by the book value of assets plus the
market value of common stock less the sum of book value of common stock and balance sheet
deferred taxes. For our analyses of firm value, we use the log of industry-median adjusted
Tobin’s Q, defined as the log of a firm’s Q divided by the industry’s median Q, where we use
two-digit SIC code industry definitions.
We run annual regressions of industry-adjusted Tobin’s Q on the governance indices, and
include standard controls obtained from Compustat as those used in Bebchuk, Cohen, and Ferrell
(2009), who in turn used the same controls of Gompers, Ishii and Metrick with a few additions.
(Using only the controls employed by GIM, with no additions, yields similar results.) In
particular, we use the following variables as controls in the Q regressions: log of the book value
of assets in the current fiscal year; log of company age measured in years; inside ownership (the
fraction of shares held by officers and directors), square of inside ownership, ROA (the ratio of
net income to assets) in the current fiscal year, CAPEX/assets (the ratio of capital expenditures to
assets) in the current fiscal year, leverage (the ratio of long-term debt plus debt due in one year to
assets) in the current fiscal year, R&D per sales in the current fiscal year; and a dummy for
incorporation in Delaware. We also include dummies for missing R&D expenditure data and
missing inside ownership data.
Table VIII reports annual OLS regressions coefficients on the governance indices from 1992
to 2008, omitting coefficients on the controls and the constant term. (We begin with 1992
because data on insider ownership as control, which is obtained from ExecuComp, begins in
1992.) As expected, our results for earlier years replicate those in earlier studies. More
importantly, we find that the negative correlation between Tobin’s Q and governance indices
continues to be statistically significant and economically meaningful until the end of our
period.11
11 Our findings concerning the persistence of the relationship between the governance indices G and E and Tobin’s Q are consistent with those of Cremers and Ferrell (2009), who extend the analysis back to 1978 and find a consistently negative association between industry adjusted Q and G-Index from 1978 to 2006, and of Giroud and Mueller (2008) who report such results for the years 1990-2006.
26
Table VIII also reports Fama-Macbeth coefficients for the 1992-2008 period as well as for
the 1992-2001 and 2002-2008 periods. For the G-Index, the Fama-Macbeth coefficient is -0.074
(with significance at the 95% confidence level) for the period 1992-2001 and -0.0107 (with
significance at the 99% confidence level) for the period 2002-2008. For the E-Index, the Fama-
Macbeth coefficient is -0.0229 (with significance at the 95% confidence level) for the period
1992-2001 and -0.0277 (with significance at the 99% confidence level) for the period 2002-
2008. The somewhat higher Fama-MacBeth coefficients in the second period are consistent with
the fact that, during the first period, good-governance firms earned abnormal returns relative to
poor-governance firms, which operated to widen market capitalization differences between
good-governance and poor-governance firms. Thus, if anything, the association between
governance indices and industry-adjusted Tobin’s Q gained strengthened significance after 2001.
We can thus conclude that, while the association between the governance indices and
abnormal returns did not exist after the period for which it was identified, the relationship
between governance indices and Tobin’s Q found by prior work persisted throughout our sample
period. Thus, while the governance indices may no longer provide a tool for generating abnormal
returns, they remain a useful tool for investors, researchers, and policymakers interested in
governance.
4. Conclusion
This paper has sought to help resolve the questions arising from GIM’s well-known and
intriguing finding of an association between governance and abnormal returns during the 1990s.
We have shown that the association ceased to the exist during the 2000s and we have provided
evidence that can help explain both the existence of the association during the 1990s and its
subsequent disappearance. Our findings are consistent with the learning hypothesis under which
(i) markets in 1990 did not fully appreciate the difference between good-governance and poor-
governance firms, and (ii) markets learned during the 1990s to appreciate these differences and
gradually factored them into market prices. While simple strategies based on the governance
indices can no longer be used to generate abnormal trading profits, the G-Index and E-Index
continue to be negatively correlated with firm value and should remain a valuable tool for
researchers, investors, and policymakers.
27
References Anderson, M. R. Banker, and S. Ravindran (2000). “Executive Compensation in the Information
Technology Industry,” Management Science 46:530-547. Bebchuk, Lucian, Alma Cohen, and Allen Ferrell (2009). “What Matters in Corporate
Governance.” Review of Financial Studies 22(2):783-827. Bernard, Victor, and Jacob K. Thomas (1989). “Post-Earnings Announcement Drift: Delayed
Price Response or Risk Premium?,” Journal of Accounting Research, Supplement XXVII, 1-36.
Bernard, Victor, and Jacob K. Thomas (1990). “Evidence that Stock Prices do not Fully Reflect
the Implications of Current Earnings for Future Earnings.” Journal of Accounting and Economics 13: 305-341.
Bhojraj, Sanjeev, Charles M. C. Lee, and Derek K. Oler (2003). “What’s My Line? A
Comparison of Industry Classification Schemes for Capital Market Research.” Journal of Accounting Research 41(5): 745-774.
Brav, Alon and J. B. Heaton (2002). “ Competing Theories of Financial Anomalies,” The Review
of Financial Studies” 15: 575-606. Campbell, John Y., Andrew W. Lo, and A. Craig MacKinlay (1997). The Econometrics of
Financial Markets. (Princeton University Press, Princeton, NJ). Carhart, Mark M. (1997). "On Persistence in Mutual Fund Performance." Journal of Finance
52(1): 57-82. Chhaochharia, Vidhi, and Yaniv Grinstein (2007). “Corporate Governance and Firm Value: The
Impact of the 2002 Governance Rules.” Journal of Finance 62: 1789-1825. Cochrane, John H. (1999). “New Facts in Finance.” Economic Perspectives 23, Federal Reserve
Bank of Chicago: 36-58. Core, John E., Wayne R. Guay, and Tjomme O. Rusticus (2006). “Does Weak Governance
Cause Weak Stock Returns: An Examination of Firm Operating Performance and Investors’ Expectations,” Journal of Finance 61: 655-687.
R-1

Cremers, Martijn and Allen Ferrell (2009). “Thirty Years of Corporate Governance: Firm Valuation and Stock Returns.” Working Paper.
Cremers, Martijn, Vinai Nair, and Kose John (2009). “Takeovers and the Cross-Section of
Returns,” Review of Financial Studies 22: 1409-1445. Daniel, Kent and Sheridan Titman (1999), “Market Efficiency in an Irrational World,” Financial
Analysts’ Journal, 55(6): 28-40. DellaVigna, Stefano and Joshua Pollet (2009). "Investor Inattention and Friday Earnings
Announcements." Journal of Finance 64(2): 709-749 Demsetz, Harold, and Kenneth Lehn (1985). “The Structure of Corporate Ownership: Causes
and Consequences.” Journal of Political Economy 93(6):1155–1177 Dittmar, Amy and Jan Mahrt-Smith (2007). “Corporate Governance and the Value of Cash
Holdings,” Journal of Financial Economics 83: 599-634. Fama, Eugene (1970). “Efficient Capital Markets: A Review of Theory and Empirical Work,”
Journal of Finance 25: 383-417. Fama, Eugene and Kenneth R. French (1993). “Common Risk Factors in the Returns on Bonds
and Stocks. Journal of Financial Economics 33: 3-53. Fama, Eugene and Kenneth R. French (1997), “Industry Costs of Capital.” Journal of Finance
47: 427-465. Fama, Eugene F. and James D. MacBeth (1975). “Risk, Return, and Equilibrium: Empirical
Tests.” Journal of Political Economy 81(3): 607-636. Georgeson Shareholder (2003). Annual Corporate Governance Review. Giroud, Xavier, and Holger M. Mueller (2008). “Corporate Governance, Product Market
Competition, and Equity Markets,” Working Paper. Gompers, Paul A., Joy L. Ishii, and Andrew Metrick (2003). "Corporate Governance and Equity
Prices." Quarterly Journal of Economics 118(1):107-155. Hand, John R. M. (2003). “Profits, Losses and the Nonlinear Pricing of Internet Stocks,” in
Intangible Assets: Values, Measures, and Risks (J.R.M. Hand and B. Lev, ed.).
R-2
Ikenberry, David L., Josef Lakonishok, and Theo Vermaelen (1995). “Market Underreaction to
Open Market Share Repurchases,” Journal of Financial Economics 39: 181-208. Investor Responsibility Research Center (IRRC) (1990, 1993, 1995, 1998, 2000, 2002, 2004,
2006). Corporate Takeover Defenses. Kaplan, Steven N. and Luigi Zingales (1997). “Do Investment-Cash Flow Sensitivities Provide
Useful Measures of Financing Constraints?” Quarterly Journal of Economics 112(1):169-216.
Karpoff, Jonathan M. and Paul H. Malatesta (1989). “The Wealth Effects of Second-Generation
State Takeover Legislation.” Journal of Financial Economics 25: 291-322. La Porta, Rafael, Josef Lakonishok, Andrei Shleifer, and Robert Vishny (1997). “Good News for
Value Stocks: Further Evidence on Market Efficiency,” Journal of Finance 52: 859-874. La Porta, Rafael, Florencio Lopez-de-Silanes, Andrei Shleifer, and Robert W. Vishny (2002).
“Investor Protection and Corporate Valuation.” Journal of Finance 57: 1147-1170. Ljungqvist, Alexander, Christopher Malloy, and Felicia Marston (2008). “Rewriting History.”
Working Paper. Lang, Larry H.P. and René M. Stulz. (1994). “Tobin’s Q, Corporate Diversification, and Firm
Performance.” Journal of Political Economy 102(6):1248–1280. Masulis, Ronald W., Cong Wang, and Fei Xie (2007). “Corporate Governance and Acquirer
Returns.” Journal of Finance 39: 1851-1889. McConnell, John J. and Henri Servaes (1990). Additional Evidence on Equity Ownership and
Corporate Value. Journal of Financial Economics 27: 595-612. Michaely, Roni, Richard H. Thaler, and Kent L. Womack (1995). “Price Reactions to Dividend
Initiations and Omissions,” Journal of Finance 38: 1597-1606. Morck, Randall, Andrei Shleifer, and Robert W. Vishny (1988). “Management Ownership and
Market Valuation: An Empirical Analysis.” Journal of Financial Economics 20: 293–315. Murphy, Kevin J. (2003). “Stock-Based Pay in New Economy Firms.” Journal of Accounting
and Economics 34:129–147.
R-3
R-4
Newey, Whitney K. and Kenneth D. West (1987). “A Simple, Positive Semi-definite, Heteroskedasticity and Autocorrelation Consistent Covariance Matrix.” Econometrica 55(3): 703–708.
Schwert, G. William (2003), “Anomalies and Market Efficiency, “in Handbook of the Economics
of Finance (G. Constantinides , M. Harris, and R.M. Stulz, eds.). Shleifer, Andrei and Robert W. Vishny (1997). "The Limits of Arbitrage," Journal of Finance
52(1): 35-55. White, Halbert (1980). “A Heteroskedasticity-Consistent Covariance Matrix Estimator and a
Direct Test for Heteroskedasticity.” Econometrica 48: 817-838.
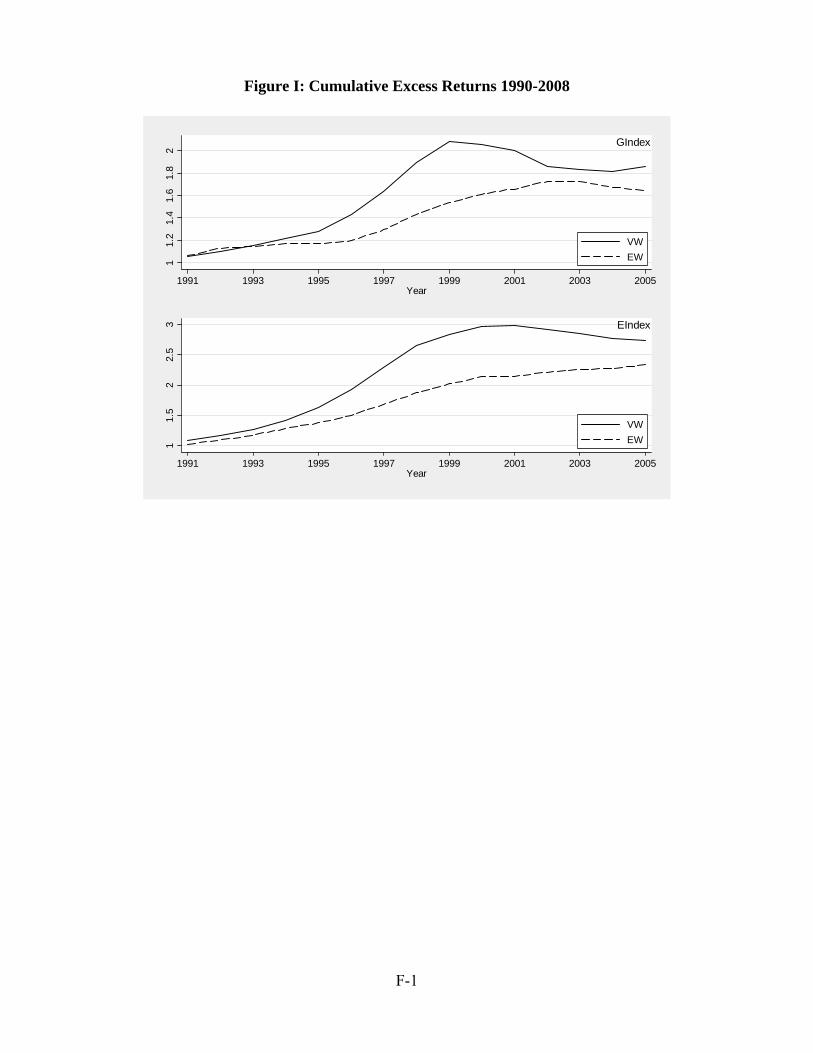
Figure I: Cumulative Excess Returns 1990-2008
11.
21.
41.
61.
82
1991 1993 1995 1997 1999 2001 2003 2005Year
VWEW
GIndex
11.
52
2.5
3
1991 1993 1995 1997 1999 2001 2003 2005Year
VWEW
EIndex
F-1
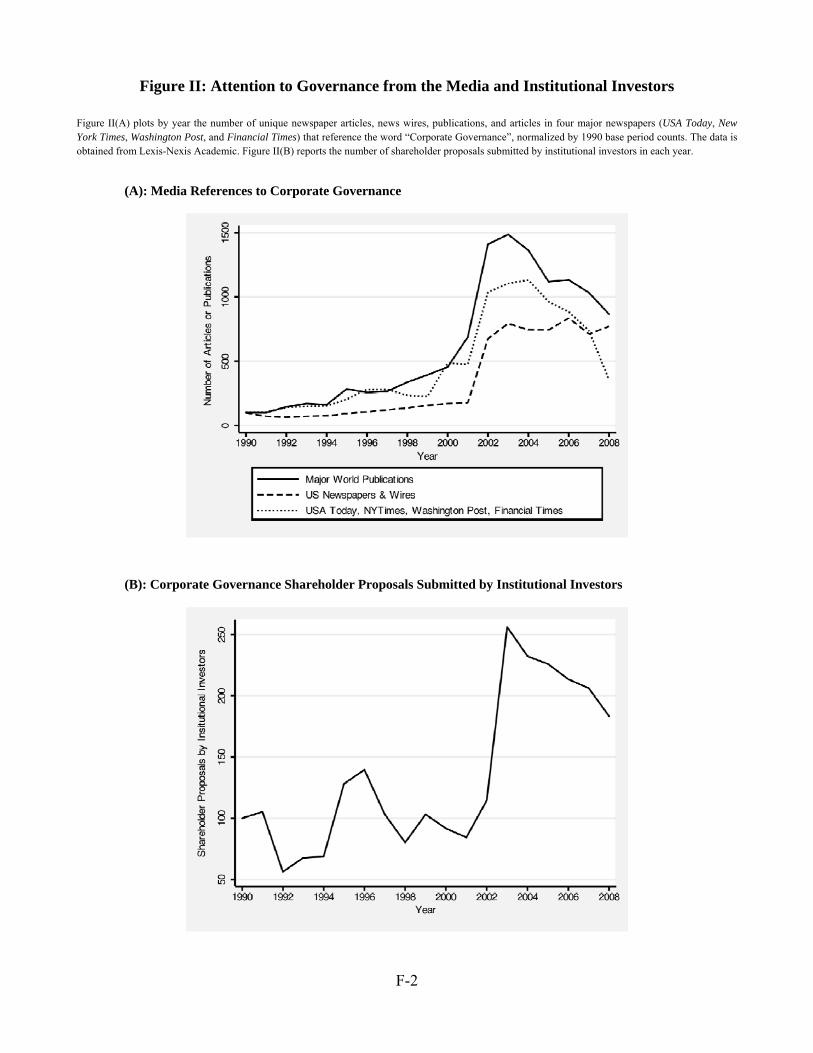
Figure II: Attention to Governance from the Media and Institutional Investors
Figure II(A) plots by year the number of unique newspaper articles, news wires, publications, and articles in four major newspapers (USA Today, New York Times, Washington Post, and Financial Times) that reference the word “Corporate Governance”, normalized by 1990 base period counts. The data is obtained from Lexis-Nexis Academic. Figure II(B) reports the number of shareholder proposals submitted by institutional investors in each year.
(A): Media References to Corporate Governance
(B): Corporate Governance Shareholder Proposals Submitted by Institutional Investors
F-2
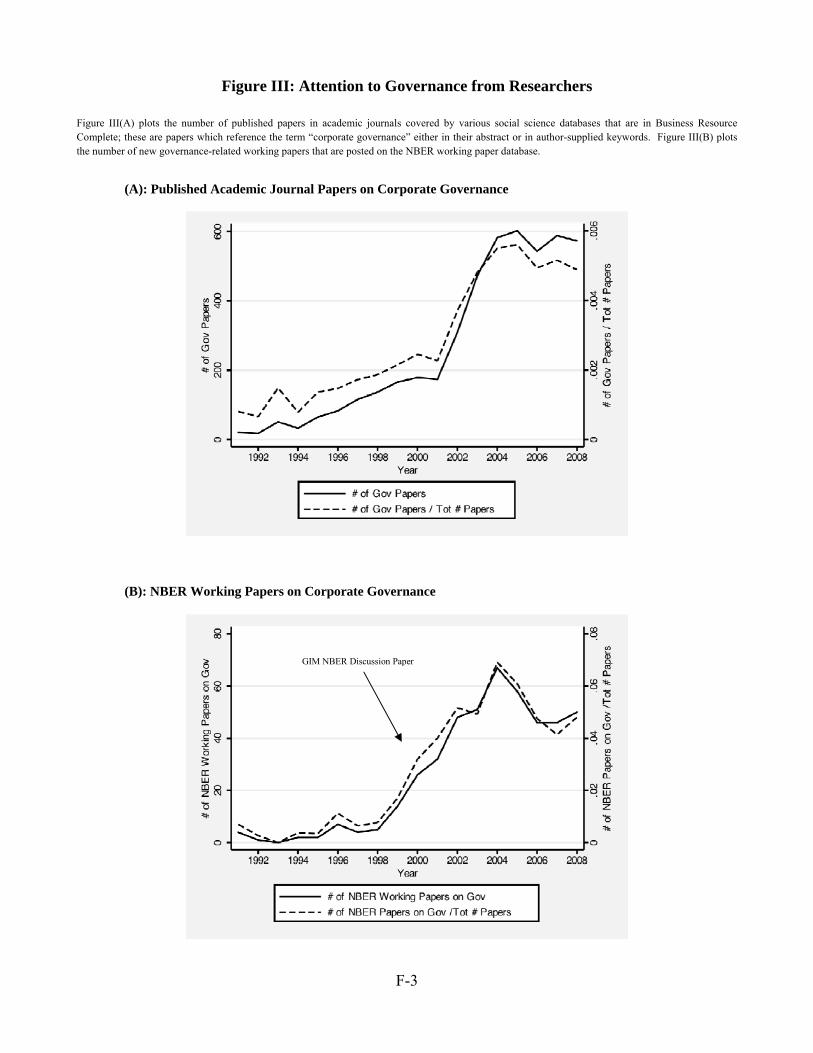
Figure III: Attention to Governance from Researchers
Figure III(A) plots the number of published papers in academic journals covered by various social science databases that are in Business Resource Complete; these are papers which reference the term “corporate governance” either in their abstract or in author-supplied keywords. Figure III(B) plots the number of new governance-related working papers that are posted on the NBER working paper database.
(A): Published Academic Journal Papers on Corporate Governance
(B): NBER Working Papers on Corporate Governance
GIM NBER Discussion Paper
F-3
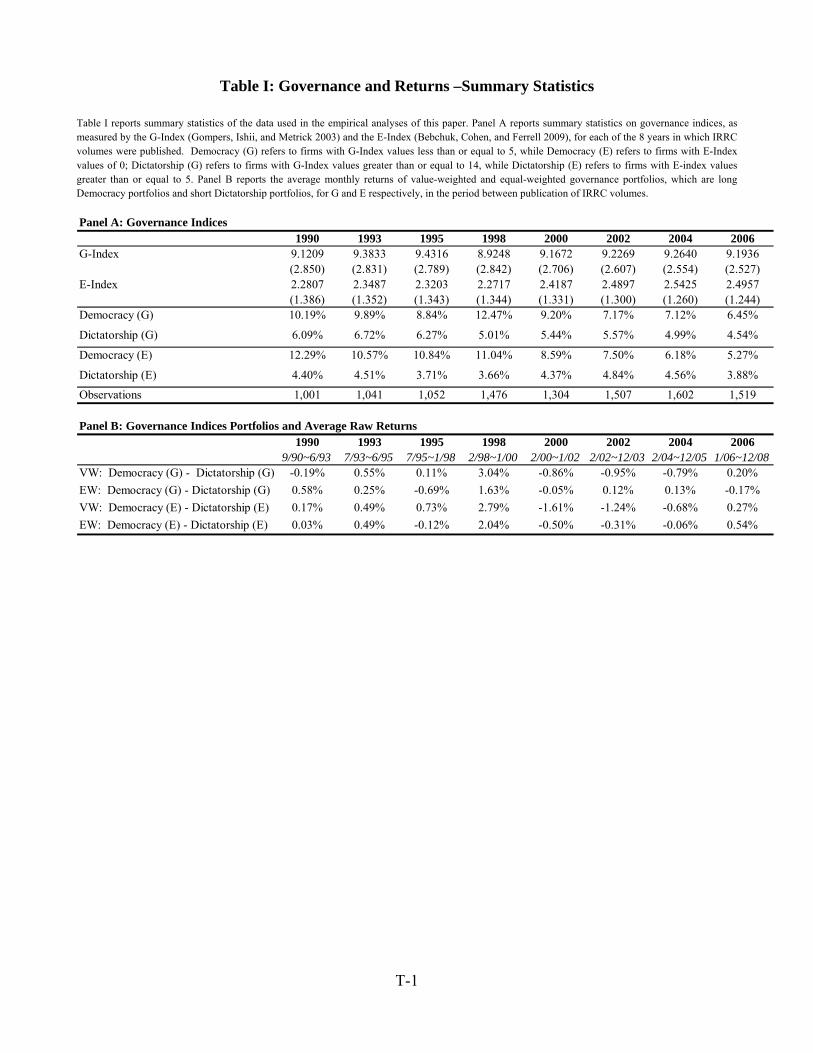
Table I: Governance and Returns –Summary Statistics
Table I reports summary statistics of the data used in the empirical analyses of this paper. Panel A reports summary statistics on governance indices, as measured by the G-Index (Gompers, Ishii, and Metrick 2003) and the E-Index (Bebchuk, Cohen, and Ferrell 2009), for each of the 8 years in which IRRC volumes were published. Democracy (G) refers to firms with G-Index values less than or equal to 5, while Democracy (E) refers to firms with E-Index values of 0; Dictatorship (G) refers to firms with G-Index values greater than or equal to 14, while Dictatorship (E) refers to firms with E-index values greater than or equal to 5. Panel B reports the average monthly returns of value-weighted and equal-weighted governance portfolios, which are long Democracy portfolios and short Dictatorship portfolios, for G and E respectively, in the period between publication of IRRC volumes.
Panel A: Governance Indices1990 1993 1995 1998 2000 2002 2004 2006
G-Index 9.1209 9.3833 9.4316 8.9248 9.1672 9.2269 9.2640 9.1936(2.850) (2.831) (2.789) (2.842) (2.706) (2.607) (2.554) (2.527)
E-Index 2.2807 2.3487 2.3203 2.2717 2.4187 2.4897 2.5425 2.4957(1.386) (1.352) (1.343) (1.344) (1.331) (1.300) (1.260) (1.244)
Democracy (G) 10.19% 9.89% 8.84% 12.47% 9.20% 7.17% 7.12% 6.45%
Dictatorship (G) 6.09% 6.72% 6.27% 5.01% 5.44% 5.57% 4.99% 4.54%
Democracy (E) 12.29% 10.57% 10.84% 11.04% 8.59% 7.50% 6.18% 5.27%
Dictatorship (E) 4.40% 4.51% 3.71% 3.66% 4.37% 4.84% 4.56% 3.88%
Observations 1,001 1,041 1,052 1,476 1,304 1,507 1,602 1,519
Panel B: Governance Indices Portfolios and Average Raw Returns1990 1993 1995 1998 2000 2002 2004 2006
9/90~6/93 7/93~6/95 7/95~1/98 2/98~1/00 2/00~1/02 2/02~12/03 2/04~12/05 1/06~12/08VW: Democracy (G) - Dictatorship (G) -0.19% 0.55% 0.11% 3.04% -0.86% -0.95% -0.79% 0.20%EW: Democracy (G) - Dictatorship (G) 0.58% 0.25% -0.69% 1.63% -0.05% 0.12% 0.13% -0.17%VW: Democracy (E) - Dictatorship (E) 0.17% 0.49% 0.73% 2.79% -1.61% -1.24% -0.68% 0.27%EW: Democracy (E) - Dictatorship (E) 0.03% 0.49% -0.12% 2.04% -0.50% -0.31% -0.06% 0.54%
T-1
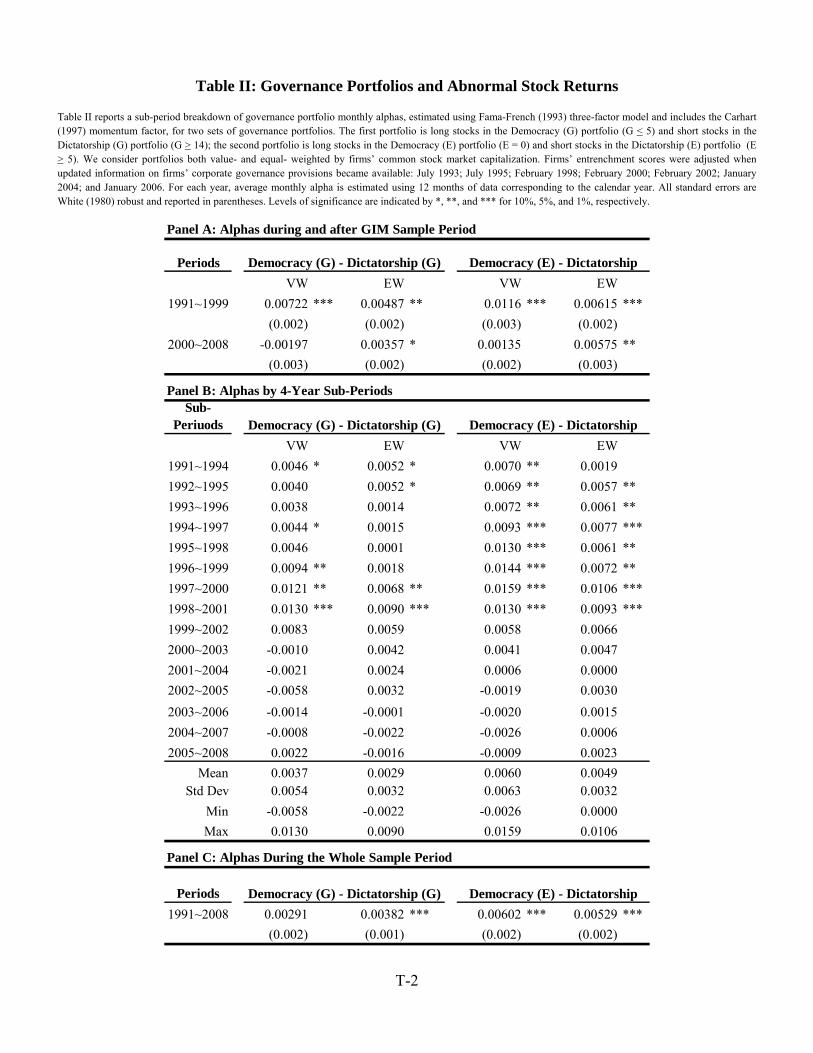
Table II: Governance Portfolios and Abnormal Stock Returns
Table II reports a sub-period breakdown of governance portfolio monthly alphas, estimated using Fama-French (1993) three-factor model and includes the Carhart (1997) momentum factor, for two sets of governance portfolios. The first portfolio is long stocks in the Democracy (G) portfolio (G < 5) and short stocks in the Dictatorship (G) portfolio (G > 14); the second portfolio is long stocks in the Democracy (E) portfolio (E = 0) and short stocks in the Dictatorship (E) portfolio (E > 5). We consider portfolios both value- and equal- weighted by firms’ common stock market capitalization. Firms’ entrenchment scores were adjusted when updated information on firms’ corporate governance provisions became available: July 1993; July 1995; February 1998; February 2000; February 2002; January 2004; and January 2006. For each year, average monthly alpha is estimated using 12 months of data corresponding to the calendar year. All standard errors are White (1980) robust and reported in parentheses. Levels of significance are indicated by *, **, and *** for 10%, 5%, and 1%, respectively.
Panel A: Alphas during and after GIM Sample Period
PeriodsVW EW VW EW
1991~1999 0.00722 *** 0.00487 ** 0.0116 *** 0.00615 ***(0.002) (0.002) (0.003) (0.002)
2000~2008 -0.00197 0.00357 * 0.00135 0.00575 **(0.003) (0.002) (0.002) (0.003)
Panel B: Alphas by 4-Year Sub-PeriodsSub-
PeriuodsVW EW VW EW
1991~1994 0.0046 * 0.0052 * 0.0070 ** 0.00191992~1995 0.0040 0.0052 * 0.0069 ** 0.0057 **1993~1996 0.0038 0.0014 0.0072 ** 0.0061 **1994~1997 0.0044 * 0.0015 0.0093 *** 0.0077 ***1995~1998 0.0046 0.0001 0.0130 *** 0.0061 **1996~1999 0.0094 ** 0.0018 0.0144 *** 0.0072 **1997~2000 0.0121 ** 0.0068 ** 0.0159 *** 0.0106 ***1998~2001 0.0130 *** 0.0090 *** 0.0130 *** 0.0093 ***1999~2002 0.0083 0.0059 0.0058 0.00662000~2003 -0.0010 0.0042 0.0041 0.00472001~2004 -0.0021 0.0024 0.0006 0.00002002~2005 -0.0058 0.0032 -0.0019 0.00302003~2006 -0.0014 -0.0001 -0.0020 0.00152004~2007 -0.0008 -0.0022 -0.0026 0.00062005~2008 0.0022 -0.0016 -0.0009 0.0023
Mean 0.0037 0.0029 0.0060 0.0049Std Dev 0.0054 0.0032 0.0063 0.0032
Min -0.0058 -0.0022 -0.0026 0.0000Max 0.0130 0.0090 0.0159 0.0106
Panel C: Alphas During the Whole Sample Period
Periods1991~2008 0.00291 0.00382 *** 0.00602 *** 0.00529 ***
(0.002) (0.001) (0.002) (0.002)
Democracy (G) - Dictatorship (G)
Democracy (E) - Dictatorship
Democracy (E) - Dictatorship
Democracy (G) - Dictatorship (G)
Democracy (G) - Dictatorship (G)
Democracy (E) - Dictatorship
T-2
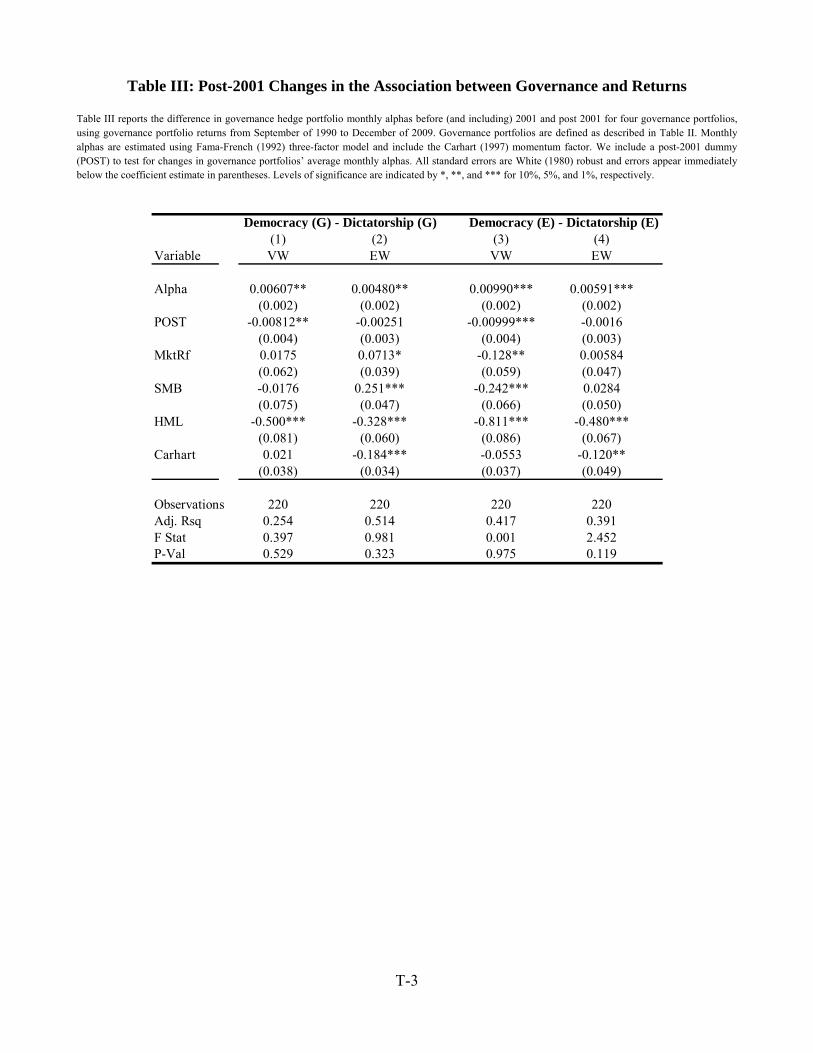
Table III reports the difference in governance hedge portfolio monthly alphas before (and including) 2001 and post 2001 for four governance portfolios, using governance portfolio returns from September of 1990 to December of 2009. Governance portfolios are defined as described in Table II. Monthly alphas are estimated using Fama-French (1992) three-factor model and include the Carhart (1997) momentum factor. We include a post-2001 dummy (POST) to test for changes in governance portfolios’ average monthly alphas. All standard errors are White (1980) robust and errors appear immediately below the coefficient estimate in parentheses. Levels of significance are indicated by *, **, and *** for 10%, 5%, and 1%, respectively.
Table III: Post-2001 Changes in the Association between Governance and Returns
(1) (2) (3) (4)Variable VW EW VW EW
Alpha 0.00607** 0.00480** 0.00990*** 0.00591***(0.002) (0.002) (0.002) (0.002)
POST -0.00812** -0.00251 -0.00999*** -0.0016(0.004) (0.003) (0.004) (0.003)
MktRf 0.0175 0.0713* -0.128** 0.00584(0.062) (0.039) (0.059) (0.047)
SMB -0.0176 0.251*** -0.242*** 0.0284(0.050)
HML 480***(0.067)
Carhar 120**(0.049)
Observ 220Adj. R 0.391F Stat 2.452P-Val 0.119
Democrac
(0.075) (0.047) (0.066)-0.500*** -0.328*** -0.811*** -0.
(0.081) (0.060) (0.086)t 0.021 -0.184*** -0.0553 -0.
(0.038) (0.034) (0.037)
ations 220 220 220sq 0.254 0.514 0.417
0.397 0.981 0.0010.529 0.323 0.975
y (G) - Dictatorship (G) Democracy (E) - Dictatorship (E)
T-3
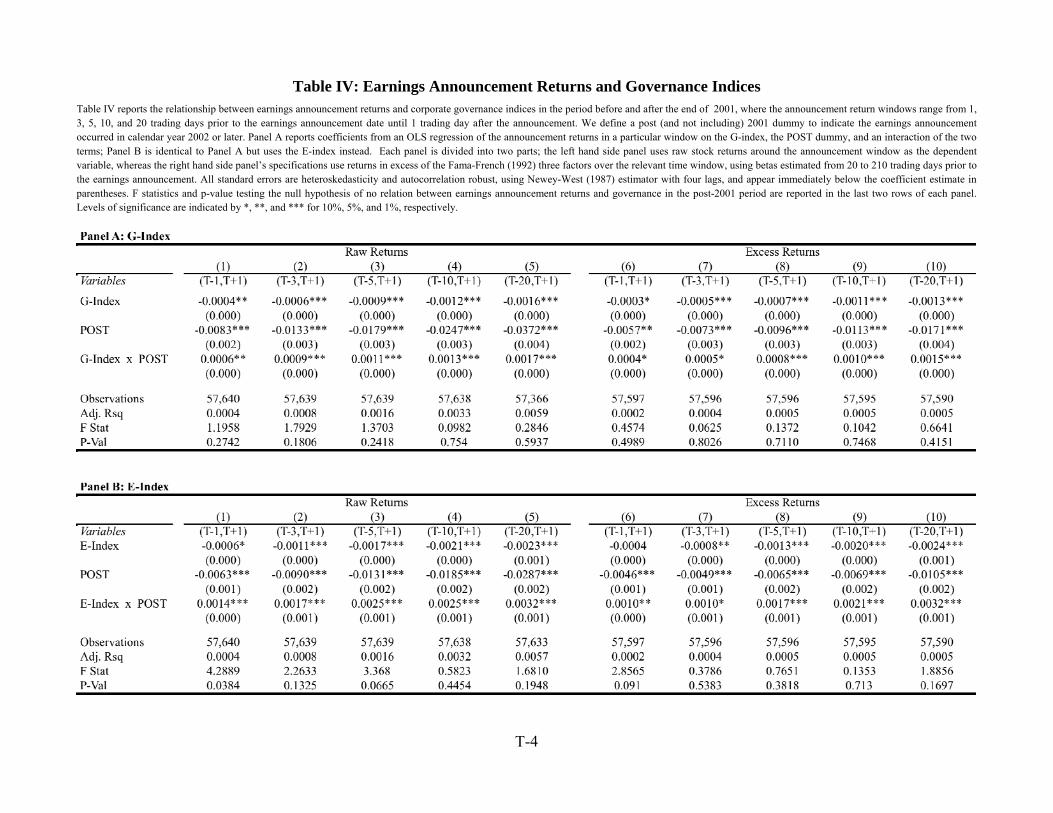
Table IV: Earnings Announcement Returns and Governance Indices
Table IV reports the relationship between earnings announcement returns and corporate governance indices in the period before and after the end of 2001, where the announcement return windows range from 1, 3, 5, 10, and 20 trading days prior to the earnings announcement date until 1 trading day after the announcement. We define a post (and not including) 2001 dummy to indicate the earnings announcement occurred in calendar year 2002 or later. Panel A reports coefficients from an OLS regression of the announcement returns in a particular window on the G-index, the POST dummy, and an interaction of the two terms; Panel B is identical to Panel A but uses the E-index instead. Each panel is divided into two parts; the left hand side panel uses raw stock returns around the announcement window as the dependent variable, whereas the right hand side panel’s specifications use returns in excess of the Fama-French (1992) three factors over the relevant time window, using betas estimated from 20 to 210 trading days prior to the earnings announcement. All standard errors are heteroskedasticity and autocorrelation robust, using Newey-West (1987) estimator with four lags, and appear immediately below the coefficient estimate in parentheses. F statistics and p-value testing the null hypothesis of no relation between earnings announcement returns and governance in the post-2001 period are reported in the last two rows of each panel. Levels of significance are indicated by *, **, and *** for 10%, 5%, and 1%, respectively.
T-4
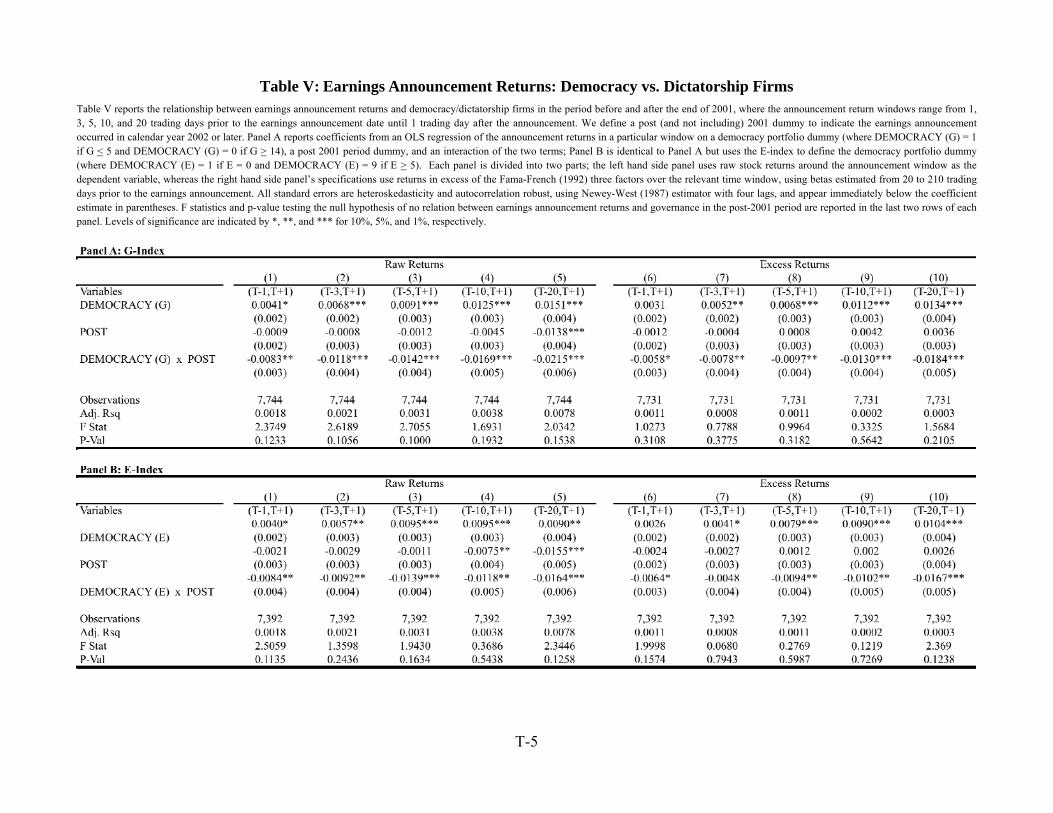
Table V: Earnings Announcement Returns: Democracy vs. Dictatorship Firms
Table V reports the relationship between earnings announcement returns and democracy/dictatorship firms in the period before and after the end of 2001, where the announcement return windows range from 1, 3, 5, 10, and 20 trading days prior to the earnings announcement date until 1 trading day after the announcement. We define a post (and not including) 2001 dummy to indicate the earnings announcement occurred in calendar year 2002 or later. Panel A reports coefficients from an OLS regression of the announcement returns in a particular window on a democracy portfolio dummy (where DEMOCRACY (G) = 1 if G < 5 and DEMOCRACY (G) = 0 if G > 14), a post 2001 period dummy, and an interaction of the two terms; Panel B is identical to Panel A but uses the E-index to define the democracy portfolio dummy (where DEMOCRACY (E) = 1 if E = 0 and DEMOCRACY (E) = 9 if E > 5). Each panel is divided into two parts; the left hand side panel uses raw stock returns around the announcement window as the dependent variable, whereas the right hand side panel’s specifications use returns in excess of the Fama-French (1992) three factors over the relevant time window, using betas estimated from 20 to 210 trading days prior to the earnings announcement. All standard errors are heteroskedasticity and autocorrelation robust, using Newey-West (1987) estimator with four lags, and appear immediately below the coefficient estimate in parentheses. F statistics and p-value testing the null hypothesis of no relation between earnings announcement returns and governance in the post-2001 period are reported in the last two rows of each panel. Levels of significance are indicated by *, **, and *** for 10%, 5%, and 1%, respectively.
T-5
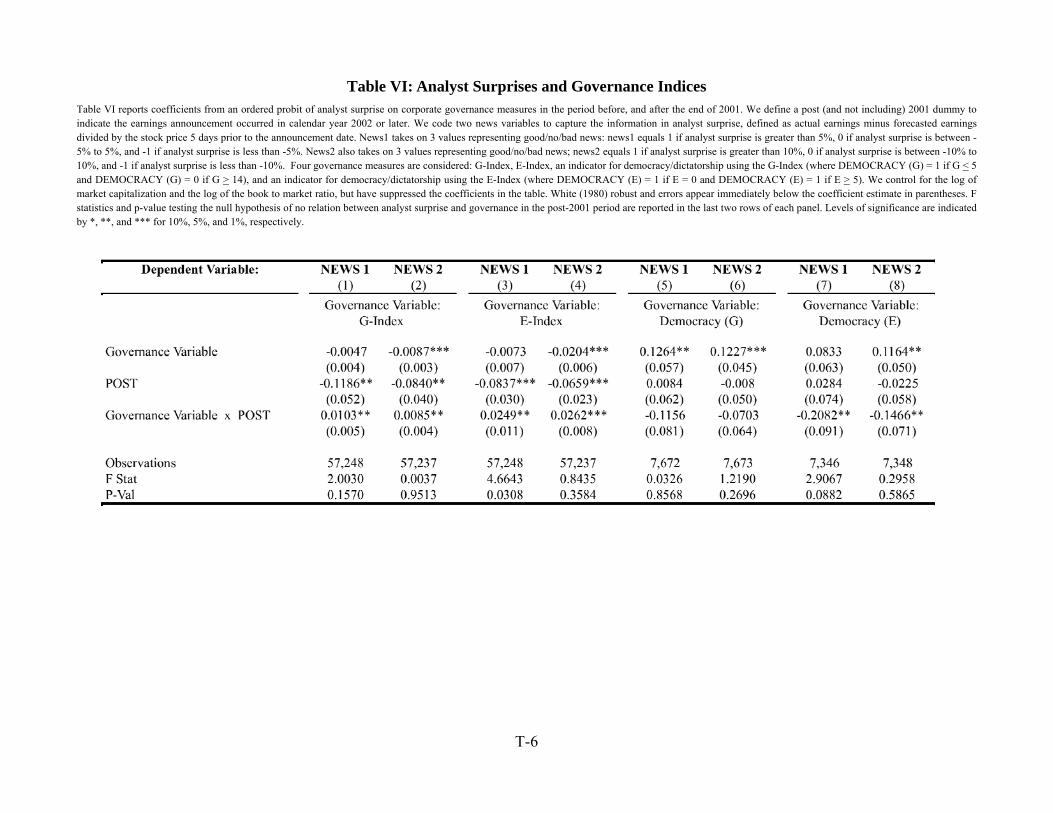
Table VI: Analyst Surprises and Governance Indices Table VI reports coefficients from an ordered probit of analyst surprise on corporate governance measures in the period before, and after the end of 2001. We define a post (and not including) 2001 dummy to indicate the earnings announcement occurred in calendar year 2002 or later. We code two news variables to capture the information in analyst surprise, defined as actual earnings minus forecasted earnings divided by the stock price 5 days prior to the announcement date. News1 takes on 3 values representing good/no/bad news: news1 equals 1 if analyst surprise is greater than 5%, 0 if analyst surprise is between -5% to 5%, and -1 if analyst surprise is less than -5%. News2 also takes on 3 values representing good/no/bad news; news2 equals 1 if analyst surprise is greater than 10%, 0 if analyst surprise is between -10% to 10%, and -1 if analyst surprise is less than -10%. Four governance measures are considered: G-Index, E-Index, an indicator for democracy/dictatorship using the G-Index (where DEMOCRACY (G) = 1 if G < 5 and DEMOCRACY (G) = 0 if G > 14), and an indicator for democracy/dictatorship using the E-Index (where DEMOCRACY (E) = 1 if E = 0 and DEMOCRACY (E) = 1 if E > 5). We control for the log of market capitalization and the log of the book to market ratio, but have suppressed the coefficients in the table. White (1980) robust and errors appear immediately below the coefficient estimate in parentheses. F statistics and p-value testing the null hypothesis of no relation between analyst surprise and governance in the post-2001 period are reported in the last two rows of each panel. Levels of significance are indicated by *, **, and *** for 10%, 5%, and 1%, respectively.
T-6
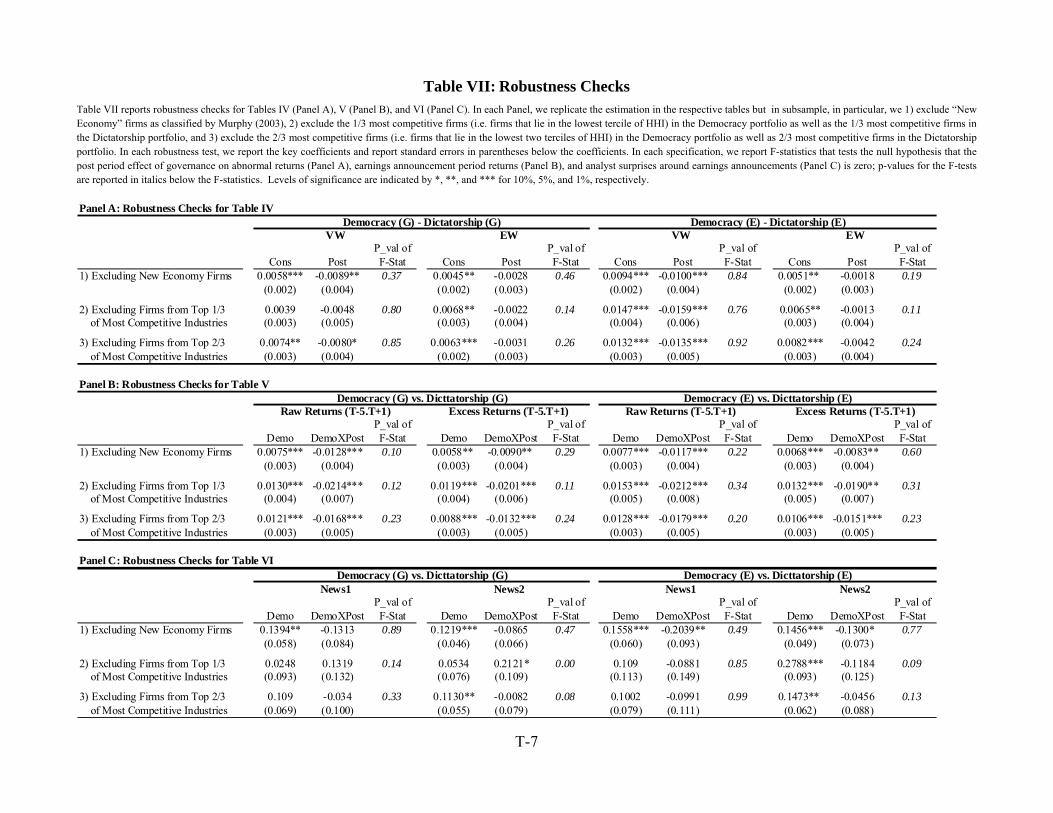
T-7
Table VII: Robustness Checks
Table VII reports robustness checks for Tables IV (Panel A), V (Panel B), and VI (Panel C). In each Panel, we replicate the estimation in the respective tables but in subsample, in particular, we 1) exclude “New Economy” firms as classified by Murphy (2003), 2) exclude the 1/3 most competitive firms (i.e. firms that lie in the lowest tercile of HHI) in the Democracy portfolio as well as the 1/3 most competitive firms in the Dictatorship portfolio, and 3) exclude the 2/3 most competitive firms (i.e. firms that lie in the lowest two terciles of HHI) in the Democracy portfolio as well as 2/3 most competitive firms in the Dictatorship portfolio. In each robustness test, we report the key coefficients and report standard errors in parentheses below the coefficients. In each specification, we report F-statistics that tests the null hypothesis that the post period effect of governance on abnormal returns (Panel A), earnings announcement period returns (Panel B), and analyst surprises around earnings announcements (Panel C) is zero; p-values for the F-tests are reported in italics below the F-statistics. Levels of significance are indicated by *, **, and *** for 10%, 5%, and 1%, respectively.
Panel A: Robustness Checks for Table IV
Cons PostP_val of F-Stat Cons Post
P_val of F-Stat Cons Post
P_val of F-Stat Cons Post
P_val of F-Stat
1) Excluding New Economy Firms 0.0058*** -0.0089** 0.37 0.0045** -0.0028 0.46 0.0094*** -0.0100*** 0.84 0.0051** -0.0018 0.19(0.002) (0.004) (0.002) (0.003) (0.002) (0.004) (0.002) (0.003)
2) Excluding Firms from Top 1/3 0.0039 -0.0048 0.80 0.0068** -0.0022 0.14 0.0147*** -0.0159*** 0.76 0.0065** -0.0013 0.11 of Most Competitive Industries (0.003) (0.005) (0.003) (0.004) (0.004) (0.006) (0.003) (0.004)
3) Excluding Firms from Top 2/3 0.0074** -0.0080* 0.85 0.0063*** -0.0031 0.26 0.0132*** -0.0135*** 0.92 0.0082*** -0.0042 0.24 of Most Competitive Industries (0.003) (0.004) (0.002) (0.003) (0.003) (0.005) (0.003) (0.004)
Panel B: Robustness Checks for Table V
Demo DemoXPostP_val of F-Stat Demo DemoXPost
P_val of F-Stat Demo DemoXPost
P_val of F-Stat Demo DemoXPost
P_val of F-Stat
1) Excluding New Economy Firms 0.0075*** -0.0128*** 0.10 0.0058** -0.0090** 0.29 0.0077*** -0.0117*** 0.22 0.0068*** -0.0083** 0.60(0.003) (0.004) (0.003) (0.004) (0.003) (0.004) (0.003) (0.004)
2) Excluding Firms from Top 1/3 0.0130*** -0.0214*** 0.12 0.0119*** -0.0201*** 0.11 0.0153*** -0.0212*** 0.34 0.0132*** -0.0190** 0.31 of Most Competitive Industries (0.004) (0.007) (0.004) (0.006) (0.005) (0.008) (0.005) (0.007)
3) Excluding Firms from Top 2/3 0.0121*** -0.0168*** 0.23 0.0088*** -0.0132*** 0.24 0.0128*** -0.0179*** 0.20 0.0106*** -0.0151*** 0.23 of Most Competitive Industries (0.003) (0.005) (0.003) (0.005) (0.003) (0.005) (0.003) (0.005)
Panel C: Robustness Checks for Table VI
Demo DemoXPostP_val of F-Stat Demo DemoXPost
P_val of F-Stat Demo DemoXPost
P_val of F-Stat Demo DemoXPost
P_val of F-Stat
1) Excluding New Economy Firms 0.1394** -0.1313 0.89 0.1219*** -0.0865 0.47 0.1558*** -0.2039** 0.49 0.1456*** -0.1300* 0.77(0.058) (0.084) (0.046) (0.066) (0.060) (0.093) (0.049) (0.073)
2) Excluding Firms from Top 1/3 0.0248 0.1319 0.14 0.0534 0.2121* 0.00 0.109 -0.0881 0.85 0.2788*** -0.1184 0.09 of Most Competitive Industries (0.093) (0.132) (0.076) (0.109) (0.113) (0.149) (0.093) (0.125)
3) Excluding Firms from Top 2/3 0.109 -0.034 0.33 0.1130** -0.0082 0.08 0.1002 -0.0991 0.99 0.1473** -0.0456 0.13 of Most Competitive Industries (0.069) (0.100) (0.055) (0.079) (0.079) (0.111) (0.062) (0.088)
Democracy (G) vs. Dicttatorship (G) Democracy (E) vs. Dicttatorship (E)
Democracy (G) vs. Dicttatorship (G) Democracy (E) vs. Dicttatorship (E)Excess Returns (T-5.T+1)Raw Returns (T-5.T+1)Excess Returns (T-5.T+1)Raw Returns (T-5.T+1)
News1 News2 News1 News2
EWDemocracy (E) - Dictatorship (E)Democracy (G) - Dictatorship (G)
VW EW VW
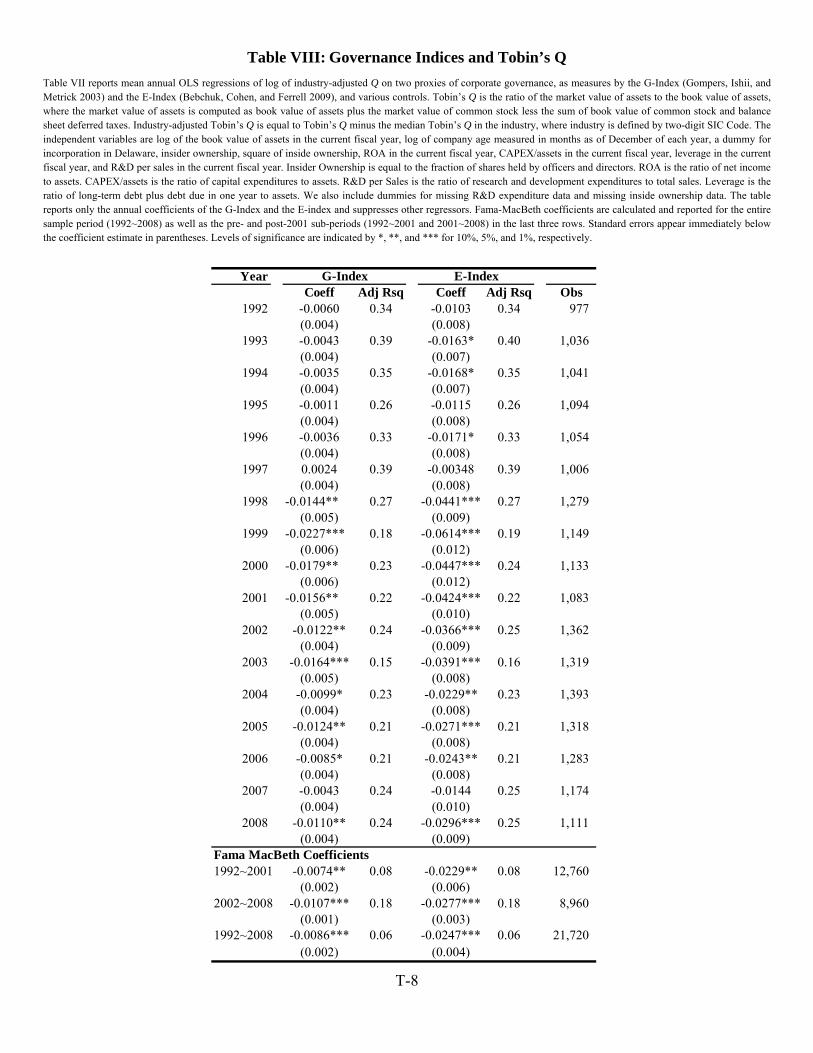
Table VIII: Governance Indices and Tobin’s Q Table VII reports mean annual OLS regressions of log of industry-adjusted Q on two proxies of corporate governance, as measures by the G-Index (Gompers, Ishii, and Metrick 2003) and the E-Index (Bebchuk, Cohen, and Ferrell 2009), and various controls. Tobin’s Q is the ratio of the market value of assets to the book value of assets, where the market value of assets is computed as book value of assets plus the market value of common stock less the sum of book value of common stock and balance sheet deferred taxes. Industry-adjusted Tobin’s Q is equal to Tobin’s Q minus the median Tobin’s Q in the industry, where industry is defined by two-digit SIC Code. The independent variables are log of the book value of assets in the current fiscal year, log of company age measured in months as of December of each year, a dummy for incorporation in Delaware, insider ownership, square of inside ownership, ROA in the current fiscal year, CAPEX/assets in the current fiscal year, leverage in the current fiscal year, and R&D per sales in the current fiscal year. Insider Ownership is equal to the fraction of shares held by officers and directors. ROA is the ratio of net income to assets. CAPEX/assets is the ratio of capital expenditures to assets. R&D per Sales is the ratio of research and development expenditures to total sales. Leverage is the ratio of long-term debt plus debt due in one year to assets. We also include dummies for missing R&D expenditure data and missing inside ownership data. The table reports only the annual coefficients of the G-Index and the E-index and suppresses other regressors. Fama-MacBeth coefficients are calculated and reported for the entire sample period (1992~2008) as well as the pre- and post-2001 sub-periods (1992~2001 and 2001~2008) in the last three rows. Standard errors appear immediately below the coefficient estimate in parentheses. Levels of significance are indicated by *, **, and *** for 10%, 5%, and 1%, respectively.
YearCoeff Adj Rsq Coeff Adj Rsq Obs
1992 -0.0060 0.34 -0.0103 0.34 977 (0.004) (0.008)
1993 -0.0043 0.39 -0.0163* 0.40 1,036 (0.004) (0.007)
1994 -0.0035 0.35 -0.0168* 0.35 1,041 (0.004) (0.007)
1995 -0.0011 0.26 -0.0115 0.26 1,094 (0.004) (0.008)
1996 -0.0036 0.33 -0.0171* 0.33 1,054 (0.004) (0.008)
1997 0.0024 0.39 -0.00348 0.39 1,006 (0.004) (0.008)
1998 -0.0144** 0.27 -0.0441*** 0.27 1,279 (0.005) (0.009)
1999 -0.0227*** 0.18 -0.0614*** 0.19 1,149 (0.006) (0.012)
2000 -0.0179** 0.23 -0.0447*** 0.24 1,133 (0.006) (0.012)
2001 -0.0156** 0.22 -0.0424*** 0.22 1,083 (0.005) (0.010)
2002 -0.0122** 0.24 -0.0366*** 0.25 1,362 (0.004) (0.009)
2003 -0.0164*** 0.15 -0.0391*** 0.16 1,319 (0.005) (0.008)
2004 -0.0099* 0.23 -0.0229** 0.23 1,393 (0.004) (0.008)
2005 -0.0124** 0.21 -0.0271*** 0.21 1,318 (0.004) (0.008)
2006 -0.0085* 0.21 -0.0243** 0.21 1,283 (0.004) (0.008)
2007 -0.0043 0.24 -0.0144 0.25 1,174 (0.004) (0.010)
2008 -0.0110** 0.24 -0.0296*** 0.25 1,111 (0.004) (0.009)
Fama MacBeth Coefficients1992~2001 -0.0074** 0.08 -0.0229** 0.08 12,760
(0.002) (0.006)2002~2008 -0.0107*** 0.18 -0.0277*** 0.18 8,960
(0.001) (0.003)1992~2008 -0.0086*** 0.06 -0.0247*** 0.06 21,720
(0.002) (0.004)
G-Index E-Index
T-8