Embed Size (px)
Citation preview

Is College Worth It? For Whom? How Do We Know?
Clive R. Belfield
May 6, 2016 | CUNY Seminar Series | New York, NY

Bachelor’s Degrees Are Worth It Study PV Earnings over HS Graduate
(*Net of college costs) Source
Agan (2013)* $243,700 NLSY79
Tamborini et al. (2015) $266,100 SIPP, IRS
Kim et al. (2015) $321,100 SIPP, IRS
Mitchell (2014) $354,300 SIPP 2008
Barrow & Malamud (2015)* $434,900 CPS 2013
Avery and Turner (2010)* $462,000 CPS2009
Webber (2014)* $492,400 NLSY79, ACS
Herschbein & Kearney (2014) $610,000 ACS 2009-12
Barrow & Rouse (2005)* $629,400 CPS 2004
Average (N=9) $423,800

CAPSEE Agenda ① What are the employment/earnings benefits of
educational pathways and awards? • For sub-BA awards, certificates, non-completers, by
field of study, at for-profits, after remediation
② What institutional programs and public policies improve completion rates and employment/earnings? • Aid, Work Study, SAP incentives, One-Stop Centers

CAPSEE Data
• Transcripts across state-wide community college and four-year college systems for FTIC cohorts in 2000s
• Transfer data from National Student Clearinghouse • Earnings data from UI systems pre- and post-college • Many states: AR, CA, MI, NC, OH, VA, WA, NY

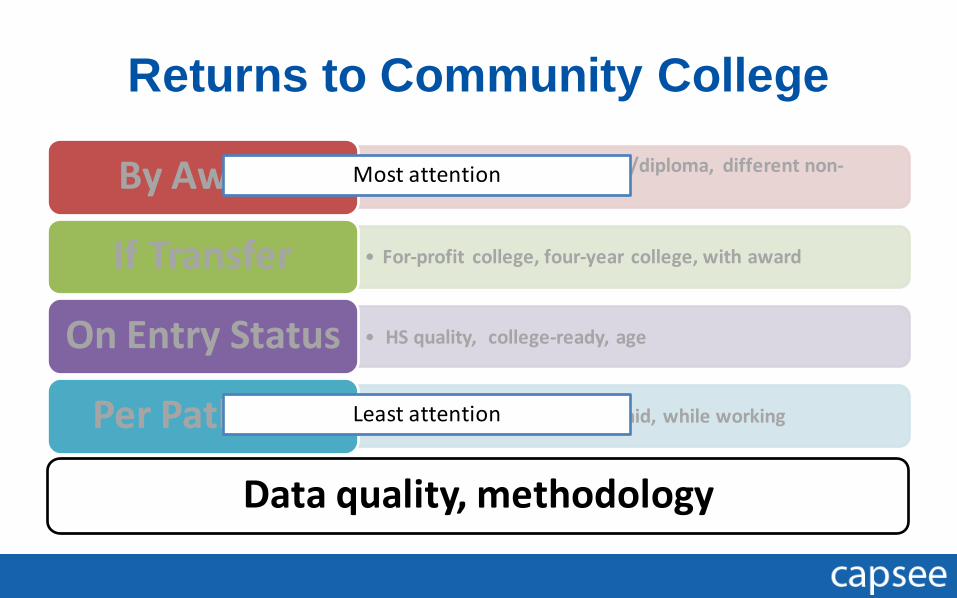
Returns to Community College
By Award
If Transfer
On Entry Status
Per Pathway

Returns to Community College
• Associate degree, certificate/diploma, different non-award By Award
• For-profit college, four-year college, with award If Transfer
• HS quality, college-ready, age On Entry Status
• College, subject, sequence, aid, while working Per Pathway
Returns to Community College • Associate degree, certificate/diploma, different non-
award By Award
• For-profit college, four-year college, with award If Transfer
• HS quality, college-ready, age On Entry Status
• College, subject, sequence, aid, while working Per Pathway
Data quality, methodology
Most attention
Least attention

Data
• Missing data: • Migration out of state; uncovered by UI; reverse
transfers
• Window for follow-up: • Too short if earnings trajectories are flat
• Need individual-level data


Split by Gender: Female Students Different characteristics:
• More prepared (HSGPA +0.15) • Older and richer (Age > 24 +8%p; EFC +$1950)
Choose differently: • More intent on AA (+11%p) • Study health/nursing (+++)
Do better: • CGPA in first semester (+0.24) • More credits (+6) and more awards (+5%p)

$2,000
$4,000
$6,000
$8,000
College entry 18 Quarters later
Quarterly Earnings by Gender Degree Completers (AR, KY, MI, OH)
Male
Female
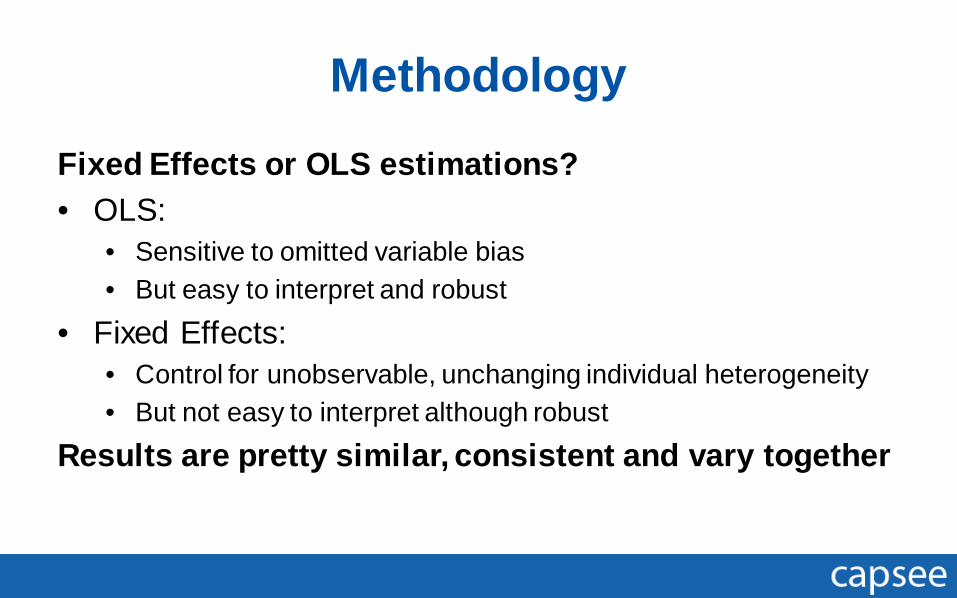
Methodology Fixed Effects or OLS estimations? • OLS:
• Sensitive to omitted variable bias • But easy to interpret and robust
• Fixed Effects: • Control for unobservable, unchanging individual heterogeneity • But not easy to interpret although robust
Results are pretty similar, consistent and vary together
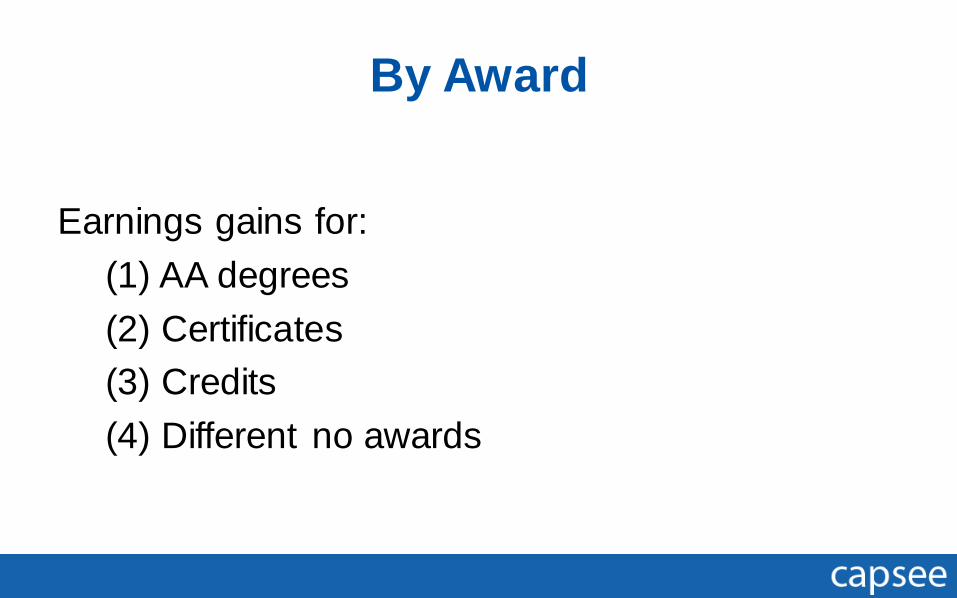
By Award
Earnings gains for:
(1) AA degrees (2) Certificates (3) Credits (4) Different no awards

$1,800
$1,040
$0 $1,000 $2,000 $3,000
KYMINC
MeanVA
WAAR
KYMINC
MeanVA
WAAR
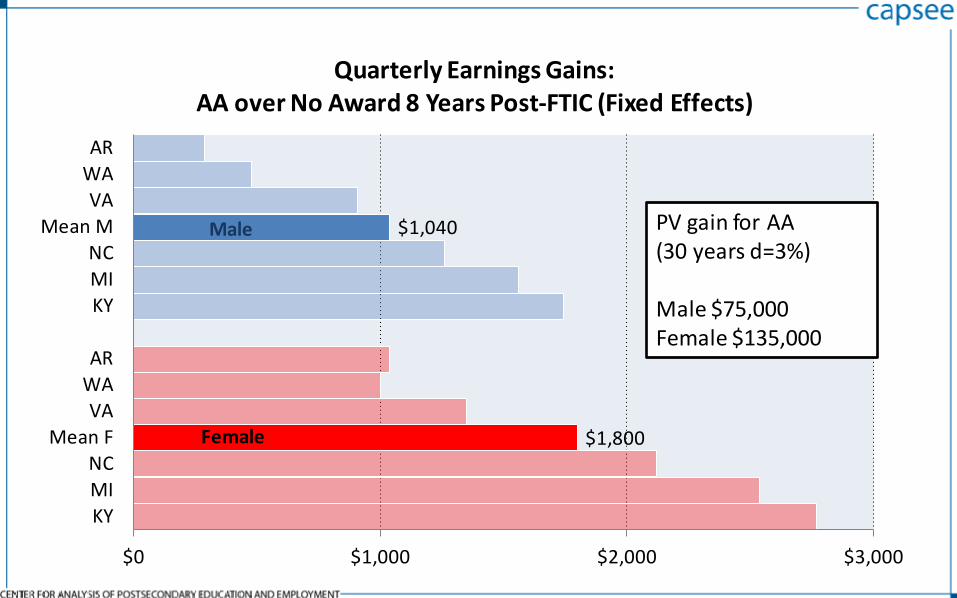
Quarterly Earnings Gains: AA over No Award 8 Years Post-FTIC (Fixed Effects)
Male
Female
$1,800
$1,040
$0 $1,000 $2,000 $3,000
KYMINC
Mean FVA
WAAR
KYMINC
Mean MVA
WAAR
Quarterly Earnings Gains: AA over No Award 8 Years Post-FTIC (Fixed Effects)
Male
Female
PV gain for AA (30 years d=3%) Male $75,000 Female $135,000
$570
$250
-$300 $600 $1,500
WAMI
MeanARKYNCAR
MINCKY
MeanWAVAAR
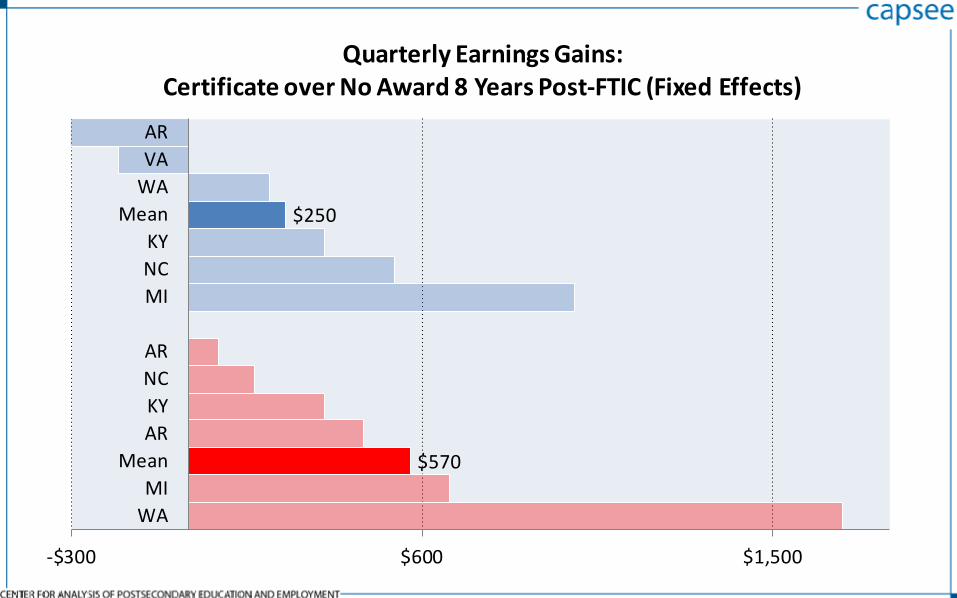
Quarterly Earnings Gains: Certificate over No Award 8 Years Post-FTIC (Fixed Effects)

$570
$250
-$300 $600 $1,500
WAMI
MeanARKYNCAR
MINCKY
MeanWAVAAR
Quarterly Earnings Gains: Certificate over No Award 8 Years Post-FTIC (Fixed Effects)
Gains are: modest, temporary, non-robust (except in health). But certificates vary substantially in credits.

-$400
$400
$1,200
$2,000
$2,800
1-10 11-20 21-30 31-40 41-50 51-60 61+
Quarterly Earnings Gain over Zero Credits (8 Years After FTIC in VA/NC)
Average
Credits Earned

Different No Awards • Returns to awards ex ante reflect: RC Returns to completion of award (ex post) P(C) Probability of completion RNC Returns to non-completion • Ex ante returns differ from ex post returns because of
differences in completion probabilities and returns to non-completion

Returns over Diploma-Holder
-40%
-20%
0%
20%
AA Cert No AA No Cert No Dipl
Female Male

By Award: New Inquiries
① What are the returns to different types of AA degrees?
② Are returns to certificates actually subject effects?
③ What are the returns to awards that interact/stack?

By Transfer
(1) To for-profit colleges
(2) Upward to four-year colleges

Transfer (1): To For-Profit Colleges
• Evidence (but weak) of earnings penalty from attending FP
• No clear gains in earnings from even attending FP after community college
• Big tuition / loan balance penalty to FP • Resume studies: “the bachelor's degrees granted by
[FPs] are associated with the worst callback outcomes for jobs requiring a bachelor's degree”


Transfer (2): Upward Students who transfer to a four-year public college have: • Higher earnings than students who do not transfer (Reynolds, 2012) • Lower earnings than those who started at a four-year college
(Andrews et al., 2013)
Earnings gains are sensitive to pathways: • Which type of college a student transfers to • Whether student completes an award before transfer

By Transfer: Unknowns
① What are the adverse features of for-profit colleges?
② What are the returns to reverse transfer? ③ What is the value of transfer with AA degree
versus without?

By Entry Status
Returns by:
(1) High school quality (2) Preparedness (3) Age

-$4,000
-$2,000
$0
$2,000
$4,000
1 147
Quarterly Earnings Gaps of AR CC Students from 147 High Schools
Male
Female
Entry Status: HS Quality
Average

-$4,000
-$2,000
$0
$2,000
$4,000
1 147
Quarterly Earnings Gaps of AR CC Students from 147 High Schools
Male
Female
Earnings gaps are not statistically significantly different for schools within box
Average

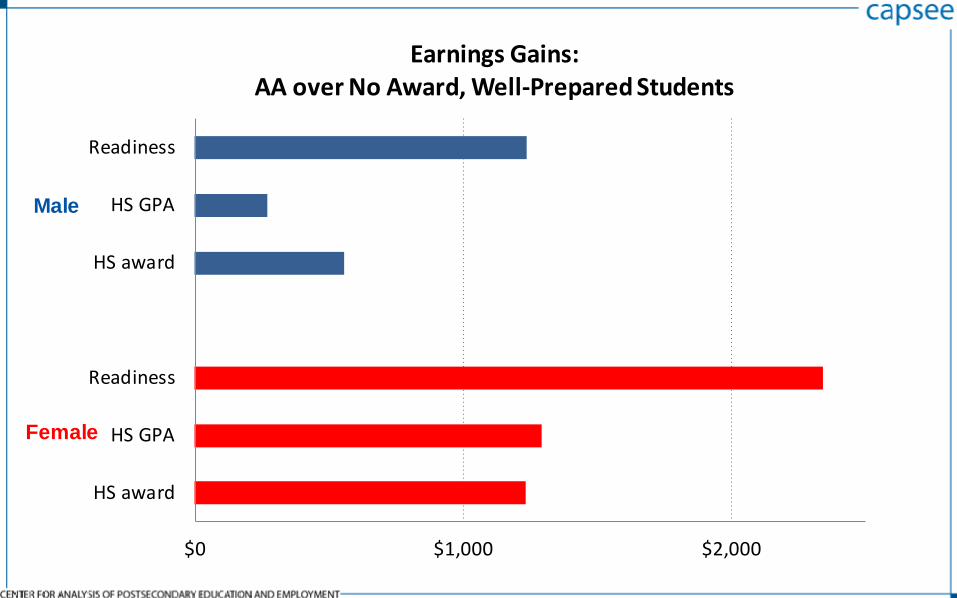
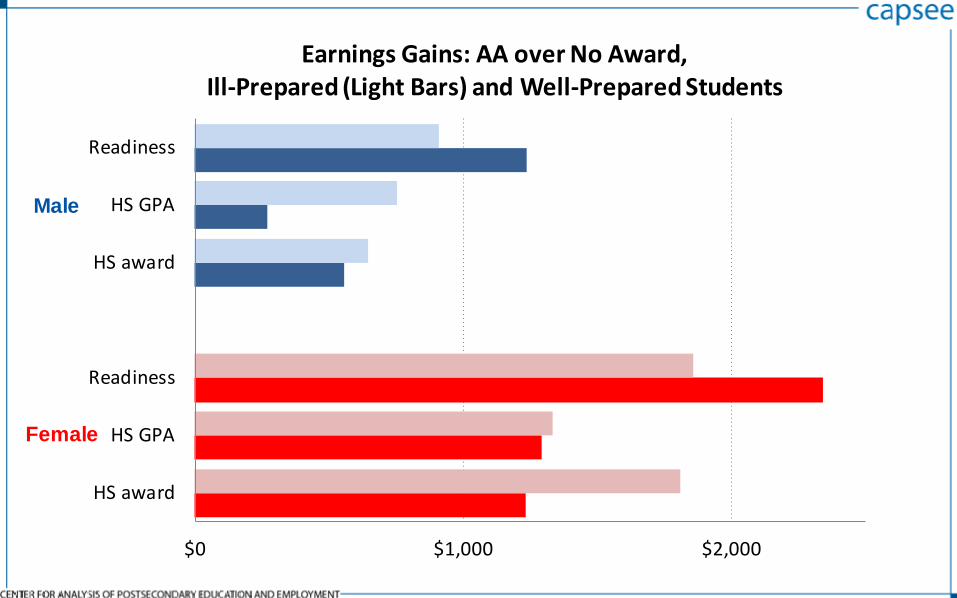
Entry Status: Preparedness
• More prepared students earn more
• Controls for preparedness do not much influence returns to college
• Estimation split by preparedness shows similar returns
$0 $1,000 $2,000
HS award
HS GPA
Readiness
HS award
HS GPA
Readiness
Earnings Gains: AA over No Award, Well-Prepared Students
Male
Female
$0 $1,000 $2,000
HS award
HS GPA
Readiness
HS award
HS GPA
Readiness
Earnings Gains: AA over No Award, Ill-Prepared (Light Bars) and Well-Prepared Students
Male
Female

Entry Status: Age
$-
$3,000
$6,000
$9,000
$12,000
Entry 12 Qtrs 24 Qtrs 36 Qtrs
Earnings Growth: AA Completers by Age on Entry
Ages 18-20 Ages 21+

Entry Status: Questions
① Is this a puzzle? • More prepared students have higher earnings • All students gain about the same in earnings
② If entry status does not influence returns per year of attainment, what selection decisions are students making?

Per Pathway
Pathways: (1) Subject / field (2) College choice (3) Aid allocation (4) Working while enrolled (5) Course sequences

Per Pathway: Subject/Field
• Heterogeneous returns per: • Subject / field (vocational/CTE) • Subject-award combination
• Health awards: • Returns are big, persistent, and robust to
modeling / sub-sampling • Approx. double returns to other AAs

Per Pathway: Choosing a College
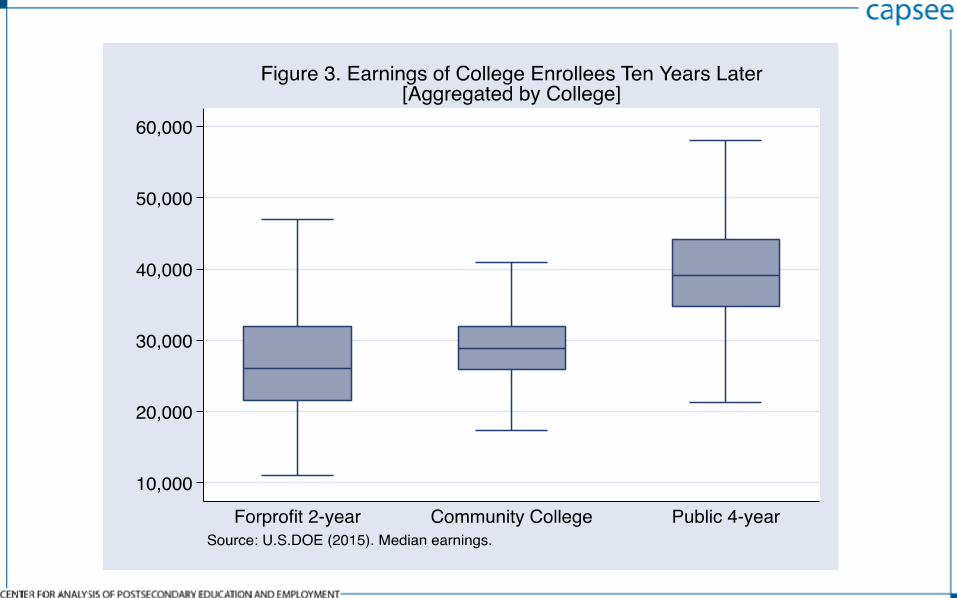
• College attended does not seem to matter much
• US DOE data: • Community college completion rate • College-level average earnings 10 years later • Correlation between these variables: approximately
zero

Per Pathway: Aid Aid effects are extremely complicated: • Type of aid • Take-up of aid • Incentives • Targeting accuracy • Changes in aid systems

Per Pathway: Working While Enrolled
• FE models estimate that penalty to being in college is $200-$300 per quarter
• Very low earnings penalty for studying
• Preliminary evidence shows that work-study is an effective form of student aid because it offers better jobs
Per Pathway: Course Sequences
• Hard to find any evidence for specific routes through college
• Progression does not seem to enhance earnings • Math courses might but many students take very
little math

Per Pathway: Questions
① Why do health programs not expand? • College-level barriers to enrollment in high-return fields? • Restrictive practices in labor market? • Selectivity into low returns areas?
② Which college characteristics matter: Class
size? Faculty quality?

Returns to Community College • Associate degree, certificate/diploma, different
non-award By Award
• For-profit, four-year college, with award If Transfer
• HS quality, college-ready, age On Entry Status
• College, subject, sequence, aid, while working Per Pathway
What is the market failure?

Evaluating Transcript Research
Why isn’t it more useful? ① Time/resources for analysis ② Obvious or outdated or useless conclusions ③ Barriers to change
What can we do about it?

Visit us on the web at capseecenter.org
We’re also on Facebook and Twitter.
CAPSEE is funded through a grant (R305C110011) from the Institute of Education Sciences, U.S. Department of Education.
Center for Analysis of Postsecondary Education and Employment Teachers College, Columbia University
525 West 120th Street, Box 174, New York, NY 10027 [email protected]
212.678.3091