Embed Size (px)
Citation preview
Clat, s and Clay Minerals, Vol. 43, No. 5, 599-606, 1995.
IRON SUBSTITUTION IN SOIL A N D SYNTHETIC ANATASE
U. SCHWERTMANN, J. FRIEDL, G. PFAB, AND A. U. GFA-IRING
Lehrstuhl t'fir Bodenkunde, Technische Universi~t Miinchen, D-80350 Freising-Weihenstephan
Abstract--Iron nI for Ti TM substitution in the structure of pedogenic and synthetic anatase of up to Fe/ (Ti+Fe) 0.1 mol/mol was indicated by an increase in unit cell size as measured by XRD line shifts. MiSss- bauer- and electron paramagnetic resonance spectra at both, 298 K and 4.2 K supported this by the presence of signals typical for octahedrally coordinated Fe I11 in a diamagnetic matrix. Charge compensation was achieved by structural OH, as indicated by FTIR bands at 3360 and 960 cm -~, which were absent in pure anatase and which disappeared on heating. The weight loss on heating amounted to ca. 0.5 mol H20/mol Fe. At 600~ structural Fe was ejected, the unit cell size decreased to that of pure anatase, and pseudobrookite, Fe2TiOs, was formed.
Key Words--Anatase, Crystal chemistry, EPR, Fe substitution, FFIR, M6ssbauer, OH--O-substitution, Pseudobrookite, TA, TEM, XRD.
I N T R O D U C T I O N
Mean Ti concentrations in various soils range be- tween 1.5 and 29.3 g/kg (Milnes and Fitzpatrick 1989). Ti tanium is found in fairly stable residual minerals such as ilmenite, titano-magnetite and rutile, but also in pedogenic minerals of which anatase has been most frequently identified. Pseudorutile and titano-mag- hemite are two others. Anatase is considered a weath- ering product of Ti-bearing, Fe-rich silicates (biotites, pyroboles) and sphene (Milnes and Fitzpatrick 1989). It can be assumed, therefore, that anatase in the weath- ering environment forms in the presence of an ample supply of Fe. If not sufficient to create Fe-Ti-phases, like pseudorutile, the question arises if Fe III may enter the tetragonal structure of anatase in measurable amounts. To the best of our knowledge, the literature holds no proof of Fe-for-Ti substitution in natural an- atase except that Fe has been noted as a trace constit- uent (Deer et al 1962).
Fitzpatrick et al (1978) synthesized Ti-Fe-mixed phases from coprecipitates at 70~ and obtained an- atase as the sole phase between Ti / (Ti+Fe) ratios of 0.7 and 1.0. The Fe was no longer oxalate extractable, and the XRD peaks became broader as Fe content increased. On these grounds, structural incorporation of Fe was suggested. A slight shift of the 101 X-ray peak toward higher d-values was indeed visible, but was not noticed by the authors. A similar line shift was recently observed with anatases from deep saprolites of lateritic profiles on basalt of the Jos Plateau, central Nigeria (Zeese et al 1994).
Based on these observations, the properties of both natural and synthetic anatases were studied using chemical and thermal analysis, X-ray diffraction, and MiSssbaner-, electron spin resonance- and FTIR-spec- troscopy to obtain more conclusive evidence regarding Fe-for-Ti-substitution in this mineral.
Copyright �9 1995, The Clay Minerals Society
MATERIALS AND METHODS
Four saprolite samples (II 1; II 2; II 5; IV 6a) formed from basalts in central Nigeria (Zeese et al 1994) and one (Inl5) from a biotite gneiss from south India (Schwertmann 1984) were examined. Pedogenic ana- tase concentrates were prepared from the kaolinitic- goethitic-hematitic saprolites by first removing the Fe oxides with DCB (Mehra and Jackson 1960). Kaolinite was subsequently dissolved using first hot 5 M NaOH and then cold 0.5 M HCl to remove sodalite and pos- sible Fe oxides formed from kaolinite-Fe during NaOH treatment. For comparison, five euhedral, dipyrami- dal, non-pedogenic anatase crystals 1-3 m m in length from various museum collections were analyzed with- out any pretreatment.
A series of synthetic anatases (series 71) was pro- duced by precipitating mixed FeC13-TiC14 solutions with NH3 at pH 5.5 (Fitzpatrick et al 1978) and then treating the precipitates hydrothermally in a 200-ml teflon ves- sel with 100 ml of water at 180~ for 40 hours in an attempt to improve crystallinity. After treatment, the samples were washed with water and freeze-dried. The Fe/(Ti+ Fe) ratios of the original solutions were 0; 0.025; 0.05; 0.075; 0.10; 0.125 and 0.2 tool/tool, and the samples were designated as 71/0 to 71/20, accordingly. An additional sample for Mrssbauer spectroscopy was prepared with isotopically enriched 57Fe and a Fe/ (Ti+Fe) of 0.002 mol/mol. This sample was produced to test i f trace amounts of Fe in a TiO2 matrix are homogenously distributed or clusters of Fe oxides. To remove any coprecipitated We III oxide in the synthetic samples, 400 mg of each sample were treated twice with 20 ml of 6 M HC1 on a sand bath at ca. 100~ for 1 hour, washed twice with 50 ml of 6 M HC1 and freeze-dried.
Total Fe and Ti were determined after dissolving ca. 30 mg of both natural and synthetic samples with 2.5
599
600 Schwertmann et al Clays and Clay Minerals
0.05
301 216 2'20116 204 2]3 211 105 200 224
0.00
/
l I. I ./..//:/:1
1/./.I/I
y = 0 . 3 8 0 , x 0.764
(~ r ~ = 0 .991 i i ~ I J I , i
0.00 0. 5 0.10 0.15 0.20
Fe/(Fe+Ti) added / molomol 1
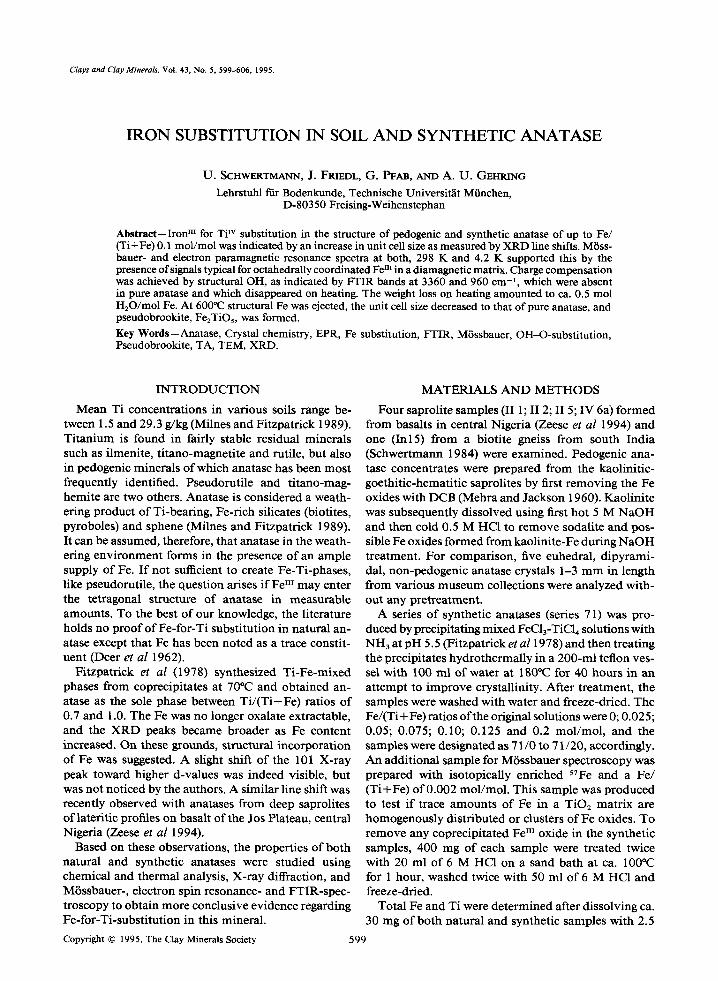
Figure 1. Relationship between the Fe/(Ti+ Fe) ratio in syn- thetic anatases after HC1 treatment and the Fe/(Ti+ Fe) added.
5 " e a t e d
0.10 I
112 004 103 lOl
~ b o v e }r ~cent ra t ion
' he t i c ~na tase
"7,
O
e~
+
lO0 90 aO 70 2 - 0 60 50 40 30 20
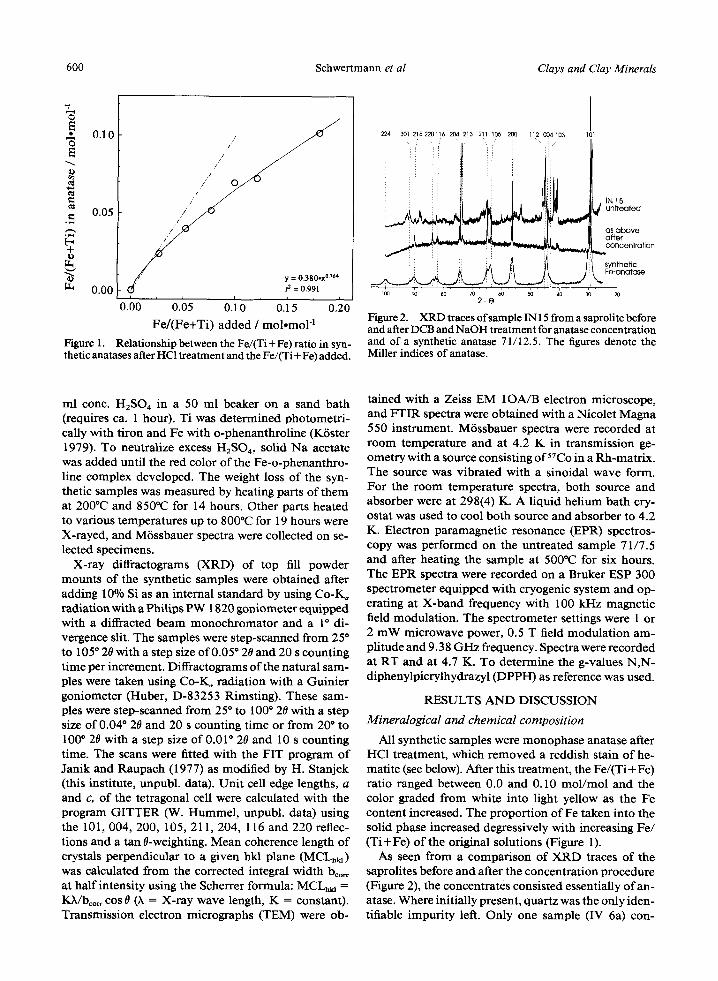
Figure 2. XRD traces of sample IN 15 from a saprolite before and after DCB and NaOH treatment for anatase concentration and of a synthetic anatase 71/12.5. The figures denote the Miller indices of anatase.
ml cone. H2SO4 in a 50 ml beaker on a sand bath (requires ca. 1 hour). Ti was determined photometri- cally with tiron and Fe with o-phenanthroline (K6ster 1979). To neutralize excess H2504, solid Na acetate was added until the red color of the Fe-o-phenanthro- line complex developed. The weight loss of the syn- thetic samples was measured by heating parts of them at 200~ and 850~ for 14 hours. Other parts heated to various temperatures up to 800"C for 19 hours were X-rayed, and M6ssbauer spectra were collected on se- lected specimens.
X-ray diffractograms (XRD) of top fill powder mounts of the synthetic samples were obtained after adding 10% Si as an internal standard by using Co-K~ radiation with a Philips PW 1820 goniometer equipped with a diffracted beam monochromator and a 1 ~ di- vergence slit. The samples were step-scanned from 25* to 105 ~ 20 with a step size of 0.05* 20 and 20 s counting time per increment. Diffractograms of the natural sam- ples were taken using Co-I~ radiation with a Guinier goniometer (Huber, D-83253 Rimsting). These sam- ples were step-scanned from 25 ~ to 100" 20 with a step size of 0.04* 20 and 20 s counting time or from 20 ~ to 100" 20 with a step size of 0.01 ~ 20 and 10 s counting time. The scans were fitted with the FIT program of Janik and Raupach (1977) as modified by H. Stanjek (this institute, unpubl, data). Uni t cell edge lengths, a and c, of the tetragonal cell were calculated with the program GITTER (W. Hummel, unpubl, data) using the 101,004, 200, 105, 211,204, 116 and 220 reflec- tions and a tan 0-weighting. Mean coherence length of crystals perpendicular to a given hid plane (MCLhu) was calculated from the corrected integral width boo= at half intensity using the Scherrer formula: MCL~a = KMbco~ cos 0 (X = X-ray wave length, K = constant). Transmission electron micrographs (TEM) were ob-
tained with a Zeiss EM 10A/B electron microscope, and FTIR spectra were obtained with a Nicolet Magna 550 instrument. M6ssbauer spectra were recorded at room temperature and at 4.2 K in transmission ge- ometry with a source consisting of 57Co in a Rh-matrix. The source was vibrated with a sinoidal wave form. For the room temperature spectra, both source and absorber were at 298(4) K. A liquid helium bath cry- ostat was used to cool both source and absorber to 4.2 K. Electron paramagnetic resonance (EPR) spectros- copy was performed on the untreated sample 71/7.5 and after heating the sample at 500"C for six hours. The EPR spectra were recorded on a Bruker ESP 300 spectrometer equipped with cryogenic system and op- erating at X-band frequency with 100 kHz magnetic field modulation. The spectrometer settings were 1 or 2 mW microwave power, 0.5 T field modulat ion am- plitude and 9.38 GHz frequency. Spectra were recorded at RT and at 4.7 K. To determine the g-values N,N- diphenylpicrylhydrazyl (DPPH) as reference was used.
RESULTS AND DISCUSSION
Mineralogical and chemical composition
All synthetic samples were monophase anatase after HCI treatment, which removed a reddish stain of he- matite (see below). After this treatment, the Fe/(Ti+ Fe) ratio ranged between 0.0 and 0.10 mol/mol and the color graded from white into light yellow as the Fe content increased. The proportion of Fe taken into the solid phase increased degressively with increasing Fe/ (Ti + Fe) of the original solutions (Figure 1).
As seen from a comparison of XRD traces of the saprolites before and after the concentration procedure (Figure 2), the concentrates consisted essentially o fan- atase. Where initially present, quartz was the only iden- tifiable impurity left. Only one sample (IV 6a) con-
Vol. 43, No. 5, 1995 Fe in Anatase 601
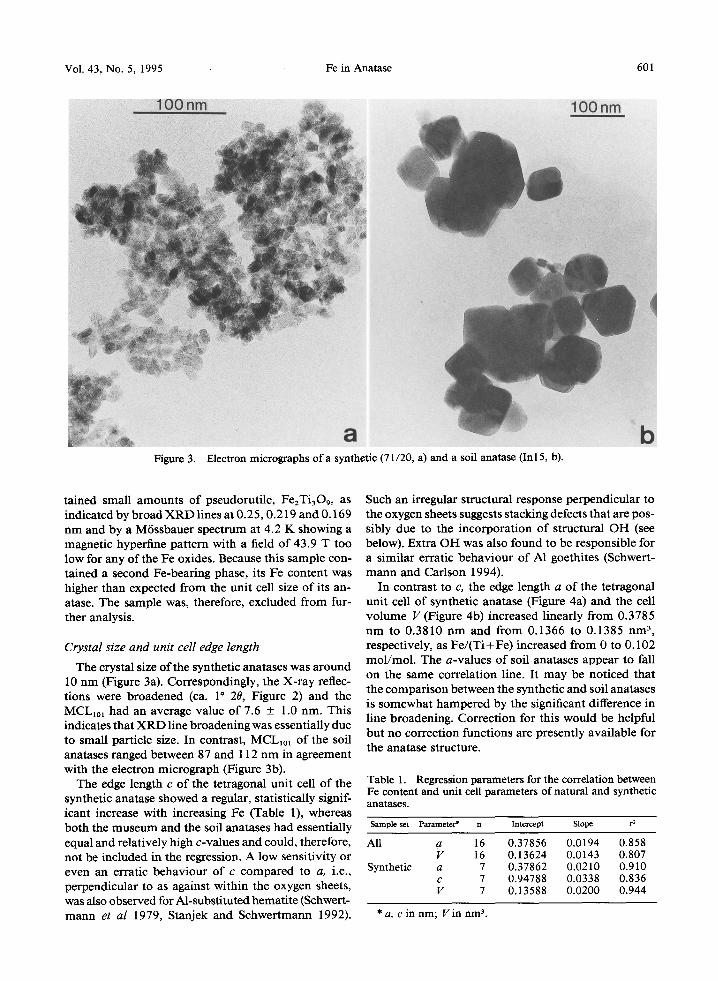
Figure 3. Electron micrographs of a synthetic (71/20, a) and a soil anatase (Inl5, b).
tained small amounts of pseudorutile, Fe2Ti309, as indicated by broad X R D lines at 0.25, 0.219 and 0.169 nm and by a M6ssbauer spectrum at 4.2 K showing a magnetic hyperfine pattern with a field of 43.9 T too low for any of the Fe oxides. Because this sample con- tained a second Fe-bearing phase, its Fe content was higher than expected from the unit cell size of its an- atase. The sample was, therefore, excluded from fur- ther analysis.
Crystal size and unit cell edge length
The crystal size of the synthetic anatases was around 10 nm (Figure 3a). Correspondingly, the X-ray reflec- tions were broadened (ca. 1 ~ 20, Figure 2) and the MCL~ol had an average value o f 7.6 ___ 1.0 nm. This indicates that X R D line broadening was essentially due to small particle size. In contrast, MCL~01 of the soil anatases ranged between 87 and 112 nm in agreement with the electron micrograph (Figure 3b).
The edge length c of the tetragonal unit cell o f the synthetic anatase showed a regular, statistically signif- icant increase with increasing Fe (Table 1), whereas both the museum and the soil anatases had essentially equal and relatively high c-values and could, therefore, not be included in the regression. A low sensitivity or even an erratic behaviour of c compared to a, i.e., perpendicular to as against within the oxygen sheets, was also observed for ?d-substituted hematite (Schwert- mann et al 1979, Stanjek and Schwertmann 1992).
Such an irregular structural response perpendicular to the oxygen sheets suggests stacking defects that are pos- sibly due to the incorporation o f structural OH (see below). Extra OH was also found to be responsible for a similar erratic behaviour of AI goethites (Schwert- mann and Carlson 1994).
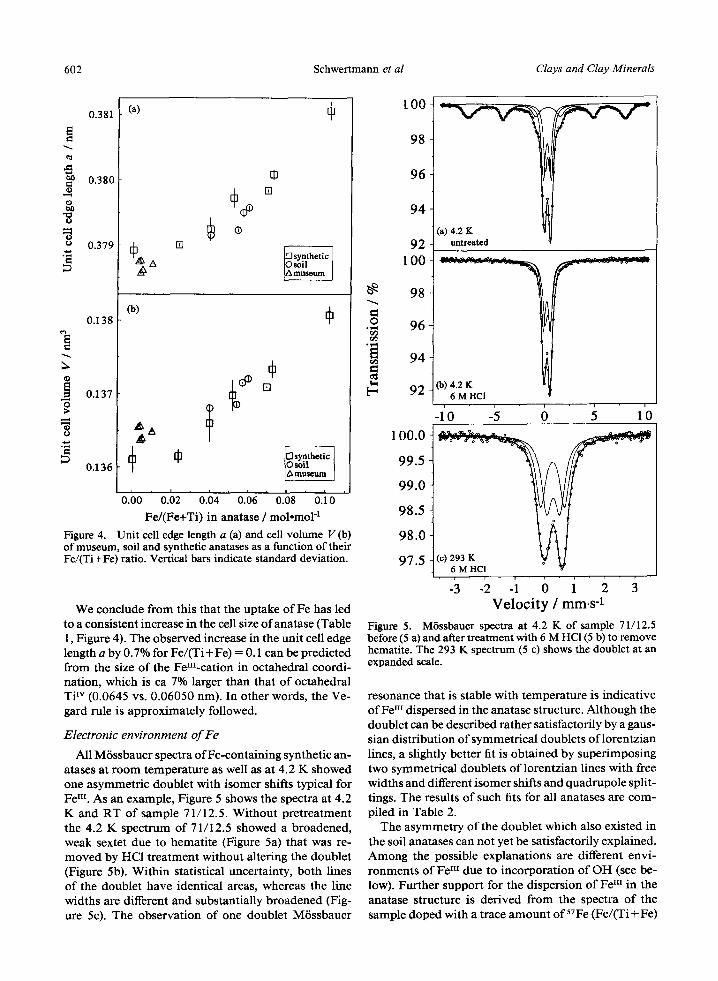
In contrast to c, the edge length a o f the tetragonal unit cell of synthetic anatase (Figure 4a) and the cell volume F (Figure 4b) increased linearly from 0.3785 nm to 0.3810 nm and from 0.1366 to 0.1385 nm 3, respectively, as Fe / (T i+Fe) increased from 0 to 0.102 mol/mol . The a-values of soil anatases appear to fall on the same correlation line. It may be noticed that the comparison between the synthetic and soil anatases is somewhat hampered by the significant difference in line broadening. Correction for this would be helpful but no correction functions are presently available for the anatase structure.
Table 1. Regression parameters for the correlation between Fe content and unit cell parameters of natural and synthetic anatases.
Sample set Parameter* n Intercept Slope r 2
All a 16 0.37856 0.0194 0.858 V 16 0.13624 0.0143 0.807
Synthetic a 7 0.37862 0.0210 0.910 c 7 0.94788 0.0338 0.836 V 7 0.13588 0.0200 0.944
* a, c in nm; V in nm 3.
602 Schwertmann et al Clays and Clay Minerals
,.m
~o
~0
=o
%
O
O )-
O
0.381
0.380
0.379
0.138
0.137
~a~ qb
+o []
+
r
0.136 ~
0.60 0.~)2 0.04 0.1)6 0.~38 O.iO
Fe/(Fe+Ti) in anatase / mol.mol a
Figure 4. Unit cell edge length a (a) and cell volume V (b) of museum, soil and synthetic anatases as a function of their Fe/(Ti+Fe) ratio. Vertical bars indicate standard deviation.
We conclude from this that the uptake of Fe has led to a consistent increase in the cell size ofanatase (Table 1, Figure 4). The observed increase in the unit cell edge length a by 0.7% for Fe/(Ti+ Fe) = 0.1 can be predicted from the size of the FeHI-cation in octahedral coordi- nation, which is ca 7% larger than that of octahedral Ti TM (0.0645 vs. 0.06050 nm). In other words, the Ve- gard rule is approximately followed.
Electronic environment o f Fe
All M/Sssbauer spectra of Fe-containing synthetic an- atases at room temperature as well as at 4.2 K showed one asymmetric doublet with isomer shifts typical for Fe Iu. As an example, Figure 5 shows the spectra at 4.2 K and RT of sample 71/12.5. Without pretreatment the 4.2 K spectrum of 71/12.5 showed a broadened, weak sextet due to hematite (Figure 5a) that was re- moved by HC1 treatment without altering the doublet (Figure 5b). Within statistical uncertainty, both lines of the doublet have identical areas, whereas the line widths are different and substantially broadened (Fig- ure 5c). The observation of one doublet M6ssbauer
o
.2
0~ [=,
100
98
96
94
92 100
98
96
94
92
(a) 4.2 K untreated
Co) 4.2 K 6 M HCI
-1'0 -5 0 5 1'0
100.0
99.5
99 .0
98.5
98 .0
97.5 (c) 293 K 6 M HCI
-3 -2 �9 - i V e l o c i t y / m m . s -1
Figure 5. M/Sssbauer spectra at 4.2 K of sample 71/12.5 before (5 a) and after treatment with 6 M HC1 (5 b) to remove hematite. The 293 K spectrum (5 c) shows the doublet at an expanded scale.
resonance that is stable with temperature is indicative ofFe III dispersed in the anatase structure. Although the doublet can be described rather satisfactorily by a gaus- sian distribution of symmetrical doublets of lorentzian lines, a slightly better fit is obtained by superimposing two symmetrical doublets of lorentzian lines with free widths and different isomer shifts and quadrupole split- tings. The results of such fits for all anatases are com- piled in Table 2.
The asymmetry of the doublet which also existed in the soil anatases can not yet be satisfactorily explained. Among the possible explanations are different envi- ronments of Fe uI due to incorporation of OH (see be- low). Further support for the dispersion of Fe HI in the anatase structure is derived from the spectra of the sample doped with a trace amount of5VFe (Fe/(Ti+Fe)
Vol. 43, No. 5, 1995 Fe in Anatase 603
Table 2. M/Sssbauer parameters at RT of synthetic and soil anatases with different concentrations of structural Fe. Area is the fractional intensity, W the lorentzian line width, QS the electrical quadrupole splitting and IS the isomer shift with respect to a source of 57Co in Rh. For measuring 70/8 BP the sample was diluted with benzophenone (C~0H~30) to suppress orientation. The value denoted with (*) was kept constant to obtain a stable fit.
QS IS W Sample ram. s-I ram. s-~ mm-s-I
70/8 0.40(3) 0.29(1) 0.38(3) 0.74(2) 0.27(1) 0.46(8)
70/8 BP 0.42(3) 0.29(1) 0.39(3) 0.76(3) 0.27(1) 0.43(2)
71/2.5 0.46(1) 0.28(1) 0.45(3) 0.74(11) 0.22(2) 0.82(6)
71/7.5 0.50(3) 0.28(1) 0.42(2) 0.85(3) 0.26(1) 0.45(2)
71/7.5 0.51(3) 0.29(1) 0.46(3) 0.82(7) 0.25(2) 0.46(5)
71/12.5 0.44(3) 0.29(1) 0.42(2) 0.79(2) 0.27(1) 0.40(*)
71/20 0.54(2) 0.28(1) 0.42(1) 0.89(2) 0.26(1) 0.39(2)
In 15 0.52(3) 0.27(1) 0.34(6) 0.74(6) 0.24(1) 0.55(3)
A~a, 99.0 t \:1"r 63(7)37(7) 98 5 q(a) 293 K * q
45(9) " ' - 3 ' - i 0 i ' 2 ' 3 55(9) 2 ' " '
65(11) ~ 100 ~ ~ 35(11)
56(8) 44(8) "r~ 99 " \ \ / ] 73(15) .~ 27(15)
51(5) 98 49(5)
68(6) ['~ 32(6) 97
(b) 293 K
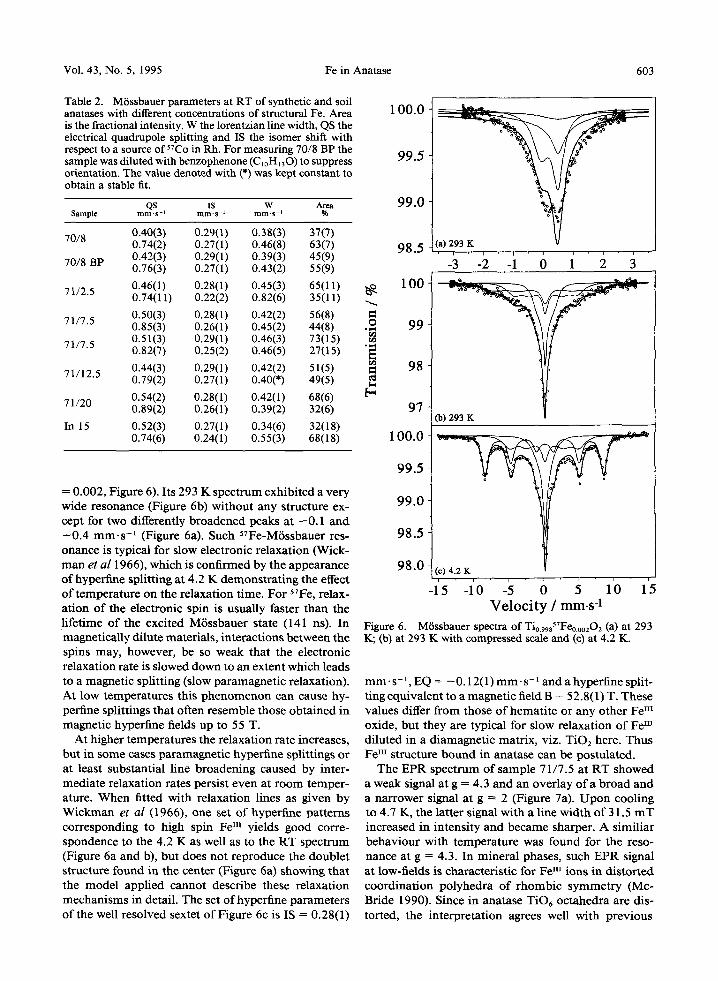
= 0.002, Figure 6). Its 293 K spectrum exhibited a very wide resonance (Figure 6b) without any structure ex- cept for two differently broadened peaks at - 0 . 1 and +0.4 m m . s -1 (Figure 6a). Such S7Fe-M6ssbauer res- onance is typical for slow electronic relaxation (Wick- m a n et al 1966), which is confirmed by the appearance of hyperfine splitting at 4.2 K demonstrating the effect of temperature on the relaxation time. For ~TFe, relax- ation of the electronic spin is usually faster than the lifetime of the excited M6ssbauer state (141 ns). In magnetically dilute materials, interactions between the spins may, however, be so weak that the electronic relaxation rate is slowed down to an extent which leads to a magnetic splitting (slow paramagnetic relaxation). At low temperatures this phenomenon can cause hy- perfine splittings that often resemble those obtained in magnetic hyperfine fields up to 55 T.
At higher temperatures the relaxation rate increases, but in some cases paramagnetic hyperfine splittings or at least substantial line broadening caused by inter- mediate relaxation rates persist even at room temper- ature. When fitted with relaxation lines as given by Wickman et al (1966), one set of hyperfine patterns corresponding to high spin Fe In yields good corre- spondence to the 4.2 K as well as to the RT spectrum (Figure 6a and b), but does not reproduce the doublet structure found in the center (Figure 6a) showing that the model applied cannot describe these relaxation mechanisms in detail. The set ofhyperfine parameters of the well resolved sextet of Figure 6c is IS = 0.28(1)
32(18) 68(18) 1 00 .0
99.5
99 .0
98.5
98 .0
* - ~ I I d ' , *
(c) 4.2 K
-i5 -i0 -5 b f0 15 Velocity / mm.s -1
Figure 6. Mfssbauer spectra of Tio.99sSVFeo.oozO2 (a) at 293 K; (b) at 293 K with compressed scale and (c) at 4.2 K.
ram. s - ' , EQ = - 0.12(1) mm. s- 1 and a hyperfine split- ting equivalent to a magnetic field B = 5 2.8 (1) T. These values differ from those of hematite or any other Fem oxide, but they are typical for slow relaxation of Fe H~ diluted in a diamagnetic matrix, viz. TiO2 here. Thus F e III structure bound in anatase can be postulated.
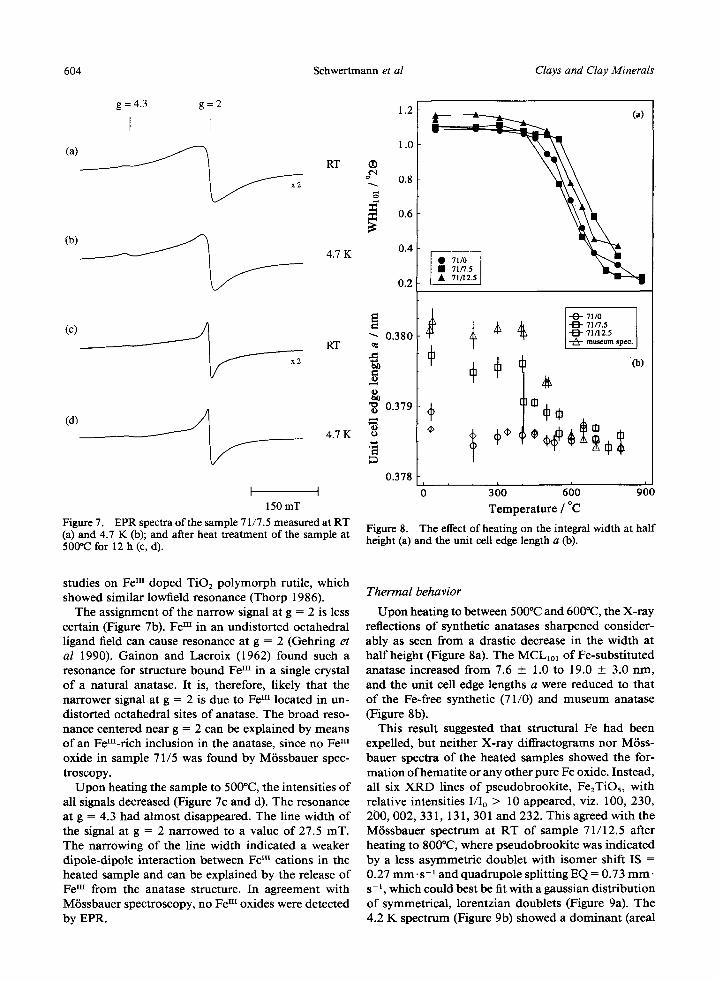
The EPR spectrum of sample 71/7.5 at RT showed a weak signal at g = 4.3 and an overlay of a broad and a narrower signal at g -- 2 (Figure 7a). Upon cooling to 4.7 K, the latter signal with a line width of 31.5 m T increased in intensity and became sharper. A similiar behaviour with temperature was found for the reso- nance at g = 4.3. In mineral phases, such EPR signal at low-fields is characteristic for Fe I" ions in distorted coordination polyhedra of rhombic symmetry (Mc- Bride 1990). Since in anatase TiO6 octahedra are dis- toned, the interpretation agrees well with previous
604 Schwertmann et al Clays and Clay Minerals
g=4.3 g=2 1.2
I I
(a) ~ RT o~ 0.81" 0
0.6
(b) ~ _ ~ ~ ~ 4.7 K 0.4
0.2
RT
(d) 4.7 K
150 mT Figure 7. EPR spectra of the sample 71/7.5 measured at RT (a) and 4.7 K (b); and after heat treatment of the sample at 500*(2 for 12 h (c, d).
~" 0.380
e.
~ 0.379
O
0.378
7,,0 ~ l-m- 71/7.5
1-t3- 71/12.5 [ ~ museum spec.
360 660 900
Temperature / ~
Figure 8. The effect of heating on the integral width at half height (a) and the unit cell edge length a (b).
studies on Fe III doped TiO2 polymorph ruffle, which showed similar lowfield resonance (Thorp 1986).
The assignment of the narrow signal at g = 2 is less certain (Figure 7b). Fe nI in an undistorted octahedral ligand field can cause resonance at g = 2 (Gehring et al 1990). Gainon and Lacroix (1962) found such a resonance for structure bound We III in a single crystal of a natural anatase. It is, therefore, likely that the narrower signal at g = 2 is due to Fem located in un- distorted octahedral sites of anatase. The broad reso- nance centered near g = 2 can be explained by means of an Fern-rich inclusion in the anatase, since no Fem oxide in sample 71/5 was found by MiSssbauer spec- troscopy.
Upon heating the sample to 500~ the intensities of all signals decreased (Figure 7c and d). The resonance at g = 4.3 had almost disappeared. The line width of the signal at g = 2 narrowed to a value of 27.5 mT. The narrowing of the line width indicated a weaker dipole-dipole interaction between Fem cations in the heated sample and can be explained by the release of Fem from the anatase structure. In agreement with M6ssbauer spectroscopy, no Fem oxides were detected by EPR.
Thermal behavior
Upon heating to between 500~ and 600~ the X-ray reflections of synthetic anatases sharpened consider- ably as seen from a drastic decrease in the width at half height (Figure 8a). The MCLlol of Fe-substituted anatase increased from 7.6 + 1.0 to 19.0 + 3.0 nm, and the unit cell edge lengths a were reduced to that of the Fe-free synthetic (71/0) and museum anatase (Figure 8b).
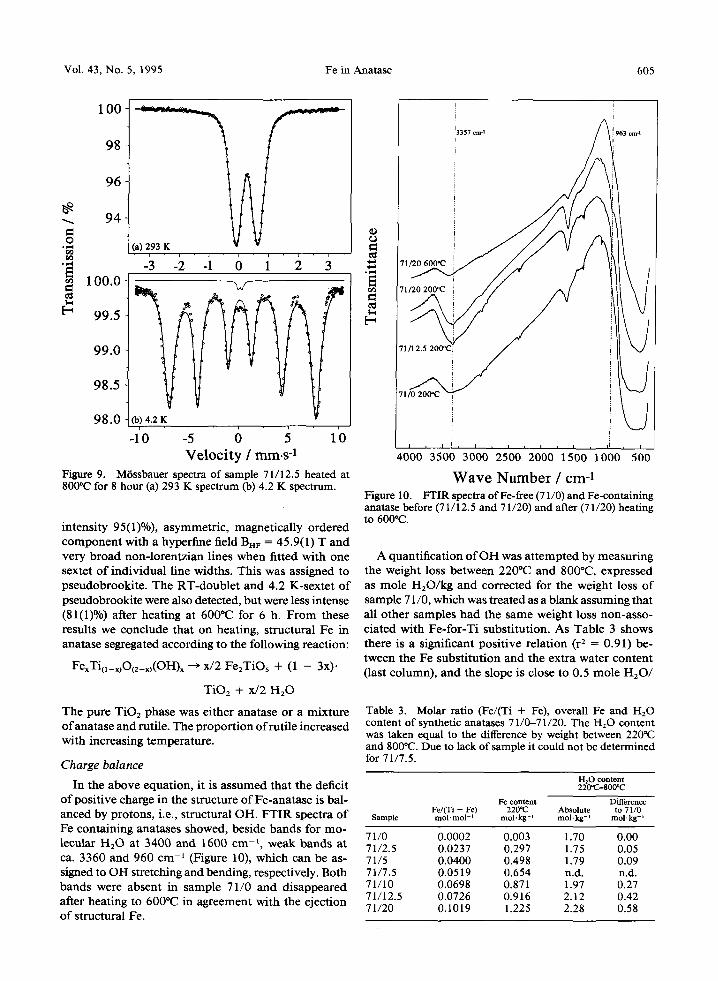
This result suggested that structural Fe had been expelled, but neither X-ray diffractograms nor Mrss- bauer spectra of the heated samples showed the for- mation of hematite or any other pure Fe oxide. Instead, all six XRD lines of pseudobrookite, Fe2TiOs, with relative intensities I/Io > 10 appeared, viz. 100, 230, 200, 002, 331, 131,301 and 232. This agreed with the Mrssbauer spectrum at RT of sample 71/12.5 after heating to 800~ where pseudobrookite was indicated by a less asymmetric doublet with isomer shift IS = 0.27 ram. s -1 and quadrupole splitting EQ = 0.73 mm. s- ~, which could best be fit with a gaussian distribution of symmetrical, lorentzian doublets (Figure 9a). The 4.2 K spectrum (Figure 9b) showed a dominant (areal
Vol. 43, No. 5, 1995 Fe in Anatase 605
100
98
96
94 o
~
100 .0 -
99.5
98.5
98.0 0a) 4.2 K
(a) 293 K
-2 -i
99.0 i
7 -
A i
0 J , i .
2 3
-1'0 -5 d 5 1'0 Velocity / mm.s -1
Figure 9. M/Sssbauer spectra of sample 71/12.5 heated at 800"C for 8 hour (a) 293 K spectrum (b) 4.2 K spectrum.
intensity 95(1)%), asymmetric, magnetically ordered component with a hyperfine field BnF = 45.9(1) T and very broad non-lorentzian lines when fitted with one sextet of individual line widths. This was assigned to pseudobrookite. The RT-doublet and 4.2 K-sextet of pseudobrookite were also detected, but were less intense (81(1)%) after heating at 600~ for 6 h. F rom these results we conclude that on heating, structural Fe in anatase segregated according to the following reaction:
FexTio_x)O(2_x)(OH)x ---) rd2 Fe2TiO5 + (1 - 3x).
TiO2 + X/2 H20
The pure TiO2 phase was either anatase or a mixture ofanatase and rutile. The proportion ofruti le increased with increasing temperature.
Charge balance
In the above equation, it is assumed that the deficit of positive charge in the structure of Fe-anatase is bal- anced by protons, i.e., structural OH. FTIR spectra of Fe containing anatases showed, beside bands for mo- lecular H 2 0 at 3400 and 1600 cm -1, weak bands at ca. 3360 and 960 cm -t (Figure 10), which can be as- signed to OH stretching and bending, respectively. Both bands were absent in sample 71/0 and disappeared after heating to 600~ in agreement with the ejection of structural Fe.
4000 3500 3000 2500 2000 1500 1000 500
Wave Number / cm-1 Figure 10. FTIR spectra of Fe-free (71/0) and Fe-containing anatase before (71/12.5 and 71/20) and after (71/20) heating to 600"C.
A quantification of OH was attempted by measuring the weight loss between 220~ and 800~ expressed as mole HEO/kg and corrected for the weight loss of sample 71/0, which was treated as a blank assuming that all other samples had the same weight loss non-asso- ciated with Fe-for-Ti substitution. As Table 3 shows there is a significant positive relation (r 2 ----- 0.91) be- tween the Fe substitution and the extra water content (last column), and the slope is close to 0.5 mole H 2 0 /
Table 3. Molar ratio (Fe/(Ti + Fe), overall Fe and H20 content of synthetic anatases 71/0-71/20. The H20 content was taken equal to the difference by weight between 2200C and 8000C. Due to lack of sample it could not be determined for 71/7.5.
H20 c o n t e n t 2 2 0 " C - 8 0 0 " C
Fe c o n t e n t D i f f e r ence F e / ( T i + Fe) 220*(2 A b s o l u t e to 71 /0
S a m p l e m o l . m o l -~ m o l . k g -~ mol,k_g - t m o l - k g -~
71/0 0.0002 0.003 1.70 0.00 71/2.5 0.0237 0.297 1.75 0.05 71/5 0.0400 0.498 1.79 0.09 71/7.5 0.0519 0.654 n.d. n.d. 71/10 0.0698 0.871 1.97 0.27 71/12.5 0.0726 0.916 2.12 0.42 71/20 0.1019 1.225 2.28 0.58
606 Schwertmann et al Clays and Clay Minerals
mole Fe as can be expected from the above reaction. We conclude that this H20 originated from structural OH-groups incorporated in the anatase structure as a consequence of the substitution o f Fe for Ti, thereby compensating for the positive charge deficit. As the Fe is ejected from the anatase structure with heating, so is OH.
CONCLUSIONS
The main question to be answered in this study was whether or not Fe in synthetic and pedogenic anatase could replace structural Ti. Strong support for such an isomorphous replacement was provided by the in- crease in the unit cell parameters a and Vwith increas- ing Fe content, and by the decrease of a and V to the values of pure anatase when the structural iron was ejected to form pseudobrookite, Fe2TiO~. The replace- ment of Ti by Fe in anatase was also supported by M6sshauer and EPR spectra indicating structural Fe III rather than a separate Fe-Ti-O-phase, which was formed when structural Fe was ejected. Replacement of Ti TM
by Fe III created a negative charge that was balanced by an O --~ OH transformation, as shown by FTIR and weight loss measurements. Most likely, substitution of some Ti by Fe IlI is typical for pedogenic anatases as compared to hydrothermal or other lithogenic ones.
A C K N O W L E D G M E N T S
The authors greatly acknowledge the assistance of Dr. E. Murad, Bamberg, for the first M6ssbauer spec- t rum and the FTIR spectra, Prof. Dr. F. E. Wagner for providing the possibility for taking 4.2 K M6ssbauer spectra and for valuable discussions, Dr. C. V. Farmer, Aberdeen, for his assistance in interpreting the IR spec- tra, Dr. H.-Ch. Bartscherer for the TEMs, Prof. H. M. K6ster, Garching, Dr. R. Hochleitner, Miinchen and Dr. H. Stanjek, Freising, for supplying the museum specimens and the latter also for valuable advice and help in the X-ray diffraction work. Dr. J. Bigham kindly improved the text. This study has been funded by the Deutsche Forschungsgemeinschaft under grant Schw 90/47-1.
REFERENCES
Deer, W. A., R. A. Howie, and J. Zussman. 1962. Rock- forming minerals. VoL 1-5. London: Longmans, Green & Co. Ltd.
Fitzpatrick, R. W., J. Le Roux, and U. Schwertmann. 1978. Amorphous and crystalline titanium and iron-titanium ox-
ides in synthetic preparations, at near ambient conditions, and in soil clays. Clays & Clay Miner. 26: 189-201.
Gainon, D., and R. Lacroix. 1982. Electron paramagnetic resonance of Fe3+-Ion in anatase. Proc. Phys. Soc. 79: 658- 659.
Gehring, A. U., R. Kathrein, and A. Reller. 1990. Activated state in the lepidocrocite structure during thermal treat- ment. Naturwissenschaften 77:177-179.
Gurewitz, E., and U. Atzmony. 1982. Mrssbauer-effect study ofFe2TiOs, an anisotropic uniaxial spin-glass. Phys. Review B, Vol. 26, No. 11: 6093-6098.
Janik, L. J., and M. Raupach. 1977. An iterative, least- squares program to separate infrared absorption spectra into their component bands. CSIRO (Austr.) Div. Soil Tech. Pap. 35: 1-37.
Krster, H. M. 1979. Die chemische Silikatanalyse. Berlin, Heidelberg, Springer, New York: 196 pp.
McBride, M. 1990. Electron spin resonance spectroscopy. In Instrumental Surface Analysis of Geological Material. D. L. Perry, ed. New York: VCH Publisher, 233-281.
Mehra, O. P., and M. L. Jackson. 1960. Iron oxide removal from soils and clays by a dithionite-citrate system buffered with sodium bicarbonate. Clays & Clay Miner. 7:317-327.
Milnes, A. R., and R. W. Fitzpatrick. 1989. Titanium and zirconium minerals. In Minerals in Soil Environments, 2rid ed. J. B. Dixon and S. B. Weed, eds. Soil Sci. Soc. Am. Book Series No. 1: 1131-1205.
Schwertmann, U. 1984. Iron oxides in some ferruglnous soils of India. Clay Res. 3: 23-30.
Schwertmann, U., and L. Carlson. 1994. Aluminum influ- ence on iron oxides: XVII. Unit cell parameters and alu- minum substitution of natural goethites. Soil Sci. Soc. Am. J. 58: 256-261.
Schwertmann, U., R. M. Fitzpatrick, R. M. Taylor, and D. G. Lewis. 1978. The influence of aluminum on iron ox- ides. II: Preparation and properties of Al-substituted he- matites. Clays & Clay Miner. 27:105-112.
Stanjek, H., and U. Schwertmann. 1992. The influence of aluminum on iron oxides. Part XVI: Hydroxyl and alu- minum substitution in synthetic hematites. Clays & Clay Miner. 40: 347-354.
Teller, R. G., M. R. Antonio, A. E. Grau, M. Gueguin, and E. Kostiner. 1990. Structural analysis ofmetastable pseu- dobrookite ferrous titanium oxides with neutron diffraction and Mrssbauer spectroscopy. Solid State Chem. 88: 334- 350.
Thorp, J. S., H. S., Eggleston, T. A. Egerton, and A. J. Pear- man. 1986. The distribution of iron centres in Fe-doped ruffle powders. J. Mater. Sci. Lett. 5: 54-56.
Wickman, H. H., M. P. Klein, and D. A. Shirley. 1966. Paramagnetic hyperfine structure and relaxation effects in M/Sssbauer spectra: 57Fe in ferrichrome A. Phys. Rev. 152 No. 1: 345-357.
Zeese, R., U. Schwertmann, G. F. Tietz, and U. Jux. 1994. Mineralogy and stratigraphy of three deep lateritic profiles of the Jos plateau (Central Nigeria). Catena 21:195-214.
(Received 6 September 1994; accepted 17 February 1995; Ms. 2573)