Embed Size (px)
Citation preview

57
COMMONWEALTH JOURNAL OF COMMERCE & MANAGEMENT RESEARCH
Vol.5, Issue 1 (January 2018) ISSN: 2393-851X Impact Factor: 4.382 UGC & ISI Indexed
INVESTOR’S PERCEPTION, AWARENESS AND
PREFERENCE IN FINANCIAL ASSET FOR
INVESTMENT
Hardik Shah Assistant Professor, Centre for Management Studies, Dharmsinh Desai University, Nadiad
Rakesh Patel Assistant Professor, Commerce Department, Dharmsinh Desai University, Nadiad
ABSTRACT
There are many investment options are available for the investors to invest. Many times investors are
aware of it and few times they are not aware of it. At last, for an individual investor the important thing
is the capital appreciation. If they will get the capital appreciation from only one or two investment
option and if they are satisfied with it then they will not think of the other avenues of the investment,
which might give them more return compare to the others. It has been observed that the overall market
of interest on government securities, bank deposits and other fixed deposit has been decreasing year
after steadily due to various factors, which affect the interest of the investors and the rate of interest of
the investors. On the other hand, the investor’s interest is gradually shifted towards mutual funds,
shares and other company securities. When compare to bank deposits the return from mutual funds is
high. Likewise, when compare to mutual funds the return from equity market is very high. However, of
course risk is also high in these securities. Hence, it is very important to know the awareness of the
investors in financial assets and how far the investors are aware of the stock market operation,
procedures and financial intermediaries. By keeping these issues in mind the present study ―investor’s
awareness and preference in financial asset for investment is undertaken.
Key Words: Investors Preference, Investors Awareness, Financial Assets, Investment

58
COMMONWEALTH JOURNAL OF COMMERCE & MANAGEMENT RESEARCH
Vol.5, Issue 1 (January 2018) ISSN: 2393-851X Impact Factor: 4.382 UGC & ISI Indexed
INTRODUCTION
Saving is the surplus of income over expenditure and when such savings are invested to
generate more money, it is called investment. Savings form an important part of the
economy of any nation. With the savings invested in various options available to the
people, the money acts as the driver for growth of the country. Indian financial scene too
presents a plethora of avenues to the investors. Though certainly not the best or deepest of
markets in the world, it has reasonable options for an ordinary man to invest his savings.
One needs to invest and earn return on their idle resources and generate a specified sum of
money for a specific goal in life and make a provision for an uncertain future. One of the
important reasons why one needs to invest wisely is to meet the cost of inflation. Inflation
is the rate at which the cost of living increases.
Livestock, land and precious metals are some of the traditional investment options. During
19th century, revolution in investment took place through the banking system as it provide
many investment options like Fixed deposits (FDs), government bonds, Public Provident
Fund (PPF) to its investors. With the development of capital market, investment in stocks
became a good option for generating higher returns. However, greater risk and lack of
knowledge about the movement of stock prices were also associated with them. Therefore,
mutual funds emerged as an ultra modern method of investment to lessen the risk at low
cost with expert’s knowledge.
Financial markets are constantly becoming more efficient by providing more promising solutions
to the investors. Being a part of financial markets although mutual funds industry is responding
very fast by understanding the dynamics of investor’s perception towards rewards, still they are
continuously following this race in their endeavor to differentiate their products responding to
sudden changes in the economy. Thus, it is high time to understand and analyze investor’s
perception, awareness and expectations, and unveil some extremely valuable information to
support financial decision making. Financial markets are becoming more exhaustive with
financial products seeking new innovations and to some extent innovations are also visible in

59
COMMONWEALTH JOURNAL OF COMMERCE & MANAGEMENT RESEARCH
Vol.5, Issue 1 (January 2018) ISSN: 2393-851X Impact Factor: 4.382 UGC & ISI Indexed
designing mutual funds portfolio but these changes need alignment in accordance with investor’s
expectations.
REVIEW OF LITERATURE
Williams (1964) proposed that sense of unpredictability of actual results of an action differing
from possible predicted results in a given situation. Risk not only includes uncertainty and loss
elements but time factor cannot be excluded from probability of risk. Doubt concerning the
outcome in a given situation before the event occurs implies that there is something about the
present situation that will be different in the future.
Sujit and Amrit (1996), stated that the main factor influenced the salaried and business class
group to invest in mutual fund were tax benefit.
Elmiger and Kim (2003) concluded risk as the trade-off that every investor has to make
between the higher rewards that potentially come with the opportunity and the higher risk that
has to be borne as a consequence of the danger.
Sankaran (2004) proposes the future direction for investors will be to invest in pension funds,
as government is envisaging a policy to cover all kinds of investors. He further opined that MF
industry will continue to grow in spite of competition and will be propelled in the right
direction because of the investor friendly financial markets.
Singh (2004) has established that middle class salaried investors and professionals perfected to
have disclosure of net asset value on a day today basis and wanted to invest in MF‟s in order
to get higher tax rebates. Further, it is observed that small investors perceived MF‟s to be better
investment alternative and public sector investments to be less risky.
Desigan et al. (2006) found that women investors are hesitant for investment in mutual funds.
Conducted a study on women investor s perception towards investment and found that
women investors’ basically are indecisive in investing in MFs due to various reasons like lack
of knowledge about the investment protection and their various investment procedures, market
fluctuations, various risks associated with investment, assessment of investment and redressal
60
COMMONWEALTH JOURNAL OF COMMERCE & MANAGEMENT RESEARCH
Vol.5, Issue 1 (January 2018) ISSN: 2393-851X Impact Factor: 4.382 UGC & ISI Indexed
of grievances regarding their various investment related problems.
IIM Data work (2007) analyzed that there is an association between education level and
financial behavior of the investor. Irrespective of the educational deposits in the bank is
popular among all the investor.
Sudalaimuthu and Kumar (2008) observed that MF is the one of investment avenues for
small investors and he studied the about investor’s perception towards MF investments
effectively taking into account the investor’s preference towards the MF sector. The study
has made an attempt to understand the financial behaviour of MF investors in connection with
the scheme preference and selection.
Alex Wang (2011), expressed that variables like awareness, income level and skill plays a vital
role which influence youngster to invest in mutual funds.
Palanivel and Chandrakumar (2013), identified the low and middle income group of
investor and irrespective of them give preference to invest in insurance and bank deposit
OBJECTIVE 1. To analyze the investors awareness & perception regarding investing in financial assets.
2. To analyze the preference of financial intermediaries in investing activity.
3. To analyze the type of financial asset preferred, by the investors.
4. To identify the factors and objectives of investing in financial assets.
RESEARCH METHODOLOGY Source of Data
Primary Data Questionnaire
Secondary Data Periodicals, journals, records, university library, books, web pages.
Sample Size 60
Sampling technique Random sampling

61
COMMONWEALTH JOURNAL OF COMMERCE & MANAGEMENT RESEARCH
Vol.5, Issue 1 (January 2018) ISSN: 2393-851X Impact Factor: 4.382 UGC & ISI Indexed
Primary Data
Initially, a rough draft was prepared keeping in mind the objective of the research. A pilot
study of 20 investors was done in order to know the accuracy of the Questionnaire. The final
Questionnaire was arrived only after certain important changes were done. Secondary Data
This data is collected by using the following means; Articles in Financial Newspapers(“Economic Times” & “The Times Of India”)
Investment Magazines, Business Magazines, Financial Chronicles.
Expert Opinions published in various print media.
Books written by various Foreign & Indian authors on Investments.
Data available on internet through various websites
Sampling Design Samples of 60 investors were selected based on random sampling technique. The information
relating to investment awareness in financial assets & preference of financial intermediaries in
investing were collected from the selected respondents with the help of the supplied
questionnaire via Google Docs
Presentation of the data The collected data will be analyzed and will be represented through various charts, graphs, pie
charts, tabulation and a master sheet of the surveyed data
LIMITATIONS OF THE STUDY The project is based upon various financial instruments that are available in India and the
perception level of the customer as well as the awareness about these financial instruments. For
which there will be the need of information from the customers about their knowledge of these

62
COMMONWEALTH JOURNAL OF COMMERCE & MANAGEMENT RESEARCH
Vol.5, Issue 1 (January 2018) ISSN: 2393-851X Impact Factor: 4.382 UGC & ISI Indexed
financial products. The various limitations of the study are:
Total number of financial instrument in the market is so large that it needs a lot of resources to
analyze them all.
There are various companies providing these financial instruments to the public. Handling and
analyzing such a varied and diversified data needs a lot of time and resources.
As the project is based on secondary data, possibility of unauthorized information cannot be
avoided.
Reluctance of the people to provide complete information about themselves can affect the
validity of responses.
The lack of knowledge in customers about the financial instruments can be a major limitation.
The information can be biased due to use of questionnaires VARIOUS INVESTMENT AVENUES AVAILABLE IN INDIA Safe/Low Risk Avenues: Savings Account Bank Fixed Deposits Public Provident Fund National Savings Certificate Post Office Savings Government Securities
Moderate Risk Avenues:
Mutual Funds Life Insurance Debentures Bonds
High Risk Avenues:
Equity Share Market Commodity Market FOREX Market

63
COMMONWEALTH JOURNAL OF COMMERCE & MANAGEMENT RESEARCH
Vol.5, Issue 1 (January 2018) ISSN: 2393-851X Impact Factor: 4.382 UGC & ISI Indexed
Traditional Avenues:
Real Estate Gold/Silver Chit Funds
Emerging Avenues:
Virtual Real Estate Hedge Funds/Private Equity Investments Art and Passion
DATA INTERPRETATION AND FINDINGS
1.1 Classification based on gender, age, qualification and annual income

64
COMMONWEALTH JOURNAL OF COMMERCE & MANAGEMENT RESEARCH
Vol.5, Issue 1 (January 2018) ISSN: 2393-851X Impact Factor: 4.382 UGC & ISI Indexed
Interpretation: 45% of the investors are men and the rest 15% are females. Generally males
bear the financial responsibility in Indian society, and therefore they have to make investment
(and other) decisions to fulfil the financial obligations. When it comes to age, it was found that
70% are young and significant number under the age of 30 years. 15% of them are in the age
group of 30 to 40 years. 10% of them are above 40-50 years of age. 5% of them are above 50
years of age. 51.67% of the individual investors covered in the study are postgraduates; 31.67%
investors are graduates and 5% of the investors are under-graduates, and 11.66% investors are
categorized as Professional qualification. It is interesting to note that most investors (covered in
the study) can be said to possess higher education (Bachelor Degree and above), and this factor
will increase the reliability of conclusions drawn about the matters under investigation. 45% of
the investors are earning less than 3 lakhs per annum, 26.67% investors are earning between 3
lakhs and 5 lakhs, 16.67% investors are earning between 5 lakhs and 8 Lakhs, 11.67% investors
are earning more than 8 lakhs per annum. Since most of the investors are below 3 lakhs annual
earnings, many of them are non risk takers.
65
COMMONWEALTH JOURNAL OF COMMERCE & MANAGEMENT RESEARCH
Vol.5, Issue 1 (January 2018) ISSN: 2393-851X Impact Factor: 4.382 UGC & ISI Indexed
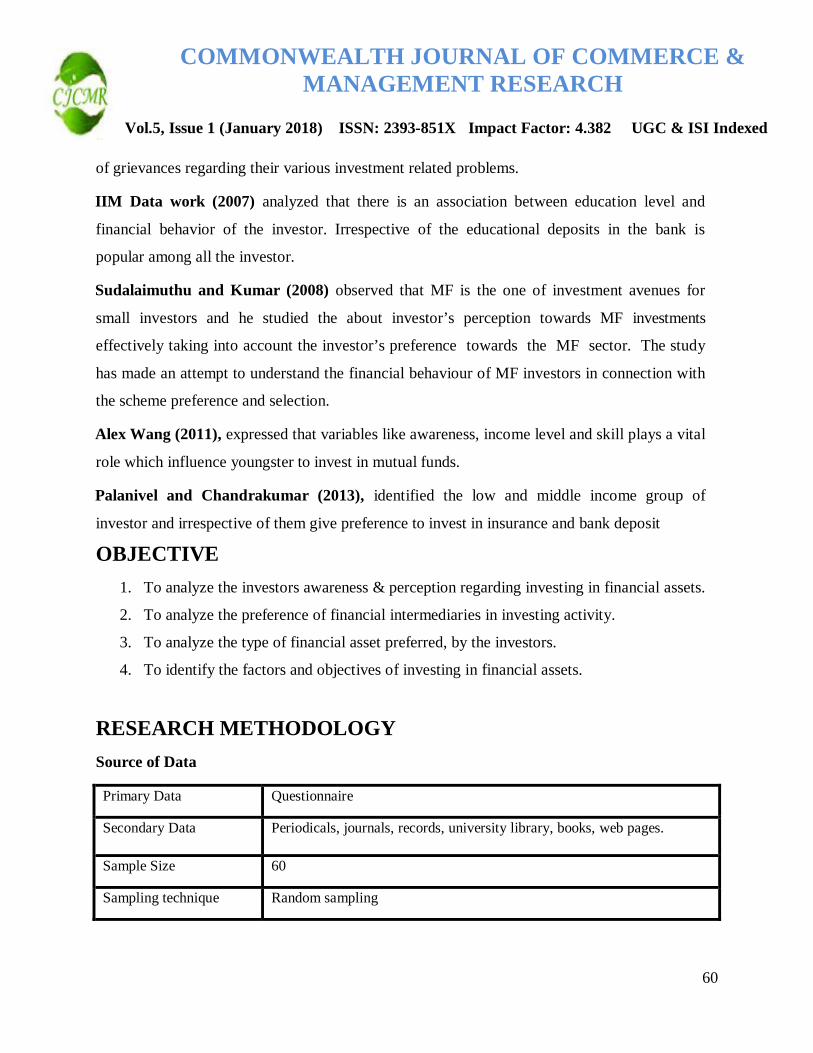
Interpretation: According to the survey, Fixed deposits ranked 1st as people were holding
their traditional investment till today, followed by shares, insurance, gold, mutual funds. The
investors didn’t prefer to change their past investments but were agreeable to invest in new
avenues with future savings.
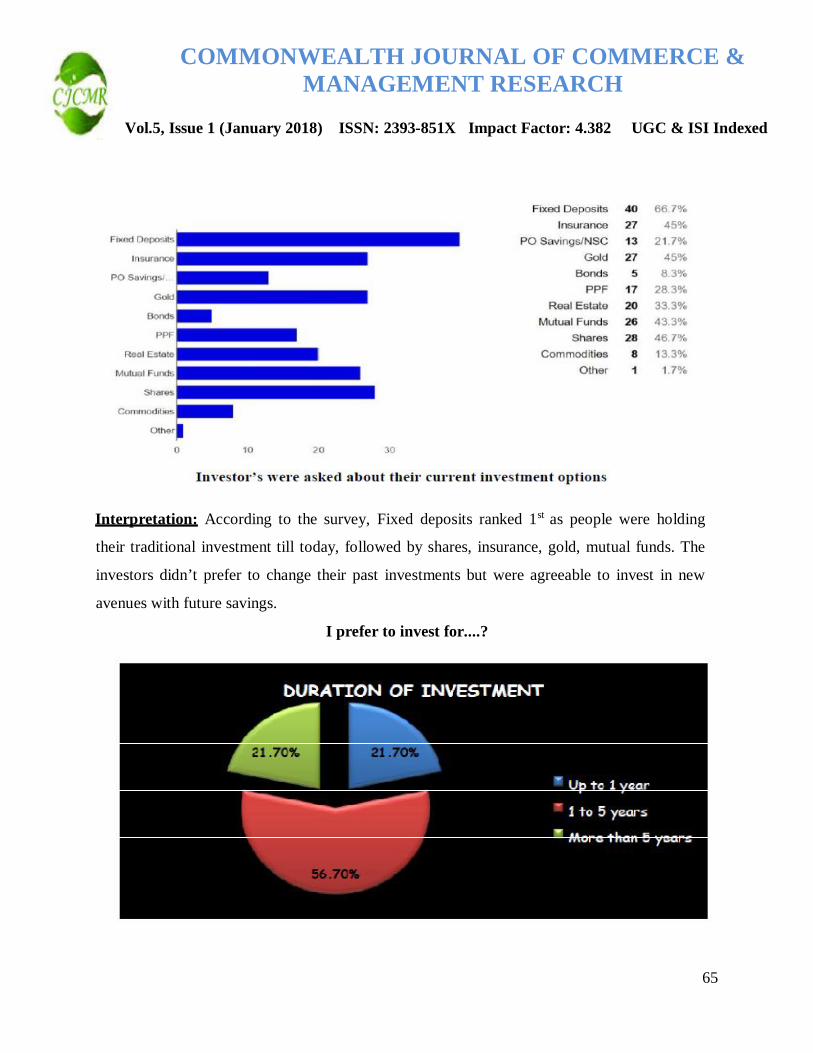
I prefer to invest for....?

66
COMMONWEALTH JOURNAL OF COMMERCE & MANAGEMENT RESEARCH
Vol.5, Issue 1 (January 2018) ISSN: 2393-851X Impact Factor: 4.382 UGC & ISI Indexed
Interpretation: It is interesting to know that many of the investors prefer to invest their money
for medium term i.e. from 1-5 yrs, instead of short term or long term. 21.7% preferred short
term, 56.7% preferred medium term, and 21.7% preferred long term.
How do you invest in these options?
Interpretation: 48.30% of the investors never had a financial advisor, they never approached an
advisor for their financial needs, the reason may be inadequate income and excess expenditure,
and there wouldn’t be surplus money to worry about. 30 % of the investors have financial
advisors, who manage their investments. While 21.70% of the investors were those who took
help and advice of their family and friends

67
COMMONWEALTH JOURNAL OF COMMERCE & MANAGEMENT RESEARCH
Vol.5, Issue 1 (January 2018) ISSN: 2393-851X Impact Factor: 4.382 UGC & ISI Indexed
Investor’s were asked about their current mutual fund investment schemes
Interpretation: According to the survey, Growth ranked 1st , followed by balanced, income,
gold, sector. The investors didn’t prefer to change their past investments but were agreeable to
invest in new avenues with future savings
Investors were asked how do they purchase Mutual Fund Unit
Interpretation: 65.5% of the investors purchased the mutual fund units through agents
reason being the complicated procedural understanding & inspite of higher returns, lack of

68
COMMONWEALTH JOURNAL OF COMMERCE & MANAGEMENT RESEARCH
Vol.5, Issue 1 (January 2018) ISSN: 2393-851X Impact Factor: 4.382 UGC & ISI Indexed
knowledge about the schemes. While, 34.5% of investors were purchasing mutual funds
themselves.
After investment, how frequently you monitor the performance of the mutual funds?
Interpretation: Due to the busy life schedule, many of the investors are not able to spend time
in monitoring their investments, only 17% of the investors are monitoring their investments
daily, 35% are monitoring on a monthly basis, 41% , the majority investors are monitoring their
investments occasionally. Many of them who have invested in safe investment avenues do not
bother about their investments, some of them forget about the investments for many years
Investors were asked how often they switched the schemes of mutual fund in a year

69
COMMONWEALTH JOURNAL OF COMMERCE & MANAGEMENT RESEARCH
Vol.5, Issue 1 (January 2018) ISSN: 2393-851X Impact Factor: 4.382 UGC & ISI Indexed
Interpretation: Mutual Fund investors were quite satisfied with their current investment and due
to lack of time they didn’t frequently switched their schemes. Many of them who have invested
in safe investment avenues do not bother about their investments, some of them forget about the
investments for many years. 44.8% of the investors never changed their scheme, 44.8% changed
one or two times, 8.6% were changing three to four times while only 1.70% of investors
switched for more than four times.
Investors were asked their most preferred source for tracking the performance of the
mutual funds
Interpretation: Online reports with 58.33% of the investors was the most preferred source as
the growing era of internet & increase in the number of internet users. Reports by financial
adviser/agents was the next with 18.33% of investors as many investors preferred to invest via
agents only. This was followed by Newspapers & magazines with 13.33% and family and friends
with 10%.

70
COMMONWEALTH JOURNAL OF COMMERCE & MANAGEMENT RESEARCH
Vol.5, Issue 1 (January 2018) ISSN: 2393-851X Impact Factor: 4.382 UGC & ISI Indexed
INVESTMENT OPTIONS Investors were asked about the investment options in which they currently invest and to indicate
top three of them as per the current investment amount. They were also asked to identify top
three investment options that will be preferred by them in future. The researcher has found that
maximum number of investors has been investing in FDs followed by real estate, mutual funds,
gold/e-gold, PO/NSC, PPF, shares, bonds and insurance. Table summarizes these ranks along
with the rank as per current investment amount and preferred investment options
With the help of cross tabulation and chi square test on income and the preference of the period of investment
Results of the tabulation of income*term

71
COMMONWEALTH JOURNAL OF COMMERCE & MANAGEMENT RESEARCH
Vol.5, Issue 1 (January 2018) ISSN: 2393-851X Impact Factor: 4.382 UGC & ISI Indexed
Interpretation: It was observed that there were 28 investors those who were having income less
than Rs. 3 lacs out of them 16 preferred to invest for 1 to 5 years while those having income
more 5 lacs, they preferred to invest for longer period i.e more than 5 years. So, medium term
investment was the most popular term for the investment.

72
COMMONWEALTH JOURNAL OF COMMERCE & MANAGEMENT RESEARCH
Vol.5, Issue 1 (January 2018) ISSN: 2393-851X Impact Factor: 4.382 UGC & ISI Indexed
Investors were asked their most preferred financial asset if there was increase in their savings
Interpretation It was found that maximum number of investors has been investing in FDs
followed by real estate, mutual funds, gold/e-gold, PO/NSC, PPF, shares, bonds and insurance. If
there was increase the savings, the investors were willing to take some risk and invest their
money in stock market, real estate, etc
Based upon the amount of investment done in different financial assets

73
COMMONWEALTH JOURNAL OF COMMERCE & MANAGEMENT RESEARCH
Vol.5, Issue 1 (January 2018) ISSN: 2393-851X Impact Factor: 4.382 UGC & ISI Indexed
Interpretation: Real Estate was the highest amongst all as the investment itself is very high. It
was followed by gold. MF was ranked 5th as mostly middle class people were preferring to invest
only for the purpose of tax savings, so the amount of investment was low.
Based upon the income and the term of the investment
Interpretation: It was observed that there were 28 investors those who were having income less
than Rs. 3 lacs out of them 16 preferred to invest for 1 to 5 years while those having income
more 5 lacs, they preferred to invest for longer period i.e more than 5 years. So, medium term
investment was the most popular term for the investment.

74
COMMONWEALTH JOURNAL OF COMMERCE & MANAGEMENT RESEARCH
Vol.5, Issue 1 (January 2018) ISSN: 2393-851X Impact Factor: 4.382 UGC & ISI Indexed
Based upon the income and frequency of switching the MF scheme
Interpretation: It is observed that people with income from Rs. 3-5 lacs were more reluctant to
change the scheme, while people with lesser income switched their scheme once or twice. In
other categories also this was observed, the reason behind this being lack of time to go after the
scheme and follow the performance daily.
1.2 Based upon the parameters investors were asked to rank the various
financial assets Further, for identifying investors perception, they were asked to rate all the investment avenues
on their parameters as return, risk, liquidity, tax saving and procedural understanding. Investors
perceive that shares are the maximum return generating investment option followed by real
estate, gold/e-gold, mutual funds and bonds. However, they consider that the risk involved in
shares is highest followed by mutual funds, real estate, insurance and bonds. On the liquidity
parameter, mutual funds are on the first rank followed by FDs and shares, Bonds, PO/NSC and
PPF. Investors perceive that insurance are the most tax savings investment option followed by
FDs. Procedural understanding is highest for the investment in PPF followed by FDs, post office/
NSC, gold/e-gold and bonds

75
COMMONWEALTH JOURNAL OF COMMERCE & MANAGEMENT RESEARCH
Vol.5, Issue 1 (January 2018) ISSN: 2393-851X Impact Factor: 4.382 UGC & ISI Indexed
Based upon the purpose of investment done in different financial assets
Factors Ranks and Scores Total Ranks
1 2 3 4 5 6 7 8 F(S) Expertise (40) (35) (54) (75) (52) (81) (106) (68) 60
(511) 8
Safety (344) (238) (90) (70) (128) (60) (50) (13) 60 (993)
3
Liquidity (288) (212) (186) (150) (148) (117) (44) (14) 60 (947)
4
Diversification (104) (140) (102) (55) (84) (96) (76) (44) 60 (701)
7
Tax benefit (384) (287) (258) (125) (72) (39) (8) (4) 60 (1177)
1

76
COMMONWEALTH JOURNAL OF COMMERCE & MANAGEMENT RESEARCH
Vol.5, Issue 1 (January 2018) ISSN: 2393-851X Impact Factor: 4.382 UGC & ISI Indexed
Regular income (80) (175) (228) (205) (116) (84) (30) (10) 60 (928)
5
Savings (72) (126) (150) (210) (84) (90) (48) (25) 60 (805)
6
High returns (304) (154) (168) (145) (136) (45) (28) (16) 60 (996)
2
Interpretation: Every investor has one or more objectives behind their investments in mutual
funds. Without any investment objective, the investment is considered as useless. According to
table the main objective of the respondents behind investing in mutual funds is the tax benefits
offered by it followed by high return and safety of the schemes. Therefore getting tax benefits
from the scheme is the main motive of the investors behind their investment in mutual funds.
Based upon the income the tax benefit considered by the investors were compared
Count
Income
Less than Rs.3,00,000
Rs.3,00,000 to
Rs.5,00,000
Rs.5,00,000 to
Rs.8,00,000
Above Rs.8,00,000
Total
Tax_benefit 1 1 0 2 4
Very Low
Low
Moderate
High
Very High
3
2
2
2
9
8
6
2
0
16
10
1
1
0
12
6
6
4
3
19
Total 28 16 9 7 60

77
COMMONWEALTH JOURNAL OF COMMERCE & MANAGEMENT RESEARCH
Vol.5, Issue 1 (January 2018) ISSN: 2393-851X Impact Factor: 4.382 UGC & ISI Indexed
Interpretation: The lower income group preferred more to invest on the basis of tax benefit, as
this purpose let their savings give highest return with moderate level of risk.
Characteristics of Mutual funds by Factor Analysis
Interpretation: In KMO and Bartlett's Test the KMO value is 0.71 which is more than the
ideal value of 0.6 thus proving that data is adequate and Bartlett's Test significance value is
0.000 which is less than 0.05 confirming the significance of analysis.

78
COMMONWEALTH JOURNAL OF COMMERCE & MANAGEMENT RESEARCH
Vol.5, Issue 1 (January 2018) ISSN: 2393-851X Impact Factor: 4.382 UGC & ISI Indexed
Interpretation: Factor 1, refers to the Benefits & Transparency explained about the mutual
funds which contributes 30.526% of the variance.
Factor 2, signifies to the Quality of Returns on Investments which contributes about 12.809% of
the variance. The major variables that are explained in this factor are “Stable and Regular
Income”, “Bank/Banker” and “Growth in Returns”.
Factor 3, explains the Information and Redemption Period which they are receiving which is
contributing nearly 10.574% of the variance. The Variables included in this factor are “Friends
and Family” and “Redemption Period”.
Factor 4 refers to Liquidity & Institutional Investors’ Activity which is contributing nearly
9.216% of the variance. The major variables that are explained by these factors are “Liquidity”
and “Intuitional Investors’ Activity”.
FINDINGS
Maximum number of investors has been investing in FDs followed by real estate, mutual
funds, gold/e-gold and PO/NSC. Lesser number of investors invests in PPF, shares, bonds
and insurance. Maximum amount of investment have been done in real estate, gold/e- gold,
FDs, shares and mutual funds in that order. However, shares followed by real estate, gold/e-
gold, mutual funds and PPF would be the most preferred investment option.
After considering all three factors as number of investors investing in a particular option, the
amount of investment and the preferred investment option for the future, real estate is the
most popular investment option followed by gold/e-gold. Mutual funds stand at third rank
with FDs and shares followed by PPF, PO/NSC, bonds and insurance.
Investors perceive shares as the most return generating option followed by real estate, gold/e-
gold, mutual funds and bonds. Shares have been considered as the most risky avenue
followed by mutual funds, real estate, insurance and bonds. For liquidity, the rank order is
mutual funds, shares, FDs, bonds, PO/NSC and PPF. For tax saving, the rank order is
insurance, FDs, PPF, real estate, PO/NSC, bonds and mutual funds.

79
COMMONWEALTH JOURNAL OF COMMERCE & MANAGEMENT RESEARCH
Vol.5, Issue 1 (January 2018) ISSN: 2393-851X Impact Factor: 4.382 UGC & ISI Indexed
Mutual funds characteristic that influence investors’ decision the most are reputation of the
mutual fund company, rating, past performance, load status and portfolio. Availability of tax
benefits, asset size and current NAV also influence the investment decision. However mutual
fund is Indian or foreign fund, its turnover and manager have a little impact on the same.
Based upon the characteristics, five factors influencing the investment decision for mutual
funds are their Structure (comprising of portfolio, exit load & mutual fund is Indian or
foreign), Size (including its turnover & asset size), Performance (i.e., its past performance,
current NAV & rating), Outlook/Status (comprising of past performance, tax benefits &
mutual fund is Indian or foreign) and Professional Expertise (i.e., its reputation & mutual
funds’ manager)
Mutual funds are gaining popularity. Even though the total money invested is small, but the
number of investors are large and they would like to invest more in these in future.
Investors perceive mutual funds are high risk low return investment which may be a reason
of its low popularity. Also, they consider that mutual funds are not good for tax saving and
procedural understanding of its investment is also not clear to most of them. However, its
liquidity has been considered good.
CONCLUSION
This report is a reflection of the behaviour of various categories of investors. Selection of a
perfect investment avenue is a difficult task to any investor. An effort is made to identify the
tastes and preferences of a sample of investors selected randomly out of a large population.
Despite of many limitations to the study I was successful in identifying some investment
patterns, there is some commonness in these investors and many of them responded positively to
the study

80
COMMONWEALTH JOURNAL OF COMMERCE & MANAGEMENT RESEARCH
Vol.5, Issue 1 (January 2018) ISSN: 2393-851X Impact Factor: 4.382 UGC & ISI Indexed
BIBLIOGRAPHY 1. Alex Wang, (2011), „Younger Generations Investing Behaviors in Mutual
Funds: Does Gender Matter? The Journal of Wealth Management, spring, Vol. 13, No.4, pp.13-23. http://dx.doi.org/10603/9430/15/15.
2. An IIMS Data works Research Report (2007), Invest India Income and Savings Survey among 321 Million Paid up Workers between the Ages of 18 and 59. www.tribuneindia.comdx.doi.org/20071010
3. Desigan et al. (2006), “Women Investor‟s Perception towards Investment: An empirical Study”, Indian Journal of Marketing. Retrieved from: http://www. google.com. (accessed on 22nd May 2010)
4. Palanivelu, V.R. & Chandrakumar, K. (2013).A Study on Preferred Investment Avenues among Salaried Peoples with Reference to Namakkal Taluk, Tamil Nadu, India, IBEA International Conference on Business, Economics and Accounting, Vol.3, No.11, pp.203212. http://www.caal-inteduorg.com/ibea2013/ejournal/089.
5. Sikidar, Sujit, Singh, Amrit Pal,“Financial Services: Investment in Equity and Mutual Funds – A Behavioural Study”, in Bhatia B.S., and Batra G.S.(ed.) Management of Financial Services, Deep and Deep Publications, New Delhi, pp. 136-145. 1996.
6. Singh, Chander,“Performance of Mutual Funds in India: An Empirical Evidence”, The ICFAI Journal of Applied Finance, Vol. 1, No. 4, 2004.
7. Wang, (2011), Younger Generations Investing Behaviors in Mutual Funds: Does Gender Matter? The Journal of Wealth Management, spring , Vol.13, No.4, pp.13-23. http://dx.doi.org/10603/9430/15/15.
WEBSITES:
www.tax4India.com
www.economictimes.Indiatimes.com
www.business-standard.com
www.Indiamoney.com
www.moneymanagementideas.com
www.savingwala.com