Embed Size (px)
Citation preview

WWW.INVESTORS.COM
Using Investor’s Business Daily To Find Winning Stocks.This Quick-Start Guide is designed to show you how to get the most out of Investor’s Business Daily’s innovative features and help you become a more educated, confident investor.
We’ll show you the most valuable and time-saving features in IBD®, give you definitions and explain why certain areas of the paper are vital if you want to make money in the stock market.
With IBD you can easily:
Discover new investment ideas. Find stocks setting up for possible breakouts. Gauge the true health of any stock. Track and understand current market conditions. Red-flag individual stock & general market sell signals. Learn the finer points of smart investing.
Every day you’ll be learning a little more about the historically grounded, common-sense investment rules and guidelines IBD was founded upon. We hope you find this guide useful. Here’s to your future investing success!
YOUR QUICK-START GUIDE
The Big Picture
Three out of four stocks follow the market’s direction. So should you. The Big Picture gives you a daily briefing on market direction and objective analysis on the price action of leading stocks. This is not personal opinion; rather, IBD editors help you understand the market’s direction and its key indicators, which are vital to your investing success. The Big Picture helped observing readers get out of the market before the big losses in 2008 and back in the market in March at the start of the current rally.
Online Resources: IBD’s market editors cover the action every hour during market hours. It’s the top story on Investors.com.
IBD’s Top 10
Your fast briefing on the day’s top stories. In minutes you get up to speed on the markets & economy.
INVESTOR’S BUSINESS DAILY INVESTORS.COM
- 2 -
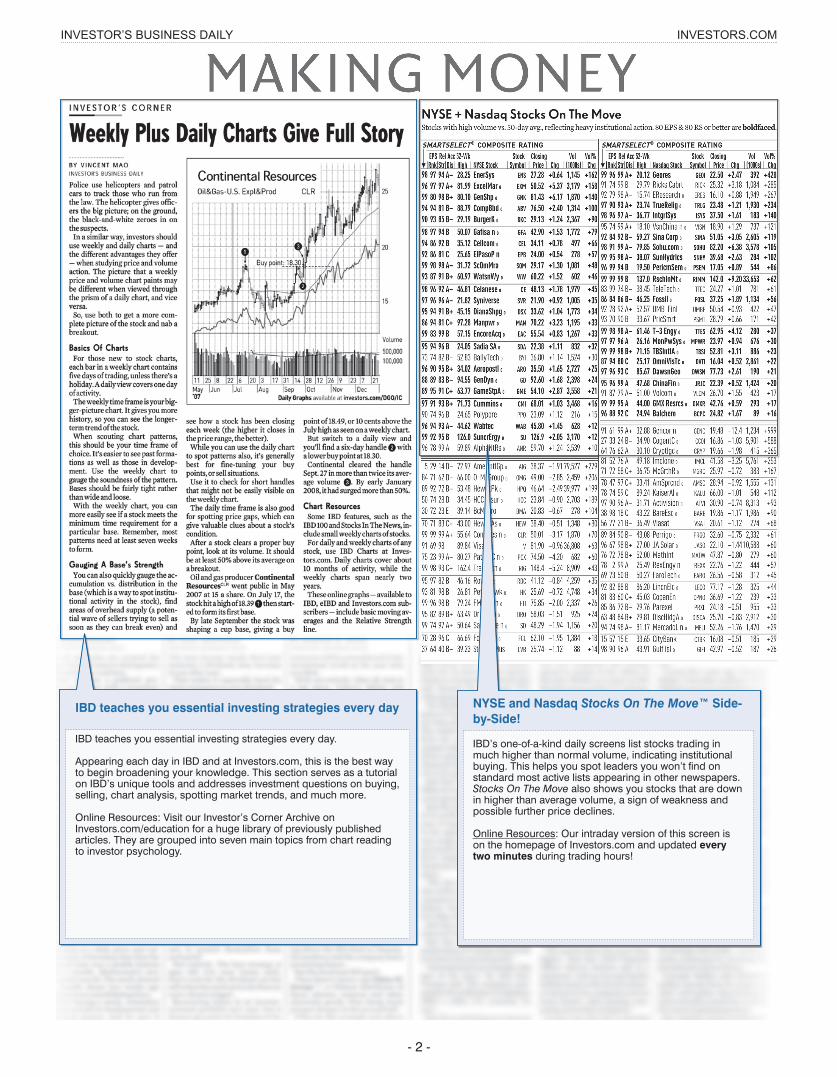
IBD teaches you essential investing strategies every day
IBD teaches you essential investing strategies every day.
Appearing each day in IBD and at Investors.com, this is the best way to begin broadening your knowledge. This section serves as a tutorial on IBD’s unique tools and addresses investment questions on buying, selling, chart analysis, spotting market trends, and much more.
Online Resources: Visit our Investor’s Corner Archive on Investors.com/education for a huge library of previously published articles. They are grouped into seven main topics from chart reading to investor psychology.
NYSE and Nasdaq Stocks On The Move™ Side-by-Side!
IBD’s one-of-a-kind daily screens list stocks trading in much higher than normal volume, indicating institutional buying. This helps you spot leaders you won’t find on standard most active lists appearing in other newspapers. Stocks On The Move also shows you stocks that are down in higher than average volume, a sign of weakness and possible further price declines.
Online Resources: Our intraday version of this screen is on the homepage of Investors.com and updated every two minutes during trading hours!
INVESTOR’S BUSINESS DAILY INVESTORS.COM
- 3 -
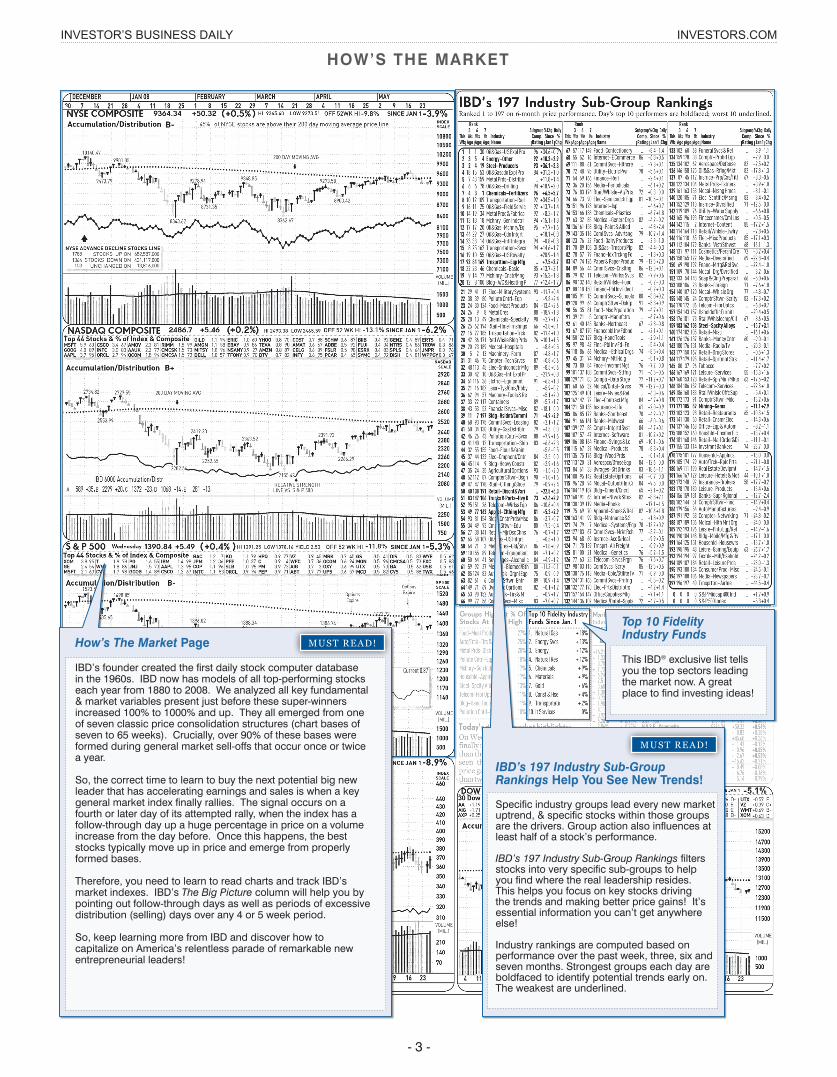
Top 10 Fidelity Industry Funds
This IBD® exclusive list tells you the top sectors leading the market now. A great place to find investing ideas!
IBD’s 197 Industry Sub-Group Rankings Help You See New Trends!
Specific industry groups lead every new market uptrend, & specific stocks within those groups are the drivers. Group action also influences at least half of a stock’s performance.
IBD’s 197 Industry Sub-Group Rankings filters stocks into very specific sub-groups to help you find where the real leadership resides. This helps you focus on key stocks driving the trends and making better price gains! It’s essential information you can’t get anywhere else!
Industry rankings are computed based on performance over the past week, three, six and seven months. Strongest groups each day are boldfaced to identify potential trends early on. The weakest are underlined.
MUST READ!
How’s The Market Page
IBD’s founder created the first daily stock computer database in the 1960s. IBD now has models of all top-performing stocks each year from 1880 to 2008. We analyzed all key fundamental & market variables present just before these super-winners increased 100% to 1000% and up. They all emerged from one of seven classic price consolidation structures (chart bases of seven to 65 weeks). Crucially, over 90% of these bases were formed during general market sell-offs that occur once or twice a year.
So, the correct time to learn to buy the next potential big new leader that has accelerating earnings and sales is when a key general market index finally rallies. The signal occurs on a fourth or later day of its attempted rally, when the index has a follow-through day up a huge percentage in price on a volume increase from the day before. Once this happens, the best stocks typically move up in price and emerge from properly formed bases.
Therefore, you need to learn to read charts and track IBD’s market indexes. IBD’s The Big Picture column will help you by pointing out follow-through days as well as periods of excessive distribution (selling) days over any 4 or 5 week period.
So, keep learning more from IBD and discover how to capitalize on America’s relentless parade of remarkable new entrepreneurial leaders!
MUST READ!
HOW’S THE MARKET
INVESTOR’S BUSINESS DAILY INVESTORS.COM
- 4 -
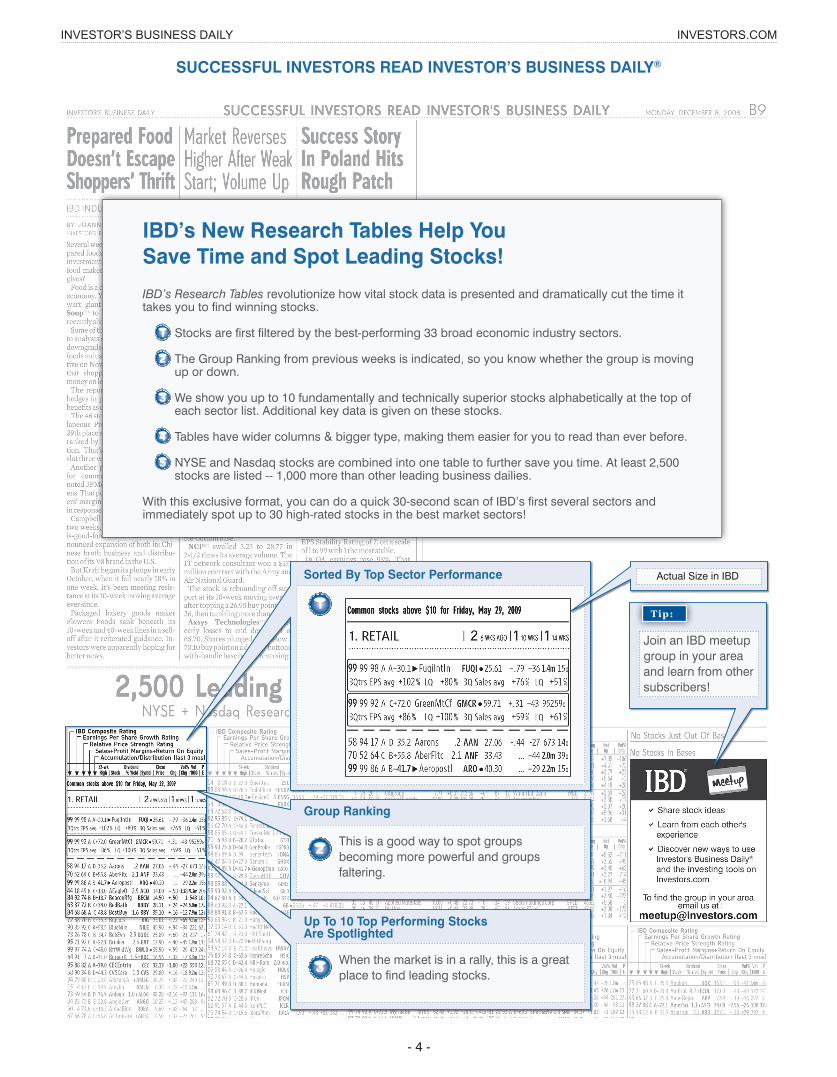
IBD’s New Research Tables Help You Save Time and Spot Leading Stocks!
IBD’s Research Tables revolutionize how vital stock data is presented and dramatically cut the time it takes you to find winning stocks.
1 Stocks are first filtered by the best-performing 33 broad economic industry sectors.
2 The Group Ranking from previous weeks is indicated, so you know whether the group is moving up or down.
3 We show you up to 10 fundamentally and technically superior stocks alphabetically at the top of each sector list. Additional key data is given on these stocks.
4 Tables have wider columns & bigger type, making them easier for you to read than ever before.
5 NYSE and Nasdaq stocks are combined into one table to further save you time. At least 2,500 stocks are listed -- 1,000 more than other leading business dailies.
With this exclusive format, you can do a quick 30-second scan of IBD’s first several sectors and immediately spot up to 30 high-rated stocks in the best market sectors!
SUCCESSFUL INVESTORS READ INVESTOR’S BUSINESS DAILY®
Sorted By Top Sector Performance Actual Size in IBD
1
Group Ranking
2 This is a good way to spot groups becoming more powerful and groups faltering.
Up To 10 Top Performing Stocks Are Spotlighted
3 When the market is in a rally, this is a great place to find leading stocks.
Tip:
Join an IBD meetup group in your area and learn from other subscribers!
INVESTOR’S BUSINESS DAILY INVESTORS.COM
- 5 -
SUCCESSFUL INVESTORS READ INVESTOR’S BUSINESS DAILY®
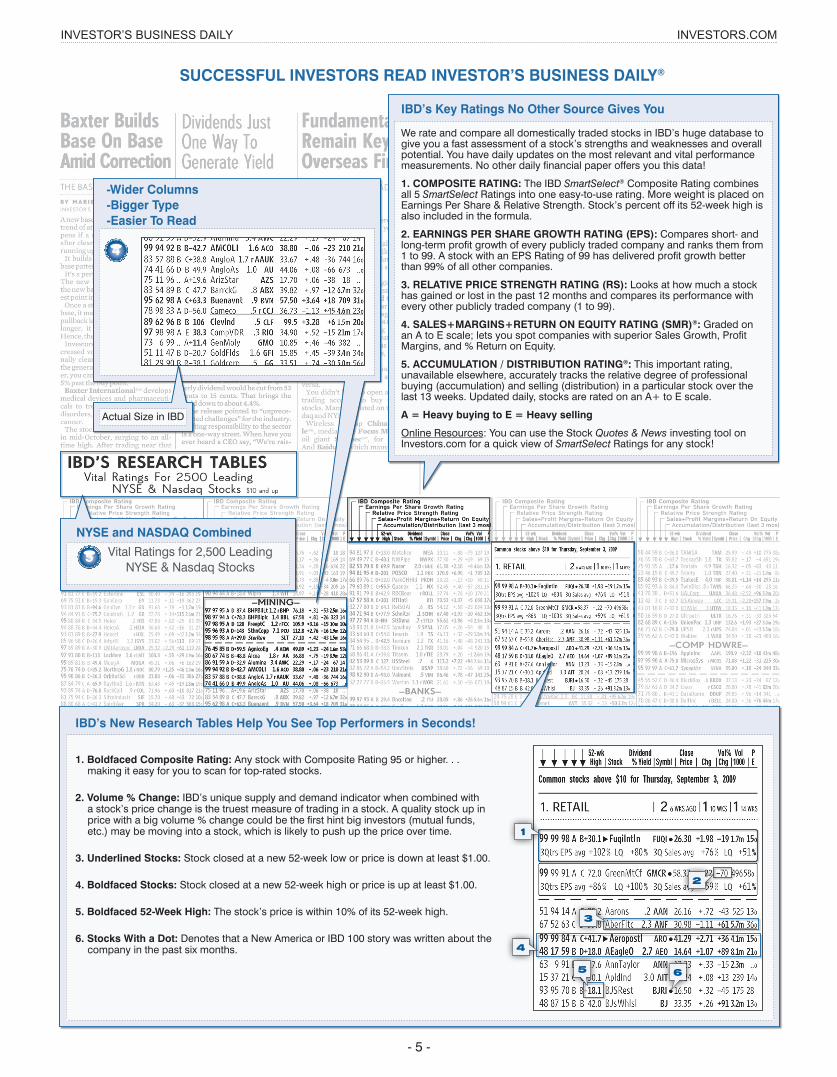
IBD’s Key Ratings No Other Source Gives You
We rate and compare all domestically traded stocks in IBD’s huge database to give you a fast assessment of a stock’s strengths and weaknesses and overall potential. You have daily updates on the most relevant and vital performance measurements. No other daily financial paper offers you this data!
1. COMPOSITE RATING: The IBD SmartSelect® Composite Rating combines all 5 SmartSelect Ratings into one easy-to-use rating. More weight is placed on Earnings Per Share & Relative Strength. Stock’s percent off its 52-week high is also included in the formula.
2. EARNINGS PER SHARE GROWTH RATING (EPS): Compares short- and long-term profit growth of every publicly traded company and ranks them from 1 to 99. A stock with an EPS Rating of 99 has delivered profit growth better than 99% of all other companies.
3. RELATIVE PRICE STRENGTH RATING (RS): Looks at how much a stock has gained or lost in the past 12 months and compares its performance with every other publicly traded company (1 to 99).
4. SALES+MARGINS+RETURN ON EQUITY RATING (SMR)®: Graded on an A to E scale; lets you spot companies with superior Sales Growth, Profit Margins, and % Return on Equity.
5. ACCUMULATION / DISTRIBUTION RATING®: This important rating, unavailable elsewhere, accurately tracks the relative degree of professional buying (accumulation) and selling (distribution) in a particular stock over the last 13 weeks. Updated daily, stocks are rated on an A+ to E scale.
A = Heavy buying to E = Heavy selling
Online Resources: You can use the Stock Quotes & News investing tool on Investors.com for a quick view of SmartSelect Ratings for any stock!
NYSE and NASDAQ Combined
Vital Ratings for 2,500 LeadingNYSE & Nasdaq Stocks
5
-Wider Columns-Bigger Type-Easier To Read
4
1. Boldfaced Composite Rating: Any stock with Composite Rating 95 or higher. . . making it easy for you to scan for top-rated stocks.
2. Volume % Change: IBD’s unique supply and demand indicator when combined with a stock’s price change is the truest measure of trading in a stock. A quality stock up in price with a big volume % change could be the first hint big investors (mutual funds, etc.) may be moving into a stock, which is likely to push up the price over time.
3. Underlined Stocks: Stock closed at a new 52-week low or price is down at least $1.00.
4. Boldfaced Stocks: Stock closed at a new 52-week high or price is up at least $1.00.
5. Boldfaced 52-Week High: The stock’s price is within 10% of its 52-week high.
6. Stocks With a Dot: Denotes that a New America or IBD 100 story was written about the company in the past six months.
1
4
5 6
3
2
IBD’s New Research Tables Help You See Top Performers in Seconds!
Actual Size in IBD
INVESTOR’S BUSINESS DAILY INVESTORS.COM
- 6 -
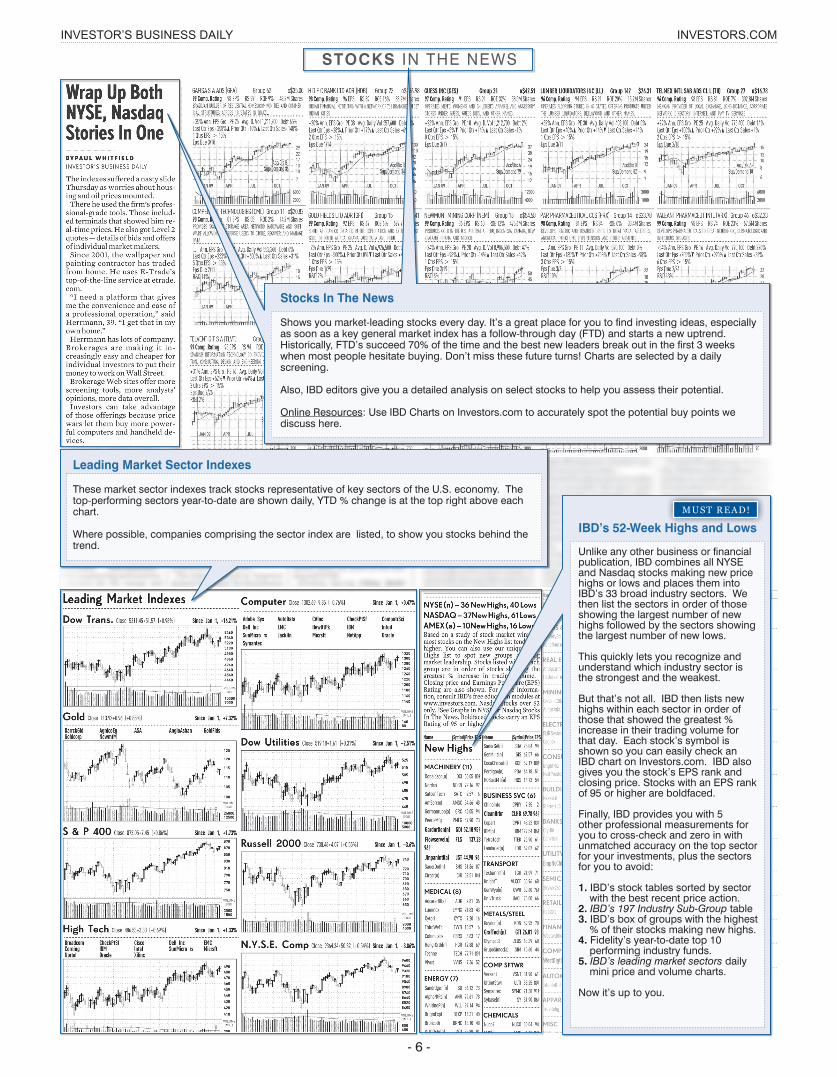
STOCKS IN THE NEWS
Stocks In The News
Shows you market-leading stocks every day. It’s a great place for you to find investing ideas, especially as soon as a key general market index has a follow-through day (FTD) and starts a new uptrend. Historically, FTD’s succeed 70% of the time and the best new leaders break out in the first 3 weeks when most people hesitate buying. Don’t miss these future turns! Charts are selected by a daily screening.
Also, IBD editors give you a detailed analysis on select stocks to help you assess their potential.
Online Resources: Use IBD Charts on Investors.com to accurately spot the potential buy points we discuss here.
IBD’s 52-Week Highs and Lows
Unlike any other business or financial publication, IBD combines all NYSE and Nasdaq stocks making new price highs or lows and places them into IBD’s 33 broad industry sectors. We then list the sectors in order of those showing the largest number of new highs followed by the sectors showing the largest number of new lows.
This quickly lets you recognize and understand which industry sector is the strongest and the weakest.
But that’s not all. IBD then lists new highs within each sector in order of those that showed the greatest % increase in their trading volume for that day. Each stock’s symbol is shown so you can easily check an IBD chart on Investors.com. IBD also gives you the stock’s EPS rank and closing price. Stocks with an EPS rank of 95 or higher are boldfaced.
Finally, IBD provides you with 5 other professional measurements for you to cross-check and zero in with unmatched accuracy on the top sector for your investments, plus the sectors for you to avoid:
1. IBD’s stock tables sorted by sector with the best recent price action.
2. IBD’s 197 Industry Sub-Group table3. IBD’s box of groups with the highest
% of their stocks making new highs.4. Fidelity’s year-to-date top 10
performing industry funds.5. IBD’s leading market sectors daily
mini price and volume charts.
Now it’s up to you.
MUST READ!
Leading Market Sector Indexes
These market sector indexes track stocks representative of key sectors of the U.S. economy. The top-performing sectors year-to-date are shown daily, YTD % change is at the top right above each chart.
Where possible, companies comprising the sector index are listed, to show you stocks behind the trend.
INVESTOR’S BUSINESS DAILY INVESTORS.COM
- 7 -
’08’07’06’05’04May ’03
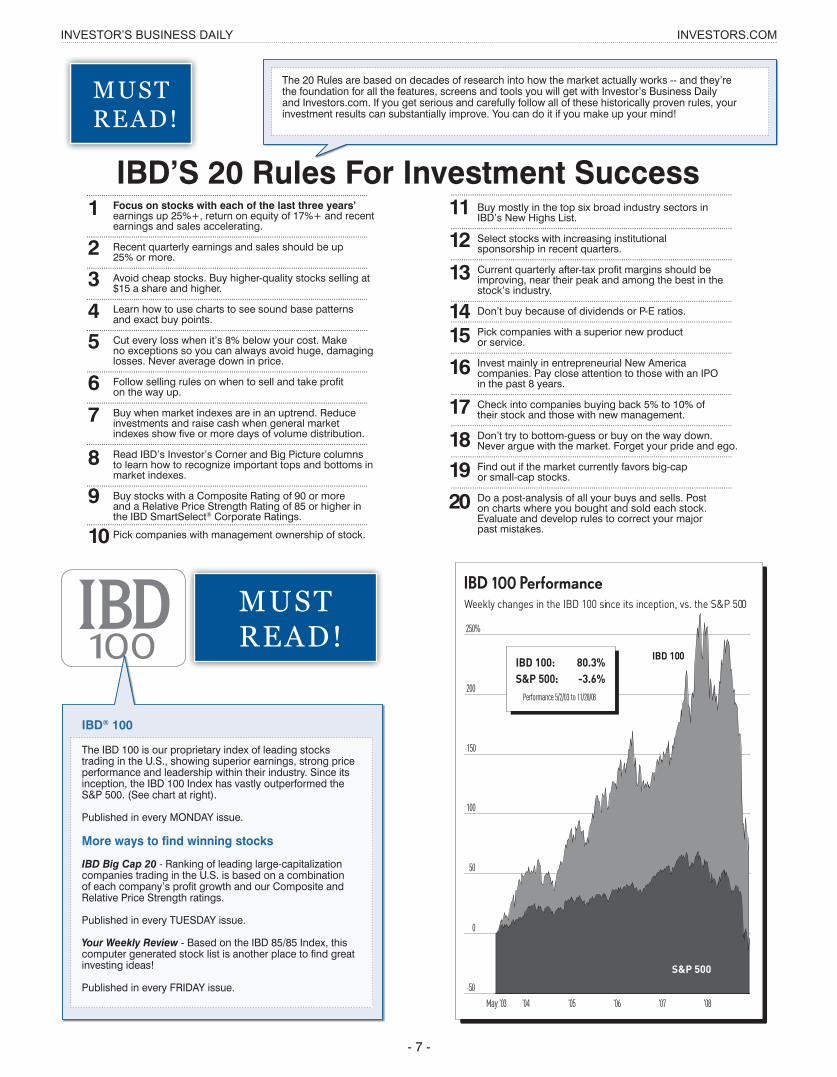
IBD 100 Performance
Weekly changes in the IBD 100 since its inception, vs. the S&P 500
IBD 100
-50
0
100
150
200
250%
50
IBD 100: 80.3%S&P 500: -3.6%
Performance 5/2/03 to 11/28/08
....................................................................................................................................
Focus on stocks with each of the last three years’ earnings up 25%+, return on equity of 17%+ and recent earnings and sales accelerating.
....................................................................................................................................
Recent quarterly earnings and sales should be up 25% or more.
....................................................................................................................................
Avoid cheap stocks. Buy higher-quality stocks selling at $15 a share and higher.
....................................................................................................................................
Learn how to use charts to see sound base patterns and exact buy points.
....................................................................................................................................
Cut every loss when it’s 8% below your cost. Make no exceptions so you can always avoid huge, damaging losses. Never average down in price.
....................................................................................................................................
Follow selling rules on when to sell and take profit on the way up.
....................................................................................................................................
Buy when market indexes are in an uptrend. Reduce investments and raise cash when general market indexes show five or more days of volume distribution.
....................................................................................................................................
Read IBD’s Investor’s Corner and Big Picture columns to learn how to recognize important tops and bottoms in market indexes.
....................................................................................................................................
Buy stocks with a Composite Rating of 90 or more and a Relative Price Strength Rating of 85 or higher in the IBD SmartSelect® Corporate Ratings.
....................................................................................................................................
Pick companies with management ownership of stock.
....................................................................................................................................
Buy mostly in the top six broad industry sectors in IBD’s New Highs List.
....................................................................................................................................
Select stocks with increasing institutional sponsorship in recent quarters.
....................................................................................................................................
Current quarterly after-tax profit margins should be improving, near their peak and among the best in the stock’s industry.
....................................................................................................................................
Don’t buy because of dividends or P-E ratios.....................................................................................................................................
Pick companies with a superior new product or service.
....................................................................................................................................
Invest mainly in entrepreneurial New America companies. Pay close attention to those with an IPO in the past 8 years.
....................................................................................................................................
Check into companies buying back 5% to 10% of their stock and those with new management.
....................................................................................................................................
Don’t try to bottom-guess or buy on the way down. Never argue with the market. Forget your pride and ego.
....................................................................................................................................
Find out if the market currently favors big-cap or small-cap stocks.
....................................................................................................................................
Do a post-analysis of all your buys and sells. Post on charts where you bought and sold each stock. Evaluate and develop rules to correct your major past mistakes.
1
2
3
45
6
7
8
9
10
11
12
13
1415
16
17
1819
20
The 20 Rules are based on decades of research into how the market actually works -- and they’re the foundation for all the features, screens and tools you will get with Investor’s Business Daily and Investors.com. If you get serious and carefully follow all of these historically proven rules, your investment results can substantially improve. You can do it if you make up your mind!
IBD’S 20 Rules For Investment Success
MUST READ!
MUST READ!
IBD® 100
The IBD 100 is our proprietary index of leading stocks trading in the U.S., showing superior earnings, strong price performance and leadership within their industry. Since its inception, the IBD 100 Index has vastly outperformed the S&P 500. (See chart at right).
Published in every MONDAY issue.
More ways to find winning stocks
IBD Big Cap 20 - Ranking of leading large-capitalization companies trading in the U.S. is based on a combination of each company’s profit growth and our Composite and Relative Price Strength ratings.
Published in every TUESDAY issue.
Your Weekly Review - Based on the IBD 85/85 Index, this computer generated stock list is another place to find great investing ideas!
Published in every FRIDAY issue.
INVESTOR’S BUSINESS DAILY INVESTORS.COM
- 8 -
© 2010 Investor’s Business Daily, Inc. Investor’s Business Daily, IBD and CAN SLIM and corresponding logos are registered trademarks owned by Data Analysis, Inc., an affiliate of Investor’s Business Daily. BLKT-WKT-008
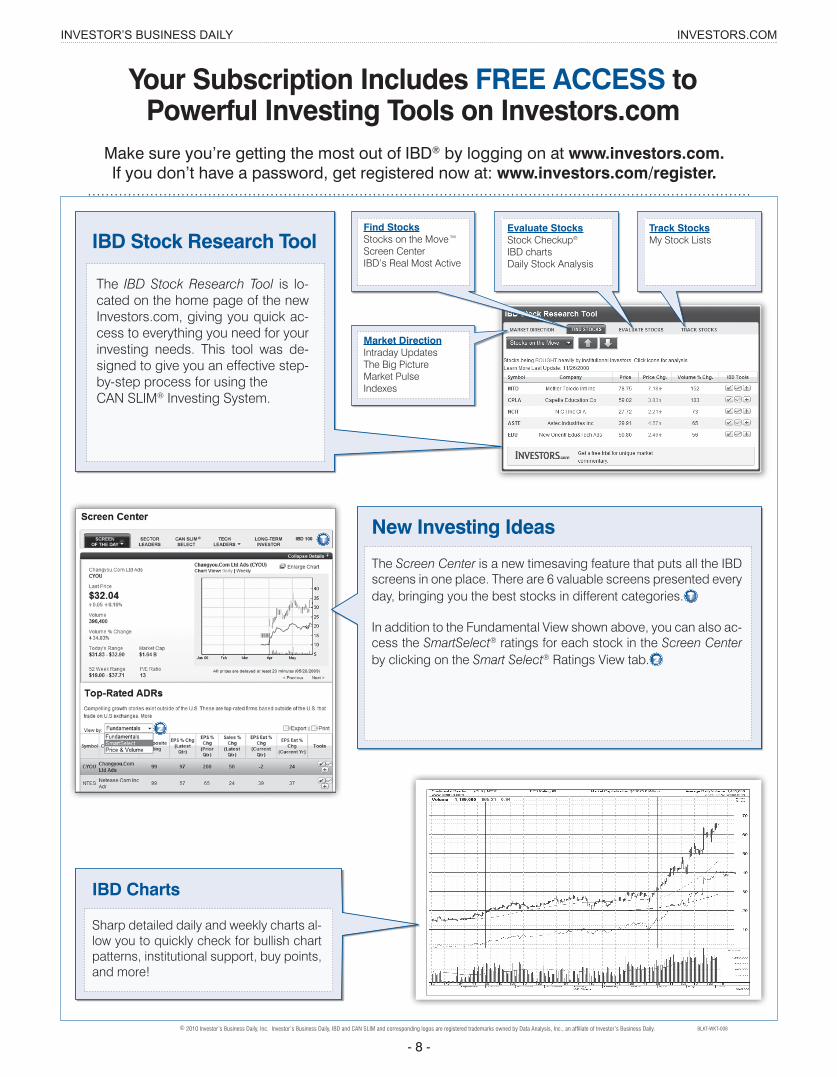
Your Subscription Includes FREE ACCESS to Powerful Investing Tools on Investors.com
Make sure you’re getting the most out of IBD® by logging on at www.investors.com. If you don’t have a password, get registered now at: www.investors.com/register.
. . . . . . . . . . . . . . . . . . . . . . . . . . . . . . . . . . . . . . . . . . . . . . . . . . . . . . . . . . . . . . . . . . . . . . . . . . . . . . . . . . . . . . . . . . . . . . . . . . . . . . . . . . . . . . . . . . . . . . . . . . . . . . . . . . . . . . . . . . . . . . . . . . . . .
Find Stocks Stocks on the Move™Screen Center IBD’s Real Most Active
Evaluate Stocks Stock Checkup®
IBD chartsDaily Stock Analysis
Track Stocks My Stock Lists
Market Direction Intraday UpdatesThe Big PictureMarket PulseIndexes
The IBD Stock Research Tool is lo-cated on the home page of the new Investors.com, giving you quick ac-cess to everything you need for your investing needs. This tool was de-signed to give you an effective step-by-step process for using the CAN SLIM® Investing System.
IBD Stock Research Tool
IBD Charts
Sharp detailed daily and weekly charts al-low you to quickly check for bullish chart patterns, institutional support, buy points, and more!
New Investing Ideas
The Screen Center is a new timesaving feature that puts all the IBD screens in one place. There are 6 valuable screens presented every day, bringing you the best stocks in different categories. 1
In addition to the Fundamental View shown above, you can also ac-cess the SmartSelect® ratings for each stock in the Screen Center by clicking on the Smart Select® Ratings View tab. 2
1
2