Embed Size (px)
Citation preview

1
Investors‟ Meet 2011
Mumbai24th March 2011

2
Disclaimer
Statements in this presentation may contain forward-looking information concerning Gujarat Gas
Company Limited (GGCL)’s strategy, operations, financial performance or condition, outlook,
growth opportunities or circumstances in the sectors or markets in which GGCL operates. By their
nature, forward-looking statements involve uncertainty because they depend on future
circumstances, and relate to events, not all of which are within GGCL's control or can be predicted
by GGCL. Although GGCL believes that the expectations reflected in such forward-looking
statements are reasonable, no assurance can be given that such expectations will prove to have
been correct. Actual results could differ materially from those set out in the forward-looking
statements. For a detailed analysis of the factors that may affect our business, financial
performance or results of operations, we urge you to look at the relevant article on Risk
Management included in GGCL’s Annual Report and Accounts 2009. Nothing in these results
should be construed as a profit forecast and no part of these results or this presentation
constitutes, or shall be taken to constitute, an invitation or inducement to invest in GGCL or any
other entity, and must not be relied upon in any way in connection with any investment decision.
GGCL undertakes no obligation to update or revise any forward-looking statements.

3
Agenda
Introduction
Business Profile
Performance HighlightsGrowth Opportunities
Regulation
Way Forward
People and Community

4
BG India footprint
Company Information
BG
India
BG
E&P
India
Ltd
• Panna-Mukta-Tapti (PMT) : Jointly Operated
Co-venturers :BG (30%), ONGC (40%), RIL(30%)
• Krishna Godavari Basin - Block KG-OSN-2004/1
(Exploration Block)
Co-venturers : BG (45%), ONGC (operator 55%)
• Mahanadi Basin - MN-DWN-2002/02
(Exploration Block)
Co-venturers : BG (25%), ONGC (operator 75%)
• Krishna Godavari Basin - KG-DWN-2009/1
(Exploration Block)
Co-venturers : BG 30% (Operator), ONGC (45%), OIL
(15%), APGIC (10%)
BGIES • LNG importers, Gas Aggregators ,Bulk Industrial,
Fertiliser, CGD operators, Power
GGCL • India’s largest private CGD company (by volumes)
• BG took over controlling stake (65.12%) in July 1997
MGL • India’s largest private CGD company (by customers)
• JV with GAIL (49.75% each), State Govt. (0.5%)
Integrated gas chain player
Source: BG Group Data Book 2010

5
Gujarat – where we operate
33%
21%9%
7%
6%
24%
Petroleum products Chemicals
Food & agro Textile & apparel
Basic & Metals Others
Industrial production• Remarkable and sustainable growth :
Average rate of growth: 10.4% in last
5 years
2nd most industrialised state in India
• 83 industrial clusters and estates
• 22% of total investment in India
• “Hydrocarbon capital” of India
Statewide gas grid under development,
large areas covered
Hosts both operating LNG terminals in
India
Landfall point for majority of gas in India
Second largest producer of onshore
natural gas
~48% of India’s installed refining capacity
Highest number of oil & gas fields in India
Source : Govt. of Gujarat

6
Gujarat Gas – strong business model
• Largest CGD in terms of volume*
• Multiple source portfolio
95% gas sourced at market determined prices
• Caters to multiple segments with different
applications and alternate fuels
• Operates in a highly industrialised and
energy intensive zone
• Easy access to rLNG : Proximity to
country’s two operational LNG terminals
• Strong capital efficiencies
• Opportunities for growth* As at 31st Dec 2010
Strong fundamentals for a successful business

7
Shareholders
65.12%
4.43%
5.14%
9.44%
15.87%
As on 31st Dec. 2010
Parent Company Holding (BGAPH)
Mutual Funds
Resident Individuals
Foreign Institutional Investors
Others
Market Capitalisation ~ Rs 50 Billion

8
Share price performance
Share price performance: CY 2010
• Average daily trading
volumes improved by over
65%
• Outperformed Sensex by
over 60%
• Increased dividend on
expanded capital
Regular : Rs. 4 per share
Special : Rs. 8 per share
Shareholders‟ value – growing consistently
80
100
120
140
160
180
200
Dec-09 Feb-10 Mar-10 Apr-10 Jun-10 Jul-10 Aug-10 Sep-10 Oct-10 Dec-10
GGAS Sensex
(Rebased to 100)

9
Agenda
Introduction
Business Profile
Performance HighlightsGrowth Opportunities
Regulation
Way Forward
People and Community

10
Key determinants for 2010
• Gas supply
Term rLNG contracted till December 2013
rLNG share increasing in portfolio (26% annual; 37% in Q4)
KG D6 gas on fall back basis – not available (despite allocation)
Supply levels sustained from other indigenous sources
Increase in APM gas price
• Increasing trend of gas cost
• Growth in Industrial retail and CNG segment ensured
17% growth in volumes
• Focused on growing high value markets
Procured additional rLNG volumes to deliver retail growth

11
Industrial segment – sustaining growth
• 83% by volume mix
• Strong retail demand
• Signed new contracts worth
350,000 scmd
• Revised prices in December
2010 by ~16%
• Segmentation to access high
value markets
• Crossed one billion scm of
retail sales in December 2010
Volume growth – CY 2010
08 09 10
20%
1005
839
783
in mmscm
Industrial customers dominate market portfolio

12
CNG segment – robust growth
08 09 10
18%
Growth in volume
08 09 10
24%
• Growth in conversion rate higher by ~30%
• Strong infrastructure growth; added 11 CNG retail outlets
• Price revisions; 8.3% in September ’10, and 8.6% in
January ’11
Growth in customers
122
104
91
in mmscm135
in „000
109
84
Fast growing segment

13
Highlights - Q4 2010
• Revenues up by 33%
• Volumes up by 13%
• Profits up by 78%
09 10
Topline growth
09 10
PAT growth
3,779
5,043 825
462
Rs. mn Rs. mn
09 10
Volume growth
274
309
mmscm

14
Highlights - 2010
• Topline grew by 31%
• Volumes increased by 17%
• PAT up by 48%
09 10
Topline growth
09 10
PAT growth
13,869
18,136 2590
1750
Rs. mn Rs. mn
Focus on value in an environment of increasing gas cost
09 10
Volume growth
1035
1212
mmscm
15
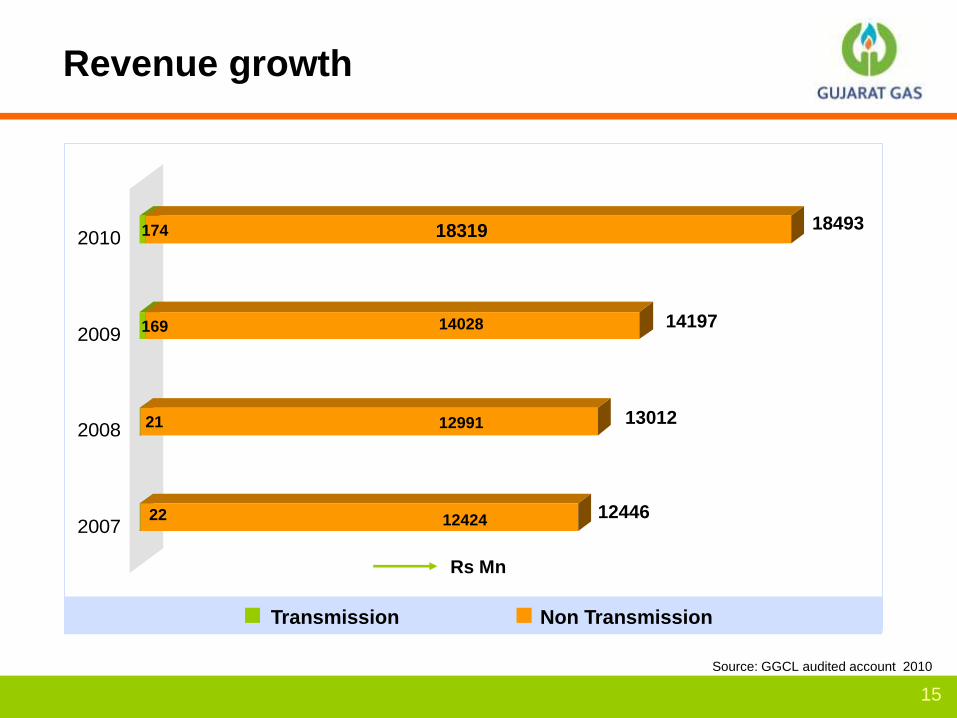
Revenue growth
2007
2008
2009
2010
Transmission Non Transmission
12446
13012
Source: GGCL audited account 2010
14197
1299121
1242422
14028169
Rs Mn
Transmission Non Transmission
18319174 18493

16
Capex
2007
2008
2009
2010
1553
1035
988
133
Rs Mn
1230190
797104 87
758222 55
1067183 719 165
Non Gas Capex Network Upgradation/Expansion CNG
Investing in network and CNG infrastructure
Source: GGCL audited account 2010

17
2007
2008
2009
2010
Transmission Non Transmission
Profit growth
2303
Rs Mn
2345
PBT
25862417169
232421
228122
Transmission Non Transmission
3833174 3659
Source: GGCL audited account 2010

18
Distribution volumes
2007
2008
2009
2010
Ind Ret CNG Dom/Com Bulk
mmscm
1196
1089
1035839 104 80 12
783 91 72 143
781 70 60 285
12121005 122 85
Sustainable growth in retail market
Ind. Retail CNG Domestic and Commercial Bulk
Source: GGCL audited account 2010

19
Agenda
Introduction
Growth Opportunities
Profile – Business
Performance HighlightsRegulation
Way Forward
People and Community
20
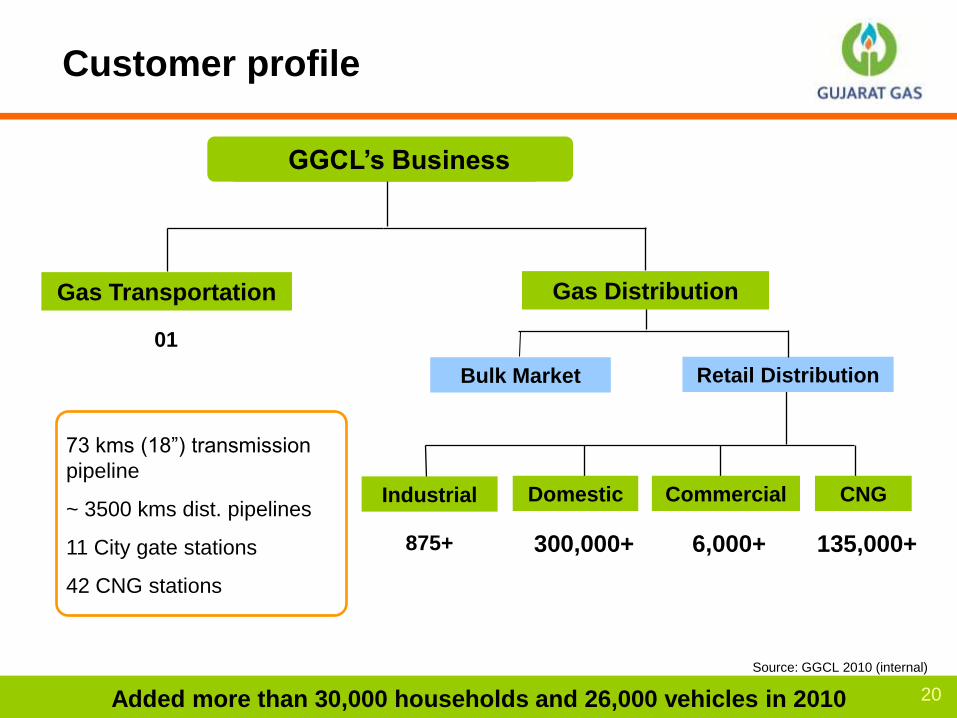
Customer profile
73 kms (18”) transmission
pipeline
~ 3500 kms dist. pipelines
11 City gate stations
42 CNG stations
135,000+
Industrial Domestic Commercial CNG
300,000+ 6,000+875+
GGCL‟s Business
Bulk Market Retail Distribution
Gas Transportation
01
Gas Distribution
GGCL‟s Business
Source: GGCL 2010 (internal)
Added more than 30,000 households and 26,000 vehicles in 2010

21
Sales mix
Year 2010
Industrial Retail
83%
Dom & Com
7%
CNG
10%
(81%)(8%)
(11%)
( %) – by realisationSource: GGCL 2010 (internal)

22
Year 2010
Gas sourcing mix
GAIL PMT
49%
GAIL APM
5%NIKO
5%
CAIRN
15%
rLNG
26%
While PMT is largest source, rLNG becoming significant
Source: GGCL 2010 (internal)

23
Profile of industrial customers
Increased share of LFR: up from 29% to 40%
CH
PL
FR
DF
Source: GGCL 2010 (internal)
CHP : Combined Heat and Power LFR : Liquid Fuel Replacement DF : Direct Firing
21%
40%
44%
19%
11%
8%
5%
6%6%
6%
39%
0%
25%
50%
75%
100%
Textile Chemical Glass & Ceramics Dye & Intermediate Pesticides Pharmaceuticals Others Total

24
Agenda
Introduction
Business Profile
Performance HighlightsGrowth Opportunities
Regulation
Way Forward
People and Community

25
Building a strong HR base
• Several Senior Management Team (SMT) members
deputed from BG Group
Succession plans in place for SMT
• Strong HSSE culture
• HR aligned to business strategy
Building capabilities and capacities
Promoting culture of execution and
meritocracy
People processes like performance and
development reviews aligned to BG Group
Focus on talent management to meet current and future business needs

26
Safety initiatives
• Leadership – driving safety
Site Safety Tours; engagement with employees/ contractors
• Competency / performance assurance
Safety Passport / Driving Passport
Pictograms – display and use at point of risk
Contractor performance appraisal and review
• Third party damage prevention – safer business
Utility coordination - enhanced interaction & awareness
GIS on wheels
• Step Forward for safety
Life Savers campaign – company wide
• Driving & road safety
IVMS / journey management
Vehicle specification / driver engagement
• CNG – RFID pilot project
• Improving living conditions of excavation labourers
Our Goal is “Zero Injuries”
RFID Tag

27
Social investments
Skill development project for unemployed tribal youths
• Two batches completed and employed
• Received BG Group Chairman’s award for the initiative
Environment education bus (Prakriti) :
• Focus on municipal run schools in rural areas
• 300,000 visitors and students covered so far
Surat Nature Park
Road safety campaign in schools –
• Nearly 10,000 children covered
Focus on sustainability of Education, Environment and Energy
28
Agenda
Introduction
Business Profile
Performance HighlightsGrowth Opportunities
Regulation
Way Forward
People and Community

29
Regulation
• Regulatory body PNGRB* set up in 2006
• MoPNG authorisation received for Surat, Bharuch and
Ankleshwar in 2008
• Authorisation applications filed with PNGRB awaiting
final award
For CGD network in districts of Surat and Bharuch
For Hazira-Ankleshwar transmission pipeline
• Interim permissions received from PNGRB to continue
construction in all operational areas
* Petroleum and Natural Gas Regulatory Board
High degree of engagement with the PNGRB

30
Agenda
Introduction
Business Profile
Performance HighlightsGrowth Opportunities
Regulation
Way Forward
People and Community

31
Strategy
• Grow high value
segments in retail
market
Moving up the
value chain
• Develop new
applications
• Grow CNG business
Management
Strategy
• Organic growth in
existing areas
• Geographic
expansion
Building
materiality
• Compliance
• Safety
• Working with
community/
stakeholders
Good Governance
32
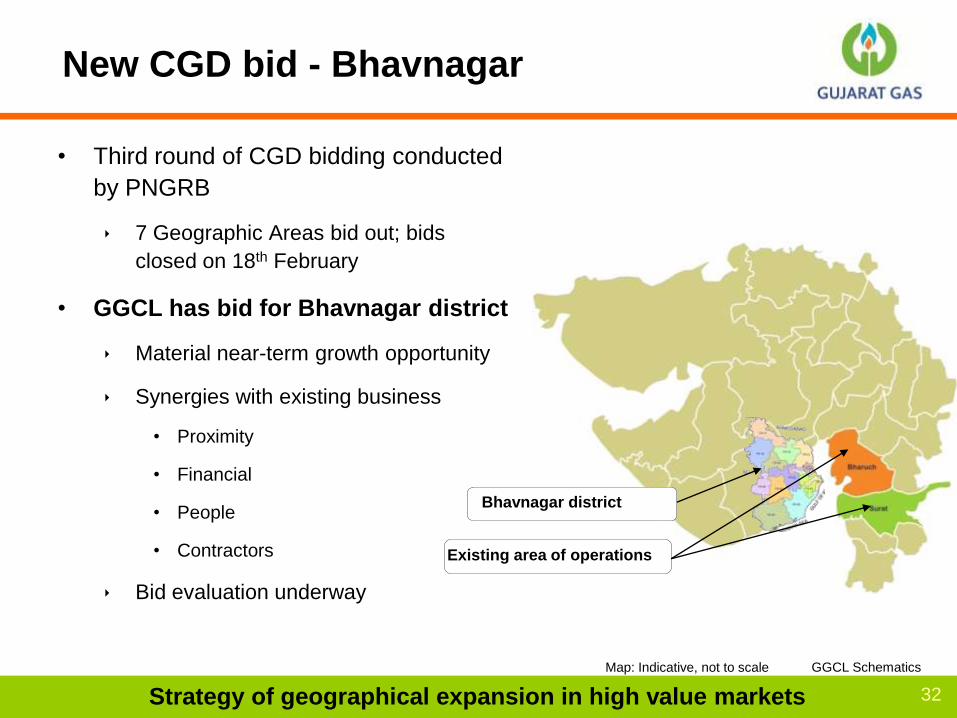
New CGD bid - Bhavnagar
• Third round of CGD bidding conducted
by PNGRB
7 Geographic Areas bid out; bids
closed on 18th February
• GGCL has bid for Bhavnagar district
Material near-term growth opportunity
Synergies with existing business
• Proximity
• Financial
• People
• Contractors
Bid evaluation underway
Strategy of geographical expansion in high value markets
Existing area of operations
Bhavnagar district
Map: Indicative, not to scale GGCL Schematics

33
Surat & Bharuch - profile
Source : Govt. of Gujarat, Indicus Analytics 2008
• Fast growing investment region contributes ~ 12% to State GDP
• Surat: India’s fastest growing city with growth rate of
11.5%
• Growth in vehicle population ~ 8%
• Large number of MOUs signed at Vibrant Gujarat Global
Investors’ Summit 2011 for investment in and around
Surat and Bharuch Districts
• Enhanced focus of state administration
A rapidly growing market

34
Gujarat – Special Investment Regions
Source :Govt. of GujaratMap: Indicative, not to scale
Investment regions (IR) :
• Bharuch-Dahej Investment Region : 8 SEZs,
10 Industrial parks and 16 Industrial estates
• Surat-Navsari Industrial Area
• Vadodara-Ankleshwar Investment Region : 3 SEZs,
4 Industrial parks and 13 industrial estates
PCPIR :
• Special Investment Region dedicated for investment
in petrochemical and petroleum projects
• Proximity to Bharuch
DMIC passes through the heart of GGCL‟s operations
DMIC – Global manufacturing & trading hub• 38% of DMIC passes through Gujarat
• Expected to triple industrial output in five years
4
4 Surat – Navsari Ind. Area
5
5 DMIC Influence Area
3
3 PCPIR
1
1 Vadodara – Ankleshwar Ind. Area
2
2 Bharuch – Dahej Ind. Areas

35
Opportunities
• Continue growth in existing areas
Leverage rapid industrialisation in south Gujarat to secure
additional industrial retail volumes
Capture CNG opportunities by increasing CNG infrastructure
Develop new gas based applications
• Pursue growth in new geographical areas
• Leverage BG Group’s global position in sourcing rLNG
supplies at competitive price
Well positioned for growth

36
Agenda
Introduction
Business Profile
Performance HighlightsGrowth Opportunities
Regulation
Way Forward
People and Community

37
Key challenges
• Gas sourcing
Challenges around additional indigenous supplies in the near
term
Contracting rLNG at competitive prices
• Increasing trend in gas cost due to demand supply gap
and global uncertainties
• Growth in a competitive scenario
• Capturing new geographic expansion opportunities
• Regulatory challenges
• Talent retention

38
Way forward
• rLNG to remain a significant portion of the sourcing
portfolio
• The trend of increasing gas costs is expected to continue
• Adopting a fresh pricing approach focusing high value
market segments
• Investments continue in existing and adjacent areas
• Bid for new area as part of a strategy of geographic
expansion
• Committed to high quality of customer service
• Committed to high standards of safety and asset integrity
To continuously build on leadership position

39
Thank you for
your attention


![0 h} 0...302.68329.89 ÿ h*_S0_0 _Sg } R)vÊ Ñ M ÿ Q ÿ ÿ ÿ ÿ 43.4645.83 o\W(h*_ ¿et_ ÿ h*_S0_0 _S g } R)vÊ Ñ M ÿ Q ÿ ÿ ÿ ÿ 40.1543.43 ê]ñ Çg,kÔs ÿ ÿ ÿ ÿ ÿ ÿ](https://img.pdfslide.us/doc/110x75/60ba50d9c1c28e561c44a1f7/0-h-0-3026832989-hs00-sg-rv-m-q-43464583.jpg)


![s [] ,,ÿ ffffÿ ÿ if f 'ÿ ÿ iÿ ,ÿ I, , I, , lÿ ÿ ÿ If ÿ Iÿ ...jetband.org/Music/2015 Show Music/standstunes-ThriftShop.pdf · Recbrded by MACKLEMORE 1st Trumpet THRIFT](https://img.pdfslide.us/doc/110x75/5f098cd27e708231d4275d2c/s-ffff-if-f-i-i-i-l-if-i-show-musicstandstunes-thriftshoppdf.jpg)