Embed Size (px)
Citation preview

Investor presentation
Mondi Group
May 2018

2
Mondi: Forward-looking statements disclaimer
This document includes forward-looking statements. All statements other than statements of historical facts included herein, inc luding, without limitation, those regarding Mondi’s financial position, business strategy, market
growth and developments, expectations of growth and profitability and plans and objectives of management for future operations, are forward-looking statements. Forward-looking statements are sometimes identified by the use
of forward-looking terminology such as “believe”, “expects”, “may”, “will”, “could”, “should”, “shall”, “risk”, “intends”, “estimates”, “aims”, “plans”, “predicts”, “continues”, “assumes”, “positioned” or “anticipates” or the negative
thereof, other variations thereon or comparable terminology. Such forward-looking statements involve known and unknown risks, uncertainties and other factors which may cause the actual results, performance or achievements
of Mondi, or industry results, to be materially different from any future results, performance or achievements expressed or implied by such forward-looking statements. Such forward-looking statements and other statements
contained in this document regarding matters that are not historical facts involve predictions and are based on numerous assumptions regarding Mondi’s present and future business strategies and the environment in which
Mondi will operate in the future. These forward-looking statements speak only as of the date on which they are made.
No assurance can be given that such future results will be achieved; various factors could cause actual future results, performance or events to differ materially from those described in these statements. Such factors include in
particular but without any limitation: (1) operating factors, such as continued success of manufacturing activities and the achievement of efficiencies therein, continued success of product development plans and targets, changes
in the degree of protection created by Mondi’s patents and other intellectual property rights and the availability of capital on acceptable terms; (2) industry conditions, such as strength of product demand, intensity of competition,
prevailing and future global market prices for Mondi’s products and raw materials and the pricing pressures thereto, financia l condition of the customers, suppliers and the competitors of Mondi and potential introduction of
competing products and technologies by competitors; and (3) general economic conditions, such as rates of economic growth in Mondi’s principal geographical markets or fluctuations of exchange rates and interest rates.
Mondi expressly disclaims
a) any warranty or liability as to accuracy or completeness of the information provided herein; and
b) any obligation or undertaking to review or confirm analysts’ expectations or estimates or to update any forward-looking statements to reflect any change in Mondi’s expectations or any events that occur or circumstances that
arise after the date of making any forward-looking statements,
unless required to do so by applicable law or any regulatory body applicable to Mondi, including the JSE Limited and the LSE.

3
Group overview
2017 Full year Group results highlights
Q1 2018 trading update and operational review
Appendices

4
Mondi at a glance
2017
Revenue1
&
ROCE
Products
26.3% 11.3% 10.4% 27.8%
€2,292m €2,055m €1,646m €1,832m
29%
1 Segment revenues, before elimination of inter-segment revenues
Packaging Paper Consumer Packaging Uncoated Fine Paper Fibre Packaging
26%
21%
24%

5
Consistent strategy delivering industry leading returns
699 767 957 981 1,018
10.8%
12.0%
14.0%14.7% 14.3%
0.0%
2.0%
4.0%
6.0%
8.0%
10.0%
12.0%
14.0%
16.0%
2013 2014 2015 2016 2017
Underlying operating profit margin
95.0 107.3 133.7 137.8 149.5
2013 2014 2015 2016 2017
CAGR 12%
Underlying operating profit and margin€ million
Underlying basic earnings per shareeuro cents per share
+

6
Strong cash flow generation
715 796 1,039 1,061 948
2013 2014 2015 2016 2017
€4.6 bn cash generated 2013–2017
Cash flow generation1
€ million
1 Cash flow generation based on net cash generated before capital expenditure, shareholder distributions, acquisitions and disposals

7
Reinvested for growth and distributed to shareholders
Five-year cumulative cash flow (2013–2017)€ billion
Invested in asset base
(2.6)
Cash flow generation Net spent on acquisitions
and disposals
Change in net debt
(0.5)
(0.4)
Distributed to shareholders
(1.1)
Support payment of
dividends to our
shareholders
Grow through selective
capital
investment opportunities
Maintain our strong and
stable financial position and
investment grade credit
metrics
Evaluate growth
opportunities through M&A
and/or increased
shareholder
distributions
4.6

8
Leading market positions
Please see sources and definitions at the end of this document
Consumer flexible
packaging
Europe
Uncoated fine
paper
Europe
Kraft paper
Global
Industrial
bags
Global
Virgin
containerboard
Europe
# 1 # 2 # 3
Corrugated
packaging
Emerging Europe
Uncoated fine
paper
South Africa
Containerboard
Emerging Europe
Commercial
release liner
Europe
Extrusion
coatings
Europe

9
Well positioned to leverage global industry growth trends
+2.4%
+11.6%
+7.9%
1 Source: IHS Markit, updated as of 1 March 2018
2 Emerging Europe and Russia
Mondi
revenue
2017 vs
20162
Emerging markets growth
Nominal €, 2016-2017E
Western
Europe
GDP1
Eastern
Europe
GDP1
Key global industry trends
Light-weighting Recyclable
Su
sta
ina
bilit
y
ConvenienceE-commerce
Rigid to flexibles

10
Creating sustainable value through our strategic framework

11
Driving performance along the entire value chain
Centralised
procurement
Rigorous quality
management
Entrepreneurial and dynamic culture
Lean processes Operational
excellence
Efficient logistics Commercial
excellence
Productivity (saleable output)Tonnes/employee, indexed
86
20172007
100
186
Culture of continuous improvement in all elements of value chain

12
Our cost advantaged operations
100% 73% 43% 100% 35% 37%
27% 57% 25% 40% 100%
32% 11%
8%12% 12%
Wh
ite
to
pkra
ftlin
er
Un
ble
ach
ed
kra
ftlin
er
Se
mi-ch
em
ica
lflu
ting
Re
cycle
dflu
ting
Un
ble
ach
ed
sa
ck
kra
ft p
aper
UF
P²
BH
KP
(p
ulp
)³
1 Delivered to Frankfurt except where noted 3 Delivered to Rotterdam Source: RISI (Q3 2017) and Mondi estimates2 Includes specialities 4 European capacity except white top kraftliner, unbleached sack kraft paper and BHKP (global)
Q4
Q3
Q2
Q1
Cost quartile1,4
%
13
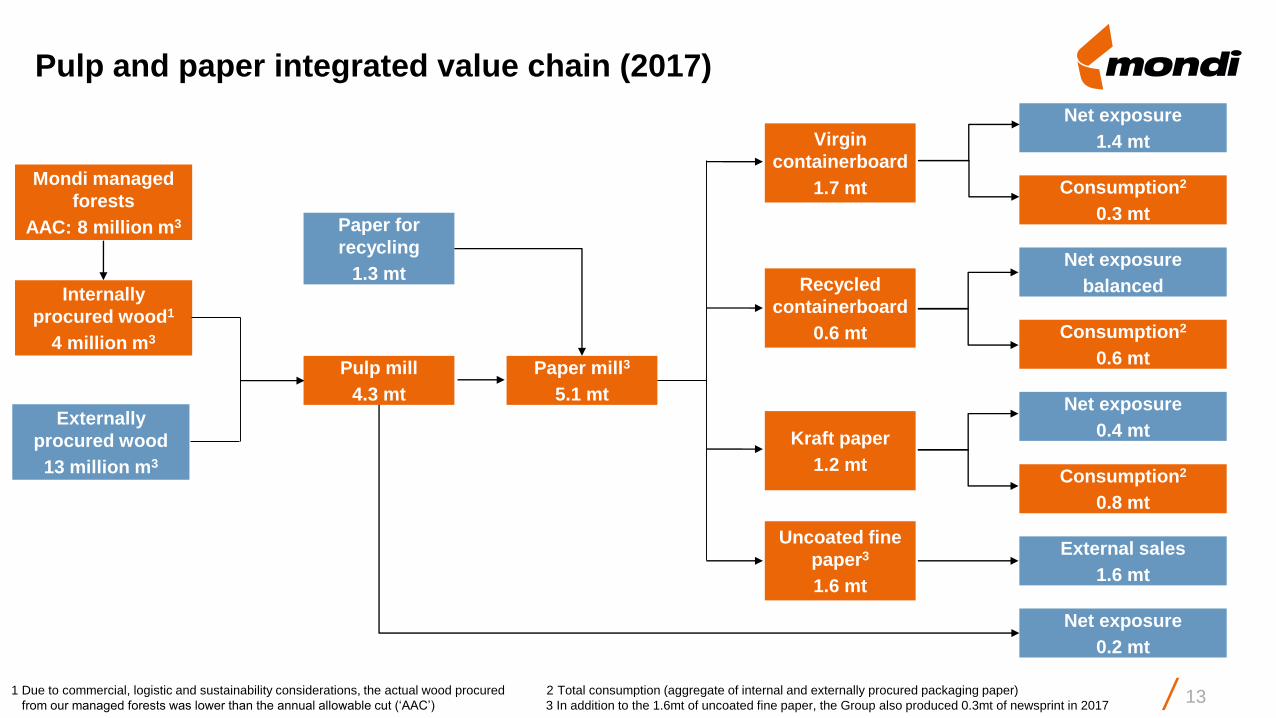
Pulp and paper integrated value chain (2017)
Net exposure
1.4 mt
Consumption2
0.3 mt
Net exposure
balanced
Consumption2
0.6 mt
Net exposure
0.4 mt
Consumption2
0.8 mt
External sales
1.6 mt
Net exposure
0.2 mt
Virgin
containerboard
1.7 mt
Paper for
recycling
1.3 mt
Mondi managed
forests
AAC: 8 million m3
Recycled
containerboard
0.6 mt
Kraft paper
1.2 mt
Uncoated fine
paper3
1.6 mt
Paper mill3
5.1 mt
Pulp mill
4.3 mt
Externally
procured wood
13 million m3
Internally
procured wood1
4 million m3
1 Due to commercial, logistic and sustainability considerations, the actual wood procured 2 Total consumption (aggregate of internal and externally procured packaging paper)
from our managed forests was lower than the annual allowable cut (‘AAC’) 3 In addition to the 1.6mt of uncoated fine paper, the Group also produced 0.3mt of newsprint in 2017

14
405 562 595 465 611
113%
159% 164%
124%
147%
0%
20%
40%
60%
80%
100%
120%
140%
160%
180%
0
100
200
300
400
500
600
700
800
900
2013 2014 2015 2016 2017 2018E 2019E
Capex and investment in intangible assets as a % ofdepreciation, amortisation and impairments
Continued investment in our world class asset base
€7
00
-€
80
0 m
illi
on
€7
00
-€
80
0 m
illi
on
Capital expenditure€ million
€770 million
committed to major
capital projects
(2013 – 2016)
● Strong contribution from major capital projects
○ €175 million of incremental operating profit over
the last four years, including €25 million in 2017
○ €15 million expected in 2018
● Capital expenditure expected to be in the range of
€700 - €800 million per annum in 2018 and 2019:
○ Štětí modernisation and woodyard upgrade
(€335 million and €41 million)
○ Ružomberok new kraft top white machine and
related pulp mill upgrade (€310 million)
○ Debottlenecking at Syktyvkar as part of our plan to
increase saleable production by around 100 ktpa
○ Targeted expansionary investments in
Fibre Packaging and Consumer Packaging
Key projects expected to increase current saleable
pulp and paper production by around 9% when in full
operation
+
Over €750 million
approved major capital
expenditure projects
(2017+)
15
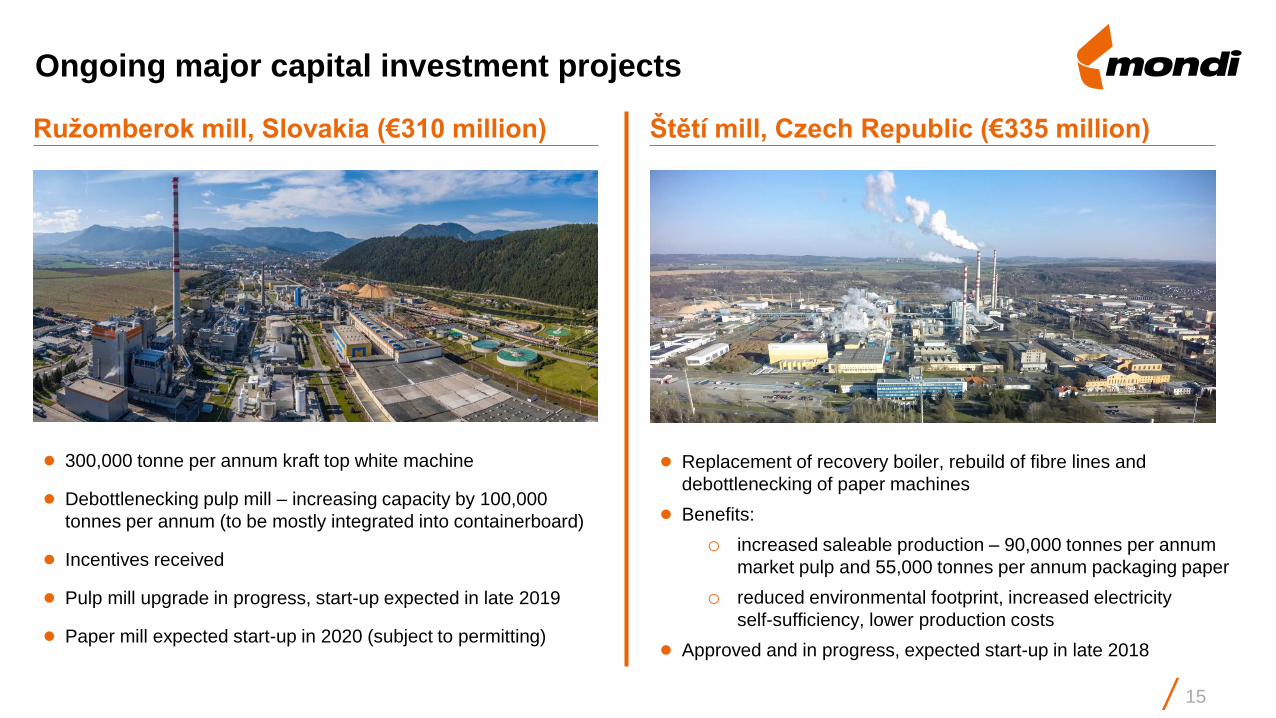
Ongoing major capital investment projects
● Replacement of recovery boiler, rebuild of fibre lines and
debottlenecking of paper machines
● Benefits:
o increased saleable production – 90,000 tonnes per annum
market pulp and 55,000 tonnes per annum packaging paper
o reduced environmental footprint, increased electricity
self-sufficiency, lower production costs
● Approved and in progress, expected start-up in late 2018
● 300,000 tonne per annum kraft top white machine
● Debottlenecking pulp mill – increasing capacity by 100,000
tonnes per annum (to be mostly integrated into containerboard)
● Incentives received
● Pulp mill upgrade in progress, start-up expected in late 2019
● Paper mill expected start-up in 2020 (subject to permitting)
Ružomberok mill, Slovakia (€310 million) Štětí mill, Czech Republic (€335 million)

16
With an integrated approach to sustainable development
Looking ahead to 2020: 16 commitments across 10 action areas
Our Growing
Responsibly
model
Employee and contractor safety
● Avoid work-related fatalities
● Prevent life-altering injuries
● Reduce TRCR by 5% against 2015
A skilled and committed workforce
● Engage with our people to create a better
workplace
Fairness and diversity in the workplace
● Promote fair working conditions in the
workplace
Sustainable fibre
● Maintain 100% FSC™ certification of our forests
and promote sustainable forest management
● Procure a minimum of 70% of wood from FSC
or PEFC™ certified sources with the balance
meeting our company minimum wood standard
Climate change
● By 2030, reduce specific CO2e emissions by
15% against 2014¹
Solutions that create value for our customers
● Encourage sustainable, responsibly produced
products
Relationships with communities
● Enhance social value to our communities through
effective stakeholder engagement and meaningful
social investments
Supplier conduct and responsible procurement
● Encourage supply chain transparency and promote
fair working conditions together with our key suppliers
Biodiversity and ecosystems
● Promote ecosystem stewardship in the landscapes
where we operate through continued multi-
stakeholder collaboration
Constrained resources and environmental
impacts
● By 2020, reduce against 2015:
○ specific contact water consumption (5%)1
○ specific waste to landfill (7.5%)
○ specific NOx emissions (7.5%)1
○ specific effluent load (COD) (5%)
1 From our pulp and paper mills

17
● Dedicated resources driving innovation
○ €23 million on R&D in 2017
○ 6 R&D centres
● Close co-operation with customers, universities and research partners
Continued innovation with our customers
Simple Sphere Courier Express Packaging –
e-commerce paper bag
Sustainable solution
CornerPack
- Efficient and sustainable, light-weight
packaging solution
- Enables faster packaging process with
decreased logistic costs
- Flexible, yet strong and durable
- Responding to consumers’ demand for
convenience in snacks on-the-go
- Easy-to-use parallel semi-circular openings
- Highly intuitive scoring line giving full control
over the size of the opening
- Replaces wooden crates used to transport
car bonnets from Sweden to China
- Collaboration with Scandinavian partner
aPak AB
- Heavy-duty cardboard packaging offering
shorter assembly and dismantling times
- Environmentally friendly alternative

18
Our cash flow priorities remain unchanged
Free cash flow
priorities
As appropriate
Maintain our strong and stable financial position
and investment grade credit metrics
Support payment of dividends to our shareholders
Evaluate growth opportunities through M&A and/or
increased shareholder distributions
Grow through selective capital
investment opportunities

19
Robust financial position 1
,61
9
1,6
13
1,4
98
1,3
83
1,3
26
1.5x 1.4x
1.1x1.0x 0.9x
(1.2)
(0.7)
(0.2)
0.3
0.8
1.3
1.8
2.3
2.8
0
200
400
600
800
1,000
1,200
1,400
1,600
1,800
2013 2014 2015 2016 2017
Net debt Net debt / underlying EBITDA
● Key financial policy
○ Retain Investment Grade credit
rating
● Current ratings:
○ Moody’s Investors Service at Baa1
(stable outlook)
○ Standard & Poor’s at BBB+
(stable outlook)
+
Net debt and net debt / underlying EBITDA€ million

20
2.6x 2.6x 2.6x 2.4x 2.4x
20
30
40
50
60
70
80
90
100
110
2013 2014 2015 2016 2017 2017special
dividend¹Ordinary dividend cover (times)
Continued growth in shareholder returns
Ordinary dividend
CAGR: 15%
36
42
52
57
Dividendseuro cents per share
+
● 2-3x ordinary dividend policy across the cycle
● The Boards regularly review the Group’s capital
allocation priorities to optimise value accretive
growth and long-term returns for shareholders
- Given our strong balance sheet position and
confidence in the Group’s ongoing cash
generating capacity, the Boards
recommended a 2017 special dividend of
100 euro cents per share
62
100
1 Special dividend of 100 euro cents per share in addition to ordinary dividend

21
Group overview
2017 Full year Group results highlights
Q1 2018 trading update and operational review
Appendices

22
699 767 957 981 1,018
15.3%17.2%
20.5% 20.3% 19.7%
0.0%
5.0%
10.0%
15.0%
20.0%
2013 2014 2015 2016 2017
ROCE (%)
● Robust financial performance
○ Revenue up 7% and underlying EBITDA up 6%
○ Underlying operating profit up 4%
○ Underlying basic earnings per share up 8%
● Over €750 million of approved major capital expenditure
projects in progress, securing a strong growth pipeline
● Acquisitions totalling over €400 million completed or
announced, expanding our product offering to better serve
customers
● Delivered against our 2020 Growing Responsibly model
commitments and renewed our WWF partnership
95.0 107.3 133.7 137.8 149.5
2013 2014 2015 2016 2017
Highlights
Robust financial performance
Underlying operating profit and ROCE€ million
Underlying basic earnings per shareeuro cents per share
+

23
Sustainable development highlights 2017

24
Group overview
2017 Full year Group results highlights
Q1 2018 trading update and operational review
Appendices

25
Trading update Q1 2018 - Overview
● €295 million underlying operating profit for the first quarter of 2018, up 15% on prior year and up 6% sequentially1
● Higher average selling prices and profit improvement initiatives across the Group more than offset higher operating costs,
the impact of maintenance shuts and negative currency effects
● Making good progress on previously announced major capital investment projects at our Štětí (Czech Republic),
Ružomberok (Slovakia) and Syktyvkar (Russia) mills and smaller expansionary projects at a number of our packaging
operations. Technical challenges remain in the ramp-up of the rebuilt paper and inline coating machine at Štětí
● In April 2018, issued a 1.625% €600 million Eurobond with an 8-year term thereby extending the Group’s maturity profile
and ensuring strong liquidity
● Standard & Poor’s upgraded the Group’s credit rating to BBB+ (stable outlook) from BBB, while we retained our Baa1
(stable outlook) credit rating by Moody’s Investors Service
● Outlook
“Our outlook for the business remains positive. We continue to experience a strong pricing environment in a number of our
key product segments, supported by good demand growth, although we do continue to see inflationary cost pressures
across the Group and currencies are currently a headwind. With our robust business model, clear customer focus and
culture of driving performance, we remain confident of sustaining our track record of delivering value accretive growth.”
1 Based on 2017 restated underlying operating profit

26
341 375 423 397 482
22.3%24.3%
25.9%23.1%
26.3%
16.0%17.9% 19.1% 18.9%
21.0%
2013 2014 2015 2016 2017
ROCE Underlying operating profit margin
FY 2017
● Strong performance with underlying operating profit up 21%
○ Driven by higher average selling prices and sales volume
growth in higher value added products
○ Partly offset by higher costs and negative currency effects
Q1 2018
Containerboard
● Markets remain robust – good demand and limited capacity
additions continue to support pricing
● Volumes up due to timing of maintenance shuts and ramp-up of
production from expansionary projects completed in 2017
Kraft paper
● Sack kraft paper market remains tight, supported by good demand
and constrained supply growth
● Sack kraft paper sales volumes were up while selling prices were
higher following price increases implemented in all markets from
the beginning of 2018
● In April 2018, we signed an agreement to sell our flat sack kraft
paper mill in Pine Bluff, Arkansas (USA) (130 ktpa capacity)
Packaging Paper
Packaging Paper | Fibre Packaging | Consumer Packaging | Uncoated Fine Paper
Underlying operating profit, margin and ROCE€ million
+
0.7
0.8
0.9
1.0
1.1
1.2
1.3
2013 2014 2015 2016 2017
VCB RCB Kraft paper
Production volumesVolumes indexed to 2013

27
FY 2017
Corrugated Packaging
● Strong organic volume growth of 6%
● Good progress in implementing price increases to compensate
significantly higher paper costs
Industrial Bags
● Volume growth of 2%, margins under pressure in the second half
● Strong cost management and continued restructuring initiatives to
optimise plant network
Q1 2018
Corrugated Packaging
● Good progress made in recovering paper price increases - efforts ongoing
● Volumes flat on a very strong comparable prior year period and pricing discipline
Industrial Bags
● Good volume growth particularly in emerging Europe and the
Middle East
● 2018 annual contracts finalised - price increases implemented
largely reflecting full cost base impact of paper price increases that
took effect from the beginning of the year
Fibre Packaging
Packaging Paper | Fibre Packaging | Consumer Packaging | Uncoated Fine Paper
+
Underlying operating profit, margin and ROCE€ million
0.9
1.0
1.1
1.2
1.3
2013 2014 2015 2016 2017
Corrugated packaging Industrial bags
Production volumesVolumes indexed to 2013
86 102 120 123 111
11.8%
13.4% 13.9% 13.5%
11.3%
5.1% 5.5% 5.9% 6.4%5.4%
2013 2014 2015 2016 2017
ROCE Underlying operating profit margin

28
FY 2017
● Underlying operating profit increased 9% on 2016
● Benefiting from improved product mix, one-off gains and
positive contribution from acquisitions
● Partly offset by lower like-for-like sales, higher fixed costs
and negative currency effects
● Programme launched to restructure the cost base and align
capacity to current market requirements
● Joined Ellen MacArthur Foundation’s New Plastics Economy
Initiative
Q1 2018
● Benefited from ongoing initiatives to improve product mix
and the restructuring programme launched in 2017
● Near term performance continued to be held back by
declining volumes in personal care components and general
challenging trading conditions
● Consultation process initiated in April 2018 to cease
production at our consumer goods packaging plant in
Scunthorpe (UK) while continuing to serve our customers
from our other plants
Consumer Packaging
Packaging Paper | Fibre Packaging | Consumer Packaging | Uncoated Fine Paper
+79 96 108 121 132
8.7%
10.4% 10.7% 10.5% 10.4%
5.6%7.0% 7.4% 7.7% 8.0%
2013 2014 2015 2016 2017
ROCE Underlying operating profit margin
Underlying operating profit, margin and ROCE€ million

29
FY 2017
● Strong performance – underlying operating profit of
€331 million and ROCE of 27.8%
● Higher average selling prices achieved on stable volumes
and focus on driving performance mitigating effects of lower
fair value gain on forestry assets and higher cash costs
● Newsprint production ceased at Merebank mill (South Africa)
at the end of 2017
Q1 2018
● Strong performance, although benefit of higher selling prices
more than offset by:
○ ongoing cost pressures
○ extended maintenance shut at our Richards Bay mill
○ a lower forestry fair value gain
● Price increases implemented from the end of March 2018 on
our UFP range as a result of continued cost pressures
● Expect a lower forestry fair value gain in 2018 based on
current prevailing timber export prices and strength of the
South African rand
Uncoated Fine Paper
Packaging Paper | Fibre Packaging | Consumer Packaging | Uncoated Fine Paper
+224 227 341 375 331
15.0%17.0%
27.0%32.3%
27.8%
12.2% 13.2%
19.3%21.8%
18.1%
2013 2014 2015 2016 2017
ROCE Underlying operating profit margin
Underlying operating profit, margin and ROCE€ million
1,000
1,200
1,400
1,600
1,800
2,000
2013 2014 2015 2016 2017
‘000
to
nn
es
Uncoated fine paper (UFP) Net market pulp
VolumesUFP production volumes / net market pulp

30
Group overview
2017 Full year Group results highlights
Q1 2018 trading update and operational review
Appendices

31
Strong global presence
Revenue by location of customer%
Revenue by location of production%
+
22%
38%10%
6%
11%
13% Emerging Europe
Western Europe
Russia
South Africa
North America
Other
Product mix%
Net operating assets by location%
33%
36%
13%
9%
8%1%
Emerging Europe
Western Europe
Russia
South Africa
North America
Other
39%
30%
11%
13%
5% 2%Emerging Europe
Western Europe
Russia
South Africa
North America
Other
51%
22%
18%
9% Consumer-relatedpackaging
Industrial packaging
Uncoated fine paper
Other
1 Comprises containerboard, corrugated packaging and consumer packaging
1

32
Lebedyan
(Corrugated)
Strong track record of acquisitions
€1.6 billion invested in acquisitions since 2012
2015 2016
SIMET
(Corrugated)
Intercell
(Industrial Bags)
Ṥwiecie
minorities
(Containerboard)
Kalenobel
(Consumer
Packaging)
Ascania
(Consumer
Packaging)
Graphic
Packaging plants
(Kraft Paper &
Industrial Bags)
2014
2 Duropack
plants
(Corrugated)
2012
Nordenia(Consumer
Packaging)
KSP
(Consumer
Packaging)
Uralplastic
(Consumer
Packaging)
Packaging Paper Fibre Packaging Consumer Packaging
2017
Excelsior
Technologies
(Consumer
Packaging)

33
Acquisitions in progress – completion expected in Q2 2018
Powerflute
● Signed agreement to acquire 100% interest for a total consideration of
€365 million on a debt and cash-free basis in December 2017
● Integrated pulp and paper mill in Kuopio (Finland) with an annual production
capacity of 285,000 tonnes of high-performance semi-chemical fluting
● Production sold to a diverse range of customers, primarily for packaging
fresh fruit and vegetables, but also other end-uses such as electronics,
chemicals and pharmaceuticals
● Around half of the company’s production is sold in Europe, while the
remainder is exported globally
Egyptian industrial bags plants
● In April 2018, signed an agreement to acquire an industrial bags plant near Cairo
(Egypt) for a total consideration of €24 million on a debt and cash-free basis
● In December 2017, signed an agreement to acquire a control position in
another plant near Cairo
● Acquisitions further expand our production network in the fast growing
Middle East region

34
Technical guidance
2018 guidance
(unless specified)
IFRS 16 – leases (early adopted from 2018)
Total assets increase 2 – 3%1
Net debt increase 12 – 19%1
Underlying EBITDA increase 2 – 3%1
Underlying operating profit increase Marginal1
ROCE decrease 0.4 – 0.5 points1
Capital expenditure range in 2018 and 2019 (per annum) €700 – 800 million
Depreciation and amortisation (excluding acquisitions) €440 – 470 million2
Estimated impact of maintenance shuts ± €115 million
Working capital as a % of turnover 12 – 14%
Effective tax rate 20 – 22%
1 Estimated impact on key metrics if applied to 2017 results2 Includes IFRS 16 (leases) potential impact

35
Production volumes
2017 2016
%
change
Packaging Paper
Containerboard '000 tonnes 2,297 2,253 2%
Kraft paper '000 tonnes 1,206 1,204 -
Softwood pulp '000 tonnes 2,010 1,976 2%
Hardwood pulp '000 tonnes 547 500 9%
Fibre Packaging
Corrugated board and boxes million m2 1,650 1,448 14%
Industrial bags million units 4,952 4,881 1%
Extrusion coatings million m2 1,281 1,249 3%
Consumer Packaging million m2 7,437 7,156 4%
Uncoated Fine Paper
Uncoated fine paper '000 tonnes 1,644 1,666 (1%)
Softwood pulp '000 tonnes 375 375 -
Hardwood pulp '000 tonnes 1,345 1,319 2%
Newsprint '000 tonnes 277 313 (12%)

36
Market position sources and definitions
Europe – Europe including Russia and Turkey
Emerging Europe – Albania, Armenia, Azerbaijan, Belarus, Bosnia and Herzegovina, Bulgaria, Croatia, Cyprus, Czech Republic, Estonia, Georgia, Hungary,
Latvia, Lithuania, Macedonia, Malta, Moldova, Montenegro, Poland, Romania, Serbia, Slovakia, Slovenia, Turkey, Ukraine
North America – Canada, Mexico, USA
Virgin containerboard (Europe) and Containerboard (emerging Europe) based on capacity – Source: RISI European Paper Packaging Capacity Report and Mondi
estimates
Kraft paper (Global) based on capacity – Source: RISI European Paper Packaging Capacity Report, RISI Mill Asset Database, Pöyry Smart Terminal Service and
Mondi estimates
Corrugated packaging (emerging Europe) based on production – Source: Henry Poole Consulting and Mondi estimates
Industrial bags (Global) based on sales volume – Source: Eurosac, Freedonia World Industrial Bags 2016 study and Mondi estimates
Extrusion coatings (Europe) based on sales volumes – Source: AWA Extrusion Coated Materials European Market Study and Mondi estimates
Consumer flexible packaging Europe based on sales – Source: PCI Wood Mackenzie – Flexible Packaging, European Supply/Demand report, 2017
Commercial release liner (Europe) based on sales volumes – Source: AWA European Release Liner Market Study and Mondi estimates
Uncoated Fine Paper (Europe) based on sales volumes (Ilim JV considered separate from IP) – Source: Euro-Graph delivery statistics, EMGE Woodfree
Forecast, EMGE World Graphic Papers, RISI Mill Asset Database, Eastconsult and Mondi estimates
Uncoated Fine Paper (South Africa) based on Mondi estimates
Mondi region definitions
Sources for market position estimates