Embed Size (px)
Citation preview
The 2010 Red List of Finnish species: the assessment work in practice
Ilpo Mannerkoski Finnish Environment Institute
Syktyvkar 29.9.-4.10.2014

Contents
•IUCN-categories
•Criteria
•National applications
•Work in practice
•Documentation
•Data
•Problems
Mannerkoski, I., Ryttäri, T. (toim.) 2007. Eliölajien uhanalaisuuden arviointi: maailman luonnonsuojeluliiton (IUCN) ohjeet. Helsinki, Suomen ympäristökeskus. 143 s. Ympäristöopas.
Guidebook for red-listing of organisms in Finland – the IUCN Guidelines
In Finnish, contains also the original text of IUCN 2001, 2003
Finnish manual for the assessment

IUCN categories
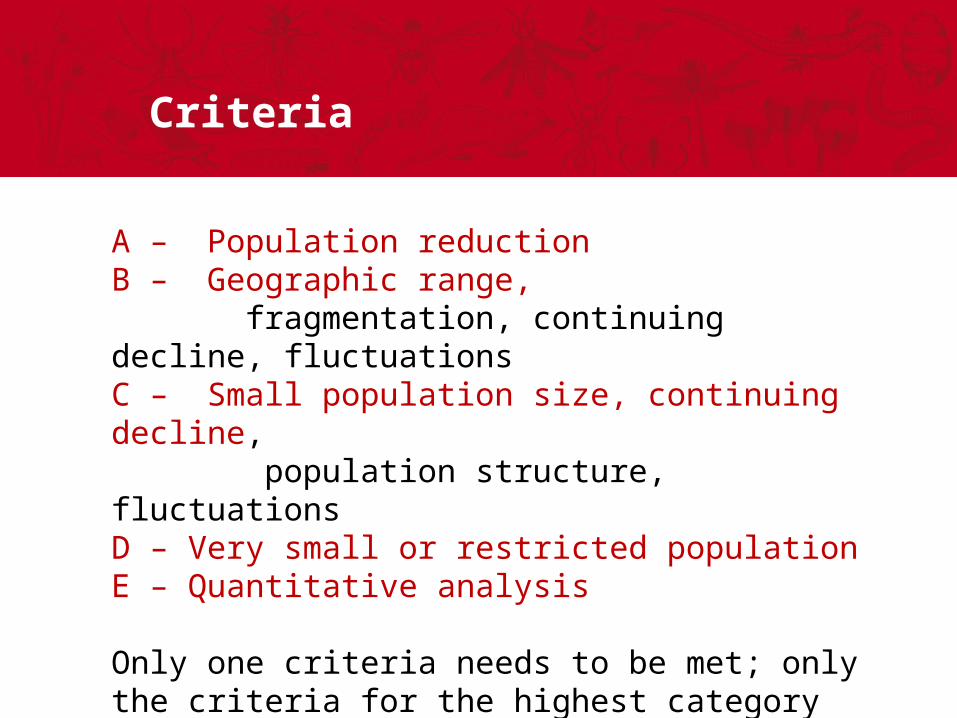
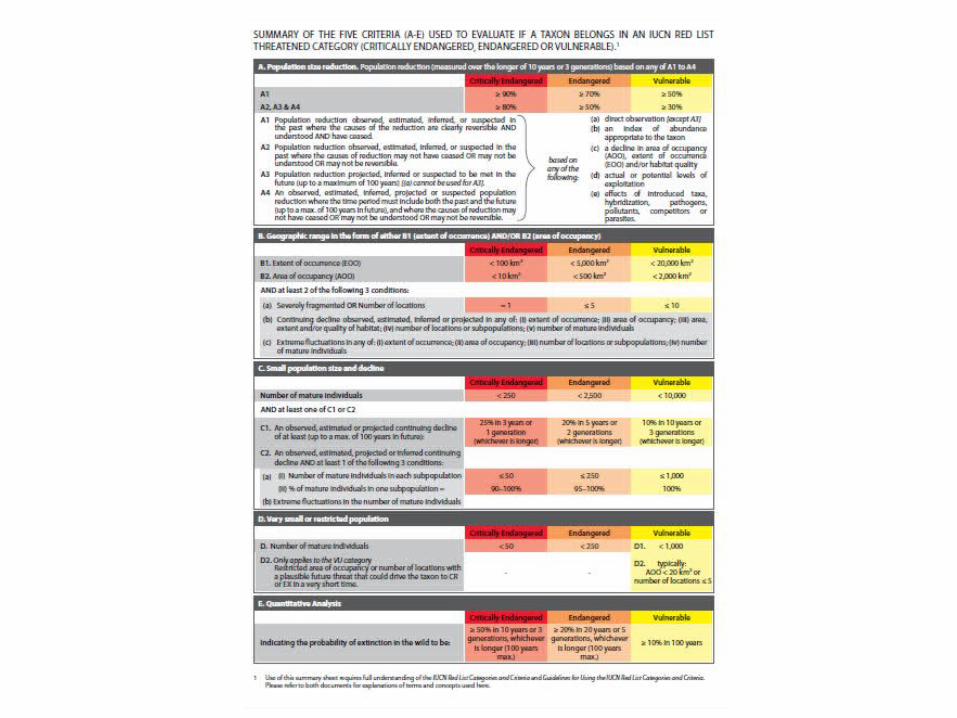
A – Population reductionB – Geographic range, fragmentation, continuing decline, fluctuationsC – Small population size, continuing decline, population structure, fluctuationsD – Very small or restricted population E – Quantitative analysis
Only one criteria needs to be met; only the criteria for the highest category met should be listed CR A2cd; B2ab(i,ii,iii); C2a(i)
Criteria

Changes in criteria after year 2000
•A two new subcriteria, changed limit values
•B one new level of hierarchy
•C minor changes
•D, no national application of D2 used
No changes in criteria after 2010

A1
A2
A3
A4
10 yrs/3 generations
New time windowsin Criteria A
Today
If the causes behind the decline are reversible AND known AND have ceased.
Old A1
Old A2
90%, 70%, 50%
80%, 50%, 30%
80%, 50%, 30%
80%, 50%, 30%
New time windows and reduction percentages in Criteria A
National applications
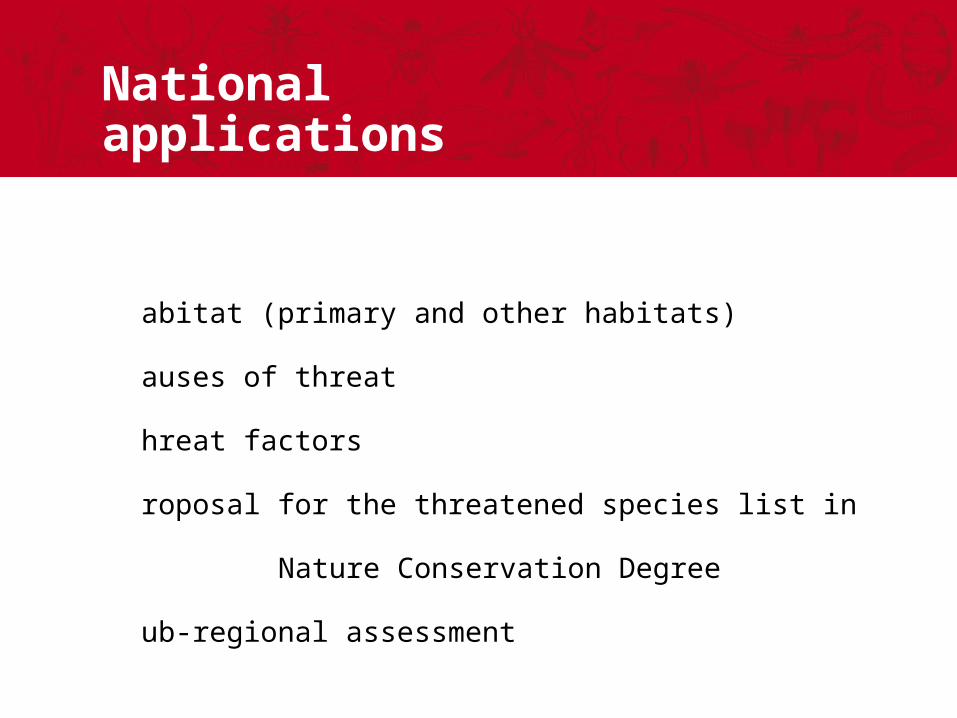
•H
abitat (primary and other habitats)•C
auses of threat•T
hreat factors•P
roposal for the threatened species list in
Nature Conservation Degree•S
ub-regional assessment
Work was done
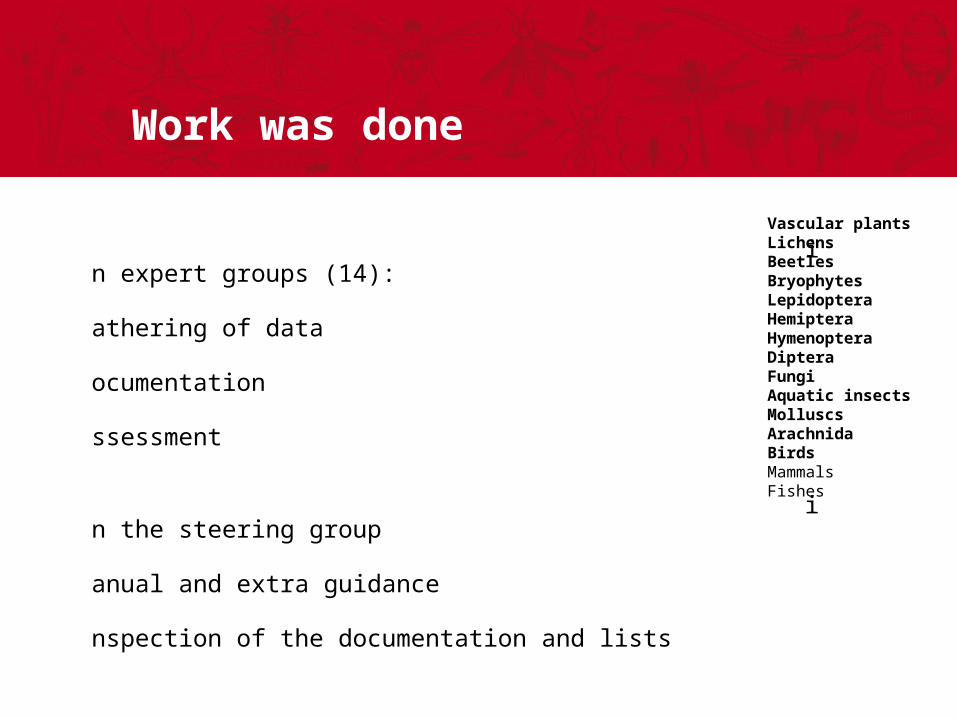
in expert groups (14):
•gathering of data
•documentation
•assessment
in the steering group
•manual and extra guidance
•inspection of the documentation and lists
Vascular plants Lichens Beetles Bryophytes Lepidoptera Hemiptera Hymenoptera Diptera Fungi Aquatic insects Molluscs Arachnida Birds Mammals Fishes

Documentation
• Things required by IUCN• Some national additions
• Distribution• Habitat (primary and other habitats)• Causes of threat• Threat factors• Comment fields on occurrence, habitats, etc. relevant for the assessment• Regional status (RT) (not all species groups)
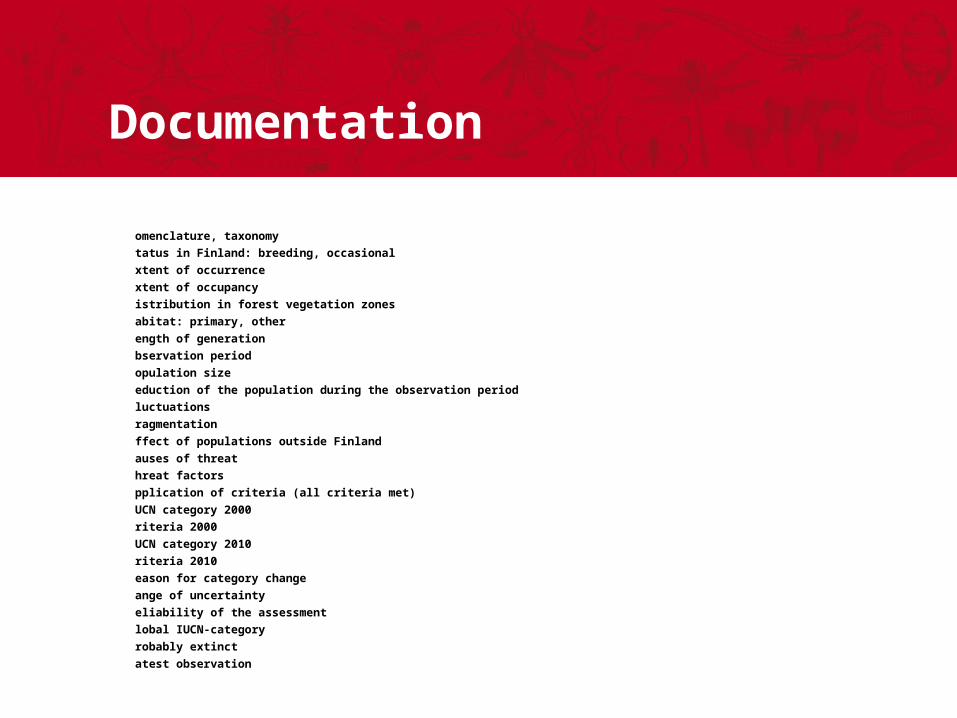
Documentation
•Nomenclature, taxonomy•Status in Finland: breeding, occasional•Extent of occurrence•Extent of occupancy•Distribution in forest vegetation zones•Habitat: primary, other•Length of generation•Observation period•Population size•Reduction of the population during the observation period•Fluctuations•Fragmentation•Effect of populations outside Finland•Causes of threat•Threat factors•Application of criteria (all criteria met)•IUCN category 2000•Criteria 2000•IUCN category 2010•Criteria 2010•Reason for category change•Range of uncertainty •Reliability of the assessment•Global IUCN-category•Probably extinct•Latest observation

Examples of habitat classification and causes of threat
• Checklists maintained mostly by expert groups
• Databases maintained by expert groups• Databases maintained by authorities and museums• Published data
• Assessment of threatened habitat types in Finland (published 2008) included 368 habitat types and supported the assessment of species
Data used in assessment

Research programme of deficiently known and threatened forest species 2003-2007 (PUTTE)books and other publications
Data: research, books

• Threatened species database (part of Environmental Information System HERTTA ), 118 000 observation sites
• Databases of Finnish Museum of Natural History (Hatikka, Kastikka, Bird Atlas, Plant Atlas)
• Tiira (BirdfLife), birds 3 670 000 observations (now 11,5 million)
• Databases of expert groups (Hemiptera 160 000, Coleoptera > 600 000, etc.)
• Insect Database (Lepidoptera 900 000, Diptera 87 000)
• Monitoring databases for butterflies and moths
Data, databases
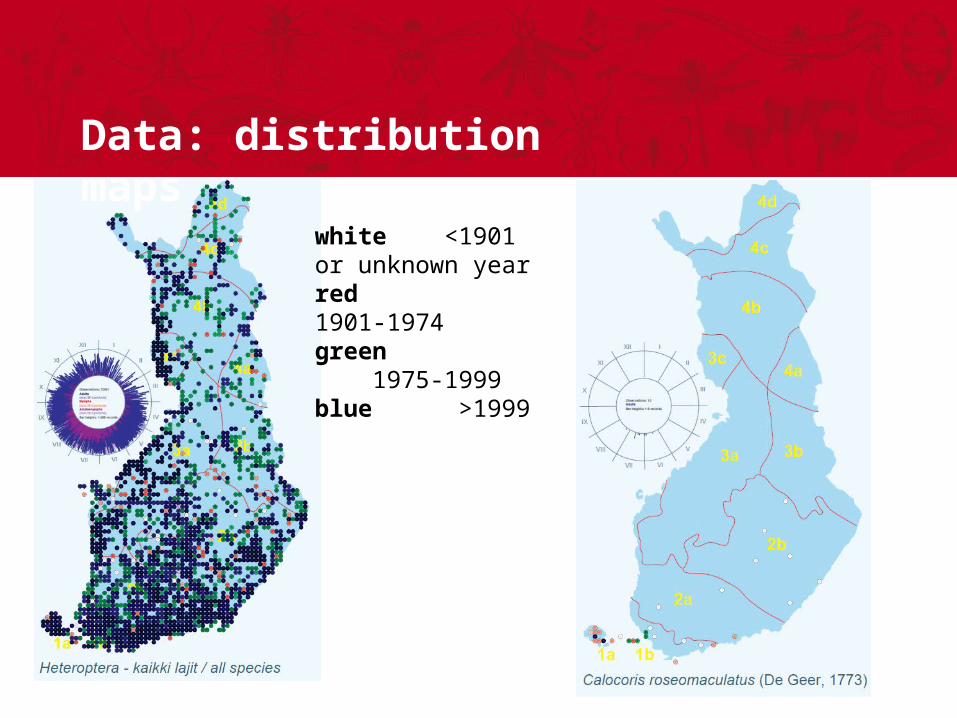
white <1901 or unknown yearred 1901-1974green 1975-1999blue >1999
Data: distribution maps

Problems
• Shortage of information• Complexity of the criteria
• Keeping the schedule• Shortage of resources• High proportion of volunteer work• High number of assessors (eg. different views in interpretation of data, collaboration)• Laborious documentation in species-rich groups• Last minute corrections etc.• No common database for observation data
Thank you!