Embed Size (px)
Citation preview
JUNE 2019
INVESTOR PRESENTATIONBUILDING A TOP 10 GLOBAL RESTAURANT BRAND
FORWARD-LOOKING STATEMENTS
This presentation contains forward-looking statements that are subject to risks and uncertainties.
All statements other than statements of historical fact or relating to present facts or current
conditions included in this presentation are forward-looking statements. Forward-looking statements
give Wingstop Inc.’s (the “Company”) current expectations and projections relating to its financial
condition, results of operations, plans, objectives, future performance and business. You can identify
forward-looking statements by the fact that they do not relate strictly to historical or current facts.
These statements may include words such as “anticipates,” “believes,” “continues,” “estimates,”
“expects,” “goal,” “objectives” “intends,” “may,” “opportunity,” “plans,” “potential,” “near-term,”
“long-term,” “projections,” “assumptions,” “projects,” “guidance,” “forecasts,” “outlook,” “target,”
“trends,” “should,” “could,” “would,” “will” and similar expressions and terms of similar meaning in
connection with any discussion of the timing or nature of future operating or financial performance or
other events.
The forward-looking statements contained in this presentation are based on assumptions that the
Company has made in light of its industry experience and perceptions of historical trends, current
conditions, expected future developments and other factors it believes are appropriate under the
circumstances. As you read and consider this presentation, you should understand that these
statements are not guarantees of performance or results. They involve risks, uncertainties (many
of which are beyond the Company’s control) and assumptions. Although the Company believes
that these forward-looking statements are based on reasonable assumptions, you should be
aware that many factors could affect its actual operating and financial performance and cause its
performance to differ materially from the performance anticipated in the forward-looking
statements. The Company believes these factors include, but are not limited to, those described
under the sections “Risk Factors” and “Management’s Discussion and Analysis of Financial
Condition and Results of Operations” in its Annual Report on Form 10-K and subsequent periodic
reports filed with the Securities and Exchange Commission (the “SEC”). Should one or more of
these risks or uncertainties materialize, or should any of these assumptions prove incorrect, the
Company’s actual operating and financial performance may vary in material respects from the
performance projected in these forward-looking statements.
Any forward-looking statement made by the Company in this presentation speaks only as of the
date on which it is made. Factors or events that could cause the Company’s actual operating and
financial performance to differ may emerge from time to time, and it is not possible for the
Company to predict all of them. The Company undertakes no obligation to publicly update any
forward-looking statement, whether as a result of new information, future developments or
otherwise, except as may be required by law.
NON-GAAP FINANCIAL MEASURES
This presentation contains certain non-GAAP financial measures. A “non-GAAP financial
measure” is defined as a numerical measure of a company’s financial performance that excludes
or includes amounts so as to be different than the most directly comparable measure calculated
and presented in accordance with GAAP in the statements of income, balance sheets or
statements of cash flow of the company. The Company has provided a reconciliation of Adjusted
EBITDA, a non-GAAP financial measure, to net income in the Appendix to this presentation.
Adjusted EBITDA is presented because management believes that such financial measure, when
viewed with the Company’s results of operations presented in accordance with GAAP and the
reconciliation of Adjusted EBITDA to net income, provides additional information to investors
about certain material non-cash items and about unusual items that the Company does not expect
to continue at the same level in the future. Adjusted EBITDA is used by investors as a
supplemental measure to evaluate the overall operating performance of companies in the
Company’s industry, but you should not consider it in isolation, or as a substitute for analysis of
results as reported in accordance with GAAP. The Company’s calculation of Adjusted EBITDA
may not be comparable to that reported by other companies. For additional information about the
Company’s non-GAAP financial measures, see the Company’s filings with the SEC.
FORWARD-LOOKING STATEMENTS
Wingstop Investor Presentation1
Corporate Overview2
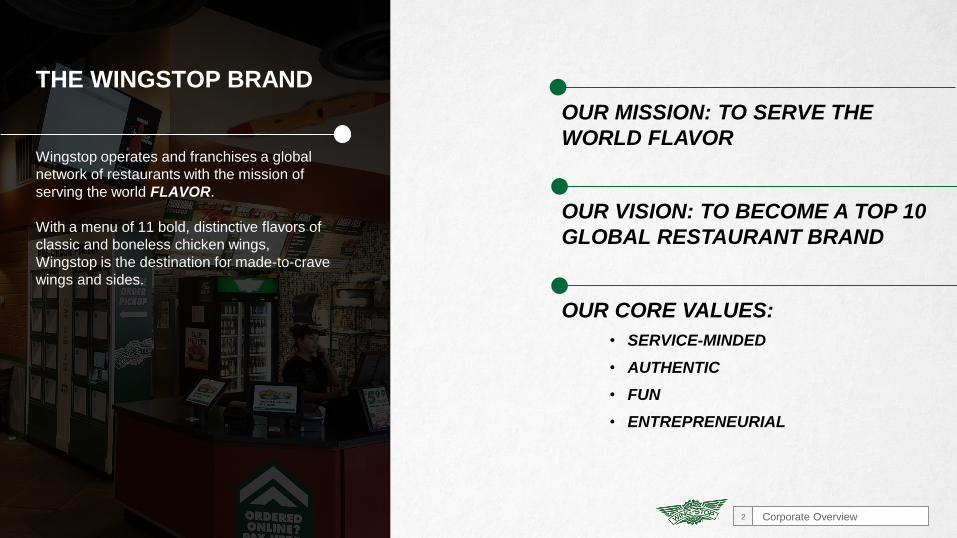
OUR MISSION: TO SERVE THE
WORLD FLAVOR
OUR VISION: TO BECOME A TOP 10
GLOBAL RESTAURANT BRAND
OUR CORE VALUES:
• SERVICE-MINDED
• AUTHENTIC
• FUN
• ENTREPRENEURIAL
THE WINGSTOP BRAND
Wingstop operates and franchises a global
network of restaurants with the mission of
serving the world FLAVOR.
With a menu of 11 bold, distinctive flavors of
classic and boneless chicken wings,
Wingstop is the destination for made-to-crave
wings and sides.
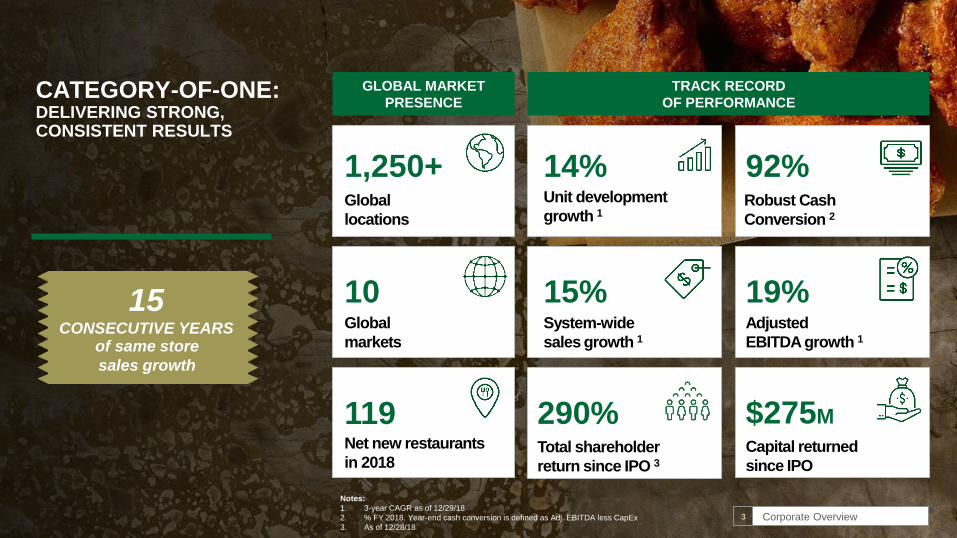
CATEGORY-OF-ONE: DELIVERING STRONG, CONSISTENT RESULTS
Notes:
1. 3-year CAGR as of 12/29/18
2. % FY 2018. Year-end cash conversion is defined as Adj. EBITDA less CapEx
3. As of 12/28/18
GLOBAL MARKET
PRESENCE
1,250+Global
locations
Corporate Overview3
10Global
markets
119Net new restaurants
in 2018
TRACK RECORD
OF PERFORMANCE
14%Unit development
growth 1
15%System-wide
sales growth 1
Capital returned
since IPO
$275M
19%Adjusted
EBITDA growth 1
92%Robust Cash
Conversion 2
Total shareholder
return since IPO 3
290%
15 CONSECUTIVE YEARS
of same store
sales growth
Corporate Overview4
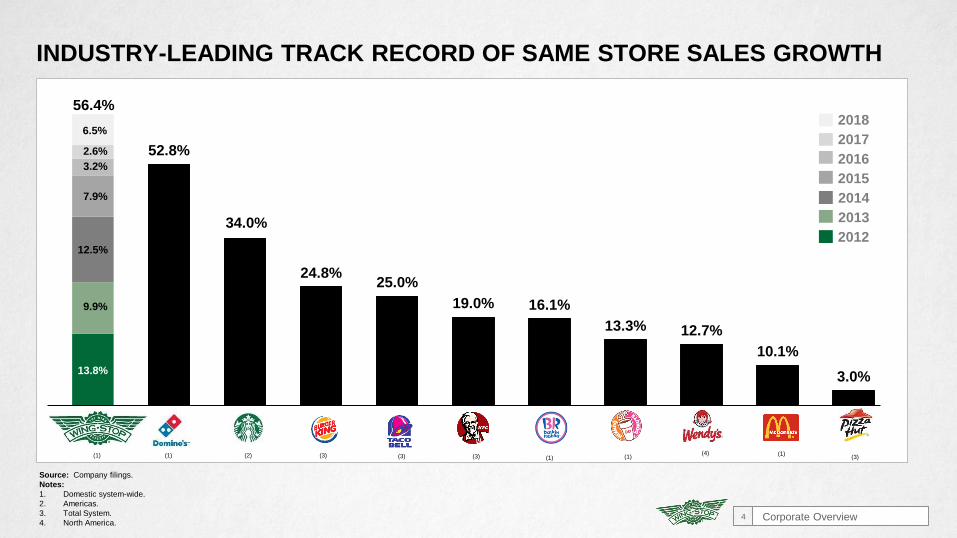
INDUSTRY-LEADING TRACK RECORD OF SAME STORE SALES GROWTH
13.8%
9.9%
12.5%
7.9%
3.2%
2.6%
56.4%
52.8%
34.0%
24.8%25.0%
19.0% 16.1%
13.3% 12.7%
10.1%
3.0%
Source: Company filings.
Notes:
1. Domestic system-wide.
2. Americas.
3. Total System.
4. North America.
2014
2013
2012
2015
2016
2017
(1) (1)(3) (1)(1)(3)(4)(3)(1) (2) (3)
20186.5%
Long-term Growth Strategy5
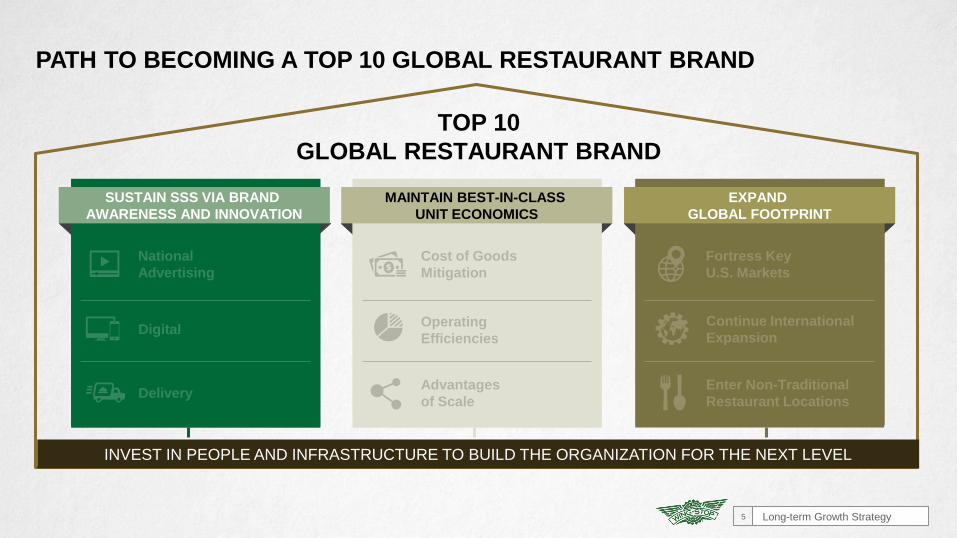
INVEST IN PEOPLE AND INFRASTRUCTURE TO BUILD THE ORGANIZATION FOR THE NEXT LEVEL
PATH TO BECOMING A TOP 10 GLOBAL RESTAURANT BRAND
National
Advertising
Digital
Delivery
Cost of Goods
Mitigation
Operating
Efficiencies
Advantages
of Scale
Fortress Key
U.S. Markets
Continue International
Expansion
Enter Non-Traditional
Restaurant Locations
SUSTAIN SSS VIA BRAND
AWARENESS AND INNOVATION
MAINTAIN BEST-IN-CLASS
UNIT ECONOMICS
EXPAND
GLOBAL FOOTPRINT
TOP 10
GLOBAL RESTAURANT BRAND
Brand Awareness & Innovation6
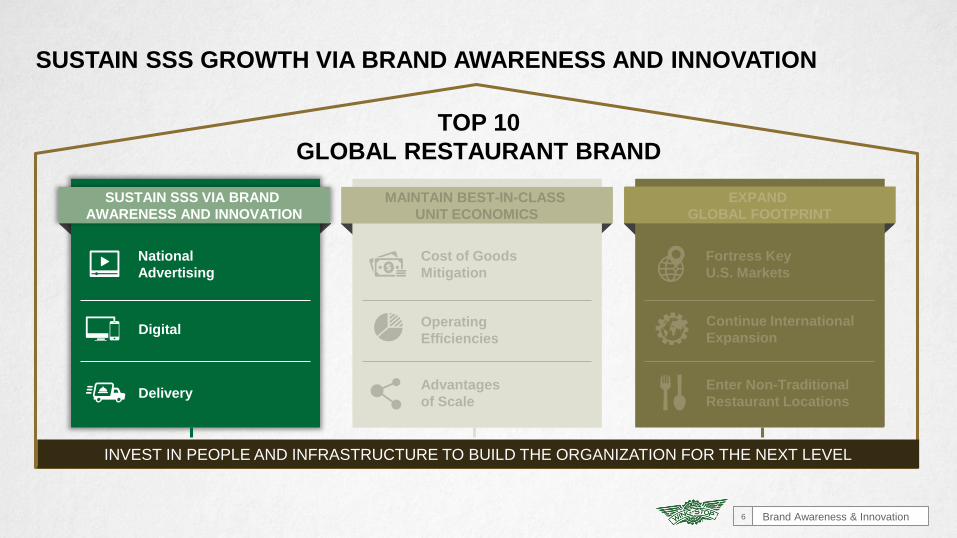
SUSTAIN SSS GROWTH VIA BRAND AWARENESS AND INNOVATION
INVEST IN PEOPLE AND INFRASTRUCTURE TO BUILD THE ORGANIZATION FOR THE NEXT LEVEL
National
Advertising
Digital
Delivery
Cost of Goods
Mitigation
Operating
Efficiencies
Advantages
of Scale
Fortress Key
U.S. Markets
Continue International
Expansion
Enter Non-Traditional
Restaurant Locations
SUSTAIN SSS VIA BRAND
AWARENESS AND INNOVATION
MAINTAIN BEST-IN-CLASS
UNIT ECONOMICS
EXPAND
GLOBAL FOOTPRINT
TOP 10
GLOBAL RESTAURANT BRAND
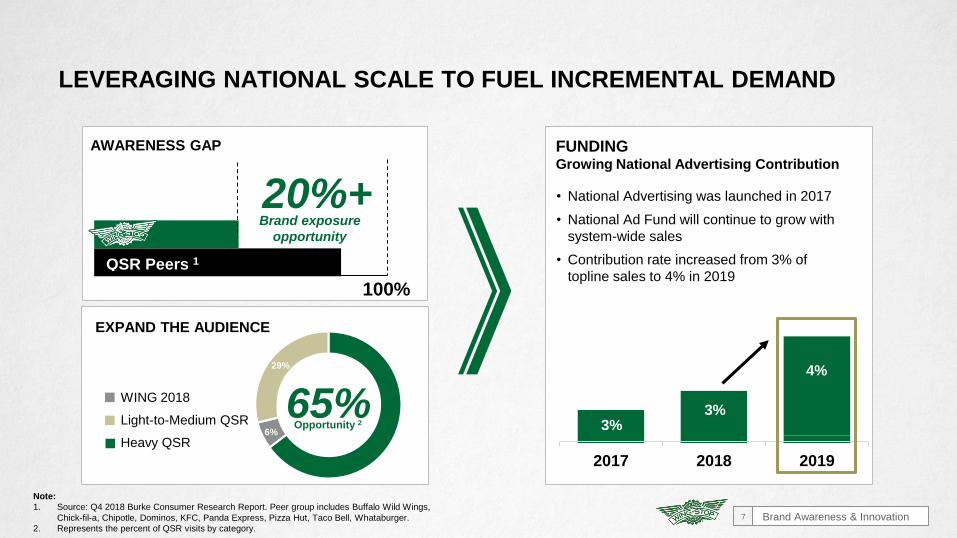
6%
29%
2017 2018 2019
FUNDING Growing National Advertising Contribution
• National Advertising was launched in 2017
• National Ad Fund will continue to grow with
system-wide sales
• Contribution rate increased from 3% of
topline sales to 4% in 2019
AWARENESS GAP
QSR Peers 1
Note:
1. Source: Q4 2018 Burke Consumer Research Report. Peer group includes Buffalo Wild Wings,
Chick-fil-a, Chipotle, Dominos, KFC, Panda Express, Pizza Hut, Taco Bell, Whataburger.
2. Represents the percent of QSR visits by category.
Brand exposure
opportunity
20%+
LEVERAGING NATIONAL SCALE TO FUEL INCREMENTAL DEMAND
Brand Awareness & Innovation7
3% 3%
4%
65%Opportunity 2
EXPAND THE AUDIENCE
100%
WING 2018
Light-to-Medium QSR
Heavy QSR
Brand Awareness & Innovation8
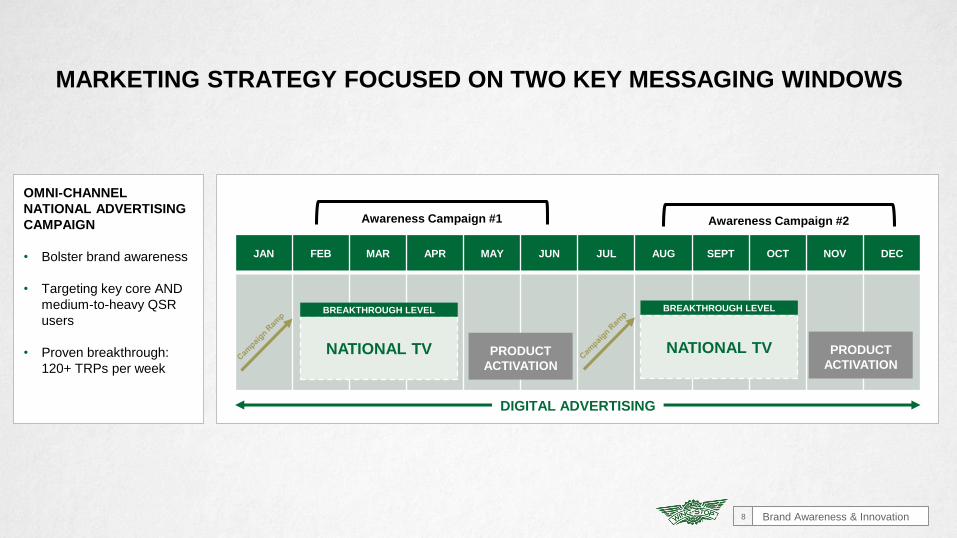
JAN FEB MAR APR MAY JUN JUL AUG SEPT OCT NOV DEC
Awareness Campaign #2
PRODUCT
ACTIVATION
Awareness Campaign #1
OMNI-CHANNEL
NATIONAL ADVERTISING
CAMPAIGN
• Bolster brand awareness
• Targeting key core AND
medium-to-heavy QSR
users
• Proven breakthrough:
120+ TRPs per week
NATIONAL TV PRODUCT
ACTIVATION
NATIONAL TV
DIGITAL ADVERTISING
BREAKTHROUGH LEVEL BREAKTHROUGH LEVEL
MARKETING STRATEGY FOCUSED ON TWO KEY MESSAGING WINDOWS
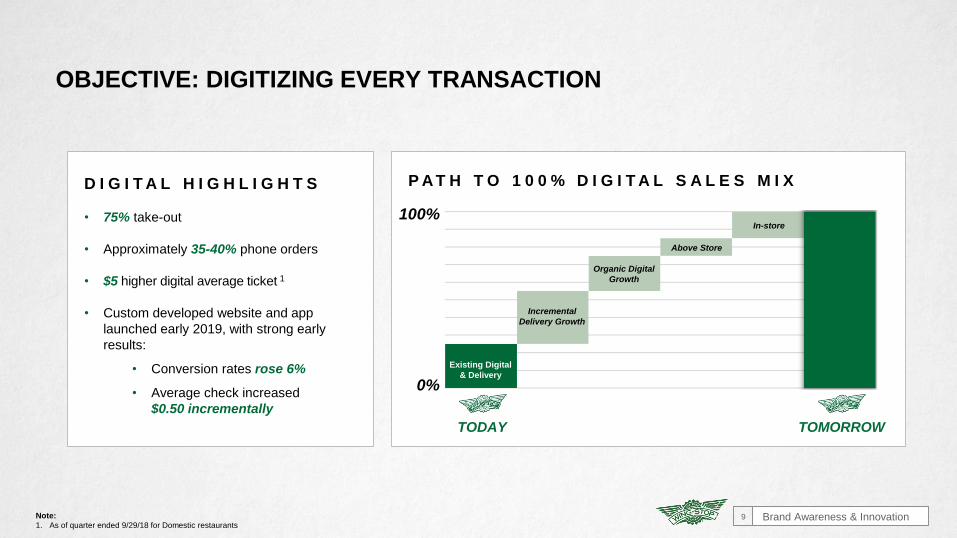
D I G I T A L H I G H L I G H T S
• 75% take-out
• Approximately 35-40% phone orders
• $5 higher digital average ticket 1
• Custom developed website and app
launched early 2019, with strong early
results:
• Conversion rates rose 6%
• Average check increased
$0.50 incrementally
Note:
1. As of quarter ended 9/29/18 for Domestic restaurants
OBJECTIVE: DIGITIZING EVERY TRANSACTION
Brand Awareness & Innovation9
Existing Digital
& Delivery
Incremental
Delivery Growth
Organic Digital
Growth
Above Store
In-store100%
0%
TODAY TOMORROW
P A T H T O 1 0 0 % D I G I T A L S A L E S M I X
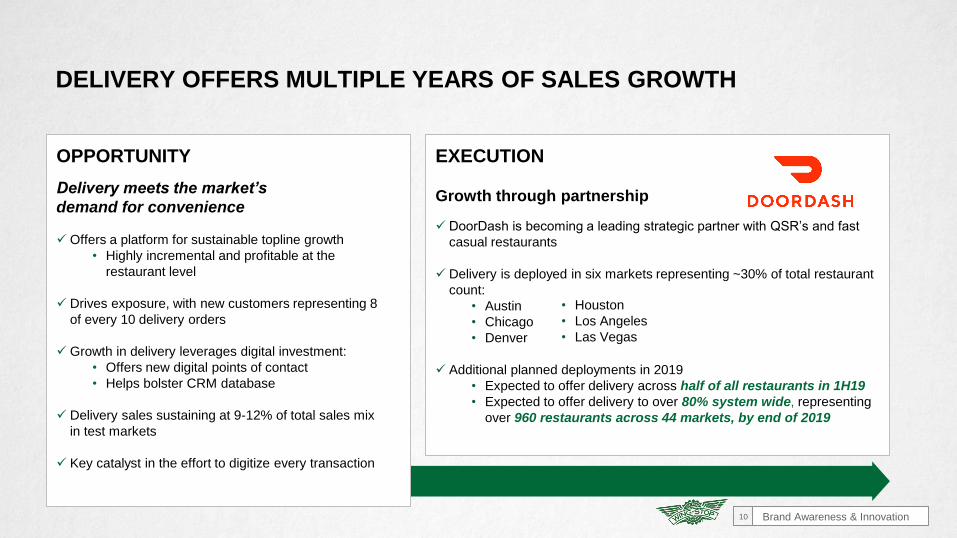
DELIVERY OFFERS MULTIPLE YEARS OF SALES GROWTH
EXECUTION
Growth through partnership
DoorDash is becoming a leading strategic partner with QSR’s and fast
casual restaurants
Delivery is deployed in six markets representing ~30% of total restaurant
count:
• Austin
• Chicago
• Denver
Additional planned deployments in 2019
• Expected to offer delivery across half of all restaurants in 1H19
• Expected to offer delivery to over 80% system wide, representing
over 960 restaurants across 44 markets, by end of 2019
OPPORTUNITY
Delivery meets the market’s
demand for convenience
Offers a platform for sustainable topline growth
• Highly incremental and profitable at the
restaurant level
Drives exposure, with new customers representing 8
of every 10 delivery orders
Growth in delivery leverages digital investment:
• Offers new digital points of contact
• Helps bolster CRM database
Delivery sales sustaining at 9-12% of total sales mix
in test markets
Key catalyst in the effort to digitize every transaction
Brand Awareness & Innovation10
• Houston
• Los Angeles
• Las Vegas
Best-in-Class Unit Economics11
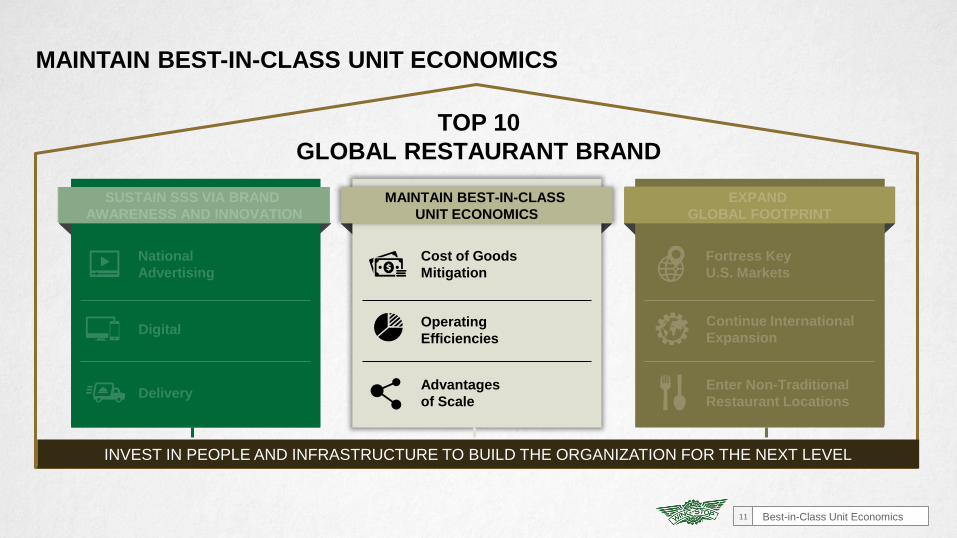
MAINTAIN BEST-IN-CLASS UNIT ECONOMICS
INVEST IN PEOPLE AND INFRASTRUCTURE TO BUILD THE ORGANIZATION FOR THE NEXT LEVEL
National
Advertising
Digital
Delivery
Cost of Goods
Mitigation
Operating
Efficiencies
Advantages
of Scale
Fortress Key
U.S. Markets
Continue International
Expansion
Enter Non-Traditional
Restaurant Locations
SUSTAIN SSS VIA BRAND
AWARENESS AND INNOVATION
MAINTAIN BEST-IN-CLASS
UNIT ECONOMICS
EXPAND
GLOBAL FOOTPRINT
TOP 10
GLOBAL RESTAURANT BRAND
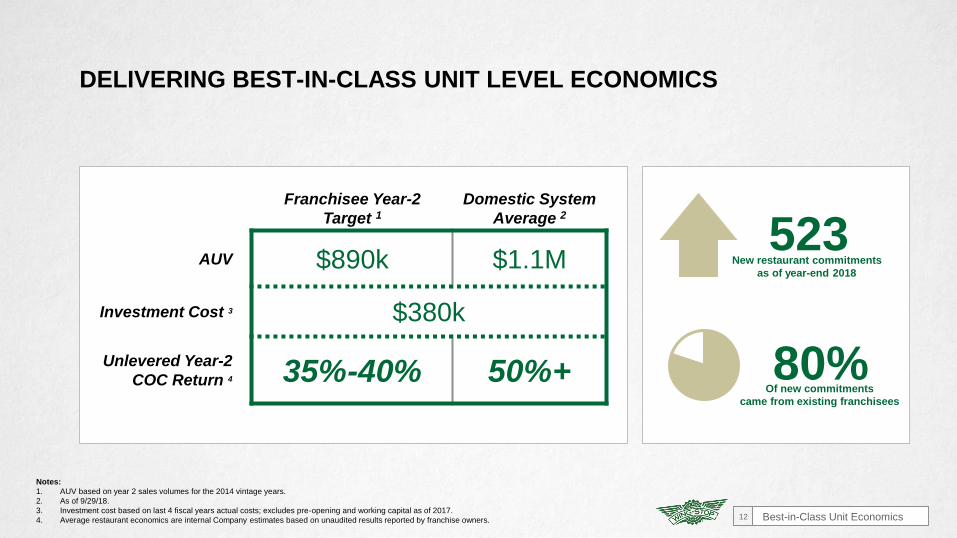
Franchisee Year-2
Target 1Domestic System
Average 2
AUV $890k $1.1M
Investment Cost 3 $380k
Unlevered Year-2
COC Return 4 35%-40% 50%+
Notes:
1. AUV based on year 2 sales volumes for the 2014 vintage years.
2. As of 9/29/18.
3. Investment cost based on last 4 fiscal years actual costs; excludes pre-opening and working capital as of 2017.
4. Average restaurant economics are internal Company estimates based on unaudited results reported by franchise owners.
DELIVERING BEST-IN-CLASS UNIT LEVEL ECONOMICS
Best-in-Class Unit Economics12
523New restaurant commitments
as of year-end 2018
80%Of new commitments
came from existing franchisees
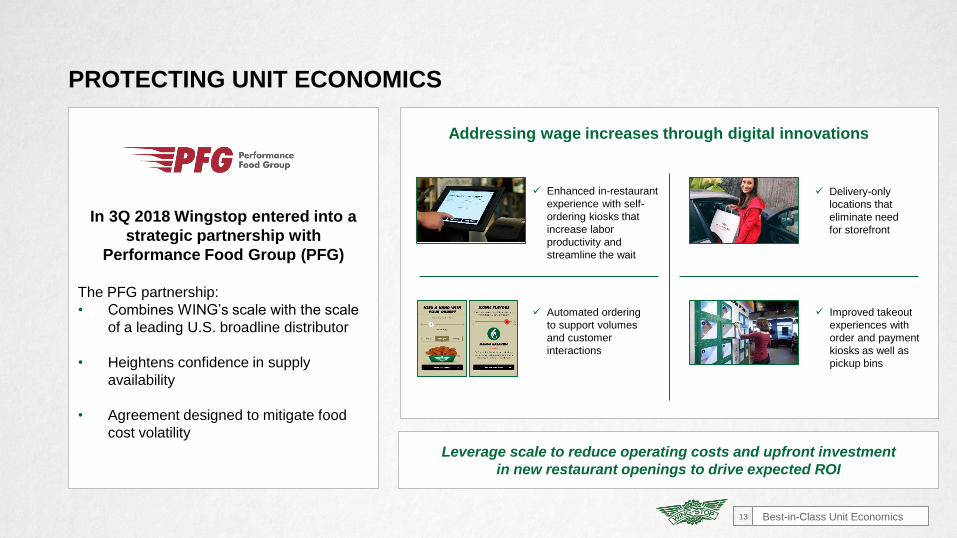
PROTECTING UNIT ECONOMICS
Best-in-Class Unit Economics13
In 3Q 2018 Wingstop entered into a
strategic partnership with
Performance Food Group (PFG)
The PFG partnership:
• Combines WING’s scale with the scale
of a leading U.S. broadline distributor
• Heightens confidence in supply
availability
• Agreement designed to mitigate food
cost volatility
Addressing wage increases through digital innovations
Leverage scale to reduce operating costs and upfront investment
in new restaurant openings to drive expected ROI
Enhanced in-restaurant
experience with self-
ordering kiosks that
increase labor
productivity and
streamline the wait
Improved takeout
experiences with
order and payment
kiosks as well as
pickup bins
Automated ordering
to support volumes
and customer
interactions
Delivery-only
locations that
eliminate need
for storefront
Global Expansion14
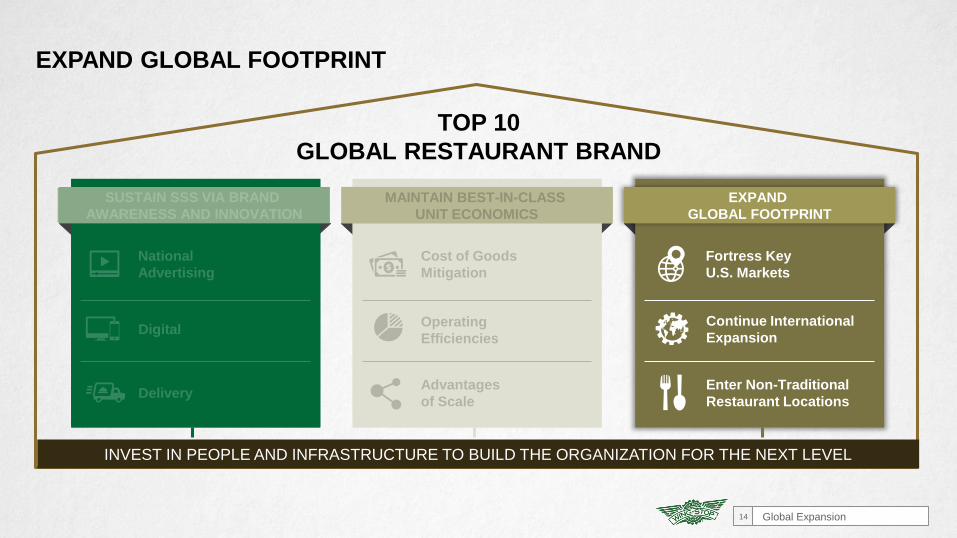
EXPAND GLOBAL FOOTPRINT
INVEST IN PEOPLE AND INFRASTRUCTURE TO BUILD THE ORGANIZATION FOR THE NEXT LEVEL
Cost of Goods
Mitigation
Operating
Efficiencies
Advantages
of Scale
Fortress Key
U.S. Markets
Continue International
Expansion
Enter Non-Traditional
Restaurant Locations
MAINTAIN BEST-IN-CLASS
UNIT ECONOMICS
EXPAND
GLOBAL FOOTPRINT
National
Advertising
Digital
Delivery
TOP 10
GLOBAL RESTAURANT BRAND
SUSTAIN SSS VIA BRAND
AWARENESS AND INNOVATION
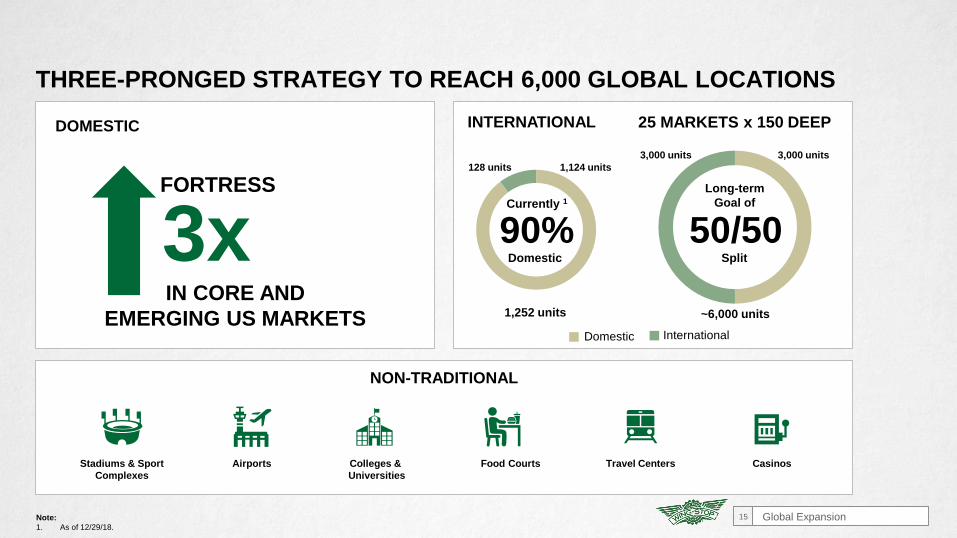
DOMESTIC
3x
NON-TRADITIONAL
90%Domestic
50/50
Long-term
Goal of
Split
INTERNATIONAL
1,252 units ~6,000 units
Currently 1
1,124 units128 units
3,000 units3,000 units
IN CORE AND
EMERGING US MARKETS
Global Expansion15
THREE-PRONGED STRATEGY TO REACH 6,000 GLOBAL LOCATIONS
Note:
1. As of 12/29/18.
FORTRESS
Stadiums & Sport
Complexes
Airports Colleges &
Universities
Food Courts Travel Centers Casinos
25 MARKETS x 150 DEEP
Domestic International
Global Expansion16
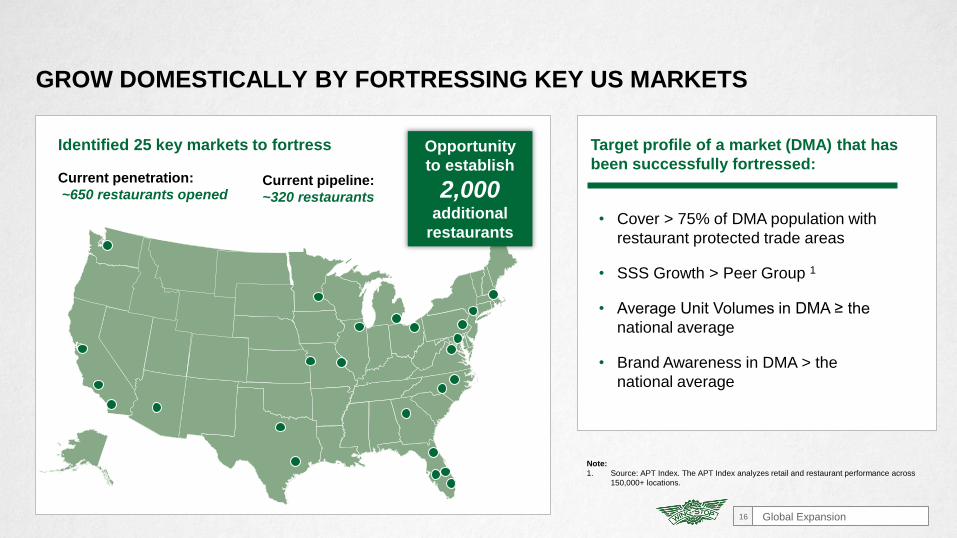
GROW DOMESTICALLY BY FORTRESSING KEY US MARKETS
• Cover > 75% of DMA population with
restaurant protected trade areas
• SSS Growth > Peer Group 1
• Average Unit Volumes in DMA ≥ the
national average
• Brand Awareness in DMA > the
national average
Target profile of a market (DMA) that has
been successfully fortressed:
Identified 25 key markets to fortress Opportunity
to establish
2,000additional
restaurants
Current pipeline:
~320 restaurants
Current penetration:
~650 restaurants opened
Note:
1. Source: APT Index. The APT Index analyzes retail and restaurant performance across
150,000+ locations.
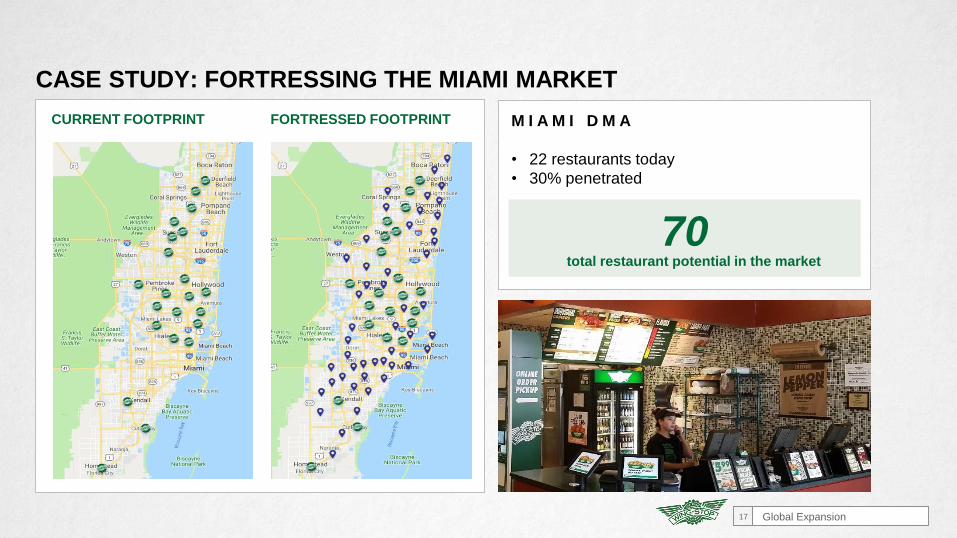
Global Expansion17
CASE STUDY: FORTRESSING THE MIAMI MARKET
M I A M I D M A
• 22 restaurants today
• 30% penetrated
CURRENT FOOTPRINT FORTRESSED FOOTPRINT
70total restaurant potential in the market
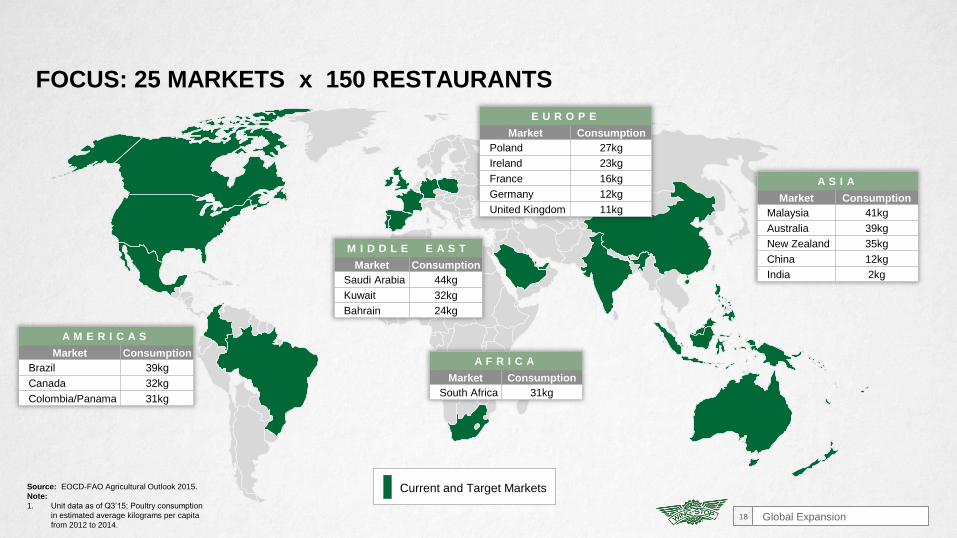
A M E R I C A S
Market Consumption
Brazil 39kg
Canada 32kg
Colombia/Panama 31kg
Source: EOCD-FAO Agricultural Outlook 2015.
Note:
1. Unit data as of Q3’15; Poultry consumption
in estimated average kilograms per capita
from 2012 to 2014.
A F R I C A
Market Consumption
South Africa 31kg
A S I A
Market Consumption
Malaysia 41kg
Australia 39kg
New Zealand 35kg
China 12kg
India 2kg
E U R O P E
Market Consumption
Poland 27kg
Ireland 23kg
France 16kg
Germany 12kg
United Kingdom 11kg
M I D D L E E A S T
Market Consumption
Saudi Arabia 44kg
Kuwait 32kg
Bahrain 24kg
Global Expansion18
FOCUS: 25 MARKETS x 150 RESTAURANTS
Current and Target Markets
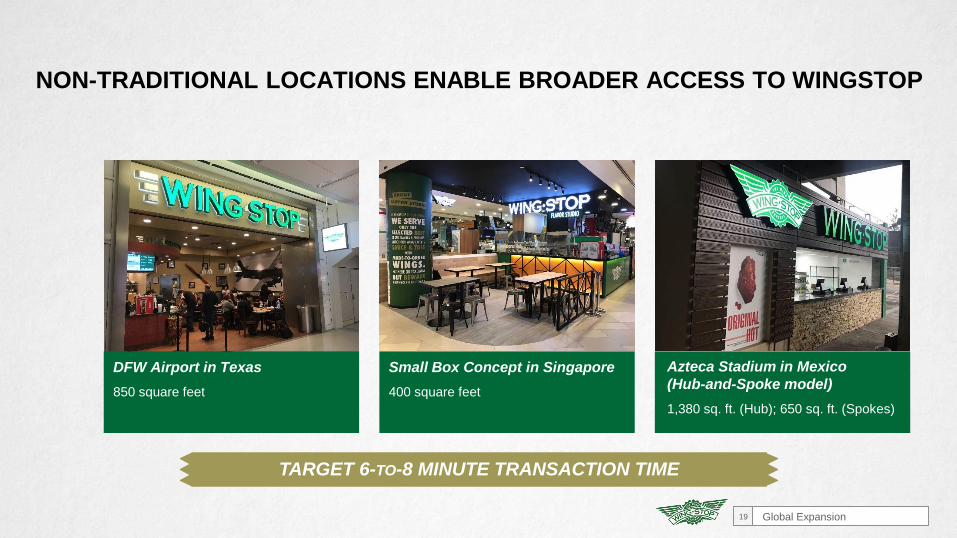
NON-TRADITIONAL LOCATIONS ENABLE BROADER ACCESS TO WINGSTOP
Global Expansion19
DFW Airport in Texas
850 square feet
Small Box Concept in Singapore
400 square feet
Azteca Stadium in Mexico
(Hub-and-Spoke model)
1,380 sq. ft. (Hub); 650 sq. ft. (Spokes)
TARGET 6-TO-8 MINUTE TRANSACTION TIME
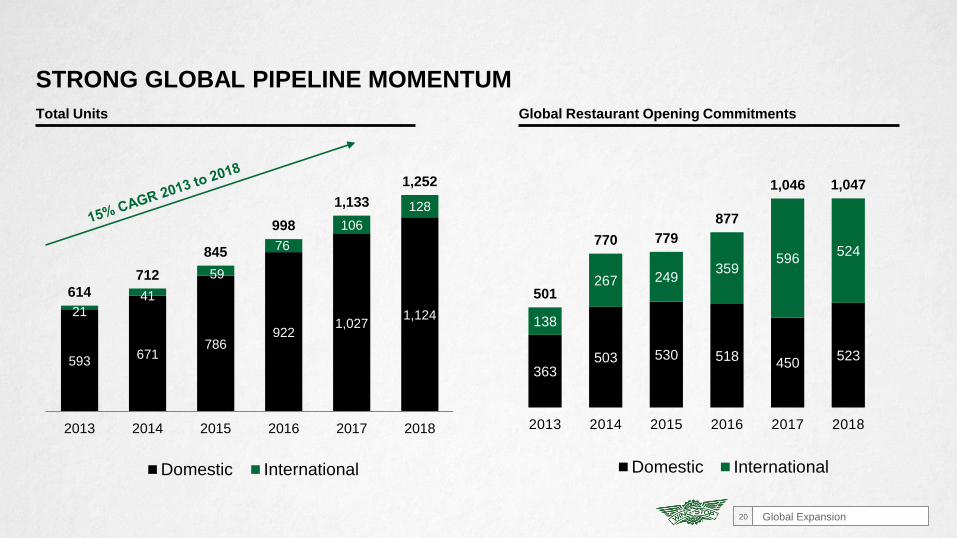
363503 530 518
450523
138
267 249359
596524
501
770 779
877
1,046 1,047
2013 2014 2015 2016 2017 2018
Domestic International
Total Units Global Restaurant Opening Commitments
STRONG GLOBAL PIPELINE MOMENTUM
Global Expansion20
593 671
786 922
1,027 1,124 21
41
59
76
106
128
614
712
845
998
1,133
1,252
2013 2014 2015 2016 2017 2018
Domestic International
LONG-TERM GROWTH MODEL
Wingstop Investor Presentation21
Long-term Growth Strategy22
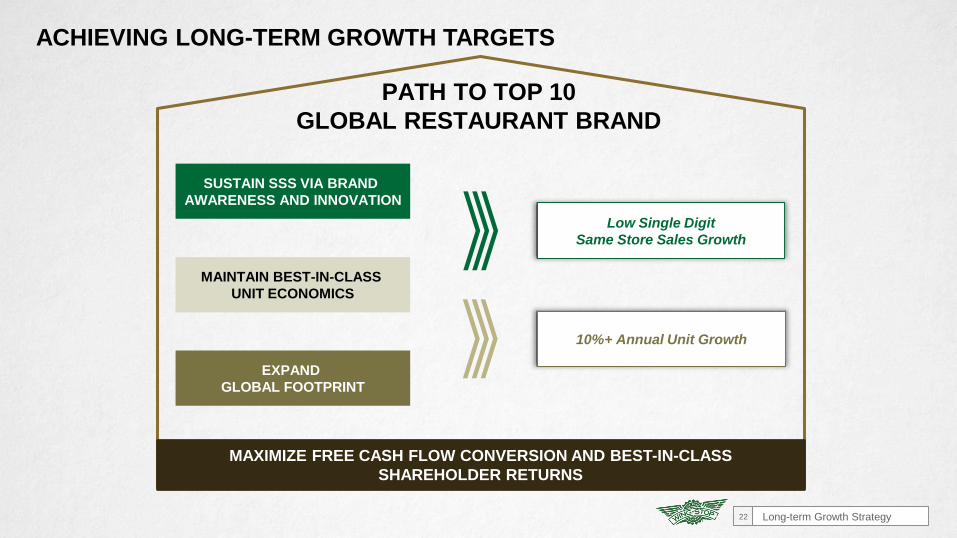
PATH TO TOP 10
GLOBAL RESTAURANT BRAND
MAXIMIZE FREE CASH FLOW CONVERSION AND BEST-IN-CLASS
SHAREHOLDER RETURNS
ACHIEVING LONG-TERM GROWTH TARGETS
10%+ Annual Unit Growth
EXPAND
GLOBAL FOOTPRINT
MAINTAIN BEST-IN-CLASS
UNIT ECONOMICS
Low Single Digit
Same Store Sales Growth
SUSTAIN SSS VIA BRAND
AWARENESS AND INNOVATION
Appendix23
APPENDIX
Appendix24
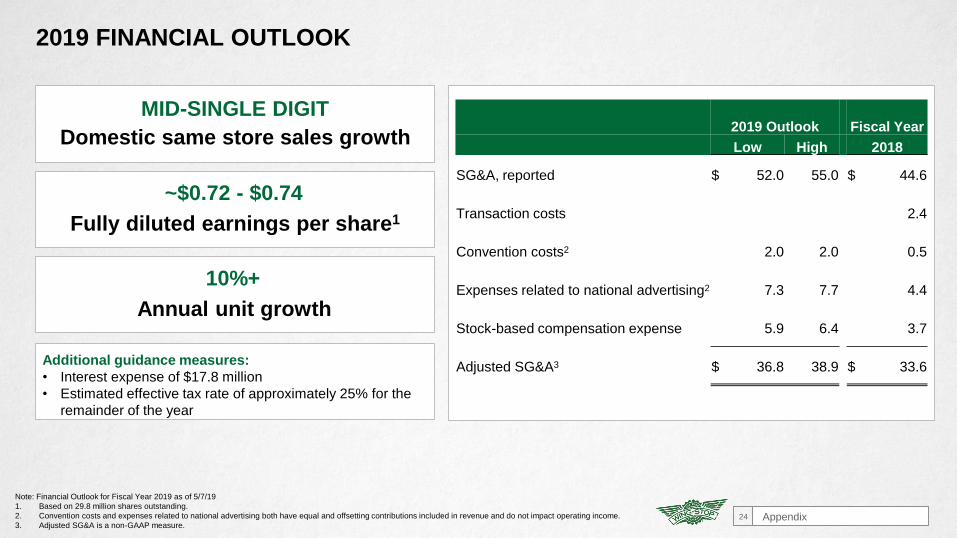
2019 FINANCIAL OUTLOOK
MID-SINGLE DIGIT
Domestic same store sales growth2019 Outlook Fiscal Year
Low High 2018
SG&A, reported $ 52.0 55.0 $ 44.6
Transaction costs 2.4
Convention costs2 2.0 2.0 0.5
Expenses related to national advertising2 7.3 7.7 4.4
Stock-based compensation expense 5.9 6.4 3.7
Adjusted SG&A3 $ 36.8 38.9 $ 33.6
Note: Financial Outlook for Fiscal Year 2019 as of 5/7/19
1. Based on 29.8 million shares outstanding.
2. Convention costs and expenses related to national advertising both have equal and offsetting contributions included in revenue and do not impact operating income.
3. Adjusted SG&A is a non-GAAP measure.
~$0.72 - $0.74
Fully diluted earnings per share1
Additional guidance measures:
• Interest expense of $17.8 million
• Estimated effective tax rate of approximately 25% for the
remainder of the year
10%+
Annual unit growth
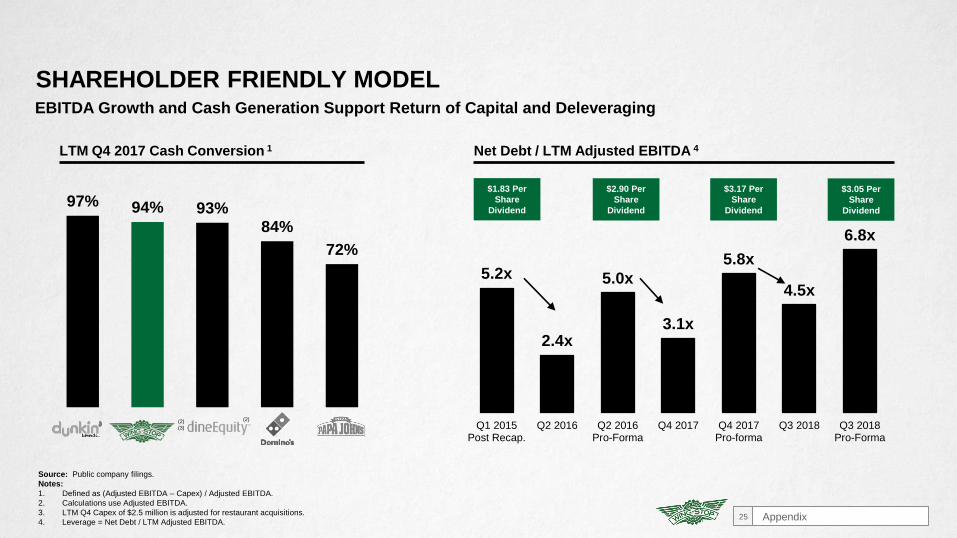
97% 94% 93%84%
72%
5.2x
2.4x
5.0x
3.1x
5.8x
4.5x
6.8x
Q1 2015Post Recap.
Q2 2016 Q2 2016Pro-Forma
Q4 2017 Q4 2017Pro-forma
Q3 2018 Q3 2018Pro-Forma
EBITDA Growth and Cash Generation Support Return of Capital and Deleveraging
(2)(2)
(3)
LTM Q4 2017 Cash Conversion 1
$2.90 Per
Share
Dividend
Net Debt / LTM Adjusted EBITDA 4
Source: Public company filings.
Notes:
1. Defined as (Adjusted EBITDA – Capex) / Adjusted EBITDA.
2. Calculations use Adjusted EBITDA.
3. LTM Q4 Capex of $2.5 million is adjusted for restaurant acquisitions.
4. Leverage = Net Debt / LTM Adjusted EBITDA.
$1.83 Per
Share
Dividend
$3.17 Per
Share
Dividend
SHAREHOLDER FRIENDLY MODEL
Appendix25
$3.05 Per
Share
Dividend
(1)
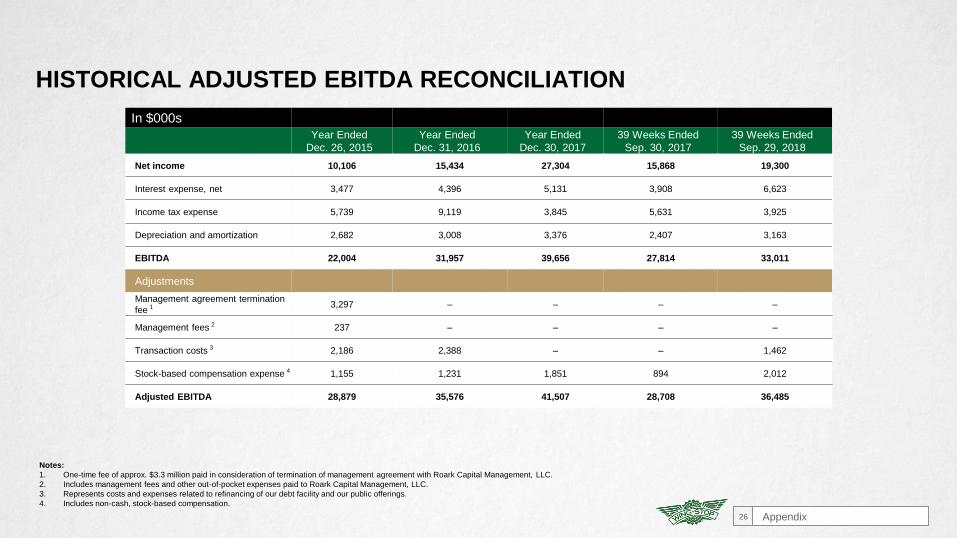
In $000s
Year Ended
Dec. 26, 2015
Year Ended
Dec. 31, 2016
Year Ended
Dec. 30, 2017
39 Weeks Ended
Sep. 30, 2017
39 Weeks Ended
Sep. 29, 2018
Net income 10,106 15,434 27,304 15,868 19,300
Interest expense, net 3,477 4,396 5,131 3,908 6,623
Income tax expense 5,739 9,119 3,845 5,631 3,925
Depreciation and amortization 2,682 3,008 3,376 2,407 3,163
EBITDA 22,004 31,957 39,656 27,814 33,011
Adjustments
Management agreement termination
fee 1 3,297 – – – –
Management fees 2 237 – – – –
Transaction costs 3 2,186 2,388 – – 1,462
Stock-based compensation expense 4 1,155 1,231 1,851 894 2,012
Adjusted EBITDA 28,879 35,576 41,507 28,708 36,485
Notes:
1. One-time fee of approx. $3.3 million paid in consideration of termination of management agreement with Roark Capital Management, LLC.
2. Includes management fees and other out-of-pocket expenses paid to Roark Capital Management, LLC.
3. Represents costs and expenses related to refinancing of our debt facility and our public offerings.
4. Includes non-cash, stock-based compensation.
HISTORICAL ADJUSTED EBITDA RECONCILIATION
Appendix26
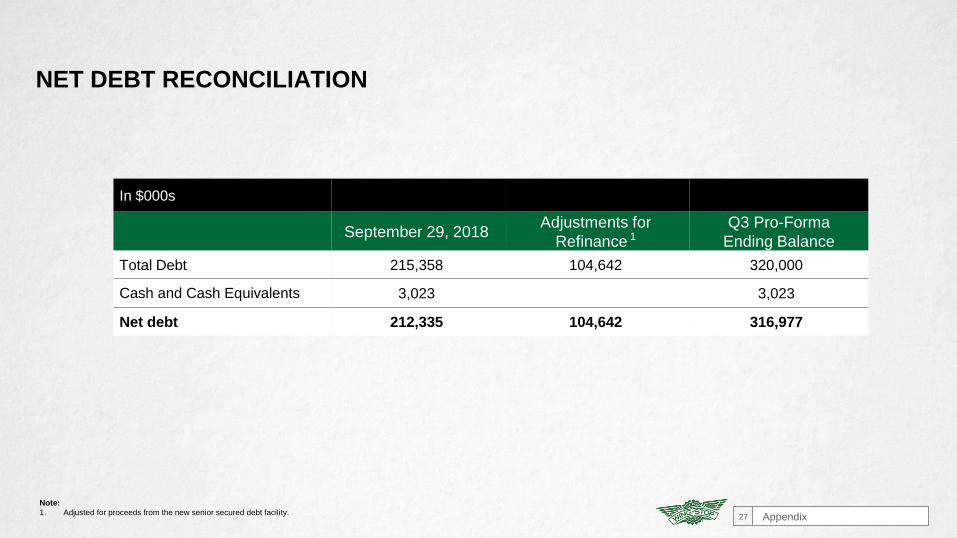
NET DEBT RECONCILIATION
In $000s
September 29, 2018Adjustments for
Refinance 1Q3 Pro-Forma
Ending Balance
Total Debt 215,358 104,642 320,000
Cash and Cash Equivalents 3,023 3,023
Net debt 212,335 104,642 316,977
Note:
1. Adjusted for proceeds from the new senior secured debt facility.Appendix27