Embed Size (px)
Citation preview
Investor DayApril 2015
2
Disclaimer
The information contained herein has been prepared for the use in this Presentation (the “Presentation”) and has not been independently verified. Such information is confidential
and is being provided to you solely for your information and may not be reproduced, retransmitted, further distributed to any other person or published, in whole or in part, for any
purpose.
The opinions presented herein are based on general information gathered at the time of writing and are subject to change without notice. Certain industry, market and competitive
position data contained in this Prospectus come from official or third party sources believed to be reliable but ALROSA does not guarantee its accuracy or completeness.
This Presentation contains statements about future events and expectations that are forward-looking statements. Any statement in this Presentation that is not a statement of
historical fact is a forward-looking statement that involves known and unknown risks, uncertainties and other factors which may cause the ALROSA’s actual results, performance
or achievements to be materially different from any future results, performance or achievements expressed or implied by such forward-looking statements. Past performance
should not be taken as an indication or guarantee of future results, and no representation or warranty, express or implied, is made regarding future performance. ALROSA
assumes no obligation to update, supplement or revise forward-looking or any other statements contained herein to reflect actual results, changes in assumptions or changes in
factors affecting these statements. ALROSA does not intend or have any duty or obligation to update or to keep current any information contained in this Presentation.
The diamond resources and reserves estimates provided in this Presentation have been prepared and presented in accordance with the standards and classifications of the
JORC Code (the Australasian Code for Reporting of Exploration Results, Mineral Resources and Ore Reserves as promulgated by the Australasian Joint Ore Reserves
Committee), which differ in significant respects from the standards and classifications applicable to the disclosure of mineral resources and reserves under the laws and
regulations of certain other jurisdictions, including the regulations of the U.S. Securities Exchange Commission (the “SEC”) with respect to registration statements and other
documents filed with the SEC. Among other things, in accordance with the JORC Code, this Presentation provides certain mineral resources estimates classified as “inferred”,
“indicated” or “measured”, which differ in significant respects from “probable” and “proven” mineral reserves estimates and are not disclosed in certain jurisdictions, including in
SEC filings. There can be significant uncertainty as to whether mineral resources can ever be feasibly and commercially mined. For further explanation of the JORC Code, see
the JORC website at www.jorc.org.
This Presentation does not constitute an offer to sell, or any solicitation of any offer to subscribe for or purchase, any securities. No part of this Presentation, nor the fact of its
distribution, should form any basis of, or be relied on in connection with, any contract or commitment or investment decision whatsoever.
The information in this Presentation is subject to verification, completion and change. No representation or warranty or undertaking, express or implied, is made as to, and no
reliance should be placed on, the accuracy or completeness of the information or opinions contained in this Presentation. None of ALROSA nor any of its shareholders, directors,
officers or employees, affiliates, advisors, representatives nor any other person accepts any liability whatsoever for any loss howsoever arising from any use of this Presentation
or its contents or otherwise arising in connection therewith.
This Presentation is not directed to, or intended for distribution to or use by, any person or entity that is a citizen or resident or located in any locality, state, country or other
jurisdiction where such distribution, publication, availability or use would be contrary to law or regulation or which would require any registration or licensing within such
jurisdiction.
This Presentation is not for distribution, directly or indirectly, to the public in the United States (including its territories and possessions, any State of the United States and the
District of Columbia). These materials are not an offer or solicitation to purchase or subscribe for securities in the United States or any other jurisdiction. Securities may not be
offered or sold in the United States absent registration with the U.S. Securities and Exchange Commission or an exemption from registration under the U.S. Securities Act of
1933, as amended. ALROSA does not intend to register any part of any offering in the United States or to conduct a public offering of any of its securities in the United States.
By attending a meeting where this Presentation is made or reviewing this Presentation you acknowledge and agree to be bound by the foregoing.
3
Presenting team
Ilya Ryashchin
Igor Kulichik
Sergei Mezhokh
Acting CEO, First Vice President
CFO, Vice President
Head of IR
4
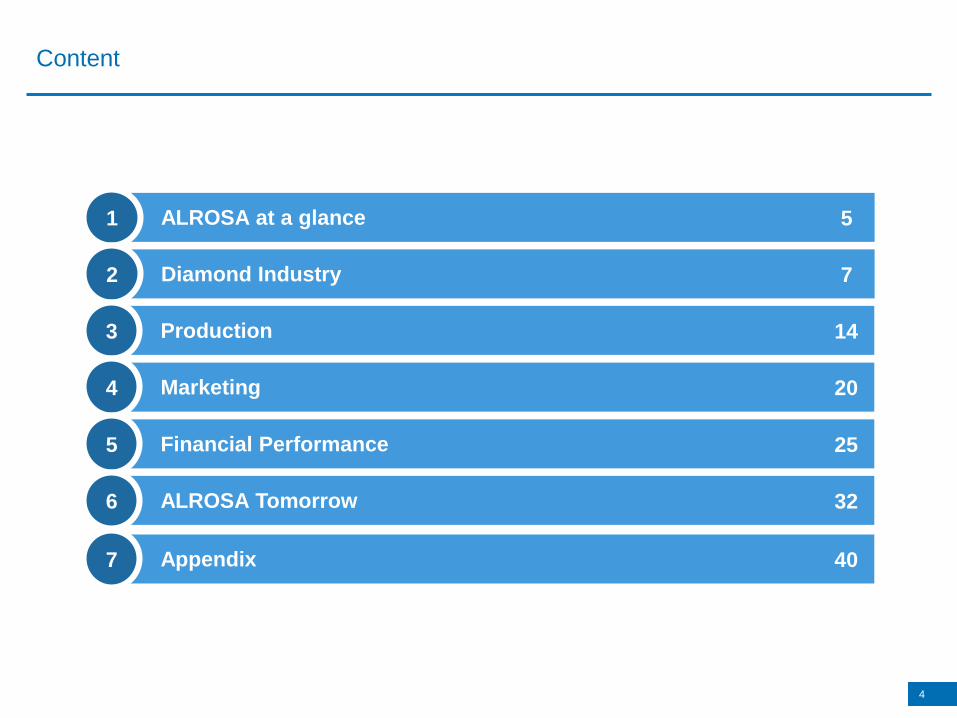
Content
ALROSA at a glance1 5
Diamond Industry2 7
Production3 14
Marketing4 20
Financial Performance5 25
ALROSA Tomorrow6 32
Appendix7 40
5
ALROSA at a glance
6
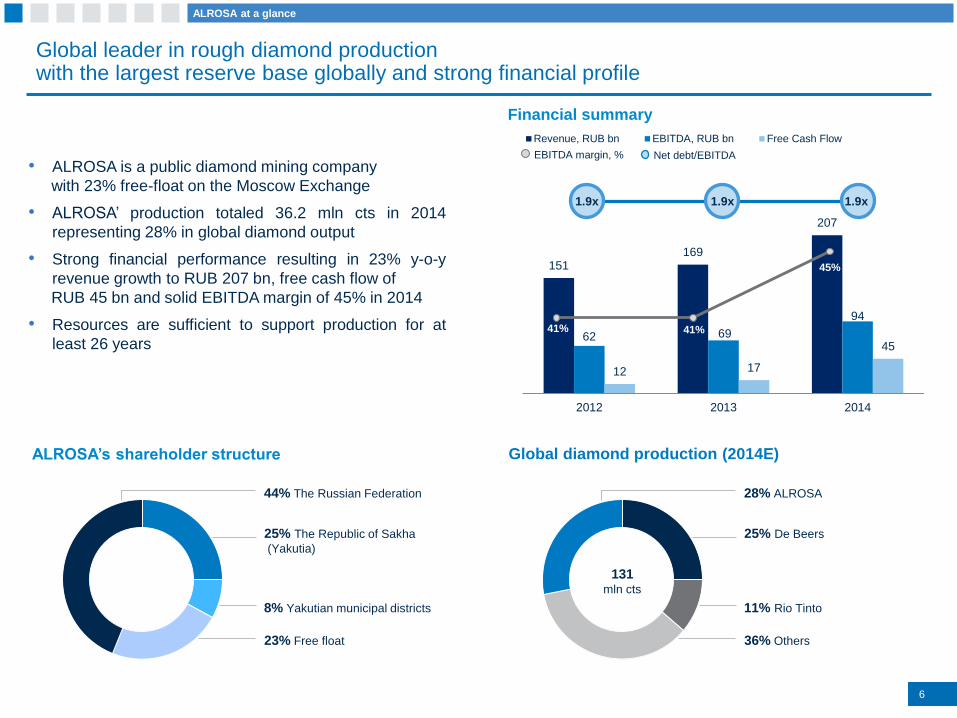
Global leader in rough diamond production with the largest reserve base globally and strong financial profile
44% The Russian Federation
25% The Republic of Sakha
(Yakutia)
8% Yakutian municipal districts
23% Free float
ALROSA’s shareholder structure
151169
207
62 69
94
12 17
45
0
50
100
150
200
2012 2013 2014
Revenue, RUB bn EBITDA, RUB bn Free Cash Flow
Financial summary
Global diamond production (2014E)
• ALROSA is a public diamond mining company
with 23% free-float on the Moscow Exchange
• ALROSA’ production totaled 36.2 mln cts in 2014
representing 28% in global diamond output
• Strong financial performance resulting in 23% y-o-y
revenue growth to RUB 207 bn, free cash flow of
RUB 45 bn and solid EBITDA margin of 45% in 2014
• Resources are sufficient to support production for at
least 26 years
ALROSA at a glance
28% ALROSA
25% De Beers
11% Rio Tinto
36% Others
131mln cts
41% 41%
45%
EBITDA margin, %
1.9x 1.9x 1.9x
Net debt/EBITDA
7
Diamond Industry
8
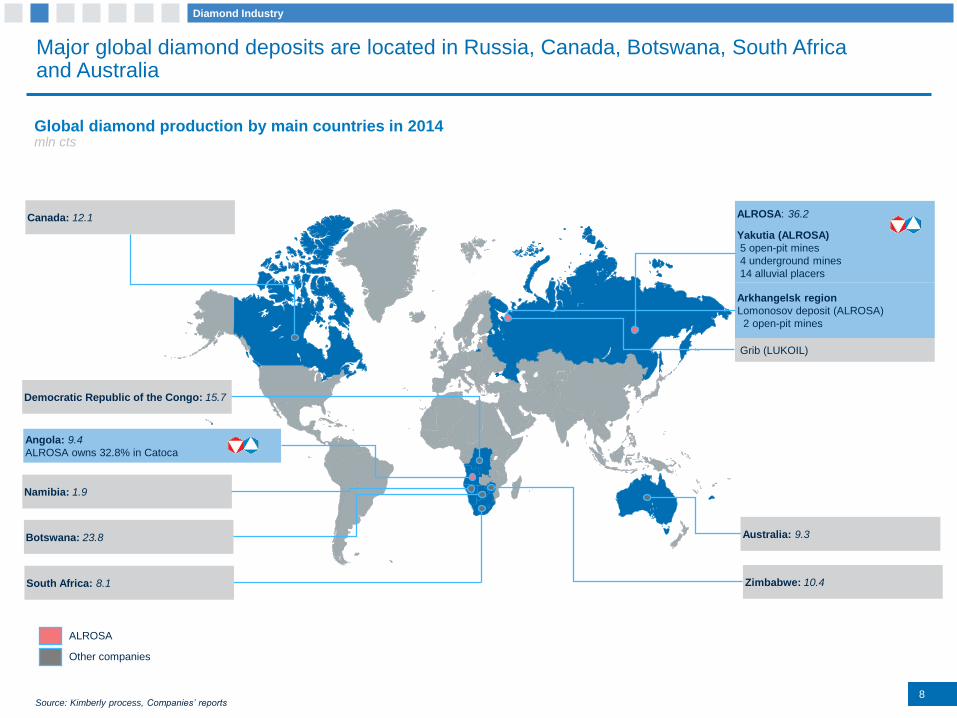
Major global diamond deposits are located in Russia, Canada, Botswana, South Africa and Australia
Australia: 9.3
ALROSA
Other companies
Yakutia (ALROSA)
5 open-pit mines
4 underground mines
14 alluvial placers
Botswana: 23.8
Angola: 9.4
ALROSA owns 32.8% in Catoca
Canada: 12.1
Democratic Republic of the Congo: 15.7
Arkhangelsk region
Lomonosov deposit (ALROSA)
2 open-pit mines
Grib (LUKOIL)
Zimbabwe: 10.4
Namibia: 1.9
mln cts
ALROSA: 36.2
Global diamond production by main countries in 2014
Diamond Industry
South Africa: 8.1
Source: Kimberly process, Companies’ reports
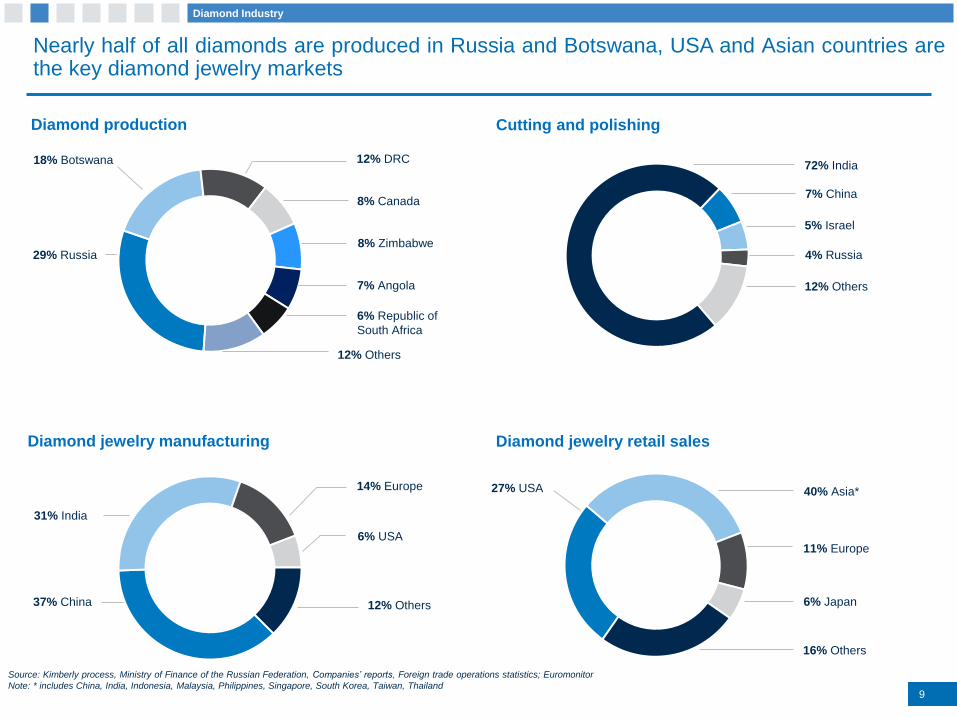
Diamond jewelry manufacturing
Nearly half of all diamonds are produced in Russia and Botswana, USA and Asian countries arethe key diamond jewelry markets
Source: Kimberly process, Ministry of Finance of the Russian Federation, Companies’ reports, Foreign trade operations statistics; Euromonitor
Note: * includes China, India, Indonesia, Malaysia, Philippines, Singapore, South Korea, Taiwan, Thailand
Diamond production
9
Cutting and polishing
Diamond jewelry retail sales
72% India
12% Others
7% China
5% Israel
4% Russia
27% USA
16% Others
11% Europe
40% Asia*
6% Japan37% China 12% Others
14% Europe
6% USA
31% India
29% Russia
18% Botswana
8% Zimbabwe
8% Canada
12% DRC
12% Others
7% Angola
6% Republic of
South Africa
9
Diamond Industry
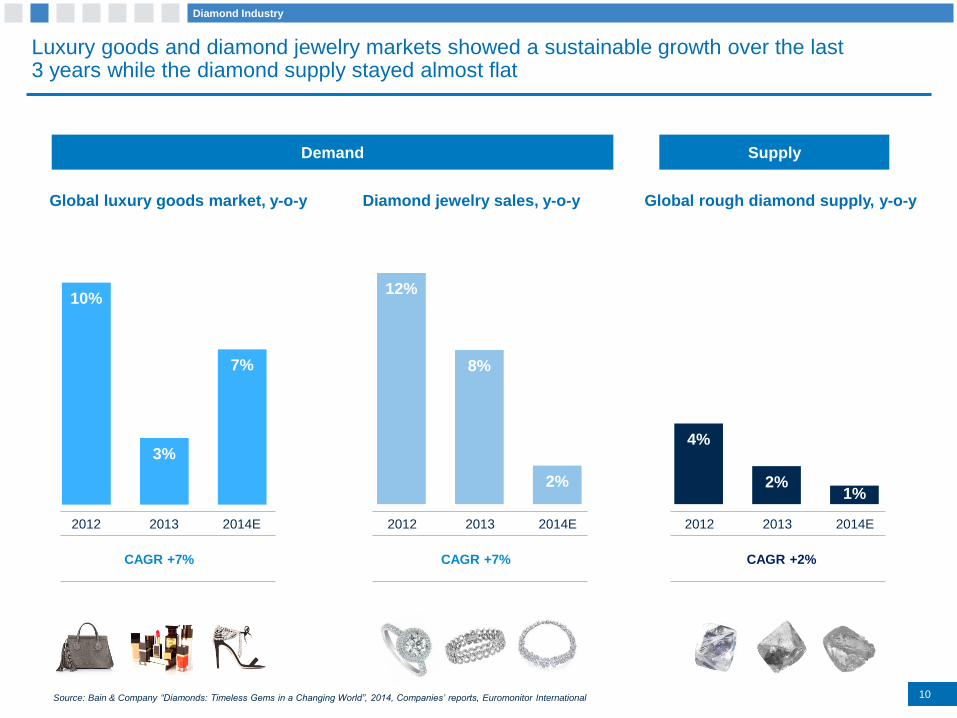
Luxury goods and diamond jewelry markets showed a sustainable growth over the last 3 years while the diamond supply stayed almost flat
Source: Bain & Company “Diamonds: Timeless Gems in a Changing World”, 2014, Companies’ reports, Euromonitor International
Diamond jewelry sales, y-o-yGlobal luxury goods market, y-o-y
10%
3%
7%
12%
8%
2%
2012 2013 2014E 2012 2013 2014E
Global rough diamond supply, y-o-y
4%
2%1%
2012 2013 2014E
Demand Supply
10
CAGR +7% CAGR +7% CAGR +2%
Diamond Industry
11
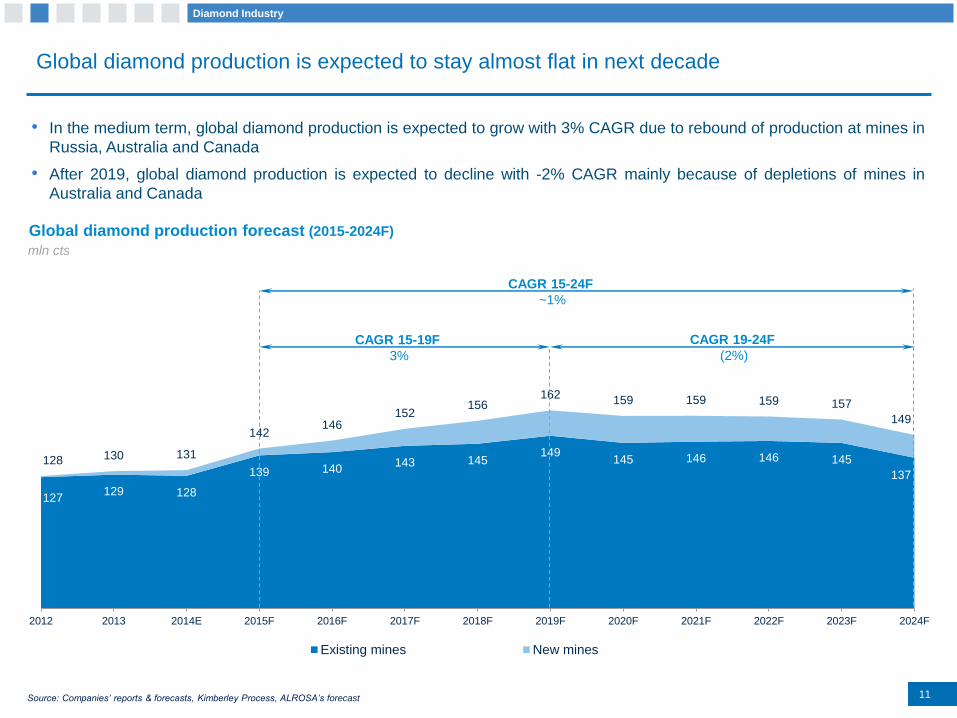
Global diamond production is expected to stay almost flat in next decade
• In the medium term, global diamond production is expected to grow with 3% CAGR due to rebound of production at mines in
Russia, Australia and Canada
• After 2019, global diamond production is expected to decline with -2% CAGR mainly because of depletions of mines in
Australia and Canada
Source: Companies’ reports & forecasts, Kimberley Process, ALROSA’s forecast
127129 128
139 140143 145
149145 146 146 145
137
128 130 131
142146
152156
162159 159 159 157
149
2012 2013 2014E 2015F 2016F 2017F 2018F 2019F 2020F 2021F 2022F 2023F 2024F
Existing mines New mines
Global diamond production forecast (2015-2024F)
CAGR 15-19F
3%
CAGR 19-24F
(2%)
CAGR 15-24F
~1%
mln cts
Diamond Industry
35
77
133
0,00
50,00
100,00
150,00
2006 2010 2014
9.8
10.2
11.2
9,09 9,10 9,10 9,10 9,11 9,11 9,11 9,11 9,12 9,12 9,12 9,13 9,13 9,13 9,14 9,14 9,14 9,14 9,15 9,15 9,15 9,16 9,16 9,16 9,17 9,17 9,17 9,17 9,18 9,18 9,18 9,19 9,19 9,19 9,20 9,20 9,20 9,20 9,21 9,21 9,21 9,22 9,22 9,22 9,23 9,23 9,23 9,23 9,24 9,24 9,24 9,25 9,25 9,25 9,26 9,26 9,26 9,27 9,27 9,27 9,27 9,28 9,28 9,28 9,29 9,29 9,29 9,30 9,30 9,30 9,30 9,31 9,31 9,31 9,32 9,32 9,32 9,33 9,33 9,33 9,33 9,34 9,34 9,34 9,35 9,35 9,35 9,36 9,36 9,36 9,36 9,37 9,37 9,37 9,38 9,38 9,38 9,39 9,39 9,39 9,39 9,40 9,40 9,40 9,41 9,41 9,41 9,42 9,42 9,42 9,42 9,43 9,43 9,43 9,44 9,44 9,44 9,45 9,45 9,45 9,45 9,46 9,46 9,46 9,47 9,47 9,47 9,48 9,48 9,48 9,49 9,49 9,49 9,49 9,50 9,50 9,50 9,51 9,51 9,51 9,52 9,52 9,52 9,52 9,53 9,53 9,53 9,54 9,54 9,54 9,55 9,55 9,55 9,55 9,56 9,56 9,56 9,57 9,57 9,57 9,58 9,58 9,58 9,58 9,59 9,59 9,59 9,60 9,60 9,60 9,61 9,61 9,61 9,61 9,62 9,62 9,62 9,63 9,63 9,63 9,64 9,64 9,64 9,64 9,65 9,65 9,65 9,66 9,66 9,66 9,67 9,67 9,67 9,67 9,68 9,68 9,68 9,69 9,69 9,69 9,70 9,70 9,70 9,71 9,71 9,71 9,71 9,72 9,72 9,72 9,73 9,73 9,73 9,74 9,74 9,74 9,74 9,75 9,75 9,75 9,76 9,76 9,76 9,77 9,77 9,77 9,77 9,78 9,78 9,78 9,79 9,79 9,79 9,80 9,80 9,80 9,80 9,81 9,81 9,81 9,82 9,82 9,82 9,83 9,83 9,83 9,83 9,84 9,84 9,84 9,85 9,85 9,85 9,86 9,86 9,86 9,86 9,87 9,87 9,87 9,88 9,88 9,88 9,89 9,89 9,89 9,89 9,90 9,90 9,90 9,91 9,91 9,91 9,92 9,92 9,92 9,93 9,93 9,93 9,93 9,94 9,94 9,94 9,95 9,95 9,95 9,96 9,96 9,96 9,96 9,97 9,97 9,97 9,98 9,98 9,98 9,99 9,99 9,99 9,99 10,00 10,00 10,00 10,01 10,01 10,01 10,02 10,02 10,02 10,02 10,03 10,03 10,03 10,04 10,04 10,04 10,05 10,05 10,05 10,05 10,06 10,06 10,06 10,07 10,07 10,07 10,08 10,08 10,08 10,08 10,09 10,09 10,09 10,10 10,10 10,10 10,11 10,11 10,11 10,11 10,12 10,12 10,12 10,13 10,13 10,13 10,14 10,14 10,14 10,15 10,15 10,15 10,15 10,16 10,16 10,16 10,17 10,17 10,17 10,18 10,18 10,18 10,18 10,19 10,19 10,19 10,20 10,20 10,20 10,21 10,21 10,21 10,21 10,22 10,22 10,22 10,23 10,23 10,23 10,24 10,24 10,24 10,24 10,25 10,25 10,25 10,26 10,26 10,26 10,27 10,27 10,27 10,27 10,28 10,28 10,28 10,29 10,29 10,29 10,30 10,30 10,30 10,30 10,31 10,31 10,31 10,32 10,32 10,32 10,33 10,33 10,33 10,34 10,34 10,34 10,34 10,35 10,35 10,35 10,36 10,36 10,36 10,37 10,37 10,37 10,37 10,38 10,38 10,38 10,39 10,39 10,39 10,40 10,40 10,40 10,40 10,41 10,41 10,41 10,42 10,42 10,42 10,43 10,43 10,43 10,43 10,44 10,44 10,44 10,45 10,45 10,45 10,46 10,46 10,46 10,46 10,47 10,47 10,47 10,48 10,48 10,48 10,49 10,49 10,49 10,49 10,50 10,50 10,50 10,51 10,51 10,51 10,52 10,52 10,52 10,52 10,53 10,53 10,53 10,54 10,54 10,54 10,55 10,55 10,55 10,56 10,56 10,56 10,56 10,57 10,57 10,57 10,58 10,58 10,58 10,59 10,59 10,59 10,59 10,60 10,60 10,60 10,61 10,61 10,61 10,62 10,62 10,62 10,62 10,63 10,63 10,63 10,64 10,64 10,64 10,65 10,65 10,65 10,65 10,66 10,66 10,66 10,67 10,67 10,67 10,68 10,68 10,68 10,68 10,69 10,69 10,69 10,70 10,70 10,70 10,71 10,71 10,71 10,71 10,72 10,72 10,72 10,73 10,73 10,73 10,74 10,74 10,74 10,74 10,75 10,75 10,75 10,76 10,76 10,76 10,77 10,77 10,77 10,78 10,78 10,78 10,78 10,79 10,79 10,79 10,80 10,80 10,80 10,81 10,81 10,81 10,81 10,82 10,82 10,82 10,83 10,83 10,83 10,84 10,84 10,84 10,84 10,85 10,85 10,85 10,86 10,86 10,86 10,87 10,87 10,87 10,87 10,88 10,88 10,88 10,89 10,89 10,89 10,90 10,90 10,90 10,90 10,91 10,91 10,91 10,92 10,92 10,92 10,93 10,93 10,93 10,93 10,94 10,94 10,94 10,95 10,95 10,95 10,96 10,96 10,96 10,96 10,97 10,97 10,97 10,98 10,98 10,98 10,99 10,99 10,99 11,00 11,00 11,00 11,00 11,01 11,01 11,01 11,02 11,02 11,02 11,03 11,03 11,03 11,03 11,04 11,04 11,04 11,05 11,05 11,05 11,06 11,06 11,06 11,06 11,07 11,07 11,07 11,08 11,08 11,08 11,09 11,09 11,09 11,09 11,10 11,10 11,10 11,11 11,11 11,11 11,12 11,12 11,12 11,12 11,13 11,13 11,13 11,14 11,14 11,14 11,15 11,15 11,15 11,15 11,16 11,16 11,16 11,17 11,17 11,17 11,18 11,18 11,18 11,18 11,19 11,19 11,19 11,20 11,20 11,20 11,21 11,21 11,21 11,22 11,22 11,22 11,22 11,23 11,23 11,23 11,24 11,24 11,24 11,25 11,25 11,25 11,25
2006 2010 2014
12
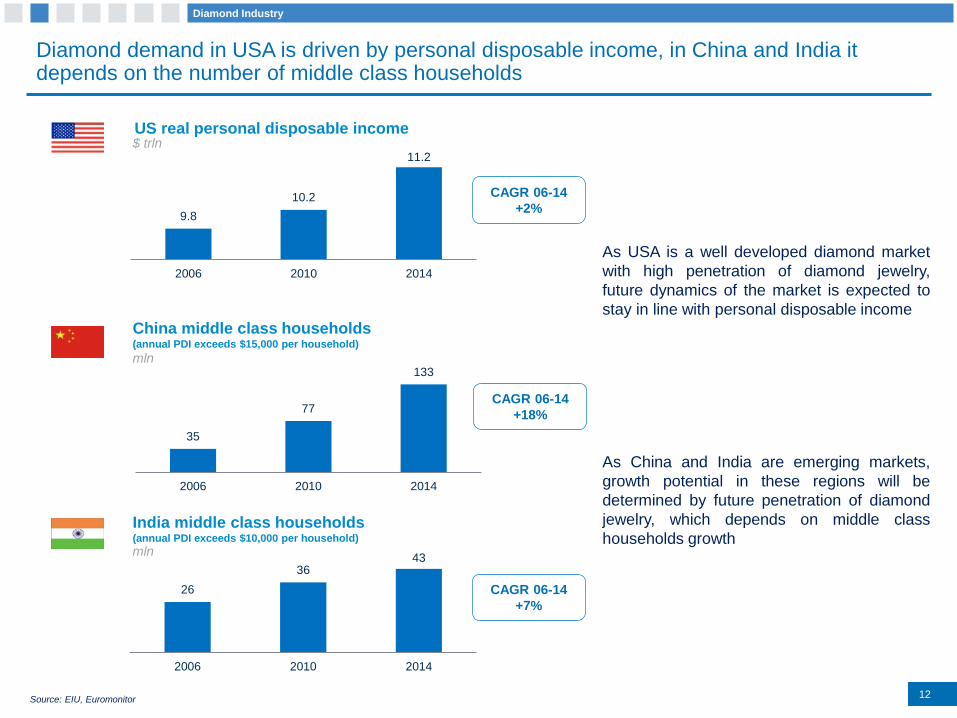
Diamond demand in USA is driven by personal disposable income, in China and India it depends on the number of middle class households
US real personal disposable income
India middle class households(annual PDI exceeds $10,000 per household)
mln
China middle class households(annual PDI exceeds $15,000 per household)
mln
26
3643
0,00
10,00
20,00
30,00
40,00
50,00
2006 2010 2014
Source: EIU, Euromonitor
$ trln
CAGR 06-14
+2%
CAGR 06-14
+18%
CAGR 06-14
+7%
Diamond Industry
As USA is a well developed diamond market
with high penetration of diamond jewelry,
future dynamics of the market is expected to
stay in line with personal disposable income
As China and India are emerging markets,
growth potential in these regions will be
determined by future penetration of diamond
jewelry, which depends on middle class
households growth
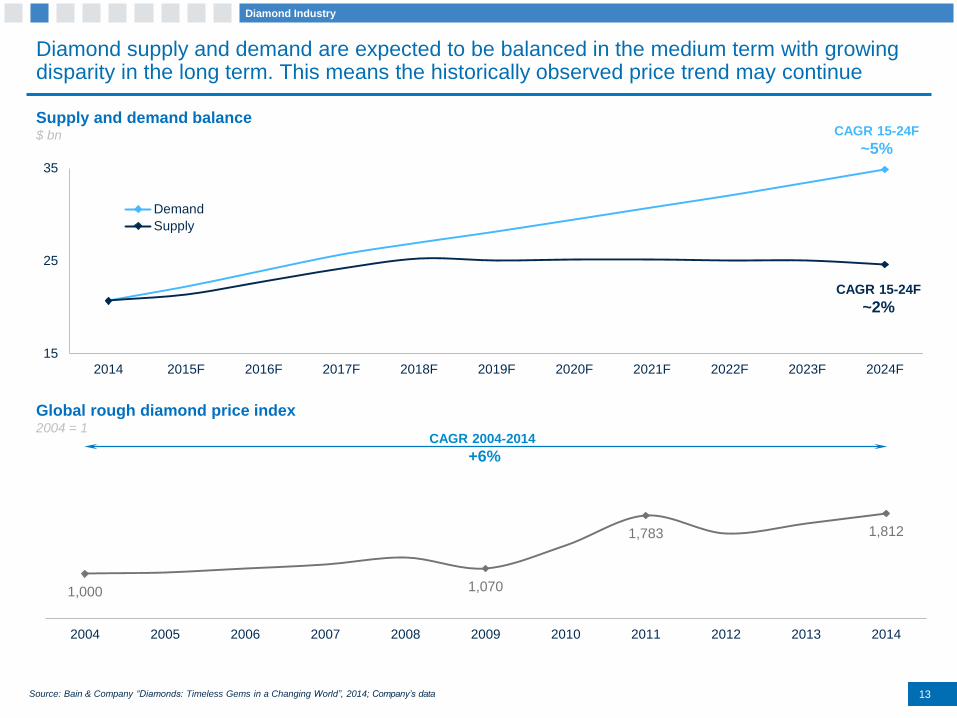
1,000 1,070
1,783 1,812
2004 2005 2006 2007 2008 2009 2010 2011 2012 2013 2014
15
25
35
2014 2015F 2016F 2017F 2018F 2019F 2020F 2021F 2022F 2023F 2024F
Demand
Supply
Diamond supply and demand are expected to be balanced in the medium term with growing disparity in the long term. This means the historically observed price trend may continue
Source: Bain & Company “Diamonds: Timeless Gems in a Changing World”, 2014; Company’s data
Global rough diamond price index 2004 = 1
Supply and demand balance$ bn
CAGR 2004-2014
+6%
Diamond Industry
13
CAGR 15-24F
~5%
CAGR 15-24F
~2%
14
Production
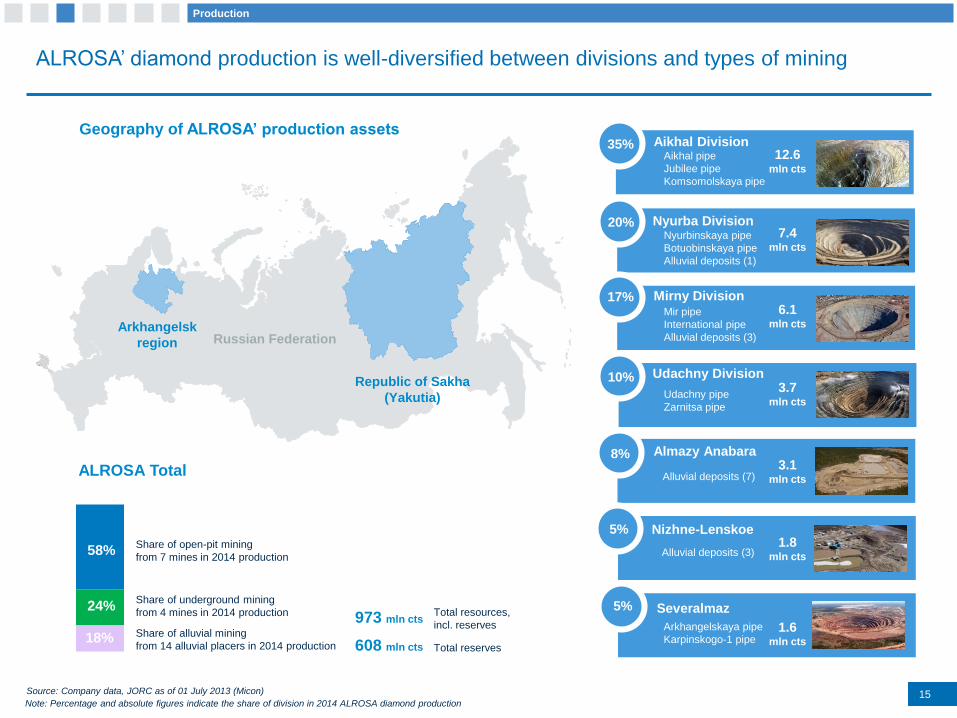
15Source: Company data, JORC as of 01 July 2013 (Micon)
ALROSA’ diamond production is well-diversified between divisions and types of mining
Severalmaz
1.6mln cts
Note: Percentage and absolute figures indicate the share of division in 2014 ALROSA diamond production
ALROSA Total
Production
Aikhal Division
17%
10%
8%
5%
Nyurba Division
Mirny Division
Udachny Division
Almazy Anabara
Nizhne-Lenskoe
12.6mln cts
7.4mln cts
6.1mln cts
3.7mln cts
3.1mln cts
1.8mln cts
Aikhal pipe
Jubilee pipe
Komsomolskaya pipe
Nyurbinskaya pipe
Botuobinskaya pipe
Alluvial deposits (1)
Mir pipe
International pipe
Alluvial deposits (3)
Udachny pipe
Zarnitsa pipe
Alluvial deposits (7)
Alluvial deposits (3)
Arkhangelskaya pipe
Karpinskogo-1 pipe
973 mln ctsTotal resources,
incl. reserves
608 mln cts Total reserves
Share of open-pit mining
from 7 mines in 2014 production
Share of underground mining
from 4 mines in 2014 production
Share of alluvial mining
from 14 alluvial placers in 2014 production
35%
20%
5%
58%
24%
18%
Geography of ALROSA’ production assets
Republic of Sakha
(Yakutia)
Arkhangelsk
region Russian Federation
16
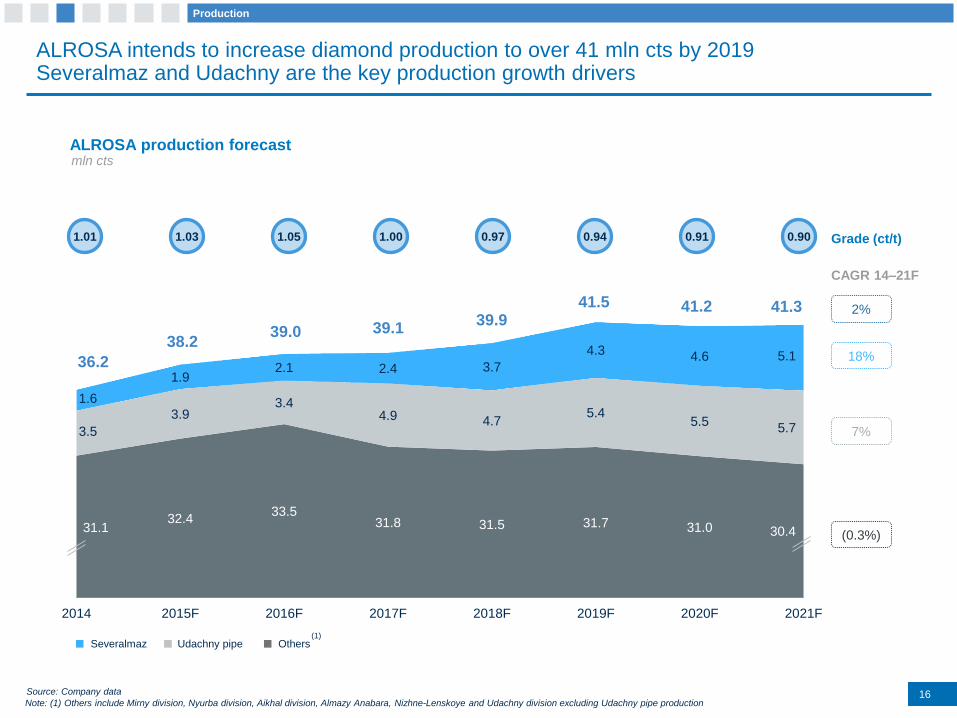
ALROSA intends to increase diamond production to over 41 mln cts by 2019Severalmaz and Udachny are the key production growth drivers
ALROSA production forecastmln cts
CAGR 14–21F
18%
7%
(0.3%)31.1
32.433.5
31.8 31.5 31.7 31.0 30.4
3.5
3.93.4
4.9 4.75.4
5.55.7
1.6
1.92.1 2.4 3.7
4.3 4.6 5.1
2014 2015F 2016F 2017F 2018F 2019F 2020F 2021F
38.2
36.2
39.0 39.1
41.341.241.539.9
2%
Source: Company data
Note: (1) Others include Mirny division, Nyurba division, Aikhal division, Almazy Anabara, Nizhne-Lenskoye and Udachny division excluding Udachny pipe production
(1)
1.01 1.03 1.05 1.00 0.97 0.94 0.91 0.90 Grade (ct/t)
Severalmaz Udachny pipe Others
Production
17
Capex will be decreasing as Severalmaz and Udachny underground mine reach their designed capacity
Planned Capex by mining complex
Source: Company data
Production
11.0
7.55.5 5.3
6.9 7.2
11.1
2.5
2.3
1.6 1.3
2.8 2.2
1.4
9.9
8.0
8.8 10.9
11.9
7.8
6.7
10.2
10.9
8.63.7
3.0
4.62.1
2.0
1.0 1.2
2.41.5
2015F 2016F 2017F 2018F 2019F 2020F 2021F
22.7
RUB bn
24.1
25.8
29.0
35.6
25.4
21.8
0.4
0.5
Severalmaz Udachny division Mining projects in the Republic of Sakha (Yakutia) Alluvial deposits Industrial infrastructure and other
1.0
18
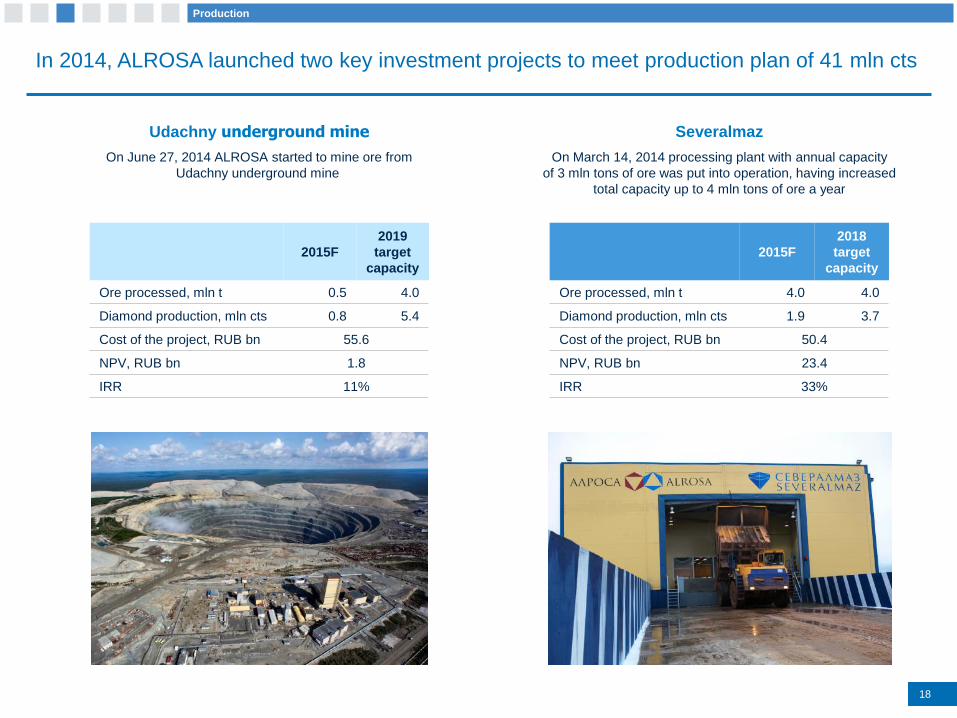
Udachny underground mine
On June 27, 2014 ALROSA started to mine ore from
Udachny underground mine
Severalmaz
On March 14, 2014 processing plant with annual capacity
of 3 mln tons of ore was put into operation, having increased
total capacity up to 4 mln tons of ore a year
2015F
2019
target
capacity
Ore processed, mln t 0.5 4.0
Diamond production, mln cts 0.8 5.4
Cost of the project, RUB bn 55.6
NPV, RUB bn 1.8
IRR 11%
2015F
2018
target
capacity
Ore processed, mln t 4.0 4.0
Diamond production, mln cts 1.9 3.7
Cost of the project, RUB bn 50.4
NPV, RUB bn 23.4
IRR 33%
In 2014, ALROSA launched two key investment projects to meet production plan of 41 mln cts
Production
19
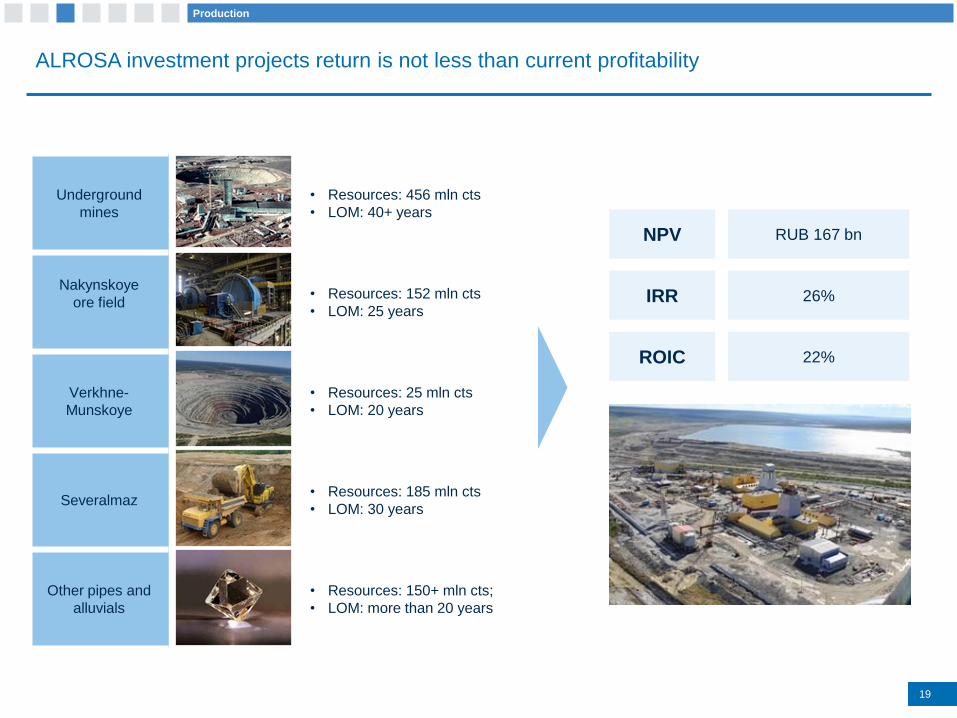
ALROSA investment projects return is not less than current profitability
Underground
mines
• Resources: 456 mln cts
• LOM: 40+ years
Nakynskoye
ore field• Resources: 152 mln cts
• LOM: 25 years
Verkhne-
Munskoye
• Resources: 25 mln cts
• LOM: 20 years
Severalmaz• Resources: 185 mln cts
• LOM: 30 years
Other pipes and
alluvials
• Resources: 150+ mln cts;
• LOM: more than 20 years
NPV
IRR
RUB 167 bn
26%
Production
ROIC 22%

2020
Marketing
21
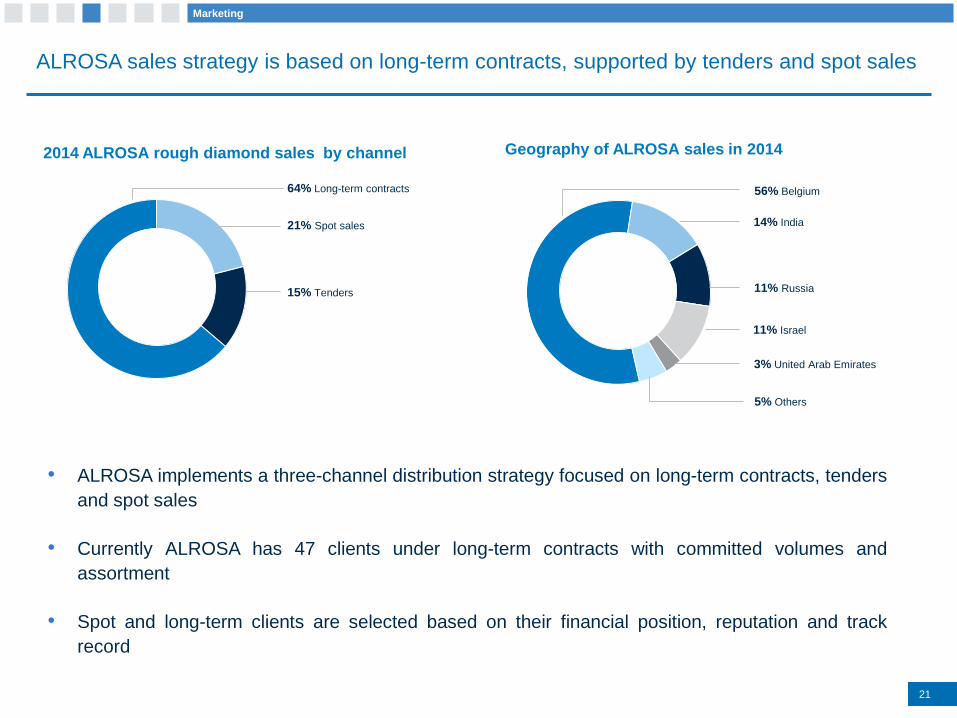
ALROSA sales strategy is based on long-term contracts, supported by tenders and spot sales
2014 ALROSA rough diamond sales by channel
• ALROSA implements a three-channel distribution strategy focused on long-term contracts, tenders
and spot sales
• Currently ALROSA has 47 clients under long-term contracts with committed volumes and
assortment
• Spot and long-term clients are selected based on their financial position, reputation and track
record
Geography of ALROSA sales in 2014
64% Long-term contracts
15% Tenders
56% Belgium
14% India
11% Israel
3% United Arab Emirates
5% Others
21% Spot sales
11% Russia
Marketing
30%
3%
45%
22%
15%
16%
5%
14%
5%
34%
11%
by sales volume by sales value
22
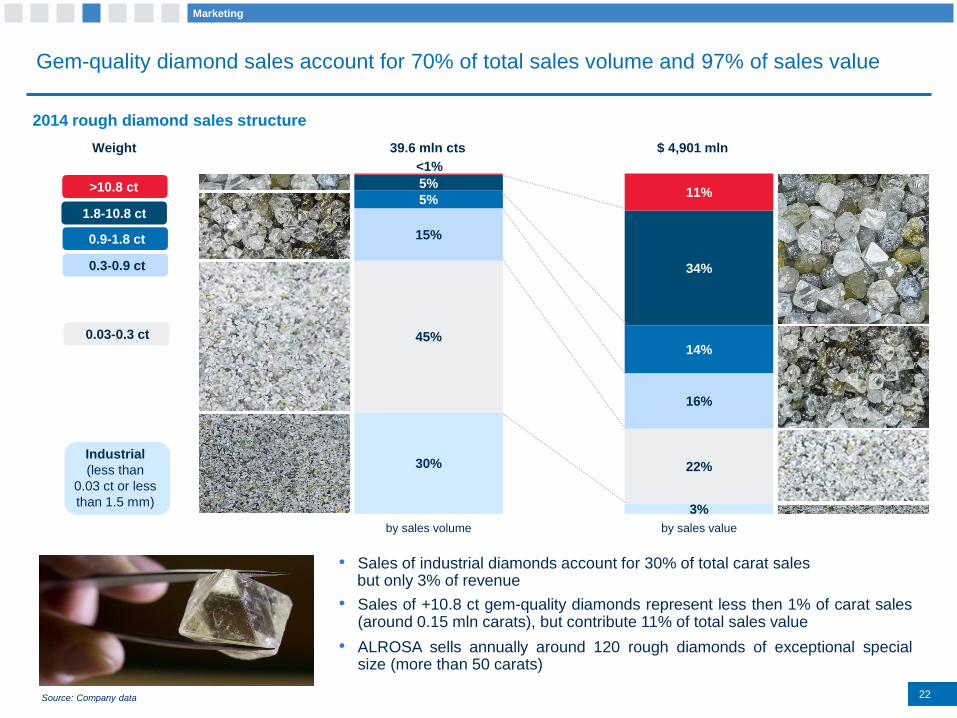
Gem-quality diamond sales account for 70% of total sales volume and 97% of sales value
Source: Company data
2014 rough diamond sales structure
• Sales of industrial diamonds account for 30% of total carat salesbut only 3% of revenue
• Sales of +10.8 ct gem-quality diamonds represent less then 1% of carat sales(around 0.15 mln carats), but contribute 11% of total sales value
• ALROSA sells annually around 120 rough diamonds of exceptional specialsize (more than 50 carats)
>10.8 ct
<1%
1.8-10.8 ct
0.9-1.8 ct
0.3-0.9 ct
0.03-0.3 ct
Industrial
(less than
0.03 ct or less
than 1.5 mm)
39.6 mln cts $ 4,901 mlnWeight
Marketing
23
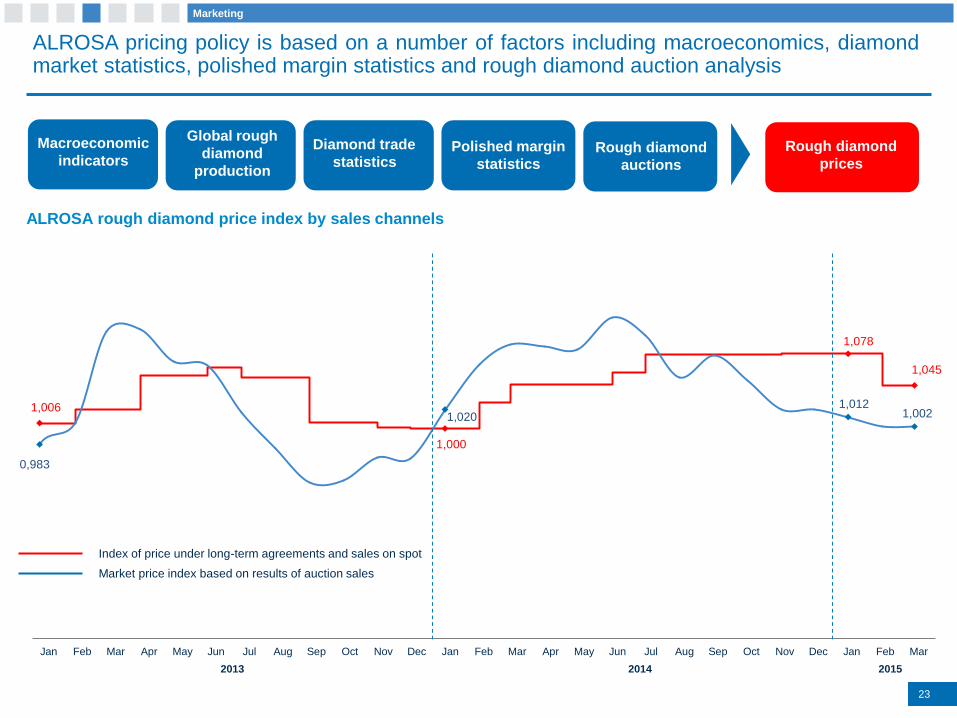
1,006
1,000
1,078
1,045
0,983
1,0201,012
1,002
2013/1 2013/22013/3 2013/42013/5 2013/62013/7 2013/8 2013/92013/102013/112013/122014/1 2014/22014/3 2014/42014/5 2014/62014/7 2014/8 2014/92014/102014/112014/122015/1 2015/22015/3
Index of price under long-term agreements and sales on spot
Market price index based on results of auction sales
Rough diamond
prices
ALROSA rough diamond price index by sales channels
Jan Feb Mar Apr May Jun Jul Aug Sep Oct Nov Dec Jan Feb Mar Apr May Jun Jul Aug Sep Oct Nov Dec Jan Feb Mar
ALROSA pricing policy is based on a number of factors including macroeconomics, diamondmarket statistics, polished margin statistics and rough diamond auction analysis
Macroeconomic
indicators
Global rough
diamond
production
Diamond trade
statisticsPolished margin
statisticsRough diamond
auctions
2013 2014 2015
Marketing
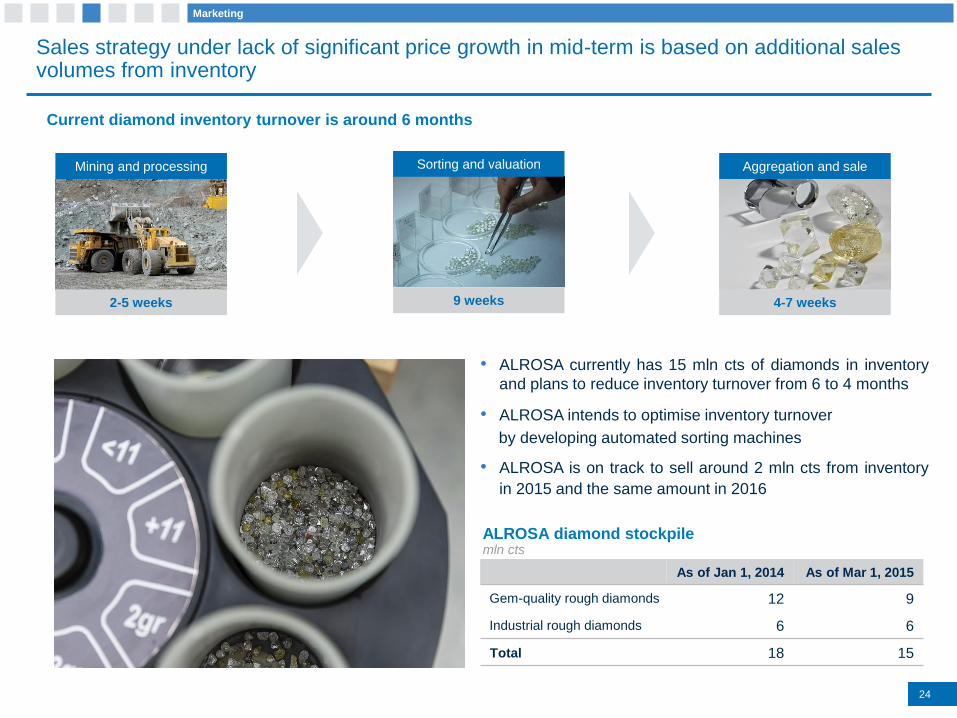
• ALROSA currently has 15 mln cts of diamonds in inventory
and plans to reduce inventory turnover from 6 to 4 months
• ALROSA intends to optimise inventory turnover
by developing automated sorting machines
• ALROSA is on track to sell around 2 mln cts from inventory
in 2015 and the same amount in 2016
24
Sales strategy under lack of significant price growth in mid-term is based on additional sales volumes from inventory
ALROSA diamond stockpilemln cts
Current diamond inventory turnover is around 6 months
As of Jan 1, 2014 As of Mar 1, 2015
Gem-quality rough diamonds 12 9
Industrial rough diamonds 6 6
Total 18 15
Mining and processing
2-5 weeks
Sorting and valuation
9 weeks
Aggregation and sale
4-7 weeks
Marketing
25
Financial Performance
26
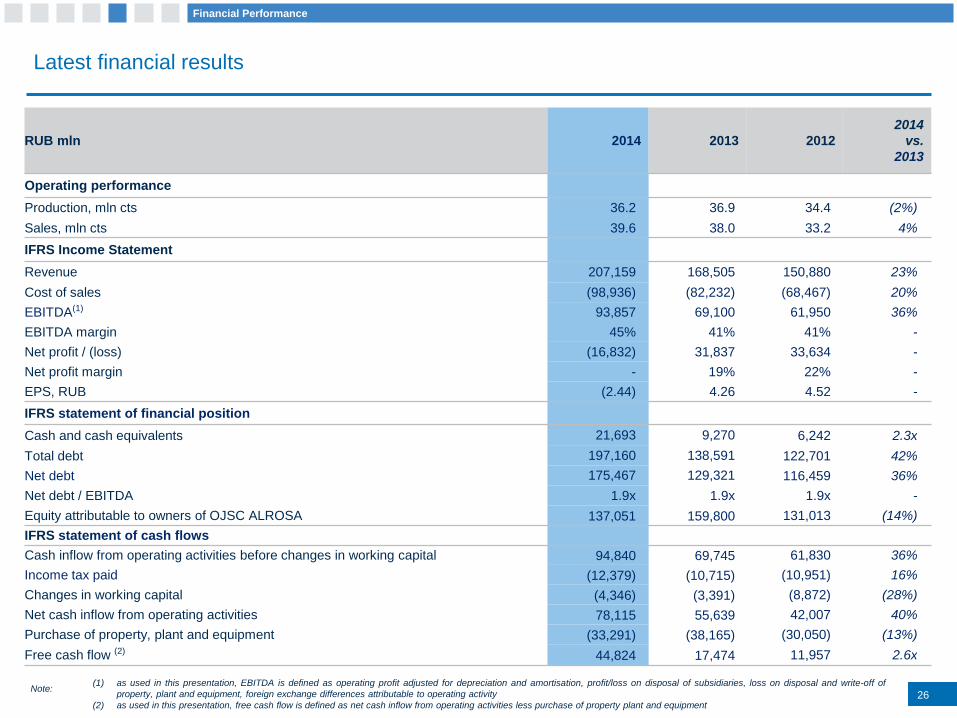
Latest financial results
RUB mln 2014 2013 2012
2014
vs.
2013
Operating performance
Production, mln cts 36.2 36.9 34.4 (2%)
Sales, mln cts 39.6 38.0 33.2 4%
IFRS Income Statement
Revenue 207,159 168,505 150,880 23%
Cost of sales (98,936) (82,232) (68,467) 20%
EBITDA(1) 93,857 69,100 61,950 36%
EBITDA margin 45% 41% 41% -
Net profit / (loss) (16,832) 31,837 33,634 -
Net profit margin - 19% 22% -
EPS, RUB (2.44) 4.26 4.52 -
IFRS statement of financial position
Cash and cash equivalents 21,693 9,270 6,242 2.3x
Total debt 197,160 138,591 122,701 42%
Net debt 175,467 129,321 116,459 36%
Net debt / EBITDA 1.9x 1.9x 1.9x -
Equity attributable to owners of OJSC ALROSA 137,051 159,800 131,013 (14%)
IFRS statement of cash flows
Cash inflow from operating activities before changes in working capital 94,840 69,745 61,830 36%
Income tax paid (12,379) (10,715) (10,951) 16%
Changes in working capital (4,346) (3,391) (8,872) (28%)
Net cash inflow from operating activities 78,115 55,639 42,007 40%
Purchase of property, plant and equipment (33,291) (38,165) (30,050) (13%)
Free cash flow (2) 44,824 17,474 11,957 2.6x
(1) as used in this presentation, EBITDA is defined as operating profit adjusted for depreciation and amortisation, profit/loss on disposal of subsidiaries, loss on disposal and write-off of
property, plant and equipment, foreign exchange differences attributable to operating activity
(2) as used in this presentation, free cash flow is defined as net cash inflow from operating activities less purchase of property plant and equipment
Note:
Financial Performance
27
Growth of cost of production was triggered by depreciation, extraction tax, fuel and energy costs as well as wages, salaries and other staff costs
2014 20132014
vs.
2013
Wages, salaries and other staff costs 34,279 32,764 5%
Depreciation 18,452 13,815 34%
Extraction tax 14,697 10,509 40%
Fuel and energy 13,686 11,016 24%
Materials 9,569 8,845 8%
Services 4,740 3,865 23%
Transport 2,474 2,559 (3%)
Other 1,058 282 3.8x
Cost of production 98,955 83,655 18%
Movement in inventory of diamonds, ores and
concentrates(898) (2,020) (56%)
Cost of diamonds for resale 879 597 47%
Cost of sales 98,936 82,232 20%
• Cost of sales growth in 2014 by +20% y-o-y was driven by increased diamond sales volume, higher depreciation, extraction tax, fuel and energy,
services, wages, salaries and other staff costs as well as sales in other business areas, including gas sales
• Depreciation growth in 2014 by 34% was triggered by amortization charges on production licenses, increased gas production, new equipment
commissioning at Severalmaz and Almazy Anabara
• Extraction tax (MET) payments increase in 2014 by +40% resulted from the ruble depreciation against the US dollar and the new Ministry of
Finance’s diamond pricelist for MET calculation having come into force on 15 March 2014
• Fuel and energy costs in 2014 increased by +24% as a result of higher regulated tariffs and increased production volumes at Severalmaz and Almazy
Anabara
• Wages, salaries and other staff costs rose by +5% as a result of indexation at the inflation rate
Production costs in 2014Cost of salesRUB mln
15% Extraction tax
35% Wages, salaries and other
staff costs
14% Fuel and energy
18% Depreciation
2% Transport
10% Materials
5% Services
1% Other
Financial Performance
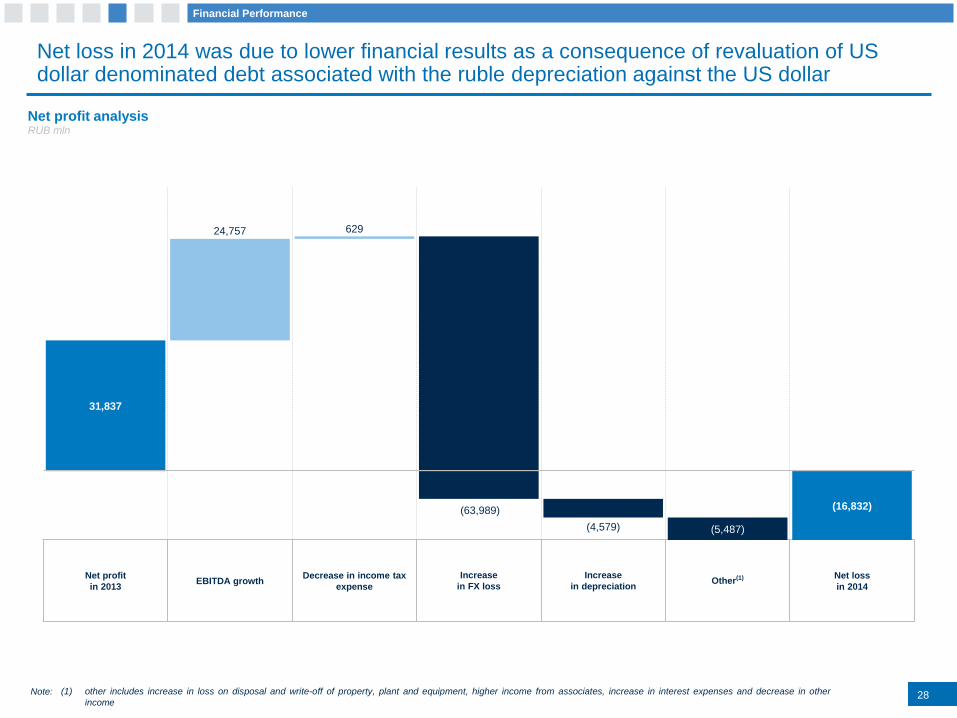
Net loss in 2014 was due to lower financial results as a consequence of revaluation of US dollar denominated debt associated with the ruble depreciation against the US dollar
Net profit
in 2013EBITDA growth
Decrease in income tax
expense
Increase
in FX loss
Increase
in depreciationOther(1) Net loss
in 2014
28
Net profit analysisRUB mln
(1) other includes increase in loss on disposal and write-off of property, plant and equipment, higher income from associates, increase in interest expenses and decrease in other
income
Note:
31,837
24,757 629
(63,989)
(4,579) (5,487)
(16,832)
Financial Performance
29
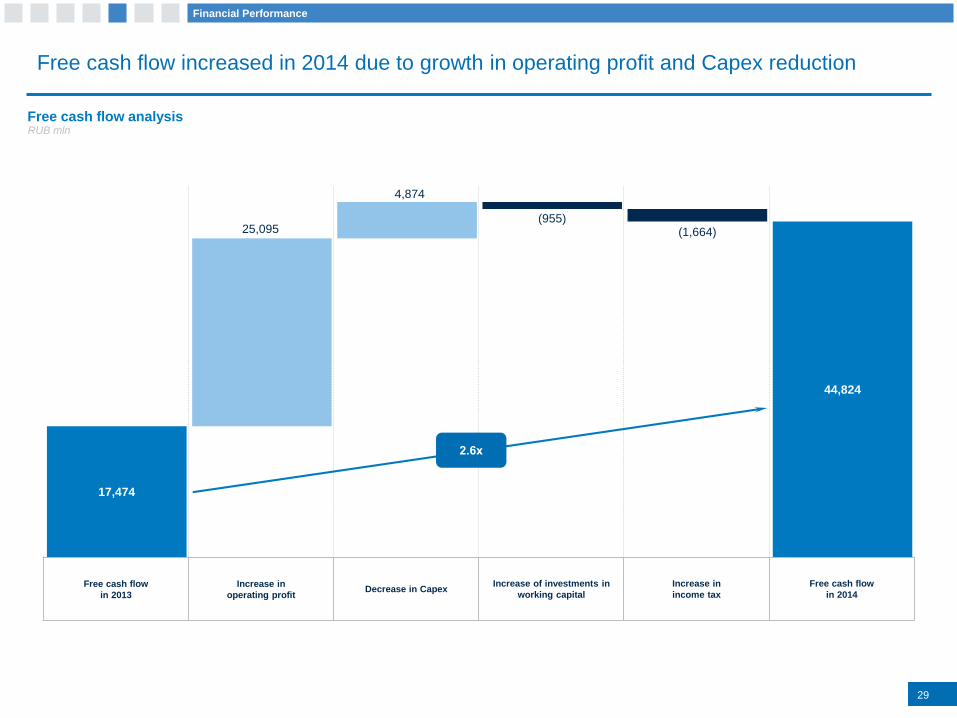
Free cash flow increased in 2014 due to growth in operating profit and Capex reduction
Free cash flow
in 2013
Increase in
operating profitDecrease in Capex
Increase of investments in
working capital
Increase in
income tax
Free cash flow
in 2014
Free cash flow analysisRUB mln
17,474
25,095
4,874
(955)(1,664)
44,824
2.6х
Financial Performance
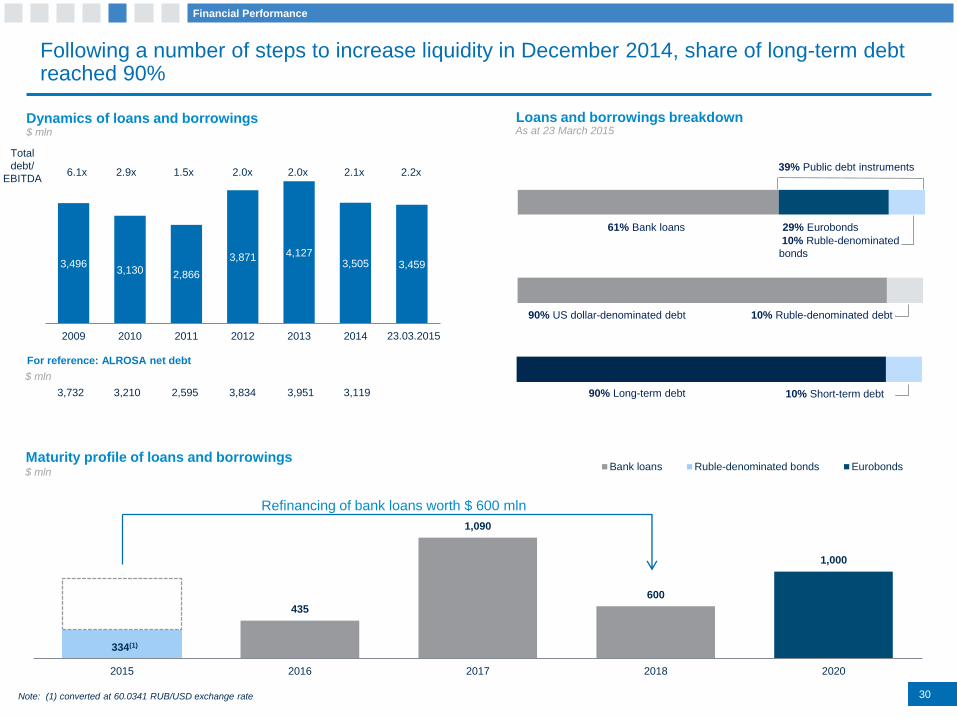
30
Following a number of steps to increase liquidity in December 2014, share of long-term debt reached 90%
334(1)
435
1,090
600
1,000
2015 2016 2017 2018 2020
Bank loans Ruble-denominated bonds Eurobonds
3,8342,5953,732
$ mln
3,951
39% Public debt instruments
61% Bank loans 29% Eurobonds
10% Ruble-denominated
bonds
10% Ruble-denominated debt90% US dollar-denominated debt
90% Long-term debt 10% Short-term debt
3,4963,130 2,866
3,871 4,1273,505 3,459
2009 2010 2011 2012 2013 2014 17.03.2015
3,210 3,119
23.03.2015
Total
debt/
EBITDA6.1x 2.9x 1.5x 2.0x 2.0x 2.1x 2.2x
Dynamics of loans and borrowings Loans and borrowings breakdown$ mln As at 23 March 2015
For reference: ALROSA net debt
Maturity profile of loans and borrowings$ mln
Note: (1) converted at 60.0341 RUB/USD exchange rate
Refinancing of bank loans worth $ 600 mln
Financial Performance
31
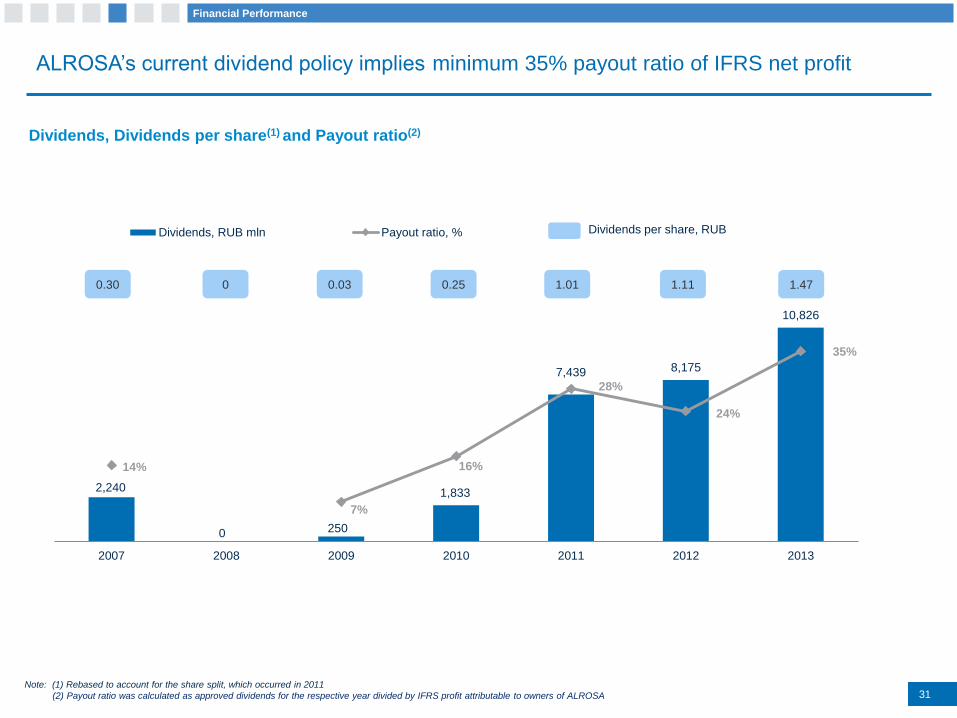
ALROSA’s current dividend policy implies minimum 35% payout ratio of IFRS net profit
Dividends, Dividends per share(1) and Payout ratio(2)
2,240
0 250
1,833
7,439 8,175
10,826
14%
7%
16%
28%
24%
35%
0
0,05
0,1
0,15
0,2
0,25
0,3
0,35
0,4
2007 2008 2009 2010 2011 2012 2013
Dividends, RUB mln Payout ratio, % Dividends per share, RUB
0.30 0 0.03 0.25 1.01 1.11 1.47
Note: (1) Rebased to account for the share split, which occurred in 2011
(2) Payout ratio was calculated as approved dividends for the respective year divided by IFRS profit attributable to owners of ALROSA
Financial Performance
32
ALROSA Tomorrow
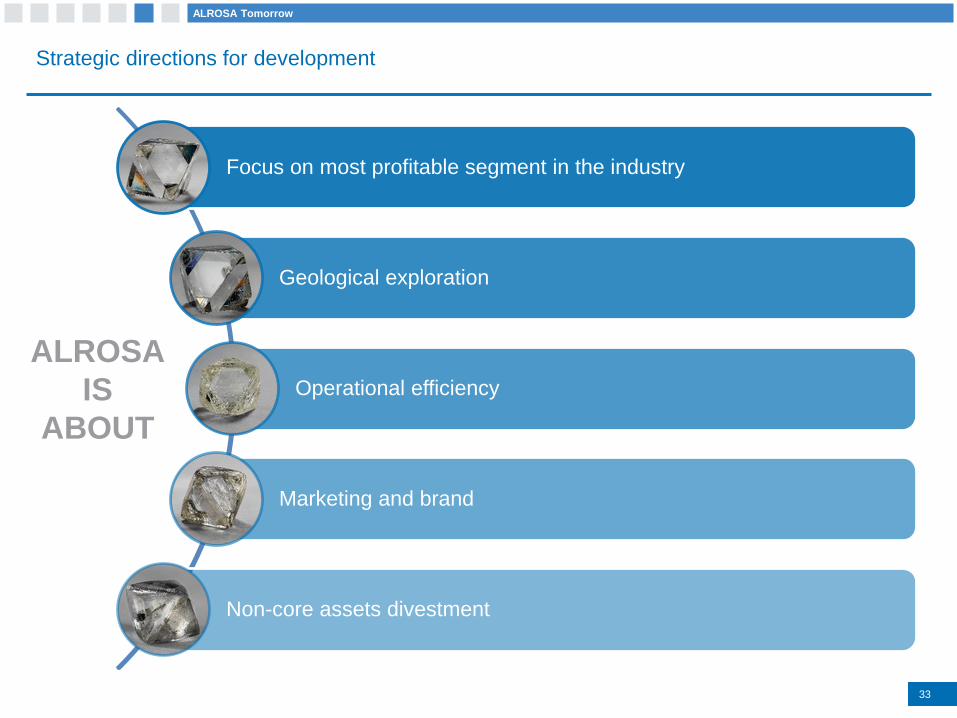
Strategic directions for development
33
ALROSA Tomorrow
Focus on most profitable segment in the industry
Geological exploration
Operational efficiency
Marketing and brand
Non-core assets divestment
ALROSA
IS
ABOUT
33
1-3%3-4%
2-3%3-5%
4-18%
Exploration andproduction
Rough diamond sales Cutting and polishing Polished diamondsales
Diamond jewelrymanufacturing
Diamond jewelry retailsales
ALROSA focuses on the rough diamond production – the most profitable segment of the diamond pipeline
Source: Bain & Company “Diamonds: Timeless Gems in a Changing World”, 201434
Rough Diamonds Polished Diamonds Diamond Jewelry
Operating margin by segments, %
21-25%
ALROSA Tomorrow
ALROSA’s strategy for geological exploration is to maintain full reserves replenishment
ALROSA aims to sustain its level of reserves consistent
with its level of production over timemln cts
ALROSA implements innovative methods of exploring
new deposits
35
176362180
373
2010 - 2014 2015 - 2023
Diamond production Growth of reserves
7,727
8,735 8,876
2012 2013 2014
Investments in geological explorationRUB mln
+2%+3%
ALROSA Tomorrow
Supply and marketing strategy
The structure of supply and marketing in ALROSA implies the following:
Speedier inventories turnover for rough diamonds, reduced from 6 to 4 months due to automation of sorting
process
Improved sorting quality in accordance with the requirements asserted by the producers of polished
diamonds
Promotion of “ALROSA ALLIANCE” brand in order to improve reputation and recognition of ALROSA in all
sectors of the diamond market
Development of trade and marketing relationships with leading jewelry retailers through direct sales of
diamonds and joint ventures for selling polished diamonds
36
ALROSA Tomorrow
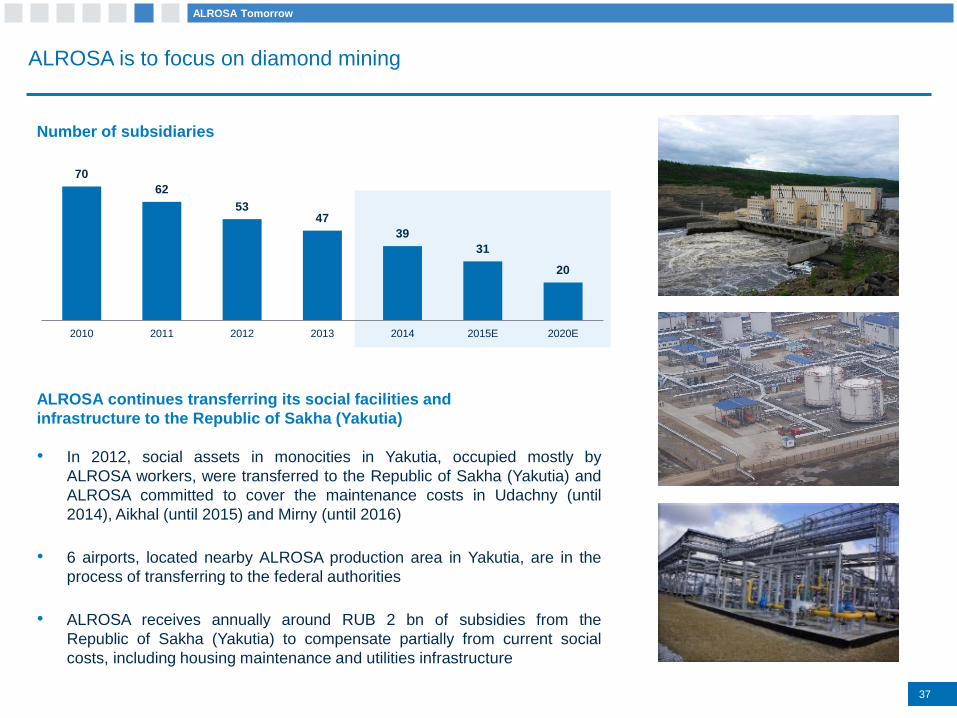
70
62
5347
39
31
20
2010 2011 2012 2013 2014 2015E 2020E
ALROSA is to focus on diamond mining
Number of subsidiaries
• In 2012, social assets in monocities in Yakutia, occupied mostly by
ALROSA workers, were transferred to the Republic of Sakha (Yakutia) and
ALROSA committed to cover the maintenance costs in Udachny (until
2014), Aikhal (until 2015) and Mirny (until 2016)
• 6 airports, located nearby ALROSA production area in Yakutia, are in the
process of transferring to the federal authorities
• ALROSA receives annually around RUB 2 bn of subsidies from the
Republic of Sakha (Yakutia) to compensate partially from current social
costs, including housing maintenance and utilities infrastructure
37
ALROSA Tomorrow
ALROSA continues transferring its social facilities and
infrastructure to the Republic of Sakha (Yakutia)
38
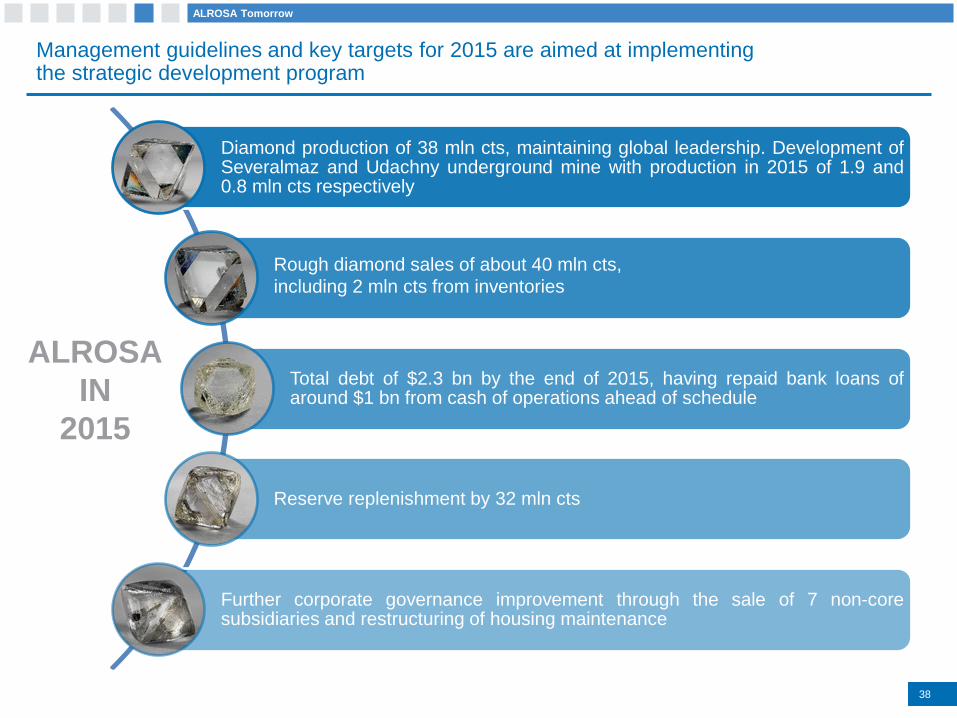
Management guidelines and key targets for 2015 are aimed at implementing the strategic development program
Diamond production of 38 mln cts, maintaining global leadership. Development ofSeveralmaz and Udachny underground mine with production in 2015 of 1.9 and0.8 mln cts respectively
Rough diamond sales of about 40 mln cts,
including 2 mln cts from inventories
Total debt of $2.3 bn by the end of 2015, having repaid bank loans ofaround $1 bn from cash of operations ahead of schedule
Reserve replenishment by 32 mln cts
Further corporate governance improvement through the sale of 7 non-coresubsidiaries and restructuring of housing maintenance
ALROSA
IN
2015
ALROSA Tomorrow
3939
Thank you!
4040
Appendix
41
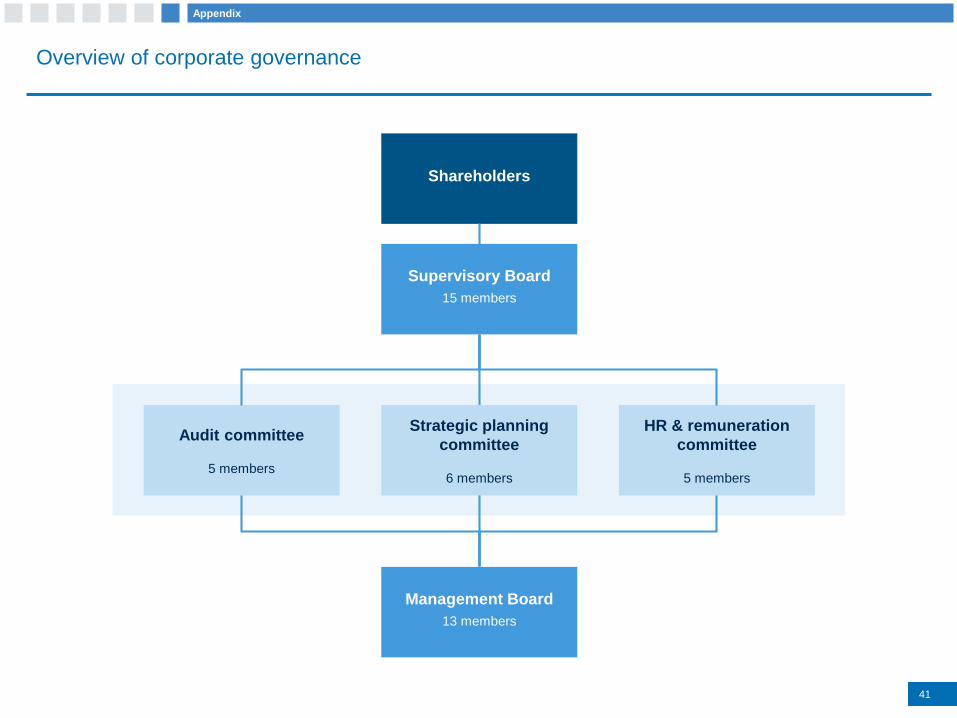
Overview of corporate governance
Appendix
Shareholders
Supervisory Board
15 members
Management Board
13 members
HR & remuneration
committee
5 members
Audit committee
5 members
Strategic planning
committee
6 members
42
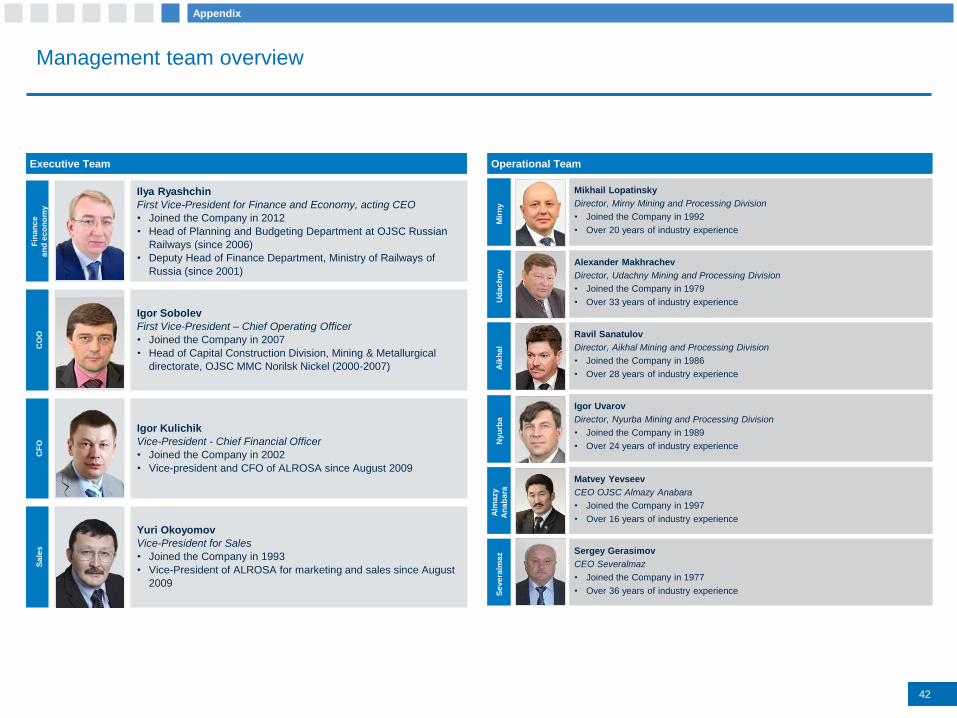
Management team overview
Operational Team
Mikhail Lopatinsky
Director, Mirny Mining and Processing Division
• Joined the Company in 1992
• Over 20 years of industry experience
Mir
ny
Ud
ac
hn
y
Alexander Makhrachev
Director, Udachny Mining and Processing Division
• Joined the Company in 1979
• Over 33 years of industry experience
Ravil Sanatulov
Director, Aikhal Mining and Processing Division
• Joined the Company in 1986
• Over 28 years of industry experience
Aik
ha
l
Igor Uvarov
Director, Nyurba Mining and Processing Division
• Joined the Company in 1989
• Over 24 years of industry experience
Nyu
rba
Matvey Yevseev
CEO OJSC Almazy Anabara
• Joined the Company in 1997
• Over 16 years of industry experience
Alm
azy
An
ab
ara
Sergey Gerasimov
CEO Severalmaz
• Joined the Company in 1977
• Over 36 years of industry experienceSe
ve
ralm
az
Executive Team
Appendix
Fin
an
ce
an
d e
co
no
my
Ilya Ryashchin
First Vice-President for Finance and Economy, acting CEO
• Joined the Company in 2012
• Head of Planning and Budgeting Department at OJSC Russian
Railways (since 2006)
• Deputy Head of Finance Department, Ministry of Railways of
Russia (since 2001)
CO
O
Igor Sobolev
First Vice-President – Chief Operating Officer
• Joined the Company in 2007
• Head of Capital Construction Division, Mining & Metallurgical
directorate, OJSC MMC Norilsk Nickel (2000-2007)
CF
O
Igor Kulichik
Vice-President - Chief Financial Officer
• Joined the Company in 2002
• Vice-president and CFO of ALROSA since August 2009
Sa
les
Yuri Okoyomov
Vice-President for Sales
• Joined the Company in 1993
• Vice-President of ALROSA for marketing and sales since August
2009
43
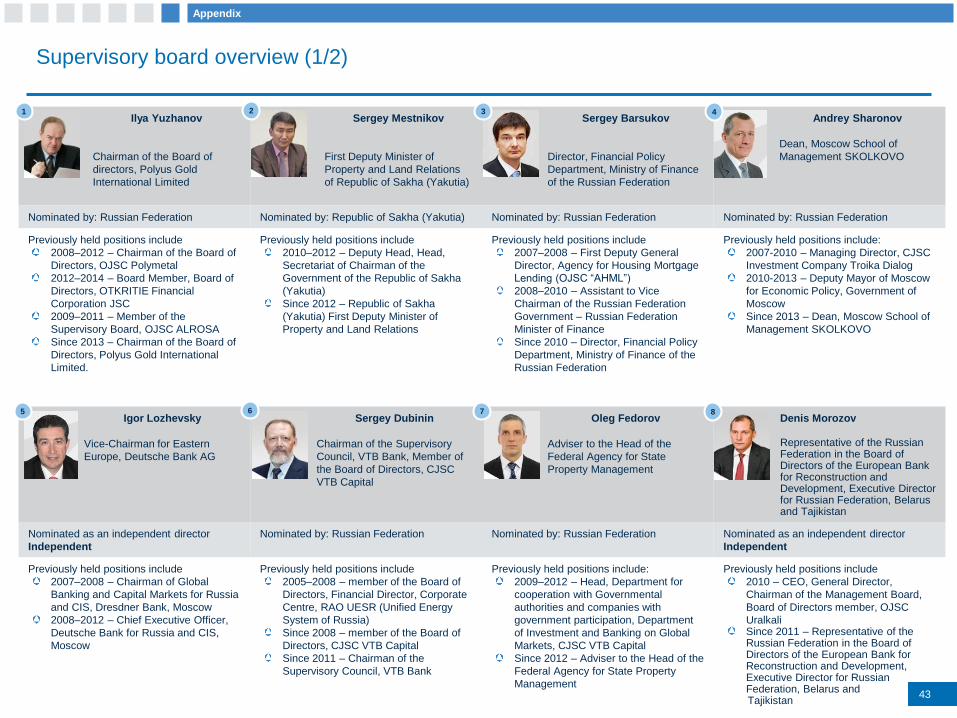
Ilya Yuzhanov
Chairman of the Board of
directors, Polyus Gold
International Limited
Sergey Mestnikov
First Deputy Minister of
Property and Land Relations
of Republic of Sakha (Yakutia)
Sergey Barsukov
Director, Financial Policy
Department, Ministry of Finance
of the Russian Federation
Andrey Sharonov
Dean, Moscow School of
Management SKOLKOVO
Nominated by: Russian Federation Nominated by: Republic of Sakha (Yakutia) Nominated by: Russian Federation Nominated by: Russian Federation
Previously held positions include
2008–2012 – Chairman of the Board of
Directors, OJSC Polymetal
2012–2014 – Board Member, Board of
Directors, OTKRITIE Financial
Corporation JSC
2009–2011 – Member of the
Supervisory Board, OJSC ALROSA
Since 2013 – Chairman of the Board of
Directors, Polyus Gold International
Limited.
Previously held positions include
2010–2012 – Deputy Head, Head,
Secretariat of Chairman of the
Government of the Republic of Sakha
(Yakutia)
Since 2012 – Republic of Sakha
(Yakutia) First Deputy Minister of
Property and Land Relations
Previously held positions include
2007–2008 – First Deputy General
Director, Agency for Housing Mortgage
Lending (OJSC “AHML”)
2008–2010 – Assistant to Vice
Chairman of the Russian Federation
Government – Russian Federation
Minister of Finance
Since 2010 – Director, Financial Policy
Department, Ministry of Finance of the
Russian Federation
Previously held positions include:
2007-2010 – Managing Director, CJSC
Investment Company Troika Dialog
2010-2013 – Deputy Mayor of Moscow
for Economic Policy, Government of
Moscow
Since 2013 – Dean, Moscow School of
Management SKOLKOVO
Igor Lozhevsky
Vice-Chairman for Eastern
Europe, Deutsche Bank AG
Sergey Dubinin
Chairman of the Supervisory
Council, VTB Bank, Member of
the Board of Directors, CJSC
VTB Capital
Oleg Fedorov
Adviser to the Head of the
Federal Agency for State
Property Management
Denis Morozov
Representative of the Russian Federation in the Board of Directors of the European Bank for Reconstruction and Development, Executive Director for Russian Federation, Belarus and Tajikistan
Nominated as an independent director
Independent
Nominated by: Russian Federation Nominated by: Russian Federation Nominated as an independent director
Independent
Previously held positions include
2007–2008 – Chairman of Global
Banking and Capital Markets for Russia
and CIS, Dresdner Bank, Moscow
2008–2012 – Chief Executive Officer,
Deutsche Bank for Russia and CIS,
Moscow
Previously held positions include
2005–2008 – member of the Board of
Directors, Financial Director, Corporate
Centre, RAO UESR (Unified Energy
System of Russia)
Since 2008 – member of the Board of
Directors, CJSC VTB Capital
Since 2011 – Chairman of the
Supervisory Council, VTB Bank
Previously held positions include:
2009–2012 – Head, Department for
cooperation with Governmental
authorities and companies with
government participation, Department
of Investment and Banking on Global
Markets, CJSC VTB Capital
Since 2012 – Adviser to the Head of the
Federal Agency for State Property
Management
Previously held positions include
2010 – CEO, General Director,
Chairman of the Management Board,
Board of Directors member, OJSC
UralkaliSince 2011 – Representative of the Russian Federation in the Board of Directors of the European Bank for Reconstruction and Development, Executive Director for Russian Federation, Belarus and Tajikistan
1 3
6 7 8
2
5
4
Supervisory board overview (1/2)
Appendix
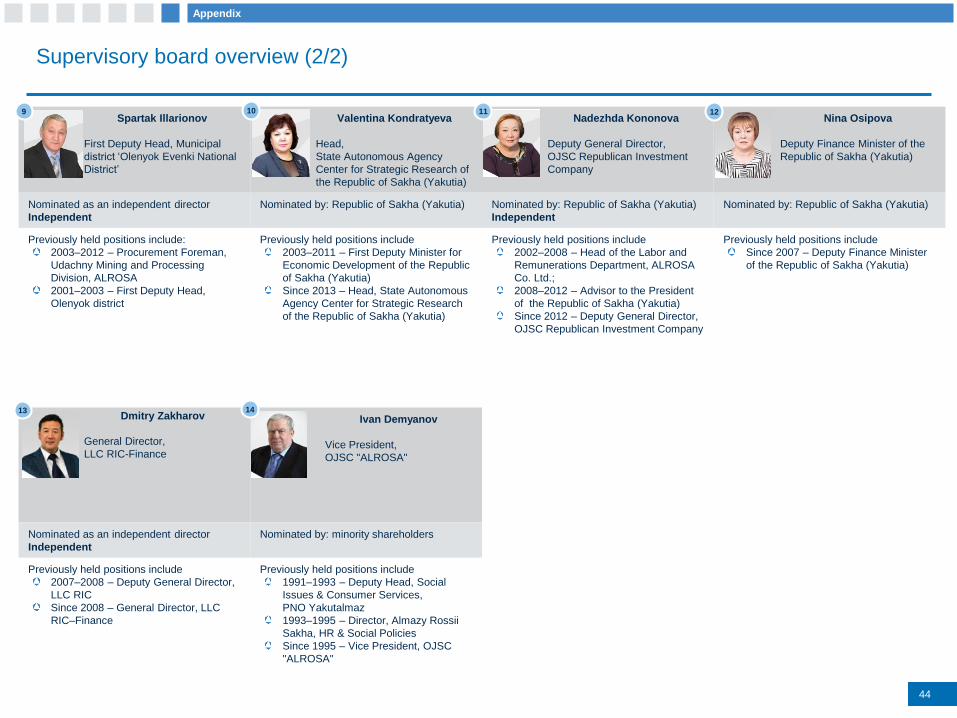
Spartak Illarionov
First Deputy Head, Municipal
district ‘Olenyok Evenki National
District’
Valentina Kondratyeva
Head,
State Autonomous Agency
Center for Strategic Research of
the Republic of Sakha (Yakutia)
Nadezhda Kononova
Deputy General Director,
OJSC Republican Investment
Company
Nina Osipova
Deputy Finance Minister of the
Republic of Sakha (Yakutia)
Nominated as an independent director
Independent
Nominated by: Republic of Sakha (Yakutia) Nominated by: Republic of Sakha (Yakutia)
Independent
Nominated by: Republic of Sakha (Yakutia)
Previously held positions include:
2003–2012 – Procurement Foreman,
Udachny Mining and Processing
Division, ALROSA
2001–2003 – First Deputy Head,
Olenyok district
Previously held positions include
2003–2011 – First Deputy Minister for
Economic Development of the Republic
of Sakha (Yakutia)
Since 2013 – Head, State Autonomous
Agency Center for Strategic Research
of the Republic of Sakha (Yakutia)
Previously held positions include
2002–2008 – Head of the Labor and
Remunerations Department, ALROSA
Co. Ltd.;
2008–2012 – Advisor to the President
of the Republic of Sakha (Yakutia)
Since 2012 – Deputy General Director,
OJSC Republican Investment Company
Previously held positions include
Since 2007 – Deputy Finance Minister
of the Republic of Sakha (Yakutia)
Dmitry Zakharov
General Director,
LLC RIC-Finance
Ivan Demyanov
Vice President,
OJSC "ALROSA"
Nominated as an independent director
Independent
Nominated by: minority shareholders
Previously held positions include
2007–2008 – Deputy General Director,
LLC RIC
Since 2008 – General Director, LLC
RIC–Finance
Previously held positions include
1991–1993 – Deputy Head, Social
Issues & Consumer Services,
PNO Yakutalmaz
1993–1995 – Director, Almazy Rossii
Sakha, HR & Social Policies
Since 1995 – Vice President, OJSC
"ALROSA"
44
10 11 12
1413
9
Supervisory board overview (2/2)
Appendix
45
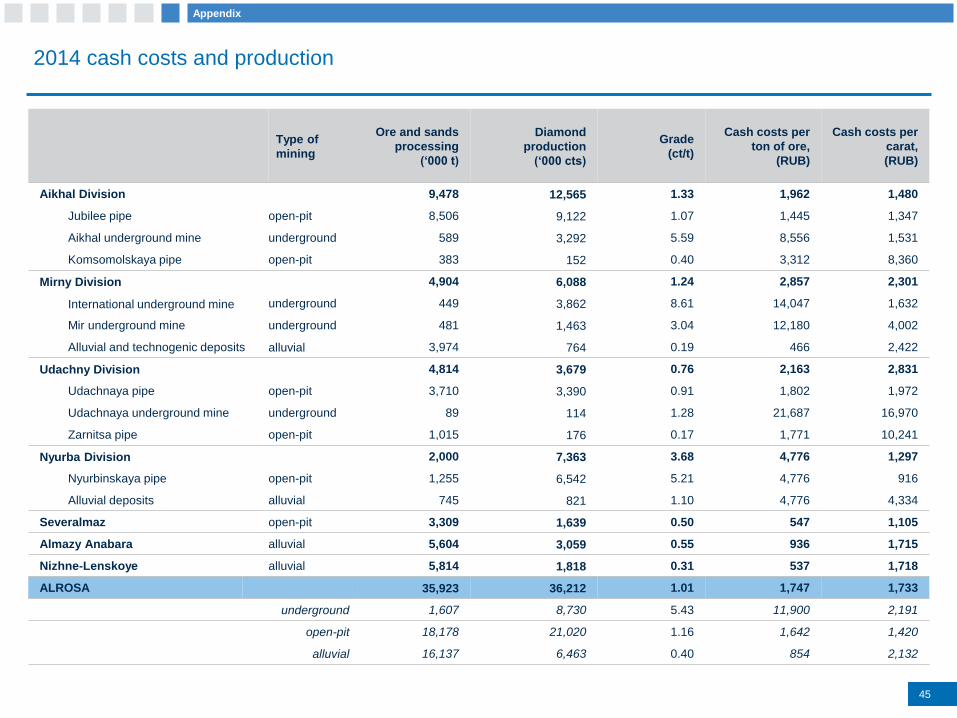
2014 cash costs and production
Type of
mining
Ore and sands
processing
(‘000 t)
Diamond
production
(‘000 cts)
Grade
(ct/t)
Cash costs per
ton of ore,
(RUB)
Cash costs per
carat,
(RUB)
Aikhal Division 9,478 12,565 1.33 1,962 1,480
Jubilee pipe open-pit 8,506 9,122 1.07 1,445 1,347
Aikhal underground mine underground 589 3,292 5.59 8,556 1,531
Komsomolskaya pipe open-pit 383 152 0.40 3,312 8,360
Mirny Division 4,904 6,088 1.24 2,857 2,301
International underground mine underground 449 3,862 8.61 14,047 1,632
Mir underground mine underground 481 1,463 3.04 12,180 4,002
Alluvial and technogenic deposits alluvial 3,974 764 0.19 466 2,422
Udachny Division 4,814 3,679 0.76 2,163 2,831
Udachnaya pipe open-pit 3,710 3,390 0.91 1,802 1,972
Udachnaya underground mine underground 89 114 1.28 21,687 16,970
Zarnitsa pipe open-pit 1,015 176 0.17 1,771 10,241
Nyurba Division 2,000 7,363 3.68 4,776 1,297
Nyurbinskaya pipe open-pit 1,255 6,542 5.21 4,776 916
Alluvial deposits alluvial 745 821 1.10 4,776 4,334
Severalmaz open-pit 3,309 1,639 0.50 547 1,105
Almazy Anabara alluvial 5,604 3,059 0.55 936 1,715
Nizhne-Lenskoye alluvial 5,814 1,818 0.31 537 1,718
ALROSA 35,923 36,212 1.01 1,747 1,733
underground 1,607 8,730 5.43 11,900 2,191
open-pit 18,178 21,020 1.16 1,642 1,420
alluvial 16,137 6,463 0.40 854 2,132
Appendix