Embed Size (px)
Citation preview

Investor presentation
2
Disclaimer
The information contained herein has been prepared for the use in this Presentation (the “Presentation”) and has not been independently verified. Such information is confidential
and is being provided to you solely for your information and may not be reproduced, retransmitted, further distributed to any other person or published, in whole or in part, for any
purpose.
The opinions presented herein are based on general information gathered at the time of writing and are subject to change without notice. Certain industry, market and competitive
position data contained in this Presentation come from official or third party sources believed to be reliable but ALROSA does not guarantee its accuracy or completeness.
This Presentation contains statements about future events and expectations that are forward-looking statements. Any statement in this Presentation that is not a statement of
historical fact is a forward-looking statement that involves known and unknown risks, uncertainties and other factors which may cause the ALROSA’s actual results, performance
or achievements to be materially different from any future results, performance or achievements expressed or implied by such forward-looking statements. Past performance
should not be taken as an indication or guarantee of future results, and no representation or warranty, express or implied, is made regarding future performance. ALROSA
assumes no obligation to update, supplement or revise forward-looking or any other statements contained herein to reflect actual results, changes in assumptions or changes in
factors affecting these statements. ALROSA does not intend or have any duty or obligation to update or to keep current any information contained in this Presentation.
The diamond resources and reserves estimates provided in this Presentation have been prepared and presented in accordance with the standards and classifications of the
JORC Code (the Australasian Code for Reporting of Exploration Results, Mineral Resources and Ore Reserves as promulgated by the Australasian Joint Ore Reserves
Committee), which differ in significant respects from the standards and classifications applicable to the disclosure of mineral resources and reserves under the laws and
regulations of certain other jurisdictions, including the regulations of the U.S. Securities Exchange Commission (the “SEC”) with respect to registration statements and other
documents filed with the SEC. Among other things, in accordance with the JORC Code, this Presentation provides certain mineral resources estimates classified as “inferred”,
“indicated” or “measured”, which differ in significant respects from “probable” and “proven” mineral reserves estimates and are not disclosed in certain jurisdictions, including in
SEC filings. There can be significant uncertainty as to whether mineral resources can ever be feasibly and commercially mined. For further explanation of the JORC Code, see
the JORC website at www.jorc.org.
This Presentation does not constitute an offer to sell, or any solicitation of any offer to subscribe for or purchase, any securities. No part of this Presentation, nor the fact of its
distribution, should form any basis of, or be relied on in connection with, any contract or commitment or investment decision whatsoever.
The information in this Presentation is subject to verification, completion and change. No representation or warranty or undertaking, express or implied, is made as to, and no
reliance should be placed on, the accuracy or completeness of the information or opinions contained in this Presentation. None of ALROSA nor any of its shareholders, directors,
officers or employees, affiliates, advisors, representatives nor any other person accepts any liability whatsoever for any loss howsoever arising from any use of this Presentation
or its contents or otherwise arising in connection therewith.
This Presentation is not directed to, or intended for distribution to or use by, any person or entity that is a citizen or resident or located in any locality, state, country or other
jurisdiction where such distribution, publication, availability or use would be contrary to law or regulation or which would require any registration or licensing within such
jurisdiction.
This Presentation is not for distribution, directly or indirectly, to the public in the United States (including its territories and possessions, any State of the United States and the
District of Columbia). These materials are not an offer or solicitation to purchase or subscribe for securities in the United States or any other jurisdiction. Securities may not be
offered or sold in the United States absent registration with the U.S. Securities and Exchange Commission or an exemption from registration under the U.S. Securities Act of
1933, as amended. ALROSA does not intend to register any part of any offering in the United States or to conduct a public offering of any of its securities in the United States.
By attending a meeting where this Presentation is made or reviewing this Presentation you acknowledge and agree to be bound by the foregoing.
3
Market Overview 4
ALROSA Performance Overview 21
Contents
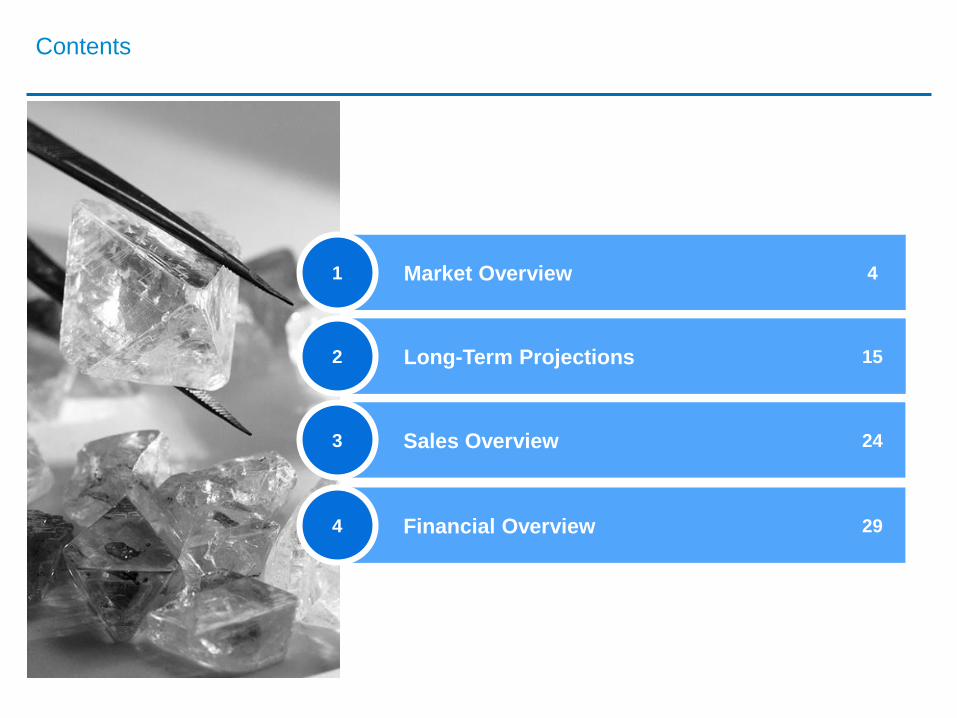
Market Overview1 4
Long-Term Projections2 15
Sales Overview3 24
Financial Overview4 29
4
Market Overview
5
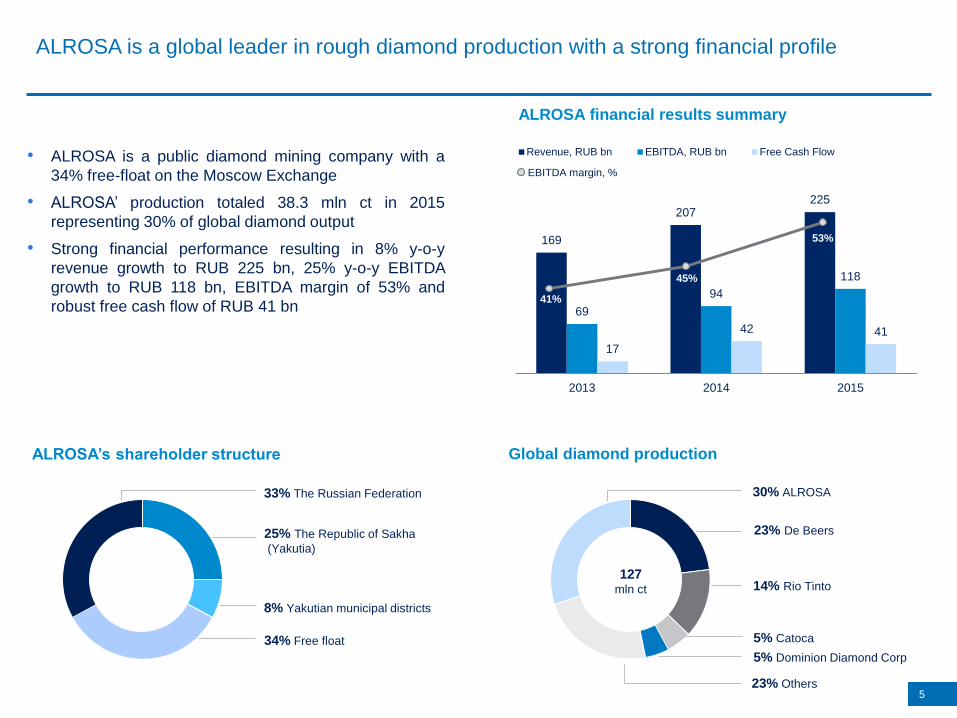
ALROSA is a global leader in rough diamond production with a strong financial profile
33% The Russian Federation
25% The Republic of Sakha
(Yakutia)
8% Yakutian municipal districts
34% Free float
ALROSA’s shareholder structure
169
207225
69
94
118
17
42 41
0
50
100
150
200
2013 2014 2015
Revenue, RUB bn EBITDA, RUB bn Free Cash Flow
ALROSA financial results summary
Global diamond production
• ALROSA is a public diamond mining company with a
34% free-float on the Moscow Exchange
• ALROSA’ production totaled 38.3 mln ct in 2015
representing 30% of global diamond output
• Strong financial performance resulting in 8% y-o-y
revenue growth to RUB 225 bn, 25% y-o-y EBITDA
growth to RUB 118 bn, EBITDA margin of 53% and
robust free cash flow of RUB 41 bn
30% ALROSA
23% De Beers
14% Rio Tinto
23% Others
127mln ct
41%
45%
53%
EBITDA margin, %
5% Catoca
5% Dominion Diamond Corp

Rough diamond production is dominated by a few mining companies with the highest marginsacross diamond pipeline
6Source: Company data, Kimberley Process, Euromonitor, AWDC Bain report “The Global Diamond industry 2016”, AWDC Bain report “The Global Diamond industry 2015”, AWDC
Bain report “The Global Diamond Report 2014”, AWDC Bain report “The Global Diamond Report 2013”.
Rough diamond
production
Cutting & polishing
of diamonds
Diamond jewelry
manufacturing
Retail sales of
diamond jewelry
Margins
Players
Entry
barriers
Top-5 players control
~ 70% of the market~ 5,000 players > 10,000 players
Major retailers
control ~ 35% of the
market
High Low Medium Medium
18-22%
Sales of rough
diamonds from
major producers
~ 100 players
High
1-3% <1% 3-5% 4-11%
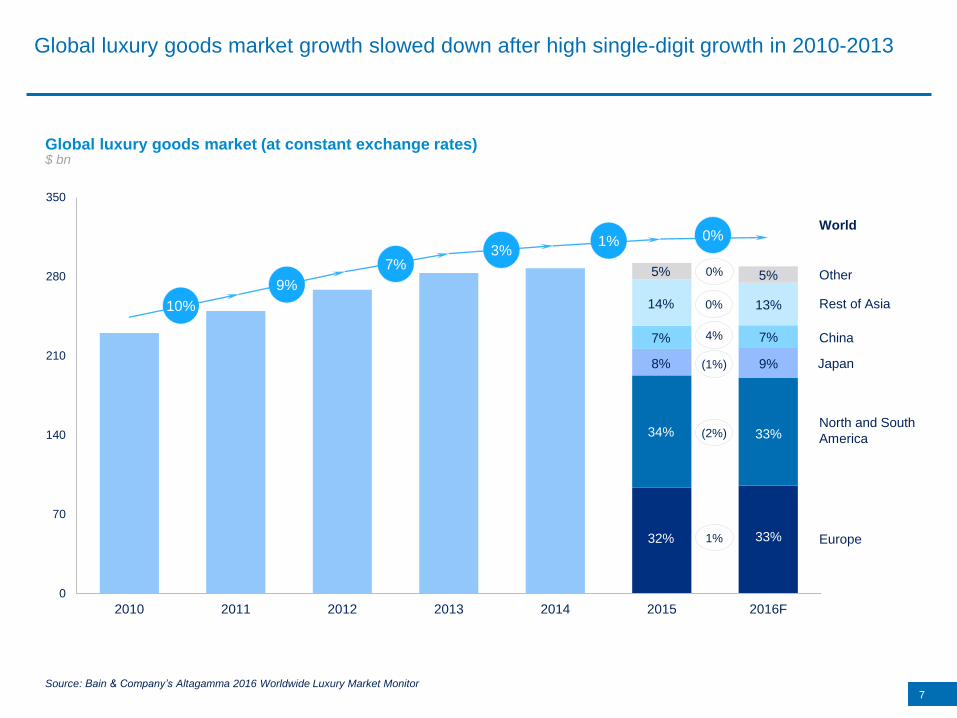
North and South
America
Europe
Japan
China
Other
World
Global luxury goods market (at constant exchange rates)
7
$ bn
Global luxury goods market growth slowed down after high single-digit growth in 2010-2013
0
70
140
210
280
350
2010 2011 2012 2013 2014 2015 2016F
33%
33%
9%
7%
13%
5%
Source: Bain & Company’s Altagamma 2016 Worldwide Luxury Market Monitor
32%
34%
8%
7%
14%
5%
10%
3%1% 0%
Rest of Asia
4%
(1%)
(2%)
1%
0%
0%
9%
7%
0
10
20
2012 2013 2014 2015 9M 2016
Polished diamondsproduced
Polished diamondsexported
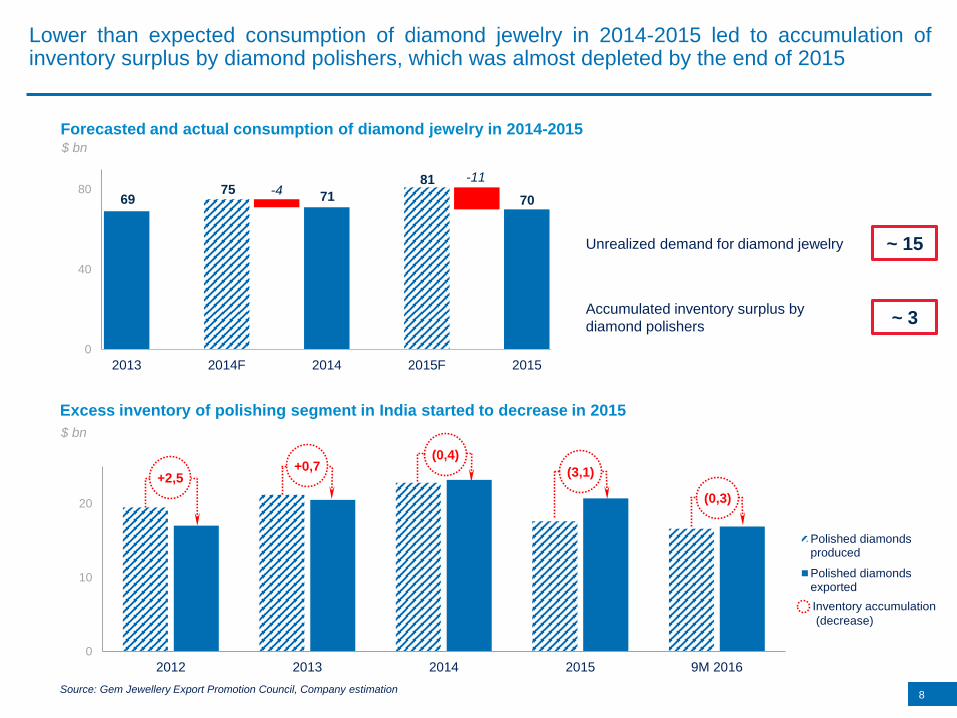
Lower than expected consumption of diamond jewelry in 2014-2015 led to accumulation ofinventory surplus by diamond polishers, which was almost depleted by the end of 2015
8Source: Gem Jewellery Export Promotion Council, Company estimation
Excess inventory of polishing segment in India started to decrease in 2015
$ bn
Forecasted and actual consumption of diamond jewelry in 2014-2015$ bn
6975
71
81
70-4
-11
0
40
80
2013 2014F 2014 2015F 2015
(0,3)
(3,1)
(0,4)+0,7
+2,5
Inventory accumulation
(decrease)
~ 15 Unrealized demand for diamond jewelry
Accumulated inventory surplus by
diamond polishers~ 3
9
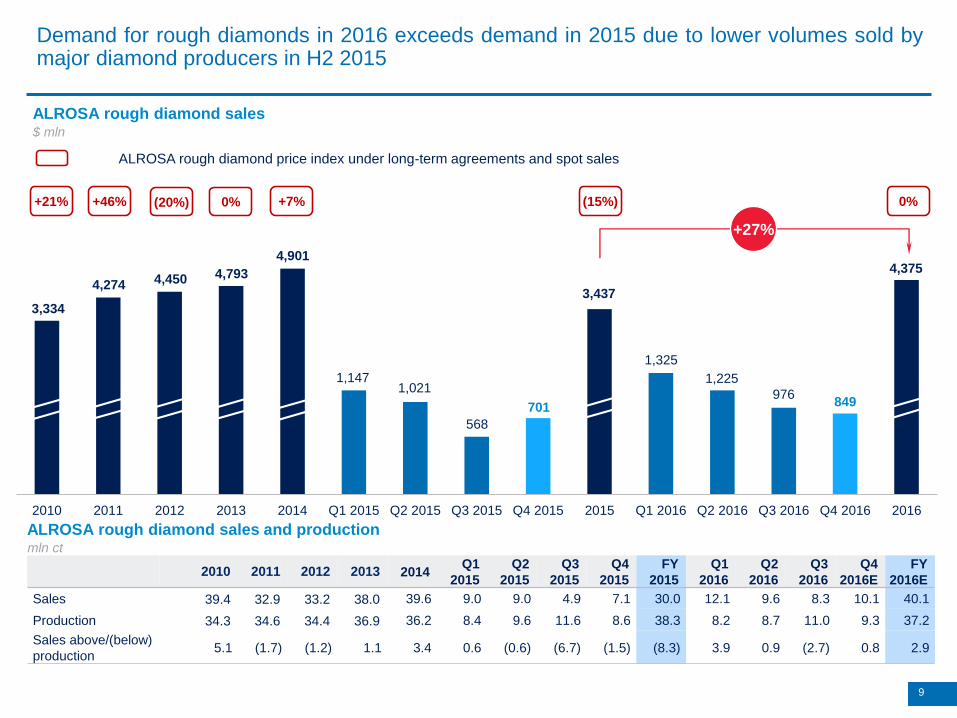
Demand for rough diamonds in 2016 exceeds demand in 2015 due to lower volumes sold bymajor diamond producers in H2 2015
2010 2011 2012 2013 2014Q1
2015
Q2
2015
Q3
2015
Q4
2015
FY
2015
Q1
2016
Q2
2016
Q3
2016
Q4
2016E
FY
2016E
Sales 39.4 32.9 33.2 38.0 39.6 9.0 9.0 4.9 7.1 30.0 12.1 9.6 8.3 10.1 40.1
Production 34.3 34.6 34.4 36.9 36.2 8.4 9.6 11.6 8.6 38.3 8.2 8.7 11.0 9.3 37.2
Sales above/(below)
production5.1 (1.7) (1.2) 1.1 3.4 0.6 (0.6) (6.7) (1.5) (8.3) 3.9 0.9 (2.7) 0.8 2.9
ALROSA rough diamond sales and productionmln ct
2010 2011 2012 2013 2014 Q1 2015 Q2 2015 Q3 2015 Q4 2015 2015 Q1 2016 Q2 2016 Q3 2016 Q4 2016 2016
ALROSA rough diamond sales$ mln
3,334
1,021
568
1,225
3,437
701
4,375
+27%
4,274 4,450 4,793
4,901
+21% +46% (20%) 0% +7% (15%)
ALROSA rough diamond price index under long-term agreements and spot sales
1,147
1,325
976849
0%

0
10
20
2006 2007 2008 2009 2010 2011 2012 2013 2014 2015
0
40
80
2006 2007 2008 2009 2010 2011 2012 2013 2014 2015
Global diamond jewelry sales
Global rough diamond sales
3% per year
5% per year
0
15
30
2006 2007 2008 2009 2010 2011 2012 2013 2014 2015
Global polished diamond sales
4% per year
$ bn
10
$ bn
$ bn
Diamond industry grew 3-5% over the past decade
ALROSA rough diamond price index%
20062007 2008
2009
2010 2011
2012
2013 2014
2015
4% per year
30%
0%
15%
-15%
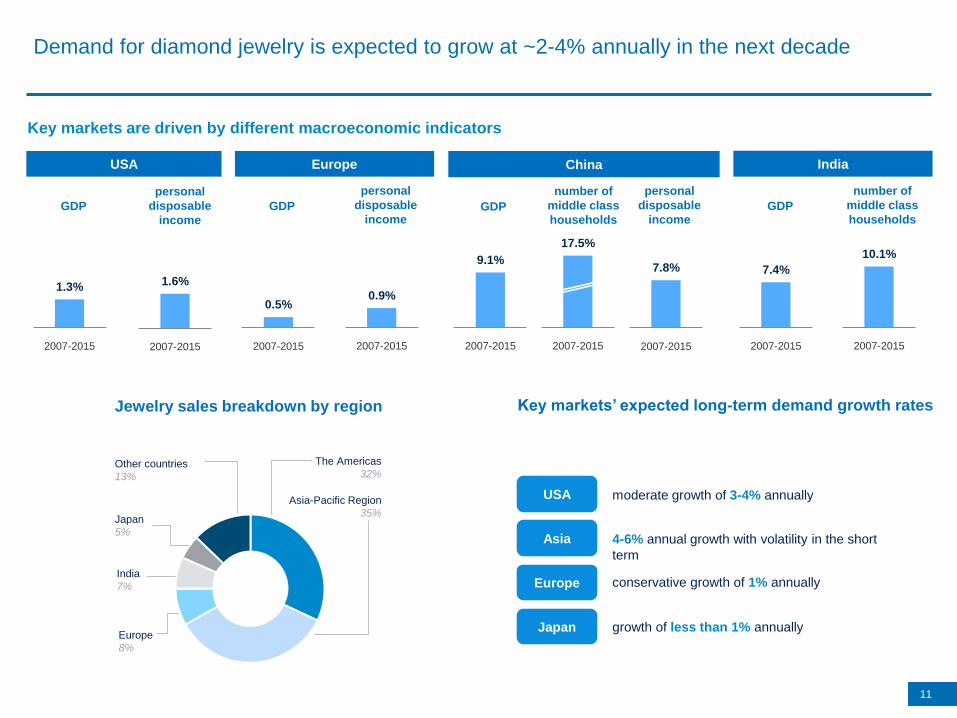
Demand for diamond jewelry is expected to grow at ~2-4% annually in the next decade
Key markets are driven by different macroeconomic indicators
1.3%
2007-2015
1.6%
2007-2015
0.5%
2007-2015
0.9%
2007-2015
17.5%
2007-2015
7.8%
2007-2015
10.1%
2007-2015
personal
disposable
income
USA Europe
GDP
personal
disposable
incomeGDP
China India
personal
disposable
income
number of
middle class
householdsGDP
9.1%
2007-2015
7.4%
2007-2015
GDP
11
number of
middle class
households
Key markets’ expected long-term demand growth rates
The Americas
32%
Asia-Pacific Region
35%
India
7%
Japan
5%
Other countries
13%
Jewelry sales breakdown by region
4-6% annual growth with volatility in the short
term
USA
Asia
Europe
Japan
moderate growth of 3-4% annually
conservative growth of 1% annually
growth of less than 1% annuallyEurope
8%
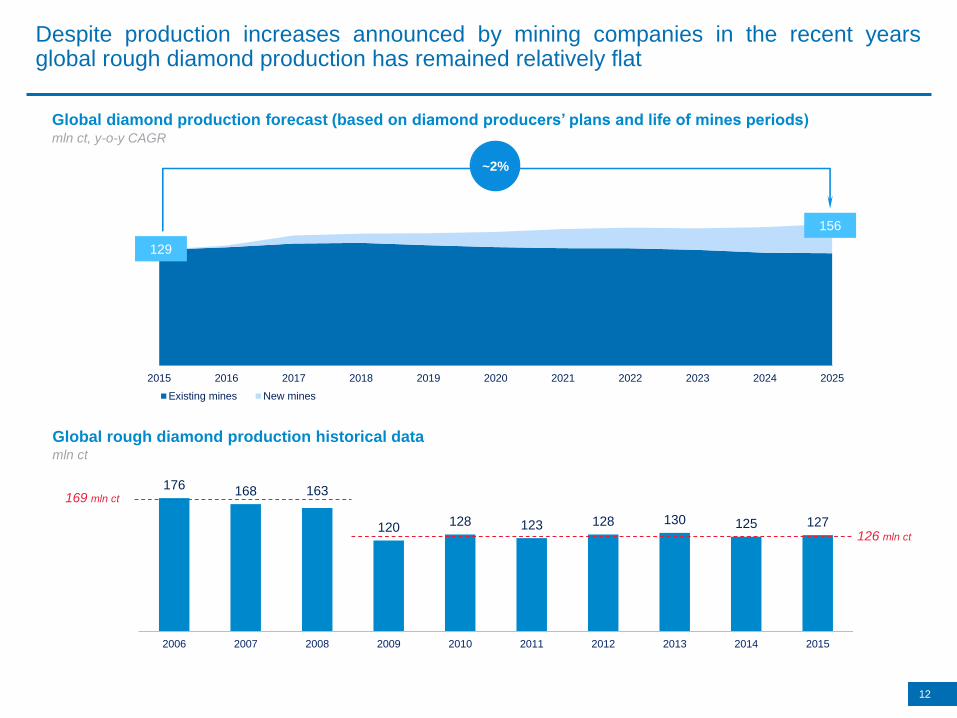
Despite production increases announced by mining companies in the recent yearsglobal rough diamond production has remained relatively flat
12
Global rough diamond production historical datamln ct
176 168 163
120 128 123 128 130 125 127
2006 2007 2008 2009 2010 2011 2012 2013 2014 2015
2015 2016 2017 2018 2019 2020 2021 2022 2023 2024 2025
Existing mines New mines
Global diamond production forecast (based on diamond producers’ plans and life of mines periods)mln ct, y-o-y CAGR
129
156
~2%
126 mln ct
169 mln ct

13
Diamond exploration becomes increasingly challenging
• Approximately 15% of kimberlites discovered are diamond-bearing, with 1% of these typically becoming producing
mines
• Currently, the search of new kimberlite pipes is complicated due to overburden, all surface kimberlite pipes have
already been discovered
• The average time from discovery to production for diamond mines is approximately 6 years
Discovery-to-production period, in years
It takes around 6 years from discovery to start of
production at a mine
9
76 6 6
4 4
Diavik Ekati Argyle Nyurbinskaya Catoca Finsch Orapa(Rio Tinto / Dominion Diamond
Corp.)
(Dominion Diamond
Corp.)
(Rio Tinto) (ALROSA) (ALROSA/Endiama /
Odebrecht / LLI Holding )
(Petra Diamonds)
(De Beers)
Development process
Development process
+ dewatering
Discovery of new kimberlites is much more challenging now
1954-
1956
1960 1969 1974-
1975
1994 1996 2006
I II III
Aikhal
International
Jubilee
Botuobinskaya
Nyurbinskaya
Maiyskaya
Host rocks Sandstones
(overburden)
Kimberlite pipes
60 m
9 m
80 m 70 m
Year discovered

10
15
20
2015 2016 2017 2018 2019 2020 2021 2022 2023 2024 2025
Rough diamonds demand
Rough diamonds deliveries tothe market in the amount ofproduction
Rough diamonds deliveries tothe market including sales frominventories
Rough diamonds sales from
inventories
14
Rough diamonds market is expected to be balanced in the mid-term; demand is expected toexceed supply after major diamond mining companies sell rough diamonds from inventoriesaccumulated in 2015
14
Global demand and supply imbalance
$ bn
Imbalance emergesThe market is balanced
Rough diamonds demand: 0-2% annually
Rough diamonds deliveries to the market: 0-2%
annually
Rough diamonds demand: 2-4% annually
Rough diamonds deliveries to the market: 1-2%
annually
$ bn

151515
Long-Term Projections
16
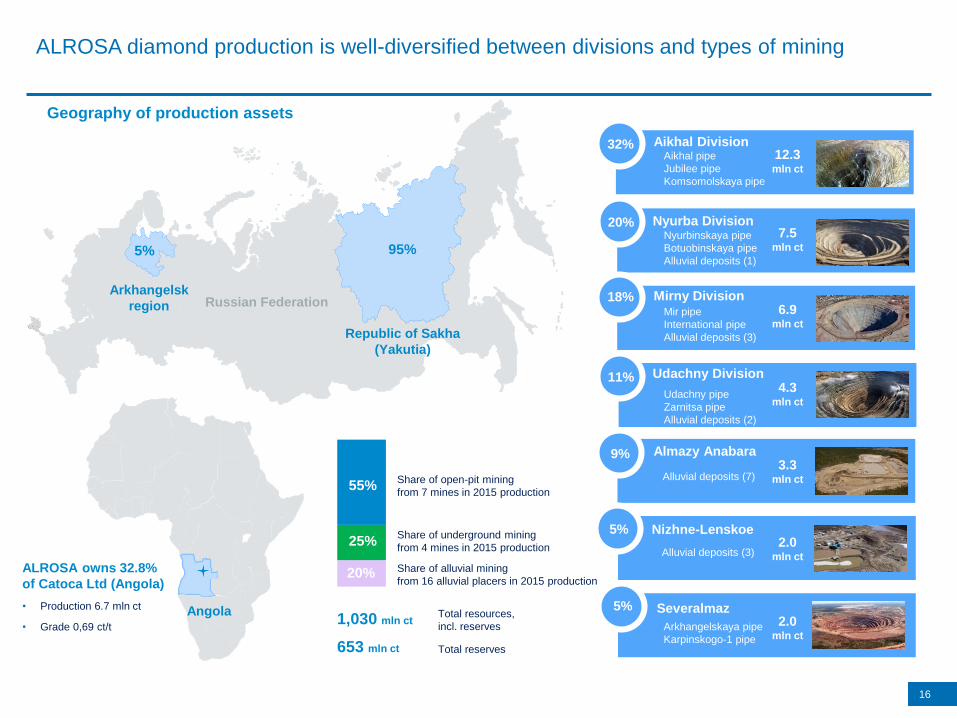
ALROSA diamond production is well-diversified between divisions and types of mining
Severalmaz
Aikhal Division
18%
11%
9%
5%
Nyurba Division
Mirny Division
Udachny Division
Almazy Anabara
Nizhne-Lenskoe
Aikhal pipe
Jubilee pipe
Komsomolskaya pipe
Nyurbinskaya pipe
Botuobinskaya pipe
Alluvial deposits (1)
Mir pipe
International pipe
Alluvial deposits (3)
Udachny pipe
Zarnitsa pipe
Alluvial deposits (2)
Alluvial deposits (7)
Alluvial deposits (3)
Arkhangelskaya pipe
Karpinskogo-1 pipe
1,030 mln ctTotal resources,
incl. reserves
653 mln ct Total reserves
Share of open-pit mining
from 7 mines in 2015 production
Share of underground mining
from 4 mines in 2015 production
Share of alluvial mining
from 16 alluvial placers in 2015 production
32%
20%
5%
55%
25%
20%
Geography of production assets
Republic of Sakha
(Yakutia)
Arkhangelsk
region Russian Federation
2.0mln ct
12.3mln ct
7.5mln ct
6.9mln ct
4.3mln ct
3.3mln ct
2.0mln ct
95%5%
Angola
ALROSA owns 32.8%
of Catoca Ltd (Angola)
• Production 6.7 mln ct
• Grade 0,69 ct/t
0.47 0.49
1.13
3.40
5.40
8.15
Se
vera
lmaz
Alm
azy A
nabara
&N
izhne
-Lenskoye
Jub
ilee p
ipe
Mir u
nderg
round
min
e
Aik
hail
underg
round m
ine
Inte
rnatio
nal
underg
round m
ine
Jubilee
pipe
Aikhal
underground
mine
International
underground
mine
1.04
ALROSA
total
Severalmaz
4661
83
145 151
210
Aik
hail
underg
round m
ine
Se
vera
lmaz
Alm
azy A
nabara
&N
izhne
-Lenskoye
Mir u
nderg
round m
ine
Jub
ilee p
ipe
Inte
rnatio
nal
underg
round m
ine
Severalmaz Alluvials Jubilee
pipe
122
ALROSA
total
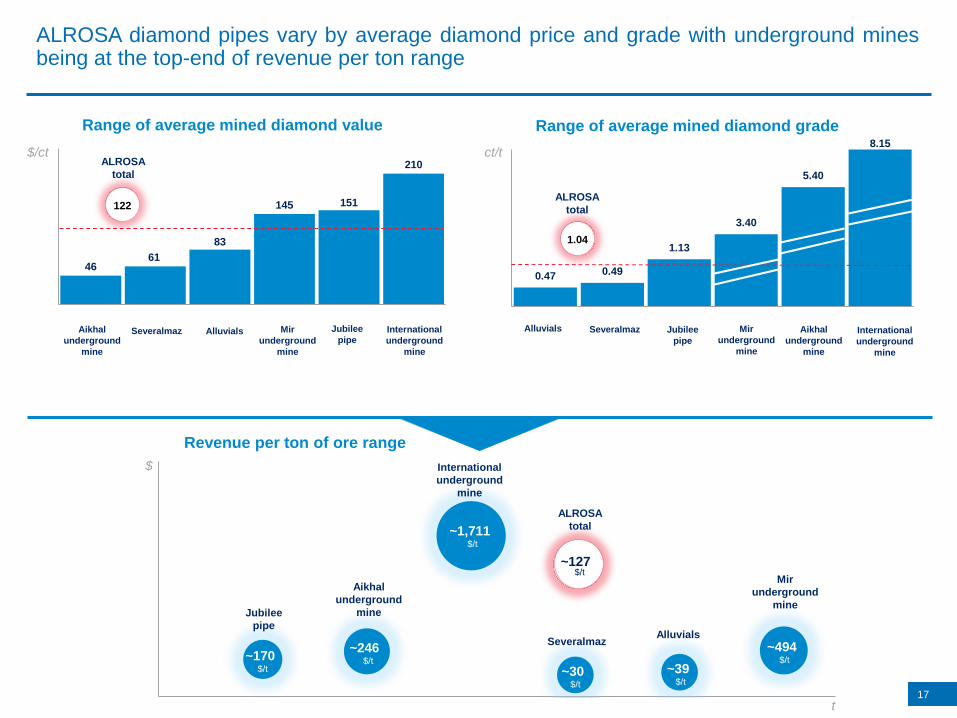
ALROSA diamond pipes vary by average diamond price and grade with underground minesbeing at the top-end of revenue per ton range
$/ct
Range of average mined diamond value Range of average mined diamond grade
ct/t
17
~170$/t
~246$/t
~1,711$/t
~30$/t
~39$/t
~494$/t
0
500
1000
1500
2000
2500
0 1 2 3 4 5 6
Mir
underground
mine
International
underground
mine
Jubilee
pipe
Aikhal
underground
mine
ALROSA
total
~127 $/t
Severalmaz
$
Alluvials
Revenue per ton of ore range
Aikhal
underground
mine
Mir
underground
mine
International
underground
mine
Alluvials Mir
underground
mine
t
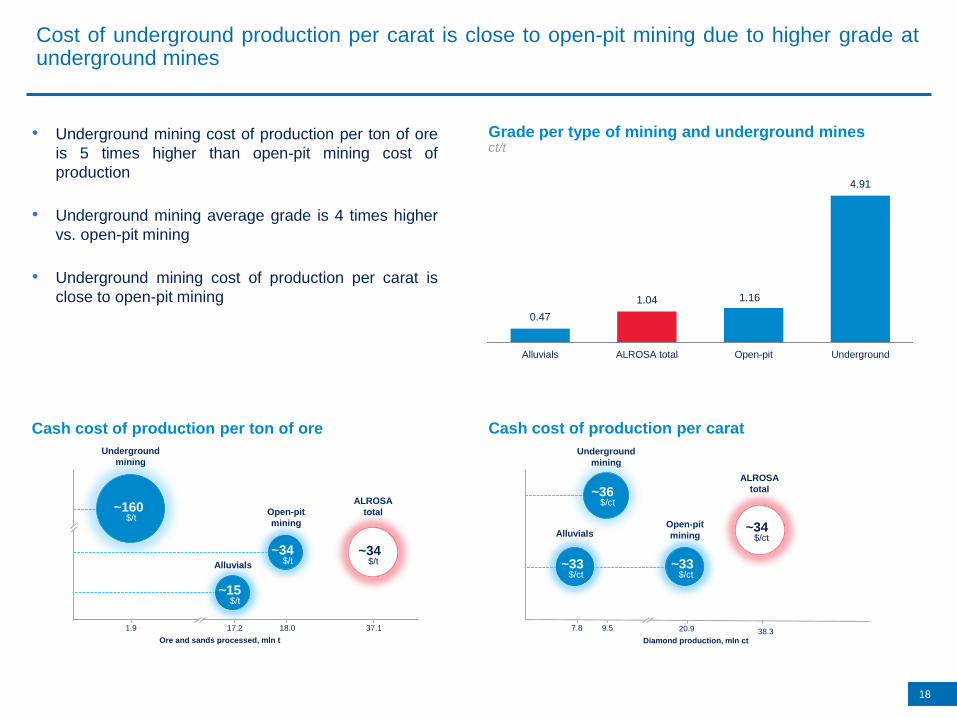
Cost of underground production per carat is close to open-pit mining due to higher grade atunderground mines
18
• Underground mining cost of production per ton of ore
is 5 times higher than open-pit mining cost of
production
• Underground mining average grade is 4 times higher
vs. open-pit mining
• Underground mining cost of production per carat is
close to open-pit mining0.47
1.04 1.16
4.91
Alluvials ALROSA total Open-pit Underground
Grade per type of mining and underground mines ct/t
Ore and sands processed, mln t
1.9 37.1
Underground
mining
Open-pit
mining
~160$/t
~34$/t
Cash cost of production per ton of ore Cash cost of production per carat
9.5 38.3
Underground
mining
Open-pit
mining
~36$/ct
~33$/ct
Diamond production, mln ct
ALROSA
total
ALROSA
total
~34$/ct
~34$/t
~15$/t
Alluvials ~33$/ct
Alluvials
18.017.2 7.8 20.9

19
ALROSA intends to increase diamond production to over 41 mln ct by 2019Severalmaz and Udachny are the key production growth drivers
ALROSA production forecastmln ct
CAGR 15–21F
17%
7%
(1%)32.4 32.8 33.0 32.1 31.7 31.0 30.4
3.92.2
3.8 4.6 5.45.5 5.7
2.02.0
2.4 3.24.3 4.6 5.1
2015 2016F 2017F 2018F 2019F 2020F 2021F
38.337.0
39.2
41.341.241.5
39.91%
Grade (ct/t)
Severalmaz Udachny pipe Other projects
1.03 0.99 1.00 0.97 0.94 0.91 0.90
69%
63%
68%
84% 75%87%
17%
18%
24%
11%15%
6%
13%
16%
6%
1%2%
2%
1%
3%
2%
4%8%
5%
0
10
20
30
40
2016F 2017F 2018F 2019F 2020F 2021F
Other projects Udachny division Verkhne-Munskoe deposit Severalmaz
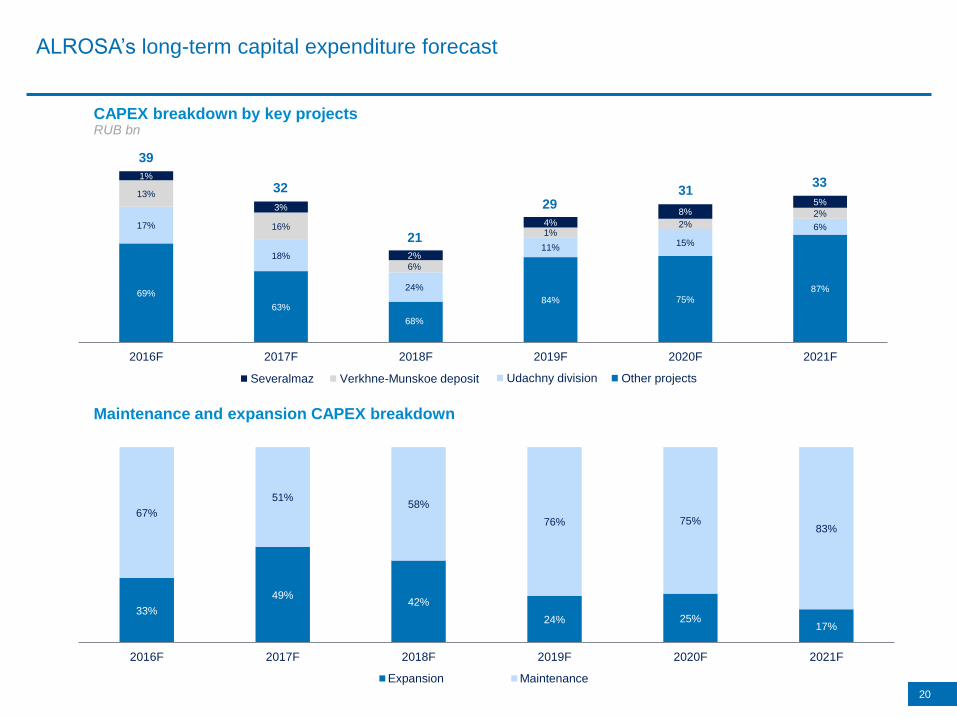
20
ALROSA’s long-term capital expenditure forecast
CAPEX breakdown by key projectsRUB bn
39
32
21
2931
33
Maintenance and expansion CAPEX breakdown
33%
49%42%
24% 25%17%
67%
51%58%
76% 75%83%
2016F 2017F 2018F 2019F 2020F 2021F
Expansion Maintenance
Other projectsSeveralmaz Verkhne-Munskoe deposit Udachny division
21
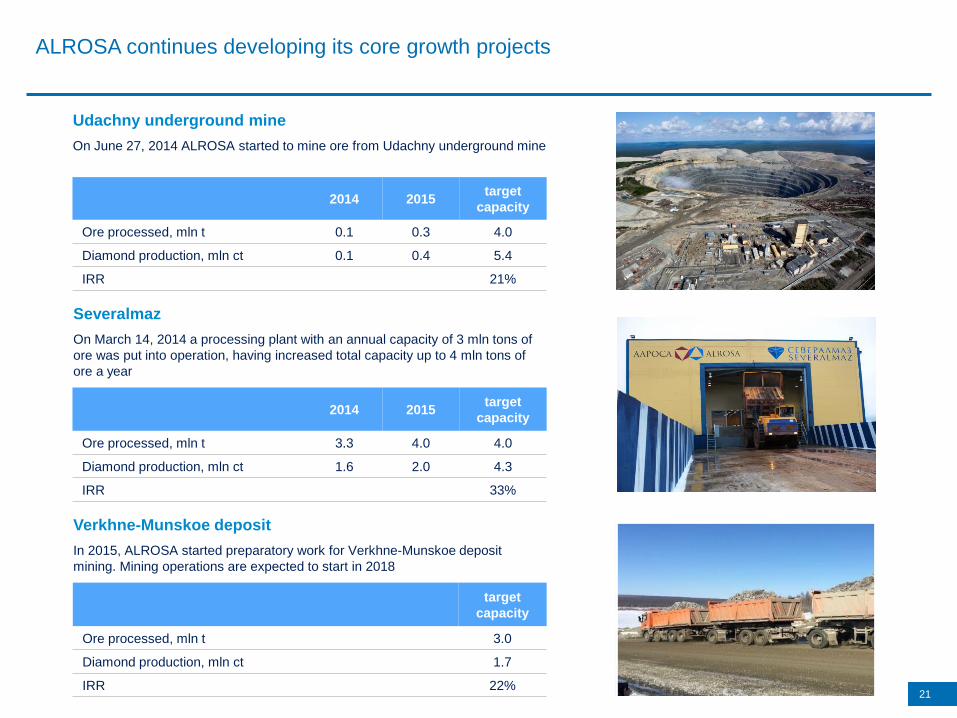
ALROSA continues developing its core growth projects
Udachny underground mine
On June 27, 2014 ALROSA started to mine ore from Udachny underground mine
Severalmaz
On March 14, 2014 a processing plant with an annual capacity of 3 mln tons of
ore was put into operation, having increased total capacity up to 4 mln tons of
ore a year
2014 2015target
capacity
Ore processed, mln t 0.1 0.3 4.0
Diamond production, mln ct 0.1 0.4 5.4
IRR 21%
2014 2015target
capacity
Ore processed, mln t 3.3 4.0 4.0
Diamond production, mln ct 1.6 2.0 4.3
IRR 33%
Verkhne-Munskoe deposit
In 2015, ALROSA started preparatory work for Verkhne-Munskoe deposit
mining. Mining operations are expected to start in 2018
target
capacity
Ore processed, mln t 3.0
Diamond production, mln ct 1.7
IRR 22%

22
Economic efficiency of Udachny underground mine will be fostered by block caving miningmethod
Next production level
Production levelBackfilled production level
Next production
level
Block caving method Traditional cut-and-fill mining
Mir underground
mine
International
underground mine
Aikhal underground
mineUdachny underground mine
Cut-and-fill mining method at Udachny underground mine would have required more than 330 thousand tons of cement a year
(~ RUB 1bn in current prices), which is an equivalent of total cement output in the Republic of Sakha (Yakutia).

ALROSA continues to streamline its operations to focus on diamond mining
23
Number of subsidiaries
70
3933
2520
01.01.2009 01.01.2015 current state 01.01.2017 01.01.2020
• Timir iron ore project
• Irelyakhneft oil project
• ALROSA Insurance
Company
Prior to 2015, ALROSA sold 31 non-core
assets with total proceeds of more than
RUB 7 bn, incl.:
• ALROSA-VGS
• MAK-Bank
• Nikonovka
• M&Diamond
• Suntarceolit
In 2015, ALROSA sold 5 non-core
assets with total proceeds of
RUB 0.3 bn, incl.:
• Geotransgaz
• Urengoy Gas Company
• Viluiskaya-3 HPP
• HIDROCHICAPA
Major non-core assets ALROSA
intends to sell, incl.:
2424
Sales Overview

25
34%
3%
66%
97%
Gem-quality diamond sales account for 66% of total sales volume and 97% of sales value
Diamond sales breakdown
Industrial
(less than
0.03 ct or less
than 1.5 mm)
Gem-quality
(more than
0.03 ct or
more than
1.5 mm)
by sales volume by sales value
26
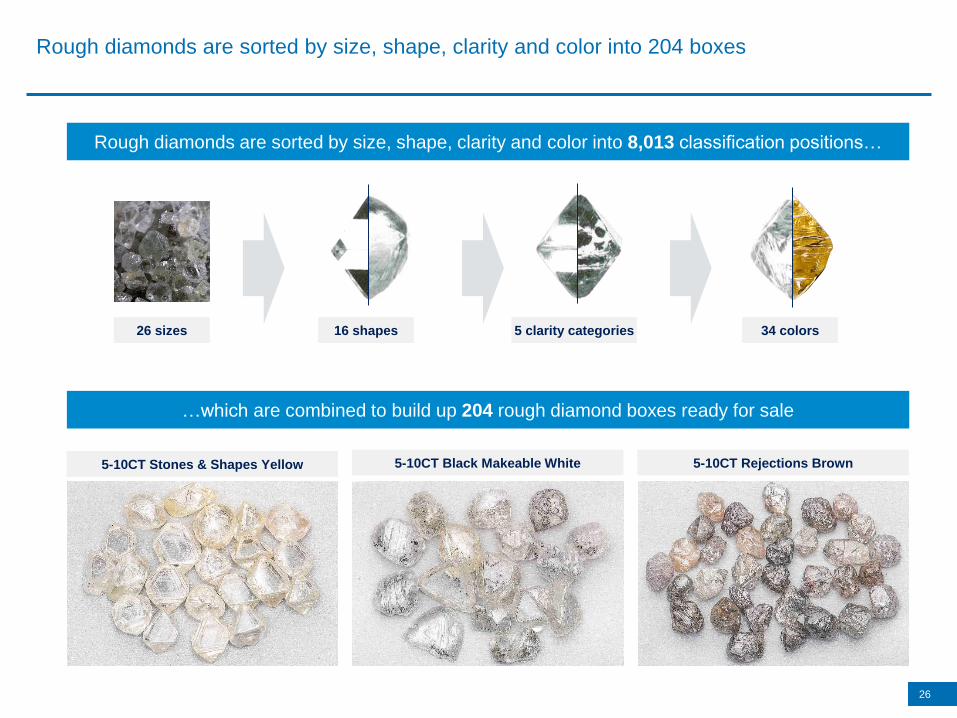
Rough diamonds are sorted by size, shape, clarity and color into 204 boxes
16 shapes 5 clarity categories 34 colors26 sizes
Rough diamonds are sorted by size, shape, clarity and color into 8,013 classification positions…
5-10CT Stones & Shapes Yellow
…which are combined to build up 204 rough diamond boxes ready for sale
5-10CT Rejections Brown5-10CT Black Makeable White
27
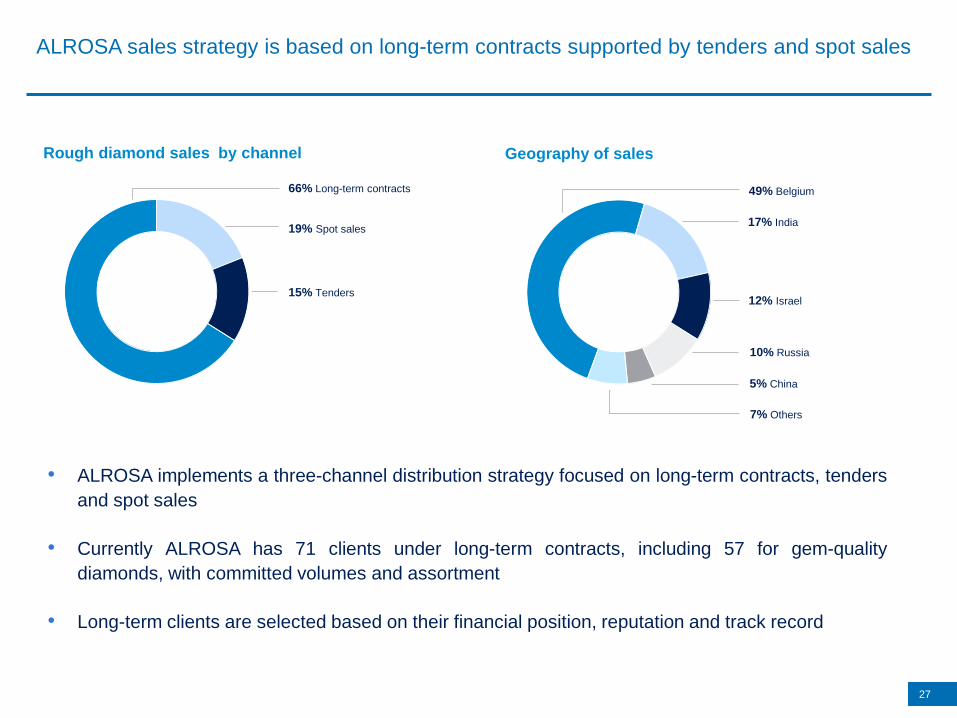
ALROSA sales strategy is based on long-term contracts supported by tenders and spot sales
Rough diamond sales by channel
• ALROSA implements a three-channel distribution strategy focused on long-term contracts, tenders
and spot sales
• Currently ALROSA has 71 clients under long-term contracts, including 57 for gem-quality
diamonds, with committed volumes and assortment
• Long-term clients are selected based on their financial position, reputation and track record
Geography of sales
66% Long-term contracts
15% Tenders
49% Belgium
17% India
10% Russia
5% China
7% Others
19% Spot sales
12% Israel

28
ALROSA has increased the number of clients due to responsible client policy
2010 2015 Change
Long-term contracts 15 71 +56
Spot sales / tenders 176 299 +123
Total number of clients 191 370 +179
Average monthly sales per
client, $ mln1.45 0.77 (47)%
Top 5 clients share in total sales 24% 18% (6)pp
Top 5 clients average monthly
sales per client, $ mln13.18 10.12 (23)%
Number of clients by sales channel
ALROSA pursues a responsible client policy, conducting a rigorous selection of clients which has
contributed to an increase in diversification and number of clients in all sales channels
• appropriate legal capacity
• sustainable financial position
• experience in diamond business
• sufficient level of solvency
Approval of clients with the following conditions:
• no more than $20 mln per month per client
• no more than 5% of total monthly sales per
client
Sales diversification conditions:

29
Financial Overview
30
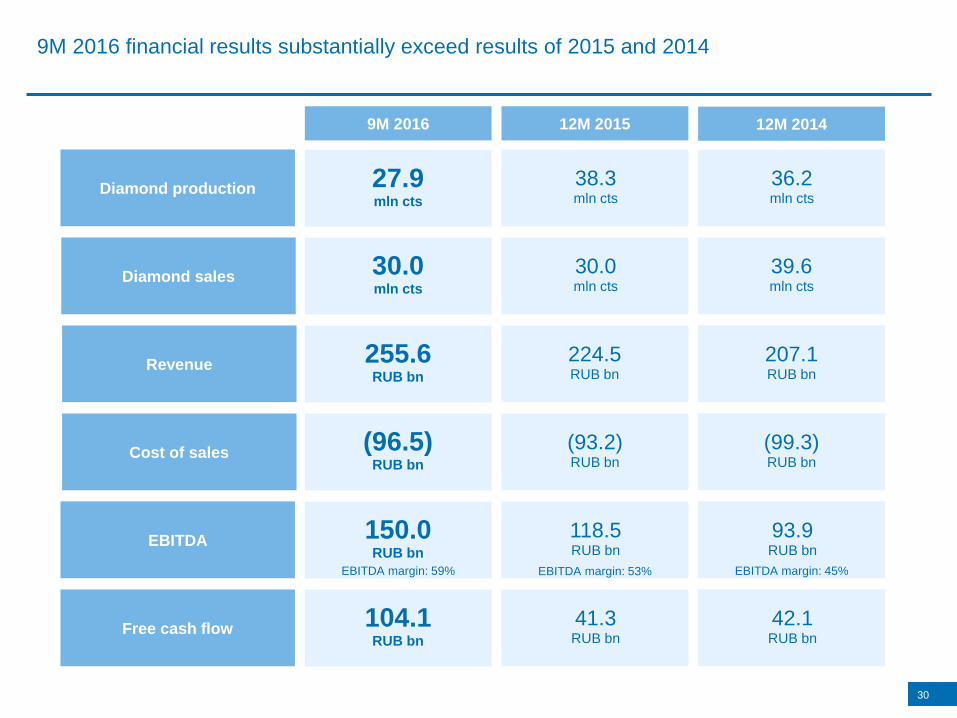
9M 2016 financial results substantially exceed results of 2015 and 2014
Diamond production
Revenue
Cost of sales
Diamond sales
EBITDA
Free cash flow
9M 2016 12M 2015 12M 2014
255.6RUB bn
224.5RUB bn
207.1RUB bn
(96.5)RUB bn
(93.2)RUB bn
(99.3)RUB bn
30.0mln cts
30.0mln cts
39.6mln cts
27.9mln cts
38.3mln cts
36.2mln cts
150.0RUB bn
118.5RUB bn
93.9RUB bn
104.1RUB bn
41.3RUB bn
42.1RUB bn
EBITDA margin: 59% EBITDA margin: 53% EBITDA margin: 45%

31
ALROSA’s financial results are impacted by foreign exchange rates fluctuations
-10 RUB/$ 2015 +10 RUB/$
Revenue
191,716 224,524 257,332received in $as diamond prices are set in $
(14.61%) +14.61%
Cost of sales
(90,330) (93,240) (96,150)are driven by $ as MET is based on $ diamond prices
(3.12%) +3.12%
EBITDA
88,601 118,498 148,395
linked to $
(25.23%) +25.23%
CAPEX
(33,794) (34,241) (34,688)
$-denominated
(1.30%) +1.30%
RUB mln
Sensitivity analysis
<10%
70%
20%90%
20%
70%
<10%

Export duty paid
Price for client
ALROSA’s
revenue
32
ALROSA benefits from increased revenue from sales of diamonds due to cancellation of 6.5%export duty on rough diamonds since September 1st, 2016
• In accordance with WTO rules, the Russian Federation cancelled 6.5% export duty on rough
diamonds on September 1st, 2016
• Price level for overseas clients has remained unchanged, with ALROSA keeping the duties
previously transferred to the budget of the Russian Federation
• Price level for domestic clients has been increased by 6.5%
Domestic clients
-
100.0
100.0
Before
+6.5%
+6.5%
-
106.5
106.5
After
Overseas clients
6.5
100.0
106.5
Before
+6.5%
0%
-
106.5
106.5
After
33
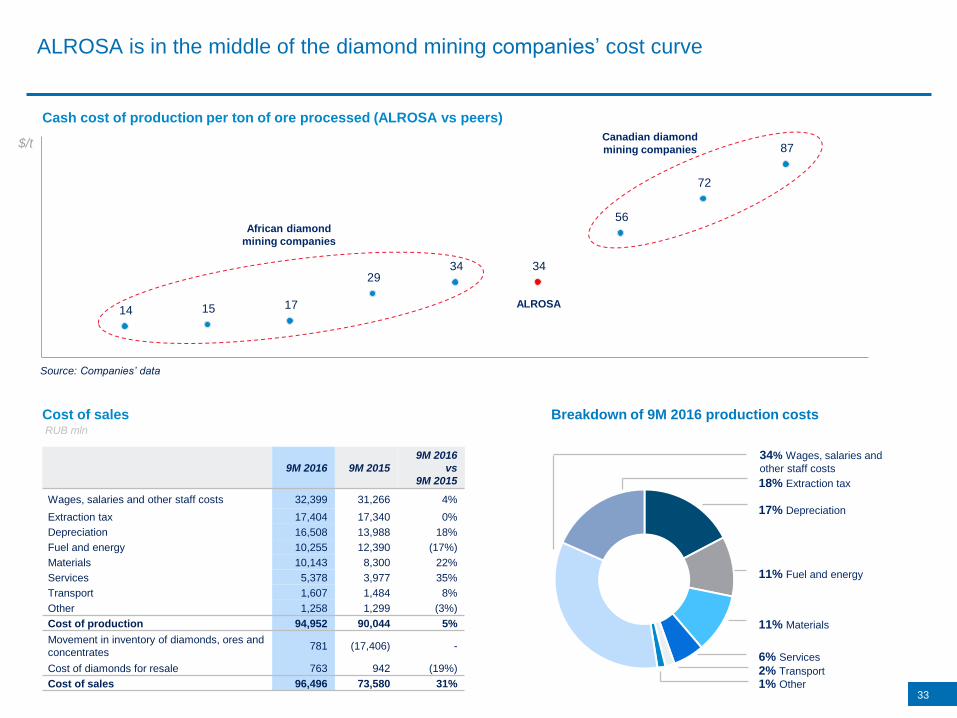
ALROSA is in the middle of the diamond mining companies’ cost curve
9M 2016 9M 2015
9M 2016
vs
9M 2015
Wages, salaries and other staff costs 32,399 31,266 4%
Extraction tax 17,404 17,340 0%
Depreciation 16,508 13,988 18%
Fuel and energy 10,255 12,390 (17%)
Materials 10,143 8,300 22%
Services 5,378 3,977 35%
Transport 1,607 1,484 8%
Other 1,258 1,299 (3%)
Cost of production 94,952 90,044 5%
Movement in inventory of diamonds, ores and
concentrates781 (17,406) -
Cost of diamonds for resale 763 942 (19%)
Cost of sales 96,496 73,580 31%
Breakdown of 9M 2016 production costsCost of salesRUB mln
17% Depreciation
34% Wages, salaries and
other staff costs
11% Fuel and energy
18% Extraction tax
2% Transport
11% Materials
6% Services
1% Other
$/t
Cash cost of production per ton of ore processed (ALROSA vs peers)
14 15 17
29 34 34
56
72
87
ALROSA
African diamond
mining companies
Canadian diamond
mining companies
Source: Companies’ data

ALROSA repaid $370 mln bank loan to JSC UniCredit Bank with cash from operations, thusreducing debt down to $2.3 bln
34
Loans and borrowings Loans and borrowings breakdown
1,000
0
600
720
2017 2018 2019 2020
Bank Loans Eurobonds
Maturity profile of loans and borrowings
As of 14 December 2016, $ mln
57% bank loans 43% eurobonds
100% US dollar-denominated debt
86% long-term debt
$ mln
3,4963,130 2,866
3,871 4,1273,481
3,040
2,320
2009 2010 2011 2012 2013 2014 2015 14.12.2016
Total
debt/
EBITDA
6.1x 2.9x 1.5x 2.0x 2.0x 2.1х 1.9x 0.8х

35
ALROSA has a track record of strong cash flows and dividend payouts
Operating cash flow, capital expenditures, free cash flow and dividends
Dividends per share, RUB
RUB mln
53,533
15,368
10,826
78,115
42,059
10,826
75,541
41,300
15,392
(38,165)(36,056)
(34,241)
OCF2013
CapEx2013
FCF2013
Dividends2013
OCF2014
CapEx2014
FCF2014
Dividends2014
OCF2015
CapEx2015
FCF2015
Dividends 2015
1.47 1.472.09
4.17(2.44)4.26
EPS, RUB

36
Appendix
37
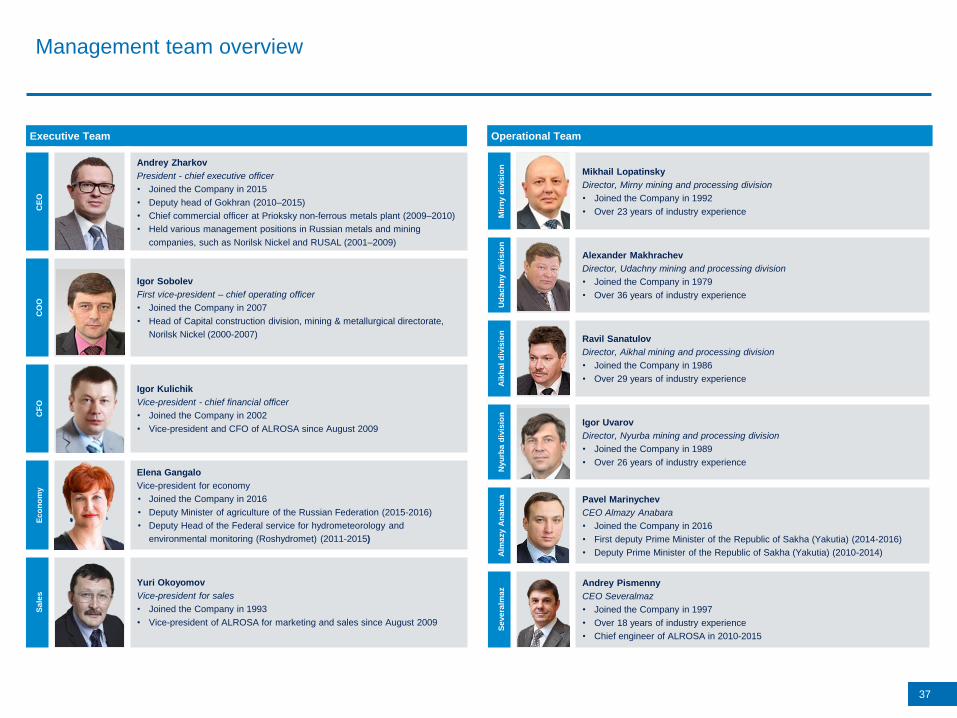
Management team overview
Operational Team Executive Team
CE
O
Andrey Zharkov
President - chief executive officer
• Joined the Company in 2015
• Deputy head of Gokhran (2010–2015)
• Chief commercial officer at Prioksky non-ferrous metals plant (2009–2010)
• Held various management positions in Russian metals and mining
companies, such as Norilsk Nickel and RUSAL (2001–2009)
CO
O
Igor Sobolev
First vice-president – chief operating officer
• Joined the Company in 2007
• Head of Capital construction division, mining & metallurgical directorate,
Norilsk Nickel (2000-2007)
CF
O
Igor Kulichik
Vice-president - chief financial officer
• Joined the Company in 2002
• Vice-president and CFO of ALROSA since August 2009
Ec
on
om
y
Elena Gangalo
Vice-president for economy
• Joined the Company in 2016
• Deputy Minister of agriculture of the Russian Federation (2015-2016)
• Deputy Head of the Federal service for hydrometeorology and
environmental monitoring (Roshydromet) (2011-2015)
Sa
les
Yuri Okoyomov
Vice-president for sales
• Joined the Company in 1993
• Vice-president of ALROSA for marketing and sales since August 2009
Mir
ny
div
isio
n
Mikhail Lopatinsky
Director, Mirny mining and processing division
• Joined the Company in 1992
• Over 23 years of industry experience
Ud
ac
hn
yd
ivis
ion
Alexander Makhrachev
Director, Udachny mining and processing division
• Joined the Company in 1979
• Over 36 years of industry experience
Aik
ha
l d
ivis
ion
Ravil Sanatulov
Director, Aikhal mining and processing division
• Joined the Company in 1986
• Over 29 years of industry experience
Nyu
rba
div
isio
n
Igor Uvarov
Director, Nyurba mining and processing division
• Joined the Company in 1989
• Over 26 years of industry experience
Alm
azy
An
ab
ara Pavel Marinychev
CEO Almazy Anabara
• Joined the Company in 2016
• First deputy Prime Minister of the Republic of Sakha (Yakutia) (2014-2016)
• Deputy Prime Minister of the Republic of Sakha (Yakutia) (2010-2014)
Se
ve
ralm
az
Andrey Pismenny
CEO Severalmaz
• Joined the Company in 1997
• Over 18 years of industry experience
• Chief engineer of ALROSA in 2010-2015

38
Anton Siluanov
Finance Minister of the
Russian Federation
Chairman of the Board of
directors
Yegor Borisov
President of the Republic of
Sakha (Yakutia)
First Deputy Chairman of the
Supervisory Board
Alexander Galushka
Minister for the Development
of the Russian Far East
Deputy Chairman of the
Supervisory Board
Andrey Zharkov
President (CEO) of ALROSA
Nominated by: Russian Federation Nominated by: Republic of Sakha (Yakutia) Nominated by: Russian Federation Nominated by: Russian Federation
Previously held positions include
• 2005 – 2011 – Deputy Minister of
Finance of the Russian Federation
• Since 2011 – Minister of Finance of the
Russian Federation
Previously held positions include
• 2003 – 2010 – Chairman of the
Government of the Republic of Sakha
(Yakutia)
• 2010 – 2014 – President of the
Republic of Sakha (Yakutia)
• Since 2014 – Head of the Republic of
Sakha (Yakutia)
Previously held positions include:
• 2004 – 2010 – President of Non-Profit
Partnership “Russian Collegium of
Appraisers”
• 2010 – 2012 – President, Co-chairman
of All-Russian public organisation
Delovaya Rossiya
• 2011 – 2012 – member of state
commission on the socio-economic
development of the Far East, the
Republic of Buryatia, the Zabaikalye
and Irtutsk regions
• Since 2013 – Minister of the Russian
Federation for the Development of the
Far East
Previously held positions include
• 2009 – 2010 – Сhief Commercial
Officer at Prioksky Non-Ferrous Metals
Plant
• 2010 – 2015 – Deputy Head of
Gokhran under the Russian Ministry of
Finance
• Since 2015 – President (CEO) of
ALROSA
Oleg Fedorov
Adviser to the Head of the
Federal Agency for State
Property Management
Sergey Barsukov
Director, Financial Policy
Department, Ministry of Finance
of the Russian Federation
Maria Gordon
Chief portfolio manager at
Pacific Investment
Management Co. (PIMCO)
until 2014
Alexey Chekunkov
CEO of Far East and Baikal
Region Development Fund
Nominated by: Russian Federation Nominated by: Russian Federation Nominated by: minority shareholders as an
independent director
Nominated by: Russian Federation
Previously held positions include:
• 2009 – 2012 – Head, Department for
cooperation with governmental
authorities and companies with
government participation, department of
investment and banking on global
markets, VTB Capital
• Since 2012 – Adviser to the Head of the
Federal Agency for State Property
Management
Previously held positions include
• 2007 – 2008 – First Deputy General
Director, Agency for Housing Mortgage
Lending (AHML)
• 2008 – 2010 – Assistant to Vice
Chairman of the Russian Federation
Government – Russian Federation
Minister of Finance
• Since 2010 – Director, Financial Policy
Department, Ministry of Finance of the
Russian Federation
Previously held positions include
• 1998 – 2010 – Goldman Sachs,
investment activity
• 2010 – 2014 – PIMCO, investment
activity
Previously held positions include
• 2009 – 2011 – Head of New Nations
Capital Investment Company
• 2011 – 2013 – Director, member of the
board, member of investment
committee of the Russian Direct
Investment Fund
• Since 2014 – Director of the Far East
Development Fund
Supervisory Board overview (1/2)
2 3 41
5 6 7 8
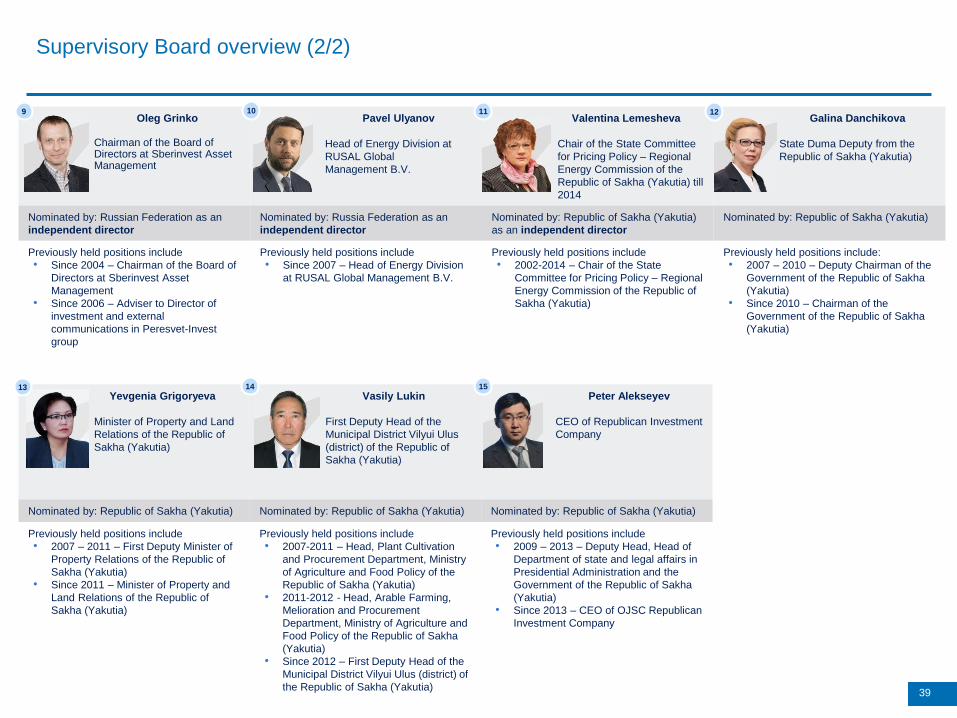
Oleg Grinko
Chairman of the Board of Directors at Sberinvest Asset Management
Pavel Ulyanov
Head of Energy Division at
RUSAL Global
Management B.V.
Valentina Lemesheva
Chair of the State Committee
for Pricing Policy – Regional
Energy Commission of the
Republic of Sakha (Yakutia) till
2014
Galina Danchikova
State Duma Deputy from the
Republic of Sakha (Yakutia)
Nominated by: Russian Federation as an
independent director
Nominated by: Russia Federation as an
independent director
Nominated by: Republic of Sakha (Yakutia)
as an independent director
Nominated by: Republic of Sakha (Yakutia)
Previously held positions include
• Since 2004 – Chairman of the Board of
Directors at Sberinvest Asset
Management
• Since 2006 – Adviser to Director of
investment and external
communications in Peresvet-Invest
group
Previously held positions include
• Since 2007 – Head of Energy Division
at RUSAL Global Management B.V.
Previously held positions include
• 2002-2014 – Chair of the State
Committee for Pricing Policy – Regional
Energy Commission of the Republic of
Sakha (Yakutia)
Previously held positions include:
• 2007 – 2010 – Deputy Chairman of the
Government of the Republic of Sakha
(Yakutia)
• Since 2010 – Chairman of the
Government of the Republic of Sakha
(Yakutia)
Yevgenia Grigoryeva
Minister of Property and Land
Relations of the Republic of
Sakha (Yakutia)
Vasily Lukin
First Deputy Head of the
Municipal District Vilyui Ulus
(district) of the Republic of
Sakha (Yakutia)
Peter Alekseyev
CEO of Republican Investment
Company
Nominated by: Republic of Sakha (Yakutia) Nominated by: Republic of Sakha (Yakutia) Nominated by: Republic of Sakha (Yakutia)
Previously held positions include
• 2007 – 2011 – First Deputy Minister of
Property Relations of the Republic of
Sakha (Yakutia)
• Since 2011 – Minister of Property and
Land Relations of the Republic of
Sakha (Yakutia)
Previously held positions include
• 2007-2011 – Head, Plant Cultivation
and Procurement Department, Ministry
of Agriculture and Food Policy of the
Republic of Sakha (Yakutia)
• 2011-2012 - Head, Arable Farming,
Melioration and Procurement
Department, Ministry of Agriculture and
Food Policy of the Republic of Sakha
(Yakutia)
• Since 2012 – First Deputy Head of the
Municipal District Vilyui Ulus (district) of
the Republic of Sakha (Yakutia)
Previously held positions include
• 2009 – 2013 – Deputy Head, Head of
Department of state and legal affairs in
Presidential Administration and the
Government of the Republic of Sakha
(Yakutia)
• Since 2013 – CEO of OJSC Republican
Investment Company
39
Supervisory Board overview (2/2)
13 15
9 10 1211
14
40
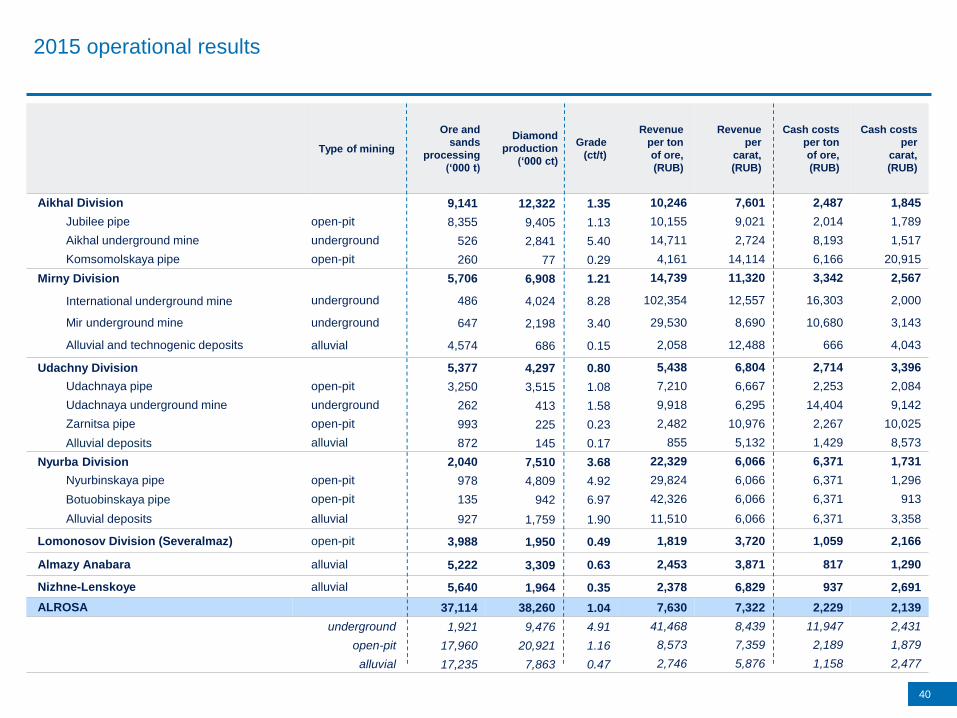
2015 operational results
Type of mining
Ore and
sands
processing
(‘000 t)
Diamond
production
(‘000 ct)
Grade
(ct/t)
Revenue
per ton
of ore,
(RUB)
Revenue
per
carat,
(RUB)
Cash costs
per ton
of ore,
(RUB)
Cash costs
per
carat,
(RUB)
Aikhal Division 9,141 12,322 1.35 10,246 7,601 2,487 1,845
Jubilee pipe open-pit 8,355 9,405 1.13 10,155 9,021 2,014 1,789
Aikhal underground mine underground 526 2,841 5.40 14,711 2,724 8,193 1,517
Komsomolskaya pipe open-pit 260 77 0.29 4,161 14,114 6,166 20,915
Mirny Division 5,706 6,908 1.21 14,739 11,320 3,342 2,567
International underground mine underground 486 4,024 8.28 102,354 12,557 16,303 2,000
Mir underground mine underground 647 2,198 3.40 29,530 8,690 10,680 3,143
Alluvial and technogenic deposits alluvial 4,574 686 0.15 2,058 12,488 666 4,043
Udachny Division 5,377 4,297 0.80 5,438 6,804 2,714 3,396
Udachnaya pipe open-pit 3,250 3,515 1.08 7,210 6,667 2,253 2,084
Udachnaya underground mine underground 262 413 1.58 9,918 6,295 14,404 9,142
Zarnitsa pipe open-pit 993 225 0.23 2,482 10,976 2,267 10,025
Alluvial deposits alluvial 872 145 0.17 855 5,132 1,429 8,573
Nyurba Division 2,040 7,510 3.68 22,329 6,066 6,371 1,731
Nyurbinskaya pipe open-pit 978 4,809 4.92 29,824 6,066 6,371 1,296
Botuobinskaya pipe open-pit 135 942 6.97 42,326 6,066 6,371 913
Alluvial deposits alluvial 927 1,759 1.90 11,510 6,066 6,371 3,358
Lomonosov Division (Severalmaz) open-pit 3,988 1,950 0.49 1,819 3,720 1,059 2,166
Almazy Anabara alluvial 5,222 3,309 0.63 2,453 3,871 817 1,290
Nizhne-Lenskoye alluvial 5,640 1,964 0.35 2,378 6,829 937 2,691
ALROSA 37,114 38,260 1.04 7,630 7,322 2,229 2,139
underground 1,921 9,476 4.91 41,468 8,439 11,947 2,431
open-pit 17,960 20,921 1.16 8,573 7,359 2,189 1,879
alluvial 17,235 7,863 0.47 2,746 5,876 1,158 2,477
Thank you!
Corporate FinanceInvestor Relations
Ozerkovskaya emb., 24/1 Moscow 115184 Russia
Tel.: +7 495 745 58 [email protected]