Embed Size (px)
Citation preview

Introduction to GIS
IAP 2013
http://libguides.mit.edu/gis Email: [email protected]
Tuesday, January 15, 1-4 pm Wednesday, January 23, 1-4 pm
Overview
• What is GIS?
• Types of Data and Projections
• What can I do with GIS?
• Data Sources and Formats
• Software
• Data Management Tips
What is GIS?
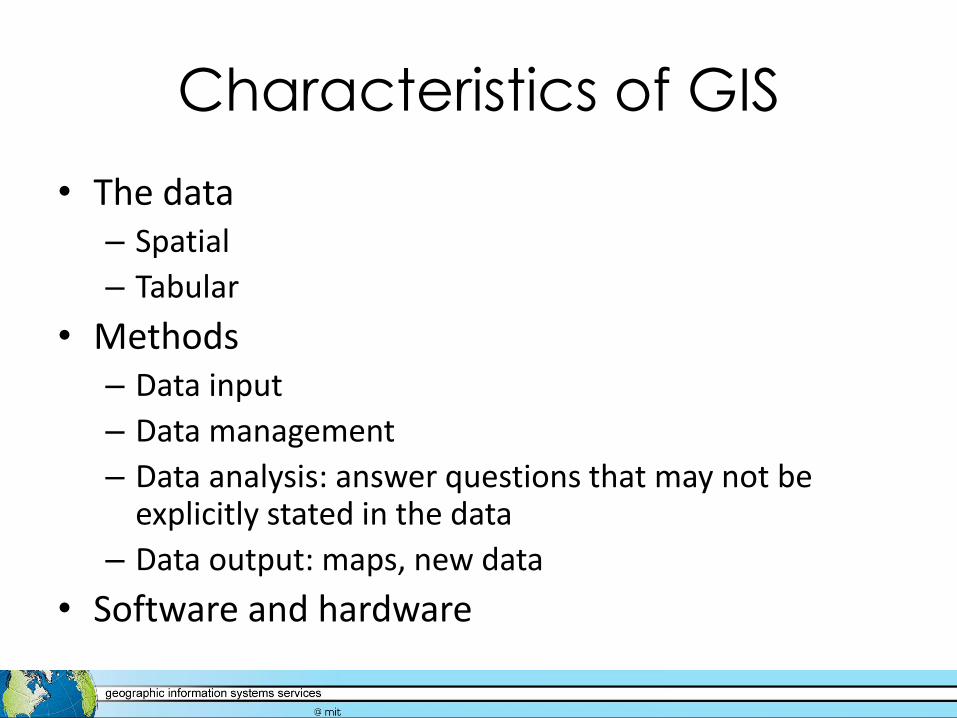
Characteristics of GIS
• The data – Spatial
– Tabular
• Methods – Data input
– Data management
– Data analysis: answer questions that may not be explicitly stated in the data
– Data output: maps, new data
• Software and hardware
Characteristics of GIS
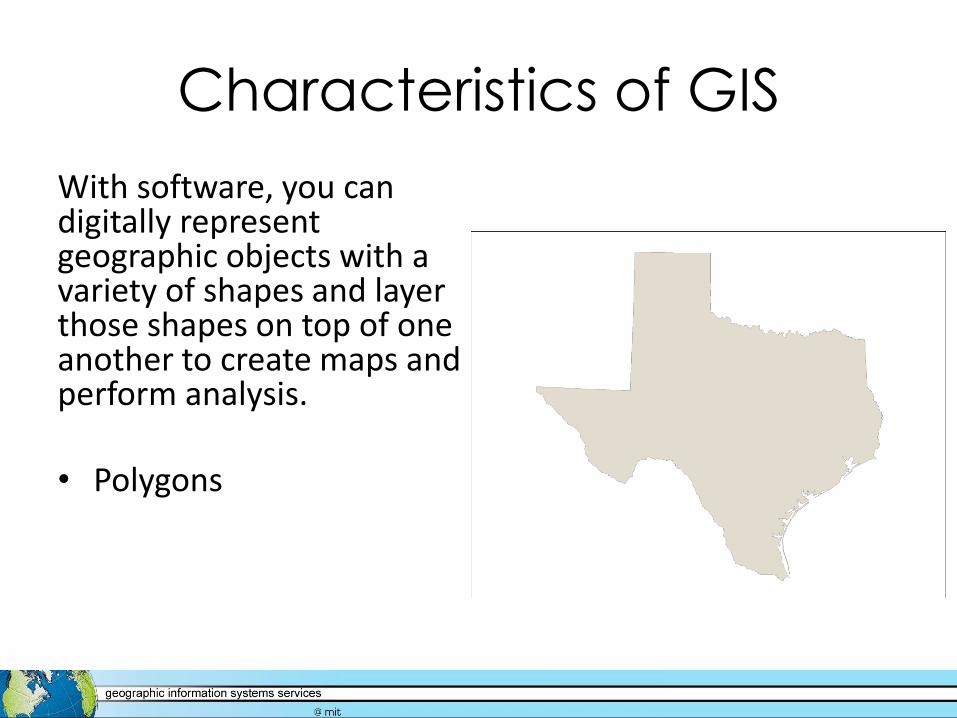
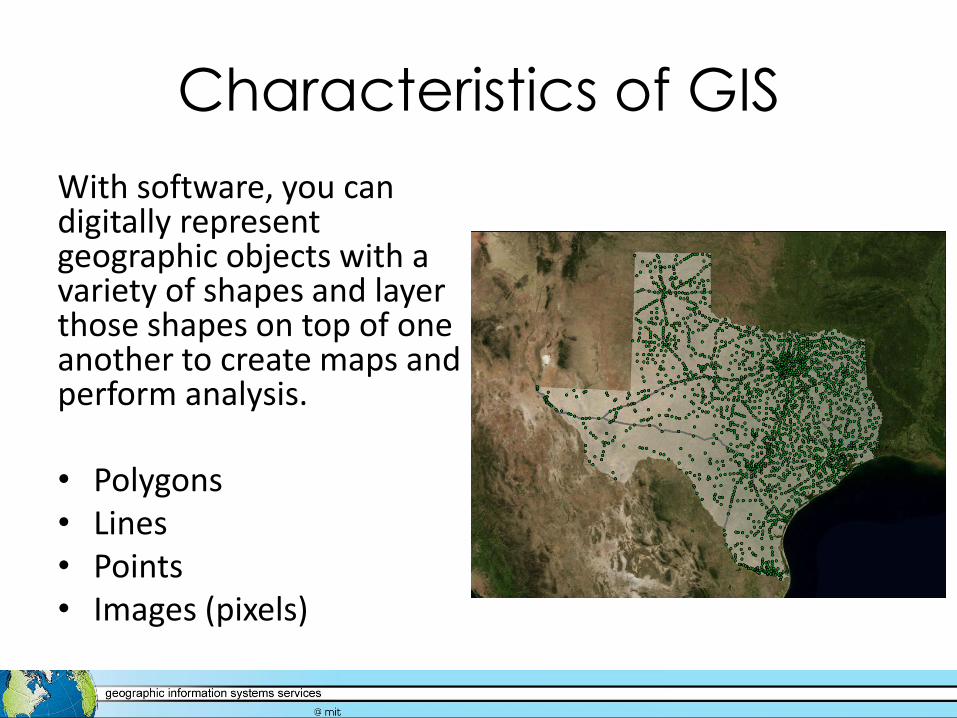
With software, you can digitally represent geographic objects with a variety of shapes and layer those shapes on top of one another to create maps and perform analysis. • Polygons
Characteristics of GIS
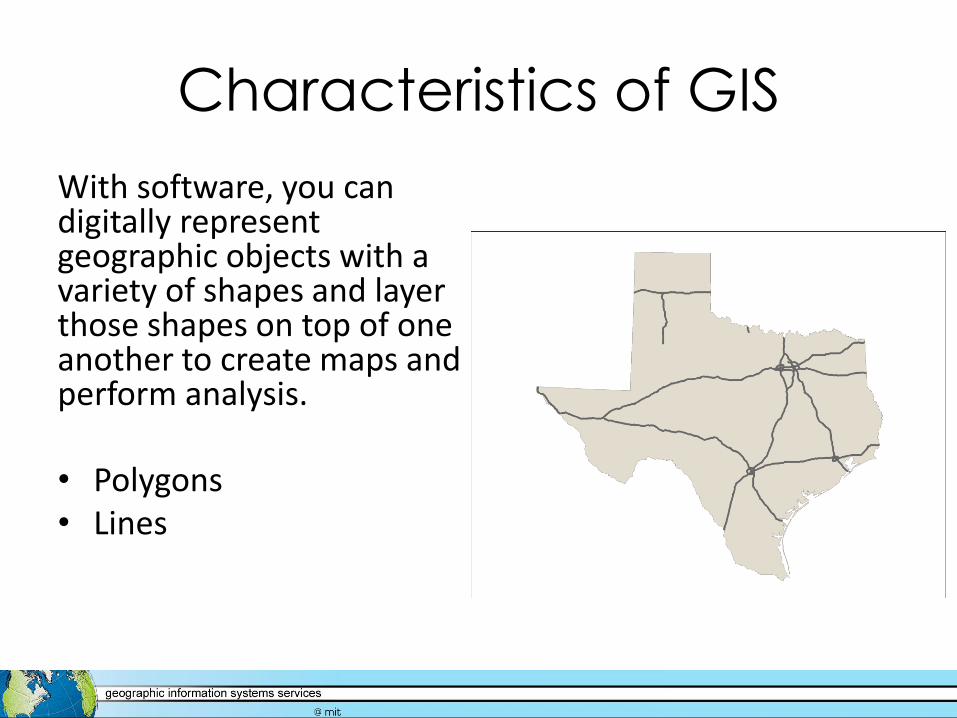
With software, you can digitally represent geographic objects with a variety of shapes and layer those shapes on top of one another to create maps and perform analysis. • Polygons • Lines

Characteristics of GIS
With software, you can digitally represent geographic objects with a variety of shapes and layer those shapes on top of one another to create maps and perform analysis. • Polygons • Lines • Points
Characteristics of GIS
With software, you can digitally represent geographic objects with a variety of shapes and layer those shapes on top of one another to create maps and perform analysis. • Polygons • Lines • Points • Images (pixels)

Data Types
• Spatial
– Spatial or coordinate data represent features that have a known location on the earth.
– Vector: Points, lines, and polygons
– Raster: Row and column matrix

Data Types: Vector
Polygons

Data Types: Vector
Points Lines
Data Types: Raster
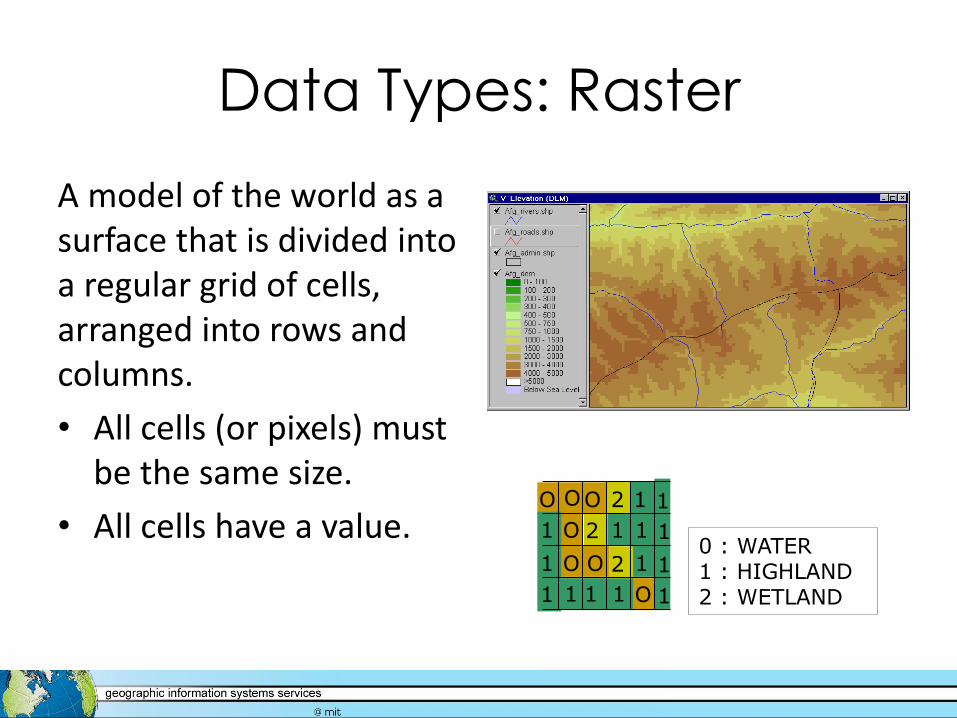
A model of the world as a surface that is divided into a regular grid of cells, arranged into rows and columns.
• All cells (or pixels) must be the same size.
• All cells have a value. O
2 O
O O
1 1 1
O 2
1
2
1
1
1
O
1
1
1
1
O
1
1
1
0 : WATER 1 : HIGHLAND 2 : WETLAND

Data Types: Raster
Rasters include images, elevation models, and scanned maps.
Data Types
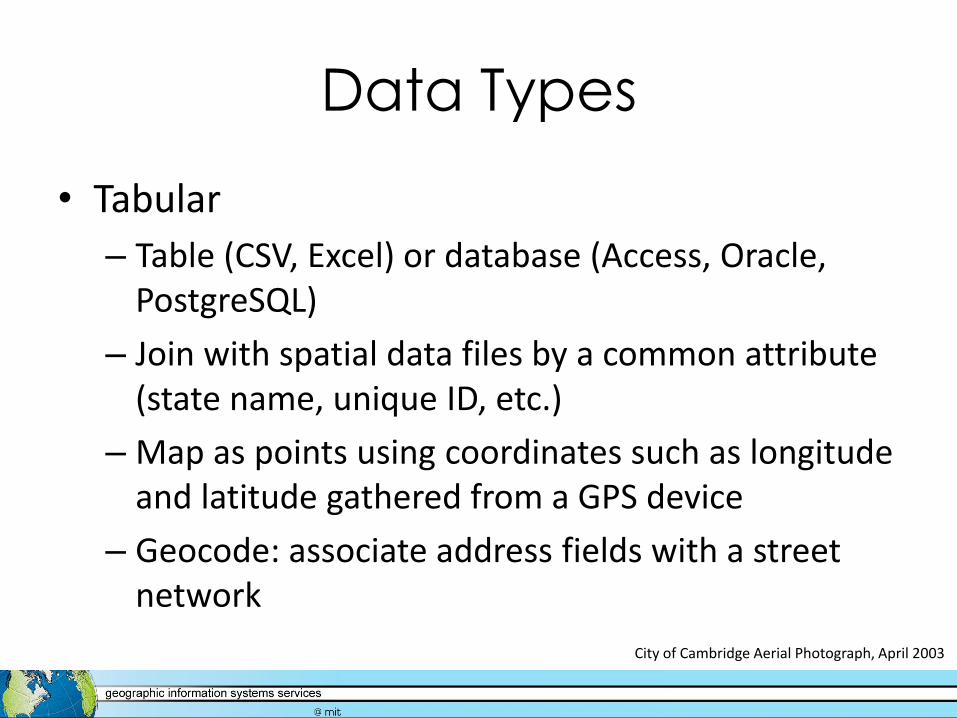
City of Cambridge Aerial Photograph, April 2003
• Tabular
– Table (CSV, Excel) or database (Access, Oracle, PostgreSQL)
– Join with spatial data files by a common attribute (state name, unique ID, etc.)
– Map as points using coordinates such as longitude and latitude gathered from a GPS device
– Geocode: associate address fields with a street network
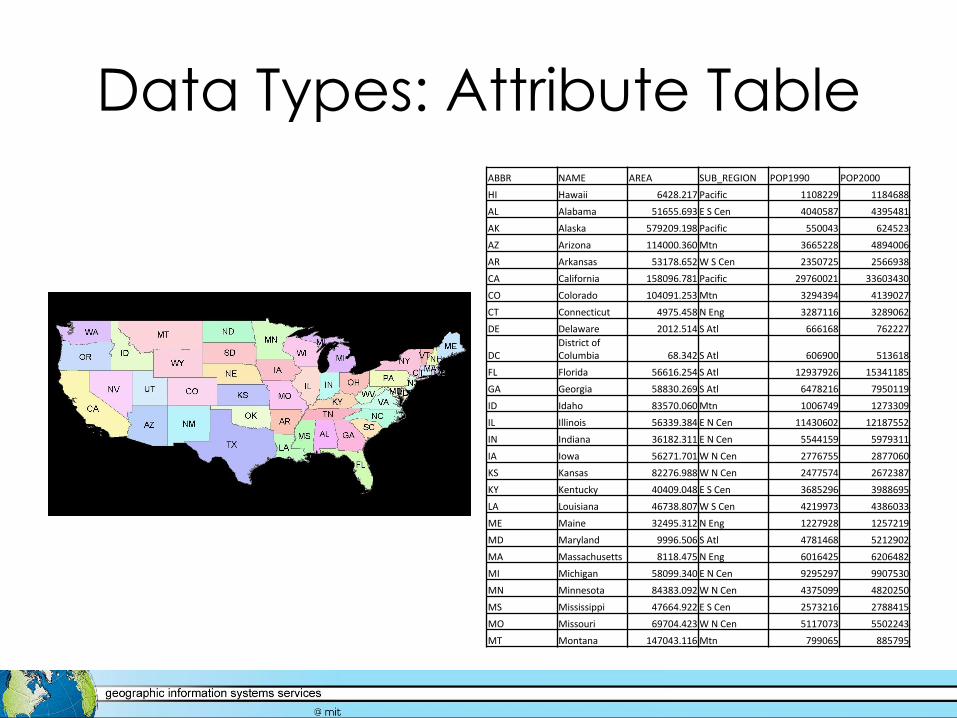
Data Types: Attribute Table
ABBR NAME AREA SUB_REGION POP1990 POP2000
HI Hawaii 6428.217 Pacific 1108229 1184688
AL Alabama 51655.693 E S Cen 4040587 4395481
AK Alaska 579209.198 Pacific 550043 624523
AZ Arizona 114000.360 Mtn 3665228 4894006
AR Arkansas 53178.652 W S Cen 2350725 2566938
CA California 158096.781 Pacific 29760021 33603430
CO Colorado 104091.253 Mtn 3294394 4139027
CT Connecticut 4975.458 N Eng 3287116 3289062
DE Delaware 2012.514 S Atl 666168 762227
DC
District of Columbia 68.342 S Atl 606900 513618
FL Florida 56616.254 S Atl 12937926 15341185
GA Georgia 58830.269 S Atl 6478216 7950119
ID Idaho 83570.060 Mtn 1006749 1273309
IL Illinois 56339.384 E N Cen 11430602 12187552
IN Indiana 36182.311 E N Cen 5544159 5979311
IA Iowa 56271.701 W N Cen 2776755 2877060
KS Kansas 82276.988 W N Cen 2477574 2672387
KY Kentucky 40409.048 E S Cen 3685296 3988695
LA Louisiana 46738.807 W S Cen 4219973 4386033
ME Maine 32495.312 N Eng 1227928 1257219
MD Maryland 9996.506 S Atl 4781468 5212902
MA Massachusetts 8118.475 N Eng 6016425 6206482
MI Michigan 58099.340 E N Cen 9295297 9907530
MN Minnesota 84383.092 W N Cen 4375099 4820250
MS Mississippi 47664.922 E S Cen 2573216 2788415
MO Missouri 69704.423 W N Cen 5117073 5502243
MT Montana 147043.116 Mtn 799065 885795
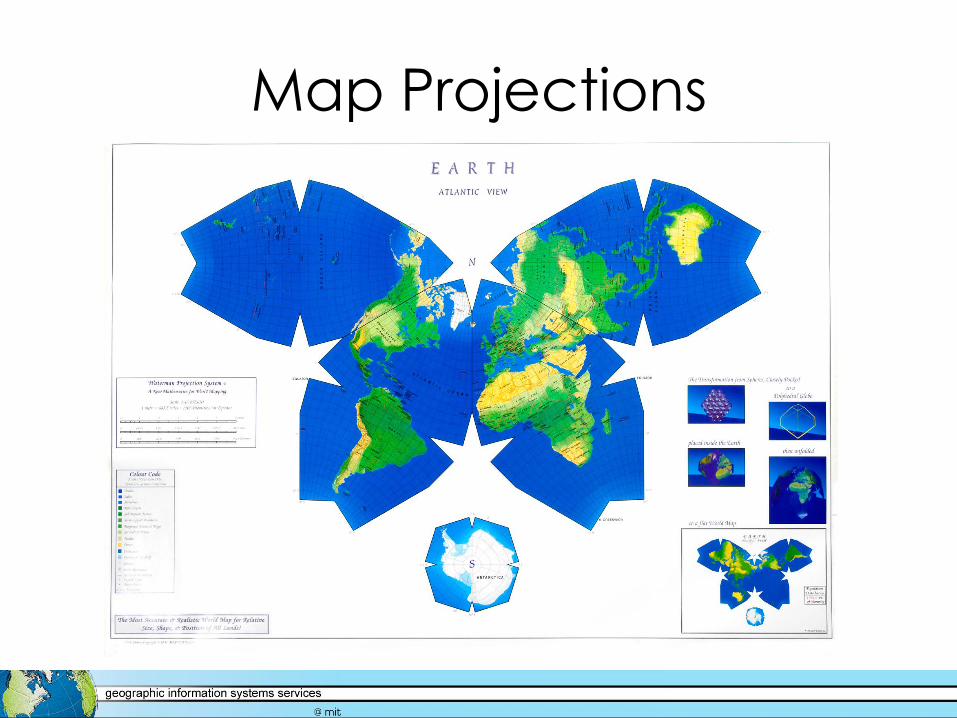
Map Projections
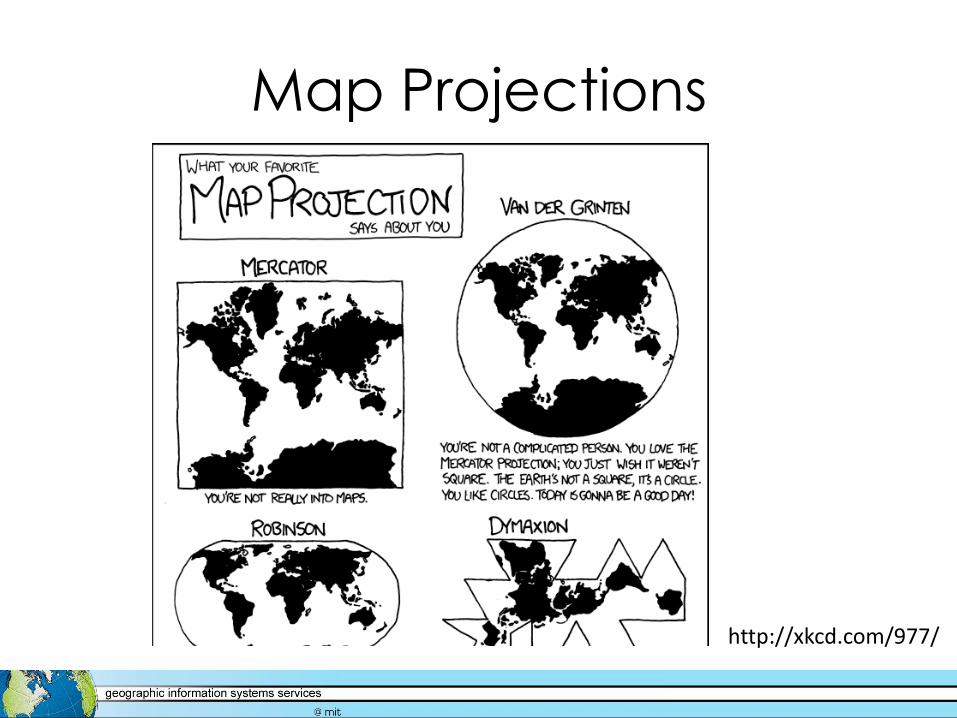
Map Projections
http://xkcd.com/977/

Map Projections
• There are many different map projections. All map projections distort at least some of the following:
– Shape
– Area
– Distance
– Direction
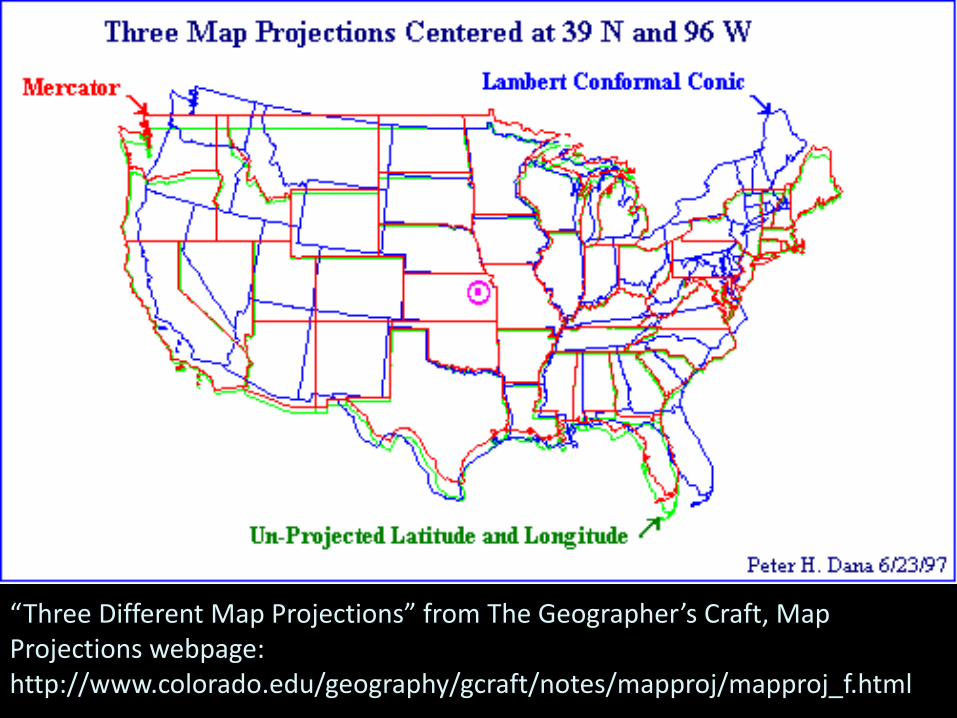
“Three Different Map Projections” from The Geographer’s Craft, Map Projections webpage: http://www.colorado.edu/geography/gcraft/notes/mapproj/mapproj_f.html

What can I do with GIS?
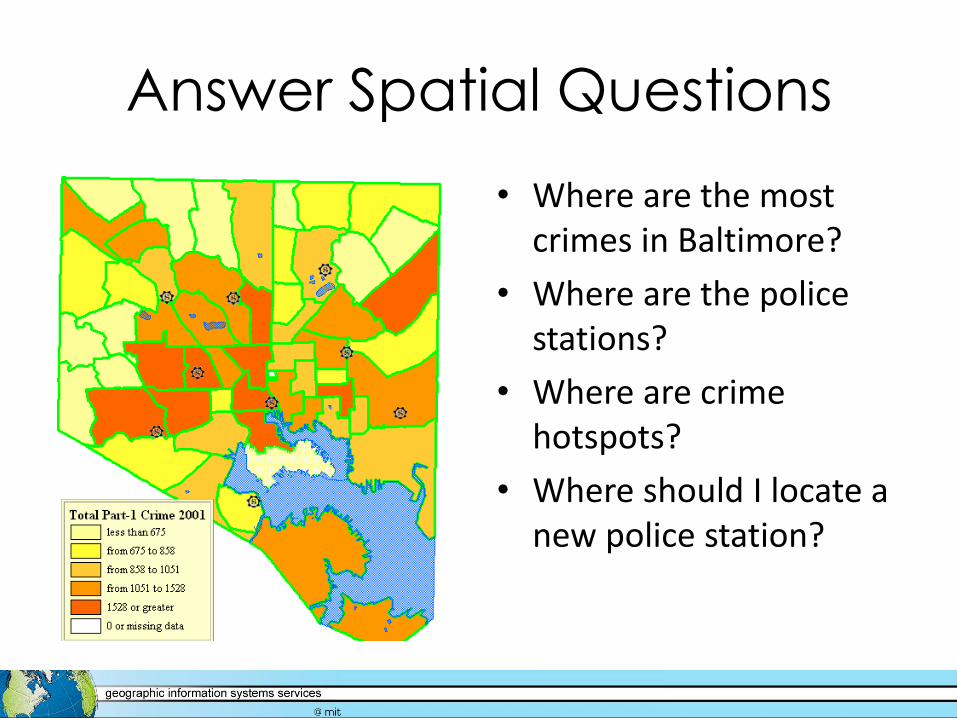
Answer Spatial Questions
• Where are the most crimes in Baltimore?
• Where are the police stations?
• Where are crime hotspots?
• Where should I locate a new police station?
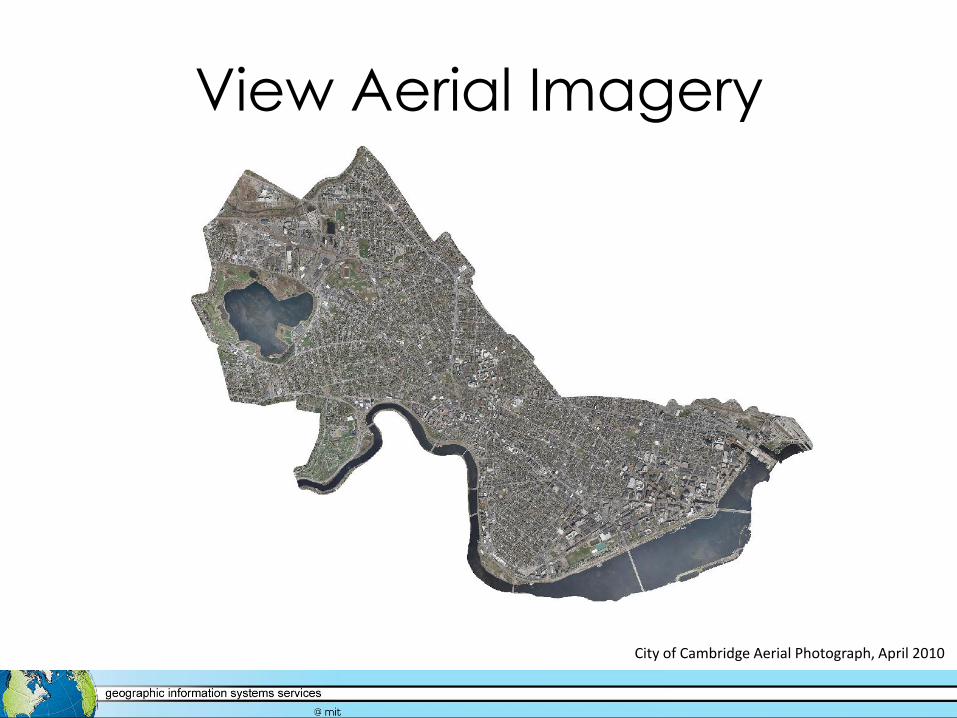
View Aerial Imagery
City of Cambridge Aerial Photograph, April 2010
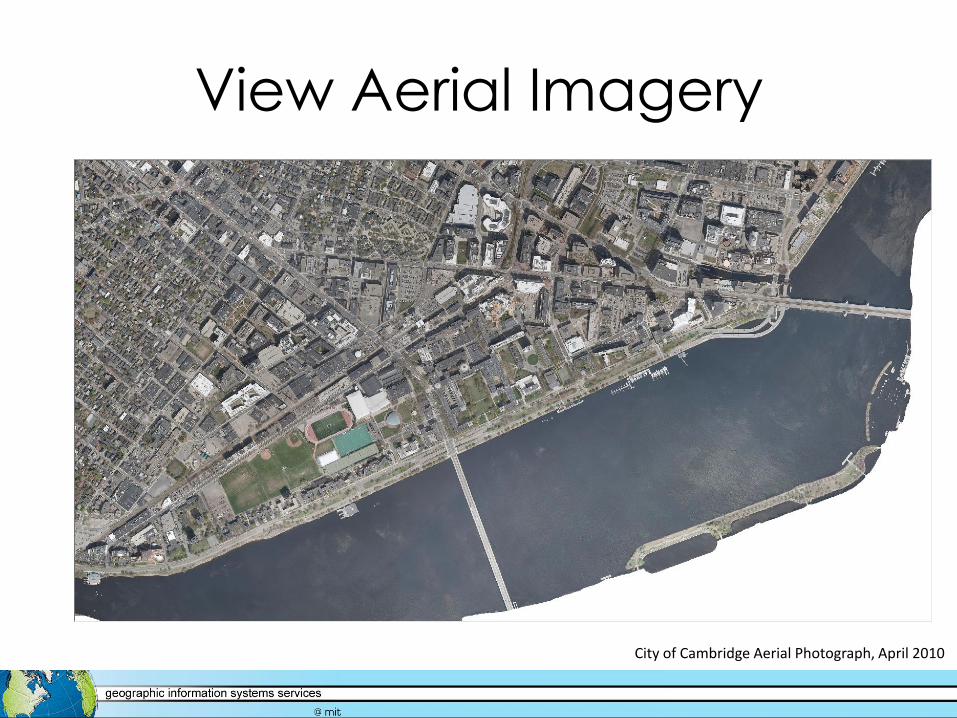
View Aerial Imagery
City of Cambridge Aerial Photograph, April 2010
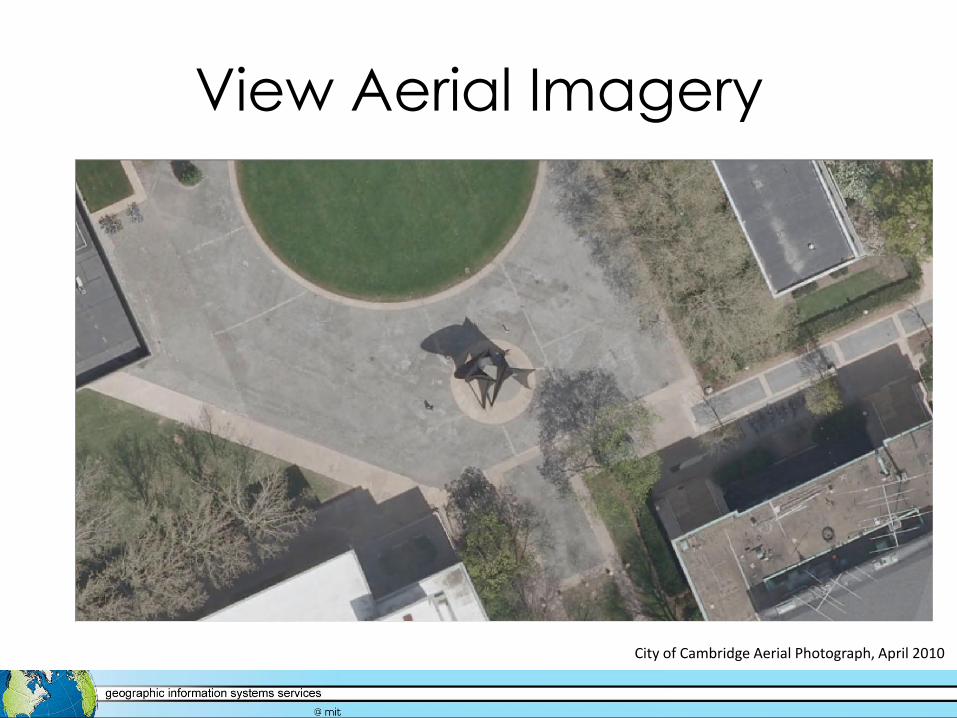
View Aerial Imagery
City of Cambridge Aerial Photograph, April 2010
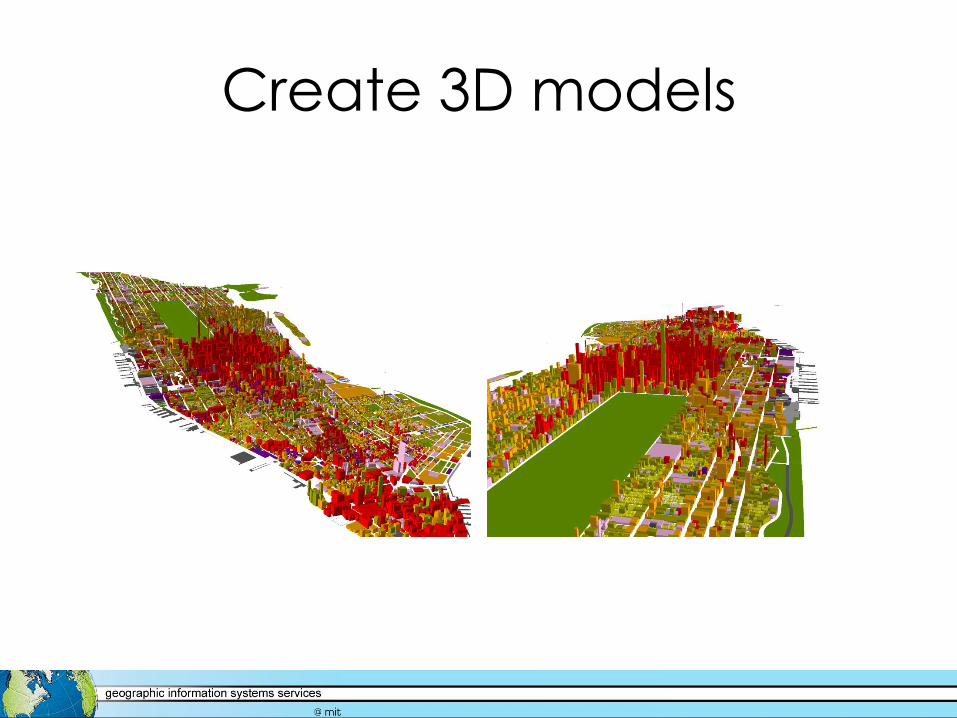
Create 3D models
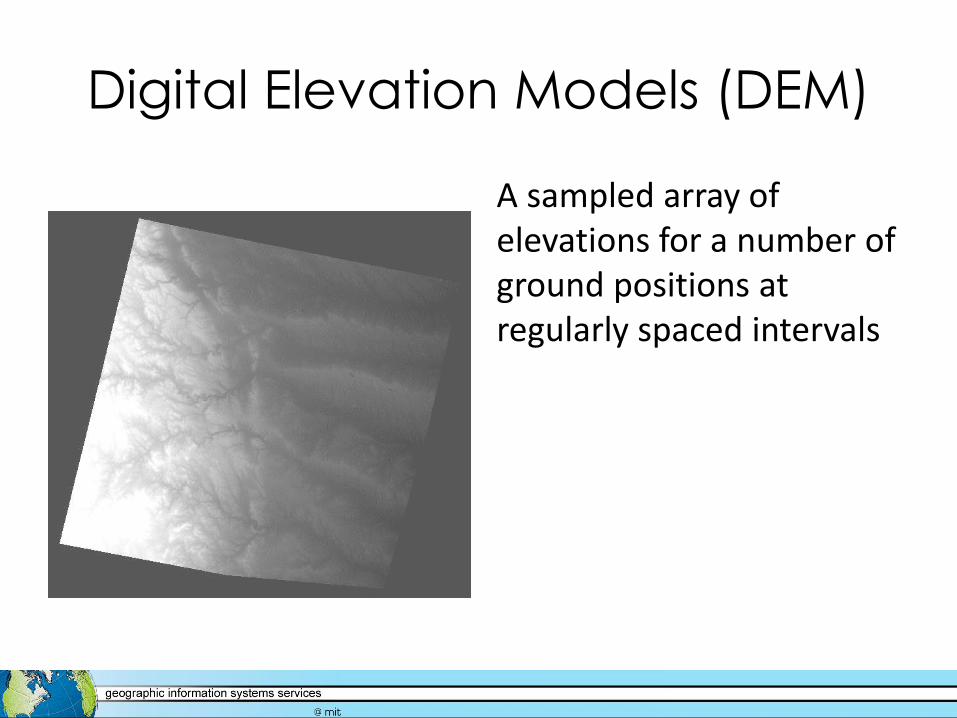
Digital Elevation Models (DEM)
A sampled array of elevations for a number of ground positions at regularly spaced intervals
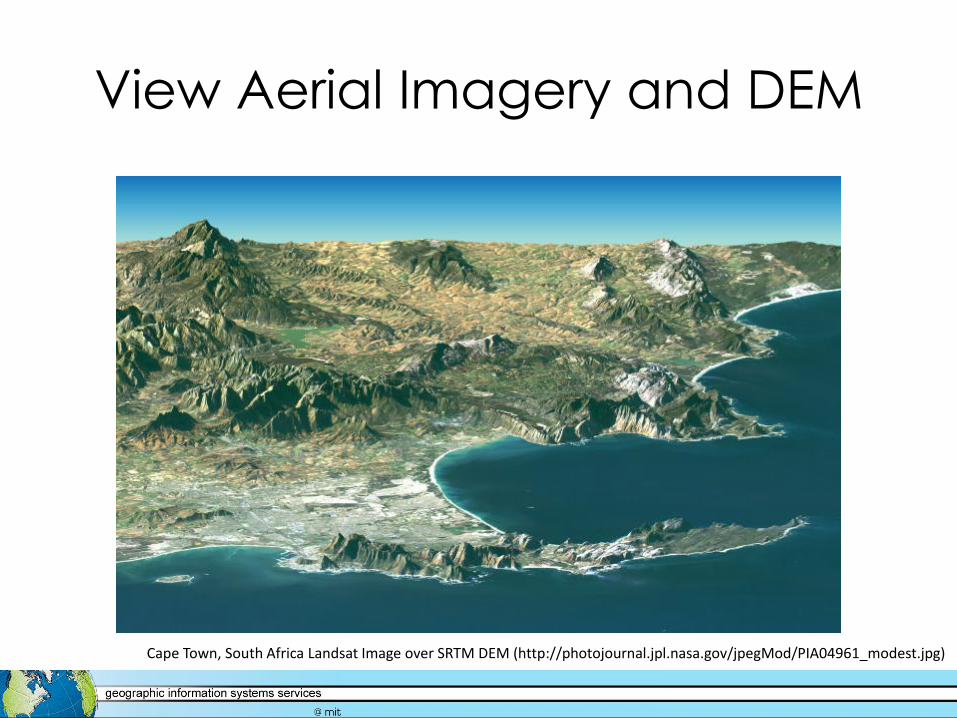
View Aerial Imagery and DEM
Cape Town, South Africa Landsat Image over SRTM DEM (http://photojournal.jpl.nasa.gov/jpegMod/PIA04961_modest.jpg)

View and Analyze Land Cover
Data
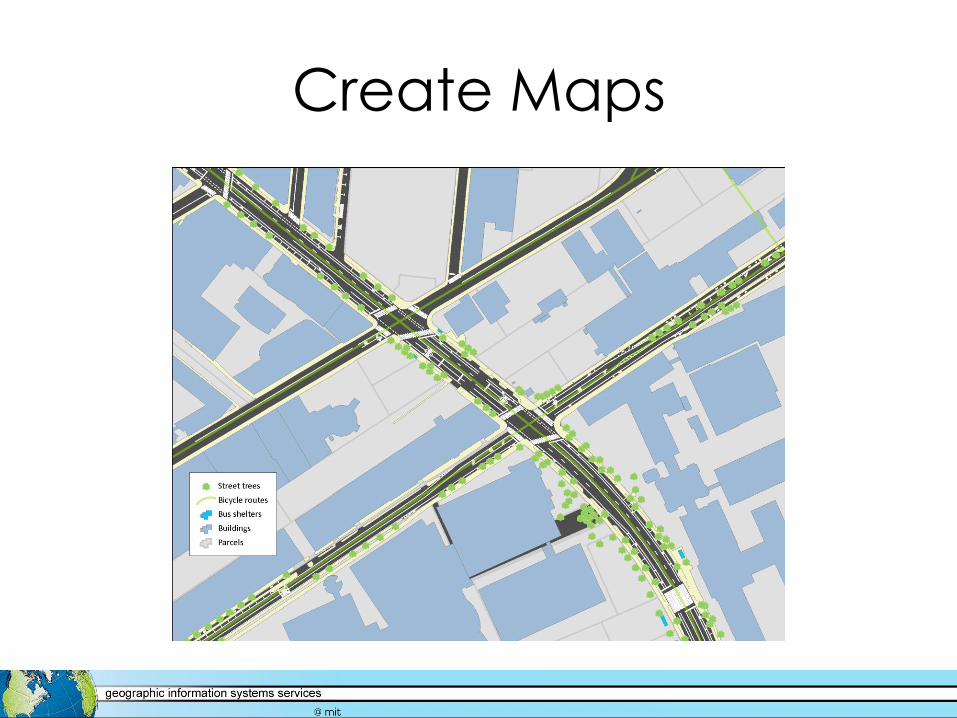
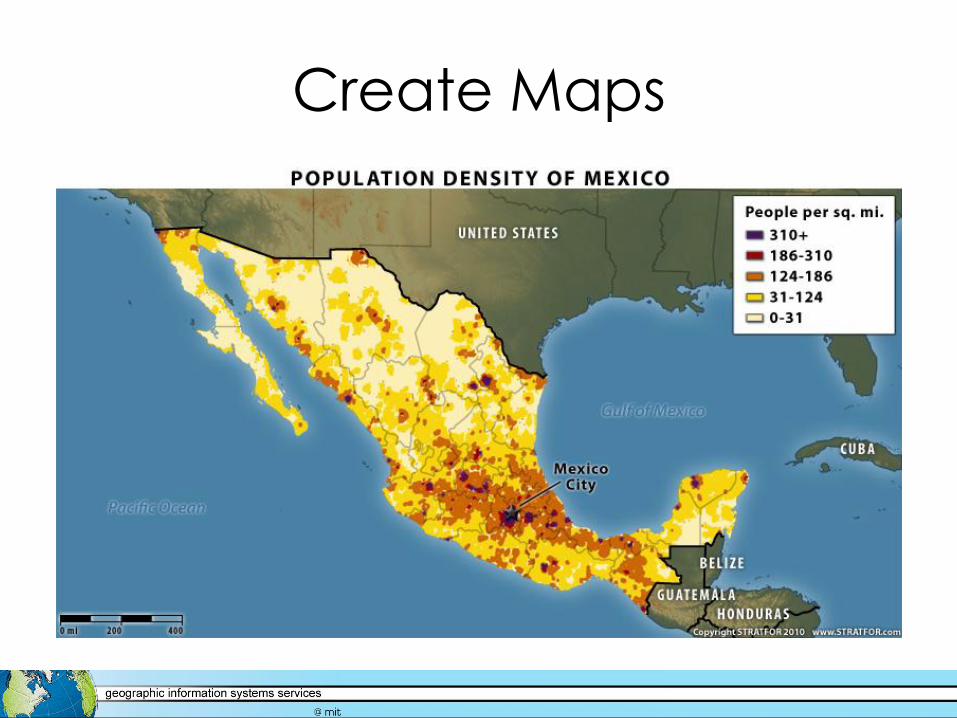
Create Maps

Create Maps
Create Maps
What types of analysis can I
do with GIS?

Create Buffers
Calculate what is
• Inside
• Outside
• Within a certain distance
Buffers in ½-mile increments around Fenway Park
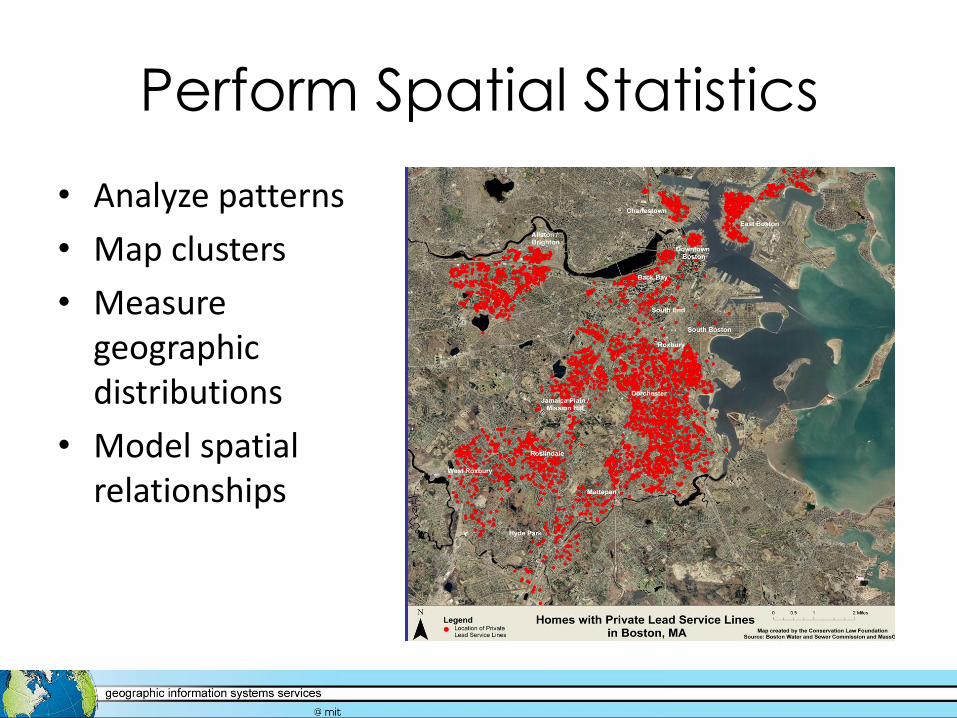
Perform Spatial Statistics
• Analyze patterns
• Map clusters
• Measure geographic distributions
• Model spatial relationships

Map Coordinates or Addresses
• Geocode Addresses:
– 77 Massachusetts Ave. Cambridge, MA 02139
• Add XY data:
– 71.093458 W
– 42.359097 N

Network Analysis
…and More!
• Georeference maps and images
• Calculate area and volume
• Perform surface analysis
– Contour
– Slope
– Aspect
– Hillshade
– Viewshed

Where do I find GIS data?

Data Sources
• MIT sources – GeoWeb: use any web browser
– MIT Geodata Repository Search Tool for ArcGIS
– Barton catalog
• Internet – http://libguides.mit.edu/ (Find Data links)
• Create your own – GPS, digitizing, etc.
Not finding what you want? GIS data purchase requests? Contact GIS Help ([email protected]).

OpenStreetMap.org
Open data! Anyone can contribute and download.
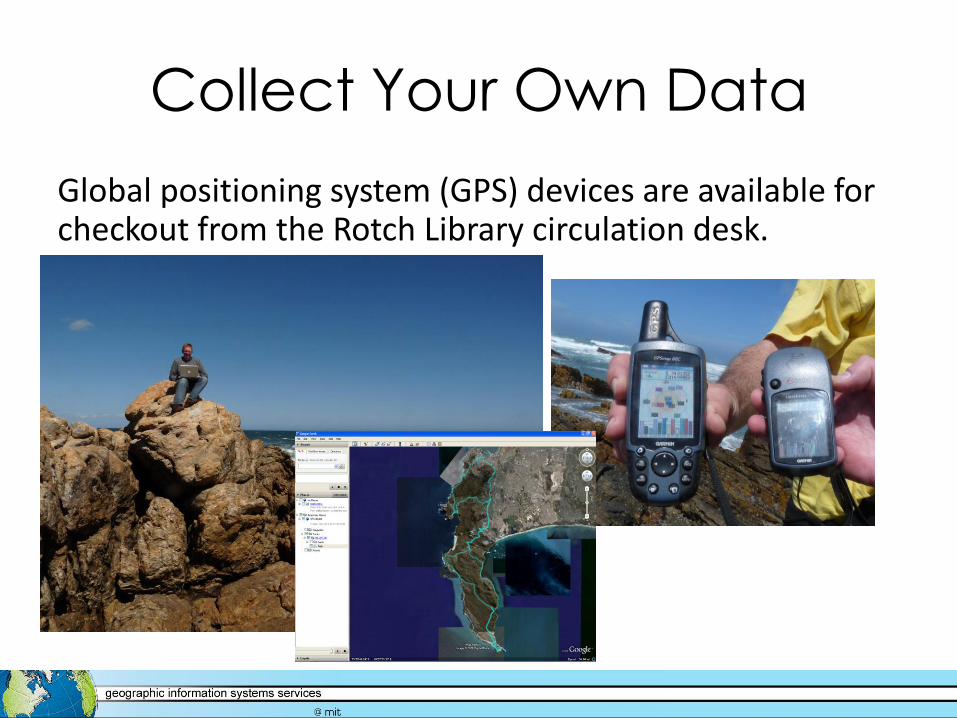
Collect Your Own Data
Global positioning system (GPS) devices are available for checkout from the Rotch Library circulation desk.

Data Sources • Data from
different sources, covering the same area, can look very different. Evaluate scale, accuracy and file size when selecting data for a project.

Data Formats
• ArcGIS can read many formats, including: – Shapefile, personal geodatabase (Access), file geodatabase
(ESRI) – Image formats (JPG, TIF, GEOTIF, etc.) – CAD (DXF and DWG) – KML/KMZ files (from Google Earth) can be read in ArcGlobe
• Data can be exported from ArcGIS to a variety of formats, including: – KML – CAD – Adobe Illustrator – TIF – JPG

What software can I use?

ESRI ArcGIS: ArcMap
• Provides the most tools for processing data, doing analysis, and creating maps
• Work in 2D
• Use the MIT-created toolbar for easily accessing the MIT Geodata Repository with a full GIS software package

ArcToolbox

ESRI ArcGIS: ArcScene
• Work in 3D

ESRI ArcGIS: ArcCatalog
• Manage files and folders
• Create new shapefiles and geodatabases
• Preview files • View metadata in
format of choice • Create metadata so
your data can be understood and shared with others
• Save metadata files as XML, TXT, HTML, or SGML
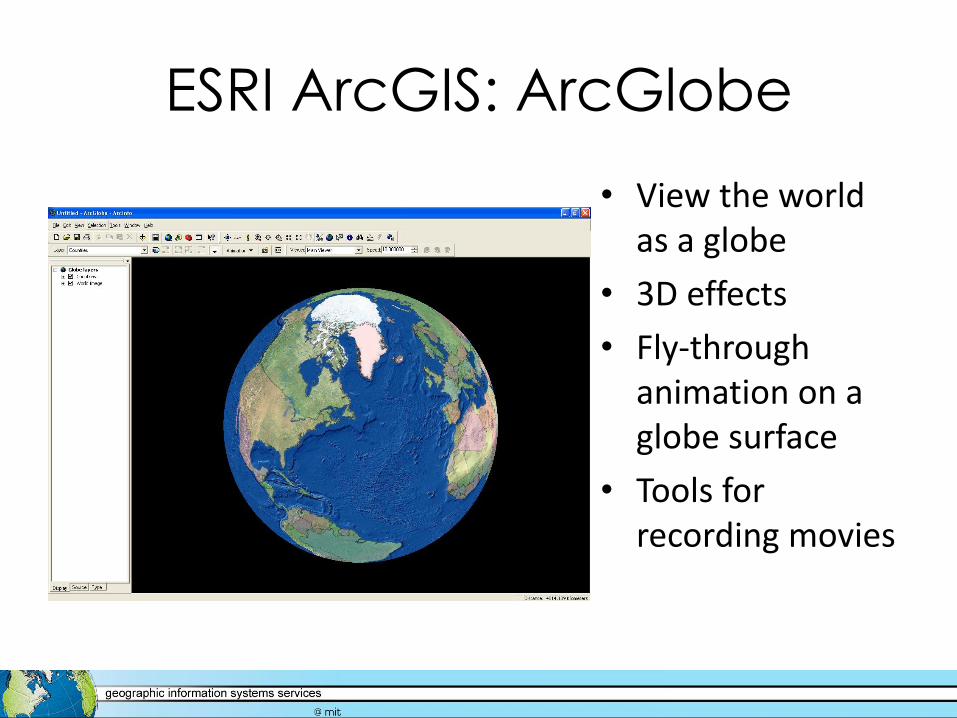
ESRI ArcGIS: ArcGlobe
• View the world as a globe
• 3D effects
• Fly-through animation on a globe surface
• Tools for recording movies
Open Source Software
The source code is made available under a license that allows the modification and redistribution of the software at will.
For a more in-depth definition, visit the Open Source Initiative: opensource.org/docs/definition.php
GIS Desktop Software
Open source: OSGeo projects
• GRASS GIS
• OSSIM
• Quantum GIS (QGIS)
• gvSIG
www.osgeo.org
Proprietary
• ESRI ArcGIS Desktop
• MapInfo
For a longer list, visit: en.wikipedia.org/wiki/List_of_GIS_software

Quantum GIS (QGIS)
Data Management Tips

Data Management Tips
GIS projects tend to generate many files, which are generally large in size. For file naming:
• Use file names that represent the file (default names like Export_Output are not helpful if you need to come back to your project later).
• Delete intermediate files
• Some software programs and tools may have file name constraints (e.g. an eight character limit without spaces). Watch out for this with ESRI ArcToolbox.

Data Management Tips
Keep detailed notes about: • Data sources • Licensing constraints • Data processing steps (ModelBuilder creates visuals of
your procedure) • What is stored where
– The GIS project maintains links to the individual data files (the data is not embedded in the map document itself)
– GIS formats, like shapefile (SHP), have many files that are linked together and must stay together in order to function
• Descriptions of the files you create and use (ArcCatalog has built-in tools for creating and editing metadata)
Backup Your Data!
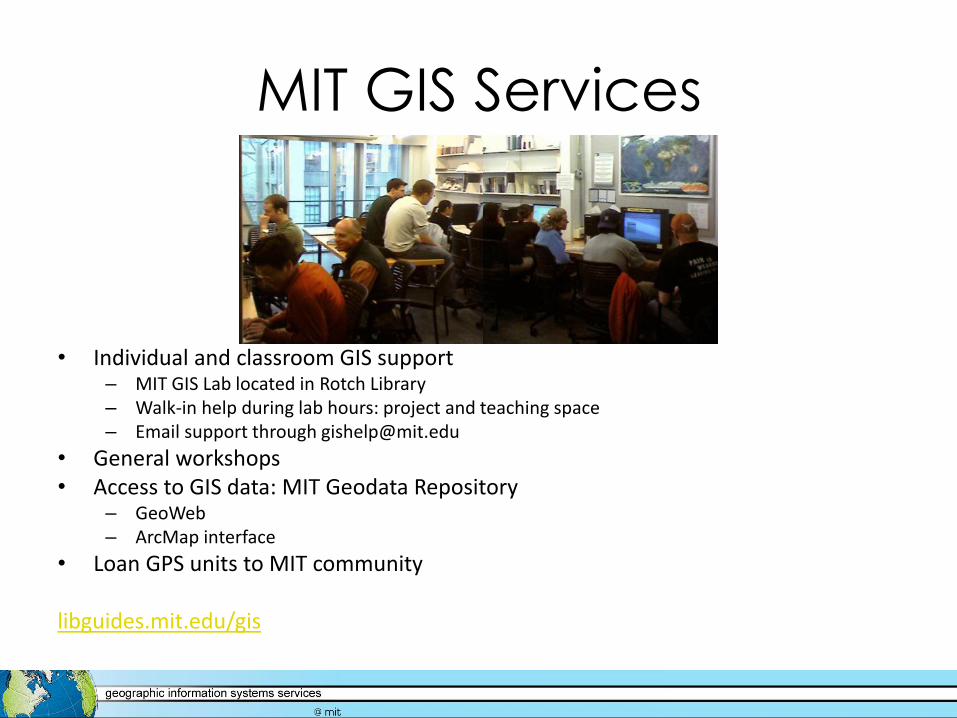
MIT GIS Services
• Individual and classroom GIS support – MIT GIS Lab located in Rotch Library – Walk-in help during lab hours: project and teaching space – Email support through [email protected]
• General workshops • Access to GIS data: MIT Geodata Repository
– GeoWeb – ArcMap interface
• Loan GPS units to MIT community libguides.mit.edu/gis