Embed Size (px)
Citation preview

Energy Information: Maps & Data to use with GIS
MIT Libraries Lisa Sweeney & Anne Graham
January 2012

What we’ll cover today:
• Energy maps @ MIT and on the web • Energy data for use with GIS software @ MIT • Where to find maps and data • Examples: How to use what you find

• Think about the data you will need • Think about the type of analysis you want to do • Seek examples of how others have done the type of work you want to attempt • GIS Services can help you think through your project idea, learn about available tools for mapping and spatial analysis, and help identify relevant data sources
Getting started

Think about the data you will need

Energy Map Sources
• Paper – search Geoweb or Barton: • Platts in Rotch Library (7-238) • Petroleum Economist in Dewey Library (E53-100) • USGS in Hayden Library (14S-134)
• Online:
• DOE Data Explorer: http://www.osti.gov/dataexplorer/
• National Carbon Explorer (funded by DOE) http://www.natcarb.org/ • National Renewable Energy Laboratory http://maps.nrel.gov/ • USGS Energy Program Publications and Data
http://energy.usgs.gov/search.html • UNEP World Wind Energy Assessment: http://na.unep.net/swera_ims/map2/
- Petroleum Economist, 2008

Energy Data Sources • MIT Geodata Repository http://web.mit.edu/geoweb/
• Includes data on electric, gas, coal, pipelines, power plants and more for North America and Europe
• MassGIS Transmission Lines http://www.mass.gov/mgis/trnslns.htm
- contains pipelines, power lines and substations for the State of Massachusetts. • Department of Energy Data Explorer http://www.osti.gov/dataexplorer/ • National Renewable Energy Laboratory
http://www.nrel.gov/gis/data_analysis.html • USGS Energy Program Publications and Data
http://energy.usgs.gov/search.html • UNEP Renewable Resource Energy Explorer
http://na.unep.net/swera_ims/map2/
- Potter et al, 2008
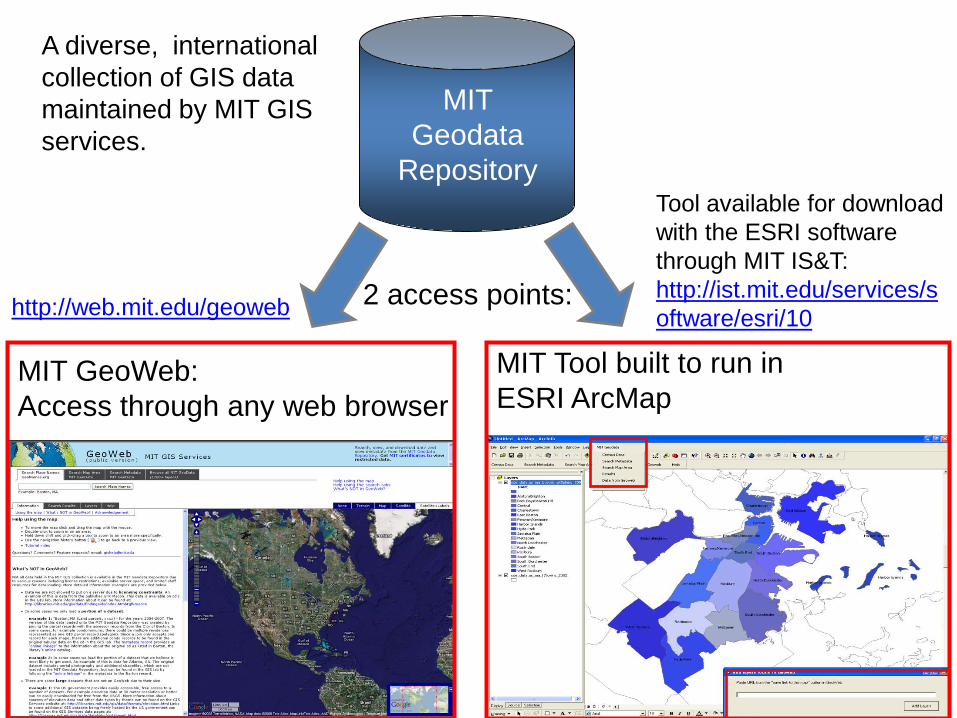
MIT Geodata
Repository
A diverse, international collection of GIS data maintained by MIT GIS services.
2 access points:
MIT Tool built to run in ESRI ArcMap
MIT GeoWeb: Access through any web browser
Tool available for download with the ESRI software through MIT IS&T: http://ist.mit.edu/services/software/esri/10 http://web.mit.edu/geoweb

Example search results from Publisher Platts in MIT Geoweb

Connect to existing data services

ArcMap example using Energy Data from the MIT Geodata Repository
Liquefied Natural Gas Import Terminals and Natural Gas Pipelines

ArcMap example using Energy Data from the MIT Geodata Repository
Liquefied Natural Gas Import Terminals, Natural Gas Pipelines and Coal Docks

ArcMap example using Energy Data from the MIT Geodata Repository
Liquefied Natural Gas Import Terminals, Natural Gas Pipelines, Coal Docks and Power Plants

ArcMap example using Energy Data
from the MIT Geodata
Repository

ArcMap example using Energy Data
from the MIT Geodata
Repository

Consumer Expenditures Examples: • Household expenditures on:
– Utilities, fuels, and public services Natural gas – Electricity – Fuel oil and other fuels – Telephone – Water and other public services
• Transportation expenditures on Gasoline and motor oil • Public transportation expenditures
Available in the MIT GIS Lab: • Geolytics Estimates Premium • ESRI’s Business Analyst

Demographics Packages available in the MIT GIS Lab for easy mapping of demographics: • Geolytics
– US Demographics from 1960 – present – Normalized data very helpful for comparing change over time
• ESRI’s Business Analyst
Online sources of demographics: • MIT Libraries guide to Census -
http://libraries.mit.edu/guides/types/census/tools-overview.html • US Census Bureau website - http://www.census.gov/ • Social Explorer - http://libraries.mit.edu/get/explorer
– US demographics from 1790 - present

Think about the type of analysis you want to do

Spatial Statistics ESRI’s ArcGIS – ArcToolbox GIS Workshop during IAP: Introduction to Spatial Statistics Tools and Analysis in ArcMap Thursday, January 26, 2-4 pm

Seek examples of how others have done the type of work you want to
attempt

Case studies and resources listed by ESRI for studying climate change: http://www.esri.com/industries/climate/resources.html HAZUS –
•FEMA's Methodology for Estimating Potential Losses from Disasters •http://www.fema.gov/plan/prevent/hazus/ •-software available in MIT GIS lab
Search Journals and Databases through Vera Search “Geography” in E-journals China Data Online - http://libraries.mit.edu/get/chinadata
Statistics and reports on China's population, economy, and industries at the national, provincial, city, county, and industrial levels, including Census data.

Supplemental Resources • MIT Library Research Guide examples:
– Energy : http://libguides.mit.edu/energy – GIS, Maps, and Mapping - http://libguides.mit.edu/gis
• Social Science Data Services – Social Science Data Services provides assistance with
finding, understanding, and managing statistics or numeric or tabular data in the social sciences, management, and related areas.
GIS Services can help you think through your project idea, learn about available tools for mapping and spatial analysis, and help identify relevant data sources. Quote:
“Thank you for all your help. I learned a lot and you saved me so much time!”

GIS workshops during IAP
• Introduction to GIS • GIS level 2 • Discovering and Using US Census Data • Introduction to Spatial Statistics Tools and Analysis in
ArcMap • Using Elevation Data and Hydrographic Tools in a GIS • Integrating Map APIs into your website and Using
Google Fusion Tables • http://libraries.mit.edu/gis/teach/current-workshops.html

• GIS lab hours - http://libraries.mit.edu/gis/ email : [email protected]
• Class and general workshop support • Loan GPS units • Access to GIS data: Geodata Repository
– MIT GeoWeb & ESRI ArcMap Interface
MIT GIS Services