Embed Size (px)
Citation preview

Energy Information: Maps & Data to use with GIS
Heather McCann & Anne Graham
January 2014

What we’ll cover today:
Data
Analysis
Examples
GIS Services
Think about the data you will need

Energy Map Sources
Maps at MIT – search Barton or Geoweb :
• Platts in Rotch Library (7-238)
• Petroleum Economist in Dewey Library (E53)
• USGS in Hayden Library (14S-134)
Maps on the web
• Department of Energy (DOE) Data Explorer: http://www.osti.gov/dataexplorer/
• National Carbon Explorer http://www.natcarbviewer.com/
• National Renewable Energy Laboratory http://maps.nrel.gov/
• USGS Energy Program http://energy.usgs.gov/
• UNEP Solar and Wind Energy Resource Assessment http://en.openei.org/apps/SWERA/
- Petroleum Economist, 2008

Energy Data Sources
Data at MIT – search Geoweb or Barton:
• Platts, All China Marketing Research Co., and Global Water Intelligence
Data on the web
• MassGIS Transmission Lines http://www.mass.gov/mgis/trnslns.htm
• Department of Energy Data Explorer http://www.osti.gov/dataexplorer/
National Renewable Energy Laboratory
http://www.nrel.gov/gis/
Open Energy Info http://en.openei.org/
• USGS Energy Program
http://energy.usgs.gov/
• United Nations Data Mart http://data.un.org/DataMartInfo.aspx
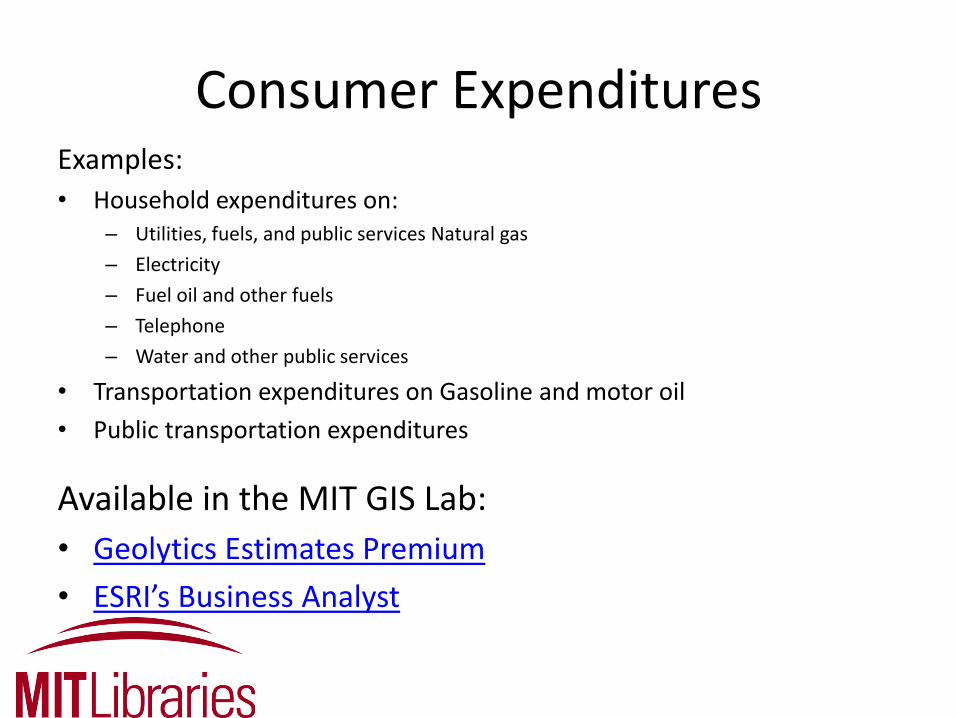
Consumer Expenditures Examples:
• Household expenditures on: – Utilities, fuels, and public services Natural gas
– Electricity
– Fuel oil and other fuels
– Telephone
– Water and other public services
• Transportation expenditures on Gasoline and motor oil
• Public transportation expenditures
Available in the MIT GIS Lab:
• Geolytics Estimates Premium
• ESRI’s Business Analyst

Demographics Packages available in the MIT GIS Lab for easy mapping of demographics:
• Geolytics – US Demographics from 1960 – present
– Normalized data very helpful for comparing change over time
• ESRI’s Business Analyst
Online sources of demographics:
• MIT Libraries guide to Census - http://libraries.mit.edu/guides/types/census/tools-overview.html
• US Census Bureau website - http://www.census.gov/
• Social Explorer - http://libraries.mit.edu/get/explorer – US demographics from 1790 - present

MIT
Geodata
Repository
A diverse, international
collection of GIS data
maintained by MIT GIS
services.
2 access points:
MIT Tool built to run in
ESRI ArcMap MIT GeoWeb:
Access through any web browser
Tool available for use with the
ESRI software through MIT. http://web.mit.edu/geoweb

Example search results from Originator: Platts in MIT Geoweb
http://web.mit.edu/geoweb

ArcMap example using Energy Data from the MIT Geodata Repository
Liquefied Natural Gas Import Terminals, Natural Gas Pipelines and Coal Docks

ArcMap example using
energy and popuulation
data from the MIT Geodata
Repository

ArcMap example using
Energy Data from the MIT
Geodata Repository

ArcMap example using DesalData

Think about the type of analysis you want to do
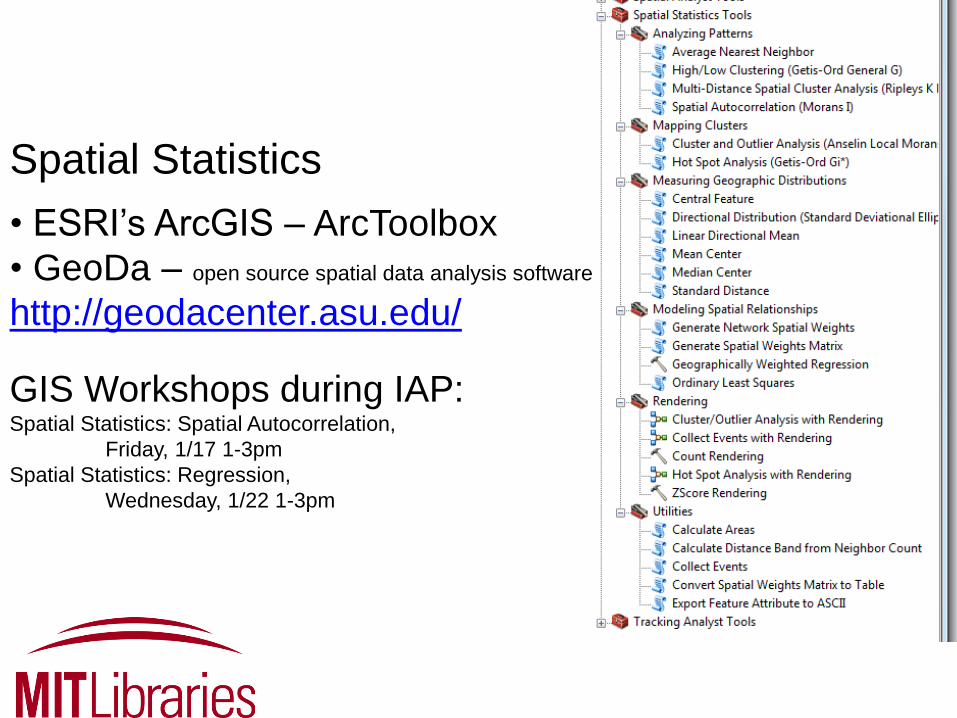
Spatial Statistics
• ESRI’s ArcGIS – ArcToolbox
• GeoDa – open source spatial data analysis software
http://geodacenter.asu.edu/
GIS Workshops during IAP: Spatial Statistics: Spatial Autocorrelation,
Friday, 1/17 1-3pm
Spatial Statistics: Regression,
Wednesday, 1/22 1-3pm

Seek examples of how others have done the type of work you want to
attempt

Case studies and resources listed by ESRI for studying industries, including
electric, gas, mining, petroleum and renewable energy: http://www.esri.com/industries/
China Data Online - http://libraries.mit.edu/get/chinadata Statistics and reports on China's population, economy, and industries at the national, provincial, city, county, and industrial levels, including Census data.
Desal Data - http://libraries.mit.edu/get/desaldata Desalination plant listings, incorporating the IDA Inventory, market analysis and economic forecasting from Global Water Intelligence.
Find examples

MIT Libraries’ Research Guides
Energy: http://libguides.mit.edu/energy
Social Science Data Services:
http://libraries.mit.edu/guides/subjects/data/
GIS Services, Maps, Data and Mapping:
http://libguides.mit.edu/gis

• help thinking through project ideas
• tools for mapping and spatial analysis
• help identifying relevant data sources
Quote:
“Thank you for all your help. I learned a lot and you saved me so much
time!”
GIS Services @MIT http://libguides.mit.edu/gis

GIS workshops during IAP http://libraries.mit.edu/news/2014-geographic/13294/
• Introduction to GIS
• GIS level 2
• Spatial Statistics: Spatial Autocorrelation
• Spatial Statistics: Regression
• Interpolation in ArcGIS
• Resources for Free and Open GIS Data
• Using Network Analyst in ArcMap
• Hydrology Tools with GIS
• Python Programming in ArcGIS: An Introduction to Scripting for Geographic Analysis Systems

• GIS lab hours - http://libguides.mit.edu/gis/ email : [email protected]
• Class and general workshop support
• Loan GPS units
• Access to GIS data: Geodata Repository
– MIT GeoWeb & ESRI ArcMap Interface
MIT GIS Services


![IBR: Pros and Conscs283/fa10/lectures/283...2 IBR: A brief history Texture maps, bump maps, environment maps [70s] Poggio MIT 90s: Faces, image-based analysis/synthesis Mid-Late 90s](https://img.pdfslide.us/doc/110x75/5f2ec77dc6901828aa22dfad/ibr-pros-and-cons-cs283fa10lectures283-2-ibr-a-brief-history-texture-maps.jpg)