Embed Size (px)
Citation preview
Seventeenth Statewide Conference on Local BridgesTuesday, October 25, 2011
Training Session 1: Fundamentals & Applications of LRFR (Bridge Superstructures)
Presented by: Bala Sivakumar Director Of Special Bridge Projects HNTB (New York)
Bala Sivakumar, P.E.
HNTB
New York
LOAD & RESISTANCE FACTOR RATING OF HIGHWAY BRIDGES
NY STATEWIDE CONFERENCE ON LOCAL BRIDGES
INTRODUCTION
TO LRFR
LOAD RATING OF HIGHWAY BRIDGES
SESSION 1OUTLINE
SESSION 1: INTRODUCTION TO LRFR
SESSION 2: LOAD MODELS FOR LRFR
SESSION 3: LRFR LOAD RATING PROCESS & LOAD RATING EQUATION
SESSION 4: LRFR LIMIT STATES, RELIABILITY INDICES & LOAD FACTORS
SESSION 5: P/S GIRDER BRIDGE LRFR RATING
SESSION 6: STEEL GIRDER BRIDGE LRFR RATING
LOAD RATING OF HIGHWAY BRIDGES
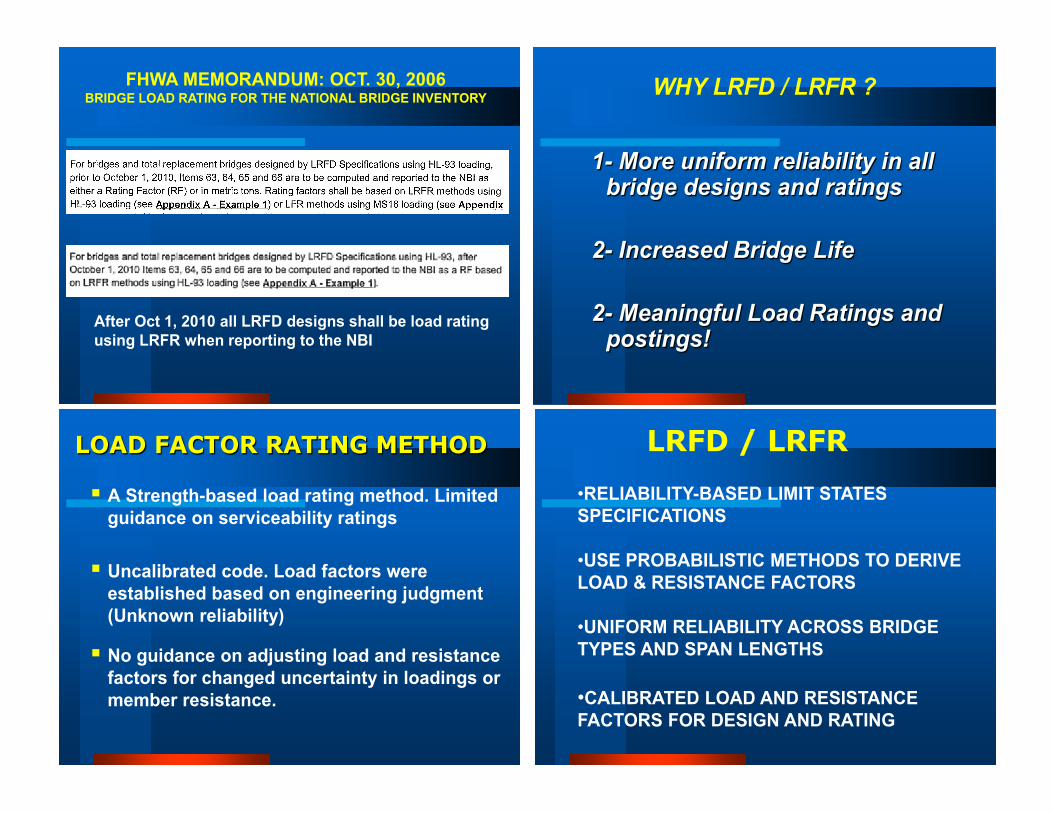
FHWA MEMORANDUM: OCT. 30, 2006BRIDGE LOAD RATING FOR THE NATIONAL BRIDGE INVENTORY
After Oct 1, 2010 all LRFD designs shall be load rating using LRFR when reporting to the NBI
WHY LRFD / LRFR ?
1- More uniform reliability in all bridge designs and ratings
2- Increased Bridge Life
2- Meaningful Load Ratings and postings!
LRFD / LRFR
•RELIABILITY-BASED LIMIT STATES SPECIFICATIONS
•USE PROBABILISTIC METHODS TO DERIVE LOAD & RESISTANCE FACTORS
•UNIFORM RELIABILITY ACROSS BRIDGE TYPES AND SPAN LENGTHS
•CALIBRATED LOAD AND RESISTANCE FACTORS FOR DESIGN AND RATING
LOAD FACTOR RATING METHOD
A Strength-based load rating method. Limited guidance on serviceability ratings
Uncalibrated code. Load factors were established based on engineering judgment (Unknown reliability)
No guidance on adjusting load and resistance factors for changed uncertainty in loadings or member resistance.
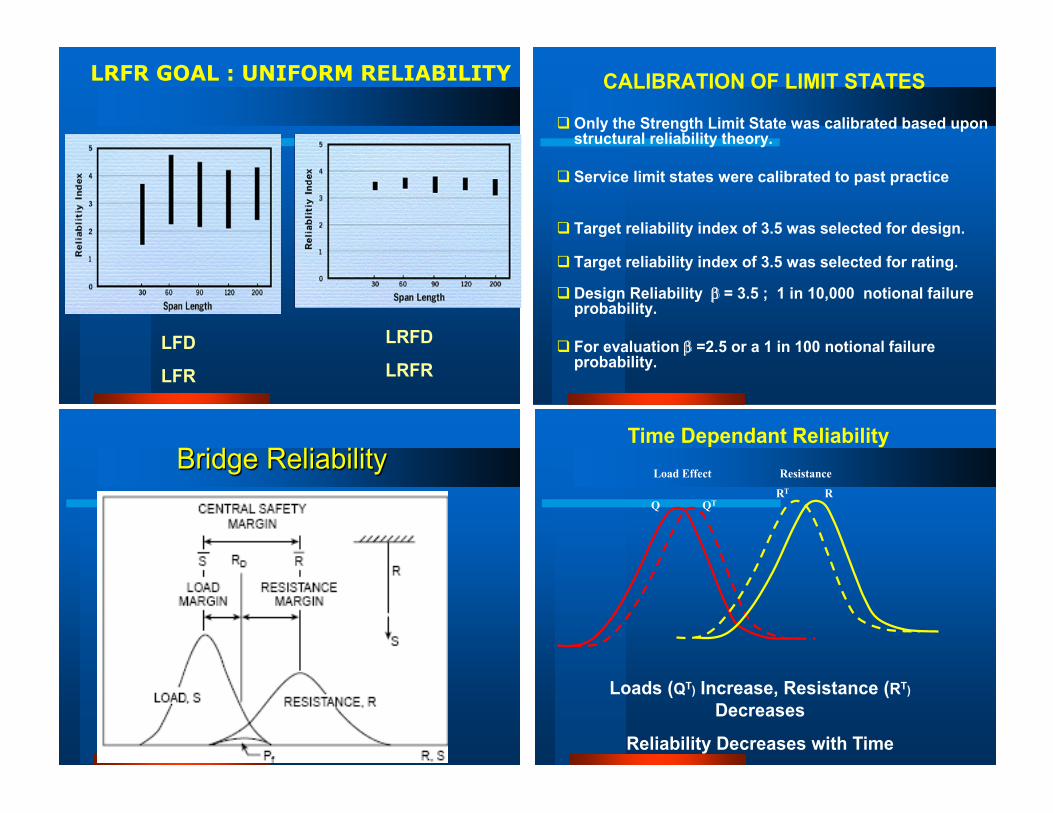
LRFR GOAL : UNIFORM RELIABILITY
LFD
LFR
LRFD
LRFR
CALIBRATION OF LIMIT STATES
Only the Strength Limit State was calibrated based upon structural reliability theory.
Service limit states were calibrated to past practice
Target reliability index of 3.5 was selected for design.
Target reliability index of 3.5 was selected for rating.
Design Reliability β = 3.5 ; 1 in 10,000 notional failure probability.
For evaluation β =2.5 or a 1 in 100 notional failure probability.
Q QTRT R
Load Effect Resistance
Loads (QT) Increase, Resistance (RT)
Decreases
Reliability Decreases with Time
Time Dependant ReliabilityBridge Reliability
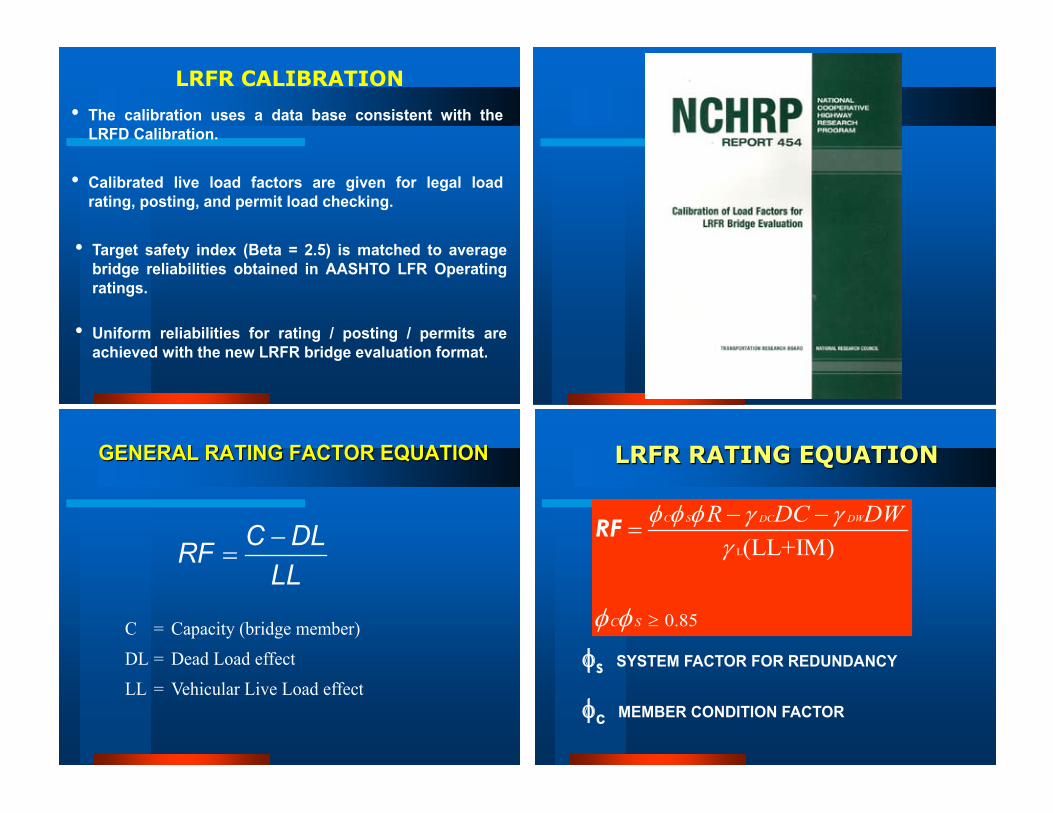
LRFR CALIBRATION
• The calibration uses a data base consistent with theLRFD Calibration.
• Calibrated live load factors are given for legal loadrating, posting, and permit load checking.
• Target safety index (Beta = 2.5) is matched to averagebridge reliabilities obtained in AASHTO LFR Operatingratings.
• Uniform reliabilities for rating / posting / permits areachieved with the new LRFR bridge evaluation format.
LRFR RATING EQUATION
L
0.85
(LL+IM)C S DC DW
C S
R DC DWφ φ φ γ γγ
φ φ ≥
− −=RF
φs SYSTEM FACTOR FOR REDUNDANCY
φc MEMBER CONDITION FACTOR
GENERAL RATING FACTOR EQUATION
C = Capacity (bridge member)DL = Dead Load effectLL = Vehicular Live Load effect
−=
C DLRFLL
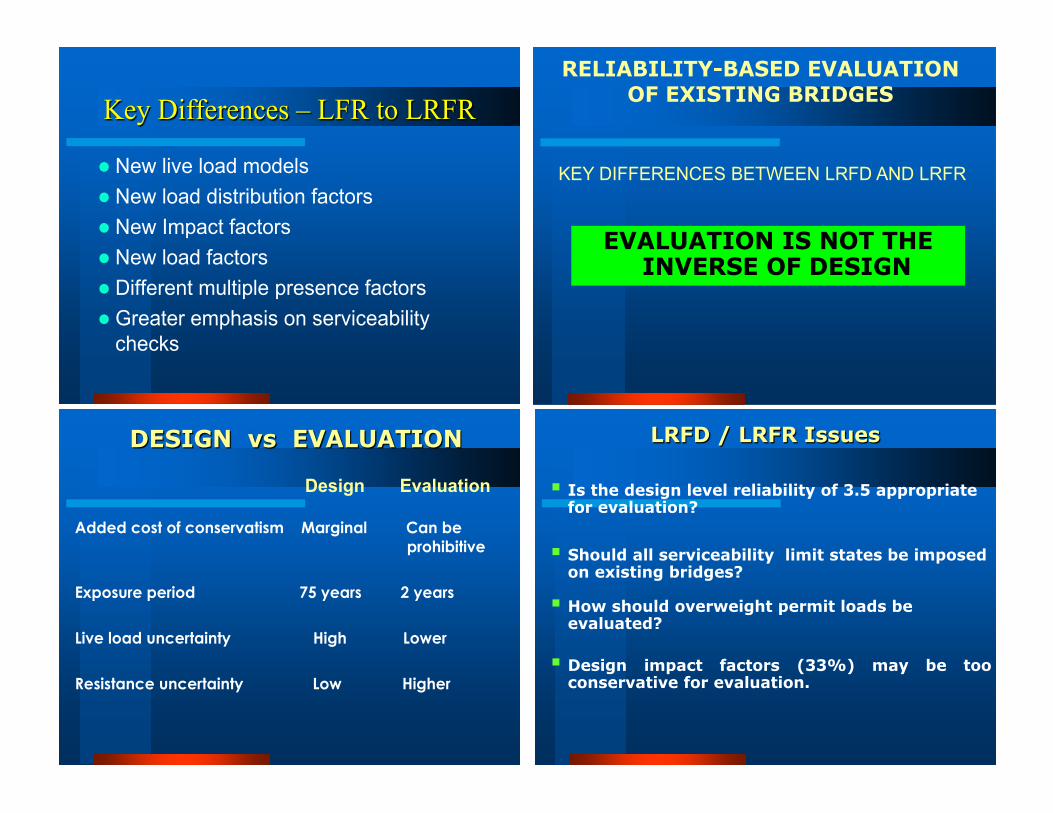
Key Differences – LFR to LRFR
New live load models New load distribution factors New Impact factors New load factors Different multiple presence factors Greater emphasis on serviceability
checks
RELIABILITY-BASED EVALUATION OF EXISTING BRIDGES
EVALUATION IS NOT THE INVERSE OF DESIGN
KEY DIFFERENCES BETWEEN LRFD AND LRFR
LRFD / LRFR Issues
Is the design level reliability of 3.5 appropriate for evaluation?
Should all serviceability limit states be imposed on existing bridges?
How should overweight permit loads be evaluated?
Design impact factors (33%) may be tooconservative for evaluation.
DESIGN vs EVALUATION
Added cost of conservatism Marginal Can be prohibitive
Exposure period 75 years 2 years
Live load uncertainty High Lower
Resistance uncertainty Low Higher
Design Evaluation
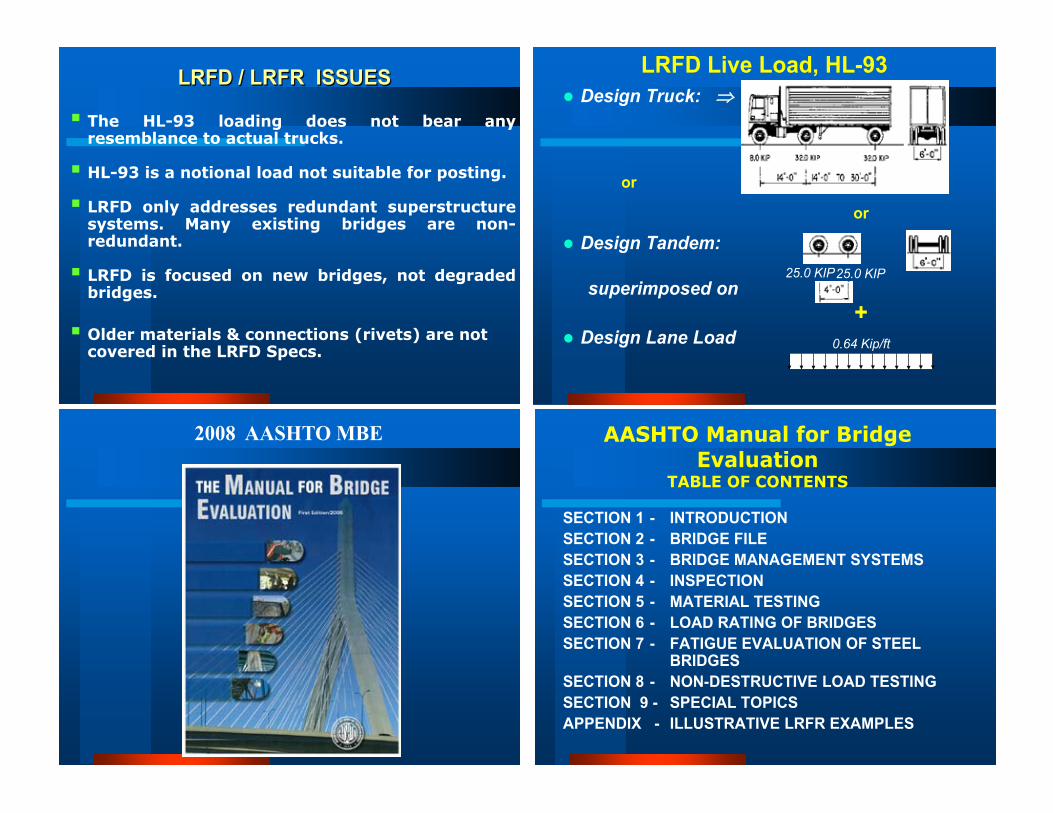
LRFD / LRFR ISSUES
The HL-93 loading does not bear anyresemblance to actual trucks.
HL-93 is a notional load not suitable for posting.
LRFD only addresses redundant superstructuresystems. Many existing bridges are non-redundant.
LRFD is focused on new bridges, not degradedbridges.
Older materials & connections (rivets) are not covered in the LRFD Specs.
LRFD Live Load, HL-93 Design Truck: ⇒
Design Tandem:
superimposed on
Design Lane Load 0.64 Kip/ft
+
or
or
25.0 KIP25.0 KIP
AASHTO Manual for Bridge Evaluation
TABLE OF CONTENTS
SECTION 1 - INTRODUCTIONSECTION 2 - BRIDGE FILESECTION 3 - BRIDGE MANAGEMENT SYSTEMSSECTION 4 - INSPECTIONSECTION 5 - MATERIAL TESTINGSECTION 6 - LOAD RATING OF BRIDGESSECTION 7 - FATIGUE EVALUATION OF STEEL
BRIDGESSECTION 8 - NON-DESTRUCTIVE LOAD TESTING SECTION 9 - SPECIAL TOPICSAPPENDIX - ILLUSTRATIVE LRFR EXAMPLES
2008 AASHTO MBE
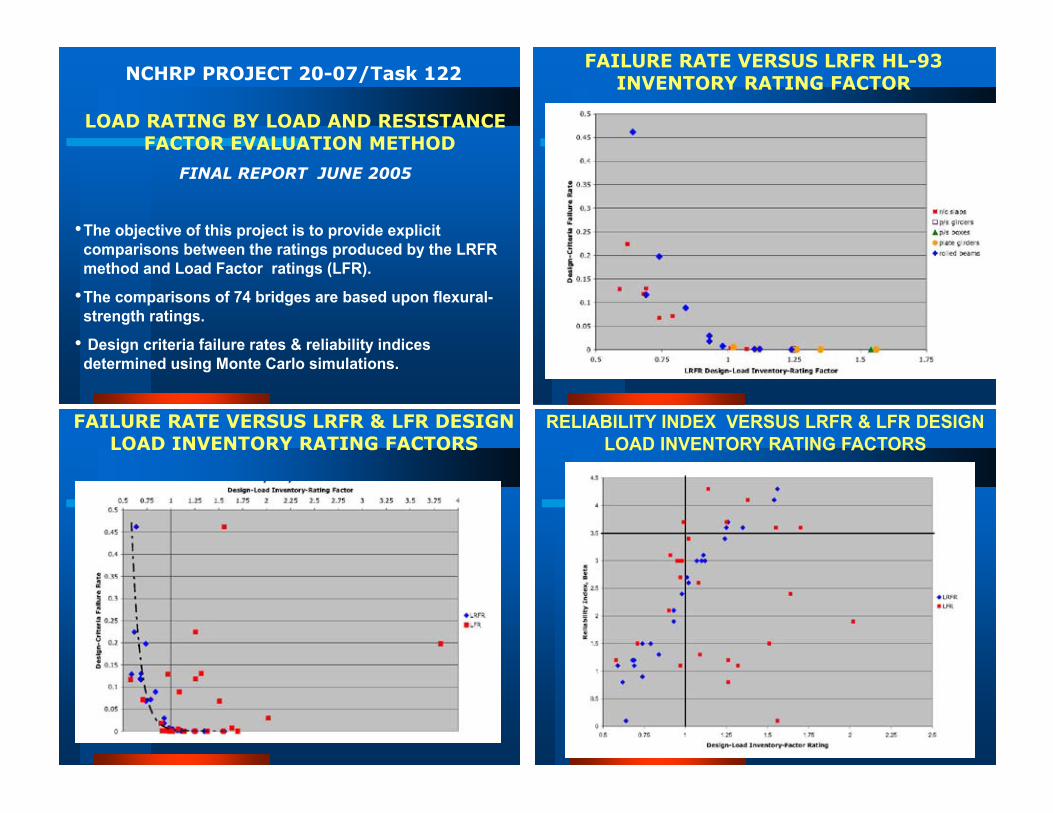
LOAD RATING BY LOAD AND RESISTANCE FACTOR EVALUATION METHOD
FINAL REPORT JUNE 2005
•The objective of this project is to provide explicit comparisons between the ratings produced by the LRFR method and Load Factor ratings (LFR).
•The comparisons of 74 bridges are based upon flexural-strength ratings.
• Design criteria failure rates & reliability indices determined using Monte Carlo simulations.
NCHRP PROJECT 20-07/Task 122FAILURE RATE VERSUS LRFR HL-93
INVENTORY RATING FACTOR
RELIABILITY INDEX VERSUS LRFR & LFR DESIGN LOAD INVENTORY RATING FACTORS
FAILURE RATE VERSUS LRFR & LFR DESIGN LOAD INVENTORY RATING FACTORS
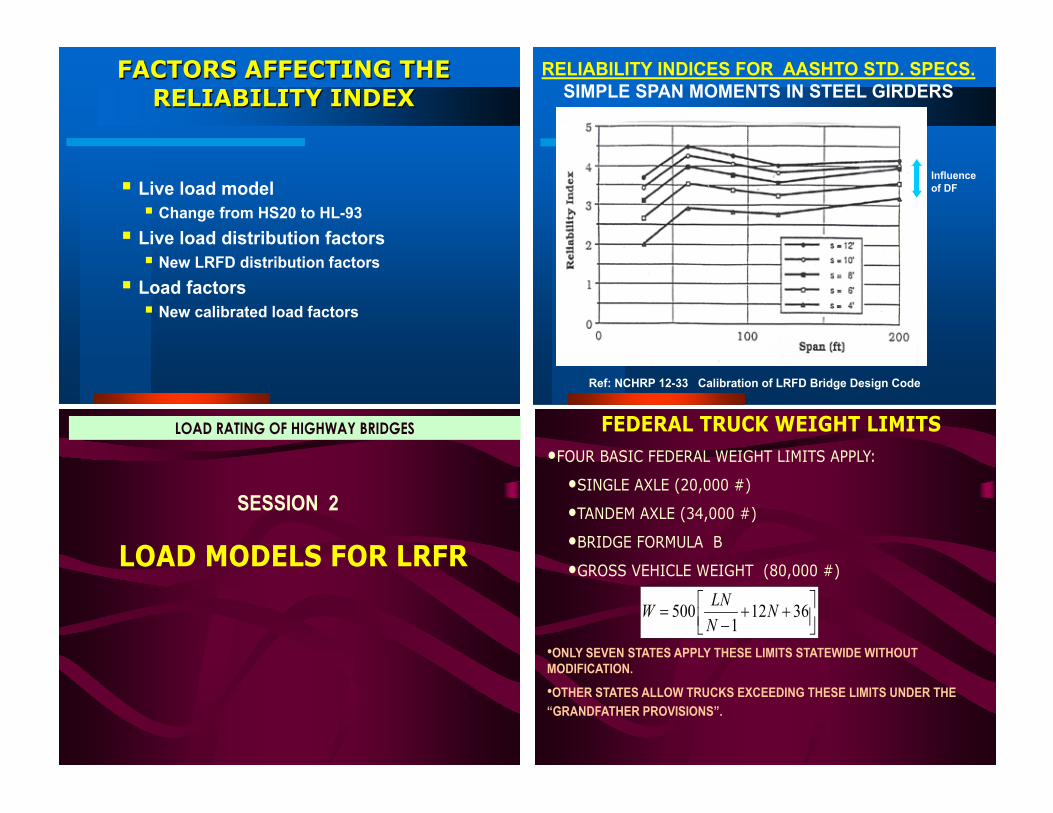
FACTORS AFFECTING THE RELIABILITY INDEX
Live load model Change from HS20 to HL-93
Live load distribution factors New LRFD distribution factors
Load factors New calibrated load factors
RELIABILITY INDICES FOR AASHTO STD. SPECS. SIMPLE SPAN MOMENTS IN STEEL GIRDERS
Ref: NCHRP 12-33 Calibration of LRFD Bridge Design Code
Influence of DF
FEDERAL TRUCK WEIGHT LIMITS•FOUR BASIC FEDERAL WEIGHT LIMITS APPLY:
•SINGLE AXLE (20,000 #)
•TANDEM AXLE (34,000 #)
•BRIDGE FORMULA B
•GROSS VEHICLE WEIGHT (80,000 #)
•ONLY SEVEN STATES APPLY THESE LIMITS STATEWIDE WITHOUT MODIFICATION.
•OTHER STATES ALLOW TRUCKS EXCEEDING THESE LIMITS UNDER THE “GRANDFATHER PROVISIONS”.
500 12 361
LNW NN
= + + −
LOAD MODELS FOR LRFR
LOAD RATING OF HIGHWAY BRIDGES
SESSION 2

WHAT ARE EXCLUSION TRUCKS ?
Trucks that exceed federal weight limits They are legal based on state weight
regulationsAre not allowed on the Interstates but can
operate on state and local roads They induce the highest load effects on
bridges
LIVE LOADS ON OUR HIGHWAYS
FEDERAL LEGAL LOADS
EXCLUSION VEHICLES (Grandfathered Trucks)
OVERWEIGHT PERMIT VEHICLES
< HS20
MICHIGAN EXCLUSION LOAD: 3-S3-5Total Weight = 149.4 Kips Total length = 72.4 Ft
Vehicle Load Effects Enveloped by HL-93
EXCLUSION TRUCKS
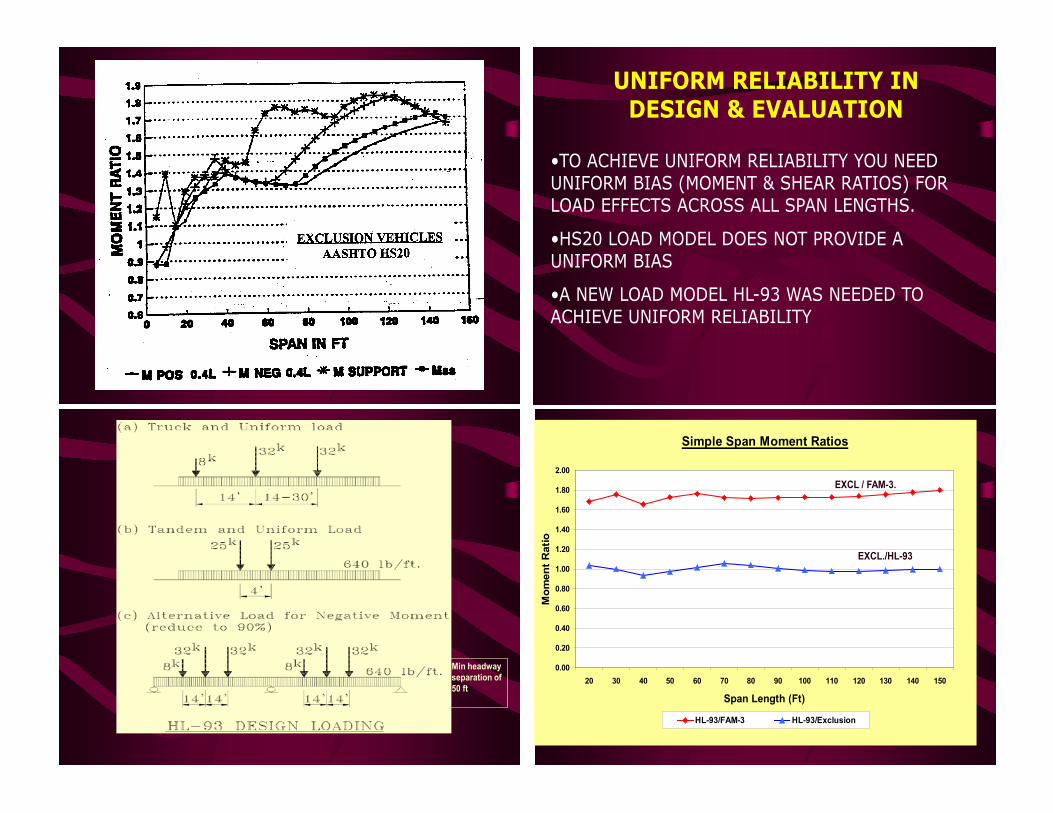
•TO ACHIEVE UNIFORM RELIABILITY YOU NEED UNIFORM BIAS (MOMENT & SHEAR RATIOS) FOR LOAD EFFECTS ACROSS ALL SPAN LENGTHS.
•HS20 LOAD MODEL DOES NOT PROVIDE A UNIFORM BIAS
•A NEW LOAD MODEL HL-93 WAS NEEDED TO ACHIEVE UNIFORM RELIABILITY
UNIFORM RELIABILITY IN DESIGN & EVALUATION
Simple Span Moment Ratios
0.00
0.20
0.40
0.60
0.80
1.00
1.20
1.40
1.60
1.80
2.00
20 30 40 50 60 70 80 90 100 110 120 130 140 150
Span Length (Ft)
Mom
ent
Rat
io
HL-93/FAM-3 HL-93/Exclusion
EXCL./HL-93
EXCL / FAM-3.
Min headway separation of 50 ft
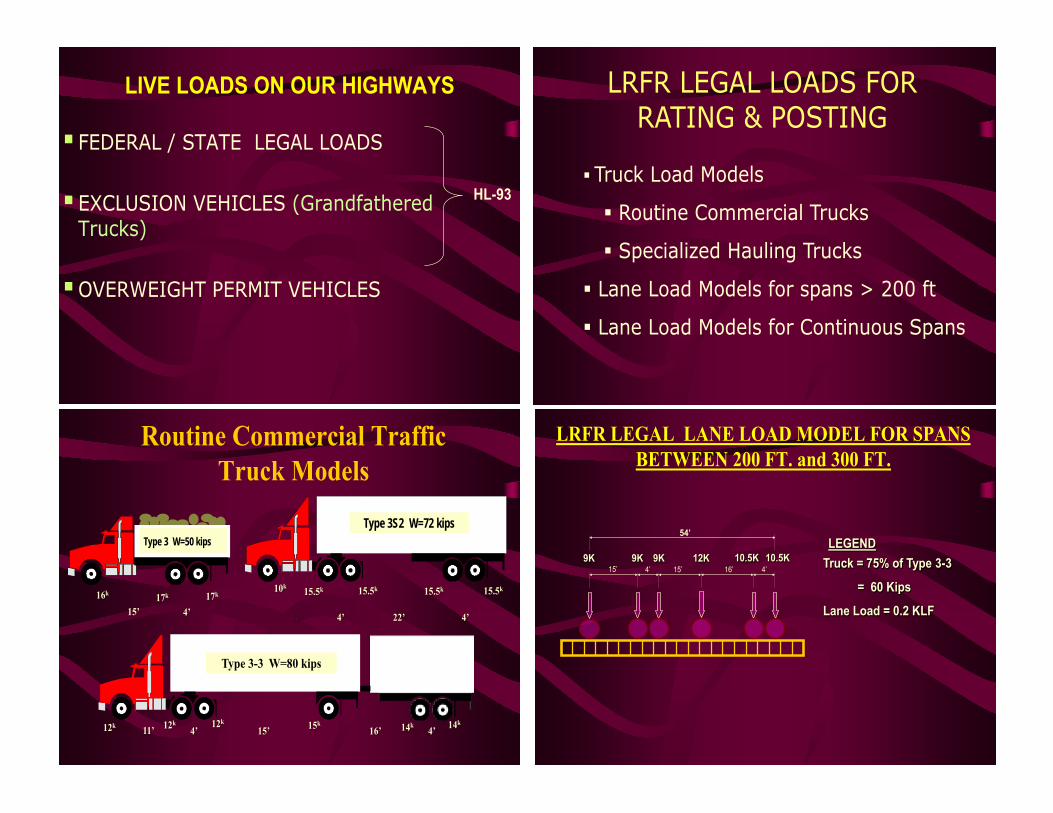
LIVE LOADS ON OUR HIGHWAYS
FEDERAL / STATE LEGAL LOADS
EXCLUSION VEHICLES (Grandfathered Trucks)
OVERWEIGHT PERMIT VEHICLES
HL-93
LRFR LEGAL LOADS FOR RATING & POSTING
Truck Load Models
Routine Commercial Trucks
Specialized Hauling Trucks
Lane Load Models for spans > 200 ft
Lane Load Models for Continuous Spans
LRFR LEGAL LANE LOAD MODEL FOR SPANS BETWEEN 200 FT. and 300 FT.
15’ 4’ 15’ 4’16’9K 9K 9K 12K 10.5K 10.5K
54’LEGEND
Truck = 75% of Type 3-3
= 60 Kips
Lane Load = 0.2 KLF
Routine Commercial TrafficTruck Models
15.5k
11’ 4’22’
15.5k15.5k15.5k10k
4’
Type 3S2 W=72 kips
16’11’ 4’ 15’ 4’12k 12k 12k 15k 14k 14k
Type 3-3 W=80 kips
15’ 4’17k17k16k
Type 3 W=50 kips
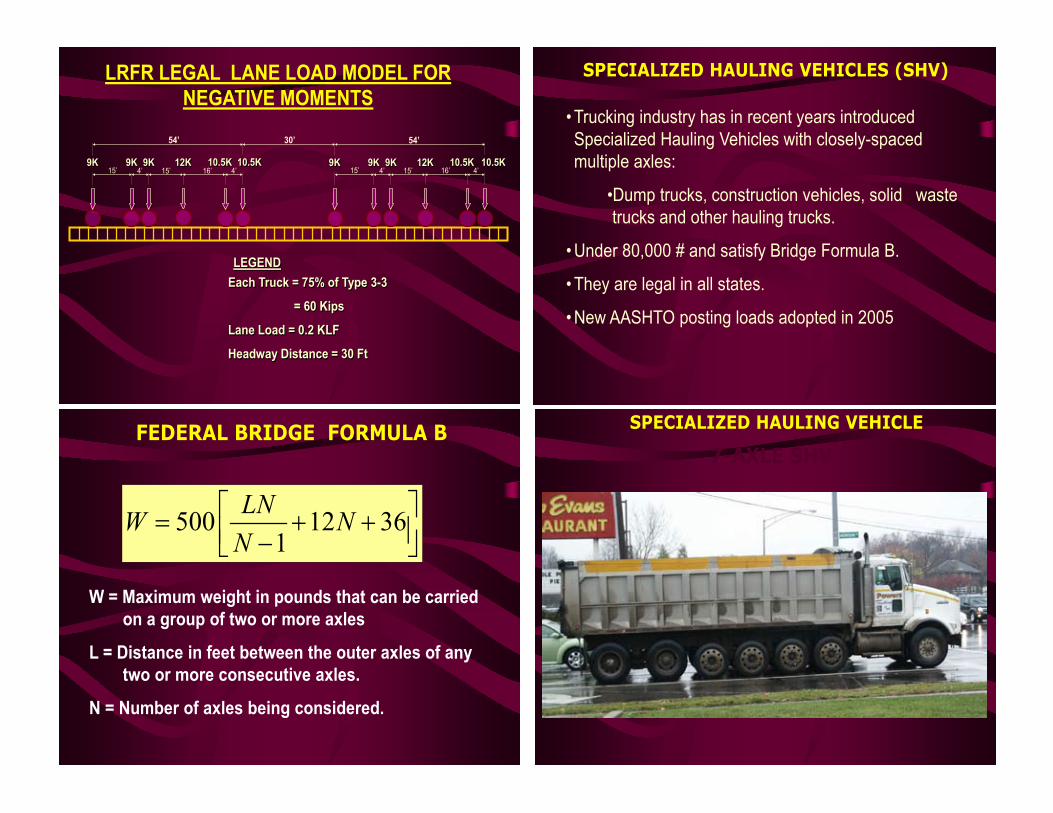
LRFR LEGAL LANE LOAD MODEL FOR NEGATIVE MOMENTS
15’ 4’ 15’ 4’16’9K 9K 9K 12K 10.5K 10.5K
54’
15’ 4’ 15’ 4’16’9K 9K 9K 12K 10.5K 10.5K
54’30’
LEGENDEach Truck = 75% of Type 3-3
= 60 Kips
Lane Load = 0.2 KLF
Headway Distance = 30 Ft
•Trucking industry has in recent years introduced Specialized Hauling Vehicles with closely-spacedmultiple axles:
•Dump trucks, construction vehicles, solid waste trucks and other hauling trucks.
•Under 80,000 # and satisfy Bridge Formula B.
•They are legal in all states.
•New AASHTO posting loads adopted in 2005
SPECIALIZED HAULING VEHICLES (SHV)
7-AXLE SHV
SPECIALIZED HAULING VEHICLE
500 12 361
LNW NN
= + + −
FEDERAL BRIDGE FORMULA B
W = Maximum weight in pounds that can be carried on a group of two or more axles
L = Distance in feet between the outer axles of any two or more consecutive axles.
N = Number of axles being considered.

7-AXLE SHVSPECIALIZED HAULING VEHICLE Original AASHTO Single Unit Truck
•AASHTO Type 3 posting load is not representative of these newer legal loads.
•These SHVs may be severely overstressing short span bridges.
TYPE 3
Weight = 50 Kips
AASHTO ADOPTED:
• NEW POSTING LOADS FOR SHVs
• A NEW NOTIONAL RATING LOAD FOR LOAD RATING OF BRIDGES
• NEW POSTING LOAD MODELS FOR SINGLE UNIT TRUCKS
• APPLIES TO: ALLOWABLE STRESS, LOAD FACTOR, LOAD AND RESISTANCE FACTOR METHODS
2005 AASHTO BRIDGE MEETING
POSTING LOADS FOR SPECIALIZED HAULING VEHICLES THAT MEET
BRIDGE FORMULA B
NCHRP Project 12-63
NCHRP Report 575
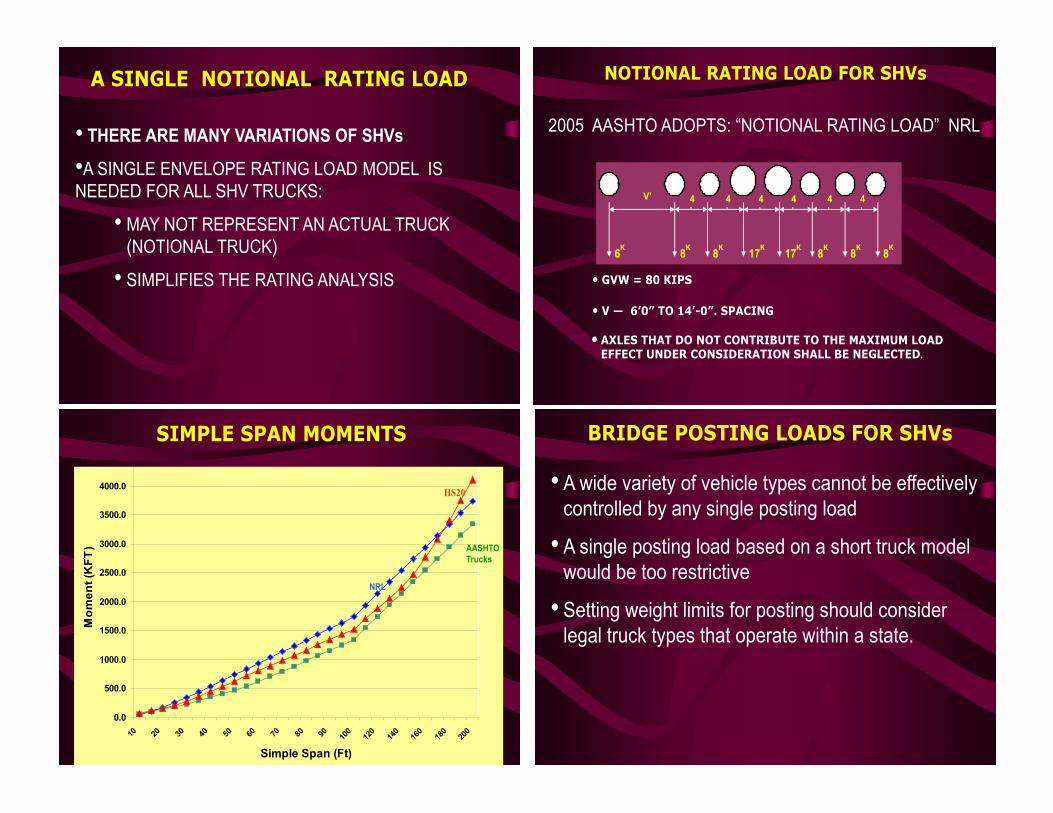
A SINGLE NOTIONAL RATING LOAD
• THERE ARE MANY VARIATIONS OF SHVs
•A SINGLE ENVELOPE RATING LOAD MODEL IS NEEDED FOR ALL SHV TRUCKS:
• MAY NOT REPRESENT AN ACTUAL TRUCK (NOTIONAL TRUCK)
• SIMPLIFIES THE RATING ANALYSIS • GVW = 80 KIPS
• V — 6’0” TO 14’-0”. SPACING
• AXLES THAT DO NOT CONTRIBUTE TO THE MAXIMUM LOAD EFFECT UNDER CONSIDERATION SHALL BE NEGLECTED.
2005 AASHTO ADOPTS: “NOTIONAL RATING LOAD” NRL
NOTIONAL RATING LOAD FOR SHVs
4’
4’
4’
4’
4’
4’
V’
6K 8K 8K 17K 17K 8K 8K 8K
BRIDGE POSTING LOADS FOR SHVs
• A wide variety of vehicle types cannot be effectively controlled by any single posting load
• A single posting load based on a short truck model would be too restrictive
• Setting weight limits for posting should consider legal truck types that operate within a state.
SIMPLE SPAN MOMENTS
0.0
500.0
1000.0
1500.0
2000.0
2500.0
3000.0
3500.0
4000.0
10 20 30 40 50 60 70 80 90 100
120
140
160
180
200
Simple Span (Ft)
Mom
ent (
KFT
)
NRL
AASHTO Trucks
HS20

SU4 TRUCK
GVW = 54 KIPS
SU5 TRUCK
GVW = 62 KIPS
17K
2005 AASHTO POSTING LOADS
4’4’10’
12K 8K 17K17K
4’4’4’10’
12K 8K 8K 17K 17K
SU6 TRUCK
GVW = 69.5 KIPS
SU7 TRUCK
GVW = 77.5 KIPS
2005 AASHTO POSTING LOADS
4’4’4’4’10’
11.5K 8K 8K 17K 17K 8K
4’4’4’4’4’10’
11.5K 8K 8K 17K 17K 8K 8K
LRFR FOR OVERWEIGHT PERMIT CHECKING
LRFR provides permit load factors by permit type:- Routine/Annual Permits < 150 K- Special Permits > 150 K
Load factors calibrated to provide uniform reliability: β = 2.5 for Routine Permits, β = 3.5 for Special permits.
CHECKING OVERWEIGHT PERMITSSTRENGTH II LIMIT STATE

ROUTINE PERMIT
8-AXLE CONTINUOUS TRIP PERMIT 105.5 K (Oregon)
Ohio Superload: TOTAL WEIGHT 848.6 k
SPECIAL PERMIT
LRFD Live Load Distribution Factors• These factors were derived using refined methods of analysis.
•The LRFD formulas are lane-load distributions not wheel-load distributions.
• Distribution formulas for beam-and-slab bridges are found in the LRFD Specifications (Section 4).
• There are specific limitations on span and girder spacings.
3.5 ≤ Spacing ≤ 16 ft.
20 ≤ Span ≤ 240 feet
LIVE LOAD DISTRIBUTION ANALYSIS
• LRFR UTILIZES LRFD DISTRIBUTION FACTORS
• MORE ACCURATE THAN S/D FACTORS
• MORE COMPLEX
• DIFFERENT DF FOR MOMENT AND SHEAR
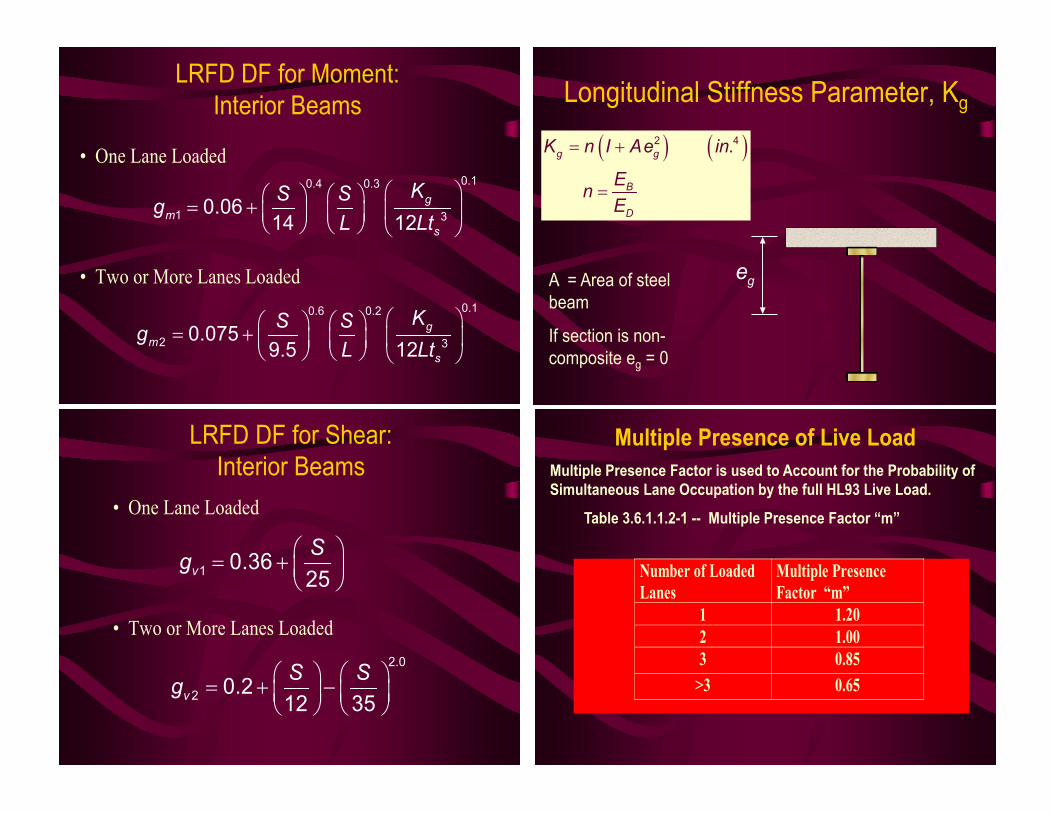
LRFD DF for Moment:Interior Beams
• One Lane Loaded
• Two or More Lanes Loaded
= +
0.10.4 0.3
1 30.0614 12
gm
s
KS SgL Lt
= +
0.10.6 0.2
2 30.0759.5 12
gm
s
KS SgL Lt
Longitudinal Stiffness Parameter, Kg
( ) ( )2 4.g g
B
D
K n I Ae in
EnE
= +
=
geA = Area of steel beam
If section is non-composite eg = 0
Multiple Presence of Live LoadMultiple Presence Factor is used to Account for the Probability of Simultaneous Lane Occupation by the full HL93 Live Load.
Table 3.6.1.1.2-1 -- Multiple Presence Factor “m”
Number of Loaded Lanes
Multiple Presence Factor “m”
1 1.202 1.003 0.85
>3 0.65
LRFD DF for Shear:Interior Beams
• One Lane Loaded
• Two or More Lanes Loaded
1 0.3625vSg = +
2.0
2 0.212 35vS Sg = + −
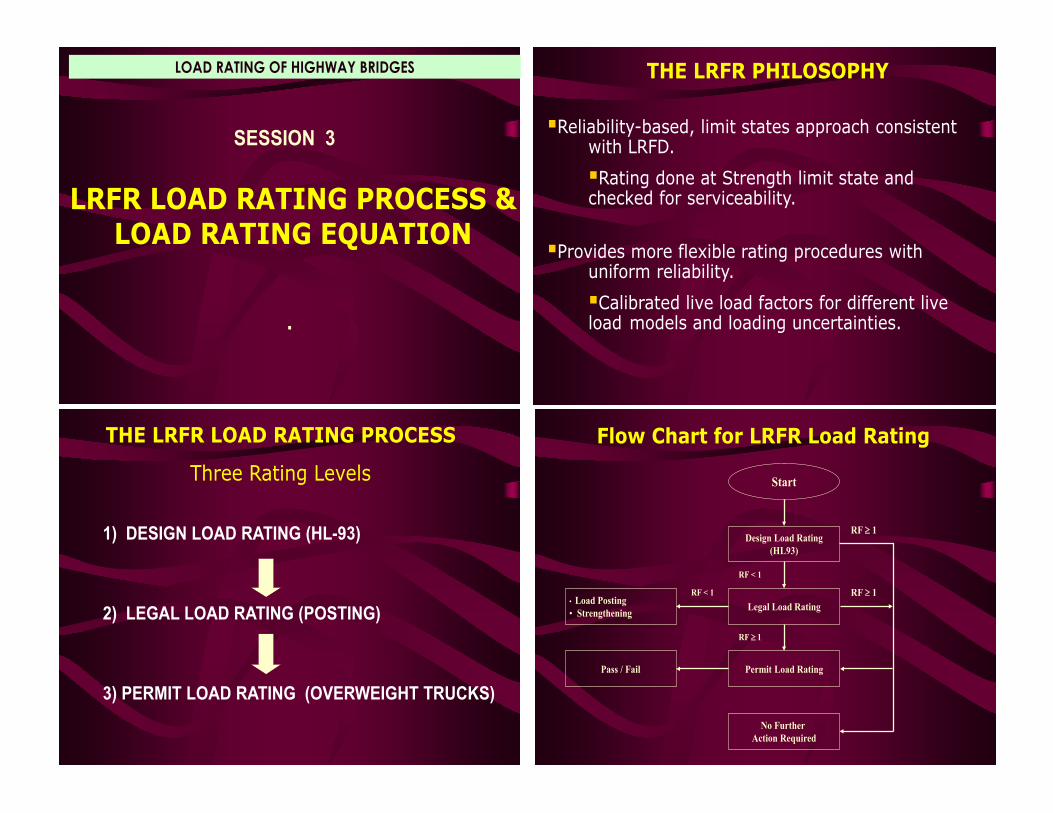
LRFR LOAD RATING PROCESS & LOAD RATING EQUATION
.
LOAD RATING OF HIGHWAY BRIDGES
SESSION 3
THE LRFR PHILOSOPHY
Reliability-based, limit states approach consistent with LRFD.
Rating done at Strength limit state and checked for serviceability.
Provides more flexible rating procedures with uniform reliability.
Calibrated live load factors for different live load models and loading uncertainties.
Flow Chart for LRFR Load Rating
Start
Legal Load Rating
Design Load Rating(HL93)
Permit Load Rating
No Further Action Required
• Load Posting• Strengthening
Pass / Fail
RF ≥ 1
RF ≥ 1
RF ≥ 1
RF < 1
RF < 1
THE LRFR LOAD RATING PROCESS
Three Rating Levels
1) DESIGN LOAD RATING (HL-93)
2) LEGAL LOAD RATING (POSTING)
3) PERMIT LOAD RATING (OVERWEIGHT TRUCKS)
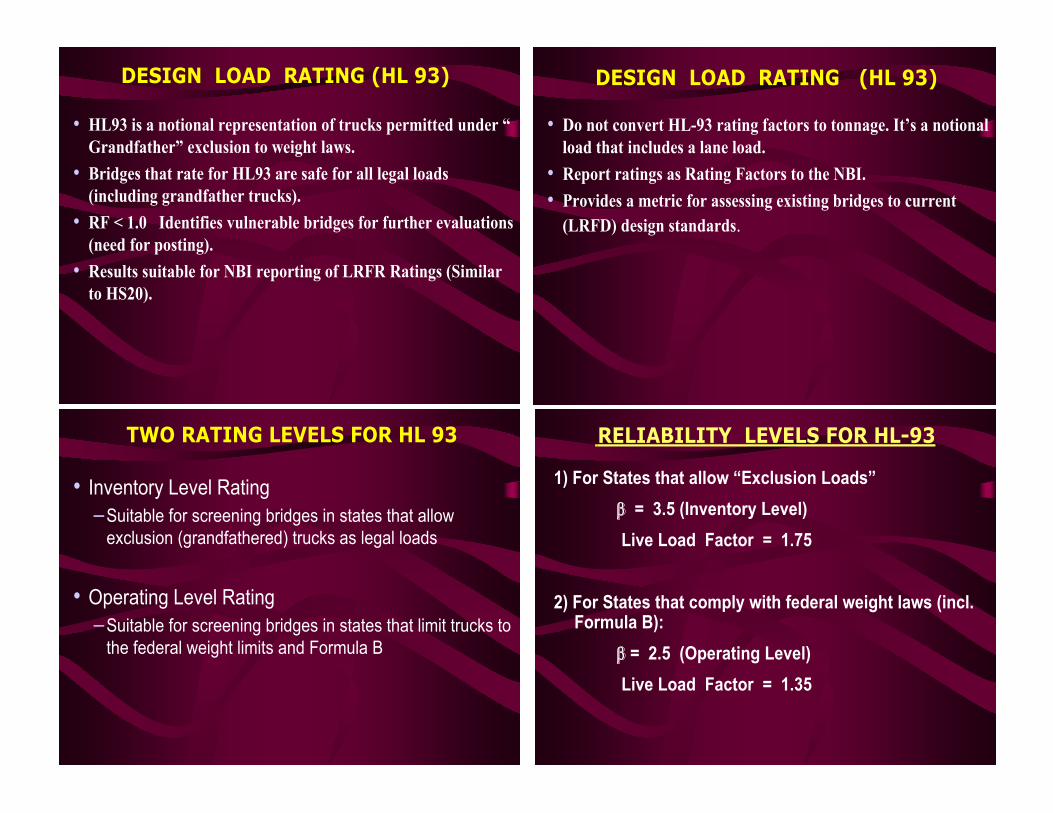
DESIGN LOAD RATING (HL 93)
• HL93 is a notional representation of trucks permitted under “ Grandfather” exclusion to weight laws.
• Bridges that rate for HL93 are safe for all legal loads (including grandfather trucks).
• RF < 1.0 Identifies vulnerable bridges for further evaluations (need for posting).
• Results suitable for NBI reporting of LRFR Ratings (Similar to HS20).
DESIGN LOAD RATING (HL 93)
• Do not convert HL-93 rating factors to tonnage. It’s a notional load that includes a lane load.
• Report ratings as Rating Factors to the NBI.• Provides a metric for assessing existing bridges to current
(LRFD) design standards.
1) For States that allow “Exclusion Loads” β = 3.5 (Inventory Level) Live Load Factor = 1.75
2) For States that comply with federal weight laws (incl. Formula B):
β = 2.5 (Operating Level) Live Load Factor = 1.35
RELIABILITY LEVELS FOR HL-93TWO RATING LEVELS FOR HL 93
• Inventory Level Rating–Suitable for screening bridges in states that allow
exclusion (grandfathered) trucks as legal loads
• Operating Level Rating–Suitable for screening bridges in states that limit trucks to
the federal weight limits and Formula B
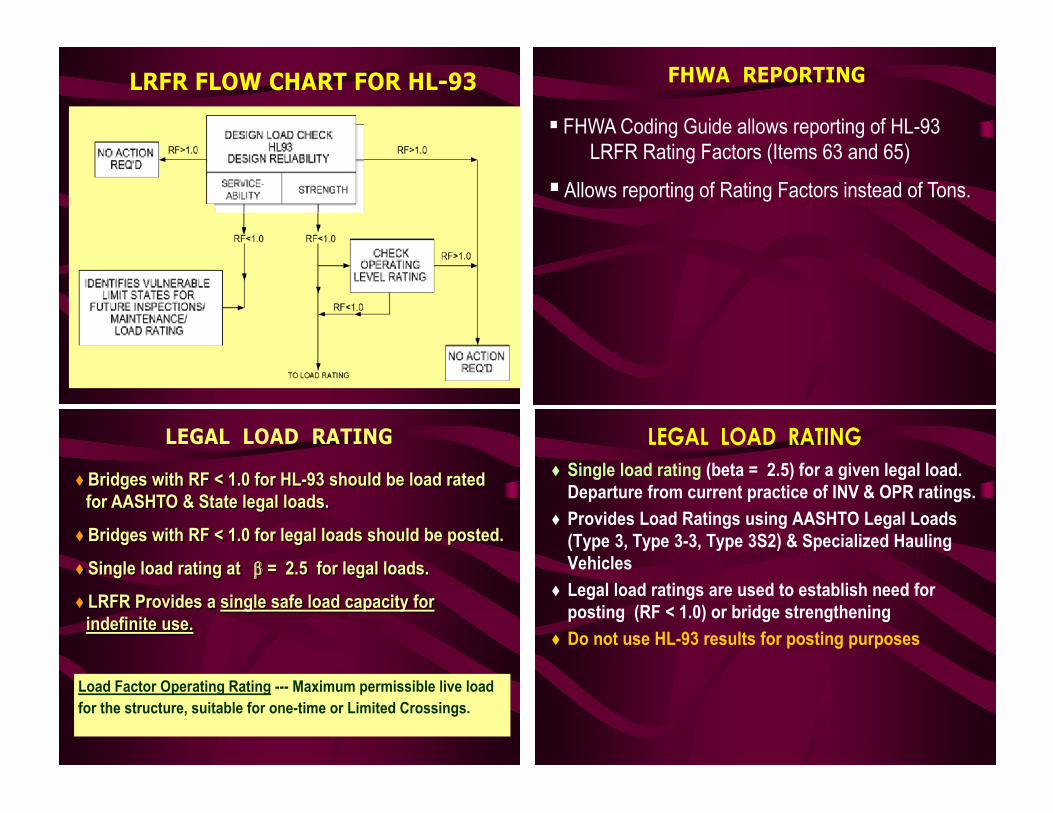
LRFR FLOW CHART FOR HL-93 FHWA REPORTING
FHWA Coding Guide allows reporting of HL-93LRFR Rating Factors (Items 63 and 65)
Allows reporting of Rating Factors instead of Tons.
LEGAL LOAD RATING♦ Single load rating (beta = 2.5) for a given legal load.
Departure from current practice of INV & OPR ratings.♦ Provides Load Ratings using AASHTO Legal Loads
(Type 3, Type 3-3, Type 3S2) & Specialized Hauling Vehicles
♦ Legal load ratings are used to establish need for posting (RF < 1.0) or bridge strengthening
♦ Do not use HL-93 results for posting purposes
LEGAL LOAD RATING
♦Bridges with RF < 1.0 for HL-93 should be load rated for AASHTO & State legal loads.
♦Bridges with RF < 1.0 for legal loads should be posted.
♦Single load rating at β = 2.5 for legal loads.
♦LRFR Provides a single safe load capacity for indefinite use.
Load Factor Operating Rating --- Maximum permissible live load for the structure, suitable for one-time or Limited Crossings.
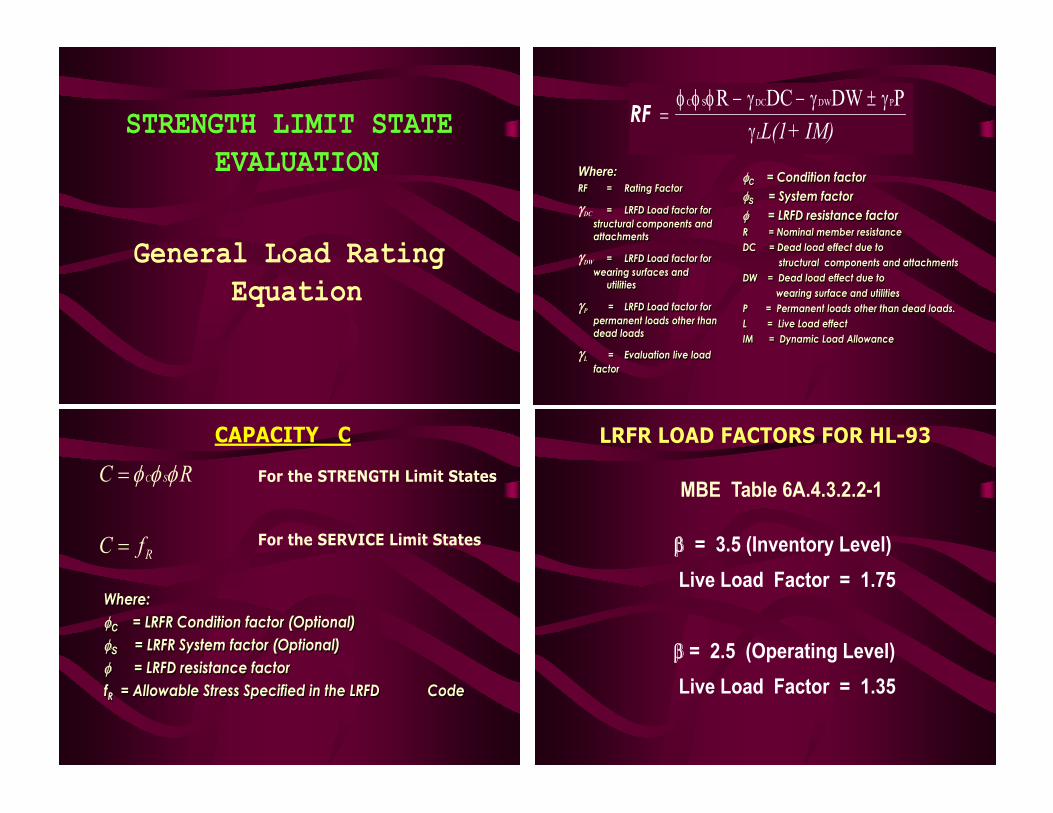
STRENGTH LIMIT STATE EVALUATION
General Load Rating Equation
Where:RF = Rating Factor
γDC = LRFD Load factor for structural components and attachments
γDW = LRFD Load factor for wearing surfaces and
utilities
γP = LRFD Load factor for permanent loads other than dead loads
γL = Evaluation live load factor
RF =− − ±φ φ φ γ γ γ
γC S DC DW PR DC DW P
LL(1+ IM)
φC = Condition factor φS = System factor φ = LRFD resistance factorR = Nominal member resistance DC = Dead load effect due to structural components and attachmentsDW = Dead load effect due to wearing surface and utilitiesP = Permanent loads other than dead loads.L = Live Load effectIM = Dynamic Load Allowance
β = 3.5 (Inventory Level)Live Load Factor = 1.75
β = 2.5 (Operating Level)Live Load Factor = 1.35
LRFR LOAD FACTORS FOR HL-93
MBE Table 6A.4.3.2.2-1
Where:φC = LRFR Condition factor (Optional) φS = LRFR System factor (Optional) φ = LRFD resistance factorfR = Allowable Stress Specified in the LRFD Code
C S
R
C R
C f
φ φ φ=
=
CAPACITY C
For the STRENGTH Limit States
For the SERVICE Limit States
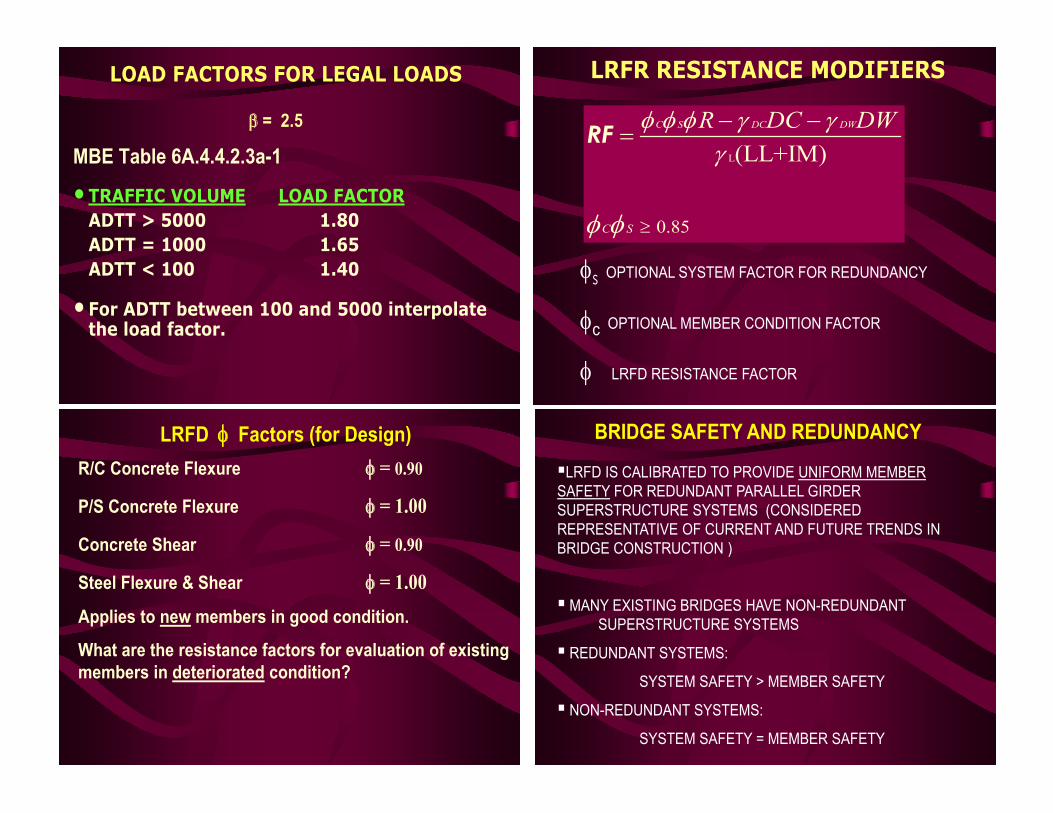
LOAD FACTORS FOR LEGAL LOADS
MBE Table 6A.4.4.2.3a-1
•TRAFFIC VOLUME LOAD FACTORADTT > 5000 1.80ADTT = 1000 1.65ADTT < 100 1.40
• For ADTT between 100 and 5000 interpolate the load factor.
β = 2.5
LRFR RESISTANCE MODIFIERS
L
0.85
(LL+IM)C S DC DW
C S
R DC DWφ φ φ γ γγ
φ φ ≥
− −=RF
φs OPTIONAL SYSTEM FACTOR FOR REDUNDANCY
φc OPTIONAL MEMBER CONDITION FACTOR
φ LRFD RESISTANCE FACTOR
BRIDGE SAFETY AND REDUNDANCY
LRFD IS CALIBRATED TO PROVIDE UNIFORM MEMBER SAFETY FOR REDUNDANT PARALLEL GIRDER SUPERSTRUCTURE SYSTEMS (CONSIDERED REPRESENTATIVE OF CURRENT AND FUTURE TRENDS IN BRIDGE CONSTRUCTION )
MANY EXISTING BRIDGES HAVE NON-REDUNDANT SUPERSTRUCTURE SYSTEMS
REDUNDANT SYSTEMS:
SYSTEM SAFETY > MEMBER SAFETY
NON-REDUNDANT SYSTEMS:
SYSTEM SAFETY = MEMBER SAFETY
LRFD φ Factors (for Design)R/C Concrete Flexure φ = 0.90
P/S Concrete Flexure φ = 1.00
Concrete Shear φ = 0.90
Steel Flexure & Shear φ = 1.00Applies to new members in good condition.
What are the resistance factors for evaluation of existing members in deteriorated condition?

SYSTEM FACTOR φs C = φφcφs R
System Factors are Multipliers to the Nominal Resistance to Reflect the Level of Redundancy of the Complete Superstructure System. Non-Redundant Bridges will Have Their Factored Member
Capacities Reduced, and, Accordingly, will Have Lower Ratings. System Factors are Used to Maintain an Adequate Level of
System Safety. The Aim of φs is to Add Reserve Capacity (to non-redundant
member) such That System Reliability is Increased from an Operating Level Reliability to an Inventory Level Reliability
SYSTEM FACTOR φs C = φφcφs R
Redundant Bridges φs = 1.00
Non-redundant Bridges φs = 0.85
NON-REDUNDANT MEMBERS WITH INTERNAL REDUNDANCY
Riveted Two-Girder/Truss Bridges φs = 0.90 Multiple Eyebar Members in Trusses φs = 0.90 Floorbeams with Spacing > 12 ft φs = 0.85
SYSTEM FACTORS ARE NOT APPROPRIATE FOR SHEAR AS SHEAR FAILURES TEND TO BE BRITTLE. WITHOUT DUCTILITY SYSTEM RESERVE IS NOT POSSIBLE.
CONDITION FACTOR φc• Condition Factor φc is Tied to The Condition of The Member
Being Evaluated:• Good or Satisfactory φc = 1.00• Fair φc = 0.95• Poor φc = 0.85
• If Element Level Condition Data is not Collected, NBI Ratings for the Superstructure May be Used
φc = 0.85 for NBI Rating of 4 φc = 0.95 for NBI Rating of 5φc = 1.00 for NBI Rating 6 or higher
Increases Beta from 2.5 to a target of about 3.5 to account for the increased variability of resistance of deteriorated members.
CONDITION FACTOR φcC = φφcφs R
Resistance of Deteriorated Bridges LRFD Resistance Factors for New Members Must be Reduced
When Applied to Deteriorated Members There is Increased Uncertainty and Variability in Resistance of
Deteriorated Members They are Prone to Accelerated Future Deterioration. (increased
additional losses between inspection cycles) Improved Inspections will Reduce, but not Totally Eliminate, the
Increased Resistance Variability in Deteriorated Bridges.
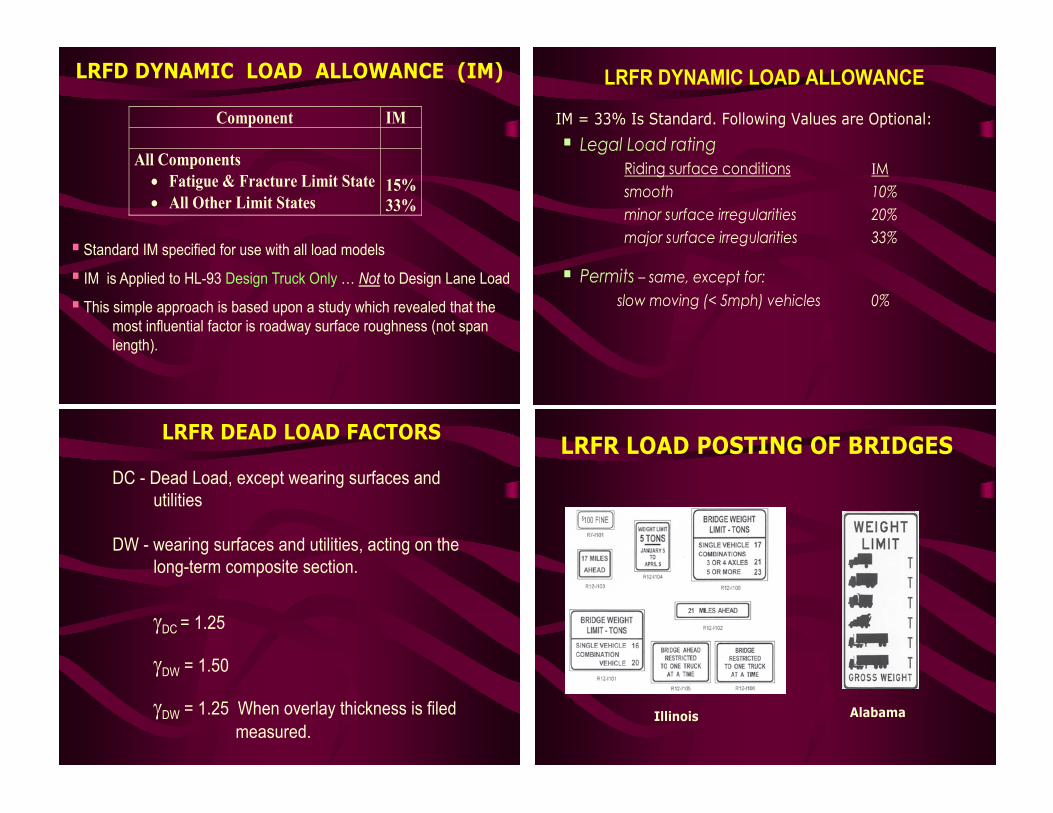
LRFD DYNAMIC LOAD ALLOWANCE (IM)
Component IM
All Components• Fatigue & Fracture Limit State• All Other Limit States
15%33%
Standard IM specified for use with all load models
IM is Applied to HL-93 Design Truck Only … Not to Design Lane Load
This simple approach is based upon a study which revealed that the most influential factor is roadway surface roughness (not span length).
LRFR DYNAMIC LOAD ALLOWANCE
IM = 33% Is Standard. Following Values are Optional:
Legal Load ratingRiding surface conditions IMsmooth 10%minor surface irregularities 20%major surface irregularities 33%
Permits – same, except for: slow moving (< 5mph) vehicles 0%
LRFR LOAD POSTING OF BRIDGES
Illinois Alabama
LRFR DEAD LOAD FACTORS
DC - Dead Load, except wearing surfaces and utilities
DW - wearing surfaces and utilities, acting on the long-term composite section.
γDC = 1.25
γDW = 1.50
γDW = 1.25 When overlay thickness is filed measured.
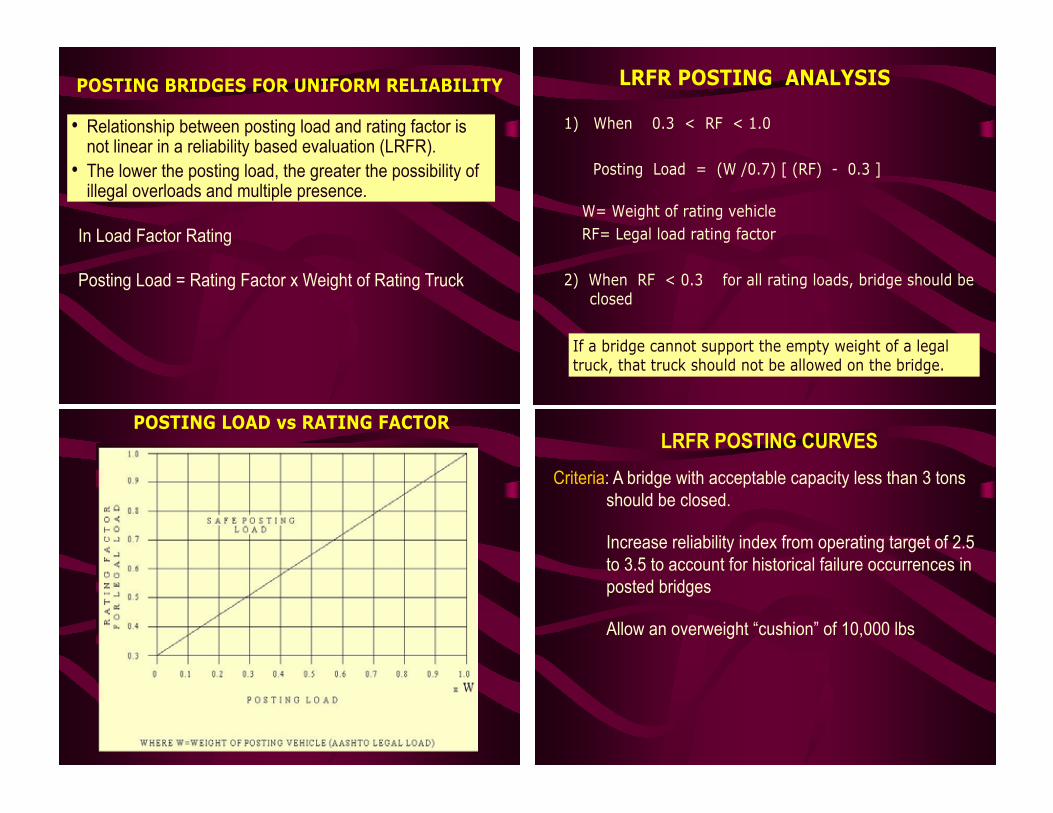
POSTING BRIDGES FOR UNIFORM RELIABILITY
• Relationship between posting load and rating factor is not linear in a reliability based evaluation (LRFR).
• The lower the posting load, the greater the possibility of illegal overloads and multiple presence.
In Load Factor Rating
Posting Load = Rating Factor x Weight of Rating Truck
LRFR POSTING ANALYSIS
1) When 0.3 < RF < 1.0 Posting Load = (W /0.7) [ (RF) - 0.3 ]
W= Weight of rating vehicleRF= Legal load rating factor
2) When RF < 0.3 for all rating loads, bridge should be
closed If a bridge cannot support the empty weight of a legal truck, that truck should not be allowed on the bridge.
LRFR POSTING CURVES Criteria: A bridge with acceptable capacity less than 3 tons
should be closed.
Increase reliability index from operating target of 2.5 to 3.5 to account for historical failure occurrences in posted bridges
Allow an overweight “cushion” of 10,000 lbs
POSTING LOAD vs RATING FACTOR
LRFR LIMIT STATES, RELIABILITY INDICES & LOAD
FACTORS
LOAD RATING OF HIGHWAY BRIDGES
SESSION 4
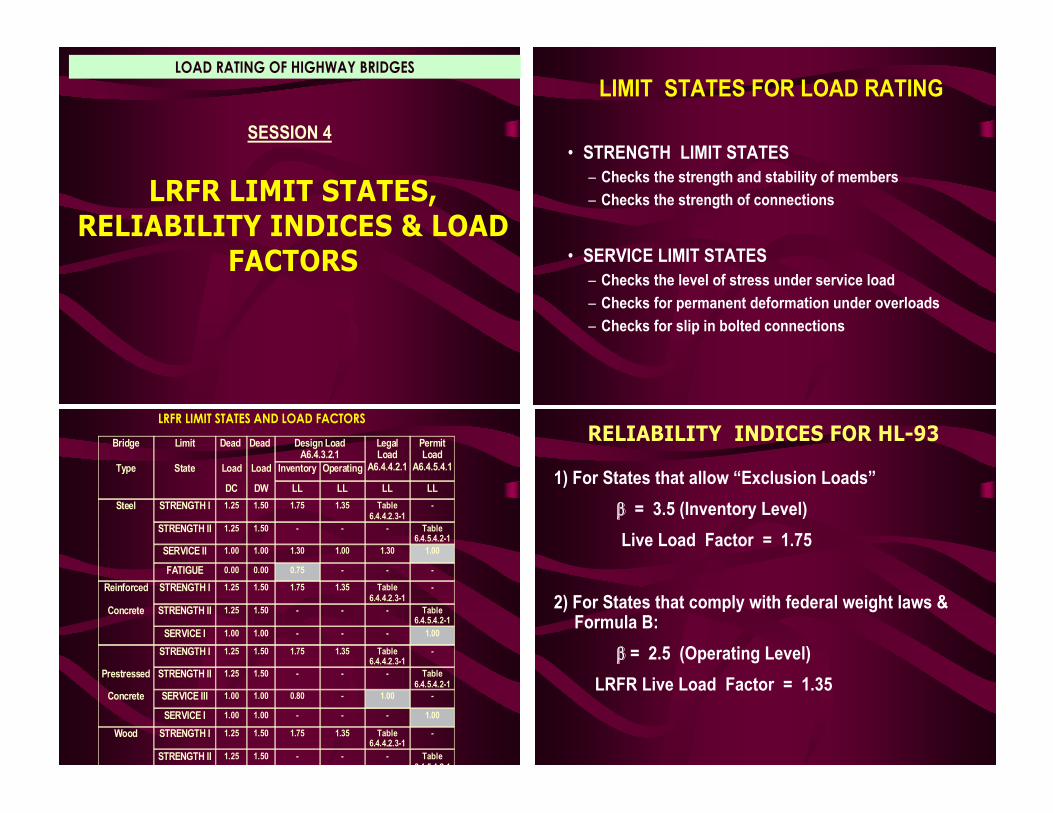
LIMIT STATES FOR LOAD RATING
• STRENGTH LIMIT STATES– Checks the strength and stability of members– Checks the strength of connections
• SERVICE LIMIT STATES– Checks the level of stress under service load – Checks for permanent deformation under overloads– Checks for slip in bolted connections
1) For States that allow “Exclusion Loads” β = 3.5 (Inventory Level) Live Load Factor = 1.75
2) For States that comply with federal weight laws & Formula B:
β = 2.5 (Operating Level)LRFR Live Load Factor = 1.35
RELIABILITY INDICES FOR HL-93Bridge Limit Dead Dead Design LoadA6.4.3.2.1
LegalLoad
A6.4.4.2.1
PermitLoad
A6.4.5.4.1Type State Load Load Inventory Operating
DC DW LL LL LL LLSteel STRENGTH I 1.25 1.50 1.75 1.35 Table
6.4.4.2.3-1-
STRENGTH II 1.25 1.50 - - - Table6.4.5.4.2-1
SERVICE II 1.00 1.00 1.30 1.00 1.30 1.00
FATIGUE 0.00 0.00 0.75 - - -
Reinforced STRENGTH I 1.25 1.50 1.75 1.35 Table6.4.4.2.3-1
-
Concrete STRENGTH II 1.25 1.50 - - - Table6.4.5.4.2-1
SERVICE I 1.00 1.00 - - - 1.00
STRENGTH I 1.25 1.50 1.75 1.35 Table6.4.4.2.3-1
-
Prestressed STRENGTH II 1.25 1.50 - - - Table6.4.5.4.2-1
Concrete SERVICE III 1.00 1.00 0.80 - 1.00 -
SERVICE I 1.00 1.00 - - - 1.00
Wood STRENGTH I 1.25 1.50 1.75 1.35 Table6.4.4.2.3-1
-
STRENGTH II 1.25 1.50 - - - Table6 4 5 4 2 1
LRFR LIMIT STATES AND LOAD FACTORS
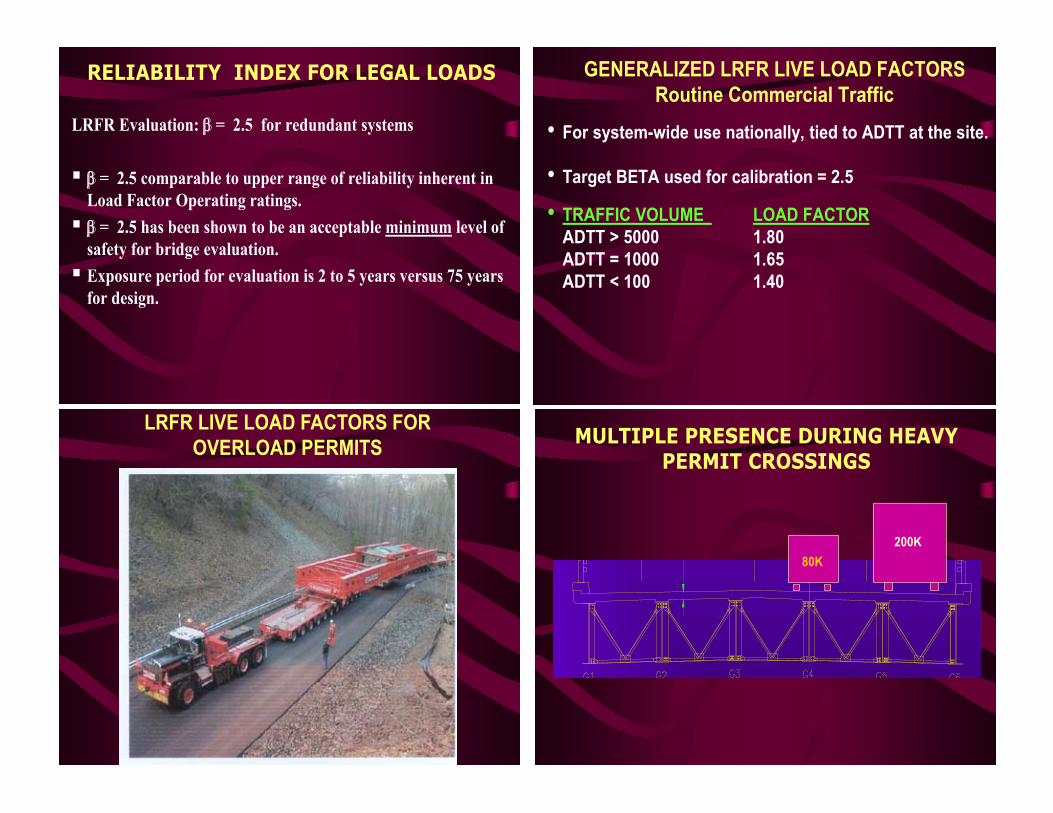
LRFR Evaluation: = 2.5 for redundant systems
= 2.5 comparable to upper range of reliability inherent in Load Factor Operating ratings. = 2.5 has been shown to be an acceptable minimum level of
safety for bridge evaluation. Exposure period for evaluation is 2 to 5 years versus 75 years
for design.
RELIABILITY INDEX FOR LEGAL LOADS GENERALIZED LRFR LIVE LOAD FACTORS Routine Commercial Traffic
• For system-wide use nationally, tied to ADTT at the site.
• Target BETA used for calibration = 2.5
• TRAFFIC VOLUME LOAD FACTORADTT > 5000 1.80ADTT = 1000 1.65ADTT < 100 1.40
200K80K
MULTIPLE PRESENCE DURING HEAVY PERMIT CROSSINGS
LRFR LIVE LOAD FACTORS FOR OVERLOAD PERMITS
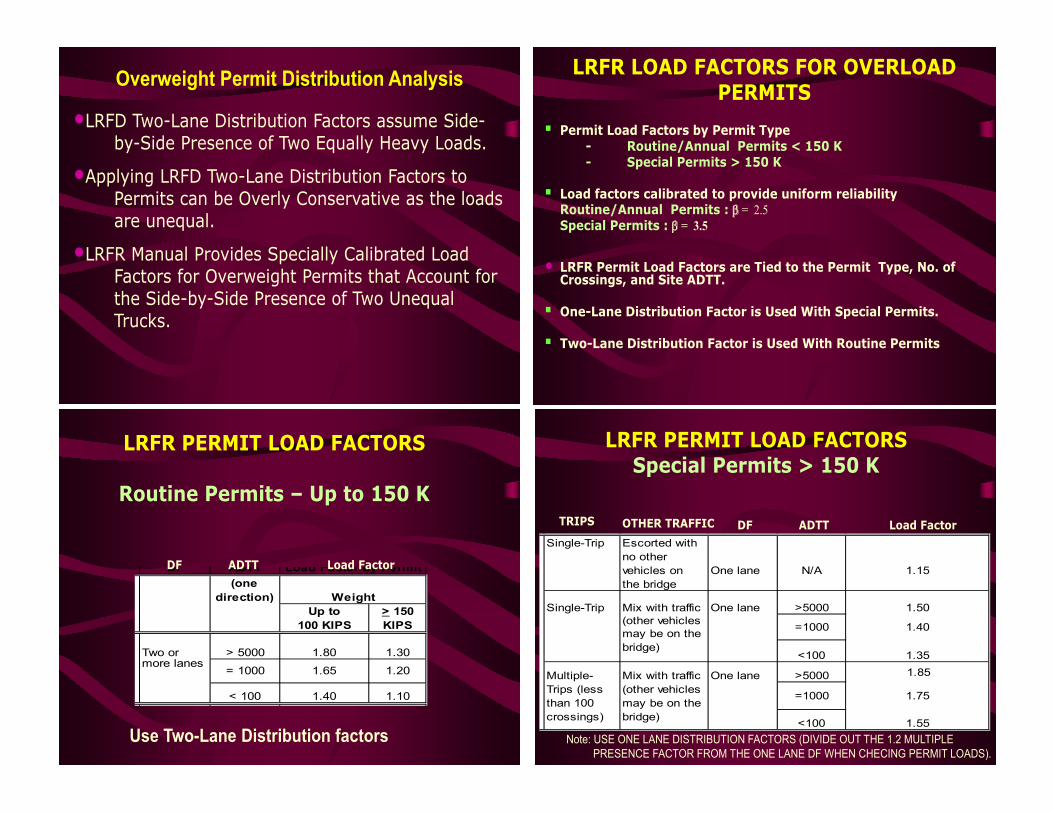
Overweight Permit Distribution Analysis
•LRFD Two-Lane Distribution Factors assume Side-by-Side Presence of Two Equally Heavy Loads.
•Applying LRFD Two-Lane Distribution Factors to Permits can be Overly Conservative as the loads are unequal.
•LRFR Manual Provides Specially Calibrated Load Factors for Overweight Permits that Account for the Side-by-Side Presence of Two Unequal Trucks.
LRFR LOAD FACTORS FOR OVERLOAD PERMITS
Permit Load Factors by Permit Type- Routine/Annual Permits < 150 K- Special Permits > 150 K
Load factors calibrated to provide uniform reliabilityRoutine/Annual Permits : β = 2.5 Special Permits : β = 3.5
• LRFR Permit Load Factors are Tied to the Permit Type, No. of Crossings, and Site ADTT.
One-Lane Distribution Factor is Used With Special Permits.
Two-Lane Distribution Factor is Used With Routine Permits
LRFR PERMIT LOAD FACTORSSpecial Permits > 150 K
Load FactorADTTDFTRIPS OTHER TRAFFIC
*
Single-Trip Escorted withno other vehicles on One lane N/Athe bridge
Single-Trip Mix with traffic One lane >5000(other vehiclesmay be on thebridge)
<100
Multiple- Mix with traffic One lane >5000 1.85Trips (less (other vehiclesthan 100 may be on thecrossings) bridge) <100 1.55
=1000
1.35
1.75
g
1.15
1.50
=1000 1.40
Note: USE ONE LANE DISTRIBUTION FACTORS (DIVIDE OUT THE 1.2 MULTIPLE PRESENCE FACTOR FROM THE ONE LANE DF WHEN CHECING PERMIT LOADS).
Df ADTT(one
direction)Up to > 150
100 KIPS KIPS
Two or > 5000 1.80 1.30more lanes
< 100 1.40 1.10
Load Factor by Permit
Weight
= 1000 1.65 1.20
LRFR PERMIT LOAD FACTORS
Routine Permits – Up to 150 K
Load FactorADTTDF
Use Two-Lane Distribution factors

7-AXLE SHV
LRFR LIVE LOAD FACTORS FOR SPECIALIZED HAULING VEHICLES
CALIBRATION OF LRFR LIVE LOAD FACTORS FOR SHVs
•SHVs Usually Constitute a Very Small Percentage of Total Truck Traffic.
•Multiple Presence Probabilities for SHVs are Similar to Permit Crossings.
•Two Fully Loaded SHVs Side-By-Side is not Likely.
• SHV in one lane and Type 3 truck in the other was used in the load factor calibration
•Reduced Live Load Factors for SHVs Compared to LRFR Factors for AASHTO Legal Loads.
LRFR SERVICE LIMIT STATES
LRFR LOAD FACTORS FOR SHVs
Traffic Volume(One Direction)
Load Factor for NRL, SU4, SU5, SU6, SU7
Unknown 1.60
ADTT ≥ 5000 1.60
ADTT = 1000 1.40
ADTT ≤ 100 1.15
Table 6A.4.4.2.3b-1
Live Load Factors for Specialized Hauling Vehicles
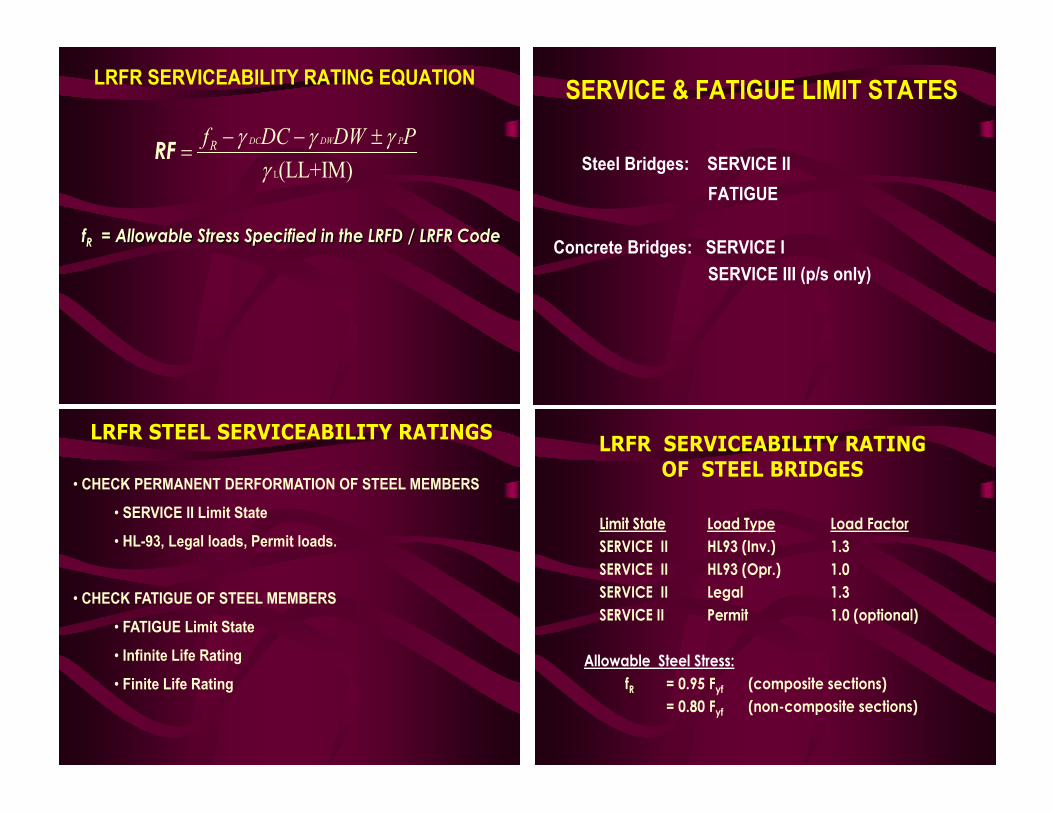
LRFR SERVICEABILITY RATING EQUATION
L(LL+IM)DC DW PRf DC DW Pγ γ γγ
− − ±=RF
fR = Allowable Stress Specified in the LRFD / LRFR Code
SERVICE & FATIGUE LIMIT STATES
Steel Bridges: SERVICE II FATIGUE
Concrete Bridges: SERVICE I SERVICE III (p/s only)
LRFR SERVICEABILITY RATING OF STEEL BRIDGES
Limit State Load Type Load FactorSERVICE II HL93 (Inv.) 1.3SERVICE II HL93 (Opr.) 1.0SERVICE II Legal 1.3SERVICE II Permit 1.0 (optional)
Allowable Steel Stress:fR = 0.95 Fyf (composite sections)
= 0.80 Fyf (non-composite sections)
LRFR STEEL SERVICEABILITY RATINGS
• CHECK PERMANENT DERFORMATION OF STEEL MEMBERS
• SERVICE II Limit State
• HL-93, Legal loads, Permit loads.
• CHECK FATIGUE OF STEEL MEMBERS
• FATIGUE Limit State
• Infinite Life Rating
• Finite Life Rating
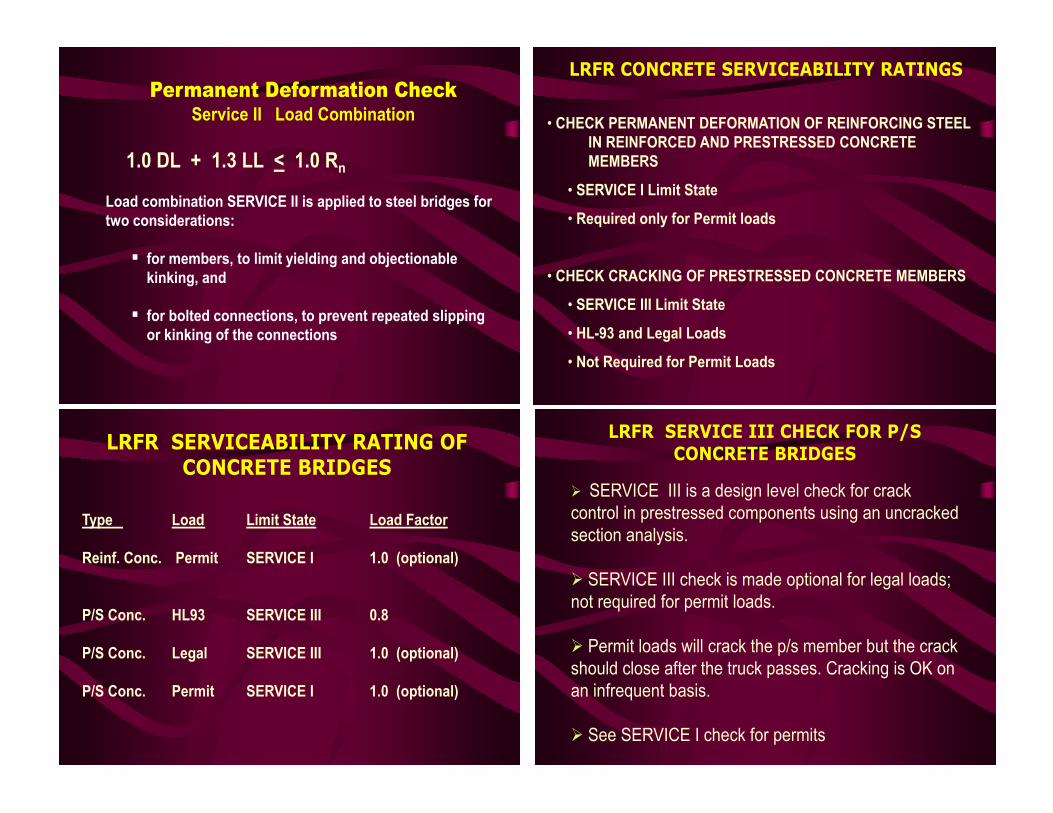
Permanent Deformation CheckService II Load Combination
1.0 DL + 1.3 LL < 1.0 Rn
Load combination SERVICE II is applied to steel bridges for two considerations:
for members, to limit yielding and objectionable kinking, and
for bolted connections, to prevent repeated slipping or kinking of the connections
LRFR CONCRETE SERVICEABILITY RATINGS
• CHECK PERMANENT DEFORMATION OF REINFORCING STEEL IN REINFORCED AND PRESTRESSED CONCRETE MEMBERS
• SERVICE I Limit State
• Required only for Permit loads
• CHECK CRACKING OF PRESTRESSED CONCRETE MEMBERS
• SERVICE III Limit State
• HL-93 and Legal Loads
• Not Required for Permit Loads
LRFR SERVICE III CHECK FOR P/S CONCRETE BRIDGES
SERVICE III is a design level check for crack control in prestressed components using an uncracked section analysis.
SERVICE III check is made optional for legal loads; not required for permit loads.
Permit loads will crack the p/s member but the crack should close after the truck passes. Cracking is OK on an infrequent basis.
See SERVICE I check for permits
LRFR SERVICEABILITY RATING OF CONCRETE BRIDGES
Type Load Limit State Load Factor
Reinf. Conc. Permit SERVICE I 1.0 (optional)
P/S Conc. HL93 SERVICE III 0.8
P/S Conc. Legal SERVICE III 1.0 (optional)
P/S Conc. Permit SERVICE I 1.0 (optional)
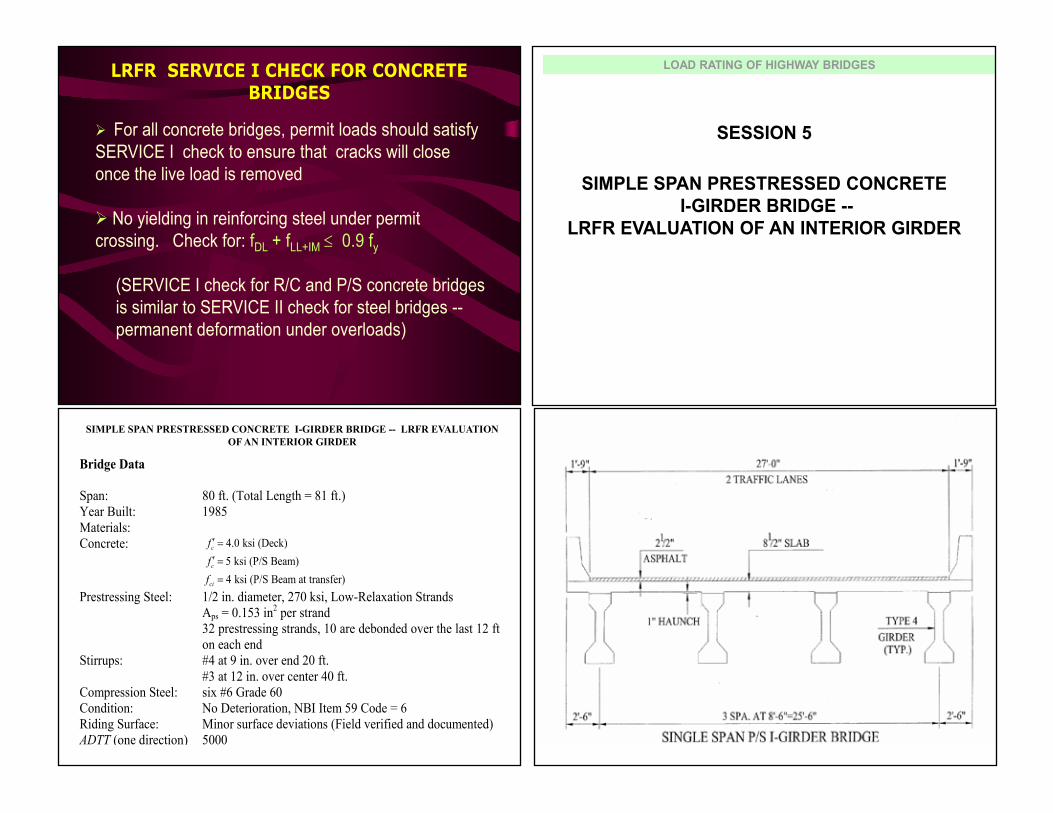
LRFR SERVICE I CHECK FOR CONCRETE BRIDGES
For all concrete bridges, permit loads should satisfy SERVICE I check to ensure that cracks will close once the live load is removed
No yielding in reinforcing steel under permit crossing. Check for: fDL + fLL+IM ≤ 0.9 fy
(SERVICE I check for R/C and P/S concrete bridges is similar to SERVICE II check for steel bridges --permanent deformation under overloads)
LOAD RATING OF HIGHWAY BRIDGES
SESSION 5
SIMPLE SPAN PRESTRESSED CONCRETE I-GIRDER BRIDGE --
LRFR EVALUATION OF AN INTERIOR GIRDER
SIMPLE SPAN PRESTRESSED CONCRETE I-GIRDER BRIDGE -- LRFR EVALUATION OF AN INTERIOR GIRDER
Bridge Data
Span: 80 ft. (Total Length = 81 ft.)Year Built: 1985Materials:Concrete: 4.0 ksi (Deck)
5 ksi (P/S Beam)4 ksi (P/S Beam at transfer)
c
c
ci
fff
′ =′ ==
Prestressing Steel: 1/2 in. diameter, 270 ksi, Low-Relaxation StrandsAps = 0.153 in2 per strand32 prestressing strands, 10 are debonded over the last 12 ft on each end
Stirrups: #4 at 9 in. over end 20 ft.#3 at 12 in. over center 40 ft.
Compression Steel: six #6 Grade 60Condition: No Deterioration, NBI Item 59 Code = 6Riding Surface: Minor surface deviations (Field verified and documented)ADTT (one direction) 5000
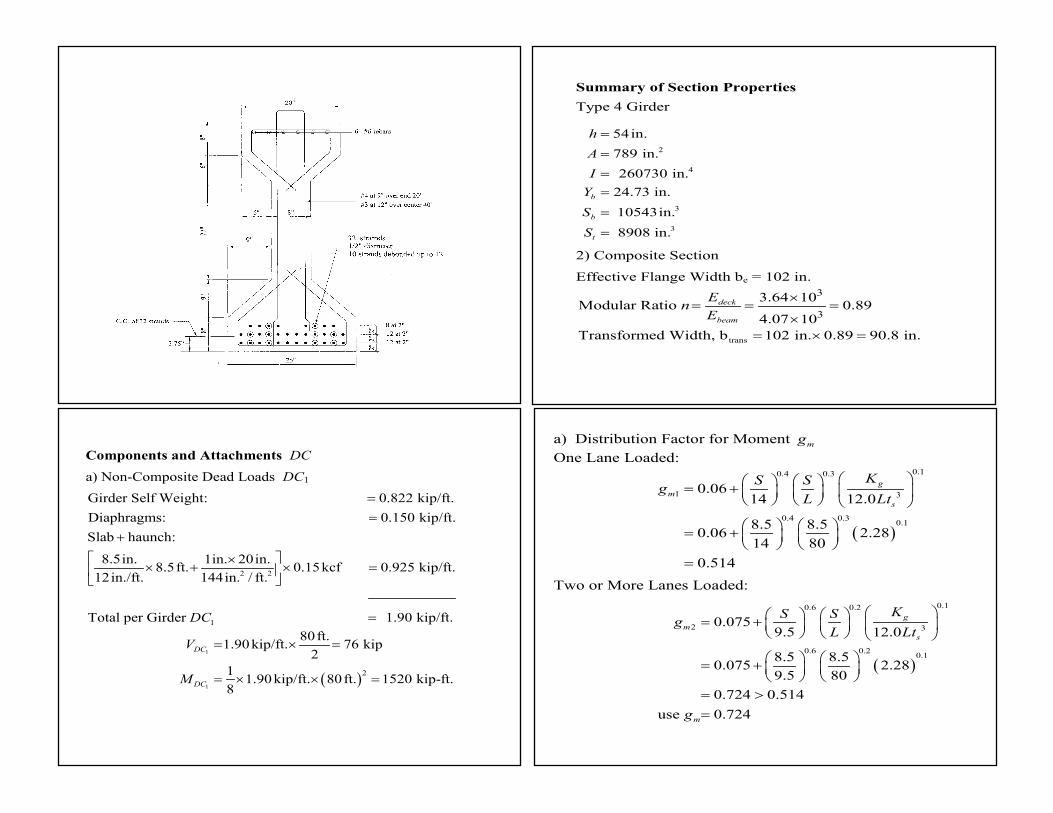
Summary of Section PropertiesType 4 Girder
2
4
3
3
54in.789 in. 260730 in.
24.73 in.
10543in.
8908 in.
b
b
t
hAI
YSS
=
=
==
=
=
2) Composite Section
Effective Flange Width be = 102 in.
trans
3
3
3.64 10Modular Ratio 0.894.07 10
Transformed Width, b 102 in. 0.89 90.8 in.
deck
beam
EnE
×= = =
×= × =
a) Distribution Factor for Moment mgOne Lane Loaded:
( )
0.10.4 0.3
1 3
0.4 0.3 0.1
0.0614 12.0
8.5 8.50.06 2.2814 80
0.514
gm
s
KS SgL Lt
= +
= +
=
Two or More Lanes Loaded:
( )
0.10.6 0.2
2 3
0.6 0.2 0.1
0.0759.5 12.0
8.5 8.50.075 2.289.5 80
0.724 0.514use 0.724
gm
s
m
KS SgL Lt
g
= +
= +
= >=
Components and Attachments DCa) Non-Composite Dead Loads DC1
2 2
Girder Self Weight: 0.822 kip/ft. Diaphragms: 0.150 kip/ft.Slab haunch:
8.5in. 1in. 20in.8.5ft. 0.15kcf 0.925 kip/ft.12in./ft. 144in. / ft.
==
+
×× + × =
1Total per Girder 1.90 kip/ft.DC =
( )
1
1
2
80ft.1.90kip/ft. 76 kip2
1 1.90kip/ft. 80ft. 1520 kip-ft.8
DC
DC
V
M
= × =
= × × =

b) Distribution Factor for Shear vg
One Lane Loaded:
1 0.3625vSg = +
8.500.3625
= +
0.70=
Two or More Lanes Loaded:2
2
2
0.212 35
8.5 8.50.212 35
0.849 0.70use 0.849
v
v
S Sg
g
= + −
= + −
= >=
Compute Maximum Live Load Effectsa) Maximum Design Live Load (HL-93)
= 33%IM512 1160 1.33LL IMM + = + ×2054.8 kip-ft..=
Distributed Live Load Moment at Midspan
2054.82054.8 0.7241487.7 kip - ft.
LL IM mM g+ = ×= ×=
Maximum Reinforcementφ factor of compression controlled sections shall be reduced in accordance with LRFD Article 5.5.4.2.1.
The net tensile strain, εt, is the tensile strain at nominal strength and determined by strain compatibility.
Given an allowable concrete strain of 0.003 and depth to neutral axis c = 4.39 in.dp = 59.75 in.
0.0034.39" 59.75" 4.39"
0.0378
c t
t
t
c d cε ε
ε
ε
=−
=−
=
For εt = 0.0378 > 0.005, the section is tension controlled and Resistance Factor φ shall be taken as 1.0.
Compute Nominal Flexural Resistance at Midspan
1ps pup
cf f kd
= −
0.28 for low-relaxation strands270 ksipu
kf
==
4.39270 1 0.28
59.75264.4 ksi
psf = − ×
=
Nominal Flexural Resistance (Midspan):
23.73 14.896 264.4 59.75
2 126244.4 kip-ft.
n ps ps paM A f d = −
= × −
=
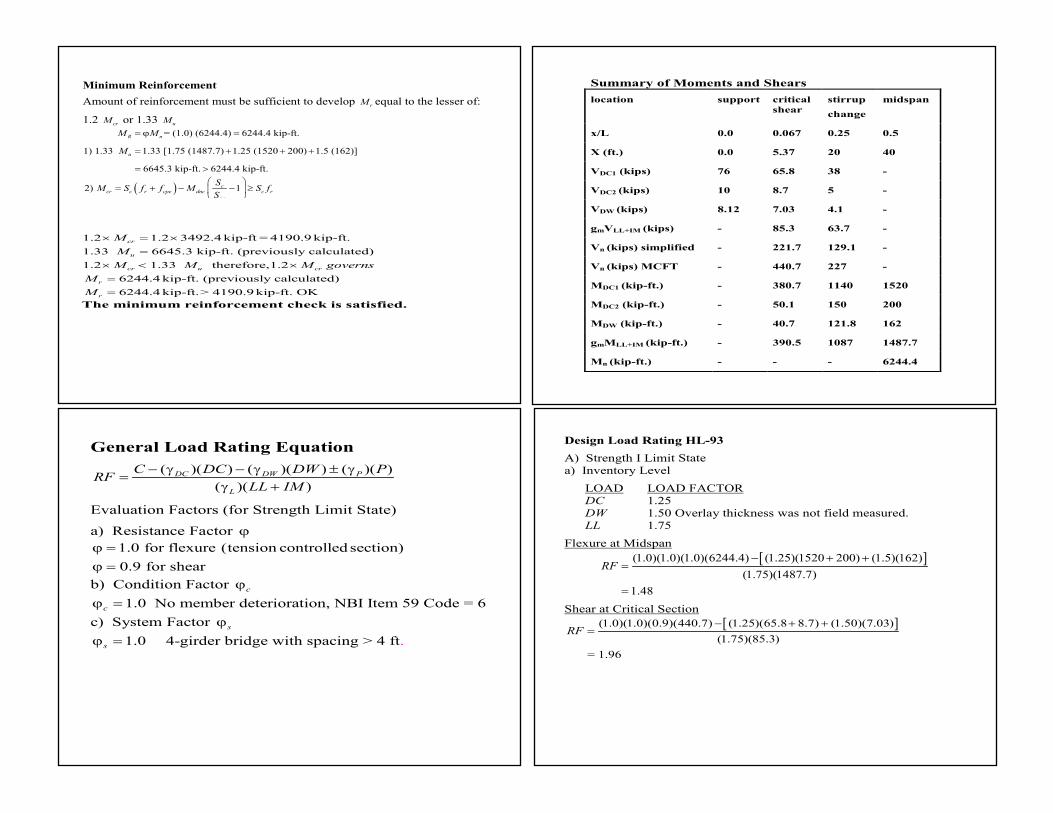
Minimum ReinforcementAmount of reinforcement must be sufficient to develop rM equal to the lesser of:
1.2 crM or 1.33 uM= (1.0) (6244.4) 6244.4 kip-ft.
1) 1.33 1.33 [1.75 (1487.7) 1.25 (1520 200) 1.5 (162)]
6645.3 kip-ft. 6244.4 kip-ft.
R n
u
M M
M
= ϕ =
= + + +
= >
( )2) 1ccr c r cpe dnc c r
nc
SM S f f M S fS
= + − − ≥
1.2 1.2 3492crM× = × .4kip-ft = 4190.9kip-ft.1.33 6645.3 kip-ft. (previously calculated)1.2 1.33 therefore,1.2
6244.4kip-ft. (previously calculated)6244.4kip-ft.> 4190.9kip-ft. OK
u
cr u cr
r
r
MM M M governs
MM
=× < ×==
The minimum reinforcement check is satisfied.
Summary of Moments and Shearslocation support critical
shearstirrupchange
midspan
x/L 0.0 0.067 0.25 0.5
X (ft.) 0.0 5.37 20 40
VDC1 (kips) 76 65.8 38 -
VDC2 (kips) 10 8.7 5 -
VDW (kips) 8.12 7.03 4.1 -
gmVLL+IM (kips) - 85.3 63.7 -
Vn (kips) simplified - 221.7 129.1 -
Vn (kips) MCFT - 440.7 227 -
MDC1 (kip-ft.) - 380.7 1140 1520
MDC2 (kip-ft.) - 50.1 150 200
MDW (kip-ft.) - 40.7 121.8 162
gmMLL+IM (kip-ft.) - 390.5 1087 1487.7
Mn (kip-ft.) - - - 6244.4
Design Load Rating HL-93A) Strength I Limit Statea) Inventory Level
LOAD LOAD FACTORDC 1.25DW 1.50 Overlay thickness was not field measured.LL 1.75
Flexure at Midspan[ ](1.0)(1.0)(1.0)(6244.4) (1.25)(1520 200) (1.5)(162)
(1.75)(1487.7)1.48
RF− + +
=
=
Shear at Critical Section[ ](1.0)(1.0)(0.9)(440.7) (1.25)(65.8 8.7) (1.50)(7.03)
(1.75)(85.3)= 1.96
RF− + +
=
General Load Rating Equation( )( ) ( )( ) ( )( )
( )( )− γ − γ ± γ
=γ +
DC DW P
L
C DC DW PRFLL IM
Evaluation Factors (for Strength Limit State)
a) Resistance Factor ϕ1.0 for flexure (tension controlled section)0.9 for shear
ϕ =ϕ =b) Condition Factor cϕ
1.0 No member deterioration, NBI Item 59 Code = 6cϕ =c) System Factor sϕ
1.0 4-girder bridge with spacing > 4 .ftsϕ =
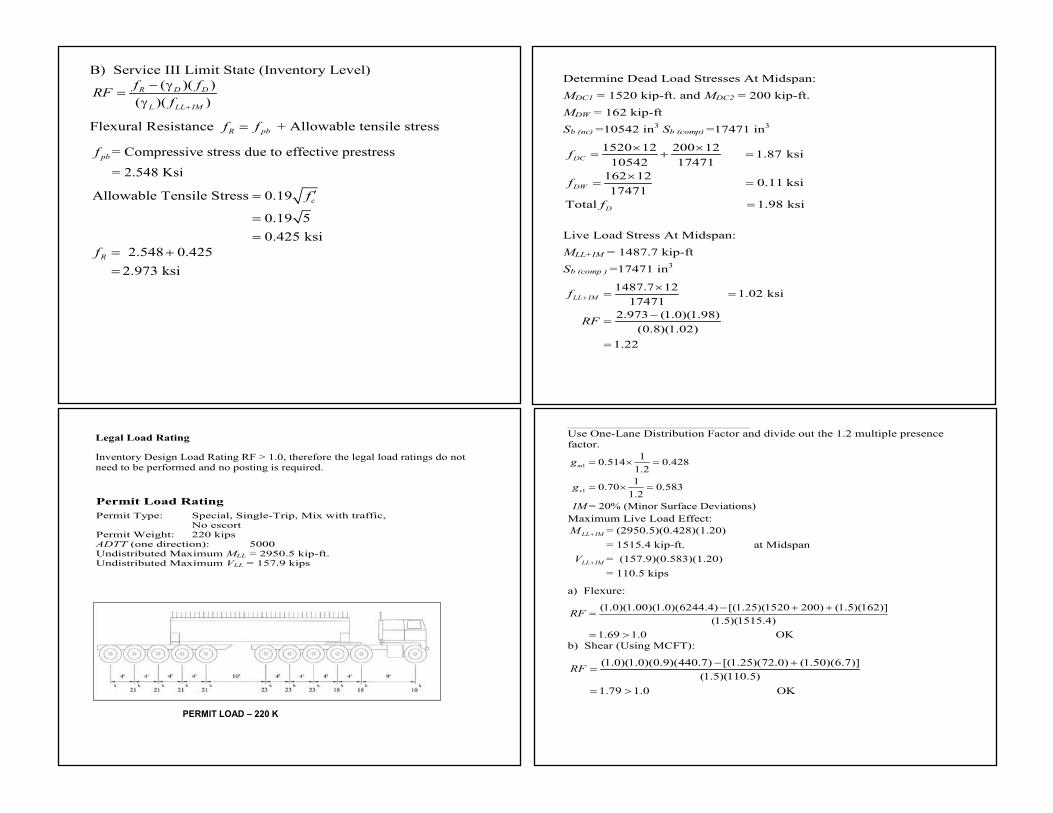
B) Service III Limit State (Inventory Level)( )( )
( )( )R D D
L LL IM
f fRFf +
− γ=
γ
Flexural Resistance R pbf f= + Allowable tensile stress
= Compressive stress due to effective prestress
= 2.548 Ksi pbf
Allowable Tensile Stress 0.19
0.19 50.425 ksi
′=
==
cf
2.548 0.4252.973 ksi
Rf = +=
Determine Dead Load Stresses At Midspan:
MDC1 = 1520 kip-ft. and MDC2 = 200 kip-ft.
MDW = 162 kip-ft
Sb (nc) =10542 in3 Sb (comp) =17471 in3
1520 12 200 12 1.87 ksi10542 17471
162 12 0.11 ksi17471
Total 1.98 ksi
× ×= + =
×= =
=
DC
DW
D
f
f
f
Live Load Stress At Midspan:
MLL+IM = 1487.7 kip-ft
Sb (comp ) =17471 in3
1487.7 12 1.02 ksi 17471
2.973 (1.0)(1.98)(0.8)(1.02)
1.22
LL IMf
RF
+
×= =
−=
=
Use One-Lane Distribution Factor and divide out the 1.2 multiple presence factor.
1
1
10.514 0.4281.210.70 0.583
1.2 = 20% (Minor Surface Deviations)
m
v
g
g
IM
= × =
= × =
Maximum Live Load Effect:= (2950.5)(0.428)(1.20)= 1515.4 kip-ft. at Midspan= (157.9)(0.583)(1.20)= 110.5 kips
+
+
LL IM
LL IM
M
V
a) Flexure:
(1.0)(1.00)(1.0)(6244.4) [(1.25)(1520 200) (1.5)(162)](1.5)(1515.4)
1.69 1.0 OK
RF − + +=
= >b) Shear (Using MCFT):
(1.0)(1.0)(0.9)(440.7) [(1.25)(72.0) (1.50)(6.7)](1.5)(110.5)
1.79 1.0 OK
RF − +=
= >
Legal Load Rating
Inventory Design Load Rating RF > 1.0, therefore the legal load ratings do not need to be performed and no posting is required.
Permit Load RatingPermit Type: Special, Single-Trip, Mix with traffic,
No escortPermit Weight: 220 kipsADTT (one direction): 5000Undistributed Maximum MLL = 2950.5 kip-ft.Undistributed Maximum VLL = 157.9 kips
PERMIT LOAD – 220 K
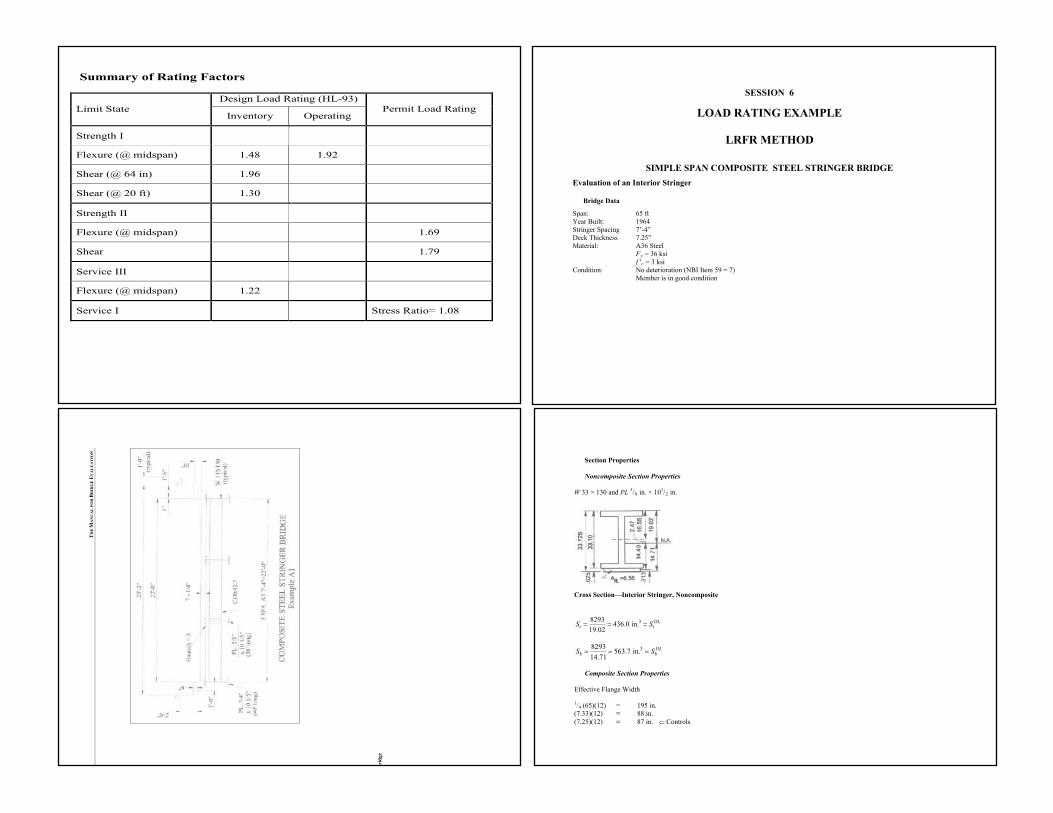
Summary of Rating Factors
Design Load Rating (HL-93)Limit State
Inventory OperatingPermit Load Rating
Strength I
Flexure (@ midspan) 1.48 1.92
Shear (@ 64 in) 1.96
Shear (@ 20 ft) 1.30
Strength II
Flexure (@ midspan) 1.69
Shear 1.79
Service III
Flexure (@ midspan) 1.22
Service I Stress Ratio= 1.08
SESSION 6
LOAD RATING EXAMPLE
LRFR METHOD
SIMPLE SPAN COMPOSITE STEEL STRINGER BRIDGEEvaluation of an Interior Stringer
Bridge Data
Span: 65 ftYear Built: 1964Stringer Spacing 7’-4”Deck Thickness 7.25”Material: A36 Steel
Fy = 36 ksif ′c = 3 ksi
Condition: No deterioration (NBI Item 59 = 7) Member is in good condition
Section Properties
Noncomposite Section Properties
W 33 × 130 and PL 5/8 in. × 101/2 in.
Cross Section—Interior Stringer, Noncomposite
38293 436.0 in.19.02
DLt tS S= = =
38293 563.7 in.14.71
DLb bS S= = =
Composite Section Properties
Effective Flange Width
1/4 (65)(12) = 195 in.(7.33)(12) = 88 in.(7.25)(12) = 87 in. ⇐ Controls
TH
E M
AN
UA
L F
OR
BR
IDG
E E
VA
LU
AT
ION
Bri
dge
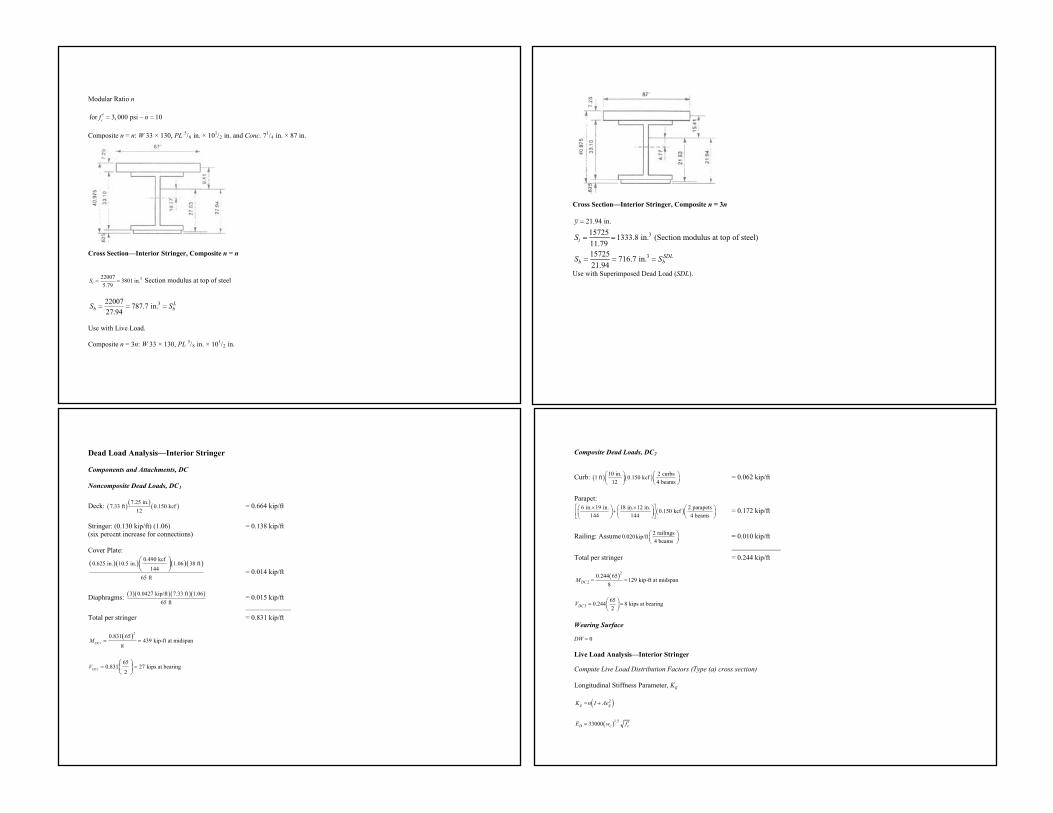
Modular Ratio n
for 3, 000 psi 10cf n′ = − =
Composite n = n: W 33 × 130, PL 5/8 in. × 101/2 in. and Conc. 71/4 in. × 87 in.
Cross Section—Interior Stringer, Composite n = n
322007 3801 in.5.79tS = = Section modulus at top of steel
322007 787.7 in.27.94
Lb bS S= = =
Use with Live Load.
Composite n = 3n: W 33 × 130, PL 5/8 in. × 101/2 in.
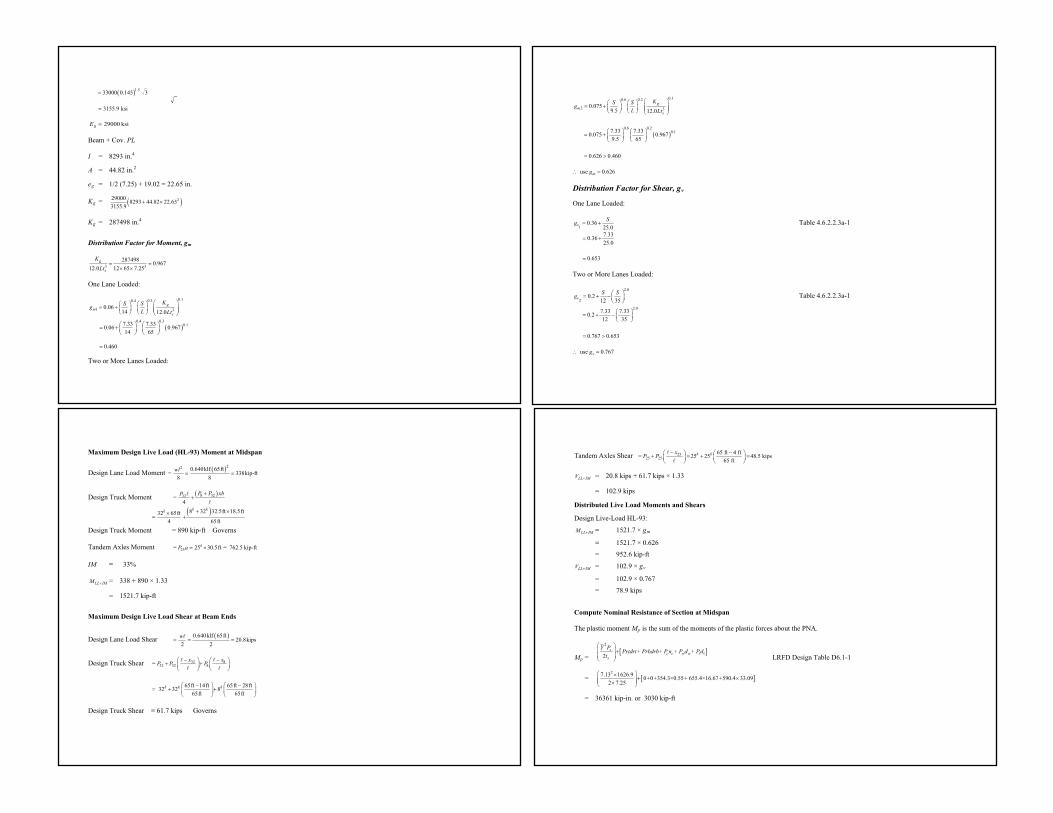
Cross Section—Interior Stringer, Composite n = 3n
21.94 in.y =
3
3
15725 1333.8 in. (Section modulus at top of steel)11.7915725 716.7 in.21.94
t
SDLb b
S
S S
= =
= = =
Use with Superimposed Dead Load (SDL).
Composite Dead Loads, DC2
Curb: ( ) ( )10 in. 2 curbs1 ft 0.150 kcf12 4 beams
= 0.062 kip/ft
Parapet:
( )6 in. 19 in. 18 in. 12 in. 2 parapets0.150 kcf144 144 4 beams
× × + = 0.172 kip/ft
Railing: Assume 2 railings0.020kip/ft4 beams
= 0.010 kip/ft
———————Total per stringer = 0.244 kip/ft
( )22
0.244 65129 kip-ft at midspan
8DCM = =
2650.244 8 kips at bearing2DCV = =
Wearing Surface
DW = 0
Live Load Analysis—Interior Stringer
Compute Live Load Distribution Factors (Type (a) cross section)
Longitudinal Stiffness Parameter, Kg
( )2g gK n I Ae= +
( )1.533000D c cE w f ′=
Dead Load Analysis—Interior Stringer
Components and Attachments, DC
Noncomposite Dead Loads, DC1
Deck: ( ) ( ) ( )7.25 in.7.33 ft 0.150 kcf
12= 0.664 kip/ft
Stringer: (0.130 kip/ft) (1.06) = 0.138 kip/ft(six percent increase for connections)
Cover Plate:
( )( ) ( )( )0.490 kcf0.625 in. 10.5 in. 1.06 38 ft
14465 ft
= 0.014 kip/ft
Diaphragms: ( )( )( )( )3 0.0427 kip/ft 7.33 ft 1.0665 ft
= 0.015 kip/ft
——————–Total per stringer = 0.831 kip/ft
( )1
20.831 65439 kip-ft at midspan
8DCM = =
1
650.831 27 kips at bearing
2DCV = =
( )1.5 33000 0.145 3=
3155.9 ksi=
29000 ksiBE =
Beam + Cov. PL
I = 8293 in.4
A = 44.82 in.2
eg = 1/2 (7.25) + 19.02 = 22.65 in.
Kg = ( )229000 8293 44.82 22.653155.9
+ ×
Kg = 287498 in.4
Distribution Factor for Moment, gm
3 3287498 0.967
12.0 12 65 7.25g
s
KLt
= =× ×
One Lane Loaded:
0.10.4 0.3
1 30.0614 12.0
gm
s
KS SgL Lt
= +
( )0.4 0.3
0.17.33 7.33 0.06 0.96714 65
= +
0.460=
Two or More Lanes Loaded:
0.10.6 0.2
2 30.0759.5 12.0
gm
s
KS SgL Lt
= +
( )0.6 0.2
0.17.33 7.33 0.075 0.9679.5 65
= +
0.626 0.460= >
use 0.626mg∴ =
Distribution Factor for Shear, gv
One Lane Loaded:
10.36
25.0vSg = + Table 4.6.2.2.3a-1
7.33 0.3625.0
= +
0.653=
Two or More Lanes Loaded:
2.0
20.2
12 35vS Sg = + −
Table 4.6.2.2.3a-1
2.07.33 7.33 0.212 35
= + −
0.767 0.653= >
use 0.767vg∴ =
Tandem Axles Shear 2525 25
65 ft 4 ft= 25 25 48.5 kips65 ft
k kxP P − − + = + =
LL IMV + = 20.8 kips + 61.7 kips × 1.33
= 102.9 kips
Distributed Live Load Moments and Shears
Design Live-Load HL-93:
LL IMM + = 1521.7 × gm
= 1521.7 × 0.626
= 952.6 kip-ft
LL IMV + = 102.9 × gv
= 102.9 × 0.767
= 78.9 kips
Compute Nominal Resistance of Section at Midspan
The plastic moment Mp is the sum of the moments of the plastic forces about the PNA.
Mp =[ ]
2
t2s
c c w w ts
Y P Prtdrt+ Prbdrb+ P n + P d + Pdt
+ LRFD Design Table D6.1-1
= [ ]27.13 1626.9 0+0+354.3×0.55+ 655.4×16.67+590.4 33.09
2 7.25 ×
+ × ×
= 36361 kip-in. or 3030 kip-ft
Maximum Design Live Load (HL-93) Moment at Midspan
Design Lane Load Moment ( )22 0.640klf 65ft= 338kip-ft
8 8wl
= =
Design Truck Moment ( )8 3232= 4
P P xbP ++
( )8 32 32.5ft 18.5ft32 65ft4 65ft
k kk + ××= +
Design Truck Moment = 890 kip-ft Governs
Tandem Axles Moment 25= 25 30.5ft = 762.5 kip-ftkP a = ×
IM = 33%
LL IMM + = 338 + 890 × 1.33
= 1521.7 kip-ft
Maximum Design Live Load Shear at Beam Ends
Design Lane Load Shear ( )0.640klf 65ft= 20.8kips
2 2w
= =
Design Truck Shear 32 832 32 8= x xP P P− − + +
65ft 14ft 65ft 28ft 32 32 865ft 65ft
k k k − −= + +
Design Truck Shear = 61.7 kips Governs
Nominal Flexural Resistance, Mn
pD ≤ 0.1 tD LRFD Design Eq. 6.10.7.1.2-1
Therefore, 1.07 0.7 pn p
t
DM M
D
= −
Shear Resistance
where 0.58p yw wV F Dt= LRFD Design Eq. 6.10.9.2-2
= 1.0 x 0.58 × 36 × 29.75 × 0.580
= 360.3 kips
Summary for Interior Stringer
Dead Load DC1
Dead Load DC2
LiveLoad Distribution
FactorDist. Live Load
+ Impact Nominal CapacityMoment, kip-ft 439.0 129.0 gm = 0.626 952.6 2873.0Shear, kips 27.0 8.0 gv = 0.767 78.9 360.3
LRFR Load-Rating Equation
( )( ) ( )( ) ( )( )( )( )
DC DW P
L
C DC DW PRF
LL IM− γ − γ ± γ
=γ +
Evaluation Factors (for Strength Limit States)
1. Resistance Factor, φφ = 1.0 for flexure and shear
2. Condition Factor, φcφc = 1.0 Member is in good condition. NBI Item 59 = 7.
3. System Factor, φsφs = 1.0 4-girder bridge, spacing > 4 ft (for flexure and shear).
Design Load Rating
Strength I Limit State
( )( )( )Capacity c s nC R= ϕ ϕ ϕ
( )( )( ) ( )( ) ( )( )( )( )
c s n DC DW
L
R DC DWRF
LL IMϕ ϕ ϕ − γ − γ
=γ +
Inventory Level
Load Load Factor γ
DC 1.25LL 1.75
Flexure: RF =( )( )( )( ) ( )( ) ( )( )
( )( )1.0 1.0 1.0 2873 1.25 439 1.25 129
1.75 952.6− −
= 1.2975
Shear: RF =( )( )( )( ) ( )( )
( )( )1.0 1.0 1.0 360.3 1.25 27 8
1.75 78.9− +
= 2.29
Operating Level
Load Load Factor γ
DC 1.25LL 1.35
Flexure: RF = 1.751.291.35
×
= 1.67
Shear: RF = 1.752.29
1.35×
= 2.97
Service II Limit State
( )( )( )( )R DC DC
LL LL IM
f fRF
f +
− γ=
γ
Inventory Level
Allowable Flange Stress for tension flange fR = 0.95RhFyf (fℓ = 0)
Checking the tension flange as compression flanges typically do not govern for composite sections.
Rh = 1.0 for non-hybrid sections
fR = 0.95 × 1.0 × 36
= 34.2 ksi
fD = 1 2DC DCf f+
= 439 12 129 12563.7 725
× ×+
= 9.35 + 2.14 = 11.49 ksi
fLL + IM = 952.6 1214.42 ksi
793
×=
γLL = 1.30 γDC = 1.0 Table 6A.4.2.2-1
RF = ( )( )( )( )
34.2 1.0 11.491.3 14.42−
= 1.21