Embed Size (px)
Citation preview
© Wärtsilä PUBLIC
WÄRTSILÄ CORPORATIONINTERIM REPORT JANUARY-SEPTEMBER 2019
25 October 2019
Jaakko Eskola, President & CEO
25 October 2019 INTERIM REPORT JANUARY-SEPTEMBER 20191
© Wärtsilä PUBLIC
Third quarter burdened by project
related challenges and low equipment
demand – services activity remains sound
© Wärtsilä PUBLIC
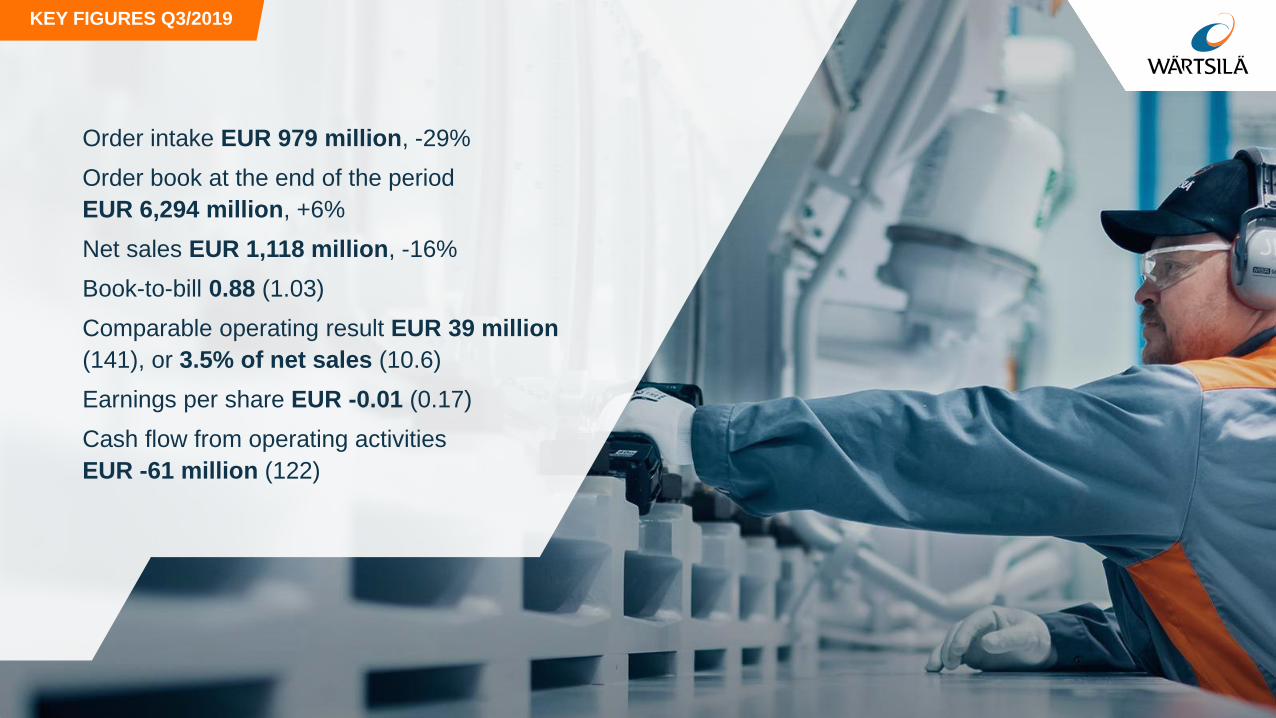
KEY FIGURES Q3/2019
Order intake EUR 979 million, -29%
Order book at the end of the period
EUR 6,294 million, +6%
Net sales EUR 1,118 million, -16%
Book-to-bill 0.88 (1.03)
Comparable operating result EUR 39 million
(141), or 3.5% of net sales (10.6)
Earnings per share EUR -0.01 (0.17)
Cash flow from operating activities
EUR -61 million (122)
© Wärtsilä PUBLIC
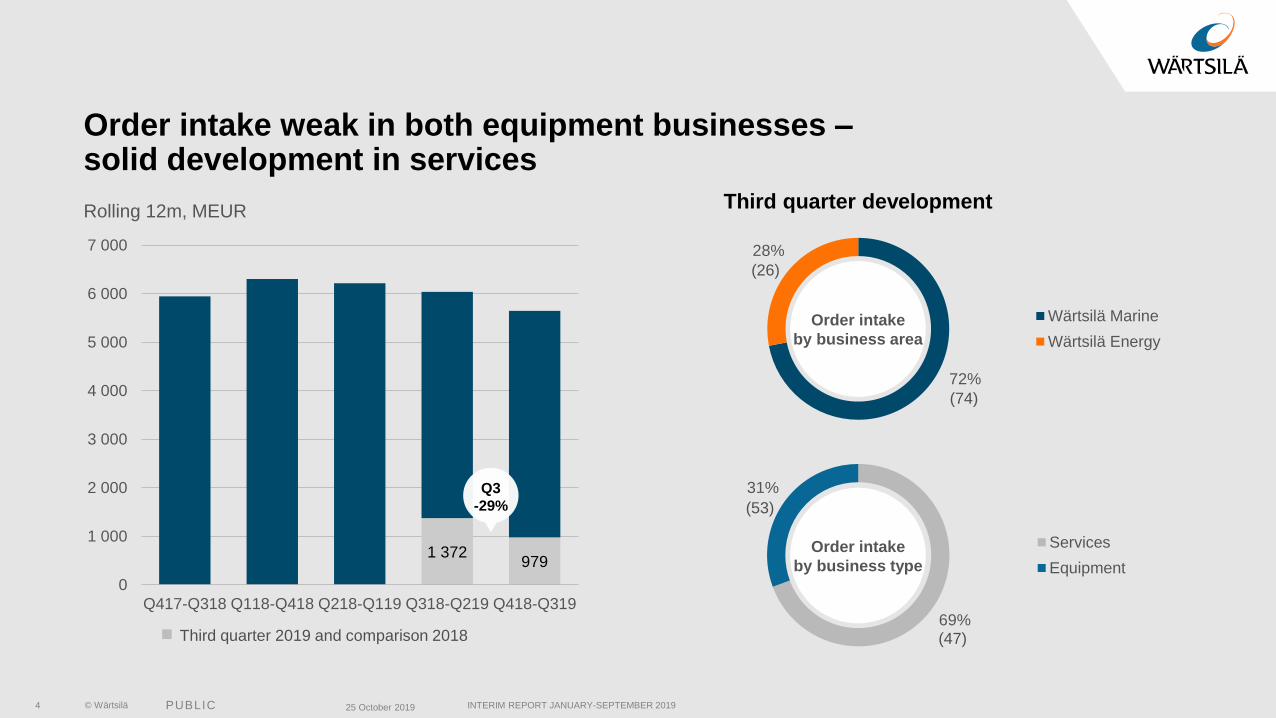
72%
28%
Wärtsilä Marine
Wärtsilä Energy
INTERIM REPORT JANUARY-SEPTEMBER 20194
Order intake weak in both equipment businesses –solid development in services
Rolling 12m, MEUR
1 372979
0
1 000
2 000
3 000
4 000
5 000
6 000
7 000
Q417-Q318 Q118-Q418 Q218-Q119 Q318-Q219 Q418-Q319
Q3
-29%
Third quarter 2019 and comparison 2018
25 October 2019
69%
31%
Services
Equipment
Order intake
by business type
Order intake
by business area
Third quarter development
(26)
(74)
(53)
(47)
© Wärtsilä PUBLIC INTERIM REPORT JANUARY-SEPTEMBER 20195
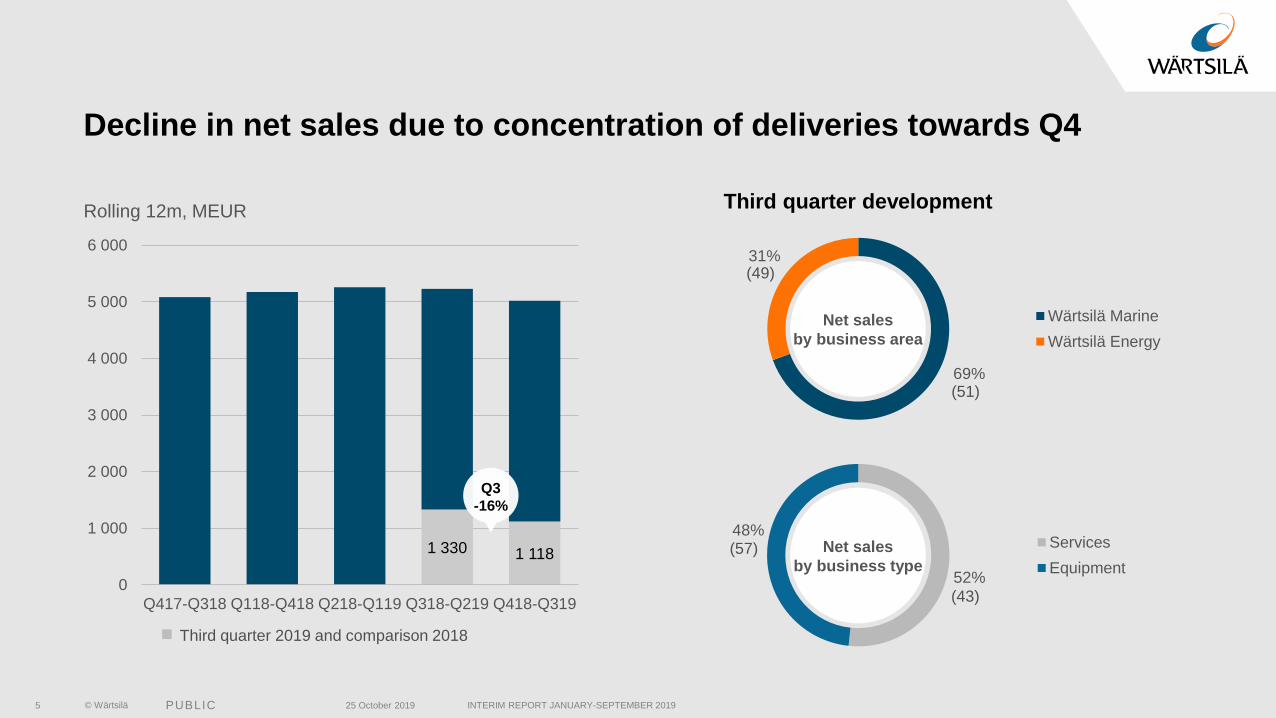
Decline in net sales due to concentration of deliveries towards Q4
1 330 1 118
0
1 000
2 000
3 000
4 000
5 000
6 000
Q417-Q318 Q118-Q418 Q218-Q119 Q318-Q219 Q418-Q319
Rolling 12m, MEUR
Third quarter 2019 and comparison 2018
25 October 2019
Q3
-16%
69%
31%
Wärtsilä Marine
Wärtsilä Energy
52%
48%Services
Equipment
Net sales
by business type
Net sales
by business area
Third quarter development
(49)
(51)
(57)
(43)
© Wärtsilä PUBLIC INTERIM REPORT JANUARY-SEPTEMBER 20196
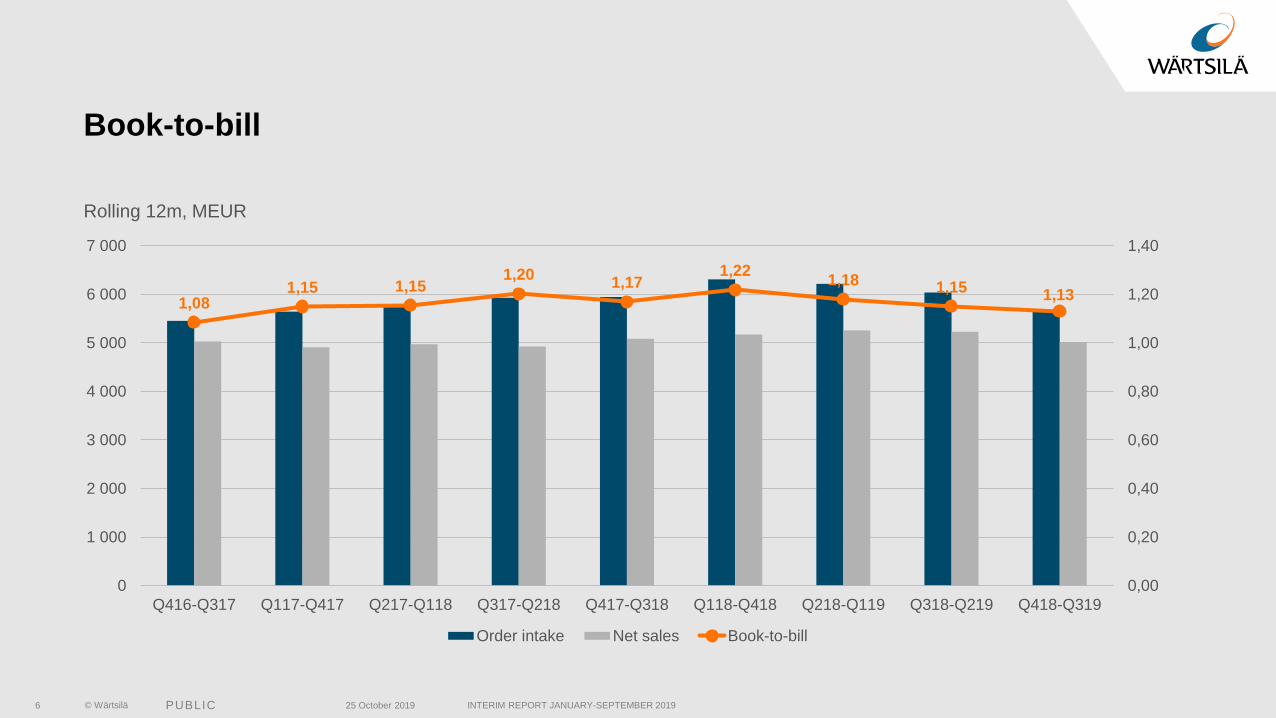
Book-to-bill
1,081,15 1,15
1,201,17
1,221,18 1,15
1,13
0,00
0,20
0,40
0,60
0,80
1,00
1,20
1,40
0
1 000
2 000
3 000
4 000
5 000
6 000
7 000
Q416-Q317 Q117-Q417 Q217-Q118 Q317-Q218 Q417-Q318 Q118-Q418 Q218-Q119 Q318-Q219 Q418-Q319
Order intake Net sales Book-to-bill
Rolling 12m, MEUR
25 October 2019
© Wärtsilä PUBLIC INTERIM REPORT JANUARY-SEPTEMBER 20197
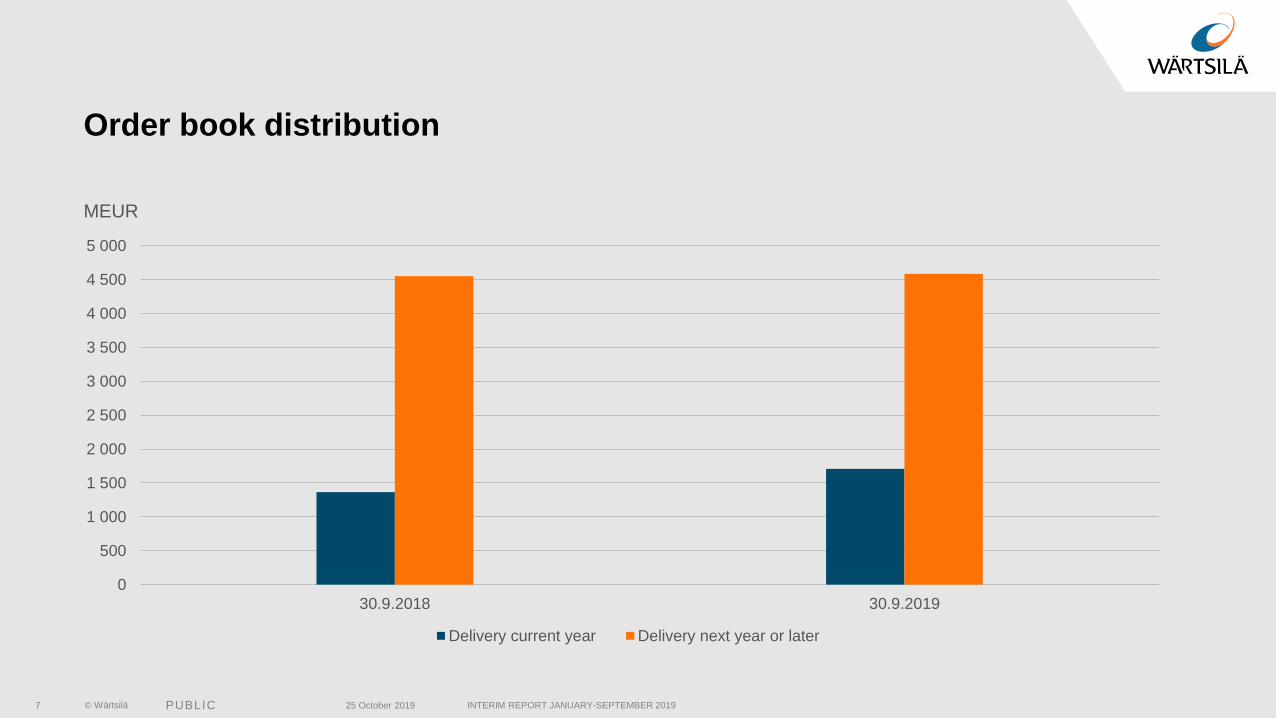
Order book distribution
0
500
1 000
1 500
2 000
2 500
3 000
3 500
4 000
4 500
5 000
30.9.2018 30.9.2019
Delivery current year Delivery next year or later
MEUR
25 October 2019
© Wärtsilä PUBLIC INTERIM REPORT JANUARY-SEPTEMBER 20198
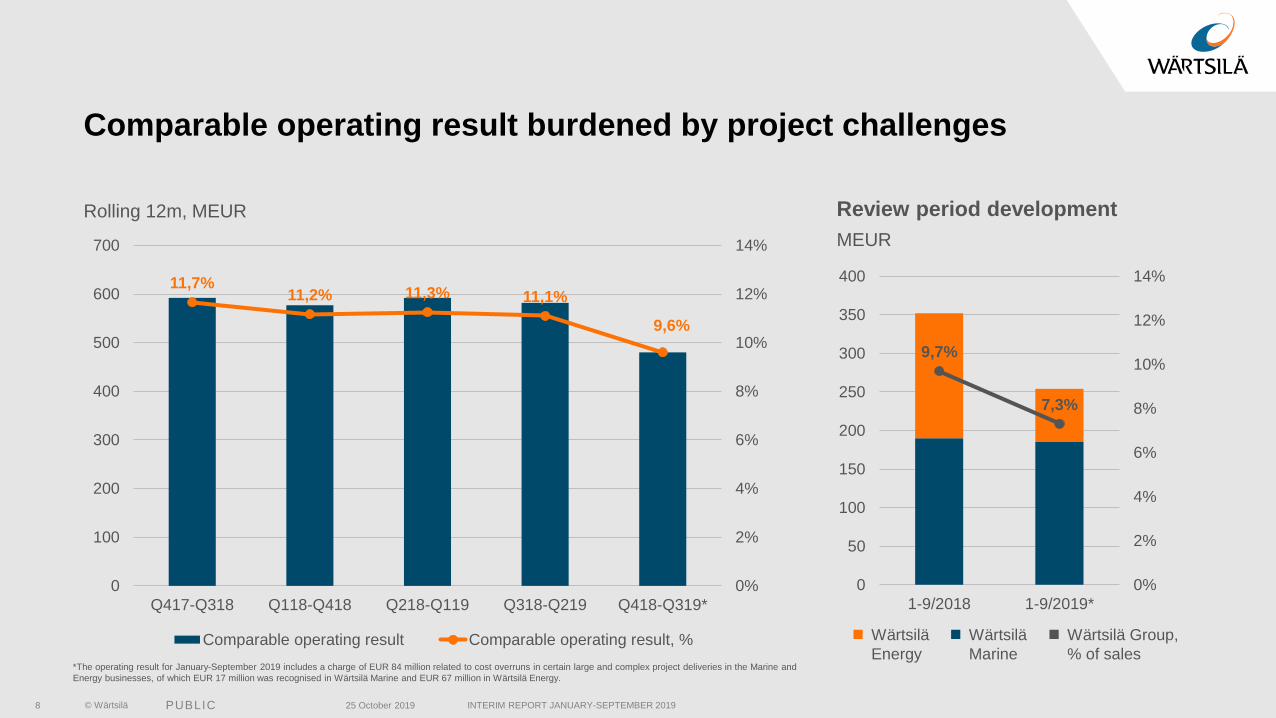
Comparable operating result burdened by project challenges
11,7%11,2% 11,3% 11,1%
9,6%
0%
2%
4%
6%
8%
10%
12%
14%
0
100
200
300
400
500
600
700
Q417-Q318 Q118-Q418 Q218-Q119 Q318-Q219 Q418-Q319*
Comparable operating result Comparable operating result, %
9,7%
7,3%
0%
2%
4%
6%
8%
10%
12%
14%
0
50
100
150
200
250
300
350
400
1-9/2018 1-9/2019*
Rolling 12m, MEUR Review period development
MEUR
◼ Wärtsilä
Energy
◼ Wärtsilä
Marine
◼ Wärtsilä Group,
% of sales
25 October 2019
*The operating result for January-September 2019 includes a charge of EUR 84 million related to cost overruns in certain large and complex project deliveries in the Marine and
Energy businesses, of which EUR 17 million was recognised in Wärtsilä Marine and EUR 67 million in Wärtsilä Energy.
© Wärtsilä PUBLIC 25 October 2019 INTERIM REPORT JANUARY-SEPTEMBER 20199
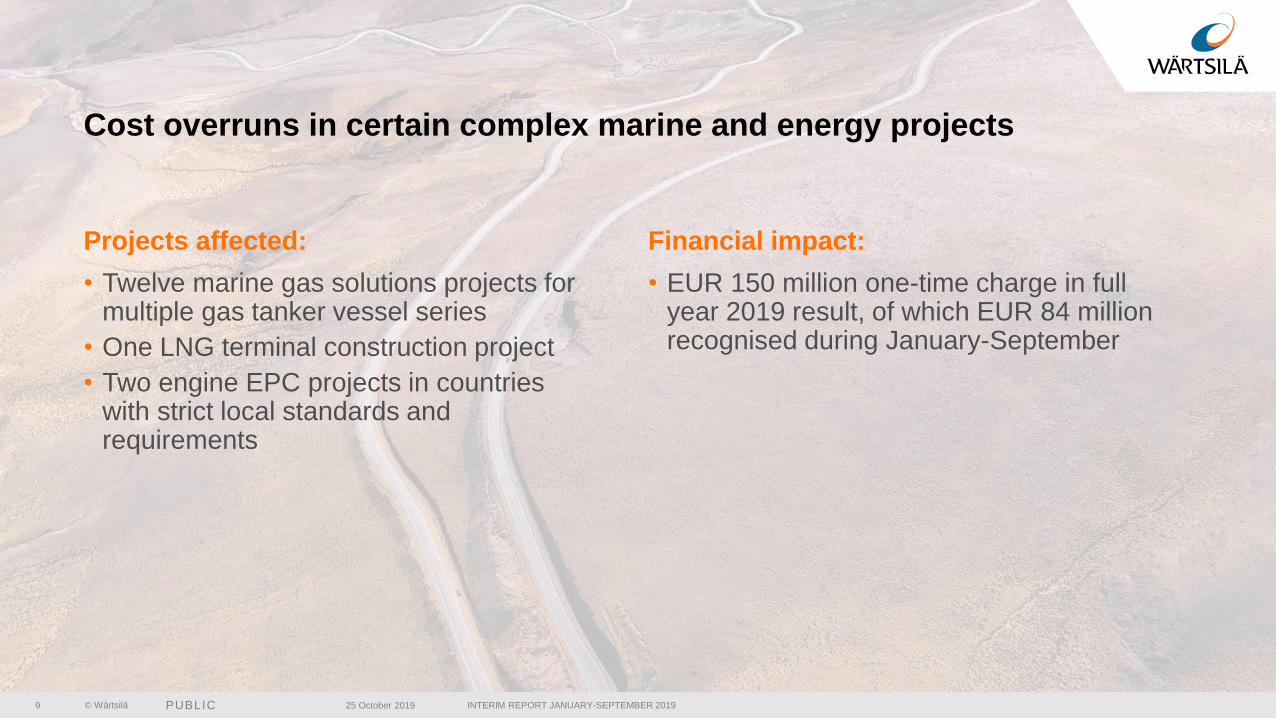
Cost overruns in certain complex marine and energy projects
Projects affected:
• Twelve marine gas solutions projects for multiple gas tanker vessel series
• One LNG terminal construction project
• Two engine EPC projects in countries with strict local standards and requirements
Financial impact:
• EUR 150 million one-time charge in full year 2019 result, of which EUR 84 million recognised during January-September
© Wärtsilä PUBLIC 25 October 2019 INTERIM REPORT JANUARY-SEPTEMBER 201910
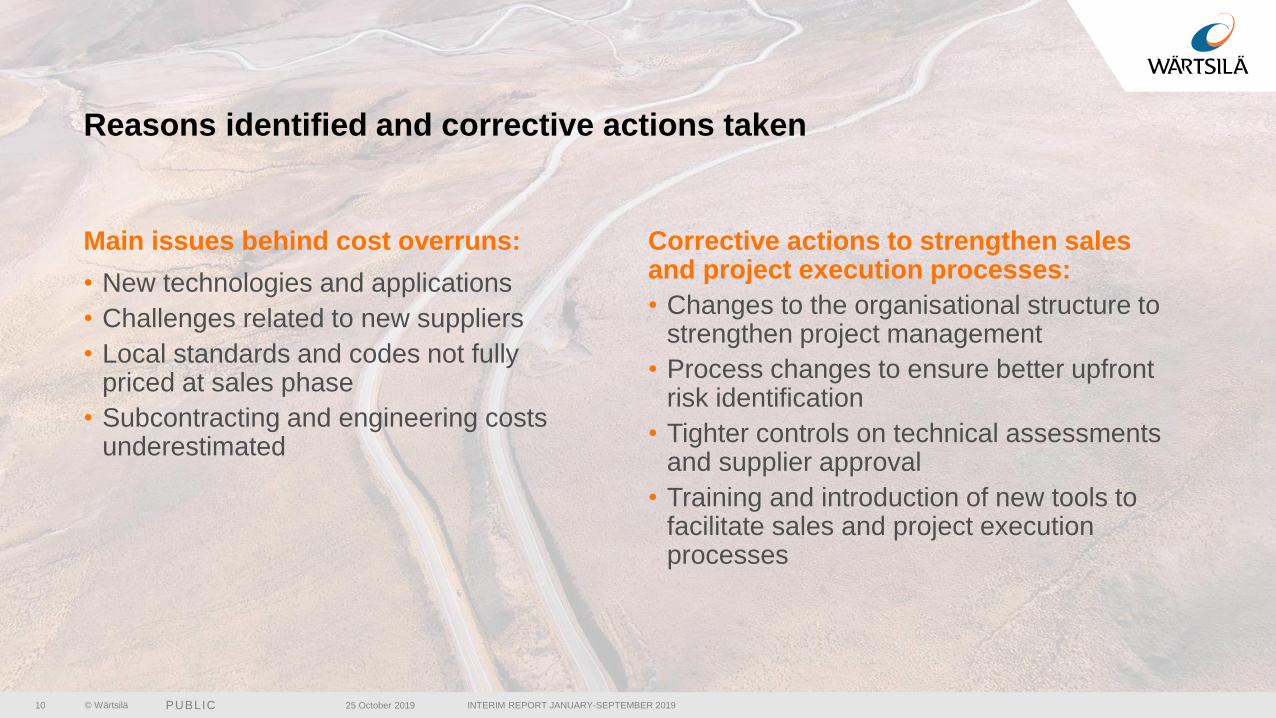
Reasons identified and corrective actions taken
Corrective actions to strengthen sales and project execution processes:
• Changes to the organisational structure to strengthen project management
• Process changes to ensure better upfront risk identification
• Tighter controls on technical assessments and supplier approval
• Training and introduction of new tools to facilitate sales and project execution processes
Main issues behind cost overruns:
• New technologies and applications
• Challenges related to new suppliers
• Local standards and codes not fully priced at sales phase
• Subcontracting and engineering costs underestimated
© Wärtsilä PUBLIC INTERIM REPORT JANUARY-SEPTEMBER 201911
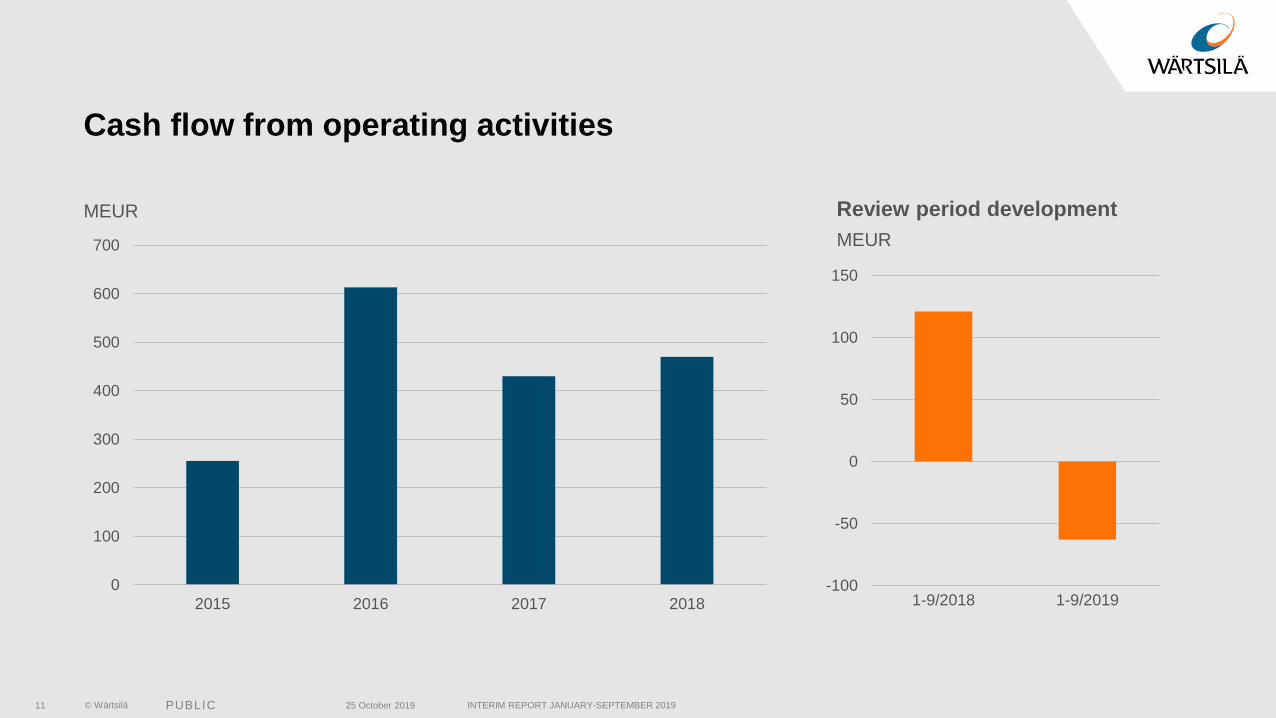
Cash flow from operating activities
0
100
200
300
400
500
600
700
2015 2016 2017 2018
MEUR Review period development
MEUR
-100
-50
0
50
100
150
1-9/2018 1-9/2019
25 October 2019
© Wärtsilä PUBLIC INTERIM REPORT JANUARY-SEPTEMBER 201912
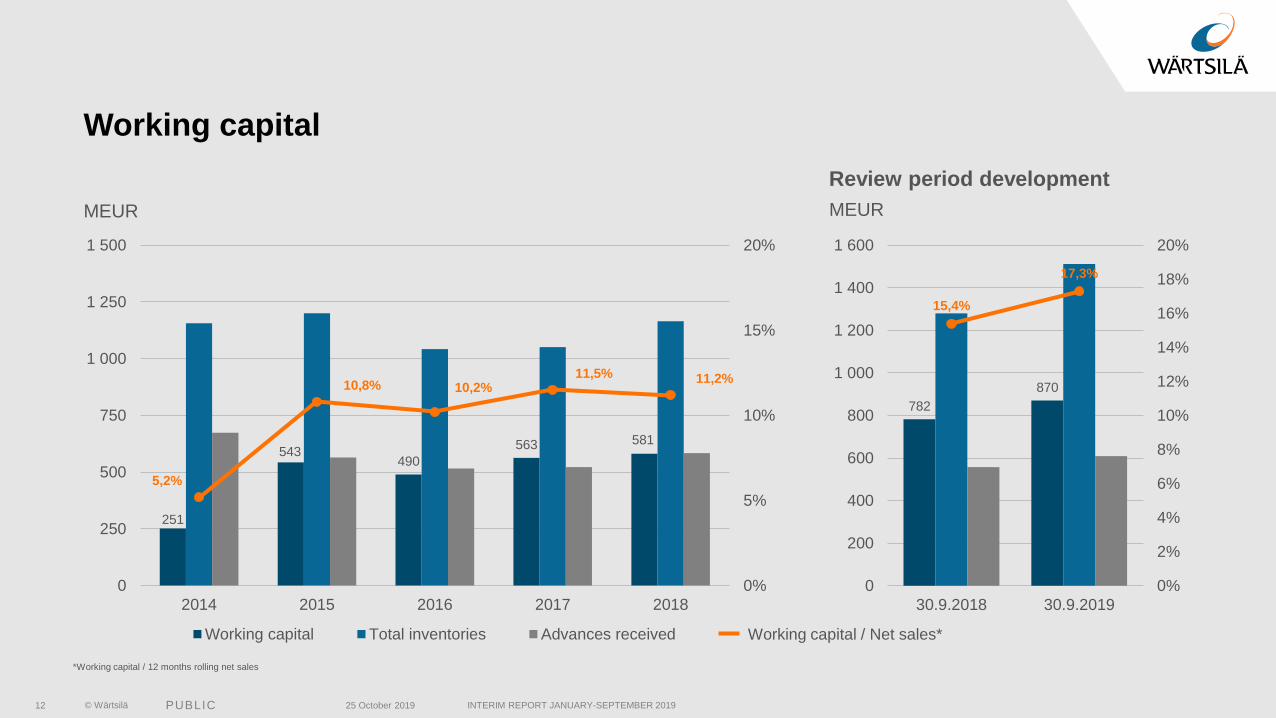
Working capital
251
543490
563 581
5,2%
10,8% 10,2%11,5% 11,2%
0%
5%
10%
15%
20%
0
250
500
750
1 000
1 250
1 500
2014 2015 2016 2017 2018
Working capital Total inventories Advances received Working capital / Net sales*
*Working capital / 12 months rolling net sales
MEUR
782
870
15,4%
17,3%
0%
2%
4%
6%
8%
10%
12%
14%
16%
18%
20%
0
200
400
600
800
1 000
1 200
1 400
1 600
30.9.2018 30.9.2019
Review period development
MEUR
25 October 2019
© Wärtsilä PUBLIC INTERIM REPORT JANUARY-SEPTEMBER 201913
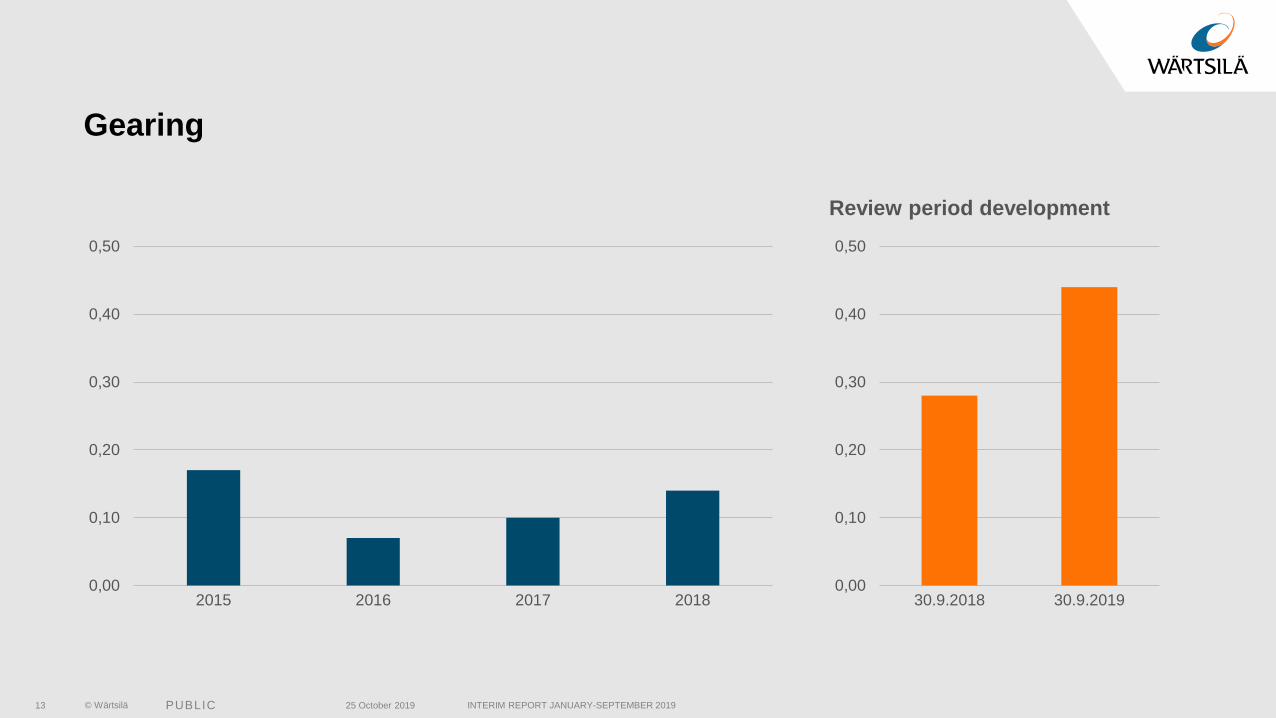
Gearing
0,00
0,10
0,20
0,30
0,40
0,50
2015 2016 2017 20180,00
0,10
0,20
0,30
0,40
0,50
30.9.2018 30.9.2019
Review period development
25 October 2019
© Wärtsilä PUBLIC
Wärtsilä
Marine Business
© Wärtsilä PUBLIC15
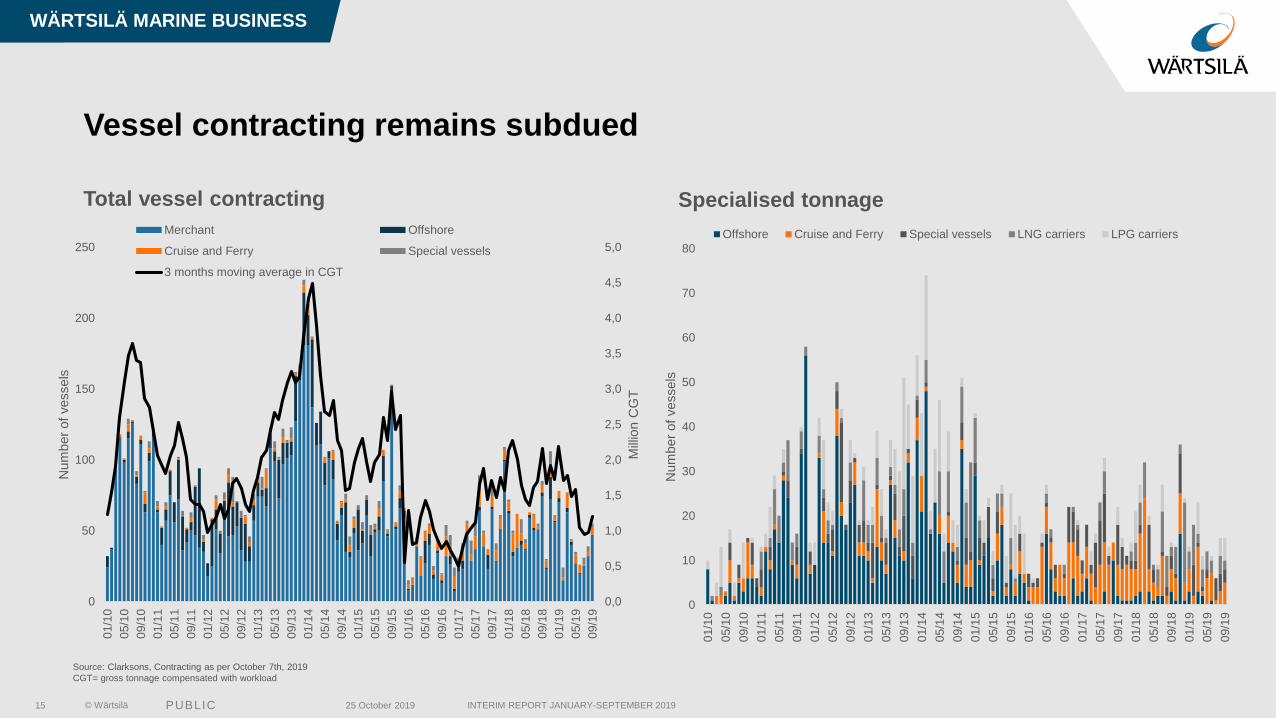
Vessel contracting remains subdued
Specialised tonnageTotal vessel contracting
Source: Clarksons, Contracting as per October 7th, 2019
CGT= gross tonnage compensated with workload
WÄRTSILÄ MARINE BUSINESS
25 October 2019 INTERIM REPORT JANUARY-SEPTEMBER 2019
0,0
0,5
1,0
1,5
2,0
2,5
3,0
3,5
4,0
4,5
5,0
0
50
100
150
200
250
01/1
0
05/1
0
09/1
0
01/1
1
05/1
1
09/1
1
01/1
2
05/1
2
09/1
2
01/1
3
05/1
3
09/1
3
01/1
4
05/1
4
09/1
4
01/1
5
05/1
5
09/1
5
01/1
6
05/1
6
09/1
6
01/1
7
05/1
7
09/1
7
01/1
8
05/1
8
09/1
8
01/1
9
05/1
9
09/1
9
Mill
ion C
GT
Num
ber
of
vessels
Merchant Offshore
Cruise and Ferry Special vessels
3 months moving average in CGT
0
10
20
30
40
50
60
70
80
01/1
0
05/1
0
09/1
0
01/1
1
05/1
1
09/1
1
01/1
2
05/1
2
09/1
2
01/1
3
05/1
3
09/1
3
01/1
4
05/1
4
09/1
4
01/1
5
05/1
5
09/1
5
01/1
6
05/1
6
09/1
6
01/1
7
05/1
7
09/1
7
01/1
8
05/1
8
09/1
8
01/1
9
05/1
9
09/1
9
Num
ber
of
vessels
Offshore Cruise and Ferry Special vessels LNG carriers LPG carriers
© Wärtsilä PUBLIC INTERIM REPORT JANUARY-SEPTEMBER 201916
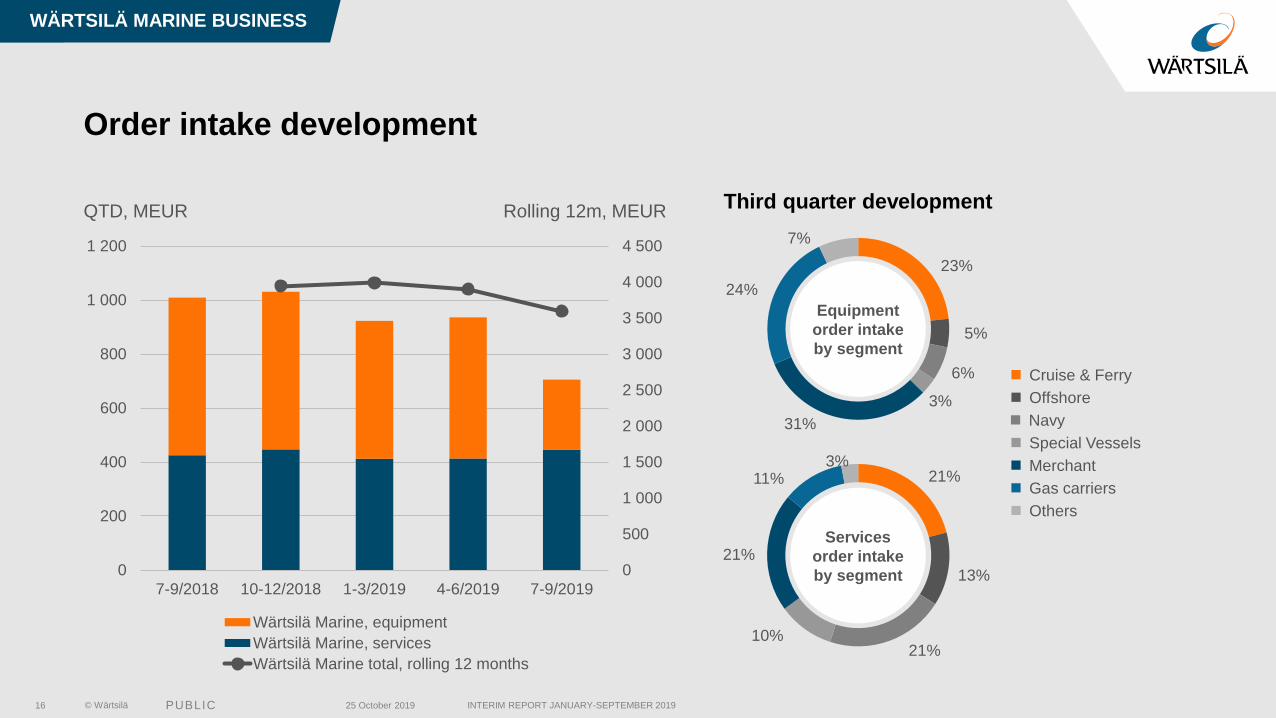
Order intake development
0
500
1 000
1 500
2 000
2 500
3 000
3 500
4 000
4 500
0
200
400
600
800
1 000
1 200
7-9/2018 10-12/2018 1-3/2019 4-6/2019 7-9/2019
Wärtsilä Marine, equipment
Wärtsilä Marine, services
Wärtsilä Marine total, rolling 12 months
WÄRTSILÄ MARINE BUSINESS
QTD, MEUR Rolling 12m, MEUR
23%
5%
6%
3%
31%
24%
7%
21%
13%
21%10%
21%
11%3%
Services
order intake
by segment
Equipment
order intake
by segment
◼ Offshore
◼ Navy
◼ Special Vessels
◼ Merchant
◼ Others
◼ Cruise & Ferry
◼ Gas carriers
25 October 2019
Third quarter development
© Wärtsilä PUBLIC 25 October 2019 INTERIM REPORT JANUARY-SEPTEMBER 201917
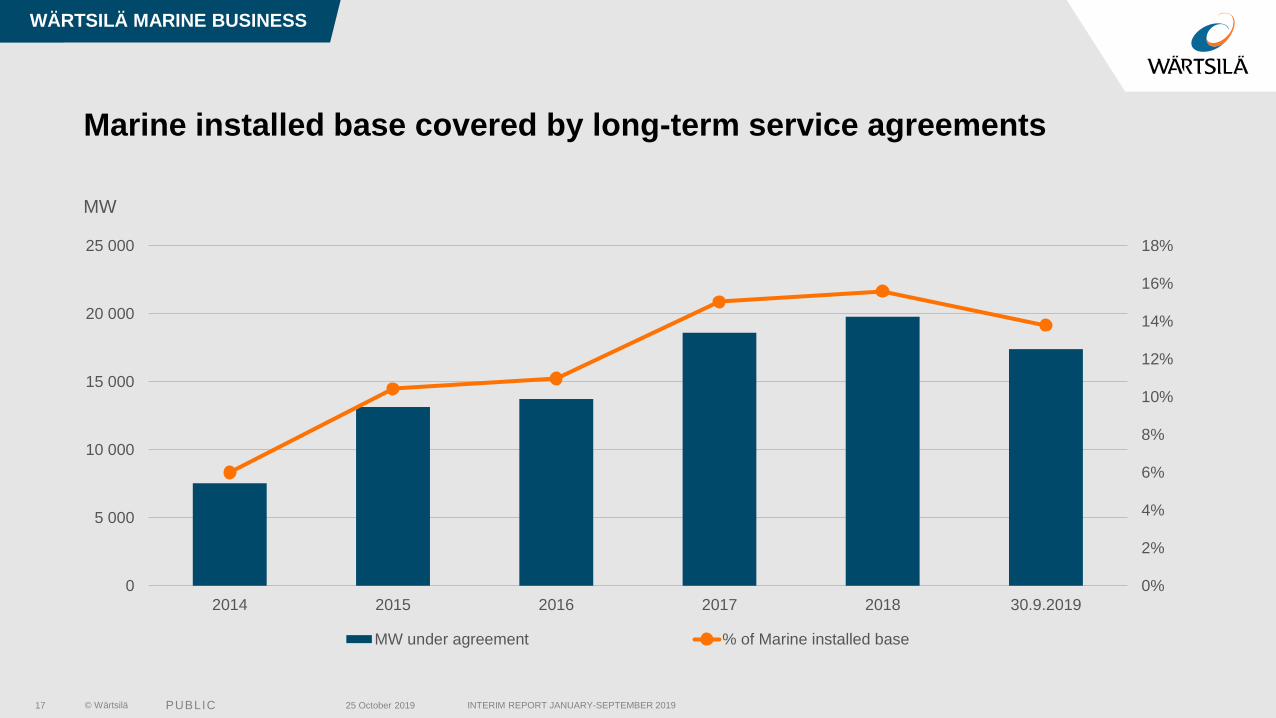
Marine installed base covered by long-term service agreements
0%
2%
4%
6%
8%
10%
12%
14%
16%
18%
0
5 000
10 000
15 000
20 000
25 000
2014 2015 2016 2017 2018 30.9.2019
MW under agreement % of Marine installed base
WÄRTSILÄ MARINE BUSINESS
MW
© Wärtsilä PUBLIC INTERIM REPORT JANUARY-SEPTEMBER 201918
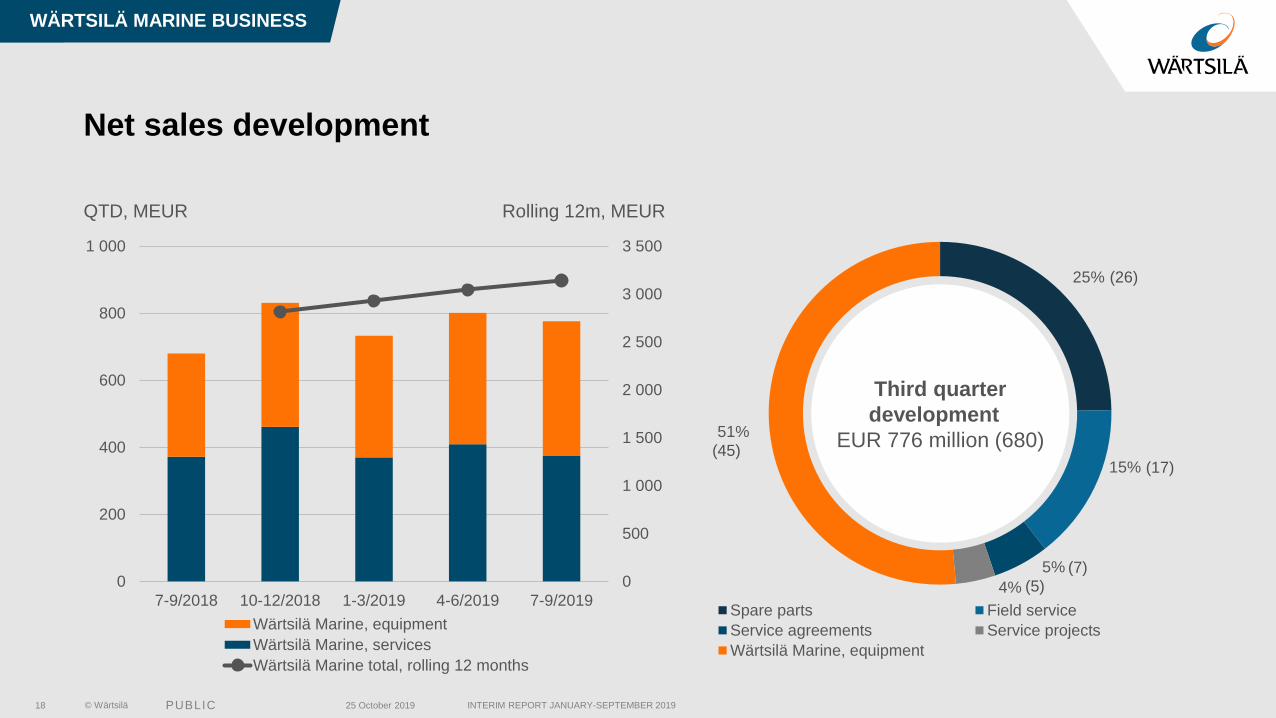
Net sales development
0
500
1 000
1 500
2 000
2 500
3 000
3 500
0
200
400
600
800
1 000
7-9/2018 10-12/2018 1-3/2019 4-6/2019 7-9/2019
Wärtsilä Marine, equipment
Wärtsilä Marine, services
Wärtsilä Marine total, rolling 12 months
25%
15%
5%
4%
51%
Spare parts Field service
Service agreements Service projects
Wärtsilä Marine, equipment
WÄRTSILÄ MARINE BUSINESS
QTD, MEUR Rolling 12m, MEUR
Third quarter
development
EUR 776 million (680)
25 October 2019
(45)
(7)
(17)
(26)
(5)
© Wärtsilä PUBLIC
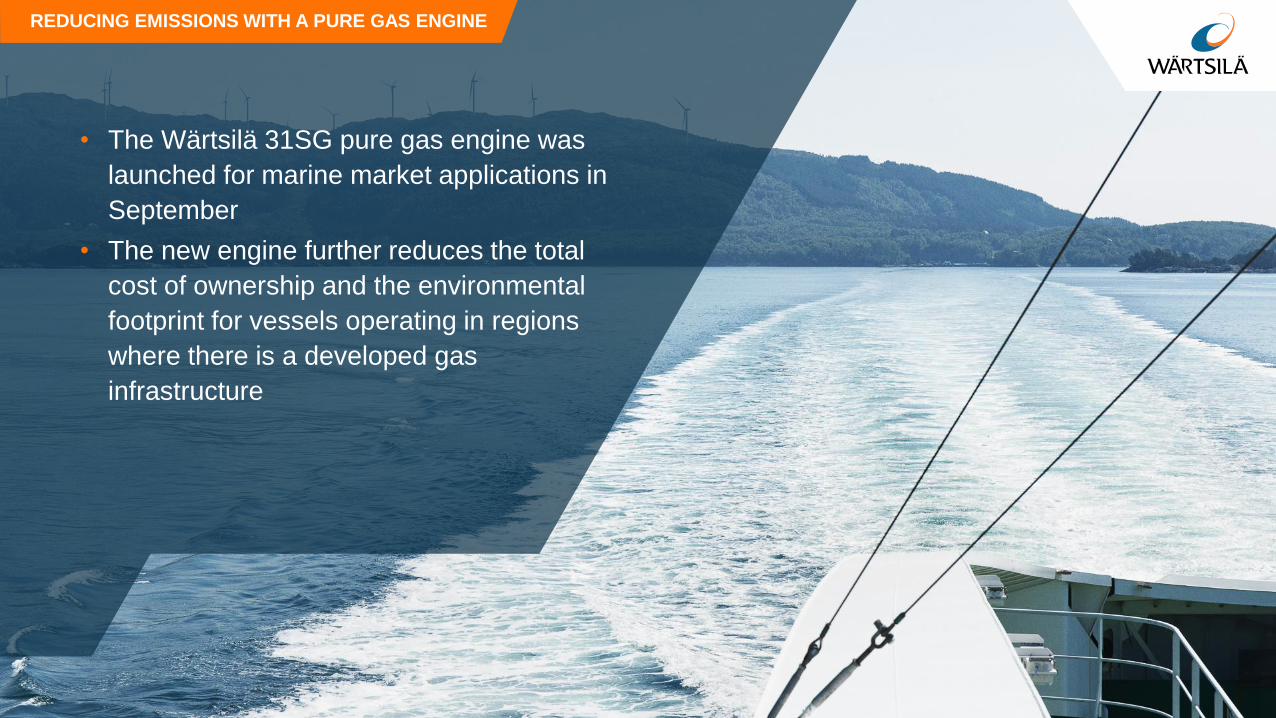
• The Wärtsilä 31SG pure gas engine was
launched for marine market applications in
September
• The new engine further reduces the total
cost of ownership and the environmental
footprint for vessels operating in regions
where there is a developed gas
infrastructure
REDUCING EMISSIONS WITH A PURE GAS ENGINE

© Wärtsilä PUBLIC
Wärtsilä
Energy Business
© Wärtsilä PUBLIC INTERIM REPORT JANUARY-SEPTEMBER 201921
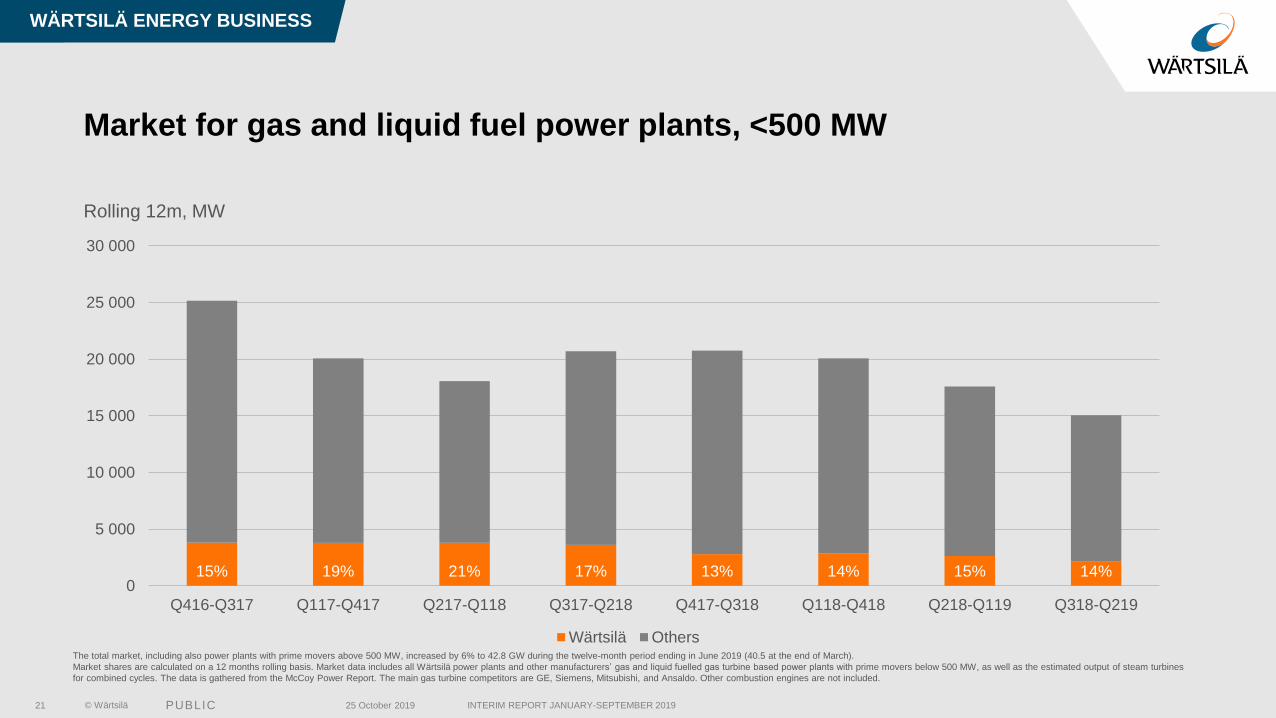
Market for gas and liquid fuel power plants, <500 MW
15% 19% 21% 17% 13% 14% 15% 14%0
5 000
10 000
15 000
20 000
25 000
30 000
Q416-Q317 Q117-Q417 Q217-Q118 Q317-Q218 Q417-Q318 Q118-Q418 Q218-Q119 Q318-Q219
Wärtsilä Others
WÄRTSILÄ ENERGY BUSINESS
The total market, including also power plants with prime movers above 500 MW, increased by 6% to 42.8 GW during the twelve-month period ending in June 2019 (40.5 at the end of March).
Market shares are calculated on a 12 months rolling basis. Market data includes all Wärtsilä power plants and other manufacturers’ gas and liquid fuelled gas turbine based power plants with prime movers below 500 MW, as well as the estimated output of steam turbines
for combined cycles. The data is gathered from the McCoy Power Report. The main gas turbine competitors are GE, Siemens, Mitsubishi, and Ansaldo. Other combustion engines are not included.
Rolling 12m, MW
25 October 2019
© Wärtsilä PUBLIC
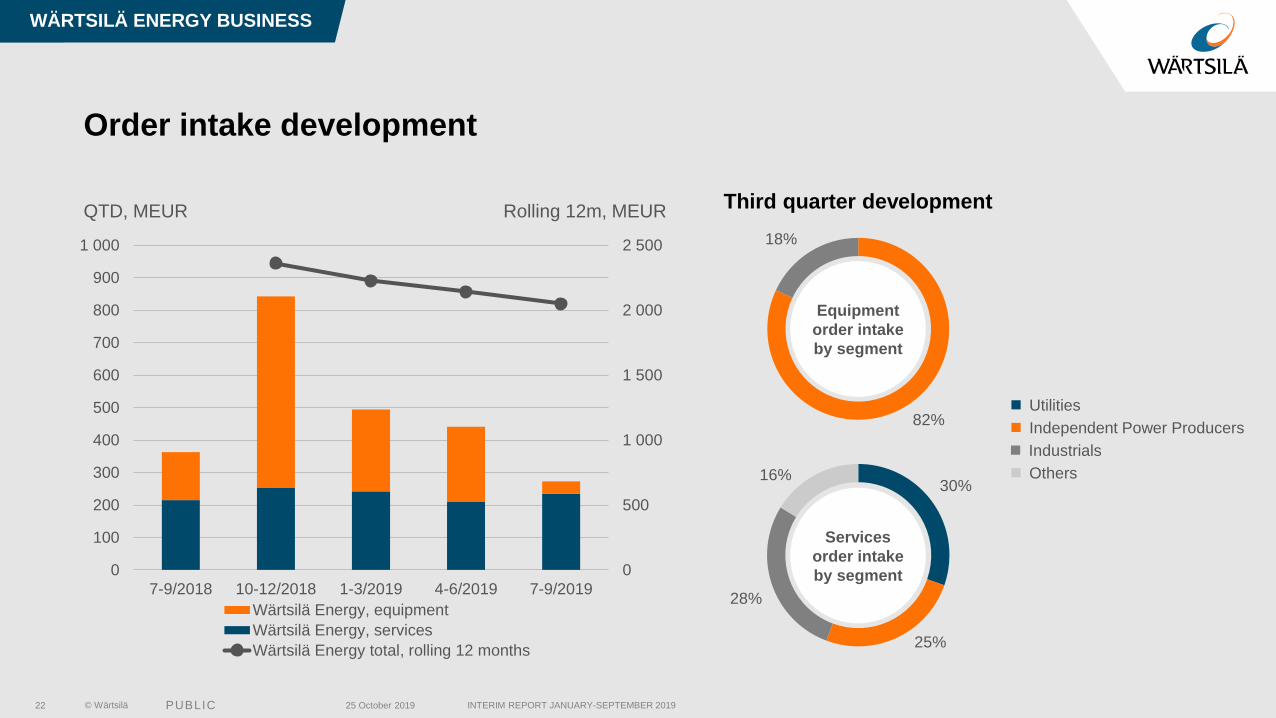
82%
18%
30%
25%
28%
16%
Services
order intake
by segment
Equipment
order intake
by segment
◼ Independent Power Producers
◼ Industrials
◼ Others
◼ Utilities
INTERIM REPORT JANUARY-SEPTEMBER 201922
Order intake development
0
500
1 000
1 500
2 000
2 500
0
100
200
300
400
500
600
700
800
900
1 000
7-9/2018 10-12/2018 1-3/2019 4-6/2019 7-9/2019
Wärtsilä Energy, equipment
Wärtsilä Energy, services
Wärtsilä Energy total, rolling 12 months
WÄRTSILÄ ENERGY BUSINESS
QTD, MEUR Rolling 12m, MEUR
25 October 2019
Third quarter development
© Wärtsilä PUBLIC INTERIM REPORT JANUARY-SEPTEMBER 201923
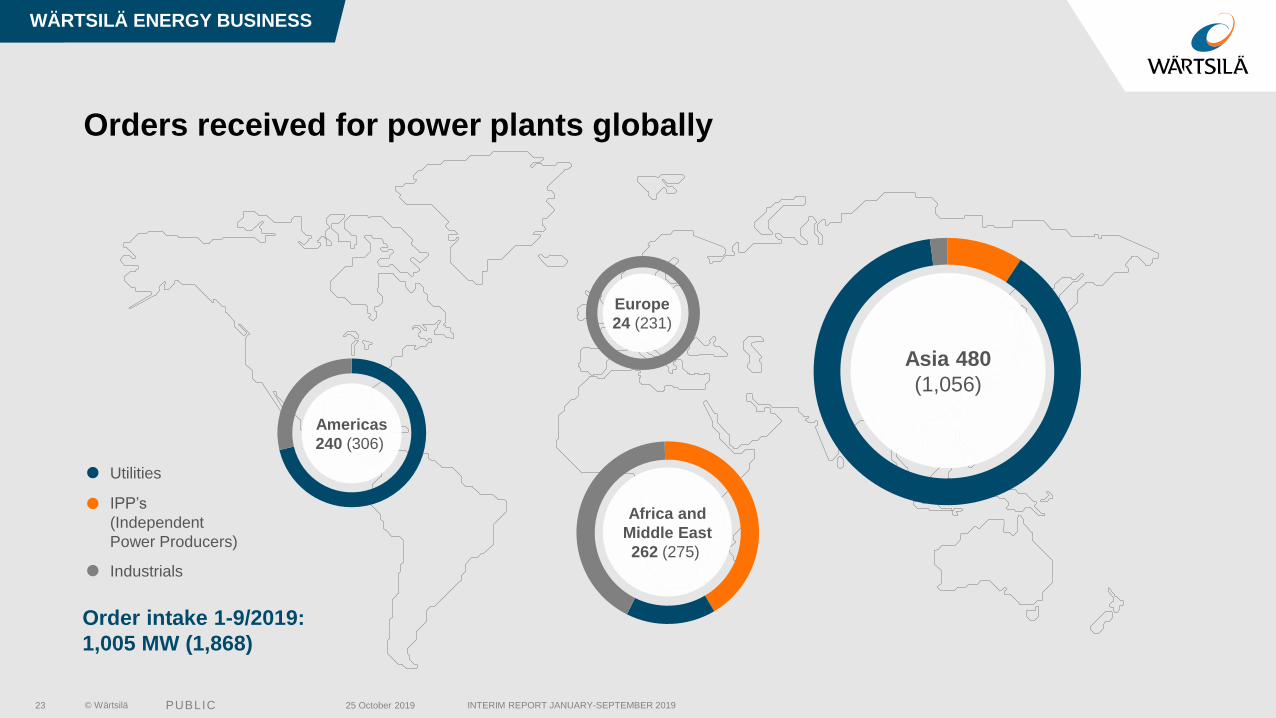
Orders received for power plants globally
WÄRTSILÄ ENERGY BUSINESS
IPP’s
(Independent
Power Producers)
Utilities
Industrials
Order intake 1-9/2019:
1,005 MW (1,868)
Asia 480
(1,056)
Africa and
Middle East
262 (275)
Americas
240 (306)
Europe
24 (231)
25 October 2019
© Wärtsilä PUBLIC24
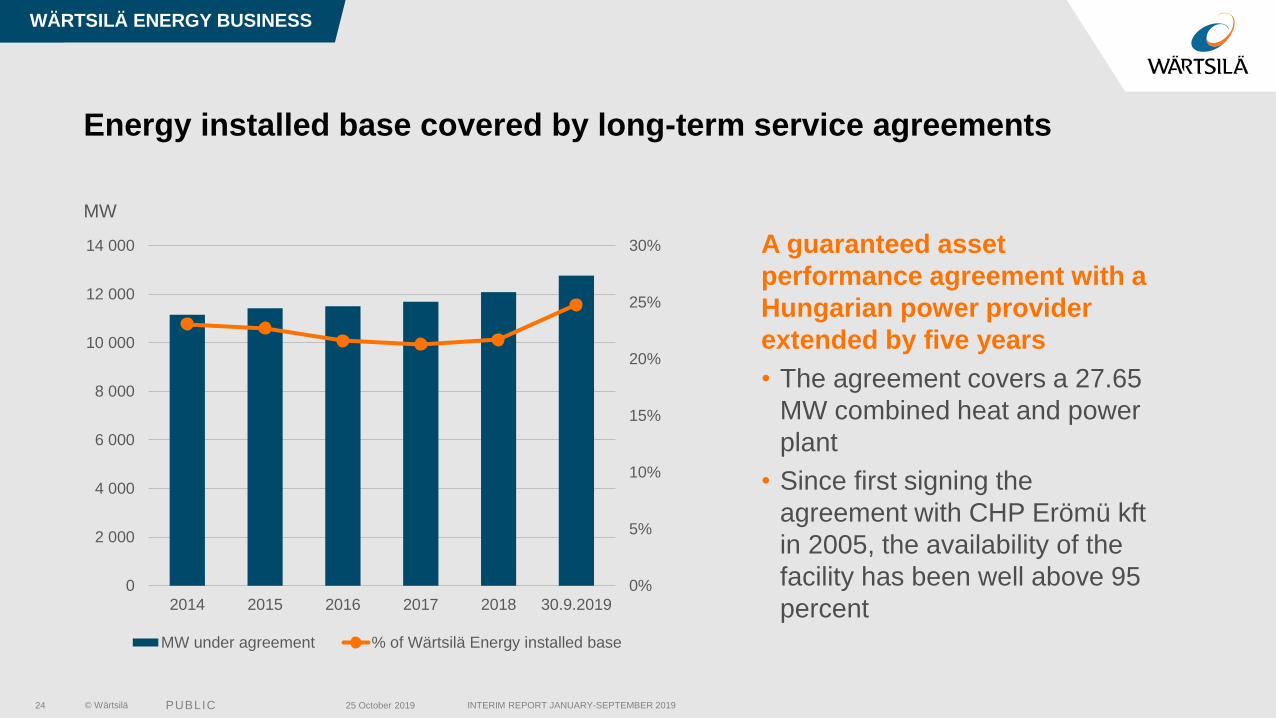
Energy installed base covered by long-term service agreements
0%
5%
10%
15%
20%
25%
30%
0
2 000
4 000
6 000
8 000
10 000
12 000
14 000
2014 2015 2016 2017 2018 30.9.2019
MW under agreement % of Wärtsilä Energy installed base
A guaranteed asset
performance agreement with a
Hungarian power provider
extended by five years
• The agreement covers a 27.65
MW combined heat and power
plant
• Since first signing the
agreement with CHP Erömü kft
in 2005, the availability of the
facility has been well above 95
percent
WÄRTSILÄ ENERGY BUSINESS
25 October 2019 INTERIM REPORT JANUARY-SEPTEMBER 2019
MW
© Wärtsilä PUBLIC INTERIM REPORT JANUARY-SEPTEMBER 201925
Net sales development
0
500
1 000
1 500
2 000
2 500
0
200
400
600
800
7-9/2018 10-12/2018 1-3/2019 4-6/2019 7-9/2019
Wärtsilä Energy, equipment
Wärtsilä Energy, services
Wärtsilä Energy total, rolling 12 months
22%
7%
20%
10%
41%
Spare parts Field service
Service agreements Service projects
Wärtsilä Energy, equipment
WÄRTSILÄ ENERGY BUSINESS
QTD, MEUR Rolling 12m, MEUR
Third quarter
development
EUR 342 million (650)
25 October 2019
(69)
(3)
(9)
(14)
(4)
© Wärtsilä PUBLIC
COLLABORATING FOR LIFECYCLE INNOVATION
• Wärtsilä’s hybrid, dual-fuel solution
establishes the new Wasaline RoPax ferry
as a benchmark in efficiency and
sustainability
• Predictive maintenance lowers operating
costs and improves reliability
• Wärtsilä benefits in the form of a floating
technology demonstrator and R&D lab
in connection to the Smart Technology
Hub being built in Vaasa
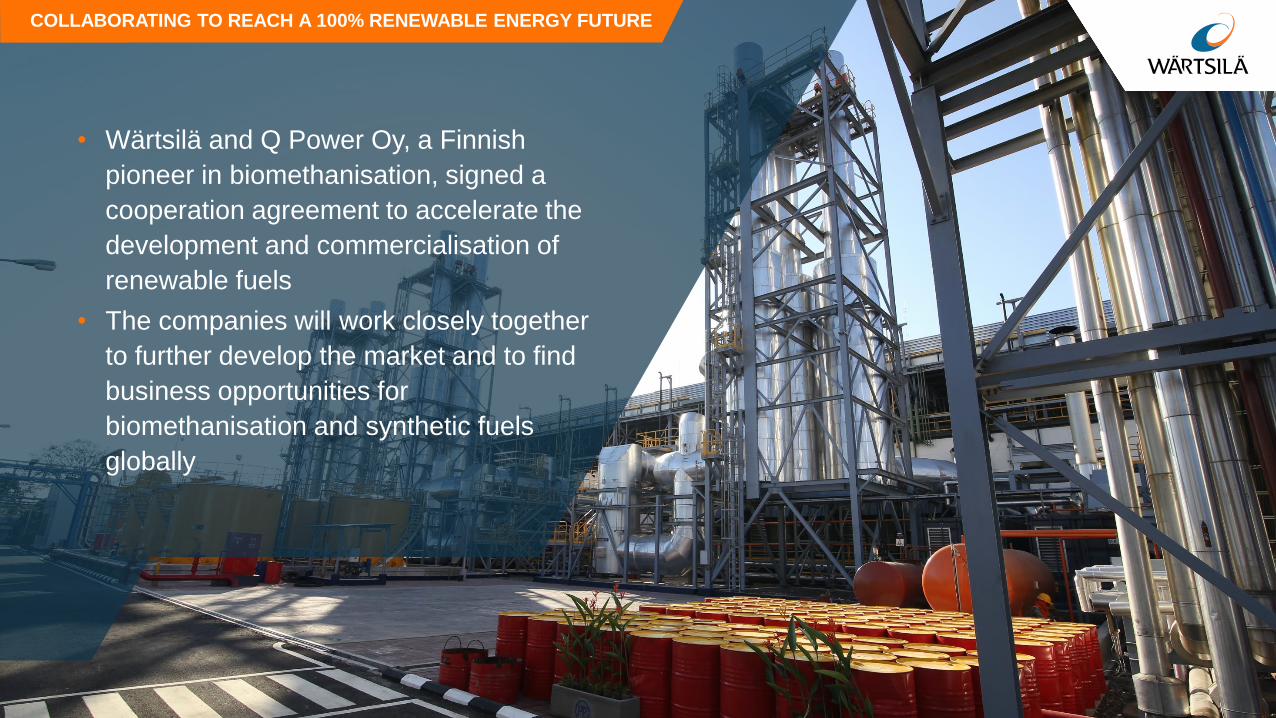
COLLABORATING TO REACH A 100% RENEWABLE ENERGY FUTURE
• Wärtsilä and Q Power Oy, a Finnish
pioneer in biomethanisation, signed a
cooperation agreement to accelerate the
development and commercialisation of
renewable fuels
• The companies will work closely together
to further develop the market and to find
business opportunities for
biomethanisation and synthetic fuels
globally
© Wärtsilä PUBLIC
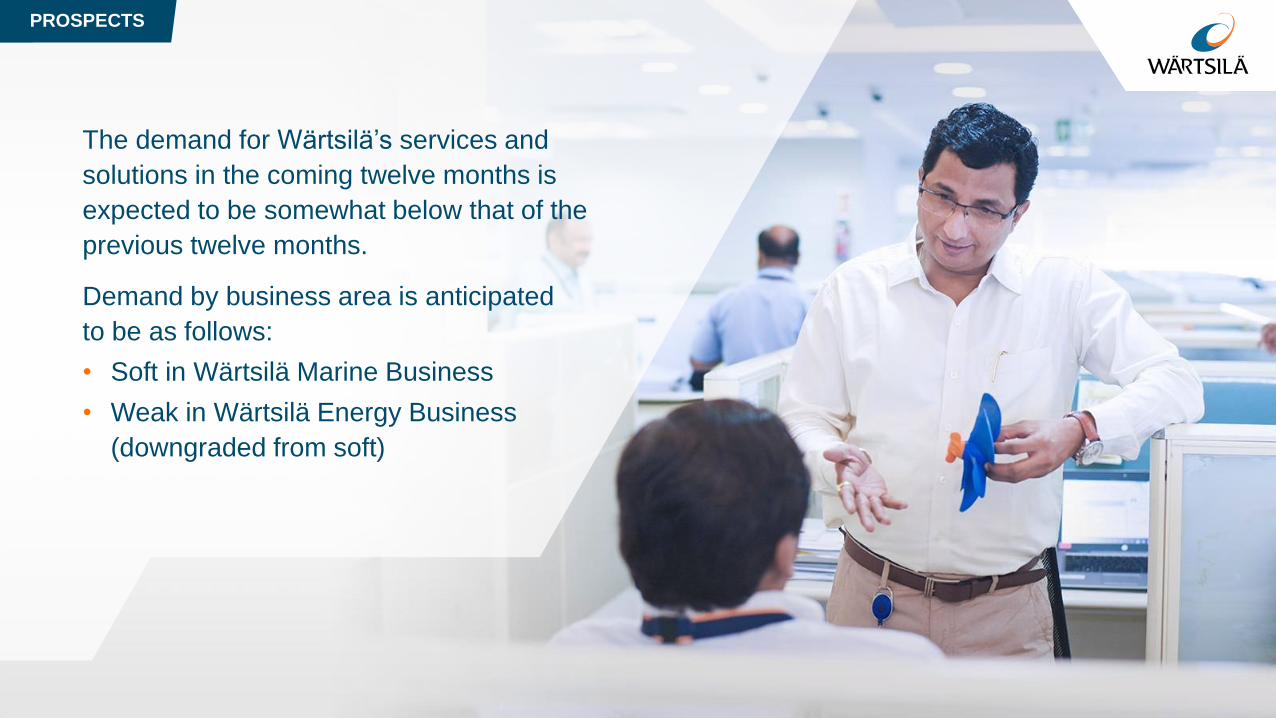
PROSPECTS
The demand for Wärtsilä’s services and
solutions in the coming twelve months is
expected to be somewhat below that of the
previous twelve months.
Demand by business area is anticipated
to be as follows:
• Soft in Wärtsilä Marine Business
• Weak in Wärtsilä Energy Business
(downgraded from soft)
THANK YOU
Further information:
Natalia Valtasaari
Vice President, Investor Relations
Tel. +358 (0) 10 709 5637
E-mail: [email protected]


![Get a higher Return On Investment with Wärtsil䀦 · 2 © Wärtsilä 29.8.2016 [Get a higher Return On Investment with Wärtsilä / Joseph Ferrari] Wärtsilä •Founded in 1834](https://img.pdfslide.us/doc/110x75/604df744e0dc7236a53e0410/get-a-higher-return-on-investment-with-wrtsil-2-wrtsil-2982016-get.jpg)