Embed Size (px)
Citation preview

Intergraph CorporationIntergraph Corporation
Investor PresentationInvestor PresentationAugust 15, 2006
Page 2
ForwardForward--Looking StatementsLooking Statements
This presentation contains forward-looking statements (all statements other than those made solely with respect to historical fact) within the meaning of the Private Securities Litigation Reform Act of 1995 including, but not limited to, any projections or expectations regarding future results, including revenue, operating income levels, margins, and cash flows; expectations regarding future market conditions; and the Company's organizational realignment and cost reduction efforts, and their anticipated impact on the Company and its divisions and business units; information regarding the development, timing of introduction, exportability, and performance of new products; the Company's ability to win new orders and any statements of the plans, strategies, expectations, and objectives of management for future operations. Forward-looking statements are subject to known and unknown risks and uncertainties (some of which are beyond the Company's control) that could cause actual results to differ materially from those anticipated in the forward-looking statements. Factors that could cause or contribute to such differences include, but are not limited to the risk factors identified in our annual report on Form 10-K, potential adverse outcomes in our efforts to improve our operating performance and increase revenue (including uncertainties with respect to the timing and magnitude of any expected improvements); potential adverse outcomes or consequences associated with the Company's organizational realignment; material changes with respect to our business, litigation, or the securities markets; risks associated with doing business internationally (including foreign currency fluctuations and export controls); worldwide political and economic conditions and changes; increased competition; rapid technological change; unanticipated changes in customer requirements, including reductions in funding or spending for, or scope of, government projects; ability to identify suitable sources of growth and to identify and execute upon suitable acquisition targets at reasonable prices; ability to improve margins; adverse trends in energy demand and prices; ability to attract or retain key personnel; the ability to access or deliver the technology necessary to compete in the markets served; potential obsolescence or exhaustion of the Company's intellectual property rights, and changes in the market value of licensed products; the ability, timing, and costs to enforce and protect the Company's intellectual property rights; risks associated with various ongoing litigation proceedings and other disputes; and other risks detailed in our press releases or in our annual, quarterly, or other filings with the Securities and Exchange Commission. The Company undertakes no obligation to make any revision to any forward-looking statement or to update any such statement to reflect events or circumstances occurring after the date thereof. Accordingly, the reader is cautioned not to unduly rely on such forward-looking statements. Intergraph and the Intergraph logo are registered trademarks of Intergraph Corporation. Other brands and product names are trademarks of their respective owners.

Page 3
AgendaAgenda
A. Intergraph Business Overview
B. Security, Government & Infrastructure (SG&I) Division
C. Process, Power & Marine (PP&M) Division
D. Intergraph Strategy Discussion
E. Intergraph Financial Summary

A.A. Intergraph Business OverviewIntergraph Business Overview

Page 5
Intergraph Profile NASDAQ: INGRIntergraph Profile NASDAQ: INGR
Business Overview:
A leading global provider of Spatial Information Management (SIM) software
Spatial technologies enable customers to manage and understand complex data through intelligent visual representations
Governments and businesses in over 60 countries rely on our software and services
Financial Overview:
Six Months
Ended Fiscal Year Ended December 31,
June 30, 2006 2005 2004 2003
Revenue $291.8M $576.8M $551.1M $526.0M
Revenue Growth 3.5% 4.7% 4.8% 5.0%
Operating Income $18.2M $31.9M $34.1M $13.4M
Operating Margin 6.2% 5.5% 6.2% 2.5%
Operating Income Before Restructuring [a] $28.6M $43.6M $34.9M $17.3M
Operating Margin Before Restructuring [a] 9.8% 7.6% 6.3% 3.3%
Weighted Average Diluted Shares Outstanding 30.8M 31.9M 36.4M 47.6M
Cash & Short-Term Investments (as of 6/30/06) $248.1M
Cash & Short-Term Investments per Share (as of 6/30/06) $8.26
[a] Non-GAAP financial measures. See Appendix.

Page 6
Intergraph Business OverviewIntergraph Business Overview
Spatial Information Management (SIM)
Process, Power & MarineSecurity, Government & Infrastructure
Industry-leading plant & ship design and information management software
Geospatially-enabled security, military and infrastructure software & services
Annual Revenue: ~$400 million Annual Revenue: ~$190 million
Public safety agencies protecting nearly 500 million people around the world
National, regional and local governments in 80% of the world’s largest countries
39 of the 50 state departments of transportation in the United States
Nearly all of the Fortune Global 500 chemical, petroleum & pharmaceutical companies

Page 7
Intergraph NonIntergraph Non--Operating AssetsOperating Assets
Intergraph possesses an intellectual property (IP) portfolio, which it protects through licensing and litigation efforts:
– Among others, Intergraph has three families of patents defining specific computer architectures: Parallel Instruction Computing (PIC) patentsClipper cache memory management patentsHigh-Availability SuperServer clustering patents
– Generated more than $900 million in pre-tax earnings through licensing and litigation from 2002 through June 2006:
$675 million from Intel$141 million from Hewlett-Packard$18 million from Texas Instruments$15 million from AMD plus future % of certain profits, if any$15 million from Sony$12 million from Gateway/eMachines plus certain future per unit royalties$10 million from IBM$10 million from Fujitsu$7.5 million from Acer
Intergraph has a minority ownership position in Bentley Systems, Inc.:– Private software company based in Exton, Pennsylvania
– Annual revenue of more than $300 million

B.B. Security, Government & Infrastructure (SG&I) DivisionSecurity, Government & Infrastructure (SG&I) Division

Page 9
Security, Government & Infrastructure (SG&I)Security, Government & Infrastructure (SG&I)
Intergraph provides software & integration services to security, government and infrastructure organizations around the world
Intergraph’s geospatially-enabled software allows organizations to protect, manage and analyze high-value assets, incidents & infrastructure
Public Safety & Government
Federal, Military& Intelligence
Utilities &CommunicationsTransportation
IndustryIndustry CustomersCustomers

Page 10
SG&I Market OverviewSG&I Market Overview
SG&I Revenue ~$175M
Federal, Military &Intelligence ($1B+)
SG&I Revenue ~$115M
Public Safety &Government (~$900M)
SG&I Revenue ~$60M
Utilities & Comm.(~$675M)
SG&I Revenue ~$50M
Transportation(~$875M)
17% 13% 9%6%
Source: Intergraph Internal Estimates

Page 11
SG&I Product FrameworkSG&I Product Framework
Software designed to create a common operational picture that enables organizations to Capture, Manage, Analyze, Integrate, and then Act on unorganized & complex data
Links spatial awareness, incident command, intelligent video, and sensor information into a single system and integrates with local, state & federal government agencies
AnalyzeCapture Manage Integrate
Common Operational Picture
GEOSPATIAL TECHNOLOGY
DATA
Page 12
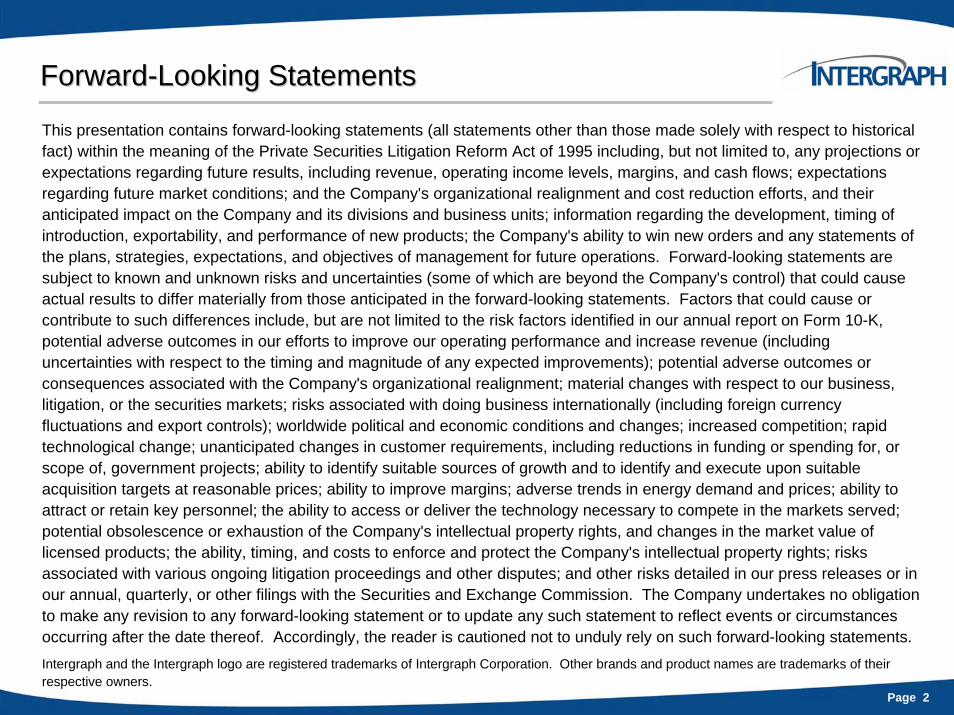
SG&I Product MatrixSG&I Product Matrix
Differentiated combination of geospatially-enabled technology and integration services that address the specific needs of our core industries
G/Technology
AnalyzeCapture Manage Integrate
Integration Services ExpertiseIntergraph Workforce
Includes ~500 U.S. Federally-
Cleared Services Personnel
GEOSPATIAL TECHNOLOGY COREINDUSTRIES
Utilities & Comm.
Transportation
Public Safety &Government
Federal, Military& Intelligence
GeoMediaGeoMedia GeoMedia
I/CAD I/CAD I/CAD
ImageScoutG/Technology
ImageStation IntelliWhere Video Analyst
DMC

Page 13
Customer Case Study: New York MTACustomer Case Study: New York MTA
New York Metropolitan Transportation Authority (MTA) subways, buses and railroads transport 2.4 billion New Yorkers per year; MTA bridges and tunnels carry nearly 300 million vehicles annually
Intergraph was selected as part of Lockheed Martin’s team providing a comprehensive upgrade to MTA’s electronic security operations infrastructure
Needs:− Security solution that electronically connects emergency response
& recovery services, and enhances detection & deterrent functions− System that more efficiently manages MTA information and
optimizes the utilization of critical security resources
Solution:− Intergraph Command and Control solution, including incident and
records management software and mobile solutions with alarm system and intelligent video integration (foundational technology for Emergency Operation Center, or EOC)
Potential Benefits:− Enables security personnel to more effectively deter, detect, alert,
protect, respond and recover from any situation, threat or incident− Early detection & threat monitoring around perimeter & buffer zones− Comprehensive incident tracking and real-time incident analysis

Page 14
National Geospatial-Intelligence Agency (NGA) provides timely, relevant, and accurate geospatial intelligence in support of national security objectives
Intergraph provides geospatial intelligence software and workflow consulting services in support of the NGA’s mission
Customer Case StudyCustomer Case Study: NGA: NGA
Needs:− Software that provides geospatial intelligence in any format
and from any source – imagery, imagery intelligence and geospatial data & information
− Maintain geospatial intelligence databases for all stakeholders and create tailored, customer-specific geospatial intelligence, analytic services and solutions
Solution:− Intergraph geospatial intelligence technology (including
GeoMedia and ImageScout software) and engineering workflow consulting services
Potential Benefits:− Provides advanced location-aware technologies for
national, regional and local security organizations

Page 15
Needs:− Implement public safety and emergency planning solutions− Implement integrated development and asset tracking system− Integrate permitting, document management & GIS data citywide
Solution:− Intergraph Incident Command software, full suite of GeoMedia
applications, and integration services expertise
Potential Benefits:− Comprehensive public safety solution -- E911 dispatch, incident
management, crime analysis, evacuation planning, and earthquake & flood response preparation
− More efficient asset & infrastructure management -- pavement maintenance, water & wastewater management, bridge management, and traffic operations
− Reduces man hours through process efficiencies and improves utilities customer service and billing
San Jose is the tenth largest city in the United States and third largest city in California with a population of approximately 1 million people and covering more than 175 square miles
Intergraph implemented a modernized public safety technology solution and a Web-based development & asset tracking system to integrate workflows & data across the city
Customer Case StudyCustomer Case Study: City of San Jose: City of San Jose

Page 16
Needs:− Coordinated emergency response between city and
county police & fire agencies
Solution:− Intergraph Incident Command software utilized by
Federal, State & Local-levels of government
Potential Benefits:− Provides centralized emergency response capabilities
− First interoperable Federal, State & Local Emergency Operations Center (EOC) in United States
− Enables first-responders from multiple agencies to share real-time information
Los Alamos National Laboratory is operated by the University of California for the National Nuclear Security Administration of the U.S. Department of Energy
Intergraph implemented a multi-agency incident command system as the foundational technology for the security solution for this critical government installation
Customer Case Study: Los Alamos National LabsCustomer Case Study: Los Alamos National Labs

Page 17
Customer Case Study: German Federal PoliceCustomer Case Study: German Federal Police
German Federal Police are responsible for providing public safety at airports, railways and federal borderlines, as well as on the high seas
Intergraph implemented command & control systems at several locations throughout the country
Needs:− Implement modernized law enforcement technologies
− Address heightened homeland security needs
Solution:− Intergraph Incident Command software and Automatic
Vehicle Location (AVL) solution
Potential Benefits:− Optimizes coordination of countrywide activities through
command & control infrastructure
− Helps shorten response times for first-responders
− Immediately alerts additional staff and provides mobile units with real-time information
− Digital mapping availability enables more effective and coordinated manhunts
Page 18
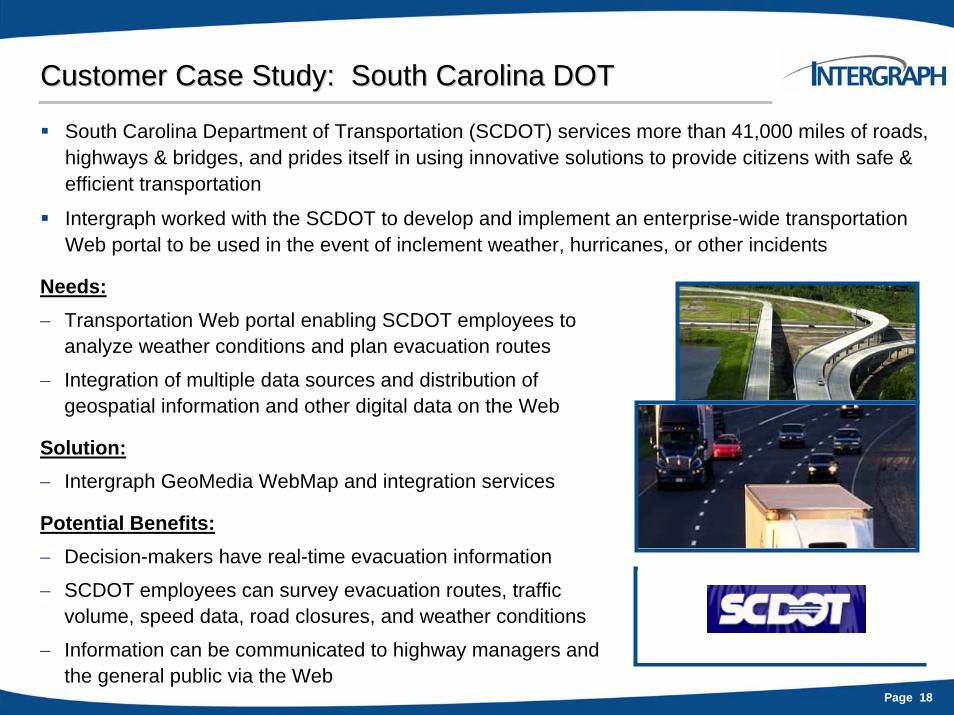
Customer Case Study: South Carolina DOTCustomer Case Study: South Carolina DOT
South Carolina Department of Transportation (SCDOT) services more than 41,000 miles of roads, highways & bridges, and prides itself in using innovative solutions to provide citizens with safe & efficient transportation
Intergraph worked with the SCDOT to develop and implement an enterprise-wide transportation Web portal to be used in the event of inclement weather, hurricanes, or other incidents
Needs:− Transportation Web portal enabling SCDOT employees to
analyze weather conditions and plan evacuation routes
− Integration of multiple data sources and distribution of geospatial information and other digital data on the Web
Solution:− Intergraph GeoMedia WebMap and integration services
Potential Benefits:− Decision-makers have real-time evacuation information
− SCDOT employees can survey evacuation routes, traffic volume, speed data, road closures, and weather conditions
− Information can be communicated to highway managers and the general public via the Web

Page 19
Customer Case Study: Florida Progress EnergyCustomer Case Study: Florida Progress Energy
Progress Energy Florida serves over 1.5 million electric customers across 30 counties in Florida
Intergraph implemented an integrated software suite for GIS-based facility mapping, automated outage & mobile workforce management, and automatic vehicle location capabilities
Needs:− System that provides dynamic/real-time information
− Mobile computing capabilities
− Achieve 100% digital environment
Solution:− Intergraph FRAMME-based GIS technology and
InService outage management system
Potential Benefits:− Consolidation of three dispatch centers into a single
facility
− Automatic outage prediction & analysis for improved customer service
− Real-time monitoring of crew locations and minimal use of paper forms & voice communication in the field
C.C. Process, Power & Marine (PP&M) DivisionProcess, Power & Marine (PP&M) Division

Page 21
Process, Power & Marine (PP&M)Process, Power & Marine (PP&M)
Intergraph provides software to the oil & gas, power, shipbuilding, pharmaceutical and chemical industries around the world
Intergraph software enables the design of plants & ships and provides the information management capabilities to build and operate those facilities
Engineering, Procurement & Construction (EPC) Owners / Operators (O/O)
IndustryIndustry CustomersCustomers

Page 22
PP&M Market OverviewPP&M Market Overview
PP&M Revenue ~$5MPP&M Revenue ~$50MPP&M Revenue ~$135M
Onshore (~$325M) Offshore (~$165M) Shipbuilding (~$110M)
42% 30% 5%
PP&M PP&M
Source: Intergraph Internal Estimates

Page 23
PP&M SmartPlant Enterprise SuitePP&M SmartPlant Enterprise Suite
SmartPlant Enterprise suite creates, captures & maintains engineering information and knowledge throughout a plant's design and operation life-cycle
SmartPlant Enterprise Suite
Integration and Information Management
Schematics Modelling
Solution Engineering Services
Materials & ProjectManagement
SmartPlant InstrumentationSmartPlant P&ID
SmartPlant Electrical
SmartSketch
SmartPlant 3DPDS
IntelliShip
SmartPlant Review
MARIAN
SmartPlant Foundation

Page 24
Customer Case Study: BechtelCustomer Case Study: Bechtel
Bechtel is one of the world’s largest engineering, construction & project management companies
Intergraph recently signed a multi-year, multi-million dollar Global Alliance Agreement with Bechtel, providing the company unlimited use of Intergraph’s plant design & engineering software
Needs:− Complete solution portfolio for plant design & engineering
information management
Solution:− Intergraph SmartPlant portfolio, Plant Design System (PDS)
and related software
− Solidifies a more than 25-year relationship between the two companies
Potential Benefits:− Improves Bechtel’s project execution & reduces design rework
− More efficient & accurate project information management, leading to better operational decisions
− Increases capture of engineering knowledge and preservation of intellectual capital

Page 25
Customer Case Study: SINOPECCustomer Case Study: SINOPEC
China Petroleum and Chemical Corporation (SINOPEC) is the largest petrochemical producer and crude oil refiner in Asia
Intergraph & SINOPEC recently entered into a long-term strategic relationship, allowing SINOPEC’s subordinate engineering companies access to Intergraph’s plant design & engineering software
Needs:− Standardize and enhance technology & processes for
SINOPEC’s subordinate engineering companies
Solution:
− Intergraph SmartPlant & PDS software, as well as technical support and consulting services
− SINOPEC’s subordinate engineering companies have used Intergraph’s software for more than 10 years
Potential Benefits:
− Reduces project execution and administrative costs
− Enhances competitive advantage of SINOPEC’s engineering companies with standardization of software and additional technical support services

Page 26
Customer Case Study: Samsung Heavy IndustriesCustomer Case Study: Samsung Heavy Industries
Samsung Heavy Industries (SHI), an affiliate of Korea’s Samsung, is one of the largest shipbuilding, offshore and construction companies in the world
SHI recently began implementing Intergraph’s IntelliShip software for all shipbuilding projects
Needs:− Modernize & improve design system to more effectively
compete with other Korean and Chinese shipbuilders
Solution:− Intergraph IntelliShip 3D modeling and engineering marine
design software
Potential Benefits:
− Improves productivity and reduces errors & design rework
− Reduces labor and time expended on drawing production as well as improving fabrication planning
− Improves 3D product models, enhancing discussions between ship owners and production managers
− Increases capture of engineering knowledge and reuse of ship designs

Page 27
Customer Case Study: The Dow Chemical Co.Customer Case Study: The Dow Chemical Co.
The Dow Chemical Co. is a worldwide innovator in the chemical, plastic and agricultural industries
Intergraph and AspenTech established an agreement with Dow to provide process plant design and integrated life-cycle engineering management software
Needs:− Reduce capital costs & plant start-up and shutdown times
while maintaining quality & productivity− Find cost-effective technologies to manage plant data
across the life-cycle
Solution:− Intergraph full suite of integrated plant design and
engineering software
Potential Benefits:− Reduces risks by re-using proven designs− Optimizes designs and reduces costs with front-end
engineering− Reduces schedule times by sharing information − Shorter planned and unplanned shutdowns by monitoring
as-built and asset information

Page 28
Customer Case Study: AlcoaCustomer Case Study: Alcoa
Alcoa is the world’s leading producer of primary aluminum, fabricated aluminum and alumina
Intergraph recently signed a global purchase agreement with Alcoa to provide its Plant Design System (PDS) and related software to Alcoa World Alumina for use by its engineering, procurement & construction contractors worldwide
Needs:− Global software standardization for all of Alcoa’s alumina
process plant projects
Solution:− Intergraph Plant Design System (PDS) and related
software
Potential Benefits:− Tightens control of engineering IT costs
− Increases project efficiency & advances best practices
− Greater efficiency in utilizing engineering and construction contractors
− Retains intellectual property and increases reuse of plant designs

D.D. Intergraph Strategy DiscussionIntergraph Strategy Discussion
Page 30
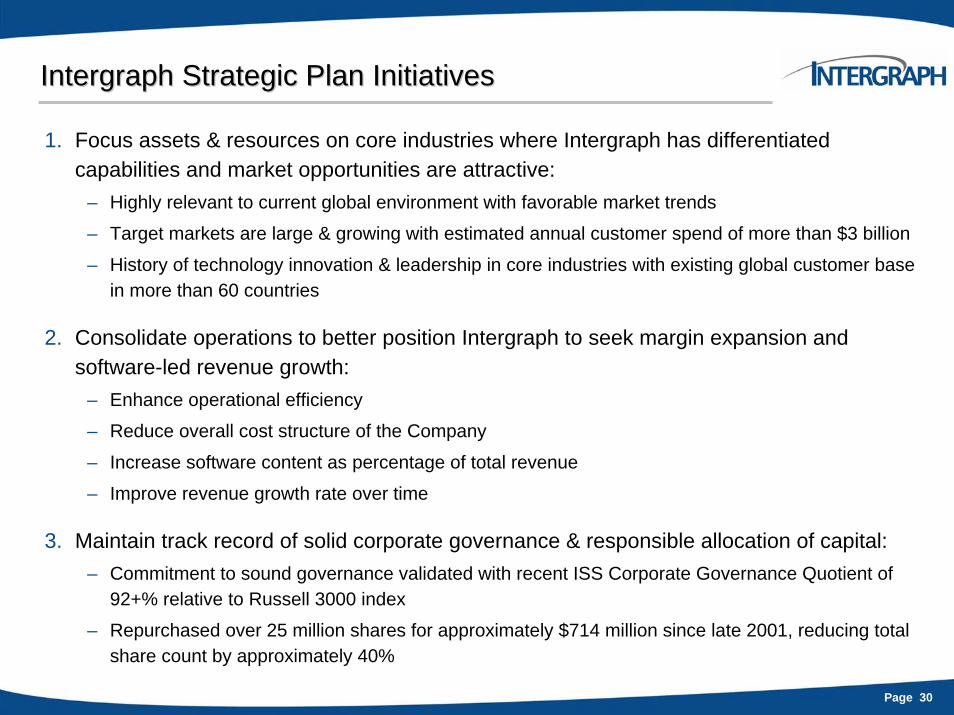
Intergraph Strategic Plan InitiativesIntergraph Strategic Plan Initiatives
1. Focus assets & resources on core industries where Intergraph has differentiated capabilities and market opportunities are attractive:
– Highly relevant to current global environment with favorable market trends
– Target markets are large & growing with estimated annual customer spend of more than $3 billion
– History of technology innovation & leadership in core industries with existing global customer base in more than 60 countries
2. Consolidate operations to better position Intergraph to seek margin expansion and software-led revenue growth:
– Enhance operational efficiency
– Reduce overall cost structure of the Company
– Increase software content as percentage of total revenue
– Improve revenue growth rate over time
3. Maintain track record of solid corporate governance & responsible allocation of capital:– Commitment to sound governance validated with recent ISS Corporate Governance Quotient of
92+% relative to Russell 3000 index
– Repurchased over 25 million shares for approximately $714 million since late 2001, reducing total share count by approximately 40%

Page 31
NOW:Change
Strategic Initiatives:Vision, Mission, Culture
Strategic Plan
Capital structure & allocation
Rebranding effort
Corporate Governance
Top-grading program
Results:FY 2005 operating income CAGR of 55% from 2003
ISS Corporate Governance score increased to 92+%
To date, repurchased over 25M shares for ~$714M
NEXT:Improve
Strategic Initiatives:Focus assets & resources on core industries
Consolidate operations to better position Intergraph to seek margin expansion & software-led revenue growth
Maintain track record of solid corporate governance & responsible allocation of shareholder’s capital
Goals:Alignment with Strategic Plan
Benchmark performance
Reduce overall cost structure
Performance-based culture
AFTER-NEXT: Expand
Strategic Initiatives:Accelerate revenue growth
Potential change in industry landscape
Company or market expansion
Transformation opportunities
Goals:Above industry performance
Turnaround complete
Sustained growth stage
Intergraph ThreeIntergraph Three--Phase Business TransformationPhase Business Transformation
2003 2003 -- 20042004 2005 2005 -- 20062006 2007 and Beyond2007 and Beyond

Page 32
NOW:Change
NEXT:Improve
Intergraph Metric FY 2003 FY 2005% CAGR
2003 – 2005
Systems & Services Orders $394.4M $468.8M
$245.5M
$576.8M
50.6%
$43.6M
7.6%
$31.9M
5.5%
31.9M
3,432
$168k
9%
Ending Backlog $193.3M 13%
Gross Margin 47.9% 2.7pts
Total Revenue $526.0M 5%
Op Income Before Restructuring [a] $17.3M 59%
Op Margin Before Restructuring [a] 3.3% 4.3pts
Operating Income $13.4M 55%
Operating Margin 2.5% 3.0pts
Weighted Avg. Diluted Shares O/S 47.6M (18%)
Average Number of Employees 3,721 (4%)
Annual Revenue per Employee $141k 9%
Intergraph Business Transformation ProgressIntergraph Business Transformation Progress
[a] Non-GAAP Financial Measures.

E.E. Intergraph Financial SummaryIntergraph Financial Summary

Page 34
Annual Financial Results (2003 Annual Financial Results (2003 –– 2005)2005)(dollars in millions)
$526$551
$577
$200
$300
$400
$500
$600
$700
2003 2004 2005
$34.9
$43.6
$17.3
$0.0
$10.0
$20.0
$30.0
$40.0
$50.0
2003 2004 2005
$13.4
$31.9$34.1
$0.0
$10.0
$20.0
$30.0
$40.0
$50.0
2003 2004 2005
Operating IncomeBefore Restructuring(Operating Margin)
Operating Income(Operating Margin)
Revenue
Operating IncomeOperating IncomeCAGR of 55%CAGR of 55%
Revenue CAGR of 5%Revenue CAGR of 5% Operating Income BeforeOperating Income BeforeRestructuring CAGR of 59%Restructuring CAGR of 59%
2.5%
6.2%
3.3%
6.3%5.5%
7.6%

Page 35
Quarterly & YTD Revenue Results (2003 Quarterly & YTD Revenue Results (2003 –– 2006)2006)(dollars in millions)
Quarterly Revenue Six Months Revenue
$139
$153$145
$138$132
$145
$121$127
$134 $135
$146 $145$136
$150
$50
$75
$100
$125
$150
$175
Q1 Q2 Q3 Q4 Q1 Q2 Q3 Q4 Q1 Q2 Q3 Q4 Q1 Q2
$282$270
$248
$292
$100
$150
$200
$250
$300
$350
2003 2004 2005 2006
Revenue CAGR of 6%Revenue CAGR of 6%2003 2004 2005 2006
Page 36
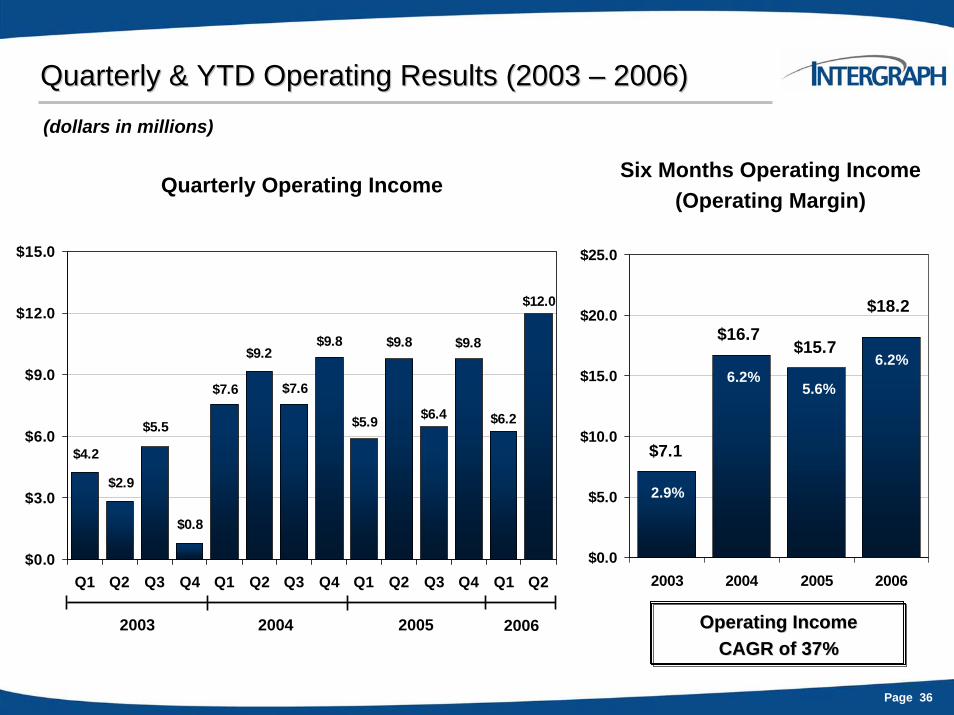
Quarterly & YTD Operating Results (2003 Quarterly & YTD Operating Results (2003 –– 2006)2006)(dollars in millions)
Six Months Operating Income(Operating Margin)
Quarterly Operating Income
$6.4 $6.2
$12.0
$9.8
$5.9
$9.8$9.8
$7.6
$5.5
$2.9
$4.2
$0.8
$7.6
$9.2
$0.0
$3.0
$6.0
$9.0
$12.0
$15.0
Q1 Q2 Q3 Q4 Q1 Q2 Q3 Q4 Q1 Q2 Q3 Q4 Q1 Q2
$15.7$16.7
$7.1
$18.2
$0.0
$5.0
$10.0
$15.0
$20.0
$25.0
2003 2004 2005 2006
5.6%6.2%
2.9%
6.2%
Operating IncomeOperating IncomeCAGR of 37%CAGR of 37%
2003 2004 2005 2006

Page 37
Quarterly & YTD Operating Results (2003 Quarterly & YTD Operating Results (2003 –– 2006)2006)(dollars in millions)
$28.6
$7.1
$17.5$19.4
$0.0
$9.0
$18.0
$27.0
$36.0
2003 2004 2005 2006
$7.6
$10.9
$17.7
$12.5$11.7
$9.2$8.4
$4.7$4.2$2.9
$5.5
$7.6
$9.8
$11.8
$0.0
$4.0
$8.0
$12.0
$16.0
$20.0
Q1 Q2 Q3 Q4 Q1 Q2 Q3 Q4 Q1 Q2 Q3 Q4 Q1 Q2
Six Months Operating IncomeBefore Restructuring(Operating Margin)
6.9%6.5%
2.9%
Quarterly Operating IncomeBefore Restructuring
Operating Income Before Operating Income Before Restructuring CAGR of 59%Restructuring CAGR of 59%
9.8%
2003 2004 2005 2006

Page 38
Intergraph Revenue Percentage by RegionIntergraph Revenue Percentage by Region
Intergraph is a global company with customers in more than 60 countries and over 50% of revenue generated outside the United States
Europe – 31%
United States – 49%
Asia Pacific – 12%
Canada – 5%
ROW – 3%
* Based on Intergraph 2005 Revenue

Page 39
Intergraph Summary HighlightsIntergraph Summary Highlights
We believe Intergraph’s software is highly relevant to the current global environment:– Heightened security concerns and ever-present terrorist threats
– Increased adoption of spatially-enabled/location-aware solutions
– High oil prices and rising global energy demands
We believe Intergraph’s target markets are large and experiencing positive macro economic trends:
– Software & services markets represent more than $3 billion in estimated annual customer spend
– Markets have estimated average blended annual growth rate in 5-10% range
Intergraph’s business transformation efforts have helped produce improved operating performance and a solid financial position:
– 2005 operating income represents compound annual growth rate of 55% from 2003 results
– 2005 operating margins more than doubled over 2003 results
– Strong balance sheet with approximately $248 million in cash & short-term investments as of June 30, 2006
Intergraph’s track record of solid corporate governance illustrated by recent ISS Corporate Governance Quotient of 92+% relative to Russell 3000 index

AppendixAppendix

Page 41
Reconciliation of Operating Income/Margin Before Reconciliation of Operating Income/Margin Before Restructuring to Operating Income/MarginRestructuring to Operating Income/Margin
Operating income before restructuring and operating margin before restructuring are non-GAAP financial measures. They are not intended as substitutes for GAAP financial measures. The Company has provided this supplemental non-GAAP financial information because it provides meaningful information regarding the Company’s results on a consistent and comparable basis for the periods presented. The Company believes investors use this information to evaluate period-to-period results and to understand potential future operating results. The Company encourages investors and other users of this information to review the Company’s financial statements and other information contained within its reports filed with the Securities and Exchange Commission and not to rely on any single financial measure. A reconciliation of the non-GAAP financial measure to the most comparable GAAP measure is set forth on the next slide.

Page 42
Reconciliation of Operating Income/Margin Before Reconciliation of Operating Income/Margin Before Restructuring to Operating Income/MarginRestructuring to Operating Income/Margin(dollars in millions)
Intergraph Annual and Year to Date Results:
Annual Results Six Months Ended June 30,
2003 2004 2005 2003 2004 2005 2006
Operating Income Before Restructuring $17.3 $34.9 $43.6 $7.1 $17.5 $19.4 $28.6
Operating Margin Before Restructuring 3.3% 6.3% 7.6% 2.9% 6.5% 6.9% 9.8%
Restructuring Charges $4.0 $0.8 $11.7 $0.0 $0.8 $3.7 $10.4
Operating Income $13.4 $34.1 $31.9 $7.1 $16.7 $15.7 $18.2
Operating Margin 2.5% 6.2% 5.5% 2.9% 6.2% 5.6% 6.2%
Intergraph Quarterly Results:
2003 2004 2005 2006
Q1 Q2 Q3 Q4 Q1 Q2 Q3 Q4 Q1 Q2 Q3 Q4 Q1 Q2
Operating Income Before Restructuring $4.2 $2.9 $5.5 $4.7 $8.4 $9.2 $7.6 $9.8 $7.6 $11.8 $11.7 $12.5 $10.9 $17.7
Operating Margin Before Restructuring 3.5% 2.2% 4.1% 3.3% 6.3% 6.6% 5.6% 6.7% 5.6% 8.1% 7.8% 8.6% 7.9% 11.6%
Restructuring Charges $0.0 $0.0 $0.0 $4.0 $0.8 $0.0 $0.0 $0.0 $1.7 $2.0 $5.3 $2.7 $4.7 $5.7
Operating Income $4.2 $2.9 $5.5 $0.8 $7.6 $9.2 $7.6 $9.8 $5.9 $9.8 $6.4 $9.8 $6.2 $12.0
Operating Margin 3.5% 2.2% 4.1% 0.5% 5.7% 6.6% 5.6% 6.7% 4.3% 6.7% 4.3% 6.8% 4.5% 7.8%