Embed Size (px)
Citation preview
Sadler Int J Health Geogr (2016) 15:19 DOI 10.1186/s12942-016-0048-6
RESEARCH
Integrating expert knowledge in a GIS to optimize siting decisions for small-scale healthy food retail interventionsRichard Casey Sadler*
Abstract
Background: The availability of healthy foods in a neighborhood remains a key determinant of diet and diet-related disease in disadvantaged communities. Innovative solutions to the ‘food desert’ problem include the deployment of mobile markets and healthy corner store initiatives. Such initiatives, however, do not always capitalize on the princi-ples guiding retail development and the possibilities of GIS-based data. Simultaneously, community partners are not always engaged effectively in the planning for such interventions, which limits acceptability and suitability of such work.
Methods: This paper highlights the results of a participatory mapping exercise to optimize the siting of a planned healthy food retail intervention in Flint, Michigan. Potential sites are chosen by engaging experts in a three-stage mapping process that includes the analytic hierarchy process and point allocation of five key variables (including food access, socioeconomic distress, population density, access to transit, and proximity to neighborhood centers), as well as direct mapping of suitable sites.
Results: Results suggest a discrete set of areas—primarily in the northwestern quadrant of the city—where small-scale healthy food retail interventions might be most strategically located. Areas with the most consistent overlap between directly mapped sites and very high levels of suitability align well with neighborhoods which are distant from existing grocery stores.
Conclusions: As a community-based strategy, this increases the opportunity for effectively improving neighborhood access to healthy foods by optimizing the potential sites for healthy food interventions. Community partners have already been active in using these results in project planning for just such an intervention.
Keywords: Mobile markets, Food deserts, GIS, Expert knowledge, Multi-criteria decision making, Analytic hierarchy process, Public participatory geographic information systems, Community-based participatory research
© 2016 The Author(s). This article is distributed under the terms of the Creative Commons Attribution 4.0 International License (http://creativecommons.org/licenses/by/4.0/), which permits unrestricted use, distribution, and reproduction in any medium, provided you give appropriate credit to the original author(s) and the source, provide a link to the Creative Commons license, and indicate if changes were made. The Creative Commons Public Domain Dedication waiver (http://creativecommons.org/publicdomain/zero/1.0/) applies to the data made available in this article, unless otherwise stated.
BackgroundInadequate consumption of healthy foods such as fruits and vegetables remains a critical factor driving the nation’s health crises around obesity, diabetes, and other diet-related diseases [1, 2]. Research continues to show links between access to and consumption of healthy foods, as well as economic inequalities in access such that poorer neighborhoods have poorer access to
healthy foods [3–5]. This compounding of social and physical inequalities highlights the troublesome depri-vation amplification effect [6], highlighted by research showing that healthy food consumption declines when food security is threatened [7, 8]. Troublesome is that, in spite of programs such as SNAP and Double-Up Food Bucks which are intended to make foods more affordable, when residents lack geographic access to grocery stores and healthy food outlets, they simply cannot reach these stores to purchase healthy foods.
Considerable investment has been made recently in helping traditional food retail return to underserved
Open Access
International Journal of Health Geographics
*Correspondence: [email protected] Department of Family Medicine, Michigan State University, 200 E 1st St, Flint, MI 48502, USA
Page 2 of 13Sadler Int J Health Geogr (2016) 15:19
urban areas [9, 10]. More recent work has advocated more flexible retail endeavors such as food trucks, mobile markets, or convenience store retrofitting due to the lower associated costs [11]. A frequent continu-ing problem of these place-based retail reinvestment decisions lies in a poor spatial conceptualization of risk factors for unhealthy food consumption; in many studies, existing knowledge on healthy food access, socioeconomic distress, and other determinants is not incorporated. Research is therefore needed to build on the evidence base for siting decisions around healthy food retail.
One method for optimizing land use siting deci-sions has been the use of multi-criteria decision making (MCDM). This practice facilitates the incorporation of diverse expert opinions into a coherent framework for suitability analysis of potential sites for investment [12, 13]. Despite its extensive use in land use planning and resource conservation, however, uptake has been slow within the food desert literature. Further, mapping exer-cises exhibiting too steep a learning curve may prevent effective participation by stakeholders [14]. The objective of this research is therefore to use local expert knowledge about social and physical factors that influence healthy food consumption to optimize potential locations for healthy food interventions in socioeconomically dis-tressed neighborhoods in Flint, Michigan.
Small‑scale healthy food retail interventionsInitial interest in food retail interventions arose out of work on food deserts, premised on the idea that retail consolidation has had deleterious effects on the impov-erished communities which were abandoned [15]. Con-siderable investment and research has been dedicated to tracking the impact of new grocery stores on diet and health, but the effects of these investments are not equivocal [16–19]. Researchers have cautioned that the-oretical perspectives focused too heavily on individual behavior change—on which many retail interventions rely—may miscast the problem on the community [20–22], which can create hesitancy among future would-be investors.
In contrast, community-based approaches which engage local partners in planning and implementation of retail interventions may hold considerable opportunity [23]. Such approaches are more sensitive to the reality that ‘silver bullets’ do not exist for behavior change [24], and instead implicitly recognize the need for an alterna-tive that recognizes the interplay between social struc-tures and individual behavior [25]. Community-based work can serve as one such intermediary by increasing awareness of and promoting locations selling healthy food options, which can be critical to supporting adaptive
strategies employed by residents living in food deserts [26, 27]. This pursuit of increasing visibility is particularly important because of the notion that residents in com-munities without supermarkets perceive fewer nutritious food options [27, 28].
Investments in existing corner stores and new mobile markets—hereafter referred to as small-scale healthy food retail (SSHFR) interventions—are twin ideas for addressing community nutrition needs on a smaller scale [29, 30]. Corner stores offer promise because many people routinely visit such stores [31], and they have connected with urban farms to increase retail-based fresh food access [32]. Elsewhere, new markets have been established in food deserts to connect low-income residents to healthy food options [33]. Mobile markets, meanwhile, can integrate local community supported agriculture with a more flexible distribution format that enhances the customer base [34]. Other studies have found increased fruit and vegetable consumption among mobile market shoppers [35], particularly when basic spatial analysis have been used to determine area-specific need [36]. More sophisticated spatial analyses incorporating both low access and low income vari-ables, meanwhile increase the certainty and validity of predictive models for optimal site selection [37].
Expert knowledge and multi‑criteria decision makingThese results suggest that GIS-based methods can be effective at optimizing SSHFR interventions. But to date, expert knowledge of social and physical factors has not been incorporated into the planning for such interventions. Within the land use planning literature, suitability modeling is commonly used to determine optimal sites for development or conservation [38, 39]. Multiple attributes (often defined as categorical varia-bles) are combined through map algebra to suggest the best sites for use, with higher scores indicating greater suitability. Because unweighted sums lack sophistica-tion in important land use planning processes, multi-criteria decision making (MCDM) is used to account for the reality that some variables are more important than others [40].
Variable weights also cannot be arbitrarily assigned; thus, expert knowledge from key stakeholders is a com-mon evidence-based method for assigning weights to variables [41, 42]. Because this weighting so strongly impacts the final results [43], the identification of key community stakeholders and the use of rigorous analyti-cal methods are important for obtaining the best results. Experts have been engaged in the past to not only derive effective results, but also lend expertise to problem iden-tification and study design, especially when they possess local knowledge that content experts may lack [44]. In
Page 3 of 13Sadler Int J Health Geogr (2016) 15:19
that study, local stakeholders were seen as a critical piece of the decision-making process, as their involvement increased the sense of local ownership of the work.
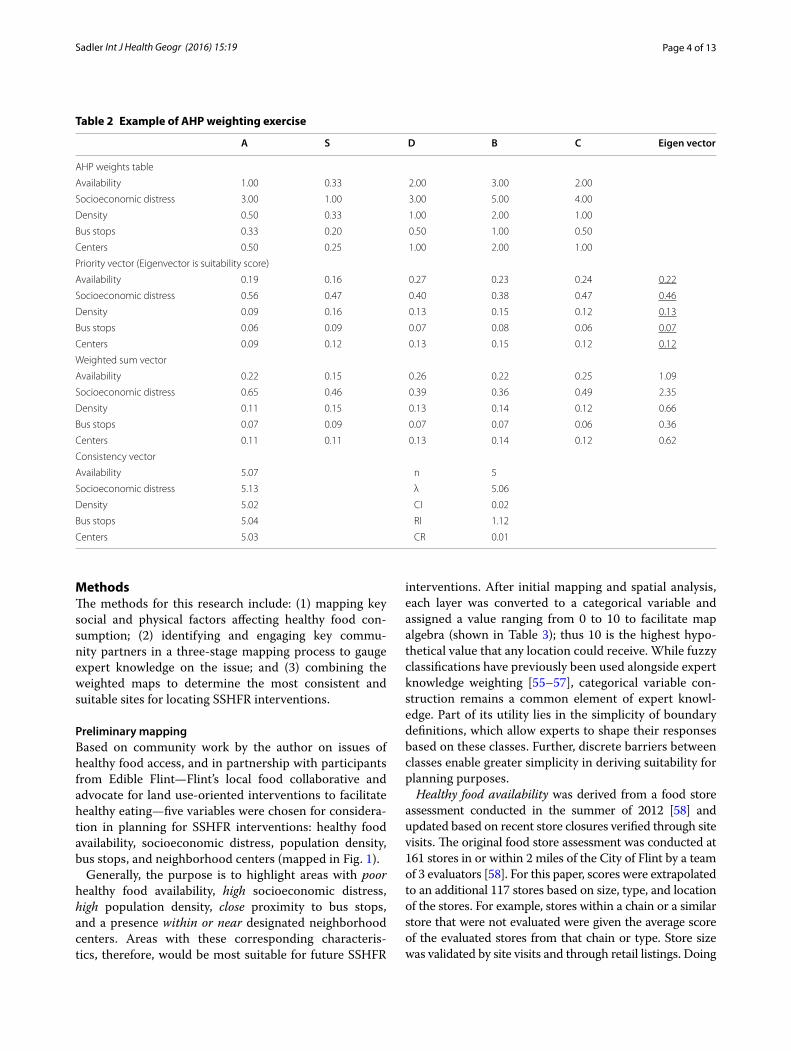
Regarding rigorous methods, the analytic hierarchy process (AHP) is effective at integrating expert opinion into variable weight assignment because of its simple pairwise comparison approach [45]. Experts using AHP simply pit variables against one another in a ‘round-robin’ format, assigning importance scores to the ‘winning’ var-iables on a scale of 1–9 (Table 1).
Pursuant to weight assignment by experts, a reciprocal matrix (A) is constructed:
In this table, aij represents the head-to-head compari-son of attribute i and attribute j, while n represents the total number of attributes. A priority vector is calculated from a normalization of the matrix to derive an eigenvec-tor in which the final weights reside. The final weights assigned by each expert can then be averaged to derive a final composite score [46]. Because of the potential for human error in weight assignment, a weighted sum vec-tor can also be calculated to derive a maximum eigen-value and assign an internal consistency score to each expert’s weights. The calculation for a consistency vector involves a sum of the products of the weighted sum vec-tor and the priority vector (wi), and is given as:
Using the value for λmax, a consistency index (CI) is calculated as:
To determine whether the expert’s weights are inter-nally consistent, a consistency ratio (CR) is computed by dividing CI by a predefined random consistency index
A =
a11 · · · a1n...
. . ....
an1 · · · ann
�max =
∑
i
∑
j
aij ∗ wi
CI =�max− n
n− 1
(RI) which varies by the size of the n × n matrix1 [47]. When the CR is less than 0.1, the individual expert’s weights are considered internally consistent. Function-ally, this means that when inconsistencies arise, the researcher can revisit the weights with the expert to clar-ify unequal weighting.
An example of this process (shown in Table 2) assumes that socioeconomic distress is the most important vari-able, garnering 46 % of the total weighting (all weights are underlined in the eigenvector of the priority vector), with availability (22 %), density (13 %), centers (12 %), and bus stops (7 %) receiving less of the total. These weights are derived from the AHP weights table scored by the hypo-thetical expert: the high scores in the socioeconomic dis-tress row generate the stronger weight for that variable in the priority vector. As noted above, the weighted sum vector is used to generate a consistency vector. The CR score of 0.01 indicates that this vector is internally con-sistent. This process is applied similarly regardless of the variables used, as the task of the expert is simply to apply comparative weights to the variables under consideration.
Because of the need for evidence-based metrics to define optimal sites for SSHFR interventions, for this paper AHP is incorporated into a multi-stage expert opinion participatory GIS exercise. This approach pro-vides an analytical method for incorporating commu-nity knowledge to inform spatial decision-making in an impending SSHFR intervention.
Study areaThis approach is particularly valuable in Flint, Michi-gan, because a long history of retail disinvestment and a more recent public health emergency around lead in drinking water have spurred increasingly urgent dis-cussion about SSHFR options to address nutritional needs [48]. Flint’s food retail network is at an advanced stage of consolidation. Beginning in the late 1960s with the passage of a Fair Housing Ordinance, and accelerat-ing with severe deindustrialization due to layoffs by the city’s former primary employer—General Motors—white and later middle class flight has cut the city population in half [49–52]. Since 2012, the Flint urban area has lost six grocery stores, including five chains. Even so, many organizations are active in alternative strategies to pro-vide nutritious foods, including through urban garden-ing, farmers’ markets, nutrition education, and expansion of food assistance programs [53, 54]. The approach taken in this paper is intended to provide an evidence base for these and other community organizations to build upon in planning for SSHFR interventions.
1 In the current study, the random consistency index is 1.12, based on n = 5 variables.
Table 1 Scale used for pairwise comparisons in the ana-lytic hierarchy process
Intensity of importance Definition
1 Equal importance
3 Moderately more important
5 Strongly more important
7 Very strongly more important
9 Extremely more important
2, 4, 6, 8 Intermediate values
Page 4 of 13Sadler Int J Health Geogr (2016) 15:19
MethodsThe methods for this research include: (1) mapping key social and physical factors affecting healthy food con-sumption; (2) identifying and engaging key commu-nity partners in a three-stage mapping process to gauge expert knowledge on the issue; and (3) combining the weighted maps to determine the most consistent and suitable sites for locating SSHFR interventions.
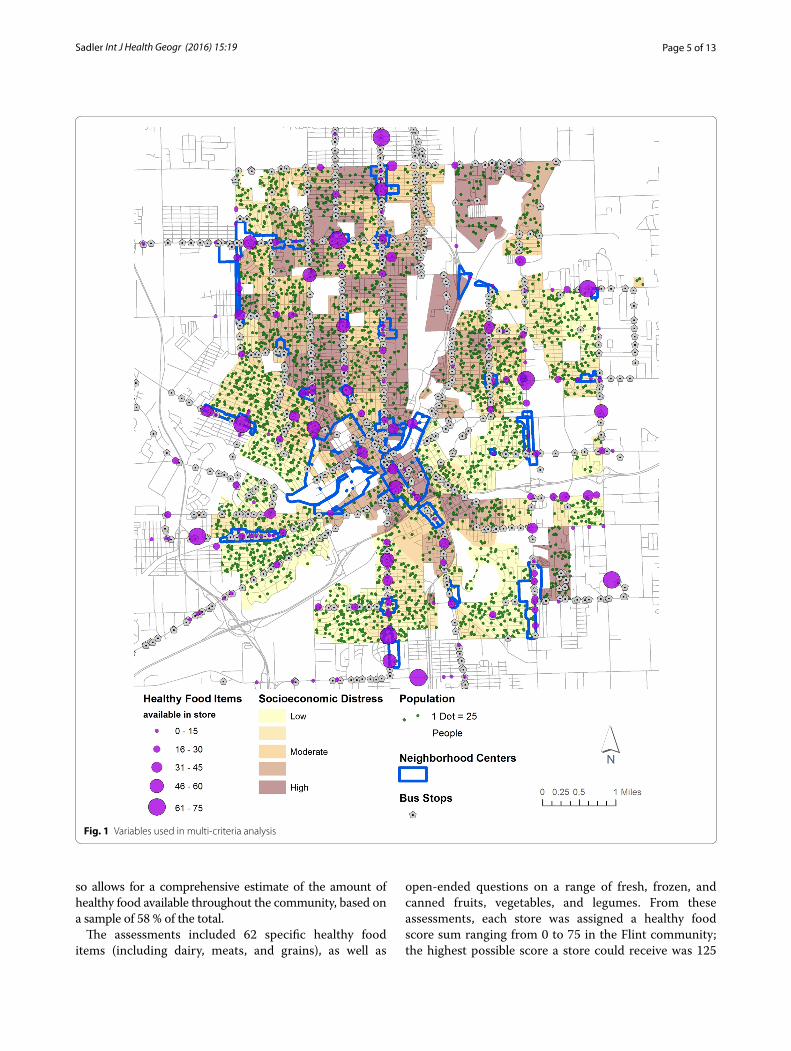
Preliminary mappingBased on community work by the author on issues of healthy food access, and in partnership with participants from Edible Flint—Flint’s local food collaborative and advocate for land use-oriented interventions to facilitate healthy eating—five variables were chosen for considera-tion in planning for SSHFR interventions: healthy food availability, socioeconomic distress, population density, bus stops, and neighborhood centers (mapped in Fig. 1).
Generally, the purpose is to highlight areas with poor healthy food availability, high socioeconomic distress, high population density, close proximity to bus stops, and a presence within or near designated neighborhood centers. Areas with these corresponding characteris-tics, therefore, would be most suitable for future SSHFR
interventions. After initial mapping and spatial analysis, each layer was converted to a categorical variable and assigned a value ranging from 0 to 10 to facilitate map algebra (shown in Table 3); thus 10 is the highest hypo-thetical value that any location could receive. While fuzzy classifications have previously been used alongside expert knowledge weighting [55–57], categorical variable con-struction remains a common element of expert knowl-edge. Part of its utility lies in the simplicity of boundary definitions, which allow experts to shape their responses based on these classes. Further, discrete barriers between classes enable greater simplicity in deriving suitability for planning purposes.
Healthy food availability was derived from a food store assessment conducted in the summer of 2012 [58] and updated based on recent store closures verified through site visits. The original food store assessment was conducted at 161 stores in or within 2 miles of the City of Flint by a team of 3 evaluators [58]. For this paper, scores were extrapolated to an additional 117 stores based on size, type, and location of the stores. For example, stores within a chain or a similar store that were not evaluated were given the average score of the evaluated stores from that chain or type. Store size was validated by site visits and through retail listings. Doing
Table 2 Example of AHP weighting exercise
A S D B C Eigen vector
AHP weights table
Availability 1.00 0.33 2.00 3.00 2.00
Socioeconomic distress 3.00 1.00 3.00 5.00 4.00
Density 0.50 0.33 1.00 2.00 1.00
Bus stops 0.33 0.20 0.50 1.00 0.50
Centers 0.50 0.25 1.00 2.00 1.00
Priority vector (Eigenvector is suitability score)
Availability 0.19 0.16 0.27 0.23 0.24 0.22
Socioeconomic distress 0.56 0.47 0.40 0.38 0.47 0.46
Density 0.09 0.16 0.13 0.15 0.12 0.13
Bus stops 0.06 0.09 0.07 0.08 0.06 0.07
Centers 0.09 0.12 0.13 0.15 0.12 0.12
Weighted sum vector
Availability 0.22 0.15 0.26 0.22 0.25 1.09
Socioeconomic distress 0.65 0.46 0.39 0.36 0.49 2.35
Density 0.11 0.15 0.13 0.14 0.12 0.66
Bus stops 0.07 0.09 0.07 0.07 0.06 0.36
Centers 0.11 0.11 0.13 0.14 0.12 0.62
Consistency vector
Availability 5.07 n 5
Socioeconomic distress 5.13 λ 5.06
Density 5.02 CI 0.02
Bus stops 5.04 RI 1.12
Centers 5.03 CR 0.01
Page 5 of 13Sadler Int J Health Geogr (2016) 15:19
so allows for a comprehensive estimate of the amount of healthy food available throughout the community, based on a sample of 58 % of the total.
The assessments included 62 specific healthy food items (including dairy, meats, and grains), as well as
open-ended questions on a range of fresh, frozen, and canned fruits, vegetables, and legumes. From these assessments, each store was assigned a healthy food score sum ranging from 0 to 75 in the Flint community; the highest possible score a store could receive was 125
Fig. 1 Variables used in multi-criteria analysis
Page 6 of 13Sadler Int J Health Geogr (2016) 15:19
(based on the total number of unique items available). For visualization purposes in Fig. 2, a score of at least 50 was considered adequate to represent a small gro-cery store (based on common characteristics of these stores. A kernel density surface was calculated (as in past research) to show the relative availability of healthy foods in the study area [59]. Finally, the surface of availability was converted to five categories by equal interval—a clas-sification scheme shown to perform better than others (e.g. quantiles) when considering a narrow range of val-ues [60]. Areas with poorer food availability scores thus received higher suitability scores (Table 3); the use of equal interval categories meant a clearer representation of ‘poor access’ areas than a quantile classification would have provided. In particular, this dataset builds on previ-ous contributions such as Widener et al.’s [37, 61] because a comprehensive view of healthy food availability can be integrated into the spatial model.
Socioeconomic distress was derived from four census block group (CBG) level variables [62] which together serve as a proxy for material and social deprivation. An unweighted z-score sum was computed from rates of low educational attainment, unemployment, poverty, and lone parenthood (as created in Pampalon et al., and used for this study area in Sadler et al.) [63, 64]. The z-score sums
were divided into five quantiles and scores were assigned based on the category of socioeconomic distress, with more distressed CBGs receiving higher suitability scores under the presumption that disadvantaged neighborhoods required more attention from SSHFR interventions.
Population density was derived by calculating the num-ber of people per square mile within each CBG. Thresh-olds were chosen by dividing the CBGs into quintiles. CBGs with higher population densities received higher suitability scores. This assignment reflects the need for a SSHFR to serve as many people as possible to be success-ful financial and socially.
Proximity to bus stops was calculated by running net-work analysis in increments of 1/8 mile (1/8, 1/4, 3/8, 1/2), reflecting commonly used thresholds for walking zones around bus stops2 [65, 66]. Zones closer to bus stops were given higher suitability scores, under the assumption that patrons visiting new SSHFR would want to economize on distance travelled.
Presence within or near designated neighborhood cent-ers addresses the city’s new master plan, which specifi-cally enumerates key zones for commercial uses [67]. While food trucks/mobile markets are allowed by right in many residential zones, other food retail uses are allowed only within commercial zones. Some variances might be granted on properties near commercial zones, so the classification for this categorical variable reflects this possibility (Table 2). Neighborhood centers are also located at visible focal points in the community; thus, a SSHFR would generally be more likely to succeed here.
Engaging community partnersWith the initial mapping layers computed, the next step involved engaging key community partners with expert knowledge on food access issues. The motivation behind engaging these partners comes from two related but often unconnected perspectives: public participatory GIS (PPGIS) and community-based participatory research (CBPR). PPGIS was popularized as such in 1996 as the growth of computer-based mapping systems lowered the barriers to such work, and from the need to integrate public and expert involvement in spatial decision-making processes [68]. CBPR has a longer history—growing from Lewin’s mid-20th century participatory action research—and aims to address social inequalities and achieve social change by combining community knowledge with action [69–71]. Despite their co-existence over the past 20 years, very little work has explicitly approached
2 For example, Neilson and Fowler [65] found 90 % of all transit riders trav-elled less than 1/2 mile from their point of departure, while transit use for destinations within 1/8 mile was 3 times greater than for 1/4 mile. Unter-mann [66] likewise used 1/4 mile as a walking threshold.
Table 3 Summary of variables used in survey
Variable Score Category
Healthy food availability 10 Worst availability
8 2nd worst availability
5 Average availability
2 2nd best availability
0 Best availability
Socioeconomic distress 10 Most distressed quintile
8 2nd most distressed quintile
5 Average distress quintile
2 2nd least distressed quintile
0 Least distressed quintile
Population density 10 Densest quintile
8 2nd densest quintile
5 Middle quintile
2 2nd least dense quintile
0 Least dense quintile
Proximity to bus stops 10 1/8 mile
8 1/4 mile
5 3/8 mile
2 1/2 mile
0 >1/2 mile
Neighborhood centers 10 In center
5 Within 1/4 mile
0 >1/4 mile
Page 7 of 13Sadler Int J Health Geogr (2016) 15:19
the idea of reducing health inequalities by using PPGIS with a CBPR approach, with the earliest work occurring in the last decade [72] and fewer than two dozen articles written on the nexus overall. In a related vein, work on
volunteered geographic information (VGI) and the ‘wiki-fication of GIS’ has likewise proliferated in recent years, as the public is increasingly able to contribute to map-ping exercises [73–75]. The distinction between CBPR
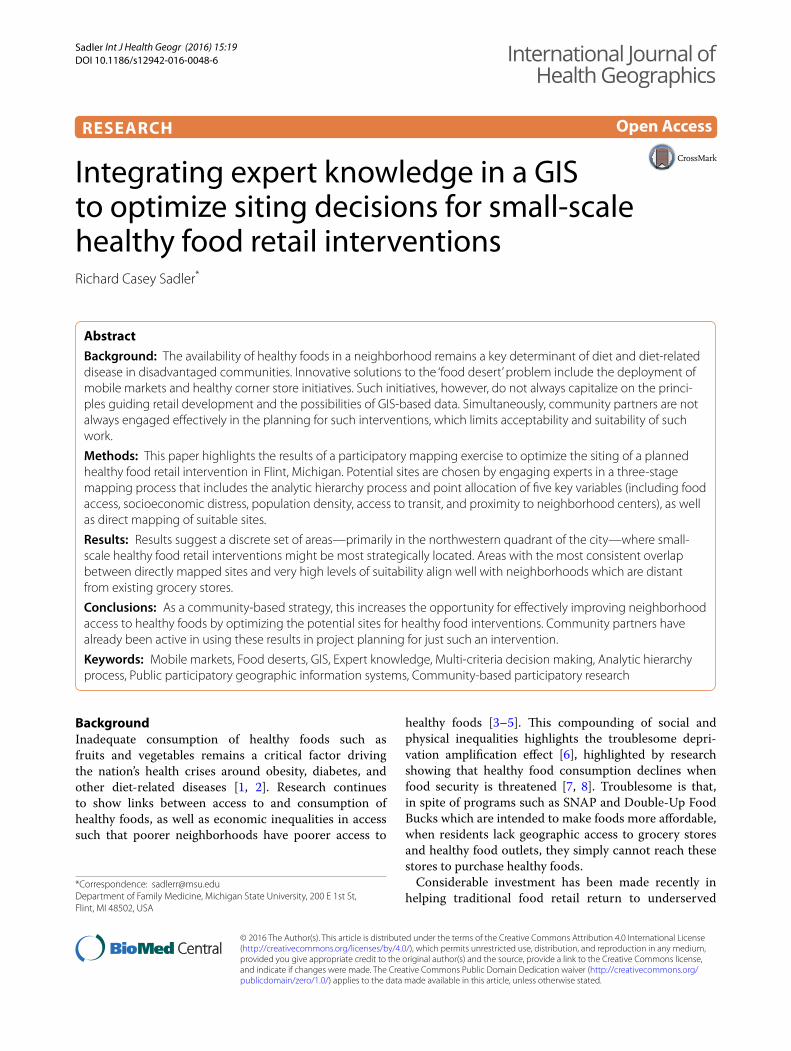
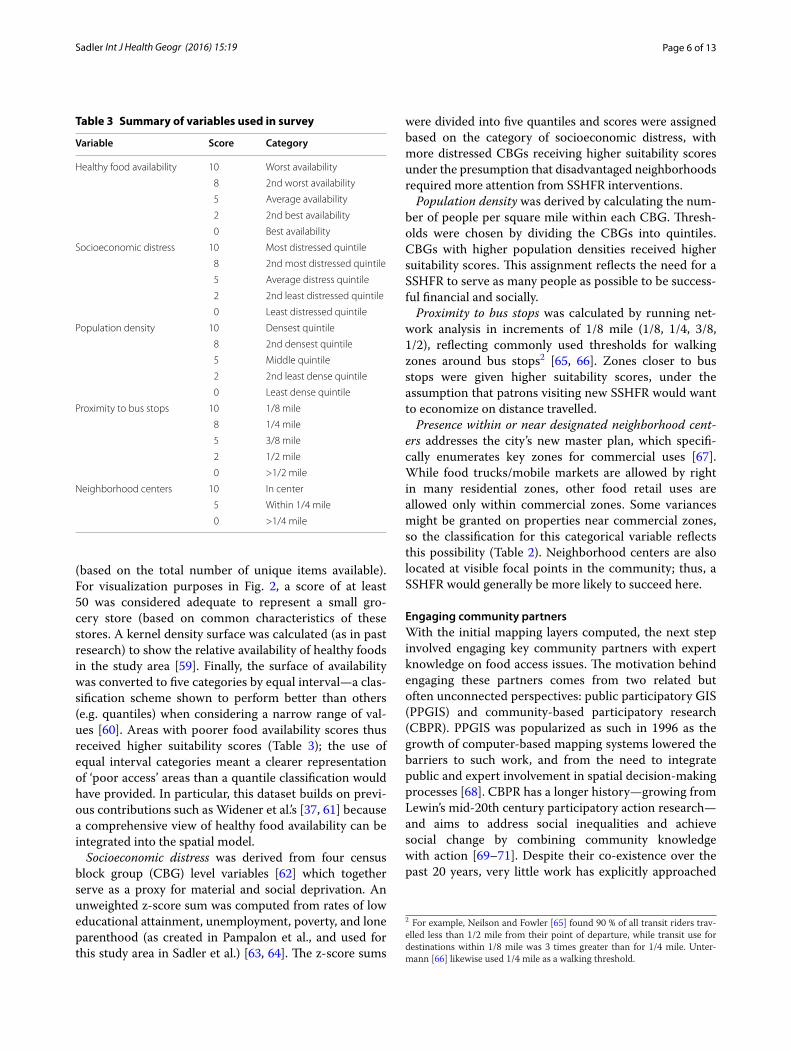
Fig. 2 Composite suitability map of AHP and PA with overlapping directly mapped sites
Page 8 of 13Sadler Int J Health Geogr (2016) 15:19
and VGI or wikified GIS may seem semantic, but explic-itly adopting CBPR as the theoretical framework carries with it a clearer connotation to community-engaged and community-led research. In contrast, VGI and wikified GIS do not explicitly require community engagement at all stages of a project. Even so, the overlaps in methodol-ogy and theoretical orientation offer an opportunity for deeper inquiry in the future.
Combining PPGIS with CBPR means that commu-nity partners were engaged at all stages of the process, including tool design, expert input, and interpretation of results. In consultation with community partner Edible Flint, a list of 11 experts was compiled from anti-hunger and local food organizations, as well as local foundation contacts with some stake in healthy eating initiatives. All partners are motivated by the same basic goal, and are already active in efforts to bring SSHFR or programs to underserved neighborhoods. Given the focus of this work on ameliorating community food insecurity, these part-ners represented the breadth of experts on this subject within the community, and are thus well-suited to this exercise. Experts were contacted with a request to par-ticipate in a three-stage participatory mapping exercise, and the author met with each individually. The structure of this exercise was partially derived from earlier research on natural resource conservation planning [38].
In the first stage, experts evaluated the relative impor-tance of the five variables directly against one another using the AHP method. Experts chose between each variable, and assigned a score indicating how much more important one variable was versus another. The sec-ond stage involved a point allocation (PA), whereby the experts doled out 100 total points to the 5 variables. This provided the experts with a second look at the variables overall and enabled an alternative method of assigning weights. Given that many experts also had keen knowl-edge of specific communities, direct mapping constituted the third component of the exercise. Experts were invited to mark anywhere they felt SSHFR would be of value. Experts did not see the results of the AHP/PA exercise prior to the direct mapping; thus, their opinions on this exercise were not influenced by the results of the AHP/PA. Throughout the process, experts were encouraged to ask clarifying questions and make any additional com-ments, especially regarding how to improve the strategy for optimizing locations for SSHFR.
Combining dataOnce data collection was completed, AHP results were inserted into individual matrices to derive weights and
ensure the CR was below the upper threshold of 0.1. AHP results were then compared to the PA results to determine cross-method consistency within variables and among experts. Using the values from the prelimi-nary mapping (Table 2), the AHP and PA weights for each variable were assigned to generate suitability lay-ers. A third suitability layer was constructed by digitiz-ing and overlaying each expert’s direct mapping results. This process enabled the determination of the most suitable and consistent sites for locating new SSHFR interventions.
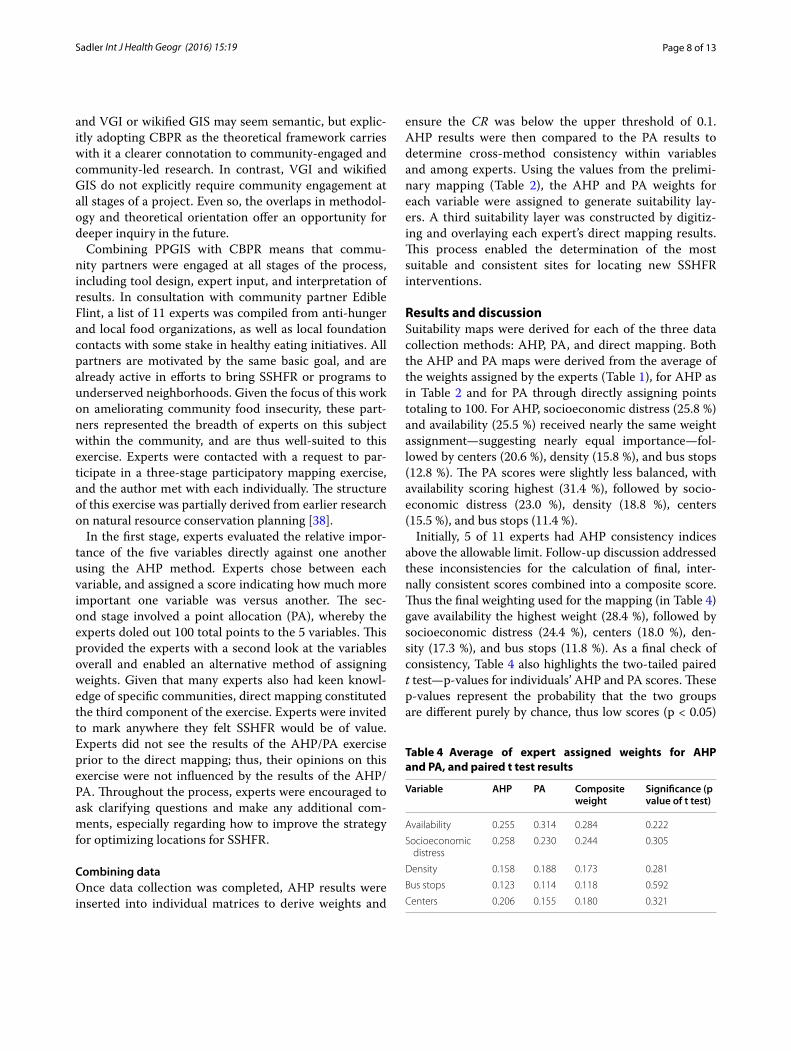
Results and discussionSuitability maps were derived for each of the three data collection methods: AHP, PA, and direct mapping. Both the AHP and PA maps were derived from the average of the weights assigned by the experts (Table 1), for AHP as in Table 2 and for PA through directly assigning points totaling to 100. For AHP, socioeconomic distress (25.8 %) and availability (25.5 %) received nearly the same weight assignment—suggesting nearly equal importance—fol-lowed by centers (20.6 %), density (15.8 %), and bus stops (12.8 %). The PA scores were slightly less balanced, with availability scoring highest (31.4 %), followed by socio-economic distress (23.0 %), density (18.8 %), centers (15.5 %), and bus stops (11.4 %).
Initially, 5 of 11 experts had AHP consistency indices above the allowable limit. Follow-up discussion addressed these inconsistencies for the calculation of final, inter-nally consistent scores combined into a composite score. Thus the final weighting used for the mapping (in Table 4) gave availability the highest weight (28.4 %), followed by socioeconomic distress (24.4 %), centers (18.0 %), den-sity (17.3 %), and bus stops (11.8 %). As a final check of consistency, Table 4 also highlights the two-tailed paired t test—p-values for individuals’ AHP and PA scores. These p-values represent the probability that the two groups are different purely by chance, thus low scores (p < 0.05)
Table 4 Average of expert assigned weights for AHP and PA, and paired t test results
Variable AHP PA Composite weight
Significance (p value of t test)
Availability 0.255 0.314 0.284 0.222
Socioeconomic distress
0.258 0.230 0.244 0.305
Density 0.158 0.188 0.173 0.281
Bus stops 0.123 0.114 0.118 0.592
Centers 0.206 0.155 0.180 0.321
Page 9 of 13Sadler Int J Health Geogr (2016) 15:19
represent significant difference. High scores therefore signify that the AHP-derived weights and the PA-derived weights are not significantly different from one another.
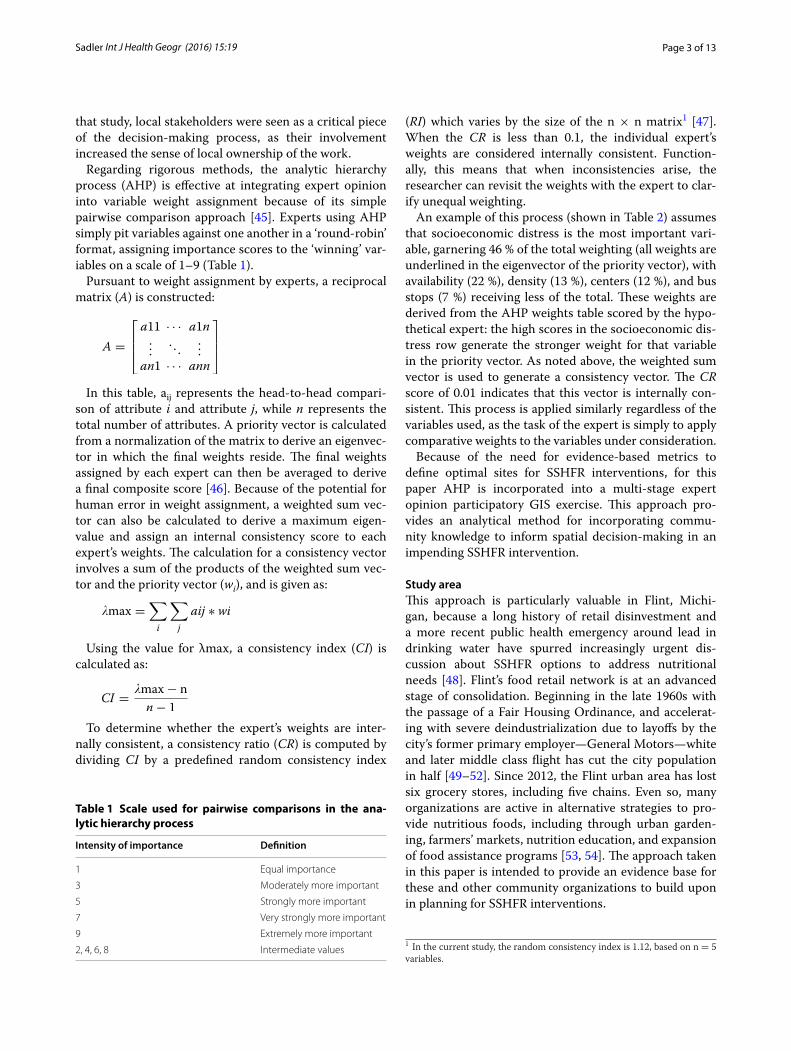
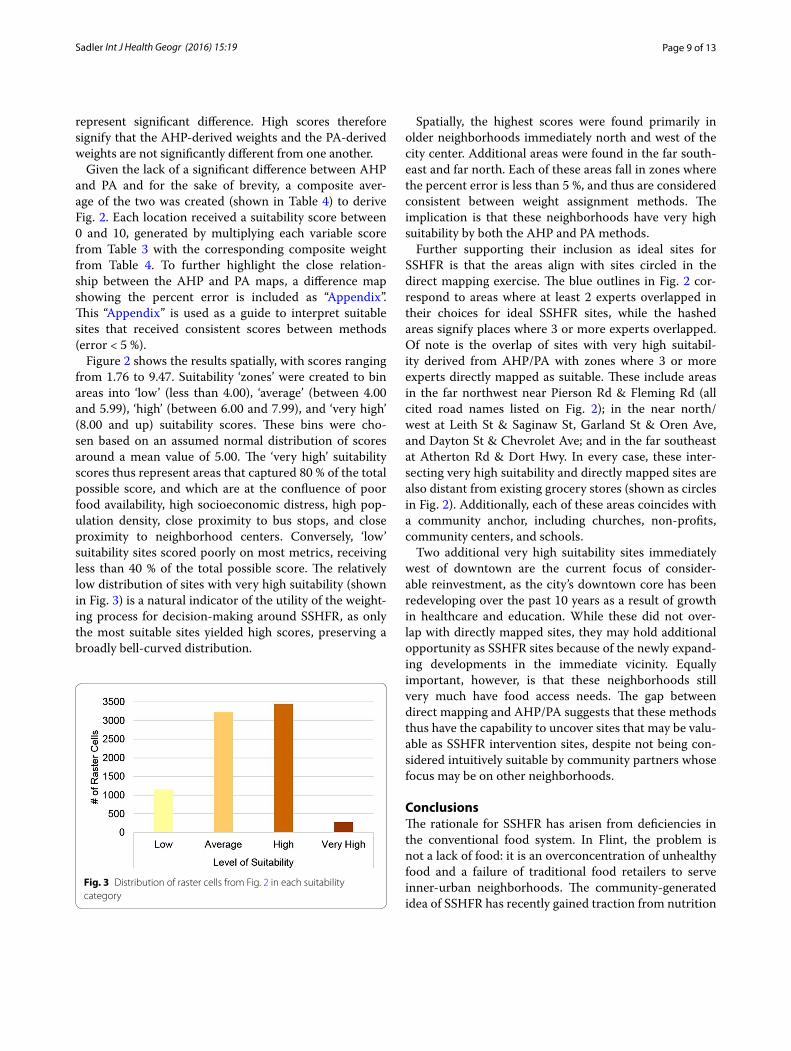
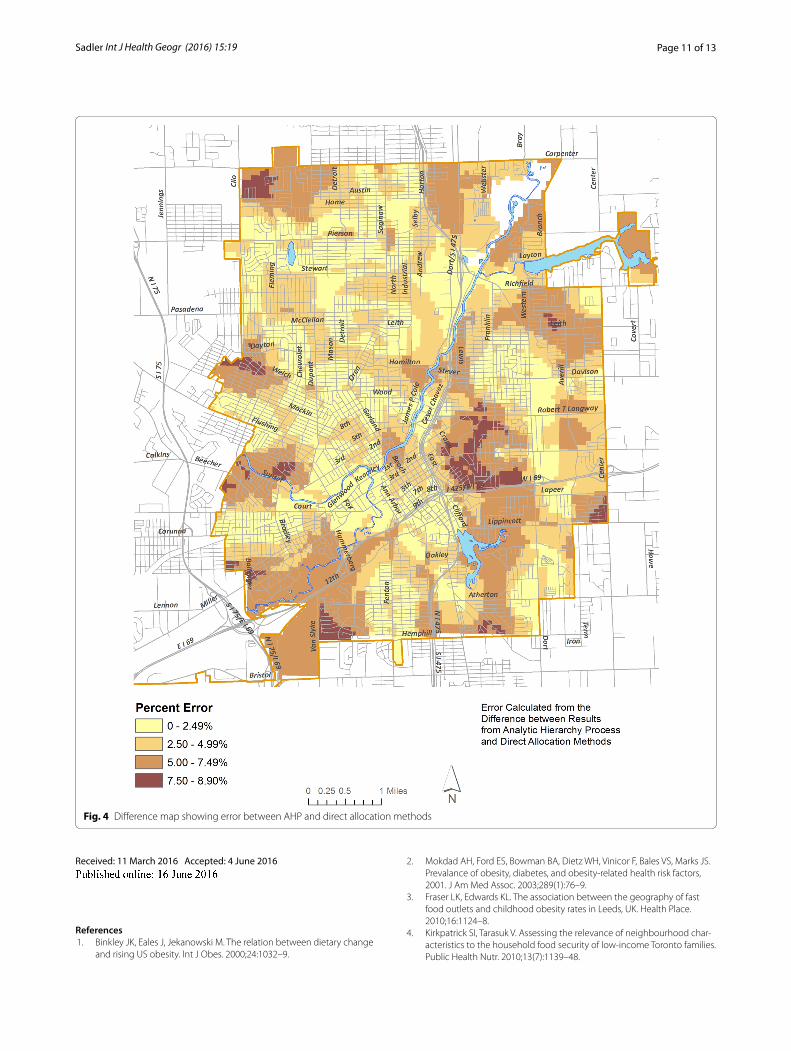
Given the lack of a significant difference between AHP and PA and for the sake of brevity, a composite aver-age of the two was created (shown in Table 4) to derive Fig. 2. Each location received a suitability score between 0 and 10, generated by multiplying each variable score from Table 3 with the corresponding composite weight from Table 4. To further highlight the close relation-ship between the AHP and PA maps, a difference map showing the percent error is included as “Appendix”. This “Appendix” is used as a guide to interpret suitable sites that received consistent scores between methods (error < 5 %).
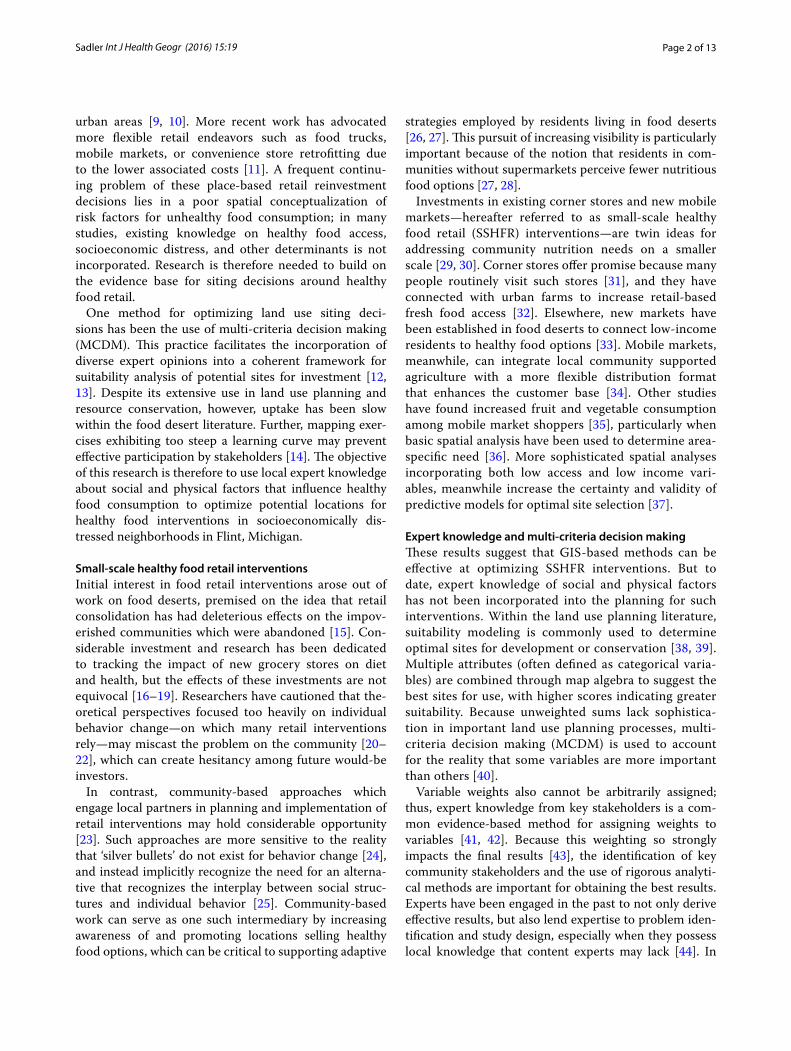
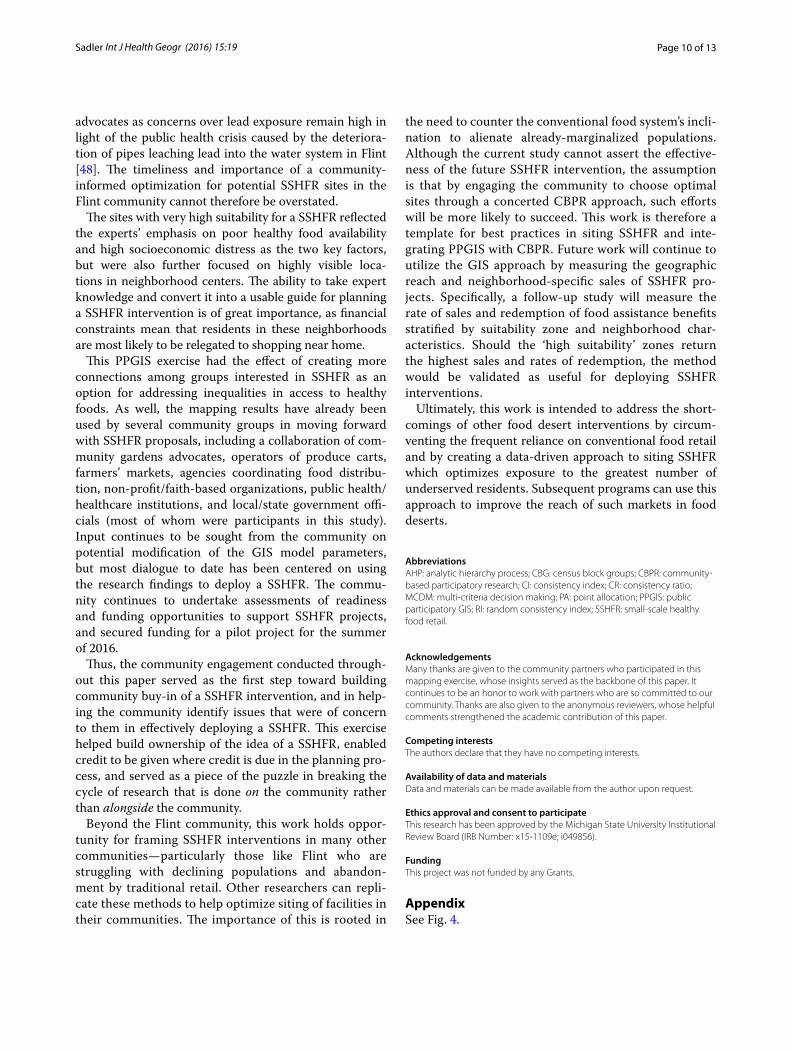
Figure 2 shows the results spatially, with scores ranging from 1.76 to 9.47. Suitability ‘zones’ were created to bin areas into ‘low’ (less than 4.00), ‘average’ (between 4.00 and 5.99), ‘high’ (between 6.00 and 7.99), and ‘very high’ (8.00 and up) suitability scores. These bins were cho-sen based on an assumed normal distribution of scores around a mean value of 5.00. The ‘very high’ suitability scores thus represent areas that captured 80 % of the total possible score, and which are at the confluence of poor food availability, high socioeconomic distress, high pop-ulation density, close proximity to bus stops, and close proximity to neighborhood centers. Conversely, ‘low’ suitability sites scored poorly on most metrics, receiving less than 40 % of the total possible score. The relatively low distribution of sites with very high suitability (shown in Fig. 3) is a natural indicator of the utility of the weight-ing process for decision-making around SSHFR, as only the most suitable sites yielded high scores, preserving a broadly bell-curved distribution.
Spatially, the highest scores were found primarily in older neighborhoods immediately north and west of the city center. Additional areas were found in the far south-east and far north. Each of these areas fall in zones where the percent error is less than 5 %, and thus are considered consistent between weight assignment methods. The implication is that these neighborhoods have very high suitability by both the AHP and PA methods.
Further supporting their inclusion as ideal sites for SSHFR is that the areas align with sites circled in the direct mapping exercise. The blue outlines in Fig. 2 cor-respond to areas where at least 2 experts overlapped in their choices for ideal SSHFR sites, while the hashed areas signify places where 3 or more experts overlapped. Of note is the overlap of sites with very high suitabil-ity derived from AHP/PA with zones where 3 or more experts directly mapped as suitable. These include areas in the far northwest near Pierson Rd & Fleming Rd (all cited road names listed on Fig. 2); in the near north/west at Leith St & Saginaw St, Garland St & Oren Ave, and Dayton St & Chevrolet Ave; and in the far southeast at Atherton Rd & Dort Hwy. In every case, these inter-secting very high suitability and directly mapped sites are also distant from existing grocery stores (shown as circles in Fig. 2). Additionally, each of these areas coincides with a community anchor, including churches, non-profits, community centers, and schools.
Two additional very high suitability sites immediately west of downtown are the current focus of consider-able reinvestment, as the city’s downtown core has been redeveloping over the past 10 years as a result of growth in healthcare and education. While these did not over-lap with directly mapped sites, they may hold additional opportunity as SSHFR sites because of the newly expand-ing developments in the immediate vicinity. Equally important, however, is that these neighborhoods still very much have food access needs. The gap between direct mapping and AHP/PA suggests that these methods thus have the capability to uncover sites that may be valu-able as SSHFR intervention sites, despite not being con-sidered intuitively suitable by community partners whose focus may be on other neighborhoods.
ConclusionsThe rationale for SSHFR has arisen from deficiencies in the conventional food system. In Flint, the problem is not a lack of food: it is an overconcentration of unhealthy food and a failure of traditional food retailers to serve inner-urban neighborhoods. The community-generated idea of SSHFR has recently gained traction from nutrition
Fig. 3 Distribution of raster cells from Fig. 2 in each suitability category
Page 10 of 13Sadler Int J Health Geogr (2016) 15:19
advocates as concerns over lead exposure remain high in light of the public health crisis caused by the deteriora-tion of pipes leaching lead into the water system in Flint [48]. The timeliness and importance of a community-informed optimization for potential SSHFR sites in the Flint community cannot therefore be overstated.
The sites with very high suitability for a SSHFR reflected the experts’ emphasis on poor healthy food availability and high socioeconomic distress as the two key factors, but were also further focused on highly visible loca-tions in neighborhood centers. The ability to take expert knowledge and convert it into a usable guide for planning a SSHFR intervention is of great importance, as financial constraints mean that residents in these neighborhoods are most likely to be relegated to shopping near home.
This PPGIS exercise had the effect of creating more connections among groups interested in SSHFR as an option for addressing inequalities in access to healthy foods. As well, the mapping results have already been used by several community groups in moving forward with SSHFR proposals, including a collaboration of com-munity gardens advocates, operators of produce carts, farmers’ markets, agencies coordinating food distribu-tion, non-profit/faith-based organizations, public health/healthcare institutions, and local/state government offi-cials (most of whom were participants in this study). Input continues to be sought from the community on potential modification of the GIS model parameters, but most dialogue to date has been centered on using the research findings to deploy a SSHFR. The commu-nity continues to undertake assessments of readiness and funding opportunities to support SSHFR projects, and secured funding for a pilot project for the summer of 2016.
Thus, the community engagement conducted through-out this paper served as the first step toward building community buy-in of a SSHFR intervention, and in help-ing the community identify issues that were of concern to them in effectively deploying a SSHFR. This exercise helped build ownership of the idea of a SSHFR, enabled credit to be given where credit is due in the planning pro-cess, and served as a piece of the puzzle in breaking the cycle of research that is done on the community rather than alongside the community.
Beyond the Flint community, this work holds oppor-tunity for framing SSHFR interventions in many other communities—particularly those like Flint who are struggling with declining populations and abandon-ment by traditional retail. Other researchers can repli-cate these methods to help optimize siting of facilities in their communities. The importance of this is rooted in
the need to counter the conventional food system’s incli-nation to alienate already-marginalized populations. Although the current study cannot assert the effective-ness of the future SSHFR intervention, the assumption is that by engaging the community to choose optimal sites through a concerted CBPR approach, such efforts will be more likely to succeed. This work is therefore a template for best practices in siting SSHFR and inte-grating PPGIS with CBPR. Future work will continue to utilize the GIS approach by measuring the geographic reach and neighborhood-specific sales of SSHFR pro-jects. Specifically, a follow-up study will measure the rate of sales and redemption of food assistance benefits stratified by suitability zone and neighborhood char-acteristics. Should the ‘high suitability’ zones return the highest sales and rates of redemption, the method would be validated as useful for deploying SSHFR interventions.
Ultimately, this work is intended to address the short-comings of other food desert interventions by circum-venting the frequent reliance on conventional food retail and by creating a data-driven approach to siting SSHFR which optimizes exposure to the greatest number of underserved residents. Subsequent programs can use this approach to improve the reach of such markets in food deserts.
AbbreviationsAHP: analytic hierarchy process; CBG: census block groups; CBPR: community-based participatory research; CI: consistency index; CR: consistency ratio; MCDM: multi-criteria decision making; PA: point allocation; PPGIS: public participatory GIS; RI: random consistency index; SSHFR: small-scale healthy food retail.
AcknowledgementsMany thanks are given to the community partners who participated in this mapping exercise, whose insights served as the backbone of this paper. It continues to be an honor to work with partners who are so committed to our community. Thanks are also given to the anonymous reviewers, whose helpful comments strengthened the academic contribution of this paper.
Competing interestsThe authors declare that they have no competing interests.
Availability of data and materialsData and materials can be made available from the author upon request.
Ethics approval and consent to participateThis research has been approved by the Michigan State University Institutional Review Board (IRB Number: x15-1109e; i049856).
FundingThis project was not funded by any Grants.
AppendixSee Fig. 4.
Page 11 of 13Sadler Int J Health Geogr (2016) 15:19
Received: 11 March 2016 Accepted: 4 June 2016
References 1. Binkley JK, Eales J, Jekanowski M. The relation between dietary change
and rising US obesity. Int J Obes. 2000;24:1032–9.
2. Mokdad AH, Ford ES, Bowman BA, Dietz WH, Vinicor F, Bales VS, Marks JS. Prevalance of obesity, diabetes, and obesity-related health risk factors, 2001. J Am Med Assoc. 2003;289(1):76–9.
3. Fraser LK, Edwards KL. The association between the geography of fast food outlets and childhood obesity rates in Leeds, UK. Health Place. 2010;16:1124–8.
4. Kirkpatrick SI, Tarasuk V. Assessing the relevance of neighbourhood char-acteristics to the household food security of low-income Toronto families. Public Health Nutr. 2010;13(7):1139–48.
Fig. 4 Difference map showing error between AHP and direct allocation methods
Page 12 of 13Sadler Int J Health Geogr (2016) 15:19
5. Morland KB, Evenson KR. Obesity prevalence and the local food environ-ment. Health Place. 2009;15:491–5.
6. Macintyre S. Deprivation amplification revisited; or, is it always true that poorer places have poorer access to resources for healthy diets and physical activity? Int J Behav Nutr Phys Act. 2007;4(32).
7. Dixon J, Omwega AM, Friel S, Burns C, Donati K, Carlisle R. The health equity dimensions of urban food systems. J Urban Health. 2007;84(1):118–29.
8. Kendall A, Olson CM, Frongillo EA. Relationship of hunger and food insecurity to food availability and consumption. J Am Diet Assoc. 1996;96(10):1019–24.
9. Donald B. Food retail and access after the crash: rethinking the food desert problem. J Econ Geogr. 2013;13(2):231–7.
10. Karpyn A, Young C, Weiss S. Reestablishing healthy food retail: changing the landscape of food deserts. Child Obes Former Obes Weight Manag. 2012;8(1):28–30.
11. Zepeda L, Reznickova A, Lohr L. Overcoming challenges to effectiveness of mobile markets in US food deserts. Appetite. 2014;79:58–67.
12. Store R, Kangas J. Integrating spatial multi-criteria evaluation and expert knowledge for GIS-based habitat suitability modeling. Landscape Urban Plan. 2001;55:79–93.
13. Strager MP, Rosenberger RS. Incorporating stakeholder preferences for land conservation: weights and measures in spatial MCA. Ecol Econ. 2006;58(1):79–92.
14. Anderson C, Beazley K, Boxall J. Lessons for PPGIS from the application of a decision-support tool in the Nova Forest Alliance of Nova Scotia, Canada. J Environ Manag. 2009;90(6):2081–9.
15. Bedore M. Geographies of capital formation and rescaling: a historical-geographical approach to the food desert problem. Can Geogr. 2013;57(2):133–53.
16. Cheadle A, Samuels SE, Rauzon S, Yoshida SC, Schwartz PM, Boyle M, Beery WL, Craypo L, Solomon L. Approaches to measuring the extent and impact of environmental change in three california community-level obesity prevention initiatives. Am J Public Health. 2010;100(11):2129–36.
17. Cummins S, Flint E, Matthews SA. New neighborhood grocery store increased awareness of food access but did not alter dietary habits or obesity. Health Aff. 2014;33(2):283–91.
18. Cummins S, Petticrew M, Higgins C, Findlay A, Sparks L. Large scale food retailing as an intervention for diet and health: quasi-experimental evaluation of a natural experiment. J Epidemiol Community Health. 2005;59:1035–40.
19. Wrigley N, Warm D, Margetts B, Whelan A. Assessing the impact of improved retail access on diet in a ‘food desert”: a preliminary report. Urban Stud. 2002;39(11):2061–82.
20. Dowler E, Caraher M. Local food projects: the new philanthropy? Polit Q. 2003;74(1):57–65.
21. Neff RA, Palmer AM, McKenzie SE, Lawrence RS. Food systems and public health disparities. J Hunger Environ Nutr. 2009;4:282–314.
22. Sadler RC, Gilliland JA, Arku G. Theoretical issues in the ‘food desert’ debate and ways forward. GeoJournal. 2015;81(3):443–55.
23. Story M, Kaphingst KM, Robinson-O’Brien R, Glanz K. Creating healthy food and eating environments: policy and environmental approaches. Annu Rev Public Health. 2008;29:253–72.
24. Algazy J, Gipstein S, Riahi F, Tryon K. Why governments must lead the fight against obesity. Medicine. 2009;361(23):2252–60.
25. Khan F. Combating obesity through the built environment: is there a clear path to success? Public Health Reform. 2011;39(3):387–93.
26. Freedman DA, Bell BA. Access to healthful foods among an urban food insecure population: perceptions versus reality. J Urban Health. 2009;86(6):825–38.
27. Tach L, Amorim M. Constrained, convenient, and symbolic consump-tion: neighborhood food environments and economic coping strategies among the urban poor. J Urban Health. 2015;92(5):815–34.
28. Moore LV, Diez-Roux AV, Brines S. Comparing perception-based and geographic information system (GIS)-based characteristics of the local food environment. J Urban Health. 2008;85(2):206–16.
29. Bodor JN, Rose D, Farley TA, Swalm C, Scott SK. Neighbourhood fruit and vegetable availability and consumption: the role of small food stores in an urban environment. Public Health Nutr. 2008;11(04):413–20.
30. Tester JM, Yen IH, Laraia B. Mobile food vending and the after-school food environment. Am J Prev Med. 2010;38(1):70–3.
31. Cannuscio CC, Weiss EE, Asch DA. The contribution of urban foodways to health disparities. J Urban Health. 2010;87(3):381–93.
32. Gudzune KA, Welsh C, Lane E, Chissell Z, Anderson Steeves E, Gittelsohn J. Increasing access to fresh produce by pairing urban farms with corner stores: a case study in a low-income urban setting. Public Health Nutr. 2015;18(15):2770–4.
33. Markowitz L. Produce(ing) equity: creating fresh markets in a food desert. Res Econ Anthropol. 2008;28:195–211.
34. Sbicca J. Growing food justice by planting an anti-oppression foundation: opportunities and obstacles for a budding social movement. Agric Hum Values. 2012;29(4):455–66.
35. Lewis CK, Zollinger TW. ‘Garden on the Go’ demonstration study report. Indiana University Health; 2012.
36. Evans AE, Jennings R, Smiley AW, Medina JL, Sharma SV, Rutledge R, et al. Introduction of farm stands in low-income communities increases fruit and vegetable among community residents. Health Place. 2012;18(5):1137–43.
37. Widener MJ, Metcalf SS, Bar-Yam Y. Agent-based modeling of policies to improve urban food access for low-income populations. Appl Geogr. 2013;40:1–10.
38. Chow TE, Sadler R. The consensus of local stakeholders and outside experts in suitability modeling for future camp development. Landsc Urban Plan. 2010;94(1):9–19.
39. Malczewski J. GIS-based land-use suitability analysis: a critical overview. Prog Plan. 2004;62(1):3–65.
40. Malczewski J. On the use of weighted linear combination method in GIS: common and best practice approaches. Trans GIS. 2000;4(1):5–22.
41. Bell N, Schuurman N, Hayes MV. Using GIS-based methods of multicriteria analysis to construct socio-economic deprivation indices. Int J Health Geogr. 2007;6(1):1.
42. Faghri A, Lang A, Hamad K, Henck H. Integrated knowledge-based geographic information system for determining optimal location of park-and-ride facilities. J Urban Plan Dev. 2002;128(1):18–41.
43. Malczewski J. GIS and multicriteria decision analysis. New York: Wiley; 1999. 44. Burger J, Gochfeld M, Powers CW, Kosson DS, Halverson J, Siekaniec G,
et al. Scientific research, stakeholders, and policy: continuing dialogue during research on radionuclides on Amchitka Island, Alaska. J Environ Manag. 2007;85(1):232–44.
45. Saaty TL. Fundamentals of decision making and priority theory with the analytic hierarchy process, vol. 6. Pittsburg: Rws Publications; 2000.
46. Thapa RB, Murayama Y. Land evaluation for peri-urban agriculture using analytical hierarchical process and geographic information system tech-niques: a case study of Hanoi. Land Use Policy. 2008;25(2):225–39.
47. Saaty TL. The analytic hierarchy process: planning, priority setting, resources allocation. New York: McGraw; 1980.
48. Hanna-Attisha M, LaChance J, Sadler RC, Schnepp AC. Elevated blood lead levels in children associated with the flint drinking water crisis: a spatial analysis of risk and public health response. Am J Public Health. 2015;106(2):283–90.
49. Henthorn TC. A catholic dilemma: white flight in northwest flint. Michi-gan Hist Rev. 2005;31(2):1–42.
50. Highsmith AR. Decline and renewal in North American cities. J Urban Hist. 2011; 0096144211403095.
51. Highsmith AR. Demolition means progress: urban renewal, local politics, and state-sanctioned ghetto formation in Flint, Michigan. J Urban Hist. 2009;35:348–68.
52. Sadler RC, Lafreniere D. Racist housing practices as a precursor to uneven neighborhood change in a post-industrial city. Hous Stud. 2016;. doi:10.1080/02673037.2016.1181724.
53. Sadler RC. Strengthening the core, improving access: bringing healthy food downtown via a farmers’ market move. Appl Geogr. 2016;67:119–28.
54. Sadler RC, Arku G, Gilliland JA. Local food networks as catalysts for food policy change to improve health and build the economy. Local Environ Int J Justice Sustain. 2014;20(9):1103–21.
55. Cheung WW, Pitcher TJ, Pauly D. A fuzzy logic expert system to estimate intrinsic extinction vulnerabilities of marine fishes to fishing. Biol Conserv. 2005;124(1):97–111.
56. Kanungo DP, Arora MK, Sarkar S, Gupta RP. A comparative study of conventional, ANN black box, fuzzy and combined neural and fuzzy weighting procedures for landslide susceptibility zonation in Darjeeling Himalayas. Eng Geol. 2006;85(3):347–66.
Page 13 of 13Sadler Int J Health Geogr (2016) 15:19
• We accept pre-submission inquiries
• Our selector tool helps you to find the most relevant journal
• We provide round the clock customer support
• Convenient online submission
• Thorough peer review
• Inclusion in PubMed and all major indexing services
• Maximum visibility for your research
Submit your manuscript atwww.biomedcentral.com/submit
Submit your next manuscript to BioMed Central and we will help you at every step:
57. Zhu AX, Hudson B, Burt J, Lubich K, Simonson D. Soil mapping using GIS, expert knowledge, and fuzzy logic. Soil Sci Soc Am J. 2001;65(5):1463–72.
58. Mayfield K, Caudell E, Pleasant F, Alaimo K. A community-based participa-tory assessment of food availability in an urban midwestern community. Poster presentation at agriculture and human values conference; 2013.
59. Charreire H, Casey R, Salze P, Simon C, Chaix B, Banos A, et al. Measuring the food environment using geographical information systems: a meth-odological review. Public Health Nutr. 2010;13(11):1773–85.
60. Cromley RG. A comparison of optimal classification strategies for choroplethic displays of spatially aggregated data. Int J Geogr Inf Syst. 1996;10(4):405–24.
61. Widener MJ, Metcalf SS, Bar-Yam Y. Developing a mobile produce distri-bution system for low-income urban residents in food deserts. J Urban Health. 2012;89(5):733–45.
62. Minnesota Population Center. National historical geographic information system: version 2.0. Minneapolis, MN: University of Minnesota; 2011.
63. Pampalon R, Hamel D, Gamache P, Raymond G. A deprivation index for health planning in Canada. Chronic Dis Can. 2010;29(4):178–91.
64. Sadler RC, Gilliland JA, Arku G. Community development and the influ-ence of new food retail sources on the price and availability of nutritious food. J Urban Aff. 2013;35(4):471–91.
65. Neilson GK, Fowler WK. Relation between transit ridership and walking distances in a low-density Florida retirement area. Highw Res Rec. 1972;(403):26–34.
66. Untermann RK. Accommodating the pedestrian: Adapting towns and neighbourhoods for walking and bicycling. Van Nostrand Reinhold; 1984.
67. City of Flint. Imagine flint: master plan for a sustainable flint. Flint: City of Flint; 2013.
68. Sieber R. Public participation geographic information systems: a literature review and framework. Ann Assoc Am Geogr. 2006;96(3):491–507.
69. Minkler M. Community-based research partnerships: challenges and opportunities. J Urban Health. 2005;82(s2):3–12.
70. Minkler M, Blackwell AG, Thompson M, Tamir H. Community-based participatory research: implications for public health funding. Am J Public Health. 2003;93(8):1210–3.
71. Shelton D. Establishing the public’s trust through community-based participatory research: a case example to improve health care for a rural Hispanic community. Annu Rev Nurs Res. 2008;26(1):237–59.
72. Esnard A. Institutional and organizational barriers to effective use of GIS by community-based organizations. URISA-WASHINGTON DC. 2007;19(2):13.
73. Boulos MNK. Web GIS in practice III: creating a simple interactive map of England’s strategic Health Authorities using Google Maps API, Google Earth KML, and MSN Virtual Earth Map Control. Int J Health Geogr. 2005;4(1):1.
74. Boulos MNK, Resch B, Crowley DN, Breslin JG, Sohn G, Burtner R, et al. Crowdsourcing, citizen sensing and sensor web technologies for public and environmental health surveillance and crisis management: trends, OGC standards and application examples. Int J Health Geogr. 2011;10(1):1.
75. Goodchild MF. Citizens as sensors: the world of volunteered geography. GeoJournal. 2007;69(4):211–21.