Embed Size (px)
Citation preview
Insulin as a regulator of flavin-containing monooxygenase enzyme in streptozotocin-induced
diabetic rats
Ph.D. Thesis
Tímea Borbás
Semmelweis University Doctoral School of Pharmaceutical and Pharmacological Sciences
Supervisor: Dr. Károly Tihanyi, C.Sc. Opponents: Dr. Miklós Tóth, D.Sc.
Dr. Zsuzsanna Veres, D.Sc.
Final Examination Committee: President: Dr. Krisztina Takács-Novák, D.Sc. Members: Dr. Imre Klebovich, D.Sc.
Dr. Katalin Monostory, Ph.D.
Budapest 2006.

TABLE OF CONTENTS
ABBREVIATIONS...................................................................................................................4
1 INTRODUCTION .....................................................................................................6 1.1 DISCOVERY OF FMO ENZYMES ............................................................................6 1.2 BIOCHEMICAL, CATALYTICAL AND STRUCTURAL PROPERTIES................7
1.2.1 Classification of the FMO enzyme ............................................................... 7 1.2.2 Unique biochemical properties .................................................................... 8 1.2.3 Approaches to distinguish between FMO- and CYP-mediated metabolism. 9 1.2.4 The mechanism of catalysis ........................................................................ 11 1.2.5 Structure: gene and protein........................................................................ 12
1.3 ISOFORMS: TISSUE-, SPECIES-, GENDER-, AGE- AND SUBSTRATE-SPECIFICITY.............................................................................................................16
1.4 CATALYSED REACTIONS .....................................................................................22 1.4.1 Substrates: endogenous and exogenous ..................................................... 22 1.4.2 Stereoselectivity .......................................................................................... 24 1.4.3 In vitro and in vivo probes of FMO............................................................ 24 1.4.4 Inhibitors .................................................................................................... 26
1.5 ROLES OF FMO ........................................................................................................27 1.5.1 Metabolism of endogenous compounds...................................................... 27 1.5.2 Xenobiotic metabolism: detoxication or bioactivation............................... 29 1.5.3 FMO in drug development.......................................................................... 30
1.6 REGULATION...........................................................................................................31 1.6.1 Genetic variation ........................................................................................ 31 1.6.2 Dietary, developmental, hormonal control ................................................ 33 1.6.3 Pathophysiological status: diabetes ........................................................... 35
2 RESEARCH OBJECTIVES...................................................................................39
3 MATERIALS AND METHODS............................................................................40 3.1 BIOCHEMICALS ......................................................................................................40 3.2 ANIMALS AND INDUCTION OF DIABETES .......................................................41 3.3 PREPARATION OF LIVER MICROSOMES...........................................................41 3.4 DETERMINATION OF CYTOCHROME CONTENT.............................................42 3.5 ENZYMATIC ASSAYS.............................................................................................42
3.5.1 FMO index reaction: Benzydamine N-oxygenation ................................... 43 3.5.2 CYP1A index reaction: Ethoxyresorufin O-deethylation ........................... 43 3.5.3 CYP2B/3A index reaction: Aminopyrine N-demethylation ........................ 44 3.5.4 CYP2E1 index reaction: p-Nitrophenol-hydroxylation.............................. 44 3.5.5 CYP3A index reaction: Testosterone-6β-hydroxylation............................. 45
3.6 DETERMINATION OF THE mRNA OF FMO1 AND FMO3 ISOFORMS ............45 3.6.1 Isolation of total RNA................................................................................. 45 3.6.2 Measurement of concentration and integrity of RNA................................. 46 3.6.3 Synthesis of cDNA ...................................................................................... 46 3.6.4 Gene expression analysis ........................................................................... 46 3.6.5 Data analysis .............................................................................................. 47
3.7 FMO-MEDIATED BIOTRANSFORMATION OF SOME CNS DRUGS................47 3.7.1 Tolperisone ................................................................................................. 47
2
3.7.2 Deprenyl, amphetamine, methamphetamine enantiomers.......................... 48
4 RESULTS.................................................................................................................50 4.1 DRUG METABOLIZING MICROSOMAL ENZYMES IN DIABETIC RATS ......50
4.1.1 Changes of physical and biochemical parameters in diabetic rats............ 50 4.1.2 The function of FMOs................................................................................. 52 4.1.3 The function of cytochromes: CYP and cytochrome b5 .............................. 58 4.1.4 Correlation analysis ................................................................................... 60
4.2 FMO-MEDIATED METABOLISM OF CNS DRUGS.............................................62 4.2.1 Tolperisone ................................................................................................. 62 4.2.2 Deprenyl, methamphetamine, amphetamine .............................................. 63
5 DISCUSSION...........................................................................................................64 5.1 CHANGES IN THE CYTOCHROME ENZYME SYSTEM: CYTOCHROME
P450 AND CYTOCHROME B5.................................................................................64 5.1.1 Hepatic cytochrome contents and CYP isoform activities.......................... 64
5.2 CHANGES IN THE FMO ENZYME SYSTEM........................................................65 5.2.1 Insulin as a regulator of FMO.................................................................... 65 5.2.2 Glucose as a marker for elevated FMO activity......................................... 67 5.2.3 Ketone bodies may have a role in FMO regulation ................................... 67 5.2.4 FMO correlates with cytochrome b5 enzyme in experimental diabetes ..... 68
5.3 THE PROPOSED INFLUENCE OF DIABETES INDUCED CHANGES OF FMO ACTIVITY ON TOLPERISONE, DEPRENYL, AMPHETAMINE, METHAMPHETAMINE METABOLISM ................................................................68
6 CONCLUSIONS......................................................................................................70
7 SUMMARY..............................................................................................................71
8 REFERENCES ........................................................................................................73
9 PUBLICATIONS.....................................................................................................90
10 ACKNOWLEDGEMENTS ....................................................................................94
3
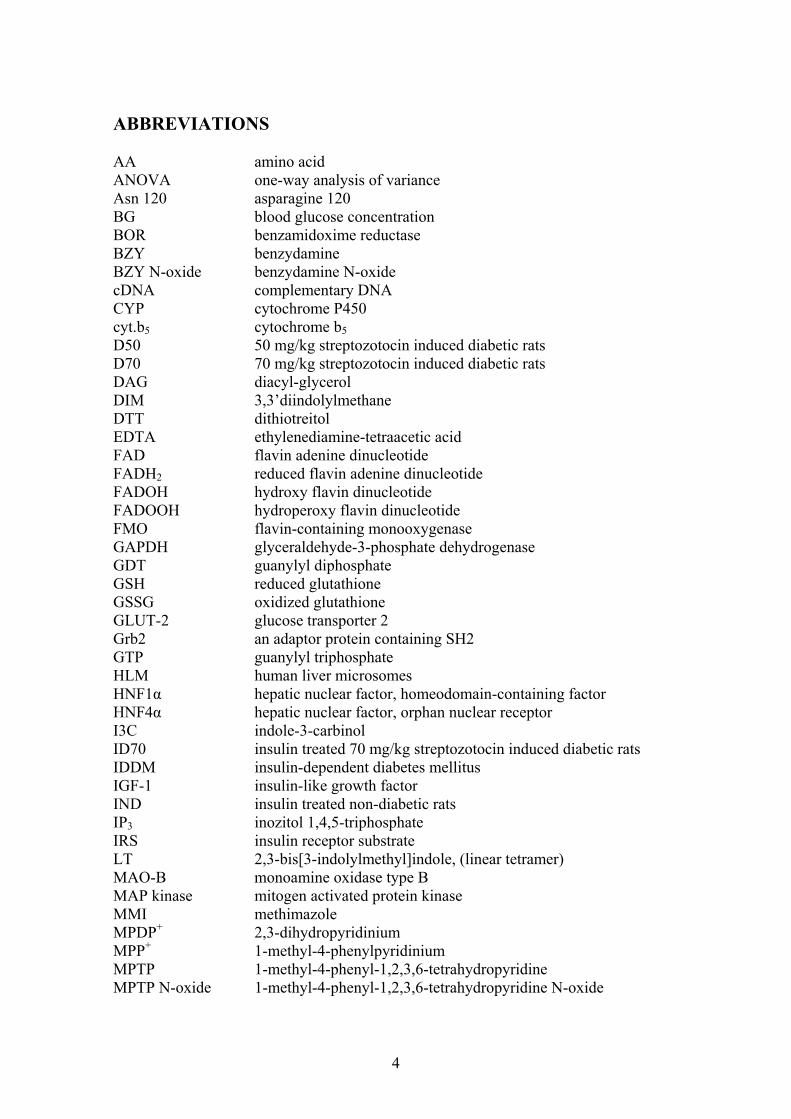
ABBREVIATIONS AA amino acid ANOVA one-way analysis of variance Asn 120 asparagine 120 BG blood glucose concentration BOR benzamidoxime reductase BZY benzydamine BZY N-oxide benzydamine N-oxide cDNA complementary DNA CYP cytochrome P450 cyt.b5 cytochrome b5D50 50 mg/kg streptozotocin induced diabetic rats D70 70 mg/kg streptozotocin induced diabetic rats DAG diacyl-glycerol DIM 3,3’diindolylmethane DTT dithiotreitol EDTA ethylenediamine-tetraacetic acid FAD flavin adenine dinucleotide FADH2 reduced flavin adenine dinucleotide FADOH hydroxy flavin dinucleotide FADOOH hydroperoxy flavin dinucleotide FMO flavin-containing monooxygenase GAPDH glyceraldehyde-3-phosphate dehydrogenase GDT guanylyl diphosphate GSH reduced glutathione GSSG oxidized glutathione GLUT-2 glucose transporter 2 Grb2 an adaptor protein containing SH2 GTP guanylyl triphosphate HLM human liver microsomes HNF1α hepatic nuclear factor, homeodomain-containing factor HNF4α hepatic nuclear factor, orphan nuclear receptor I3C indole-3-carbinol ID70 insulin treated 70 mg/kg streptozotocin induced diabetic rats IDDM insulin-dependent diabetes mellitus IGF-1 insulin-like growth factor IND insulin treated non-diabetic rats IP3 inozitol 1,4,5-triphosphate IRS insulin receptor substrate LT 2,3-bis[3-indolylmethyl]indole, (linear tetramer) MAO-B monoamine oxidase type B MAP kinase mitogen activated protein kinase MMI methimazole MPDP+ 2,3-dihydropyridinium MPP+ 1-methyl-4-phenylpyridinium MPTP 1-methyl-4-phenyl-1,2,3,6-tetrahydropyridine MPTP N-oxide 1-methyl-4-phenyl-1,2,3,6-tetrahydropyridine N-oxide
4
MpTS methyl para-tolyl sulfide MpTSO methyl para-tolyl sulfoxide mRNA messenger ribonucleic acid NADPH reduced nicotinamide adenine dinucleotide phosphate NADP+ nicotinamide adenine dinucleotide phosphate NIDDM noninsulin dependent diabetes mellitus PDB ID protein data bank identification PCR polymerase chain reaction PIP2 phosphatidyl-inositol 4,5 biphosphate PKC proteinkinase C PLC-γ phospholipase C-γ PTP 4-phenyl-1,2,3,6-tetrahydropyridine ras guanine nucleotide-binding protein RIN RNA Integrity Number RNA ribonucleic acid RLM rat liver microsomes SH2 domain src homology domain 2 SNP single nucletide polymorphism SOS Ras-specific nucleotide exchange factor Src kinase a non-receptor tyrosine kinase STZ streptozotocin TCA trichloro acetic acid TMA trimethylamine TMA N-oxide trimethylamine N-oxide TMAuria trimethylaminuria Tris tris hydroxymethyl aminomethane YY1 Yin Yang-1 1get PDB ID of glutathione-reductase 1npx PDB ID of NADPH-peroxidase 1vqw PDB ID of a protein with similarity to FMO 1w4x PDB ID of phenylacetone monooxygenase 5-DPT 10-([N,N-dimethylamino]alkyl)-2-(trifluoromethyl)phenothiazine
5
1 INTRODUCTION Drug metabolizing enzymes being adaptive enzymes are of great importance in
maintaining homeostasis. The flavin-containing monooxygenase (FMO) family is one
of the major microsomal monooxygenase enzyme systems involved in drug metabolism.
Its function is NADPH- and O2-dependent. FMO catalyses the oxygenation of a variety
of nucleophilic heteroatom-containing (i.e. nitrogen, sulfur, selenium and phosphorous)
xenobiotics to their respective oxides.1
FMO was purified from pig liver in Ziegler’s laboratory in 1972, hence it was
named „Ziegler’s-enzyme” for a period of time.2 Its contribution to drug metabolism
was underestimated until the 1990s. It is not inducible by typical cytochrome P450
(CYP) inducers, but in certain patophysiological states such as diabetes it is altered
along with CYP isoforms. In diabetes therapy, besides the description of metabolic
pathways, the recognition of changes in drug metabolising capacity is essential for
avoidance of unwanted drug-drug interactions and achievement of optimal drug
exposition. The regulatory role of insulin was studied regarding CYP isoforms, but
similar observations have not yet been made for FMO.
In this thesis, first the recent developments on flavin-containing monooxygenase
will be surveyed concerning its biochemical, structural and catalytical properties;
isoforms; substrate specificity; physiological significance and toxicological importance;
relevance in drug metabolism and development; regulation; functional SNPs causing
FMO deficiency leading to a hereditary disease, trimethylaminuria. Then, it will be
described how we came to the conclusion that insulin is a regulator of FMO.
1.1 DISCOVERY OF FMO ENZYMES
In 1960 Miller and his co-workers reported that liver microsomes contained enzymes
that catalysed the NADPH- and O2-dependent oxidation of butter yellow and a number
of other azo dyes.3 Ziegler studied the nature of enzymes catalysing these so-called
mixed function oxidation reactions. They selected the N-oxidation of N,N-
dimethylaniline as a model reaction since its N-oxide was easily detectable by a rapid
colorimetric measurement. They characterized the enzyme in liver microsomes. The
highest activity among a wide variety of vertebrates was consistently observed in
6
microsomes isolated from pig liver. One of Ziegler’s students, Caroline Mitchell,
succeeded in purifying the enzyme that catalyses the NADPH- and O2-dependent N-
oxidation of N,N-dimethylaniline from this source in 1972.2 The purified flavoprotein
was free of metals and other nonprotein components other than FAD or lipid.
This enzyme had been known as a mixed-function amine N-oxidase until 1979.
However, shortly after the isolation of the enzyme from pig liver Jollow and Cook
demonstrated that it catalyzed oxygenation of an exceptionally wide range of
xenobiotics that had no common structural features.4 The list includes inorganic and
organic compounds and some of the better substrates contain functional groups bearing
sulfur or selenium instead of nitrogen. Since the name “mixed-function amine N-
oxidase” or simply “N-oxidase” was restrictive, the flavoprotein was given the trivial
name flavin-containing monooxygenase, usually abbreviated as FMO.
1.2 BIOCHEMICAL, CATALYTICAL AND STRUCTURAL PROPERTIES
1.2.1 Classification of the FMO enzyme
FMO is a microsomal monooxygenase enzyme catalysing xenobiotic oxidation. Flavin-
monooxygenase and cytochrome P450 share a number of similarities with respect to
tissue, cellular and organelle expression, the utilization of oxygen and NADPH as
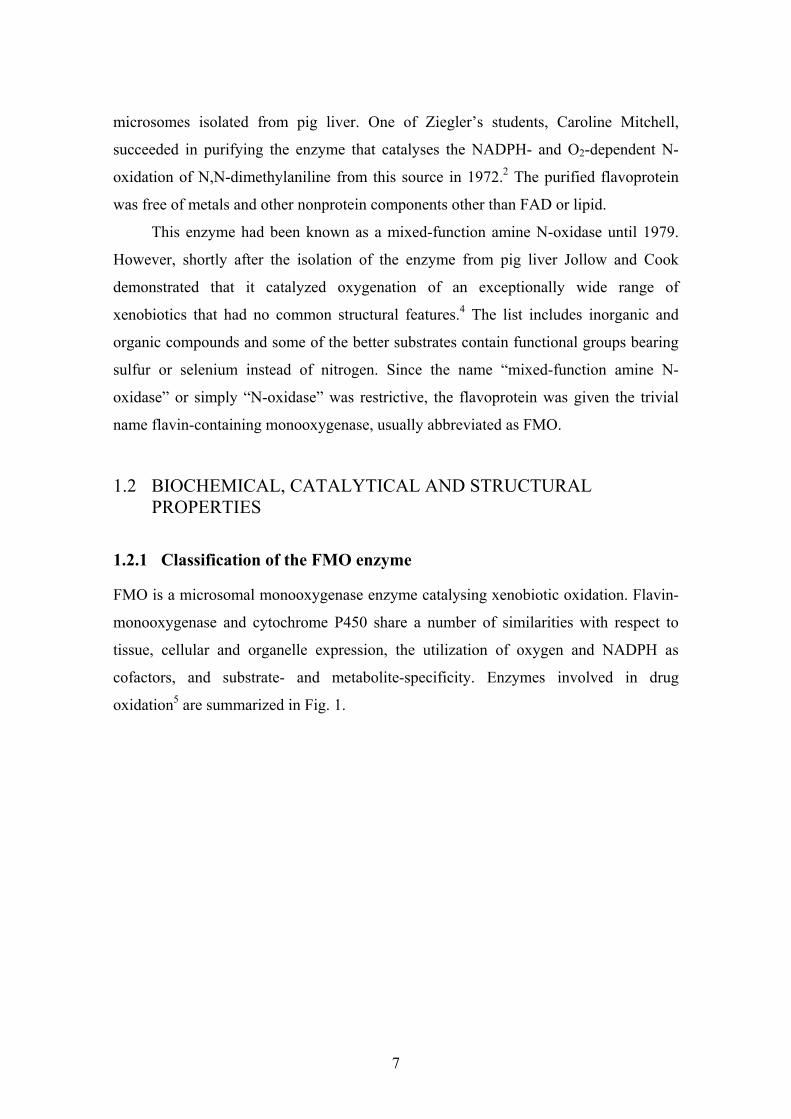
cofactors, and substrate- and metabolite-specificity. Enzymes involved in drug
oxidation5 are summarized in Fig. 1.
7
Xenobiotic oxidation
Non-microsomal oxidation Microsomal oxidation
Heme-containing Non-heme containig
Cytochrome P450(CYP)
Flavin-containingmonooxygenase
(FMO)
Alcohol-dehydrogenaseAldehyde-dehydrogenaseDihydrodiol-dehydrogenaseMonoamine-oxidaseSemicarbazide-sensitive amine oxidaseEnzymes of peroxisomal β-oxidationMolybdenum-containing monooxygenases(aldehyde-oxidase and xantine-oxidase)
Xenobiotic oxidation
Non-microsomal oxidation Microsomal oxidation
Heme-containing Non-heme containig
Cytochrome P450(CYP)
Alcohol-dehydrogenaseAldehyde-dehydrogenaseDihydrodiol-dehydrogenaseMonoamine-oxidaseSemicarbazide-sensitive amine oxidaseEnzymes of peroxisomal β-oxidationMolybdenum-containing monooxygenases(aldehyde-oxidase and xantine-oxidase)
Flavin-containingmonooxygenase
(FMO)
Fig. 1. Enzymes involved in the oxidation of xenobiotics
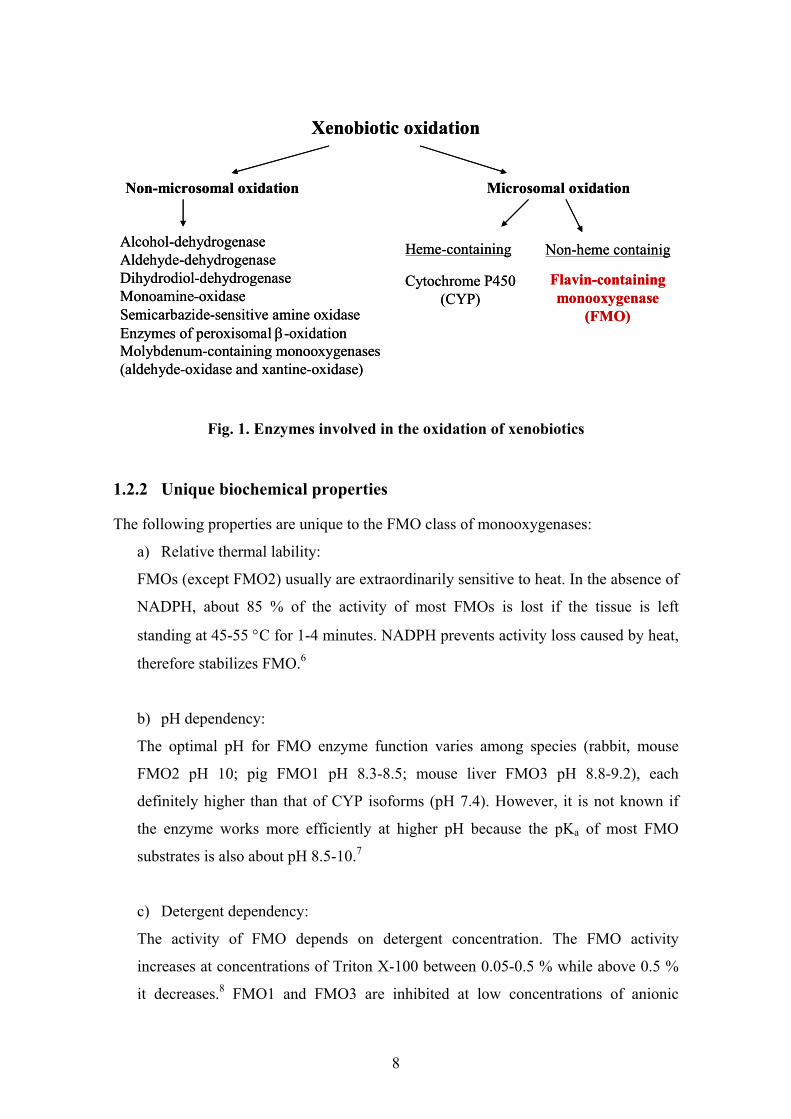
1.2.2 Unique biochemical properties
The following properties are unique to the FMO class of monooxygenases:
a) Relative thermal lability:
FMOs (except FMO2) usually are extraordinarily sensitive to heat. In the absence of
NADPH, about 85 % of the activity of most FMOs is lost if the tissue is left
standing at 45-55 °C for 1-4 minutes. NADPH prevents activity loss caused by heat,
therefore stabilizes FMO.6
b) pH dependency:
The optimal pH for FMO enzyme function varies among species (rabbit, mouse
FMO2 pH 10; pig FMO1 pH 8.3-8.5; mouse liver FMO3 pH 8.8-9.2), each
definitely higher than that of CYP isoforms (pH 7.4). However, it is not known if
the enzyme works more efficiently at higher pH because the pKa of most FMO
substrates is also about pH 8.5-10.7
c) Detergent dependency:
The activity of FMO depends on detergent concentration. The FMO activity
increases at concentrations of Triton X-100 between 0.05-0.5 % while above 0.5 %
it decreases.8 FMO1 and FMO3 are inhibited at low concentrations of anionic
8
detergents such as sodium cholate or fatty acids while FMO2 function at the sodium
cholate concentration as high as 1 % is not inhibited.9
d) Formation of relatively stabile hydroperoxy flavin intermediate:
Hydroperoxy flavin is protected from decomposition by the protein environment of
FMO, and the presence of NADPH which is an FMO stabilizer.10 This allows FMO
to be in an oxygenated, so-called “cocked gun” mode. In the absence of substrate,
FMO does not generate copious amounts of H2O2 suggesting that FMO does not
expose the cell to untoward effects of oxidative stress.6
e) Metabolite prediction:
The metabolite produced by FMO in case of a particular substrate could be
predicted in case the substrate reacts with alkyl hydroperoxides or peracids.10
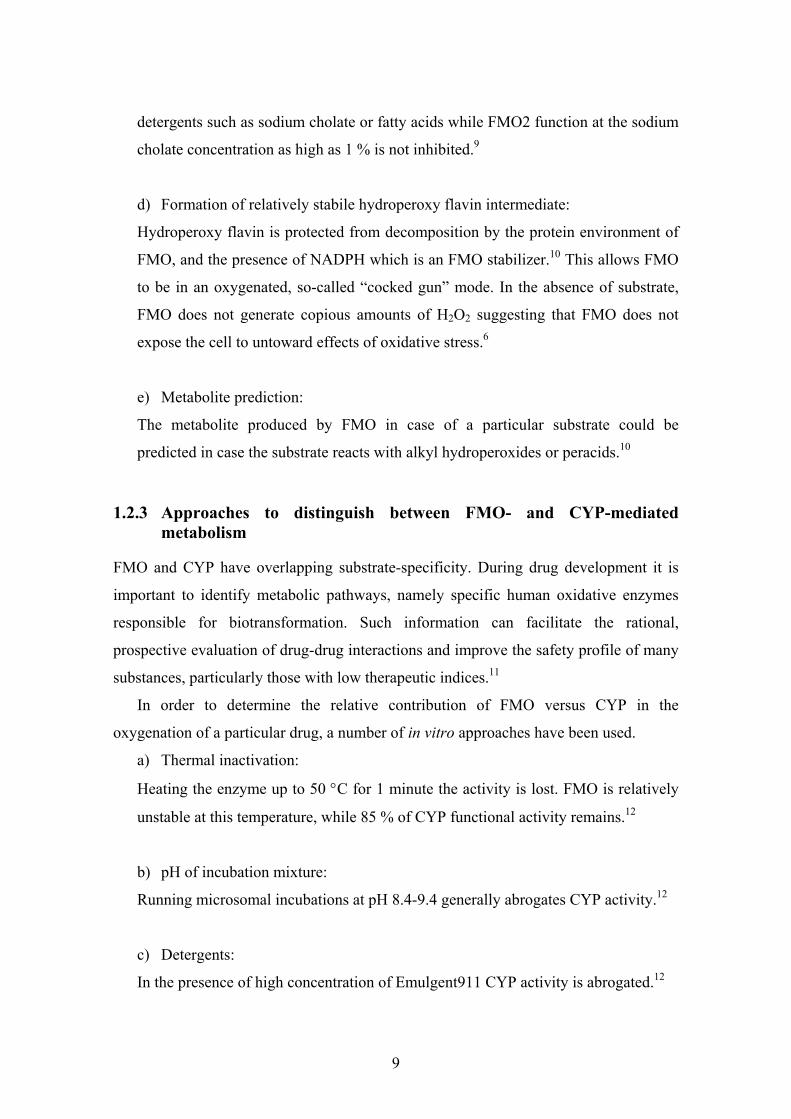
1.2.3 Approaches to distinguish between FMO- and CYP-mediated metabolism
FMO and CYP have overlapping substrate-specificity. During drug development it is
important to identify metabolic pathways, namely specific human oxidative enzymes
responsible for biotransformation. Such information can facilitate the rational,
prospective evaluation of drug-drug interactions and improve the safety profile of many
substances, particularly those with low therapeutic indices.11
In order to determine the relative contribution of FMO versus CYP in the
oxygenation of a particular drug, a number of in vitro approaches have been used.
a) Thermal inactivation:
Heating the enzyme up to 50 °C for 1 minute the activity is lost. FMO is relatively
unstable at this temperature, while 85 % of CYP functional activity remains.12
b) pH of incubation mixture:
Running microsomal incubations at pH 8.4-9.4 generally abrogates CYP activity.12
c) Detergents:
In the presence of high concentration of Emulgent911 CYP activity is abrogated.12
9

d) Metal ions:
FMO is relatively sensitive to metal ions, therefore incubations should be carried out
in the absence of MgCl2 and in the presence of a chelating agent.10
e) Inactivation of heme prostetic group via saturating by CO.9
f) Inhibitors:
Chemical inhibitors:
o FMO inhibitors: methimazol (MMI)13, thiourea14, indole-3-carbinol
(I3C).15
o General CYP inhibitors: N-benzylimidazole13, aminobenzotriazole,
proadifen hydrochloride (SKF-525).16
Immunological inhibitors (antibodies):
o FMO inhibitors: antibodies directed toward FMOs (rabbit lung
FMO217 and human liver FMO318).
o General CYP inhibitor: antibody against NADPH-P450 reductase.19
g) Molecular biology tools: recombinant FMO isozymes.9
h) Banks of human liver microsomes: well-characterized for CYP and FMO
activities in order to carry out correlation studies.9
i) Observing the stereochemistry of the product: the stereochemistry of FMO- and
CYP-mediated N- and S-oxygenations is sometimes distinct.10
It is more difficult to determine a metabolic pathway in vivo. In animals, pretreatment
with MMI or I3C inhibits FMO mediated metabolism, but these are not fully specific
for FMO. MMI inhibits thyroid peroxidase20 and the reactive sulfenic acid produced
inhibits CYP activity as well21, whereas I3C induces CYP isozymes22.
10
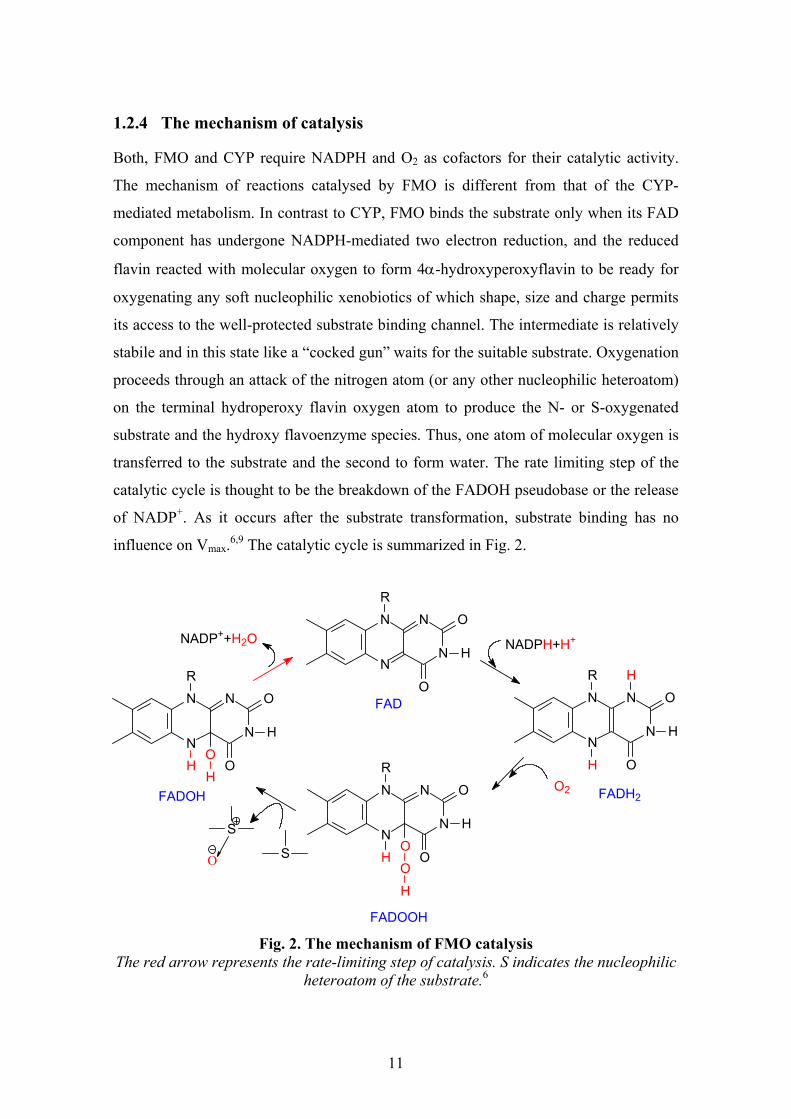
1.2.4 The mechanism of catalysis
Both, FMO and CYP require NADPH and O2 as cofactors for their catalytic activity.
The mechanism of reactions catalysed by FMO is different from that of the CYP-
mediated metabolism. In contrast to CYP, FMO binds the substrate only when its FAD
component has undergone NADPH-mediated two electron reduction, and the reduced
flavin reacted with molecular oxygen to form 4α-hydroxyperoxyflavin to be ready for
oxygenating any soft nucleophilic xenobiotics of which shape, size and charge permits
its access to the well-protected substrate binding channel. The intermediate is relatively
stabile and in this state like a “cocked gun” waits for the suitable substrate. Oxygenation
proceeds through an attack of the nitrogen atom (or any other nucleophilic heteroatom)
on the terminal hydroperoxy flavin oxygen atom to produce the N- or S-oxygenated
substrate and the hydroxy flavoenzyme species. Thus, one atom of molecular oxygen is
transferred to the substrate and the second to form water. The rate limiting step of the
catalytic cycle is thought to be the breakdown of the FADOH pseudobase or the release
of NADP+. As it occurs after the substrate transformation, substrate binding has no
influence on Vmax.6,9 The catalytic cycle is summarized in Fig. 2.
N
NN
N
R
O
O
H
N
NN
N
R
O
O
H
H
H
NADP
N
NN
N
R
O
O
H
H+H+
HO
O
H
O2
O
HH
N
NN
N
R
O
O
H
NADP++H2O
S
S
FAD
FADH2
FADOOH
FADOH
O
Fig. 2. The mechanism of FMO catalysis
The red arrow represents the rate-limiting step of catalysis. S indicates the nucleophilic heteroatom of the substrate.6
11

1.2.5 Structure: gene and protein
Currently eleven human FMO genes are known. FMO1, 2, 3, 4 and 5 isoforms are
functionally active the others are pseudogenes.23,24 The FMO gene family probably
arose by duplication of a common ancestral gene some 250-300 million years ago.25
The genes are located on the long arm of chromosome 1.26 The structural
organization of the human FMO3 gene is seen in Fig. 3.
Fig. 3. The gene structure of human FMO3 The exon/intron structure of the gene along with the arrangement of the exon-derived sequences within the corresponding mRNA are shown above. Introns (horizontal open boxes) are numbered in boldface type and their approximate sizes (in kilobases) are shown in paretheses. Exons (solid vertical boxes) are numbered in italics and are linked by dashed lines to the equivalent regions within the mRNA (open boxes) that contain the exon length (in nucleotides) or, in the case of exons 2 and 9, the length of the protein coding regions within the exon. Shaded regions represent 5’ and 3’ untranslated regions within the mRNA. The location within the mRNA of the sequences that encode the fingerprint motifs associated with the ADP-binding βαβ-folds of the FAD- and NADP-binding domains within the protein are shown by filled and open horizontal boxes, respectively.27
The deduced amino acid sequence of the human FMO isoenzymes have 82-87 %
identity with their known orthologues in other mammals, but only 51-57 % similarity to
each other25 with the exception of FMO3 and FMO6, which share 71 % identity28. FMO
human genes having sequence identity of ≥ 82 % are grouped in one family, which is
indicated by the first numeral of the designation (i.e. 1, 2, 3, 4, 5 and 6). The order of
12
naming followed the chronology of publication of the sequence for each member of the
family.27
The molecular weight of FMO is around 56 kDa.29 FMOs are built of 532-558
amino acids (AA) with highly conserved regions corresponding to the binding site of
the ADP moiety of FAD (AA position 4-32) and NADPH (AA position 186-213). FMO
apoenzyme binds FAD stochiometrically. All mammalian FMOs are anchored proteins
and possess very strong membrane association properties.6 Only its C-terminus
(residues 510-533) is sufficiently hydrophobic to be inserted into the membrane.
Instruction for active membrane association is probably encoded in an internal sequence
(residues 55-77). It was proposed that the substrate binding site of FMO3 is between the
397 and 431 amino acids. Ziegler has suggested that only a single point of attachment to
the terminal hydroperoxy flavin oxygen is required for substrate oxygenation. In
Cashman’s opinion, however, additional points of contact with the substrates are
required at the active site of FMO for explaining stereoselectivity. Other regions of
FMO have notable homology with well-characterized enzymes such as the serine
protease, acetyl-choline esterase, esterase and the leucin-box of T cell receptor.7
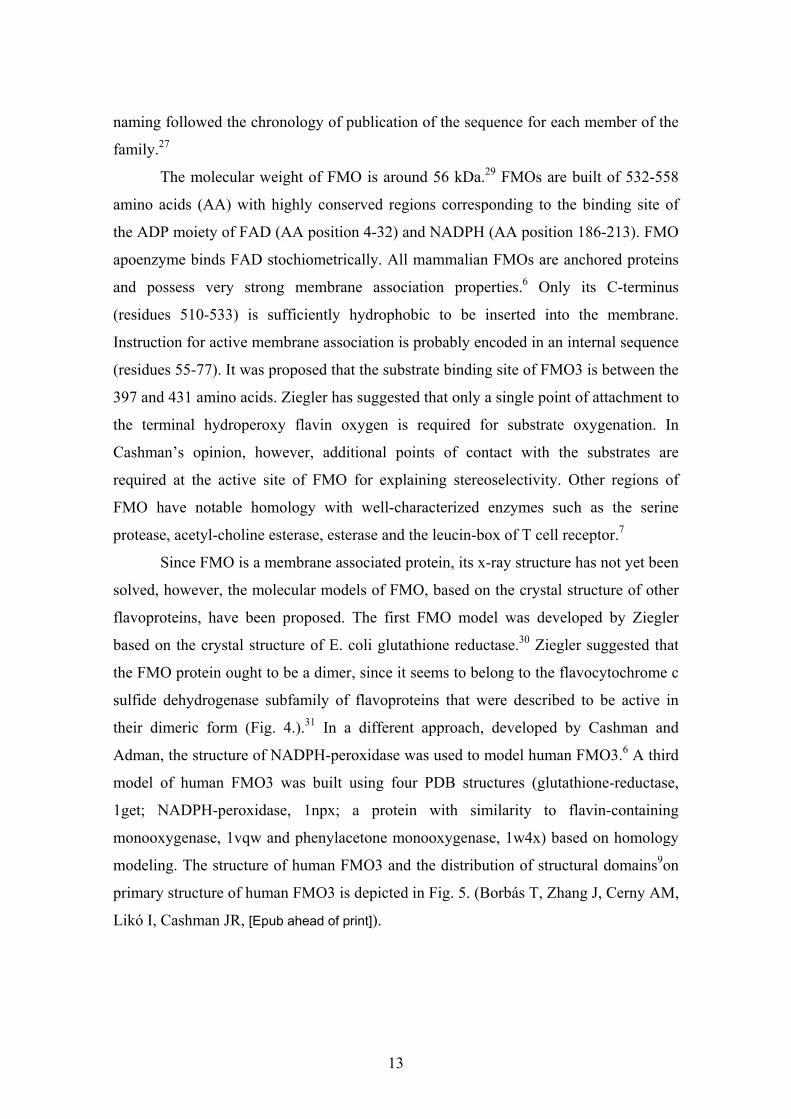
Since FMO is a membrane associated protein, its x-ray structure has not yet been
solved, however, the molecular models of FMO, based on the crystal structure of other
flavoproteins, have been proposed. The first FMO model was developed by Ziegler
based on the crystal structure of E. coli glutathione reductase.30 Ziegler suggested that
the FMO protein ought to be a dimer, since it seems to belong to the flavocytochrome c
sulfide dehydrogenase subfamily of flavoproteins that were described to be active in
their dimeric form (Fig. 4.).31 In a different approach, developed by Cashman and
Adman, the structure of NADPH-peroxidase was used to model human FMO3.6 A third
model of human FMO3 was built using four PDB structures (glutathione-reductase,
1get; NADPH-peroxidase, 1npx; a protein with similarity to flavin-containing
monooxygenase, 1vqw and phenylacetone monooxygenase, 1w4x) based on homology
modeling. The structure of human FMO3 and the distribution of structural domains9on
primary structure of human FMO3 is depicted in Fig. 5. (Borbás T, Zhang J, Cerny AM,
Likó I, Cashman JR, [Epub ahead of print]).
13
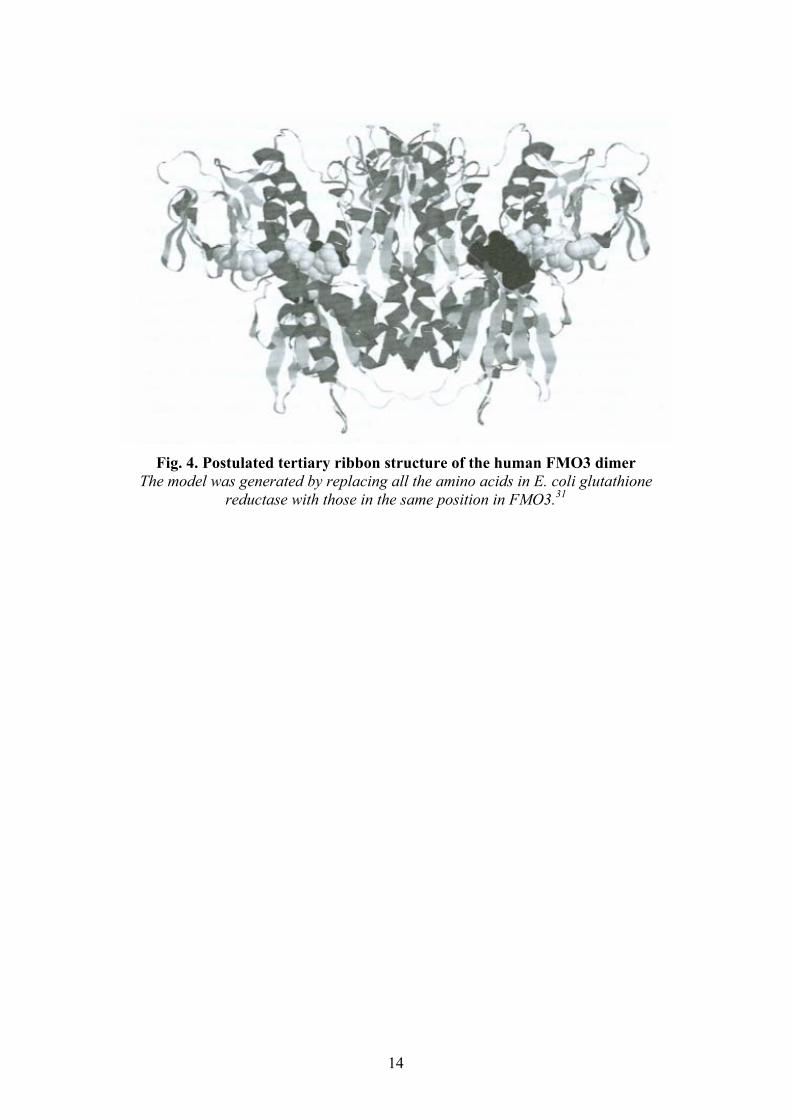
Fig. 4. Postulated tertiary ribbon structure of the human FMO3 dimer
The model was generated by replacing all the amino acids in E. coli glutathione reductase with those in the same position in FMO3.31
14
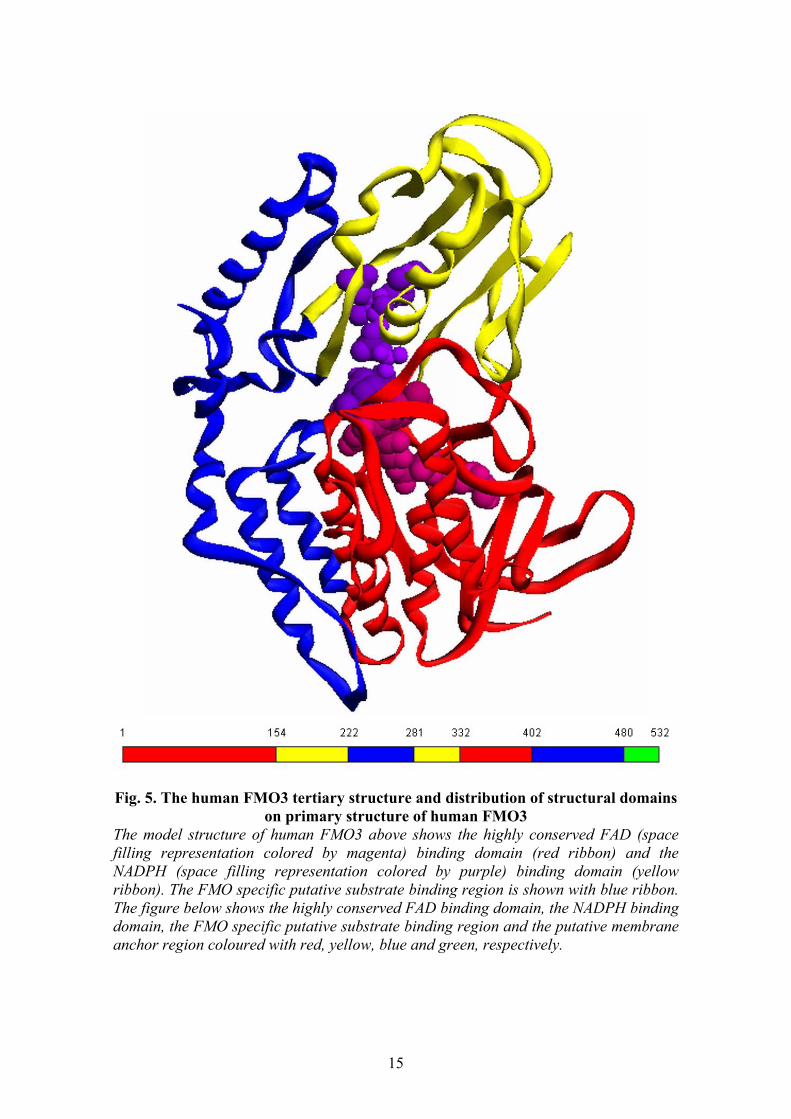
Fig. 5. The human FMO3 tertiary structure and distribution of structural domains
on primary structure of human FMO3 The model structure of human FMO3 above shows the highly conserved FAD (space filling representation colored by magenta) binding domain (red ribbon) and the NADPH (space filling representation colored by purple) binding domain (yellow ribbon). The FMO specific putative substrate binding region is shown with blue ribbon. The figure below shows the highly conserved FAD binding domain, the NADPH binding domain, the FMO specific putative substrate binding region and the putative membrane anchor region coloured with red, yellow, blue and green, respectively.
15
1.3 ISOFORMS: TISSUE-, SPECIES-, GENDER-, AGE- AND SUBSTRATE-SPECIFICITY
FMO isoforms exhibit tissue-, species-, gender-, age- and substrate-specificity.
a) Tissue-specificity: (Fig. 6.)
FMOs are expressed in the liver – the main metabolic organ – and in the lung, kidney,
small intestine, brain as well. FMO isoforms show the following tissue-specific
distribution:
FMO1 isoform is the most abundant in human kidney; human small intestine,
fetal liver, most experimental animal liver, nasal mucosa and esophagus also
contain it.
FMO2 isoform is dominant in human and rabbit lung, however it is not a
prominent active enzyme there.
FMO3 isoform is the most abundant in adult human liver, with a concentration
of 100 pmol/mg microsomal protein.32 The microsomal FMO3 content is 60 %
of CYP3A4 - the most abundant hepatic CYP isoenzyme – present in adult
human liver. Its turnover number is 2-3-fold greater than that of CYP.33,34
FMO4 isoform is dominant in adult human liver and kidney.
FMO5 isoform was shown to be as much abundant in adult human liver as
FMO3.
In humans, FMO is expressed in the highest quantity in the liver and lung and only
half of those amounts in the kidney. The abundance of various FMO isoforms in the
brain are represented equally less than 1 % in comparison to the richest corresponding
human tissues.
It is important to keep in mind when interpolating liver microsomal data for FMO
catalysis from experimental animals to humans that in animals the prominent hepatic
enzyme is FMO1, whereas in humans FMO3.5
16

Fig. 6. Tissue-specific distribution of FMO isoforms in humans Data based on mRNA measurements.35
b) Species-specificity: (Table 1.)
The pattern of tissue-specific distribution depends on the species examined. The table
shows a compilation of the „best guess” as to the tissue distribution of FMO forms in
experimental male animals and humans.
17
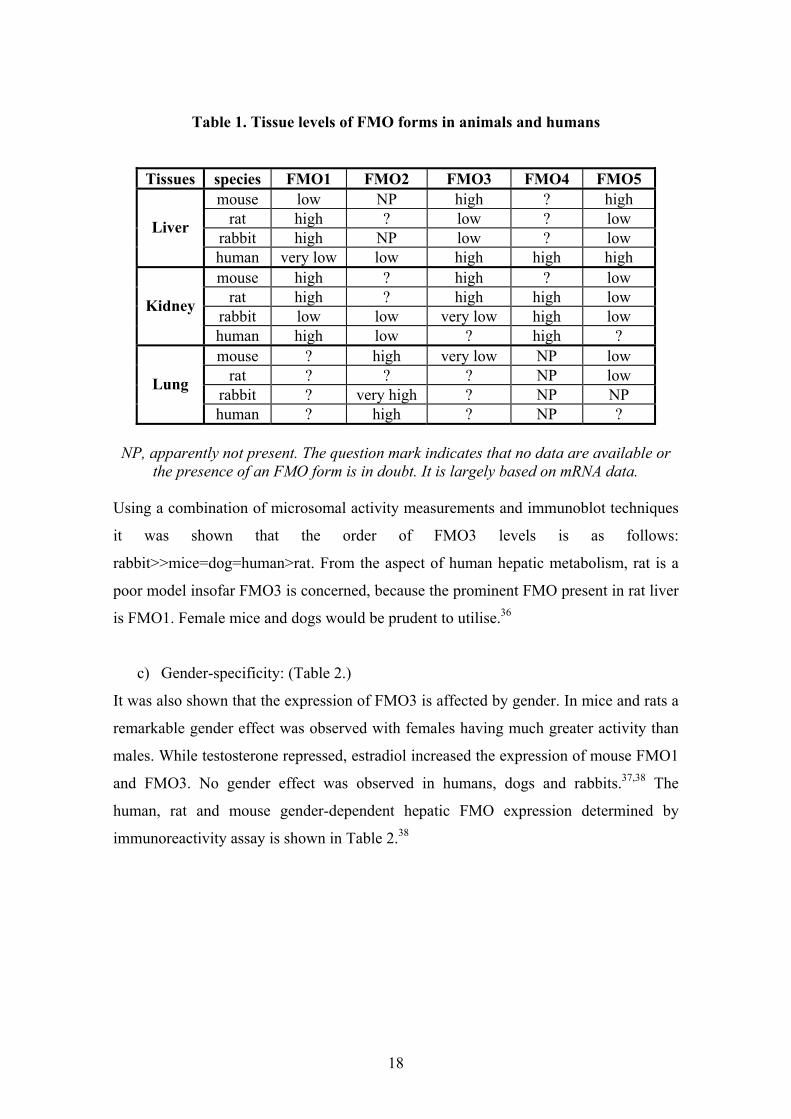
Table 1. Tissue levels of FMO forms in animals and humans
Tissues species FMO1 FMO2 FMO3 FMO4 FMO5 mouse low NP high ? high
rat high ? low ? low rabbit high NP low ? low
Liver
human very low low high high high mouse high ? high ? low
rat high ? high high low rabbit low low very low high low
Kidney
human high low ? high ? mouse ? high very low NP low
rat ? ? ? NP low rabbit ? very high ? NP NP
Lung
human ? high ? NP ?
NP, apparently not present. The question mark indicates that no data are available or the presence of an FMO form is in doubt. It is largely based on mRNA data.
Using a combination of microsomal activity measurements and immunoblot techniques
it was shown that the order of FMO3 levels is as follows:
rabbit>>mice=dog=human>rat. From the aspect of human hepatic metabolism, rat is a
poor model insofar FMO3 is concerned, because the prominent FMO present in rat liver
is FMO1. Female mice and dogs would be prudent to utilise.36
c) Gender-specificity: (Table 2.)
It was also shown that the expression of FMO3 is affected by gender. In mice and rats a
remarkable gender effect was observed with females having much greater activity than
males. While testosterone repressed, estradiol increased the expression of mouse FMO1
and FMO3. No gender effect was observed in humans, dogs and rabbits.37,38 The
human, rat and mouse gender-dependent hepatic FMO expression determined by
immunoreactivity assay is shown in Table 2.38
18
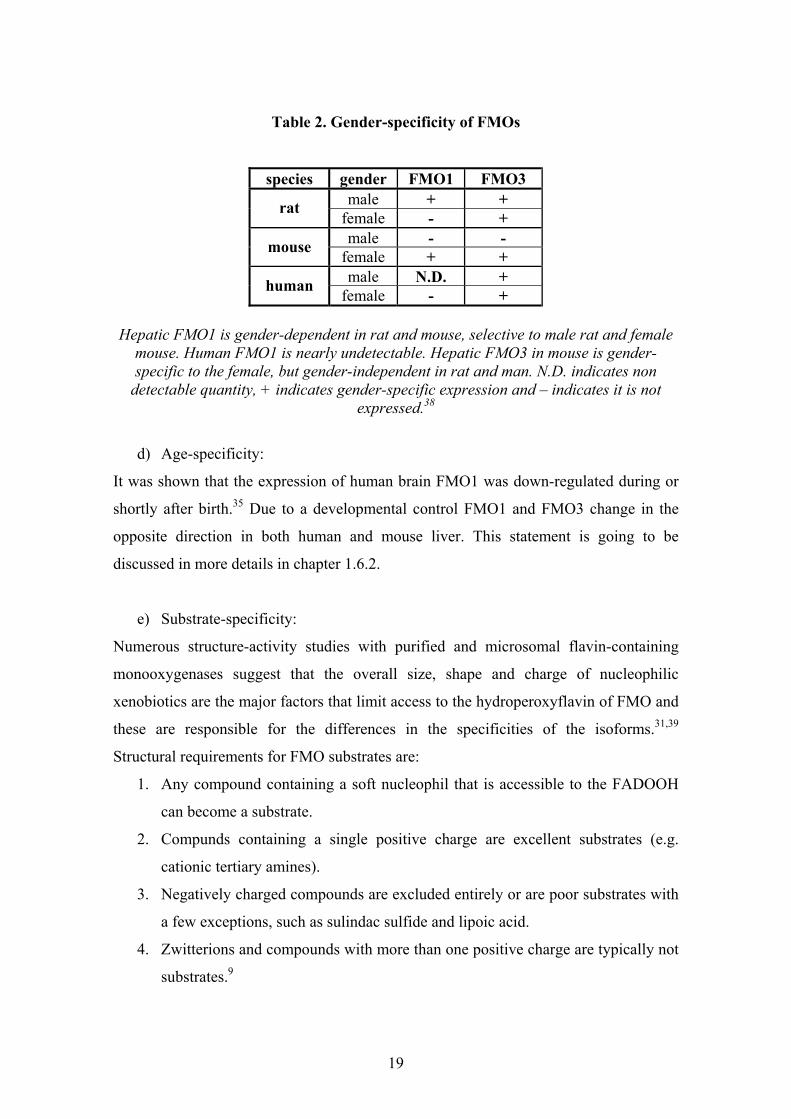
Table 2. Gender-specificity of FMOs
species gender FMO1 FMO3 male + + rat female - + male - - mouse female + + male N.D. + human female - +
Hepatic FMO1 is gender-dependent in rat and mouse, selective to male rat and female
mouse. Human FMO1 is nearly undetectable. Hepatic FMO3 in mouse is gender-specific to the female, but gender-independent in rat and man. N.D. indicates non
detectable quantity, + indicates gender-specific expression and – indicates it is not expressed.38
d) Age-specificity:
It was shown that the expression of human brain FMO1 was down-regulated during or
shortly after birth.35 Due to a developmental control FMO1 and FMO3 change in the
opposite direction in both human and mouse liver. This statement is going to be
discussed in more details in chapter 1.6.2.
e) Substrate-specificity:
Numerous structure-activity studies with purified and microsomal flavin-containing
monooxygenases suggest that the overall size, shape and charge of nucleophilic
xenobiotics are the major factors that limit access to the hydroperoxyflavin of FMO and
these are responsible for the differences in the specificities of the isoforms.31,39
Structural requirements for FMO substrates are:
1. Any compound containing a soft nucleophil that is accessible to the FADOOH
can become a substrate.
2. Compunds containing a single positive charge are excellent substrates (e.g.
cationic tertiary amines).
3. Negatively charged compounds are excluded entirely or are poor substrates with
a few exceptions, such as sulindac sulfide and lipoic acid.
4. Zwitterions and compounds with more than one positive charge are typically not
substrates.9
19
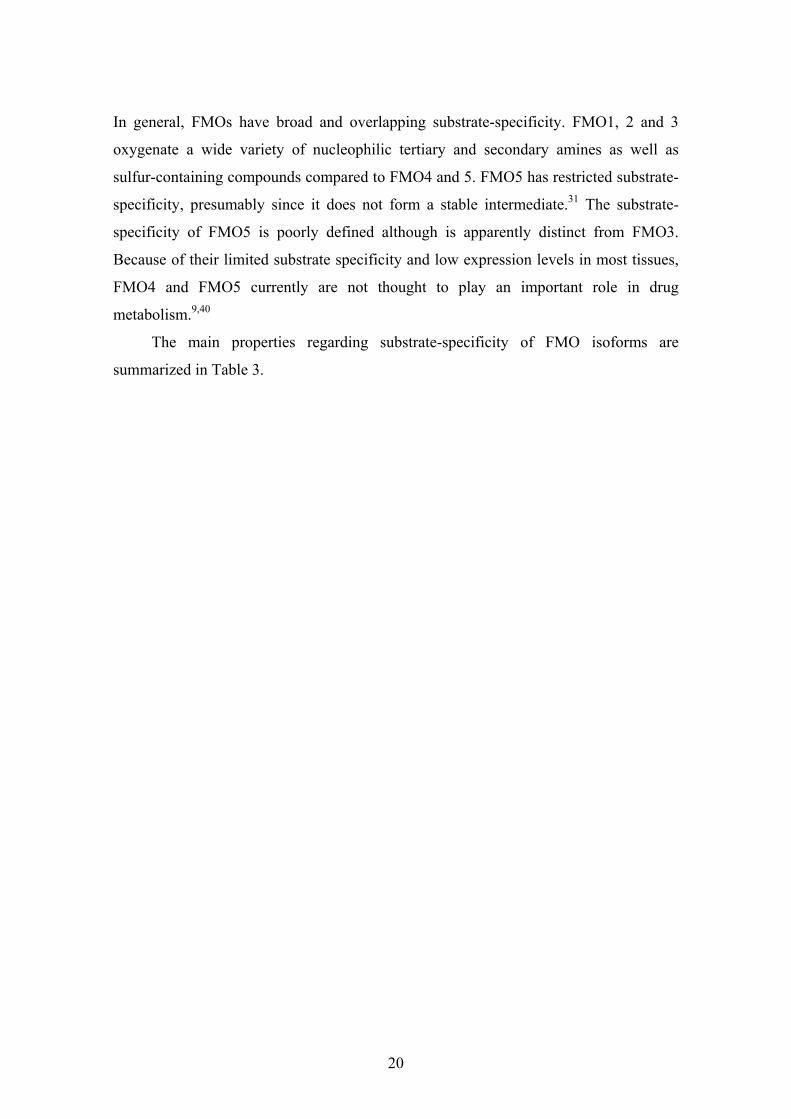
In general, FMOs have broad and overlapping substrate-specificity. FMO1, 2 and 3
oxygenate a wide variety of nucleophilic tertiary and secondary amines as well as
sulfur-containing compounds compared to FMO4 and 5. FMO5 has restricted substrate-
specificity, presumably since it does not form a stable intermediate.31 The substrate-
specificity of FMO5 is poorly defined although is apparently distinct from FMO3.
Because of their limited substrate specificity and low expression levels in most tissues,
FMO4 and FMO5 currently are not thought to play an important role in drug
metabolism.9,40
The main properties regarding substrate-specificity of FMO isoforms are
summarized in Table 3.
20

T
able
3. T
he su
bstr
ate-
spec
ifici
ty o
f FM
O is
ofor
ms
The
subs
trat
e-sp
ecifi
city
of F
MO
isof
orm
s ,,
,,
C
PZ: c
hlor
prom
azin
e, IP
M: i
mip
ram
ine
21

1.4 CATALYSED REACTIONS
1.4.1 Substrates: endogenous and exogenous
FMO catalyses the oxygenation of nucleophilic heteroatom-containing (i.e. nitrogen,
sulfur, selenium and phosphorous) substrates. Sulfur atom is a preferred site of FMO
oxygenation owing to its enhanced nucleophilicity, therefore S-oxygenation is favored
over N-oxygenation.10
a) Endogenous substrates
As discussed previously, the charge restriction for access to the substrate channel
leading to FADOOH exclude many potential nucleophilic endogenous substrates from
FMO-dependent oxygenation. There are a number of notable exceptions, however.
Substrates and their metabolites produced by FMO are listed below:
Nitrogen containing:
o biogen amines (phenethylamine, tyramine) → trans-oxime41
o trimethylamine → trimethylamine N-oxide, KM=28 uM10
Sulfur-containing:
o Cysteamine (sulfhydryl) → cystamine (disulfide), KM=120 uM
o disulfide lipoic acid → sulfoxide, KM=120 uM
o methionine → sulfoxide, KM=20 mM
o S-farnezyl-cysteine → sulfoxide, KM=30 uM
o cysteine S-conjugates, selenocysteine conjugates with high KM9
22
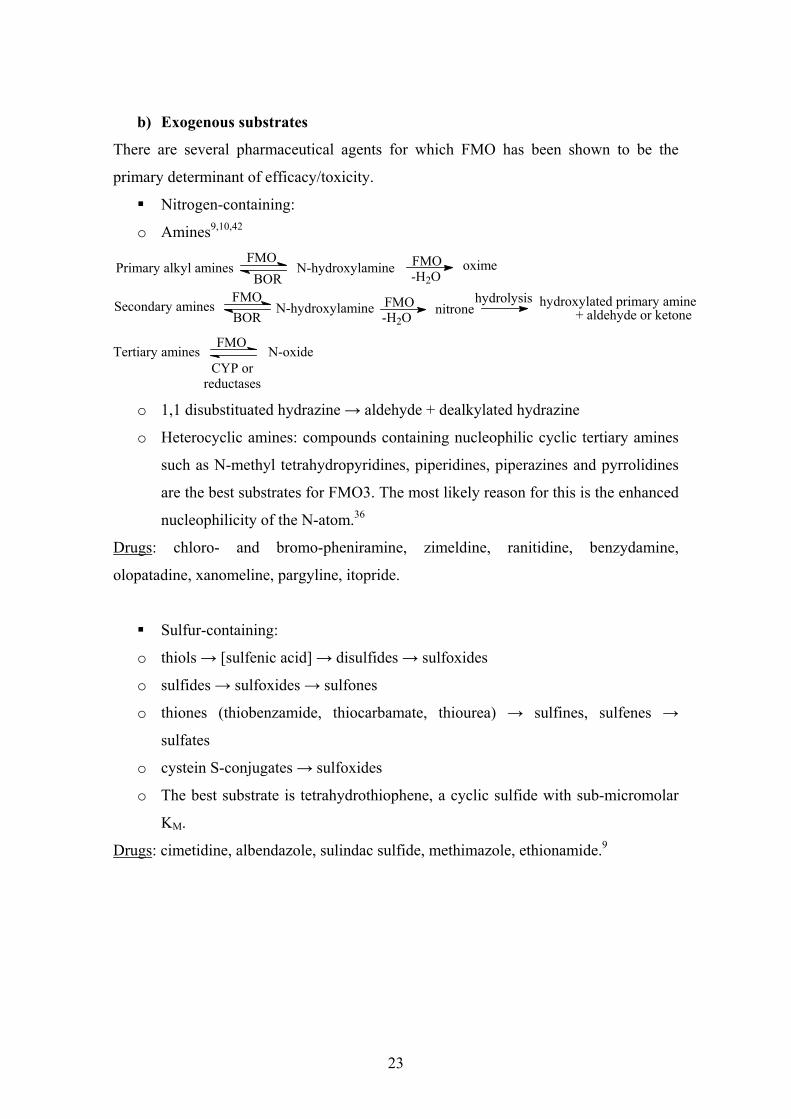
b) Exogenous substrates
There are several pharmaceutical agents for which FMO has been shown to be the
primary determinant of efficacy/toxicity.
Nitrogen-containing:
o Amines9,10,42
Primary alkyl amines N-hydroxylamine oxime
Secondary amines N-hydroxylamine nitrone hydroxylated primary amine+ aldehyde or ketone
Tertiary amines FMO
CYP orreductases
N-oxide
FMO
FMOBOR
BORFMO
FMO
hydrolysis-H2O
-H2O
o 1,1 disubstituated hydrazine → aldehyde + dealkylated hydrazine
o Heterocyclic amines: compounds containing nucleophilic cyclic tertiary amines
such as N-methyl tetrahydropyridines, piperidines, piperazines and pyrrolidines
are the best substrates for FMO3. The most likely reason for this is the enhanced
nucleophilicity of the N-atom.36
Drugs: chloro- and bromo-pheniramine, zimeldine, ranitidine, benzydamine,
olopatadine, xanomeline, pargyline, itopride.
Sulfur-containing:
o thiols → [sulfenic acid] → disulfides → sulfoxides
o sulfides → sulfoxides → sulfones
o thiones (thiobenzamide, thiocarbamate, thiourea) → sulfines, sulfenes →
sulfates
o cystein S-conjugates → sulfoxides
o The best substrate is tetrahydrothiophene, a cyclic sulfide with sub-micromolar
KM.
Drugs: cimetidine, albendazole, sulindac sulfide, methimazole, ethionamide.9
23
1.4.2 Stereoselectivity
FMO-mediated oxygenation often shows great stereoselectivity.
Primary alkyl amines are transformed to oximes in a stereospecific fashion.
Trans-oxime is formed from amphetamine, tyramine41, phenetylamine43, while cis-
oxime is formed from 5-DPT41.
Chiral sulfides are transformed to sulfoxide in a stereospecific fashion.
Cimetidine36, parylgine25, ,44 and flosequinan45 are transformed into (-) S-oxide with
FMO3 and (+) S-oxide with FMO1. Methionine is transformed into d-methionine S-
oxide.46
Often, the contribution of FMO to the metabolism of a given compound can be
assessed by its unique stereoselectivity relative to other oxygenases. For example, the
cytochrome P450s oxidize (S)-nicotine to a mixture of cis- and trans-N-1'-oxides. In
contrast, (S)-nicotine is oxidized by human FMO3 exclusively to the trans-N-1'-oxide.47
1.4.3 In vitro and in vivo probes of FMO
In order to determine FMO activity in vitro and in vivo FMO-specific substrates are
needed. There are two substrates commonly used to measure both, in vivo and in vitro
hepatic FMO activity.
Trimethylamine (TMA) is an endogenous substrate; it can be used in a non-
invasive-way to quantify human FMO phenotype. TMA/TMA N-oxide transformation
could be considered as a reaction catalysed exclusively by FMO3 since human FMO3 is
at least 100-fold more efficient at oxygenating TMA than human FMO1. The
extrahepatic human FMO1 probably does not make a significant contribution to TMA
N-oxygenation.48 The ratio of TMA and TMA N-oxide in urine is a biomarker of human
hepatic FMO3 activity.
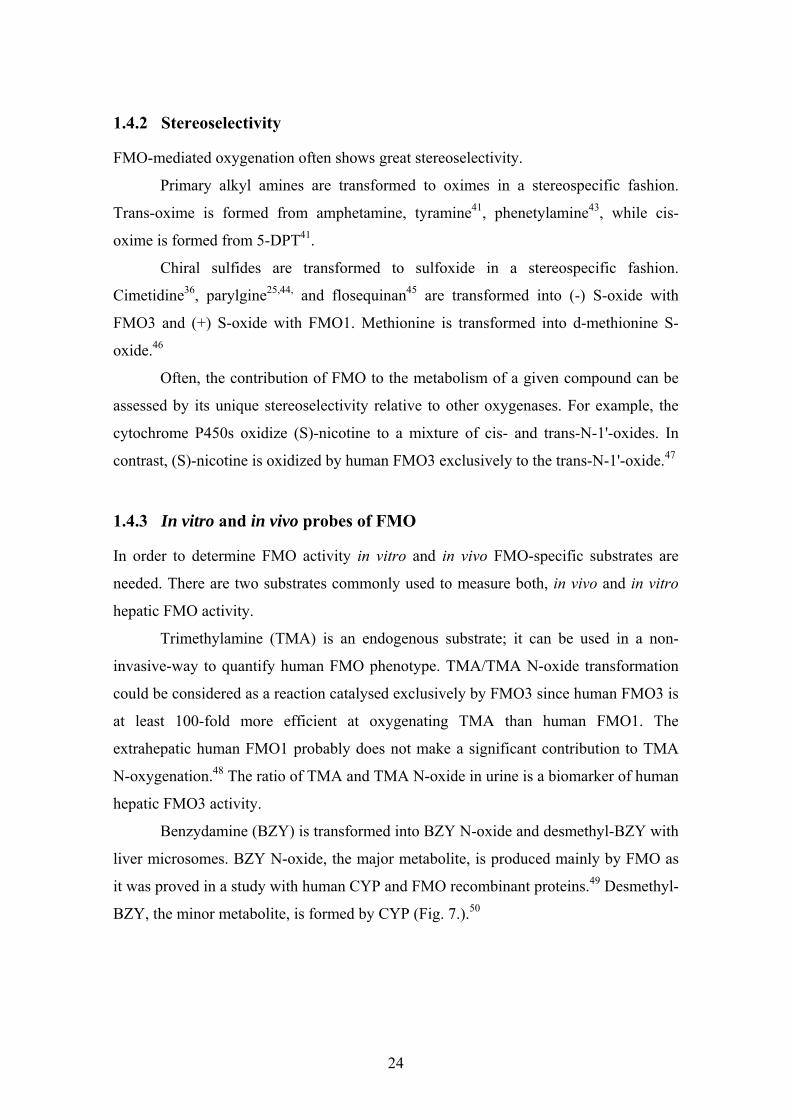
Benzydamine (BZY) is transformed into BZY N-oxide and desmethyl-BZY with
liver microsomes. BZY N-oxide, the major metabolite, is produced mainly by FMO as
it was proved in a study with human CYP and FMO recombinant proteins.49 Desmethyl-
BZY, the minor metabolite, is formed by CYP (Fig. 7.).50
24
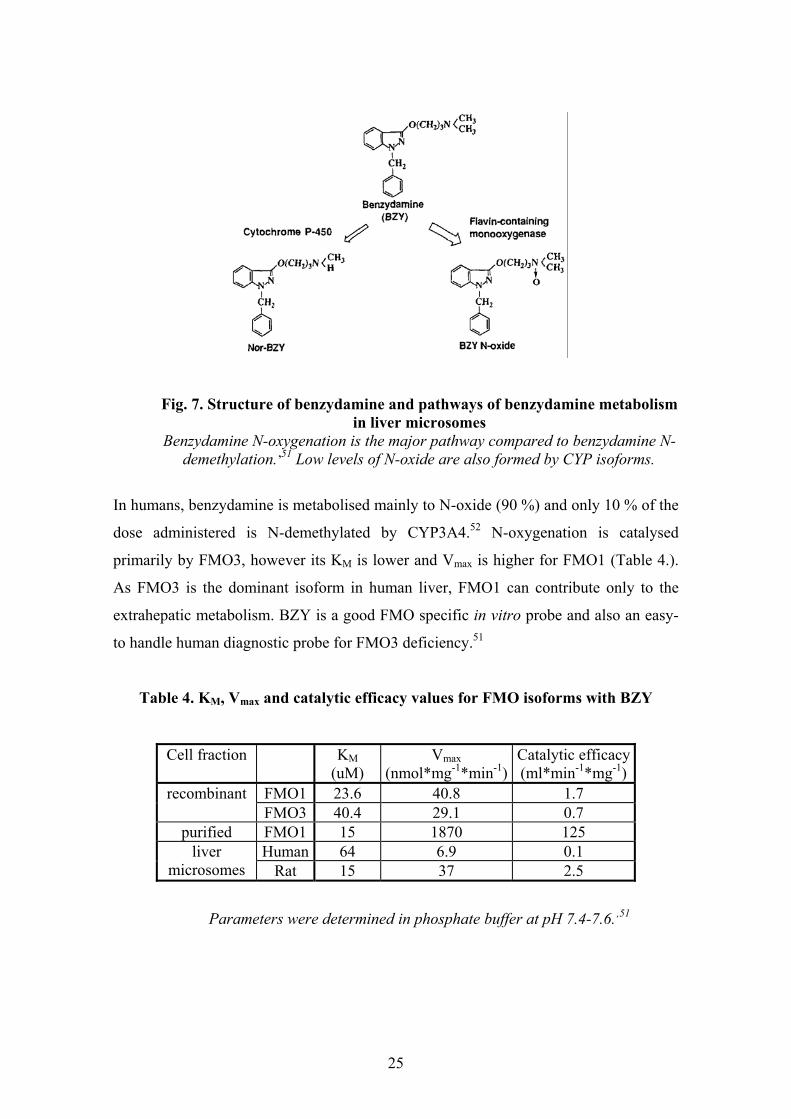
Fig. 7. Structure of benzydamine and pathways of benzydamine metabolism in liver microsomes
Benzydamine N-oxygenation is the major pathway compared to benzydamine N-demethylation. ,51 Low levels of N-oxide are also formed by CYP isoforms.
In humans, benzydamine is metabolised mainly to N-oxide (90 %) and only 10 % of the
dose administered is N-demethylated by CYP3A4.52 N-oxygenation is catalysed
primarily by FMO3, however its KM is lower and Vmax is higher for FMO1 (Table 4.).
As FMO3 is the dominant isoform in human liver, FMO1 can contribute only to the
extrahepatic metabolism. BZY is a good FMO specific in vitro probe and also an easy-
to handle human diagnostic probe for FMO3 deficiency.51
Table 4. KM, Vmax and catalytic efficacy values for FMO isoforms with BZY
Cell fraction KM(uM)
Vmax(nmol*mg-1*min-1)
Catalytic efficacy (ml*min-1*mg-1)
FMO1 23.6 40.8 1.7 recombinant FMO3 40.4 29.1 0.7
purified FMO1 15 1870 125 Human 64 6.9 0.1 liver
microsomes Rat 15 37 2.5
Parameters were determined in phosphate buffer at pH 7.4-7.6. ,51
25
S-nicotine would be a highly stereoselective probe of human FMO activity, but
because of its relatively high KM value, its usefulness as an in vivo probe is less than
desired. Since human FMO3 produce exclusively trans-nicotine N-oxide, whereas
animal FMO1 produces cis and trans nicotine N-oxide, S-nicotine is reasonably useful
as a high stereoselective in vitro probe of human FMO3.36
There are some probe drugs that are used mainly in vivo for population studies.
Cimetidine, mainly in (-) form, transformed to cimetidine S-oxide in a ratio of (-) 75 %
and (+) 25 % in urine. Clozapine was used to analyse population frequencies and allelic
linkage of human FMO3 variations.36 Ranitidine was used to phenotype Korean
population and correlate with human FMO3 genotype.53
1.4.4 Inhibitors
FMO has a few competitive and uncompetitive inhibitors, but to date no mechanism-
based (suicide substrate) inhibitor is known. The most commonly used competitive
inhibitors of FMO in vitro are MMI, thiobenzamide and I3C.6,13,22
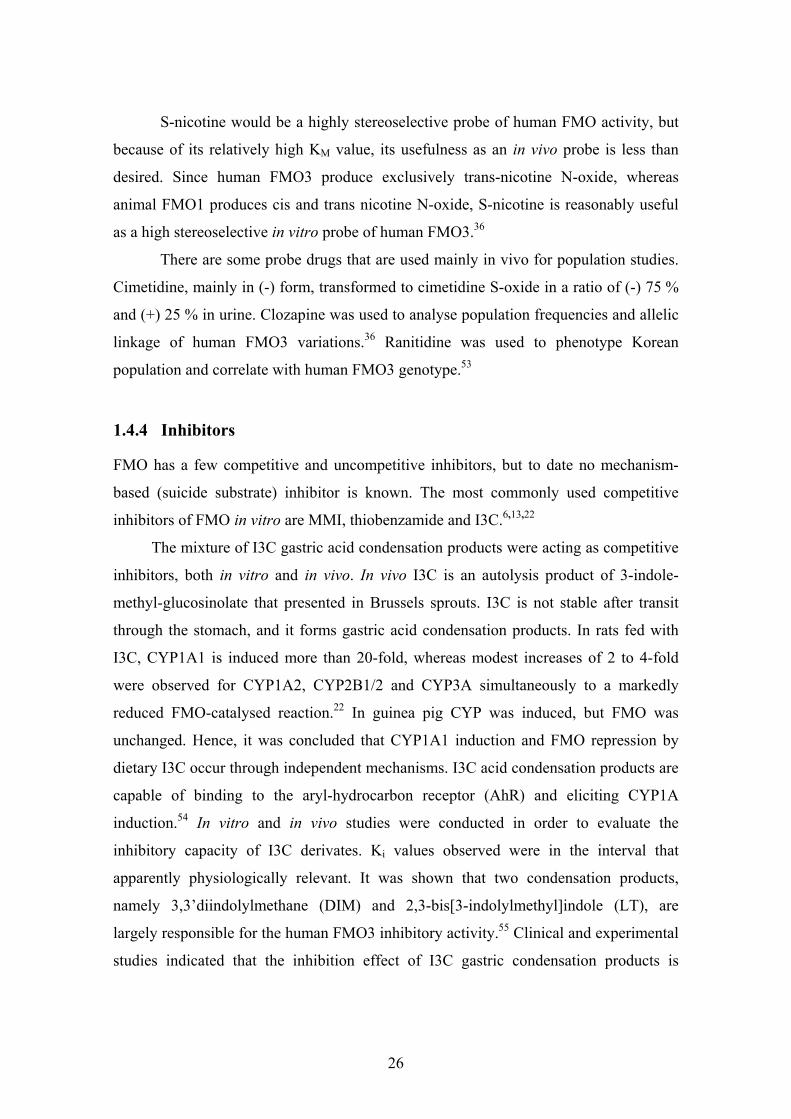
The mixture of I3C gastric acid condensation products were acting as competitive
inhibitors, both in vitro and in vivo. In vivo I3C is an autolysis product of 3-indole-
methyl-glucosinolate that presented in Brussels sprouts. I3C is not stable after transit
through the stomach, and it forms gastric acid condensation products. In rats fed with
I3C, CYP1A1 is induced more than 20-fold, whereas modest increases of 2 to 4-fold
were observed for CYP1A2, CYP2B1/2 and CYP3A simultaneously to a markedly
reduced FMO-catalysed reaction.22 In guinea pig CYP was induced, but FMO was
unchanged. Hence, it was concluded that CYP1A1 induction and FMO repression by
dietary I3C occur through independent mechanisms. I3C acid condensation products are
capable of binding to the aryl-hydrocarbon receptor (AhR) and eliciting CYP1A
induction.54 In vitro and in vivo studies were conducted in order to evaluate the
inhibitory capacity of I3C derivates. Ki values observed were in the interval that
apparently physiologically relevant. It was shown that two condensation products,
namely 3,3’diindolylmethane (DIM) and 2,3-bis[3-indolylmethyl]indole (LT), are
largely responsible for the human FMO3 inhibitory activity.55 Clinical and experimental
studies indicated that the inhibition effect of I3C gastric condensation products is
26
species-specific. In humans, rats, mice, rabbits and guinea pigs the remaining activities
were 30, 30, 100, 60 and 100 %, respectively.15,22,55,56
Dimethylamino stilbene carboxylate is an uncompetitive inhibitor of FMO, which
appears to interfere with the NADPH-binding domain.10 Polyclonal antibodies against
FMO are reportedly less successfully used.9
1.5 ROLES OF FMO
FMO is present both in prokaryotes and eukaryotes.57 It is believed that FMO evolved
to protect mammals from an onslaught of lipophilic and nucleophilic chemicals in the
early environment.58 In plants, namely Arabidopsis, an FMO-like enzyme called
YUCCA enzyme catalyses a key step in tryptophan-dependent auxin biosynthesis.59
It is known that yeast FMO (yFMO) generates oxidizing equivalents in the form
of GSSG that are then transported into the lumen of the endoplasmic reticulum and
create a redox potential essential for proper folding of proteins that have disulfide
bonds.60 However, yFMO differs from the mammalian FMO as the former one easily
accepts substrates like glutathione, cysteine and cysteamine.61
The importance of mammalian FMO in xenobiotic metabolism is proved, while
its physiological role has not been identified yet, except for TMA N-oxygenation.9
1.5.1 Metabolism of endogenous compounds
FMO is responsible for transformation of the odorous trimethylamine (TMA) into
odourless TMA N-oxide. TMA is derived from the diet by enterobacterial
decomposition of precursors such as TMA N-oxide, choline, lecithine and carnitine.
TMA N-oxide is readily excreted by the urine.27 The failure to efficiently oxygenate
TMA leads to trimethylaminuria (Fish Odour Syndrome).
Endogenous compounds, such as biogen amines (phenetylamine, tyramine) are
good substrates for FMO. The oximes appear to have little pharmacological activity,
and therefore FMO-mediated N-oxygenation of biogenic amines is belived to be one of
the mechanisms of inactivation.9
Farnesyl-cystein and farnesyl-cystein methyl ester are efficiently S-oxygenated
in a stereoselective fashion by FMO (KM=22.7 and 33.9 uM, Vmax=1319 and
27
1001 nmol*min-1*mg protein-1, respectively). Metabolising the terminal cysteine of the
farnesylated ras protein may prevent that ras protein associates with the membrane and
eventually MAP kinase cascade activation does not happen. Further studies are required
to establish this possible role.7
It is known that mammalian FMO strongly prefers not to accept physiological
nucleophiles (i.e. gluthatione and cysteine) that would otherwise cause a nonproductive
futile cycle of NADPH consumption and glutathione depletion. As the KM values for
methionine and cysteine S-conjugates are at mM concentration, it may call into question
the importance of such metabolism in vivo.9,40
The physiological role of S-oxygenation of cysteamine to cystamine by FMO is
not known. It was suggested that FMO has a role in protein disulfide bond formation
through oxygenating of cysteamine.62 Based entirely on speculation it is thought that
FMO oxygenation of cysteamine may serve to help control the overall thiol/disulfide
redox state of the cell, which in turn, controls many important pathways. FMO could
have a simple protective function. Cysteamine above the concentration of 40 uM is
toxic to cells, apparently through the transition metal-dependent formation of H2O2.63
Therefore, FMO may control the H2 2
2 2 Cysteamine can reach mM
cellular concentration. Hence, FMO oxygenation of cysteamine to cystamine followed
by its transport to the cytosol may represent a detoxication mechanism.
O level and the expression of genes regulated by
H O , sulfhydryl/disulfid ratios and general redox state.64
FMO catalyzes the sulfoxydation of the methyl sulfids of lipoic acid, however its
potential role in lipoic acid metabolism is not yet known. Lipoic acid plays important
role in energy metabolism (i.e. cofactor of the piruvate dehydrogenase enzyme
complex) and protection of mitochondria during aging.65
Reactive metabolites formed by FMO have not yet been observed to inactivate
the FMO enzyme, however they inhibit or covalently modify proximal proteins,
including CYPs.21,66
28
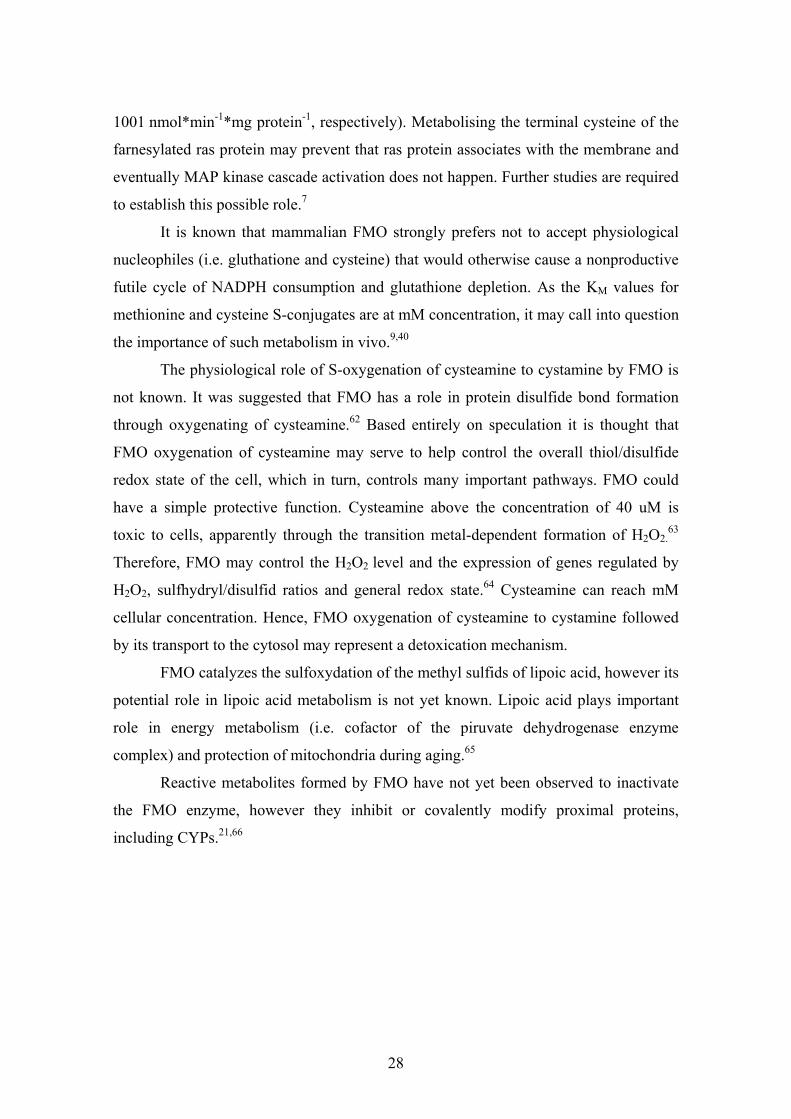
1.5.2 Xenobiotic metabolism: detoxication or bioactivation
a) Detoxication
FMO is involved in the oxygenation of a wide range of heteroatom-containing
compounds transforming xenobiotics to more polar, readily excreted (N-oxide or S-
oxide) forms. Generally, FMO takes part in the detoxication of substrates such as
synthetic therapeutic drugs and natural compounds in the diet like alkaloids. The N-
oxygenation of tertiary amine usually results in detoxication.
E.g.:
MPTP
FMO
MAO-B
MPTP N-oxide: readily excreted
MPDP+ MPP+: resulting parkinsonism
CYPPTP
FMO-mediated metabolism might be underestimated since tertiary amine N-oxide
can be reduced back to its parent amine by CYPs or reductases (eg. nicotine,
tamoxifen), just as N-hydroxylamines to primary and secondary amines by
benzamidoxime reductase (BOR). By this mechanism FMO provides a reservoir of
parent drug, prolonging its action. Since FMO often contributes to the formation of the
same metabolite pool produced by CYPs, its action is frequently overlooked.9
Regarding sulfur-containing compounds FMO prevents other cellular
macromolecules by being damaged from reactive metabolites such as sulfines, sulfenes
and sulfenic acids generated by other enzymes like CYPs.10
b) Bioactivation
The FMO enzyme family has also been implicated in the bioactivation of several
xenobiotics resulting in metabolites with greater electrophilicity, as mentioned above
(i.e. sulfenic acid, sulfinic acid).7,40 Thiourea S-oxygenation is an example of FMO-
dependent bioactivation of xenobiotics. The sulfenic acid produced reversibly reacts
with GSH and drives oxidative stress through redox cycles; whereas sulfinic acid is
responsible for inactivating CYPs.7
The N-oxygenation of secondary amines does not always result in detoxication. An
FMO-mediated metabolism of N-deacetyl-ketoconazole appears to be involved in
29
hepatotoxicity. FMO-dependent production of hydroxylated secondary and primary
amines can lead to complexation with hemoproteins including CYP, resulting in
inhibition and toxicity.67 The adverse effect (hepatotoxicity) of ethionamide is due to
FMO mediated metabolism.9
1.5.3 FMO in drug development
Xenobiotic metabolism primarly occurs via CYPs. Hepatic CYP3A isoform has a
dominant role as it is responsible for transformation of 50-60 % of drugs metabolised by
CYPs, and as a consequence drug-drug interactions could mainly be associated to
CYP3A.
In drug development many candidates have failed on pharmacokinetic and
toxicological causes. For example, toxic metabolites or bioavailability problems were
responsible for many failures. The aim of drug research is to develop efficient and safe
drugs with acceptable bioavailability. Utilizing the drug metabolism pathway involving
flavin-containing monooxygenase and minimizing P450-mediated bioactivation could
mean a strategy which may produce metabolites with lower or no toxicity, lead to
higher bioavailability and decrease the chance of drug-drug interactions as the
metabolism of a chemical is distributed over a wider scale of monooxygenases.
a) Drug metabolism shifted toward FMO-mediated metabolism
Cisapride, mosapride and itopride are gastrokinetic agents. Cisapride and mosapride are
metabolized mainly by CYP3A4-mediated dealkylation. Itopride mainly undergoes
FMO-catalyzed tertiary amine N-oxygenation (75 % of oral dose in humans). The
adverse effect (life-threatening ventricular arrhythmias) observed with cisapride with
concurrent administration of CYP3A4 inhibitor was not seen using itopride.
b) Prodrug approach
Retroreduction of oxygenated N-containing compounds may provide a novel prodrug
approach. An enzyme system that requires NADH-cytochrome b5 reductase,
cytochrome b5 and a third component with the characteristic of cytochrome P450
(CYP2D6 or CYP2A) is responsible for hydroxylamine reduction. For drugs rapidly
30
metabolized or for those with problematic pharmacokinetic properties, utilizing a
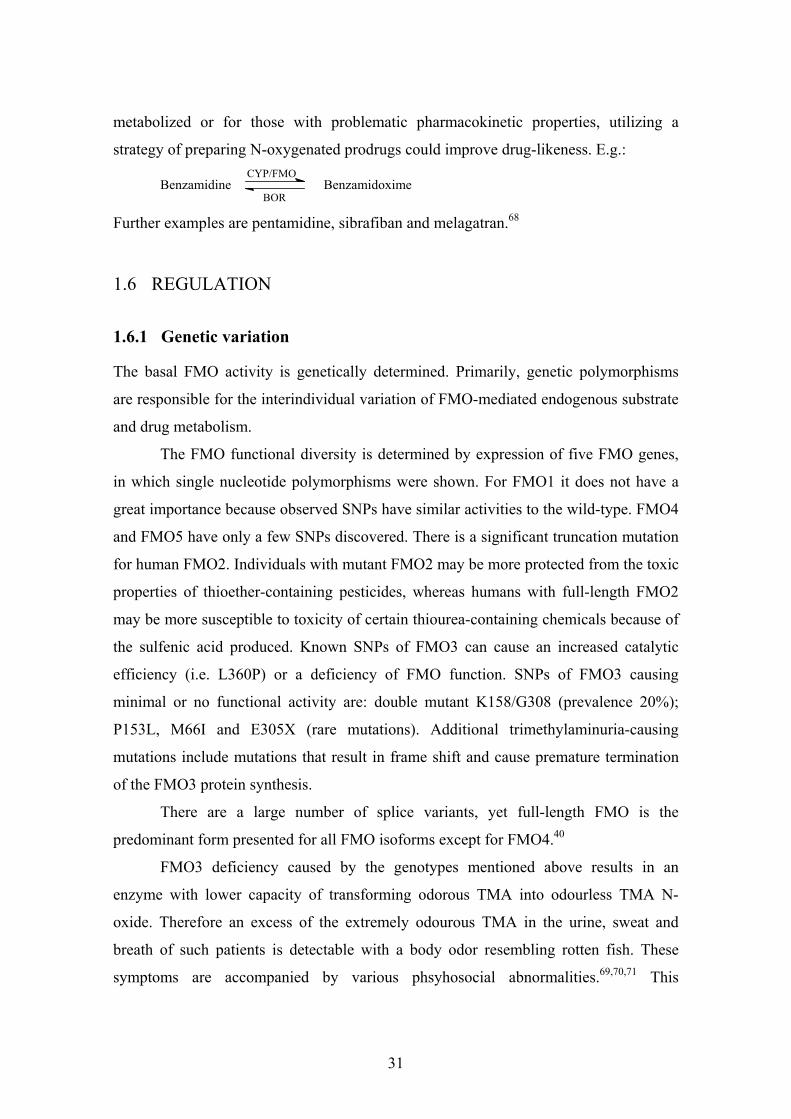
strategy of preparing N-oxygenated prodrugs could improve drug-likeness. E.g.:
Benzamidine BenzamidoximeCYP/FMO
BOR Further examples are pentamidine, sibrafiban and melagatran.68
1.6 REGULATION
1.6.1 Genetic variation
The basal FMO activity is genetically determined. Primarily, genetic polymorphisms
are responsible for the interindividual variation of FMO-mediated endogenous substrate
and drug metabolism.
The FMO functional diversity is determined by expression of five FMO genes,
in which single nucleotide polymorphisms were shown. For FMO1 it does not have a
great importance because observed SNPs have similar activities to the wild-type. FMO4
and FMO5 have only a few SNPs discovered. There is a significant truncation mutation
for human FMO2. Individuals with mutant FMO2 may be more protected from the toxic
properties of thioether-containing pesticides, whereas humans with full-length FMO2
may be more susceptible to toxicity of certain thiourea-containing chemicals because of
the sulfenic acid produced. Known SNPs of FMO3 can cause an increased catalytic
efficiency (i.e. L360P) or a deficiency of FMO function. SNPs of FMO3 causing
minimal or no functional activity are: double mutant K158/G308 (prevalence 20%);
P153L, M66I and E305X (rare mutations). Additional trimethylaminuria-causing
mutations include mutations that result in frame shift and cause premature termination
of the FMO3 protein synthesis.
There are a large number of splice variants, yet full-length FMO is the
predominant form presented for all FMO isoforms except for FMO4.40
FMO3 deficiency caused by the genotypes mentioned above results in an
enzyme with lower capacity of transforming odorous TMA into odourless TMA N-
oxide. Therefore an excess of the extremely odourous TMA in the urine, sweat and
breath of such patients is detectable with a body odor resembling rotten fish. These
symptoms are accompanied by various phsyhosocial abnormalities.69, ,70 71 This
31
metabolic disease is called: trimethylaminuria. It was first mentioned in the
Mahabharata, in an Indian epic tale (1400 B.C.), where a young woman was ostracized
from the society because she smelled like rotting fish. Moreover, Shakespeare was
likely referring to a TMAuria patient in a scene from “The tempest”.34 The first clinical
description was given by Humbert in 1970, on a young patient.72
There are several subtypes of this disorder: 1. primary genetic (autosomal
recessive hereditary disease), 2. hepatitis induced form, 3. childhood transient form
(immaturity of the enzyme), 4. transient form associated with menstruation, 5. precursor
overload (Huntington chorea or Alzheimer treatment with choline at high daily dosage),
6. disease states (liver cirrhosis, uremic patients).34
The incidence of trimethylaminuria has been reported to be between 0.1-1% in
British Caucasians.73 A higher prevalence of trimethylaminuria is observed in the
tropics which maybe a protection from insects.74 The disease is diagnosed by urinary
ratios of TMA-NO and TMA following a challenge dose of choline. The effective
treatment appear to be dietary restriction (low choline, carnitine, lecithine, fish),
antibiotics to inhibit bacterial reduction of TMA N-oxide in the intestine (e.g.
metronidazole), laxatives to decrease transit time (e.g. lactulose), enchancement of
residual FMO3 activity by supplementation of riboflavin, folate supplementation since a
methyl donor may interact with choline and methionine in the metabolic processes,
charcoal and copper-chlorophyllin (deodorant). Individuals having functional
polymorphisms of FMO3 metabolise related substrates (dietary compounds, drugs and
pesticides) in a distinct manner.34
Several psychiatric disturbances have been reported in patients with TMAuria
and these have been presumed to be psychosocial reactions to the odour. Feelings of
shame, low selfesteem, social isolation, anxiety, depression, suicidal tendencies,
paranoia, educational and career disadvantages, relationship difficulties, addiction to
alcohol and other drugs and overt aggression have been described. Speculation of a
causative linkage between neurological disorders and deficient TMA N-oxygenation
could be conceivable along several lines.75
32
1.6.2 Dietary, developmental, hormonal control
In contrast to CYPs, FMO is not readily induced or inhibited by exogenous compounds.
Thus, changes in FMO activity as a consequence of environmental influences are not
likely to be dramatic.
FMO is regulated at transcriptional, posttranscriptional and posttranslational
levels. A number of factors can influence the expression of FMO (physiological and
dietary factors)40 and alter the activity of FMO (cofactor supply, modulators).
Transcriptional regulation of FMO involving receptors, ligand-binding and interaction
with DNA have not been widely studied as possible other forms of regulation.
Previously identified regulatory elements were found at the rabbit FMO1 promoter such
as the hepatic nuclear factor, homeodomain-containing factor (HNF1α), the hepatic
nuclear factor, orphan nuclear receptor (HNF4α) and the Yin Yang-1 (YY1) sites.
HNF1α and HNF4α were demonstrated to enhance FMO1 promoter activity, whereas
YY1 suppressed the ability of the upstream domains to enhance transcription.76 These
regulatory elements are conserved between rabbit and human FMO1. In rainbow fish,
hypersalinity induces FMO. Its regulatory pathway is not clear, but it was proposed that
cortisol directly regulate FMO. A glucocorticoid response element has been identified
in the promoter region of mammalian FMO1.77,78
A posttranslational regulatory effect could be the N-glycosylation of FMO1
selectively at Asn120.40 An NO modification of FMO3 activity in rat liver was also
reported. FMO3 activity and mRNA level were suppressed by NO, whereas dithiotreitol
and ascorbate were shown to restore FMO3 activity79.
A number of other mechanisms to regulate CYP including the enchancement of
mRNA stability, enzyme phosphorylation and protein-protein interactions either do not
occur for FMO or have not been reported.12
Dietary control
Rats switched from commercial chow diet to chemically defined diet (total parenteral
nutrition or synthetic aminoacid diet), exhibited a marked reduction in liver FMO
activity. These results suggested the existence of plant-derived constituents capable of
FMO induction.80 I3C and its gastric acid condensation products cause a marked
reduction in FMO activity.15 Total parenteral nutrition plus choline in rats caused a 3-
33
fold increase in hepatic microsomal FMO along with CYP2E1 induction.81 The FMO
activity was reduced by ca 30 % in starved female mice.82 Guinea pigs maintained on an
ascorbic acid free diet exhibited a significant decrease (45 %) in hepatic N-oxidation of
dimethylaniline.83
Developmental control
The most striking example for developmental control is the selective and antiparallel
expression of FMO1 and FMO3 in fetal and adult human liver. FMO1 is the major form
in human fetal liver, while FMO3 becomes the dominant form in adult liver. Human
FMO3 is not expressed in fetal liver, but it is induced after birth (0-8 years of age). The
signal for termination of FMO1 expression is related to the parturition and not to
gestation age.9 Other age-related changes in FMOs of human brain were shown only in
case of FMO1. It was also downregulated shortly after birth.40
In mice, FMO3 is presented 2 weeks after birth in both gender and remains until
puberty. Then, testosterone represses FMO3 enzyme production in males, while the
production does not change in females.38
Hormonal control
In rodents, FMO is regulated by steroids (sex steroids and glucocorticoids) and growth
hormone.84 Rat liver appears to be subject to positive regulation by testosterone and
negative control by estradiol.85 The expression of hepatic FMO1 seems to be repressed
by testosterone in male mice.38,85 Estradiol plays a role in the determination of FMO
activity in rat lung and kidney (FMO2 and FMO1).40 Cortisol regulates hepatic FMO
activity in female mice82 and also in rainbow fish77. FMO2 mRNA and protein
expression in pregnant rabbit correlates with progesterone and corticosterone. Up to a
20-fold variation of FMO activity has been observed in the corpora lutea of pigs during
estorus. Gestation increases FMO2 activity in rabbit86, mouse placenta87 and pig corpora
lutea88. The activity was also affected by the circadian rhythm, as it was lower ca 40 %
in the morning than in the afternoon in female mice.82
These observations have not yet been reported for humans. However, transient
trimethylaminuria was observed in females during menstruation.34
34
1.6.3 Pathophysiological status: diabetes
Diabetics are unable to absorbe glucose in certain cells because of insulopenia or insulin
resistance, leading to sugar accumulation in their blood.
Two classes of diabetes mellitus, type I and type II, with type II comprising over
80 % of the clinical cases, are known. Type I diabetes (also called juvenile or insulin-
dependent diabetes mellitus – IDDM) generally develops when patients are in the
adolescence and is characterized by the destruction of the β-cells, responsible for the
production of insulin, in the islet of Langerhans. Bacterial infection may set off an
immunological reaction in susceptibile people, which may initialize this form. Type II
diabetes (noninsulin dependent diabetes mellitus – NIDDM) generally develops later in
life and is caused by insulin resistance. Obesity and family history are prime risk factors
for the development of this form. Type I diabetes is treated with insulin
supplementation, while type II can often be controlled with diet, exercise and oral
hypoglycaemic agents available.89, ,90 91
CYP and FMO are the two major microsomal monooxygenase enzyme families
responsible for drug metabolism. Although many aspects of pathophysiological
consequences of diabetes mellitus have been scrutinized and its effect on drug
metabolism has been widely studied, there are only few reports regarding FMO. It
should also be noted that the effect of diabetes on various drug metabolising enzyme
systems depends on the type of the disease.
My thesis deals with the study of alteration of microsomal metabolic enzymes in
STZ-induced diabetic rats with type I form, therefore in the next part a brief survey will
be given on diabetes mellitus with special regard to pharmacokinetic and metabolic
aspects.
The effect of diabetes on pharmacokinetic parameters
For most drugs oral absorption is unlikely to be affected by diabetes, although a delay in
the absorption of tolazamide and a decrease in the absorption of ampicillin have been
reported. Subcutanous absorption of insulin is more rapid in diabetic patients, whereas
the intramuscular absorption of several drugs is slower.
The protein binding of a number of drugs in the blood is reduced in diabetes,
which may be due to the glycosylation of plasma proteins or displacement by plasma
35
free fatty acids, the level of which is increased in diabetic patients. Plasma
concentration of albumin and α1-acid glycoprotein does not appear to be changed by the
disease. The distribution of drugs with little or no protein binding in blood is generally
not altered, although the volume of distribution of antipyrine is reduced by 20 % in
IDDM.
Dainith in 1976 suggested that the clearance of antipyrine and other drugs could
be higher in diabetics92 (Table 5.). In addition, an elevated clearance of theophyllin was
found in type I93, but unchanged in type II diabetes94. The presence of fatty liver in
NIDDM may contribute to a reduced hepatic clearance, whereas decreased protein
binding in blood may cause an increased clearance.
The effect of diabetes on hepatic blood flow in humans appears to be unknown.
In diabetic adults the renal clearance of drugs either is comparable with that
found in nondiabetic individuals or reduced.95
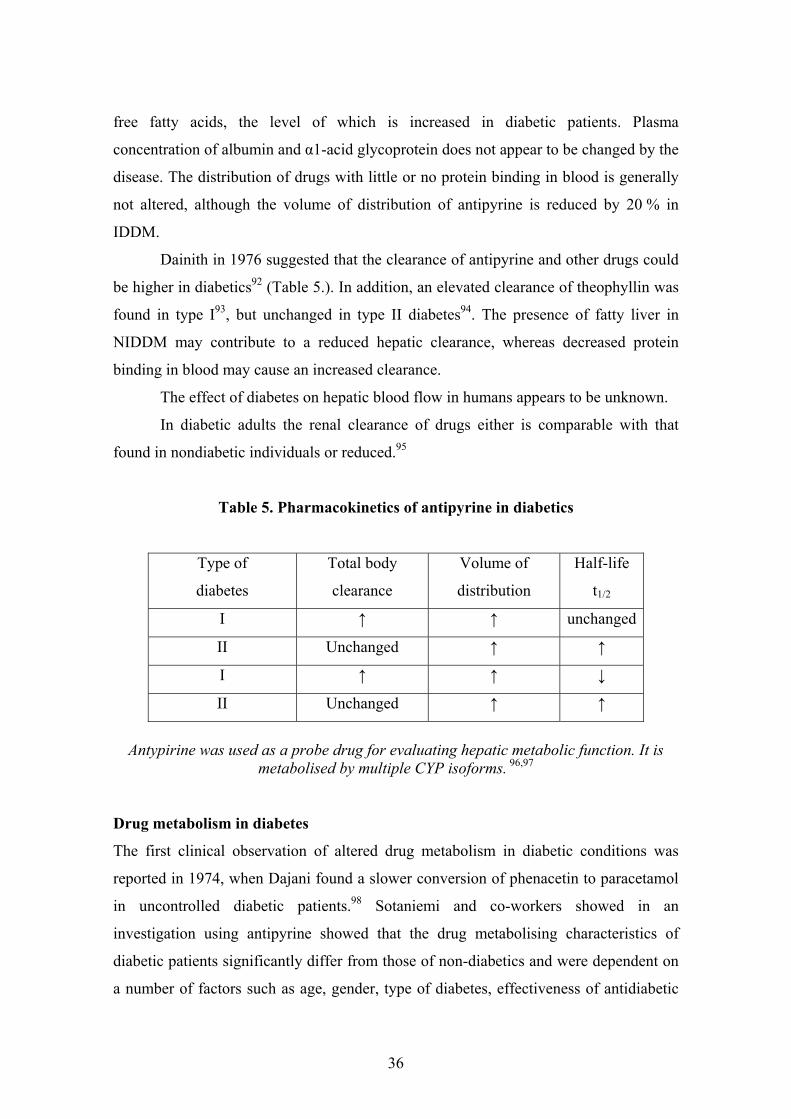
Table 5. Pharmacokinetics of antipyrine in diabetics
Type of
diabetes
Total body
clearance
Volume of
distribution
Half-life
t1/2
I ↑ ↑ unchanged
II Unchanged ↑ ↑
I ↑ ↑ ↓
II Unchanged ↑ ↑
Antypirine was used as a probe drug for evaluating hepatic metabolic function. It is
metabolised by multiple CYP isoforms. 96,97
Drug metabolism in diabetes
The first clinical observation of altered drug metabolism in diabetic conditions was
reported in 1974, when Dajani found a slower conversion of phenacetin to paracetamol
in uncontrolled diabetic patients.98 Sotaniemi and co-workers showed in an
investigation using antipyrine showed that the drug metabolising characteristics of
diabetic patients significantly differ from those of non-diabetics and were dependent on
a number of factors such as age, gender, type of diabetes, effectiveness of antidiabetic
36
therapy and hepatic status, especially liver histology.99 Even in well-controlled diabetes,
drug metabolism may be altered, and the nature and extent of the changes are dependent
on the type of the disease.100 In human type II diabetes the expression of hepatic FMO5
isoform is markedly down-regulated.101 Alterations of FMO expression and activity in
diabetic patients could be of significance in drug therapy as a number of therapeutic and
recreational drugs are substrates for FMO to a certain extent.9
To elucidate the effect of diabetes on drug metabolism, studies on diabetic
animals were performed. The two primary ways of developing diabetic animals are their
treatment with streptozotocin (STZ) or alloxan in order to destroy pancreatic β-cells
responsible for insulin production. The mechanism of diabetogenesis regarding the two
agents is different. STZ at a dosage of 40-60 mg/kg administered by i.v. or >40-60
mg/kg i.p. causes IDDM while a dosage of 100 mg/kg on the day of birth causes
NIDDM. The latter form can also be modeled with congenital diabetic (Ob/Ob)
animals. The main reason for STZ induced β-cell death in the pancreas is DNA
alkylation.102
Alloxan at a dosage of 65 mg/kg administered by i.v. or at 150 mg/kg i.p. causes
diabetes in rats. 103 The toxic action of alloxan on pancreatic cells is a sum of several
processes such as oxidation of essential –SH groups, inhibition of glucokinase,
generation of free radicals and disturbances in intracellular calcium homeostasis. 104
STZ has a higher specificity as a β-cytotoxic agent in rat and is therefore reputed to be
less toxic as compared to alloxan.105
Animal studies on experimental type I diabetes revealed that diabetic state
modified the CYP-mediated hepatic metabolism of certain drugs. 106 It was reported that
codein, chlorpromazine, hexobarbital and phenylbutazone were metabolized more
slowly in alloxan-diabetic male rats than in control animals.106,107 The elimination rate
of chlorpropramide fell rapidly in diabetic animals.108 The microsomal metabolism of
aniline was reported either increased109 or unchanged110. In addition, the FMO-mediated
imipramin N-oxidation in the liver increased 1.5- to 2-fold in comparison to control
mice both in congenital and STZ-induced diabetes.111
Focusing on streptozotocin-induced diabetic rats, changes in drug metabolizing
capacity of hepatic monooxygenases have been reported. There are several conflicting
reports on the changes in hepatic CYP content and isozyme activities. Both, increase112
37
and absence of change113 of total cytochrome P450 content in diabetes were reported.
An elevated cytochrome b5 level was detected in diabetic rats in the latter study. In case
of CYP2B, CYP3A and CYP2E1 both induction112, ,114 115 and repression have been
reported110
14
2
, ,112116 . The induction of CYP1A activity was confirmed by independent
studies.113,1 The most likely explanation for these discrepancies is that the metabolic
status of experimental animals -just as it was mentioned above for humans - is strongly
influenced by the varying severity of induced diabetes. In addition, strain, sex and age
may also introduce some variations.117 In diabetic rats, Rouer and her co-workers
detected two-fold higher FMO activity than in normal rats, whereas they could not show
any changes in FMO protein expression. However, a slight structural difference of the
enzymes was indicated by the analysis of their tryptic peptide profiles.118 In the study of
Wang the hepatic FMO1 protein expression and activity were induced 2.5-fold and 1.8-
fold in diabetic rats compared to non-diabetic rats.119 Based on animal studies, it was
suggested that in diabetes the higher FMO activity might be due to the presence of an
endogenous factor120, a post-translational enzymatic activation or changes in
conformation of the enzyme in the membrane caused by changes of its lipid
composition.117,121 Rouer proposed that the activity of the flavin monooxygenase
appears to be controlled by a glycoregulatory hormone.122
The effect of insulin supplementation was studied in diabetic rats. The change of
the hepatic metabolic rate of aminopyrine on insulin treatment was reversible11
whereas that of aniline and testosterone were not115. Insulin treatment itself caused a
significant change only in the activity of ethoxyresorufin O-deethylase.123 Yamazoe
suggested that insulin might exert an indirect effect on CYPs through the normalization
of growth-hormon-mediated process(es) in diabetic rats.114
Enhanced CYP2E1 protein expression and suppressed CYP2B and CYP3A
expressions were seen in the absence of insulin in primary rat hepatocyte culture.124
Moreover, Woodcroft had demonstrated that insulin suppresses CYP2E1 transcription.
Insulin as a regulator of flavin-containing monooxygenase in experimental diabetes
has not yet been demonstrated.
38
2 RESEARCH OBJECTIVES
Our main goal was to study if insulin has a role in FMO regulation. For this purpose we
induced experimental diabetes using streptozotocin as diabetogenic agent. Rat was
selected as a model animal. Rats were divided into 5 groups: 1. control, 2. STZ-induced
diabetic (lower dosage), 3. STZ-induced diabetic (higher dosage), 4. insulin treated
diabetic, 5. insulin treated non-diabetic rats. Changes in FMO function was determined
at two levels: enzymatic activity and gene expression. FMO activity was measured
using BZY as an FMO specific substrate and the BZY N-oxide produced was analysed
and quantified by an HPLC method applying UV detection developed by us. The gene
expression of FMO1 and FMO3 were followed by quantitative Real-time PCR. Along
that, the changes in abundance of cytochromes (cytochrome P450 and cytochrome b5)
and the enzymatic activities of hepatic CYP1A, CYP2B, CYP2E1 and CYP3A were
characterized in order to support and complete the results in our experimental model
system. The objectives were as follows:
1. Does insulin have a role in FMO regulation?
2. Does insulin treatment in STZ-induced diabetic rats restore FMO function?
3. Does the severity of diabetes show a significant correlation with FMO function?
4. Does insulin itself regulate FMO in non-diabetic rats?
5. Does insulin regulate the function of FMO at enzymatic and/or gene expression
level?
6. Are both FMO isoforms equally sensitive to insulin-deficiency?
7. Does FMO activity correlate with the activity or abundance of any other
cytochrome enzymes altered in experimental diabetes?
39
3 MATERIALS AND METHODS
3.1 BIOCHEMICALS
All biochemicals used were of the highest purity available from commercial sources.
Streptozotocin, sodium dithionite, 6β-hydroxytestosterone, aminopyrine, glucose-6-
phosphate, glucose-6-phosphate dehydrogenase, ethoxyresorufin and benzydamine were
obtained from Sigma-Aldrich (St. Louis, MO), MpTS and its sulfoxide was from
Sigma-Aldrich Chemie GmbH (Steinheim, Germany). Benzydamine N-oxide
metabolite was synthetized in the Synthetic Chemistry Research Laboratory II of
Gedeon Richter Ltd (Budapest, Hungary) by an established method.125 It was identified
and characterized by comparison of melting point and TLC, NMR and MS data to that
of the authentic samples. Tolperisone hydrochloride and metabolite standards were
synthesized in Gedeon Richter Ltd (Budapest, Hungary). Resorufin and 4-nitrocatechol
were from Aldrich Chemical Co. (Milwauuke, WI). Testosterone was from Fluka
(Buchs, Switzerland). Para-nitrophenol, sodium pyrophosphate, MgCl2, NADPH,
perchloric acid, sodium bicarbonate, phosphoric acid and acetic acid were obtained
from Reanal (Budapest, Hungary). Insulin (Ultratard) was purchased from Novo
Nordisk (Novo Allé, Denmark). Human liver microsomes for studying deprenyl
metabolism were obtained from Xenotech LLC (Kansas City, KS, USA), while for
tolperisone studies from In Vitro Technologies (Baltimore MD). Microsomes
containing recombinant human FMO1 and FMO3 from baculovirus-insect cell
(supersomes) were purchased from BD Gentest (Woburn, MA, USA). Hydrochloride
salts of S- and R-methamphetamine, S- and R-amphetamine, S- and R-deprenyl, S- and
R-methamphetamine-hydroxylamine, S- and R-amphetamine-hydroxylamine, 1R,NR-
and 1S,NS-deprenyl N-oxide, and the diastereomeric mixture (1:1) of 1R,NR and
1R,NS- and 1S,NS- and 1S,NR-deprenyl N-oxide, and S-para-fluorodesmethyldeprenyl
(internal standard) were kindly provided by Chinoin Pharmaceutical and Chemical
Works, a member of the Sanofi-Aventis Group (Budapest, Hungary). CE-grade 2-
(hydroxy-propyl)-β-cyclodextrin was supplied by Beckman Coulter (Fullerton, CA,
USA). Hydroxypropylmethylcellulose was obtained from Sigma (St. Louis, MO).
Discovery C18 Lt SPE cartridges (Supelco, Bellefonte, PA, USA) were used for solid-
40
phase extraction of the samples. Chromatographic solvents were of gradient grade and
were purchased from Merck (Darmstadt, Germany).
3.2 ANIMALS AND INDUCTION OF DIABETES
The study was carried out in accordance with the Declaration of Helsinki. Male
Sprague-Dawley rats (160-170 g) were purchased from Harlan (Holland). Rats were
maintained at 20-25 °C on a 12-h light/12-h dark cycle, with access to water and food
ad libitium. Diabetes was induced by a single intraperitoneal injection of buffered
solution (0.1 mol/l citrate, pH 6.0) of streptozotocin at doses of 50 and 70 mg/kg. The
animals were considered diabetic if their blood glucose concentrations elevated over
350 mg/dl on the 4th day following streptozotocin treatment. The animals were
separated in 5 groups: control (n=8); diabetic rats treated with streptozotocin at
50 mg/kg dose (n=9), D50; diabetic rats treated with streptozotocin at 70 mg/kg dose
(n=8), D70; diabetic rats treated with streptozotocin at 70 mg/kg dose and from the 5th
day insulin treatment was initiated with dose gradually increasing (on day 1: 20,
day 6: 40, day 7: 50 and from the day 8: 2x75 IU/kg/day) (n=8), ID70; and non-diabetic
rats with insulin treatment daily at a dosage of 50 IU/kg for avoiding hypoglycaemia
(n=5), IND. During insulin treatment blood glucose level was checked twice daily using
Glucotrend kit (Mannheim, Germany). Animals were sacrificed by cervical dislocation
2 weeks after the streptozotocin treatment in a short interval so as to avoid circadian
variation.
3.3 PREPARATION OF LIVER MICROSOMES
After isolating the liver it was homogenised in 1.15 % KCl containing Tris-HCl buffer
(0.1 M, pH 7.4) with the volume/mass ratio of 2:1 buffer (V, ml) and liver (m, g). The
buffer also contained 0.2 mM ethylenediamine-tetraacetic acid (EDTA), 0.1 mM
dithiotreitol (DTT), 0.1 M tris hydroxymethyl aminomethane (Tris), 1.15 % of KCl and
10 % of glycerine. The pH was adjusted with HCl to 7.4.
Individual rat liver microsomes (RLM) were prepared by differential
centrifugation (the homogenate was centrifuged for 15 min at 9000 x g, the supernatant
41
was ultracentrifugated for 60 min at 105000 x g). The microsomal pellet obtained was
resuspended in the same buffer.
The microsomal protein content was measured with alkaline folin phenol reagent
with bovine serum albumin as standard using the method described by Lowry.126
Therefore, 2 ml mixture of three reagents (A: 10 ml 0.2 N NaOH + 4 % Na2CO3, B: 0.2
ml 2 % KNa- tartrate, C: 0.2 ml 1 % CuSO4) were added to an equal volume of the
microsomal suspension (0.25 %). Ten minutes later 0.2 ml of Folin-Ciocalteu phenol
reagent was added. After 30 minutes of exposure the absorbance of violet Cu-complex
in the samples was determined at 750 nm by spectrophotometer (Beckman DU-30).
3.4 DETERMINATION OF CYTOCHROME CONTENT
The content of cytochromes (i.e. cytochrome P450 and cytochrome b5) was essentially
determined by the method described by Greim (1970).127 Briefly, 1.2 ml of microsomal
suspension was bubbled by carbon monoxide for 15-20 seconds (20-30 bubbles) and
divided into two aliquots (i.e. sample and reference cell). The aliquot in the sample cell
was reduced by a few crystals of solid dithionite and the differential spectra were
recorded. Cytochrome P450 concentration (nmol/mg protein) was calculated from the
absorbance difference measured at 450 and 490 nm using ε=91 mM-1cm-1, whereas the
concentration of cytochrome b5 was calculated from the same spectra from the
difference of absorbences measured at 409 and 424 nm by the use of ε=161 mM-1cm-1
(Hitachi U-3300).
3.5 ENZYMATIC ASSAYS
All incubations were carried out in incubation mixtures containing 6.25 mM sodium
pyrophosphate, 5 mM MgCl2, 5 mM glucose-6-phosphate, 1 U/ml glucose-6-phosphate
dehydrogenase and 0.25 to 1 mg/ml RLM in a final volume of 0.5 or 2 ml of 0.1 M
Tris-HCl buffer, pH 7.4. Incubation time and microsomal protein concentrations were
within the linear range of metabolite formation.
42

3.5.1 FMO index reaction: Benzydamine N-oxygenation
BZY/BZY N-oxide transformation was used as an FMO specific index reaction. BZY
N-oxide was measured by a modified method of Kawaji50 (see in Results).
NN
O
N
NN
O
N
O
FMO1 / FMO3
Fig. 8. FMO-mediated BZY N-oxide formation
The metabolic profile of BZY transformation in rat liver microsomes was also
studied. The analytical measurement was performed on a Thermo Finnigan Surveyor
HPLC system equipped with UV and MS detector. A Superspher 60 Rp-select B,
4x125 mm, (5 µm) column was operated at 0.8 ml/min flow rate, maintained at 30 °C.
The metabolites of BZY were determined using a mobil phase of a mixture of methanol
and 0.1 M ammonium-acetate in the presence of 0.1 % AcOH, using a gradient of 20:80
(A) to 80:20 (B); gradient steps: A of 60 (2 min), 10 (6-13 min), and 60 % (13.1-15
min). The UV signal was detected at 306 nm. 10 µl supernatant was injected onto
HPLC. The MS was set up for positive ionization (ESI) with an ionising potential of 3
kV; the temperature of the capillary was 220 ºC.
3.5.2 CYP1A index reaction: Ethoxyresorufin O-deethylation
CYP1A1/2 specific activity was measured by a modified method of Burke.128 In a final
volume of 2 ml the substrate concentration was 100 µM, the microsomal protein
concentration 1 mg/ml. Prior to the initiation of the reaction by the addition of 7-
ethoxyresorufin a 5 minutes long preincubation was taken along. The incubation was
carried out for 15 minutes in shaking water bath at 37 °C. After the indicated time the
43

reaction was stopped with 1 ml of ice-cold methanol. Then the samples were
centrifuged for 30 minutes at 3000 x g, at 4 °C. The supernatant was then analysed by
fluorometer (Hitachi F-4000) as the metabolite, resorufin, is fluorescent (λex=535 nm
and λem=585 nm). The metabolite concentration was determined based on the
calibration of resorufin at 125, 250, 500, 1000, 1500, 2000 and 2500 nM.
3.5.3 CYP2B/3A index reaction: Aminopyrine N-demethylation
Aminopyrine N-demethylation was determined by measuring formaldehyde formation
via the method of Nash.129 The substrate concentration was 4 mM, the microsomal
protein concentration used was 1 mg/ml in a final volume of 2 ml. The reaction was
initiated by the addition of NADPH. The incubation was carried out for 30 minutes in
shaking water bath at 37 °C. After the indicated time the reaction was stopped with
500 µl of 20 % TCA. Then the samples were centrifuged for 20 minutes at 3000 x g, at
4 °C. In order to develope the colour reaction 2 ml Nash reagent was added to 1.5 ml of
supernatant and left them in waterbath at 37 °C, without shaking. After 30 minutes, the
samples were spectrophotometrically quantified at 410 nm (Beckman DU-30). The
produced formaldehyde concentration was determined based on the calibration of
HCHO at 20, 40, 80, 160 and 400 µM.
3.5.4 CYP2E1 index reaction: p-Nitrophenol-hydroxylation
CYP2E1 specific activity was measured by a modified method of Reinke and Moyer.130
The substrate concentration was 2 mM, the microsomal protein concentration used was
1 mg/ml in a final volume of 2 ml. The reaction was initiated by the addition of
NADPH. The incubation was carried out for 15 minutes in a shaking water bath at
37 °C. After the indicated time the reaction was stopped with 500 µl of 20 % TCA.
Then, the samples were centrifuged for 20 minutes at 3000 x g, at 4 °C. In order to
develope the colour reaction 1 ml 2 M NaOH reagent was added to 1.5 ml of
supernatant. The samples were quantified at 505 nm wavelength (Beckman DU-30).
The produced p-nitrocatechol (PNC) concentration was determined based on the
calibration of PNC at 2.5, 5, 10, 20, 30, 40, 50, 60 and 75 µM.
44
3.5.5 CYP3A index reaction: Testosterone-6β-hydroxylation
CYP3A specific activity was measured by a modified method of Anderson.131 The
substrate concentration was 500 µM, the microsomal protein concentration used was
0.25 mg/ml in a final volume of 500 µl. The reaction was initiated by the addition of
NADPH. The incubation was carried out for 5 minutes at 37°C using a shaking water
bath. After the indicated time the reaction was stopped with 500 µl of ice-cold
methanol. Samples were placed into a refrigerator (-20 °C) for 10 minutes. Then the
samples were centrifuged for 10 minutes at 10000 x g, at 4 °C. The supernatant was
injected onto HPLC. The analytical measurement was performed on a Merck-Hitachi
LaChrom HPLC system equipped with UV detector. Purospher C18e 125 x 4 mm (5
µm) column (Merck) operated at 0.8 ml/min flow rate, maintained at 40 °C. 6β-
hydroxytestosterone was determined using mobil phases of methanol/0.1 M
ammonium-acetate, 45:55 (A) and methanol (B) with a gradient (A of 100 (4 min), 40
(14-17 min), and 100 % (20-26 min)). UV detection was at 254 nm.
The metabolite concentration was determined based on the calibration of 6β-
hydroxytestosterone at 1, 5 and 25 µM.
3.6 DETERMINATION OF THE MRNA OF FMO1 AND FMO3 ISOFORMS
3.6.1 Isolation of total RNA
The isolation was carried out using RNeasy Mini Kit (Qiagen) by following the given
protocol. Hence, 30-30 mg of liver sample of each examined animal was placed into
500 µl aliquotes of RNA stabilization reagent. The tissue was disrupted and
homogenized in Potter with lysing buffer, containing highly denaturating guanidine
isothiocyanate. The tissue lysate was centrifuged at 10000 x g for 3 minutes. The
supernatant was transferred to a new microcentrifuge tube and 500 ul of 70 % ethanol
was added. Then 700 µl of the sample was applied to an RNeasy mini column (silica-gel
membrane) and DNA and protein were eluted 3 times with washing buffer. The mRNA
was eluted by 50 µl of RNase-free water. This procedure provides enrichment for
mRNA.
45
3.6.2 Measurement of concentration and integrity of RNA
The concentration and integrity of purified RNA was checked by Agilent 2100
bioanalyser using RNA 6000 Nano Assay kit. RNA quality is characterized by a
number called RNA integrity number (RIN), given in a scale of 0-10.
3.6.3 Synthesis of cDNA
Full-length first strand cDNA was generated from an RNA template using Ready–To-
Go You-Prime First-Strand Beads (Amersham Pharmacia Biotech) with addition of 2
µg of denaturated total RNA sample and random primers (Promega). The reaction was
carried out at 37 ˚C for 60 minutes.
3.6.4 Gene expression analysis
The quantification of mRNA levels was performed using Applied Biosystem TaqMan®
Gene Expression Assays. One-tube TaqMan Real-time PCR was ran using Taqman
Universal PCR master Mix (Applied Biosystems) and standard conditions in 25 µl
reactions on the ABI PRISM® 7000 Sequence Detection System (Applied Biosystems).
Specific amplifications of cDNA was performed using TaqMan® Gene Expression
Assays consist PCR primers and FAM™ dye-labeled TaqMan® MGB probe. Taqman
assays for rFMO1 (Rn00562945_m1) rFMO3 (Rn00584825_m1) and huGAPDH
(Applied Biosystems) were used. GAPDH was used as an endogenous control to
normalize for differences in amount of total RNA added to the reaction. Treshold cycle
(Ct) was determined for GAPDH, FMO1 and FMO3. The measurements were done two
times in triplicates. The relative amount of FMO1 and FMO3 mRNA was determined
by comparative Ct method as the following:
CtGAPDH = average for GAPDH of the sample in question
CtFMO= individual value for FMO of the sample in question
∆Ct=CtFMO-CtGAPDH
∆∆CtFMOtreated=∆CtFMOtreated-average(∆CtFMO control)
Fold-induction FMO treated=2-∆∆CtFMOtreated
46
3.6.5 Data analysis
Statistical analysis was performed by Statistica 6.0 (StatSoft, Inc.). Normality test
(Shapiro-Wilk’s test) and homogenity test (Bartlett’s test) were run for all datasets in
order to determine whether they have Gaussian distribution and homogenity in their
variances. In case of parametric distribution one-way analysis of variance (ANOVA)
was used which was followed by Tukey multicomparison test if any significant change
was shown. This procedure was followed for all enzyme activities and content datasets
except for FMO activity and mRNA values. The latter ones had non-parametric
distribution (despite transformations), therefore for their analyses Kruskal-Wallis
multicomparison test was used. Mean, S.D. and correlation coefficient were calculated
by GraphPad Prism 2.01 (GraphPad Software, Inc.). The confidence interval was
chosen to 95 %.
3.7 FMO-MEDIATED BIOTRANSFORMATION OF SOME CNS DRUGS
3.7.1 Tolperisone
All incubations were carried out in incubation mixture described in chapter 3.5.
Tolperisone concentration used was 5 µM (inhibition experiment) or 0-1500 µM
(enzyme kinetic measurement). In incubations with human liver microsomes (HLM),
the mixture contained 1 mg/ml of pooled microsomal protein and the reaction was
initiated by the addition of NADPH and conducted using a shaking water bath at 37 ˚C
for 20 minutes. Tolperisone consumption and major metabolite formation was measured
by HPLC. In incubations containing insect cell-expressed recombinant human FMO3
the enzyme concentration was 1 nmol/ml. The reactions were initiated by the addition of
microsomes and incubated in water bath at 37 ˚C, without shaking, according to the
manufacturer’s recommendation. Microsomes prepared from wild-type baculovirus
infected cells were used as control. The reaction was stopped with equal volume of ice-
cold methanol, centrifuged for 10 min at 7500 x g, and 10 µl of supernatant was injected
into HPLC. Thiourea at 10 mM was used as a competitive inhibitor of FMO3 in an
inhibition study carried out with HLM. Tolperisone was used as an assumed inhibitor
and MpTS/MpTSO transformation as an FMO index reaction125 for determining Ki of
47
tolperisone using insect cell-expressed recombinant human FMO3 enzyme. Incubations
were performed for 20 minutes. MpTSO was analysed with HPLC.
Analytical measurements were carried out using a Merck-Hitachi LaChrome HPLC
system equipped with UV detector. Discovery C18 150x4.6 mm (5µm) column with
Supelguard 20x4 mm (5 µm) column (Supelco, Bellefonte, PA) was maintained at 40 ˚C
for all assays. Tolperisone and hydroxymethyl-tolperisone was monitored at 256 and
251 nm, respectively. The system was operated at 0.8 ml/min flow rate, under isocratic
conditions. The mobile phase contained 47 % methanol in 0.1 M ammonium-acetate.
MpTSO was monitored at 233 nm using methanol/0.1 M ammonium-acetate, 34:46 (A)
and methanol (B) as mobile phases with a gradient grade of (A) 100 (5 min), 35 (12
min) and 100 % (16-22 min).
3.7.2 Deprenyl, amphetamine, methamphetamine enantiomers
All incubations were carried out in the incubation mixture described previously in
chapter 3.5. The concentration of substrates was 1 mM. In incubations with human liver
microsomes, the mixture contained 1 mg/ml microsomal protein and the reaction was
initiated by addition of NADPH (0.5 mM final concentration), and carried out in
shaking water bath at 37 ˚C for 30 min. For the incubations containing insect cell-
expressed recombinant human FMOs the enzyme concentration was 100 nM (FMO1
and FMO3). The reactions were initiated by the addition of supersomes and incubated
in water bath at 37 ˚C, without shaking, in accordance with the manufacturer’s
recommendation. Microsomes prepared from wild-type baculovirus infected cells were
used as control. The reaction was stopped with equal volume of 0.4 M cold perchloric
acid and centrifuged for 10 min at 10000 x g. After solid-phase extraction, the residue
redissolved in distilled water was analysed by capillary electrophoresis (CE). All
experiments were performed with a P/ACE MDQ CE system controlled by 32 Karat
software, Version 5.0 (Beckman Coulter). The instrument was equipped with UV
detector, set at 200 nm. Separations were carried out in fused-silica capillaries, 75 µm
ID, 365 µm OD, 50.2 cm total length, 40 cm to the detector (Polymicro Technologies,
Phoenix, AZ, USA). Samples were introduced into the capillary by pressure (5s, 0.5 psi)
with the sample volume corresponding to about 1.25 % of the capillary volume. The
48

separations were carried out applying a constant voltage of 25 kV, and the temperature
was maintained at 15 ˚C.
49
4 RESULTS
4.1 DRUG METABOLIZING MICROSOMAL ENZYMES IN DIABETIC RATS
4.1.1 Changes of physical and biochemical parameters in diabetic rats
Streptozotocin treated rats became diabetic (25 animals out of 27) with symptoms of
polydipsia, polyuria, hyperglycaemia and decreased rate of body weight gain. The
measured physiological parameters of the animals are summarized in Table 6. Control
and insulin treated non-diabetic (IND) rats consistently had blood glucose levels of
approx. 100 mg/dl and 110 mg/dl respectively, while rats receiving streptozotocin at
50 and 70 mg/kg doses (in order to reach a broader interval of blood glucose level for
correlation studies) displayed about a five-fold increase in blood glucose levels 520 and
540 mg/dl, respectively. Diabetic rats had a dose-dependent reduction of body weight
and wet liver weight compared to controls, at the time of sacrifice. Insulin treatment of
diabetic animals only partially compensated the rise of blood glucose levels
(390 mg/dl), but fully the changes of body weight and wet liver weight, which resulted
in an enhanced relative liver weight. The body weight and the wet liver weight of IND
animals were reduced in comparison to control animals.
50
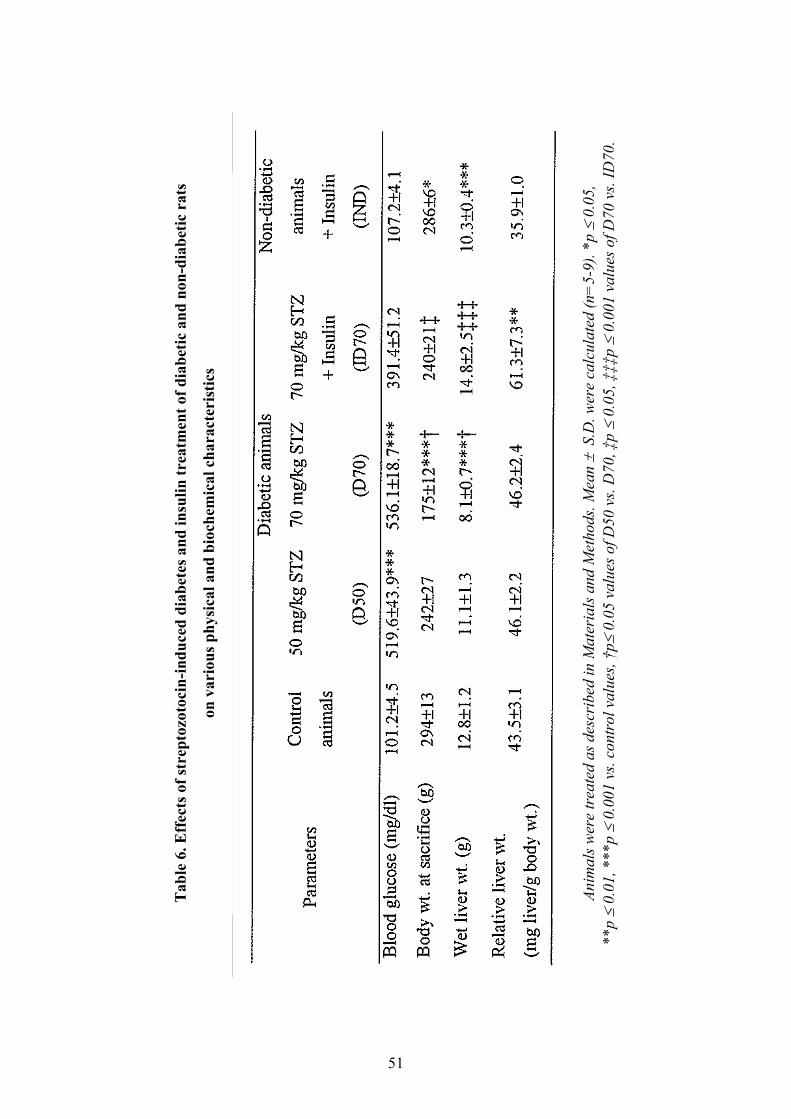
Anim
als w
ere
trea
ted
as d
escr
ibed
in M
ater
ials
and
Met
hods
. Mea
n ±
S.D
. wer
e ca
lcul
ated
(n=
5-9)
. *p ≤
0.05
, **
p ≤
0.01
, ***
p ≤
0.00
1 vs
. con
trol
val
ues,
†p≤
0.05
val
ues o
f D50
vs.
D70
, ‡p ≤
0.05
, ‡‡‡
p ≤
0.00
1 va
lues
of D
70 v
s. ID
70.
Tab
le 6
. Eff
ects
of s
trep
tozo
toci
n-in
duce
d di
abet
es a
nd in
sulin
trea
tmen
t of d
iabe
tic a
nd n
on-d
iabe
tic r
ats
on v
ario
us p
hysi
cal a
nd b
ioch
emic
al c
hara
cter
istic
s
51
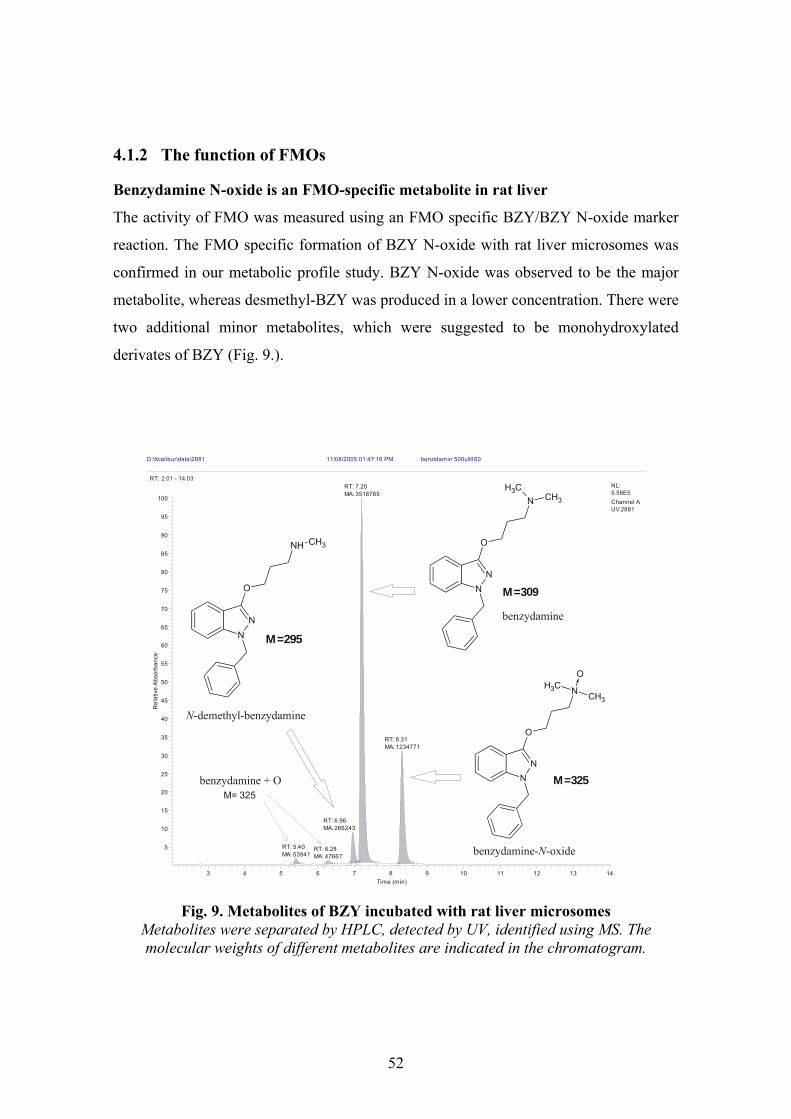
4.1.2 The function of FMOs
Benzydamine N-oxide is an FMO-specific metabolite in rat liver
The activity of FMO was measured using an FMO specific BZY/BZY N-oxide marker
reaction. The FMO specific formation of BZY N-oxide with rat liver microsomes was
confirmed in our metabolic profile study. BZY N-oxide was observed to be the major
metabolite, whereas desmethyl-BZY was produced in a lower concentration. There were
two additional minor metabolites, which were suggested to be monohydroxylated
derivates of BZY (Fig. 9.).
D:\Xcalibur\data\2881 11/08/2005 01:47:16 PM benzidamin 500uM 60
RT: 2.01 - 14.03
3 4 5 6 7 8 9 10 11 12 13 14Time (min)
5
10
15
20
25
30
35
40
45
50
55
60
65
70
75
80
85
90
95
100
Rel
ativ
eA
bsor
banc
e
RT: 7.20MA: 3518785
RT: 8.31MA: 1234771
RT: 6.96MA: 266243
RT: 5.40MA: 53941
RT: 6.28MA: 47667
NL:5.58E5Channel AUV 2881
NN
O
NH CH3
M=295
NN
O
NCH3CH3
O
M=325
NN
O
NCH3
CH3
M=309
benzydamine
benzydamine- -oxideN
N-demethyl-benzydamine
benzydamine + OM= 325
Fig. 9. Metabolites of BZY incubated with rat liver microsomes
Metabolites were separated by HPLC, detected by UV, identified using MS. The molecular weights of different metabolites are indicated in the chromatogram.
52

Development of a new HPLC-UV method for the determination of benzydamine N-oxide
Based on the study of substrate-, protein- and time-dependency of BZY/BZY N-oxide
transformation, the parameters of incubation were all within the linear range. The
substrate concentration was 500 µM, the microsomal protein concentration used was
0.25 mg/ml in a final volume of 500 µl. The reaction was initiated by the addition of
NADPH. The incubation was carried out for 5 minutes using a shaking water bath at
37 °C. After the indicated time the reaction was stopped with 500 µl of ice-cold
methanol. Samples were placed into a –20 °C fridge for 10 minutes. Then, the samples
were centrifuged for 10 minutes at 10000 x g, at 4 °C followed by injection of 10 µl
supernatant onto HPLC. The analytical measurement was performed on a Merck-
Hitachi LaChrom HPLC system equipped with UV detector. Purospher C18e 125 x 4
mm (5 µm) column (Merck) operated at 0.8 ml/min flow rate, maintained at 30 °C.
Benzydamine N-oxide was monitored at 306 nm. The mobile phase consisted of 58 %
methanol in 0.1 M ammonium-acetate and isocratic elution was applied. Under these
chromatographic conditions, BZY and BZY N-oxide eluted at 9.5 and 6.8 min,
respectively. The metabolite concentration was determined based on the calibration of
BZY N-oxide at 2, 5 and 25 µM. All measurements were carried out in triplicates.
Specific enzymatic activity of FMO
FMO activity elevated in D50 and D70 rats (p=0.0008 and p=0.0001, respectively). It
increased in a streptozotocin dose-dependent manner: 50 mg/kg and 70 mg/kg doses
caused 39 % and 73 % increase, respectively. In insulin treated diabetic (streptozotocin
70 mg/kg) (ID70) animals, the FMO activity was restored to the control level. Insulin
had no effect on the FMO activity of IND animals. (Fig. 10.).
53
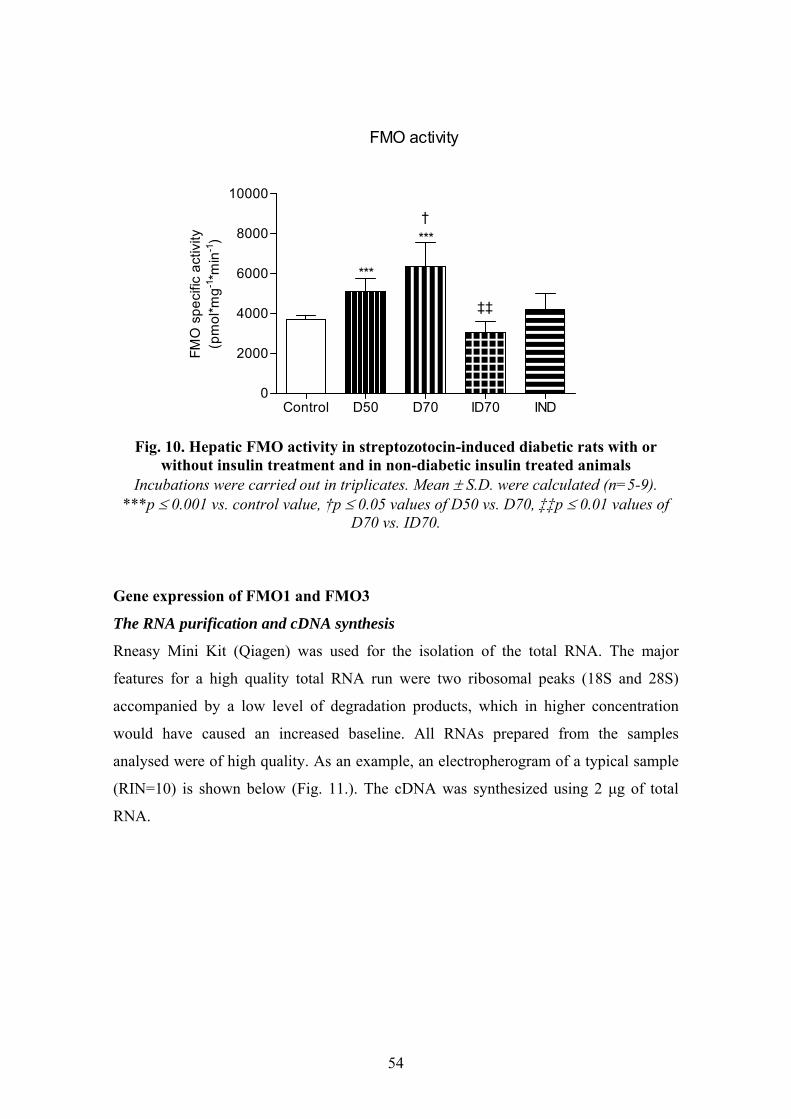
Control D50 D70 ID70 IND0
2000
4000
6000
8000
10000
***
***†
‡‡
FMO activity
FMO
spe
cific
act
ivity
(pm
ol*m
g-1*m
in-1
)
Fig. 10. Hepatic FMO activity in streptozotocin-induced diabetic rats with or
without insulin treatment and in non-diabetic insulin treated animals Incubations were carried out in triplicates. Mean ± S.D. were calculated (n=5-9).
***p ≤ 0.001 vs. control value, †p ≤ 0.05 values of D50 vs. D70, ‡‡p ≤ 0.01 values of D70 vs. ID70.
Gene expression of FMO1 and FMO3
The RNA purification and cDNA synthesis
Rneasy Mini Kit (Qiagen) was used for the isolation of the total RNA. The major
features for a high quality total RNA run were two ribosomal peaks (18S and 28S)
accompanied by a low level of degradation products, which in higher concentration
would have caused an increased baseline. All RNAs prepared from the samples
analysed were of high quality. As an example, an electropherogram of a typical sample
(RIN=10) is shown below (Fig. 11.). The cDNA was synthesized using 2 µg of total
RNA.
54
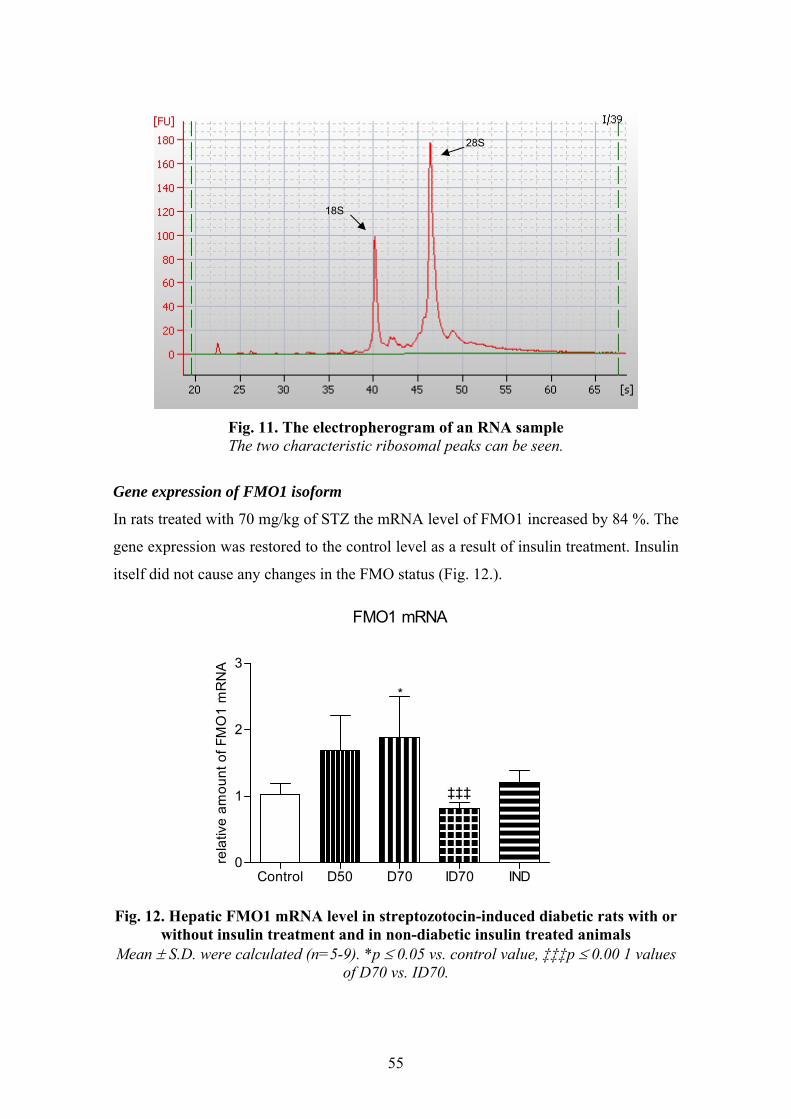
28S
18S
Fig. 11. The electropherogram of an RNA sample The two characteristic ribosomal peaks can be seen.
Gene expression of FMO1 isoform
In rats treated with 70 mg/kg of STZ the mRNA level of FMO1 increased by 84 %. The
gene expression was restored to the control level as a result of insulin treatment. Insulin
itself did not cause any changes in the FMO status (Fig. 12.).
FMO1 mRNA
Control D50 D70 ID70 IND0
1
2
3
*
‡‡‡
rela
tive
amou
nt o
f FM
O1
mR
NA
Fig. 12. Hepatic FMO1 mRNA level in streptozotocin-induced diabetic rats with or
without insulin treatment and in non-diabetic insulin treated animals Mean ± S.D. were calculated (n=5-9). *p ≤ 0.05 vs. control value, ‡‡‡p ≤ 0.00 1 values
of D70 vs. ID70.
55
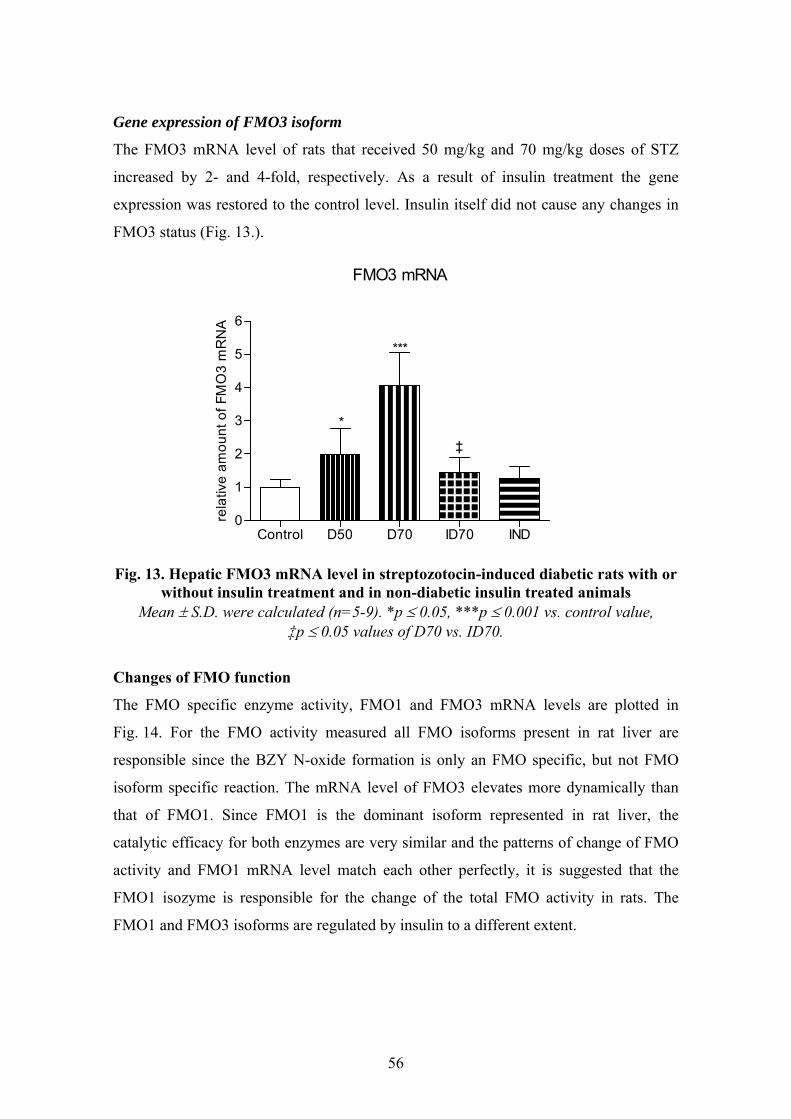
Gene expression of FMO3 isoform
The FMO3 mRNA level of rats that received 50 mg/kg and 70 mg/kg doses of STZ
increased by 2- and 4-fold, respectively. As a result of insulin treatment the gene
expression was restored to the control level. Insulin itself did not cause any changes in
FMO3 status (Fig. 13.).
FMO3 mRNA
Control D50 D70 ID70 IND0
1
2
3
4
5
6
*
***
‡
rela
tive
amou
nt o
f FM
O3
mR
NA
Fig. 13. Hepatic FMO3 mRNA level in streptozotocin-induced diabetic rats with or
without insulin treatment and in non-diabetic insulin treated animals Mean ± S.D. were calculated (n=5-9). *p ≤ 0.05, ***p ≤ 0.001 vs. control value,
‡p ≤ 0.05 values of D70 vs. ID70.
Changes of FMO function
The FMO specific enzyme activity, FMO1 and FMO3 mRNA levels are plotted in
Fig. 14. For the FMO activity measured all FMO isoforms present in rat liver are
responsible since the BZY N-oxide formation is only an FMO specific, but not FMO
isoform specific reaction. The mRNA level of FMO3 elevates more dynamically than
that of FMO1. Since FMO1 is the dominant isoform represented in rat liver, the
catalytic efficacy for both enzymes are very similar and the patterns of change of FMO
activity and FMO1 mRNA level match each other perfectly, it is suggested that the
FMO1 isozyme is responsible for the change of the total FMO activity in rats. The
FMO1 and FMO3 isoforms are regulated by insulin to a different extent.
56

57
FMO
1 m
RNA
Con
trol
D50
D70
ID70
IND
0123456
*
‡‡‡
relative amount of FMO1 mRNA
FMO
3 m
RN
A
Con
trol
D50
D70
ID70
IND
0123456
*
***
‡
relative amount of FMO3 mRNA
FMO
act
ivity
Con
trol
D50
D70
ID70
IND
0123456
‡‡
† ***
***
relative FMO activity
FMO
1 m
RNA
Con
trol
D50
D70
ID70
IND
0123456
*
‡‡‡
relative amount of FMO1 mRNA
FMO
3 m
RN
A
Con
trol
D50
D70
ID70
IND
0123456
*
***
‡
relative amount of FMO3 mRNA
FMO
act
ivity
Con
trol
D50
D70
ID70
IND
0123456
‡‡
† ***
***
relative FMO activity
Fig.
14.
Com
pari
son
of F
MO
act
ivity
, FM
O1
and
FMO
3 m
RN
A le
vels
Bo
th, t
he F
MO
act
ivity
and
FM
O m
RNA
leve
ls w
ere
incr
ease
d in
dia
betic
rats
whi
ch d
eclin
ed to
con
trol
leve
l on
insu
lin tr
eatm
ent.
Ther
e w
ere
no c
hang
es o
bser
ved
in F
MO
stat
us in
non
-dia
betic
rats
trea
ted
with
insu
lin p
er se
. *p ≤
0.05
, ***
p ≤
0.00
1 vs
. con
trol
va
lues
; †p ≤
0.05
val
ues o
f D50
vs.
D70
; ‡p ≤
0.05
, ‡‡p
≤ 0
.01,
‡‡‡
p ≤
0.00
1 va
lues
of D
70 v
s. ID
70.
4.1.3 The function of cytochromes: CYP and cytochrome b5
Total cytochrome P450 content and cytochrome b5 concentration
Cytochrome P450 content in ID70 animals decreased by 34 % and 36 % in comparison
to control and diabetic (streptozotocin, 70 mg/kg) (D70) rats, respectively. In contrast to
cytochrome P450, major changes were shown in cytochrome b5 concentration in
untreated diabetic rats. The cytochrome b5 concentration increased in diabetic rats in a
streptozotocin dose-dependent manner: 50 mg/kg and 70 mg/kg doses caused 50 % and
95 % increase, respectively. The cytochrome b5 concentration in ID70 animals was
restored to control level, while in IND animals it remained unchanged (Table 7.).
Cytochrome P450 isozyme activities
The ethoxyresorufin O-deethylase activity, used as CYP1A marker reaction, increased
in diabetic rats by 48 % and 67 %, and it was restored to control values by insulin
treatment (Table 7.). In IND animals this CYP1A-mediated activity did not change. The
aminopyrine N-demethylase activity, a nonspecific index reaction of CYP2B/CYP3A,
decreased in diabetic rats in a streptozotocin dose-dependent manner: 50 mg/kg and
70 mg/kg doses caused mild reduction of activity. Aminopyrine N-demethylase activity
in ID70 animals was not restored to control level and there was a mild and significant
decrease in IND animals. The p-nitrophenol hydroxylase activity, an index reaction of
CYP2E1, did not change substantially either in ID70 or D70 rats. In contrast, there was
a marked 73 % decrease in CYP2E1 activity in IND rats. The CYP3A-mediated
testosterone 6β-hydroxylase activity increased by 43 % only in diabetic (streptozotocin,
50 mg/kg) (D50) rats. There was no change in CYP3A activity in either of the insulin
treated groups.
58
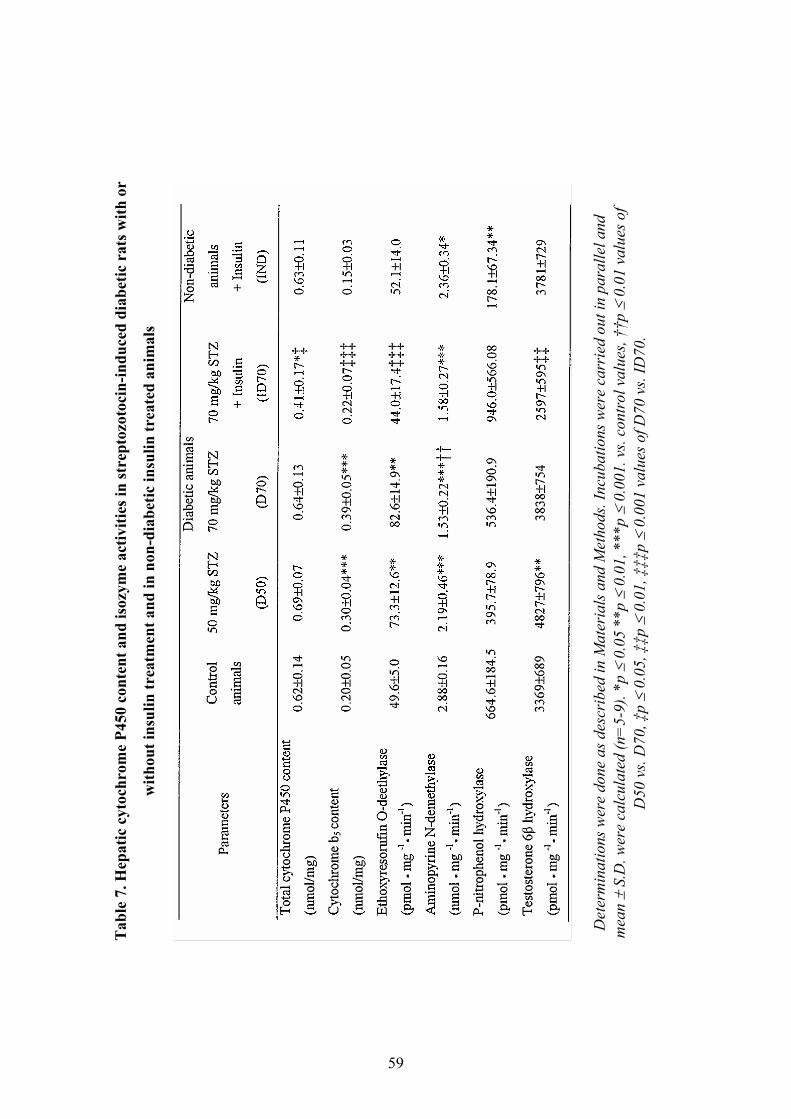
Tab
le 7
. Hep
atic
cyt
ochr
ome
P450
con
tent
and
isoz
yme
activ
ities
in st
rept
ozot
ocin
-indu
ced
diab
etic
rat
s with
or
with
out i
nsul
in tr
eatm
ent a
nd in
non
-dia
betic
insu
lin tr
eate
d an
imal
s
Det
erm
inat
ions
wer
e do
ne a
s des
crib
ed in
Mat
eria
ls a
nd M
etho
ds. I
ncub
atio
ns w
ere
carr
ied
out i
n pa
ralle
l and
m
ean ±
S.D
. wer
e ca
lcul
ated
(n=
5-9)
. *p ≤
0.05
**p
≤ 0
.01,
***
p ≤
0.00
1. v
s. co
ntro
l val
ues,
††p ≤
0.01
val
ues o
f D
50 v
s. D
70, ‡
p ≤
0.05
, ‡‡p
≤ 0
.01,
‡‡‡
p ≤
0.00
1 va
lues
of D
70 v
s. ID
70.
59

4.1.4 Correlation analysis
The directions and extents of the changes in blood glucose level, FMO activity and
cytochrome activities or contents (Table 8.) motivated us to perform regression analysis
between these parameters.
Table 8. The changes in blood glucose concentration, FMO activity, cytochrome
contents and activities in streptozotocin-induced diabetic rats with or without
insulin treatment and in non-diabetic insulin treated animals
Treatment BG FMO Total CYP Cyt.b5 CYP1A CYP2B/
CYP3A CYP2E1 CYP3A
D50 ↑↑ ↑ UC ↑ ↑ ↓ UC ↑
D70 ↑↑ ↑↑ UC ↑ ↑ ↓↓ UC UC
ID70 ↑ UC ↓ UC UC ↓↓ UC UC
IND UC UC UC UC UC ↓ ↓ UC
BG means blood glucose concentration. UC indicates that there was no change in comparison to the values of control animals.
Out of these parameters, the hepatic FMO activity and the cytochrome b5 content of
diabetic rats showed highly significant correlations with blood glucose concentration
and consequently with each other. The correlations between FMO activity and blood
glucose level and between FMO activity and cytochrome b5 content are shown in Fig.
15. and 16.
60
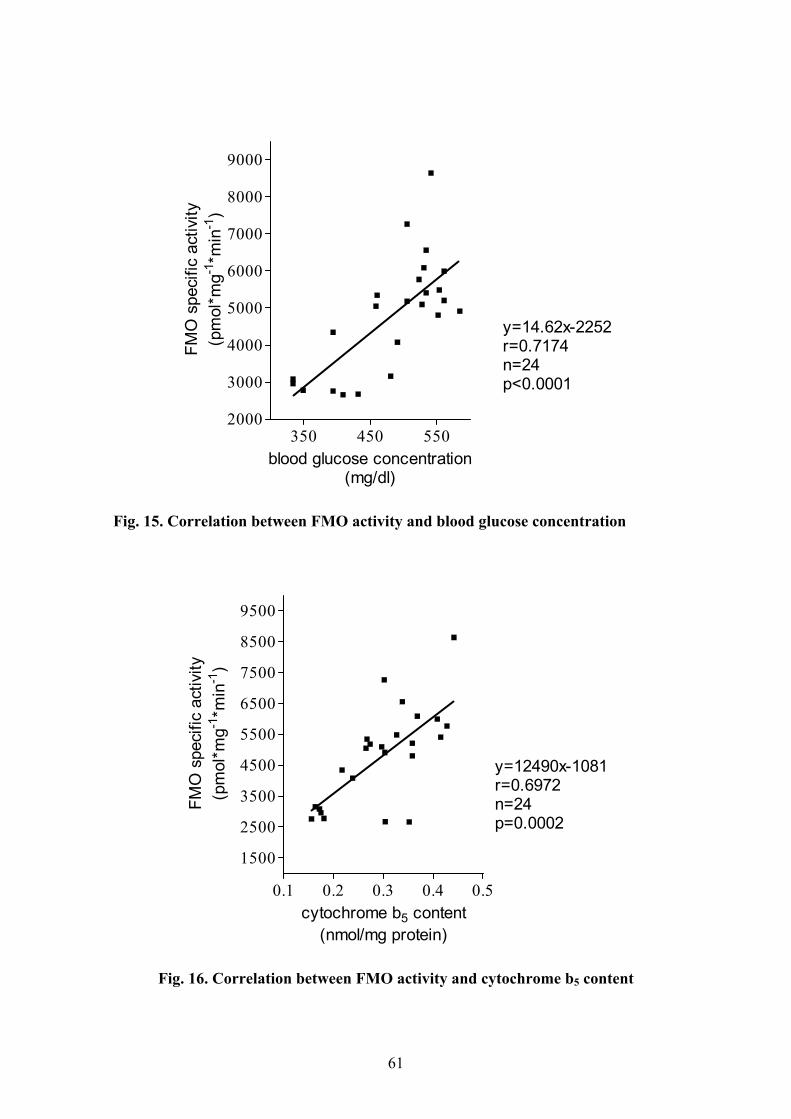
350 450 5502000
3000
4000
5000
6000
7000
8000
9000
y=14.62x-2252r=0.7174n=24p<0.0001
blood glucose concentration(mg/dl)
FMO
spe
cific
act
ivity
(pm
ol*m
g-1*m
in-1
)
Fig. 15. Correlation between FMO activity and blood glucose concentration
0.1 0.2 0.3 0.4 0.5
1500
2500
3500
4500
5500
6500
7500
8500
9500
y=12490x-1081r=0.6972n=24p=0.0002
cytochrome b5 content(nmol/mg protein)
FMO
spe
cific
act
ivity
(pm
ol*m
g-1*m
in-1
)
Fig. 16. Correlation between FMO activity and cytochrome b5 content
61

The analysis also gave significant correlations between average blood glucose
concentration and hepatic CYP1A and CYP3A activities and cytochrome P450
concentration (Table 9.).
Table 9. Regression analysis between blood glucose level and cytochrome contents
and activities and flavin-containing monooxygenase activity in streptozotocin-
induced diabetic rats with or without insulin treatment
Correlated parameters n r p BG with FMO activity 24 0.7141 <0.0001 BG with total cytochrome P450 content 24 0.5655 0.004 BG with cytochrome b5 content 24 0.7381 <0.0001 BG with CYP1A activity 24 0.5957 0.0021 BG with CYP3A activity 24 0.4900 0.0151 FMO activity with cytochrome b5 content 24 0.6972 0.0002
4.2 FMO-MEDIATED METABOLISM OF CNS DRUGS
4.2.1 Tolperisone
Tolperisone undergoes not only CYP-dependent, but also CYP-independent microsomal
biotransformation to a certain extent. The use of isoform-specific cytochrome P450
inhibitors, inhibitory antibodies and experiments with recombinant P450s pointed to
CYP2D6 as the prominent enzyme in tolperisone metabolism. In addition, CYP2C19,
CYP2B6 and CYP1A2 were also involved in the metabolism to a smaller extent. The
involvement of FMO was observed using a competitive inhibitor, thiourea in HLM. The
Ki of tolperisone was determined with FMO3 recombinant supersomes using MpTS
index reaction. Since thiourea did not inhibit tolperisone metabolism and the Ki of
tolperisone was 1197 µM in the MpTS oxidase reaction, FMO was suggested to not
contribute to tolperisone metabolism. Instead, the involvement of a microsomal
reductase was assumed.
62
4.2.2 Deprenyl, methamphetamine, amphetamine
The N-oxygenated metabolites of deprenyl, methamphetamine and amphetamine
enantiomers were assessed. The drugs were incubated with recombinant human FMO1
and FMO3, and human liver microsomes, respectively. The enantioselectivity of the
substrate preference as well as the stereoselective formation of the new chiral center
upon oxidation of the prochiral tertiary nitrogen of deprenyl were observed. FMO1 was
shown to be more active in the N-oxygenation of both deprenyl and methamphetamine
isomers compared to FMO3. The deprenyl enantiomers and S-methamphetamine were
substrates of human recombinant FMO3. Conversion of amphetamine to its
hydroxylamine derivative could not be observed in incubation with either FMO1 or
FMO3. Formation of the new chiral center on the nitrogen, during N-oxidation of the
tertiary amine deprenyl, was found stereoselective. The two FMO isoforms have shown
opposite preference in the formation of this chiral center. Methamphetamine-
hydroxylamine formed from methamphetamine was further transformed by FMO.
63

5 DISCUSSION
Diabetes mellitus is a complex metabolic disorder in which the energy metabolism is
disturbed. It affects carbohydrate, lipid, protein and drug metabolism. Changes in drug
metabolizing enzymes at enzymatic and gene expression level were observed regarding
flavin-containing monooxygenase and cytochrome enzyme systems in streptozotocin
induced diabetes.
5.1 CHANGES IN THE CYTOCHROME ENZYME SYSTEM: CYTOCHROME P450 AND CYTOCHROME B5
5.1.1 Hepatic cytochrome contents and CYP isoform activities
Regarding cytochrome enzyme systems in the liver, the abundance and activity of CYPs
as well as the content of cytochrome b5 were in agreement with those described in the
literature. In diabetic state, the total cytochrome P450 and p-nitrophenol hydroxylase
activity was not affected significantly and the cytochrome b5 concentration elevated as it
was observed by Barnett113 and Ackerman110. The aminopyrine N-demethylase activity
decreased compaerably to the study of Reinke112, the ethoxyresorufin O-deethylase and
testosterone 6β-hydroxylase activities increased as described by Yamazoe114 and
Shimojo115. The formation of 6β-hydroxytestosterone is catalysed by both CYP3A and
CYP2B1.114 The lack of increase in testosterone 6β-hydroxylase activity in 70 mg/kg
streptozotocin induced (D70) rats may have been due to the marked repression of
CYP2B.
In insulin treated diabetic rats the cytochrome b5 content, ethoxyresorufin O-
deethylase and testosterone 6β-hydroxylase, but not the aminopyrine N-demethylase
activities were restored to the control value. The p-nitrophenol hydroxylase activity did
not change, but there was a major standard deviation seen which may be due to the
interindividual variation of sensitivity to insulin.
In insulin treated non-diabetic rats p-nitrophenol hydroxylase and aminopyrine
N-demethylase activities showed significant repression in comparison to control values.
Woodcroft reported that insulin suppresses CYP2E1 transcription.132 The effect of
64
insulin on CYP2E1 enzymatic activity in non-diabetic rats (IND) indicated identical
tendency.
5.2 CHANGES IN THE FMO ENZYME SYSTEM
The role of insulin and ketone bodies in the regulation of CYPs (i.e. CYP1A2,
CYP2B1, CYP2E1) is proved124
1
, ,133 134, but regarding FMO these factors have not yet
been observed.
In our study it was confirmed that the FMO activity is elevated approximately 2-
fold in streptozotocin-induced diabetic rats and FMO1 isoform is responsible for this
change. Furthermore, we have shown that FMO activity and FMO1 and FMO3 mRNA
levels were nearly restored to the control value upon insulin treatment. A considerable
decrease in blood glucose concentration was shown, which did not reach the control
value. Insulin operated only in insulin deficient state and per se did not cause any
changes in FMO status.
5.2.1 Insulin as a regulator of FMO
In the study, blood glucose level (inverse indicator of insulin concentration) was
regularly checked. Glucose is the major factor responsible for insulin secretion from
pancreas β-cells. Glucose enters these cells through GLUT-2, an insulin-independent
form of glucose transporters and induces insulin secretion indirectly.90,9
Insulin affects cell functions at gene transcriptional, posttranscriptional and
posttranslational levels. The signal transduction of insulin starts with the binding of the
ligand to its plasmamembrane receptor. The insulin receptor is only functional in a
tetrameric form, in which the monomers (2α and 2β) are connected by disulfide bonds.
Insulin binding to the extracellular α-domain of insulin receptor induces intracellular,
intramolecular autophosphorylation of tirozines on β-domain. It stimulates tirozine
kinase, which is able to carry out phosphorylation of insulin receptor substrates (IRS)
directly (without mediators). There is another main pathway of insulin mediated
signaling that includes SH2 domain (src homology domain 2) containing proteins,
which bind to the phosphorylated tirozine on the β-domain of the receptor, and become
activated. The phospholipase C (PLC-γ) enzyme possesses an SH2 domain, which
65
makes it able to bind to phosphorylated tirozines. When it becomes activated, it is
translocated to the membrane. In the lipid bilayer PIP2 (phosphatidil-inositol 4,5
biphosphate) is hydrolized by PLC-γ into inozitol 1,4,5 –triphosphate (IP3) and diacyl
glycerol (DAG). IP3 binds to the Ca-store and releases Ca2+ ions. This leads to an
intracellular Ca2+ signal. Subsequently, Ca2+ binds to calmodulin producing a Ca2+-
calmodulin complex, which in turn can bind to various enzymes and activate them.
DAG stays in the membrane and activates protein kinase C (PKC). PKC is a
serine/treonin kinase having broad substrate-specificity and it induces the raf kinase and
so the mitogen activated protein kinase (MAP kinase) cascade. The steroid receptor
coactivator (Src kinase) can also be activated in the insulin-mediated pathway. Grb2,
another protein containing SH2 domain, stays in the cytoplasm and usually binds
together with SOS, which is a helper protein in the process of transforming GDT to
GTP for ras protein. The activated ras protein stimulates raf kinase, the first enzyme in
the MAP kinase cascade activation, which leads to the phosphorylation of various
proteins, transcriptional factors and kinases.
The main pathway of insulin transduction is likely to be the protein
phosphorylation/dephosphorylation. However, insulin also acts through Ca2+, IP3 and
DAG mediators.91,135 Long-term effects of insulin mediated by gene transcription,
protein synthesis, cell proliferation and cell differentiation are known. Furthermore, as
insulin binds to the IGF-1 receptors it has a growth forming effect as well.90,91 At least
one of these signaling patways is responsible for the insulin-mediated FMO regulation.
Covalent modification could occur on IRS and PLC-γ pathways. In our study, the
changes of FMO function in diabetes and insulin treated diabetes were detected not only
at enzymatic, but also at mRNA level. Therefore, it is strongly proposed that insulin
modifies FMO gene transcription or the stability of FMO mRNA. Since the FMO
activity increased in insulin deficiency, it decreased to control level on insulin
treatment, and insulin per se did not cause any changes of the FMO status, it was
suggested that insulin possesses a repressor function. Thus, it activates those signaling
pathways that are responsible for the binding of transcriptional factors to the cis
responsive element (i.e. promoter or enchancer/silencer regions) of the FMO gene.
66
It was demonstrated that the FMO3 isoform is approximately 2 times more
sensitive to insulin concentration compared to FMO1, a fact to keep in mind since the
FMO3 isoform is the dominant one in human liver.
5.2.2 Glucose as a marker for elevated FMO activity
In our study, the insulin level was altered by insulin administration to diabetic rats
(ID70). Nevertheless, blood glucose level, the inverse parameter of insulin
concentration was regularly checked. In short-term studies the determination of glucose
concentration is simple and characteristic for the severity of diabetes mellitus, whereas
long-term studies permit the determination of an other informative parameter, namely
hemoglobin A1c (HbA1c) concentration that indicates the long-term blood glucose
concentration. Since the regression analyses showed a highly significant correlation
between FMO activity and average blood glucose concentration in diabetic rats, blood
glucose is probably a marker for elevated FMO activity. Similarly, a highly significant
correlation was observed between the FMO activity and the HbA1c level in
streptozotocin-induced diabetic rats, either treated or not with insulin and in non-
diabetic animals confirming our present result (unpublished observation). The average
blood glucose levels between the groups treated with 50 and 70 mg/kg streptozotocin
did not differ significantly implying a nearly maximal diabetogen effect of 50 mg/kg
dose. Although, the increase of FMO activity showed dose-dependence of
streptozotocin, its biological meaning is questionable.
Total cytochrome P450 content, hepatic CYP1A and CYP3A activities were also
correlated with blood glucose level in diabetic rats.
5.2.3 Ketone bodies may have a role in FMO regulation
As ketone bodies were suggested to play a role in CYP regulation, the possibility that
acetoacetate and β-hydroxy-butyrate may have an influence on FMO regulation seems
to be conceivable. It was reported that acetone concentration rose sharply along with
blood glucose concentration in rats. The concentration was below 0.4 mM until the
serum glucose level exceeded 400 mg/dl, then elevated to 6 mM between 500-
600 mg/dl glucose.11 Although the acetone concentration was not measured in this 6
67
study, our results regarding FMO activity showed that the blood glucose level of
control, ID70 and IND rats was under 400 mg/dl, accompanied by a normal FMO
activity, whereas that of D50 and D70 rats ranged between 500-600 mg/dl, accompanied
by an elevated FMO activity. These parallel changes indicate that studies on the effect
of acetone on FMO activity at such doses may provide further pieces of information.
5.2.4 FMO correlates with cytochrome b5 enzyme in experimental diabetes
Interestingly, FMO activity and cytochrome b5 content had a tendency to change in the
same manner and both parameters showed strong correlation with the blood glucose
level as well as with each other in diabetic state. The role of cytochrome b5 in fatty acid
desaturation and drug metabolism is well recognized.136 The elevation of cytochrome b5
level is accompanied by the defect of terminal desaturase enzyme in diabetes.137 As the
afore-mentioned enzymes have the tendency to change in the same direction in diabetes,
it is probable that a change of FMO activity occurs when fatty acid metabolism is
disturbed. It was shown previously that FMO and cytochrome b5 are involved in the
metabolism of amines through the catalyzes of a redox reaction in the opposite direction
(N-oxygenation and retro reduction, respectively).12 Therefore, it is reasonable to
assume a common regulatory pathway between FMO and cytochrome b5.
5.3 THE PROPOSED INFLUENCE OF DIABETES INDUCED CHANGES OF FMO ACTIVITY ON TOLPERISONE, DEPRENYL, AMPHETAMINE, METHAMPHETAMINE METABOLISM
The metabolic pathways and profiles of tolperisone, deprenyl, amphetamine and
metamphetamine were studied.
Tolperisone was found to be a poor FMO substrate in humans. Firstly, it was a
weak inhibitor of FMO3 mediated MpTS/MpTSO index reaction using recombinant
enzyme with a Ki well over the diagnostic concentration range. Secondly, the turnover
number for tolperisone biotransformation was low to be relevant. Thirdly, thiourea used
at 10 mM was not capable of inhibiting the FMO-mediated metabolism of tolperisone in
HLM. Due to the high affinity constant of FMO for tolperisone, the diabetes induced
increase in FMO capacity is suggested to not have any influence on tolperisone
metabolism.
68
Deprenyl and its metabolites (methamphetamine and amphetamine) were
metabolized by FMO efficiently to their respective N-oxides or hydroxylamines. Both
tertiary amines were primarly transformed by the FMO1 isoform, although the FMO3
mediated metabolism was also observed. Therefore, it is suggested that diabetes induced
changes of FMO activity may have influence on the metabolism of deprenyl,
methamphetamine and amphetamine.
Finally, since insulin is a regulator of FMO, I would like to emphasize the necessity to
observe diabetes induced metabolic changes regarding this enzyme system in humans. It
is vital in one hand since FMO3, the dominant FMO isoform in adult liver, appears to
be very sensitive to insulin-deficiency; and on the other hand the number of compounds
understood to become metabolized with the contribution of FMO is constantly
increasing.
69
6 CONCLUSIONS
1. Insulin has a role in the regulation of FMO. We proposed a repressor function
for insulin based on the observed insulin-deficiency induced FMO activity,
which was restored on insulin supplementation to the control level and had no
influence on non-diabetic rats. These were reported for the very first time by us.
2. We confirmed that diabetes induced the FMO enzyme approximately by 2-fold,
and observed that the insulin treatment of STZ-induced diabetic rats restored the
FMO enzymatic activity.
3. We demonstrated that diabetes had an effect on FMO function. The severity of
diabetes was characterized by blood glucose concentration. A high correlation
was shown between FMO activity and blood glucose concentration (inverse
indicator of insulin level) in diabetic rats. Blood glucose level is a good marker
for FMO induction.
4. We revealed that insulin itself did not affect either the FMO activity or the gene
expression in non-diabetic rats.
5. Furthermore, the functional changes of FMO in diabetic and insulin treated
diabetic rats were shown not only at enzymatic, but also at gene expression
level, observing FMO1 and FMO3 isoforms.
6. We have recognized that the FMO1 and the FMO3 isoforms showed distinct
sensitivity to insulin-deficiency. We have shown that the FMO3 isoform is two
times more sensitive to insulin than FMO1, under the conditions examined.
7. Our regression analysis indicated a significant correlation between FMO activity
and cytochrome b5 content.
70
7 SUMMARY
INSULIN AS A REGULATOR OF FLAVIN-CONTAINING MONOOXYGENASE
ENZYME IN STREPTOZOTOCIN-INDUCED DIABETIC RATS
The flavin-containig monooxygenase enzyme (FMO) family is one of the major
microsomal monooxygenase enzyme systems involved in drug metabolism. Its
physiological role in mammals, aside from the transformation of trimethylamine into
trimethylamine N-oxide, is unknown. FMO1 and FMO3 isoforms are predominant in
the liver of experimental animals and humans, respectively. The activity of FMO
changes in certain pathophysiological conditions, for example in diabetes. Our main
goal was to study whether insulin has a role in FMO regulation. For this purpose we
induced experimetal diabetes in rats using streptozotocin, and then the diabetic rats
received insulin supplementation. Changes in FMO function were determined at the
level of enzymatic activity and gene expression. FMO activity was measured using an
FMO specific substrate, benzydamine. The FMO1 and FMO3 gene expressions were
observed by q-RT-PCR. Along that, the changes in abundance and activities of hepatic
cytochrome enzyme system were characterized in order to support and complete the
results in our experimental model system. It was shown that both, FMO activity and
FMO1 mRNA level increased approximately 2-fold in diabetic rats. These levels were
restored to the control level upon insulin supplementation and no change was observed
upon insulin treatment of non-diabetic animals. A repressor function was proposed for
insulin, because FMO activity was induced in insulin-deficiency, restored on insulin
supplementation to control level and had no influence per se. As a high correlation was
found between the FMO activity and the blood glucose level of diabetic rats, blood
glucose level was suggested to be a good marker for elevated FMO activity.
Furthermore, we have recognized that FMO1 and FMO3 isoforms showed distinct
sensitivity to insulin-deficiency.
1. Dalmadi B, Leibinger J, Szeberényi Sz, Borbás T, Farkas S, Szombathelyi Zs and Tihanyi K (2003) Identification of metabolic pathways involved in the biotransformation of tolperisone by human microsomal enzymes. Drug Metab Dispos, 31: 631-636.
71
2. Szökő É, Tábi T, Borbás T, Dalmadi B, Tihanyi K and Magyar K. (2004) Assessment of the N-oxidation of deprenyl, methamphetamine and amphetamine enantiomers by chiral capillary electrophoresis; an in vitro metabolism study. Electrophoresis, 25(16): 2866-75.
3. Borbás T, Benkő B, Szabó I, Dalmadi B, Tihanyi K. (2006) Insulin in flavin-containing monooxygenase regulation. Flavin-containing monooxygenase and cytochrome P450 activities in experimental diabetes. Eur J Pharm Sci, 28(1-2): 51-58.
4. Borbás T, Zhang J, Cerny MA, Likó I, Cashman JR (2006) Investigation of structure and function of a catalytically efficient variant of the human flavin-containing monooxygenase form 3 (FMO3). Drug Metab and Dispos, 34: 1995-2002.
72
REFERENCES 1 Ziegler DM. Microsomal flavin-containing monooxygenase: oxygenation of
nucleophilic nitrogen and sulphur compounds. In: Jakoby WB (Ed.), Enzymatic Basis
of Detoxication. Academic Press, New York, 1980: 201-277.
2 Ziegler DM, Mitchell CH. (1972) Microsomal oxidases IV; Properties of a mixed
function amine oxidase isolated from pig liver microsomes. Arch Biochem Biophys,
150: 116-125.
3 Miller JA, Kramer JW, Miller EC. (1960) The N-and-ring hydroxylation of 2
acetylaminofluorene during carcinogenesis in the rat. Cancer Res, 20: 950-962.
4 Ziegler DM, Jollow D, Cook DF. Properties of a purified liver microsomal mixed-
function amine oxidase. In: Kamin, Henry (Ed.), Proceedings of the Third International
Symposium on Flavins and Flavin-proteins. University Park Press, Butterworth and Co
Ltd., Baltimore, London, 1971: 507-522.
5 Rettie AE, Fischer MB: Transformation Enzymes: Oxidative, Non-P450. In: Woolf TF
(Ed.), Handbook of Drug Metabolism. Marcel Dekker Inc., New York, 1999: 132-151. 6 Cashman JR. Flavin monooxygenases. In: Ioannides C. (Ed.), Enzymes systems that
Metabolise Drugs and Other Xenobiotics. John Wiley and Sons Ltd., 2002: 67-93. 7 Cashman JR. (1995) Structural and catalytic properties of the mammalian flavin-
containing monooxygenase. Chem Res Toxicol, 8(2): 165-181. 8 Brunelle A, Bi YA, Lin J, Russel B, Luy L, Berkman C, Cashman JR. (1977)
Characterization of two human flavin-containing monooxygenase (FORM3) enzymes
expressed in Escherichia coli as maltose binding protein fusions. Drug Metab Dispos,
25(8): 1001-1007.
73
9 Krueger SK, Williams DE. (2005) Mammalian flavin-containing monooxygenase:
structure/function, genetic polymorphisms and role in drug metabolism. Pharmacol
Ther, 106: 357-387. 10 Cashman JR. In vitro metabolism: FMO and related oxygenations. In: Woolf TF
(Ed.), Handbook of Drug Metabolism. Marcel Dekker Inc., Ann Arbor, 1999, 477-506. 11 Birkett DJ, MacKenzie PI, Veronese ME, Miners JO. (1993) In vitro approaches can
predict human drug metabolism. Trends Pharmacol Sci, 14(8): 292-294.
12 Cashman JR. (2005) Some distinctions between flavin-containing and cytochrome
P450 monooxygenases. Biochem Biophys Res Commun, 338: 599-604. 13 Grothusen A, Hardt J, Brautigam L, Lang D, Böcker R. (1996) A convenient method
to discriminate between cytochrome P450 enzymes and flavin-containing
monooxygenases in human liver microsomes. Arch Toxicol, 71: 64-71. 14 Poulsen LL, Hyslop RM, Ziegler DM. (1979) S-oxygenation of N-substituted
thioureas catalysed by the pig liver microsomal FAD-containing monooxygenase. Arch
Biochem Biophys, 198: 78-88.
15 Larsen-Su S, Williams DE. (1996) Dietary indole-3-carbinol inhibits FMO activity
and the expression of flavin-containing monooxygenase form 1 in rat liver and intestine.
Drug Metab Dispos, 24(9): 927-931.
16 Correira MA. Human and rat liver cytochromes P450: Functional markers, diagnostic
inhibitor probes, and parameters frequently used in P450 studies (appendix). In: Ortiz
de Montellano PR (Ed.), Cytochrome P450 structure, mechanism and biochemistry.
Kluwer Academic/Plenum Publishers, New York, 2005: 619-943. 17 Bhagwat SV, Bhamre S, Boyd MR, Ravindranath V. (1996) Further Characterization
of rat brain flavin-containing monooxygenase. Metabolism of imipramine to its N-
oxide. Biochem Pharmacol, 51(11): 1469-75.
74
18 Myers CR, Porgilsson B, Myers JM.(1997) Antibobies to a synthetic peptide that
react with flavin-containing monooxygenase (HLFMO3) in human hepatic microsomes.
J Pharmacol Toxicol Methods, 37(2): 61-66.
19 Pike MG, Mays DC, Macomber DW, Lipsky JJ. (2001) Metabolism of disulfiram
metabolite, S-methyl N,N-diethyldithiocarbamate, by flavin monooxygenase in human
renal microsomes. Drug Metab Dispos, 29: 127-132.
20 Engler H, Taurog A, Nakashima T. (1982) Mechanism of inactivation of thyroid
peroxidase by thioureylene drugs. Biochem Pharmacol, 31: 3801-3806.
21 Kedderis GL, Rickert DE. (1985) Loss of rat liver microsomal cytochrome P450
during methimazole metabolism. Role of flavin-containing monooxygenase. Drug
Metab Dispos, 13: 58-61.
22 Katchamart S, Stresser DM, Dehal SS, Kupfer D, Williams DE. (2000) Concurrent
flavin-containing monooxygenase down-regulation and cytochrome P-450 induction by
dietary indoles in rat: implications for drug-drug interactions. Drug Metab Dispos, 28:
930-936. 23 Lawton M, Cashman J, Cresteil T, Dolphin C, Alfarra A. (1994) A nomenclature for
the mammalian flavin-containing monooxygenase gene family based on amino acid
sequence identities. Arch Biochem Biophys, 308: 254-257.
24 Hines RN, Hopp KA, Franco J, Saeian K, Begun FP. (2002) Alternative processing of
the human FMO6 gene renders transcripts incapable of encoding a functional flavin-
containing monooxygenase. Mol Pharmacol, 62: 320-25.
25 Philips IR, Dolphin CT, Clair P, Hadley MR, Hutt AJ. (1995) The molecular biology
of the flavin-containing monooxygenase of man. Chem Biol Interact, 96(1): 17-32.
75
26 Shephard EA, Dolphin CT, Fox ME, Povey S, Smith R, Phillips IR. (1993)
Localization of genes encoding three distinct flavin-containing monooxygenase to
human chromosome 1g. Genomics, 16: 85-89.
27 Dolphin CT, Riley JH, Smith RL, Shephard EA, Phillips IR. (1997) Structural
organization of the human flavin-containing monooxygenase 3 gene (FMO3), the
flavored candidate for Fish Odor Syndrome, determined directly from genomic DNA.
Genomics, 46: 260-267.
28 McCombie RR, Dolphin CT, Povey S, Phillips IR, Shepard E. (1996) Localization of
human flavin-containing monooxygenase genes FMO2 and FMO5 to chromosome 1q.
Genomics, 1996, 34(3):426-9.
29 Wu RF, Ichikawa Y. (1994) Characteristic properties and kinetic amnalysis with
neurotoxins of porcine FAD-containing monooxygenase. Biochem Biophys Acta, 1208:
204-210.
30 Ziegler DM. Flavin-containing monooxygenase family of isozymes. Abstract, Proc of
the First International Workshop on Trimethylaminuria, Bethesda, MD, March 29-30.,
1999.
31 Ziegler DM. (2002) An overview of mechanism, substrate specificities and structure
of FMOs. Drug Metab Rev, 34(3): 503-511. 32 Yeung CK, Lang DH, Thummel KE, Rettie AE. (2000) Immunoquantitation of
FMO1 in human liver, kidney and intestine. Drug Metab Dispos, 28: 1107-1111.
33 Overby LH, Carver GC, Philpot RM. (1997) Quantitation and kinetic properties of
hepatic microsomal and recombinant flavin-containing monooxygenases 3 and 5 from
humans. Chem Biol Interact, 106: 29-45.
76

34 Cashman JR, Camp K, Fakharzadeh SS, Fenessey PV, Hines RN, Mamer OA,
Mitchell SC, Preti G, Schlenk D, Smith RL, Tjoa SS, Williams DE, Yannicelli S. (2003)
Biochemical and clinical aspects of the human flavin-containing monooxygenase form
3 (FMO3) related to trimethylaminuria. Curr Drug Metab, 4: 151-170.
35 Zhang J, Cashman JR. (2006) Quantitative analysis of FMO gene mRNA levels in
human tissues. Drug Metab Dispos, 34: 19-26.
36 Cashman JR. (2000) Human flavin-containing monooxygenase: substrate specificity
and role in drug metabolism. Curr Drug Metab, 1(2): 181-191. 37 Ripp SL, Itagaki K, Philpot RM, Elfarra AA. (1999) Species and sex differences in
expression of flavin-containing monooxygenase form 3 in liver and kidney microsomes.
Drug Metab Dispos, 27(1): 46-52.
38 Cherrington NJ, Cao Y, Cherrington JW, Rose RL, Hodgson E. (1998) Physiological
factors affecting protein expression of flavin-containing monooxygenases 1, 3 and 5.
Xenobiotica, 28(7): 673-682.
39 Kim YM, Ziegler DM. (2000) Size limit of thiocarbamides accepted as substrates by
human flavin-containing monooxygenase 1. Drug Metab Dispos, 28: 1003-1006.
40 Cashman JR and Zhang J. (2006) Human flavin-monooxygenases. Annu Rev
Pharmacol Toxicol, 46: 65-100. 41 Lin J, Cashman JR. (1997) Detoxication of tyramine by the flavin-monooxygenase:
stereoselective formation of the trans oxime. Chem Res Toxicol, 10: 842-52.
42 Yamada H, Baba T, Oguri K, Yoshimura H. (1988) The mammalian flavin-
containing monooxygenases: molecular characterization and regulation of expression.
Biochem Pharmacol, 37(2): 368-370.
77
43 Lin J, Cashman JR. (1997) N-oxygenation of phenethylamine to the trans-oxime by
adult human liver flavin-containing monooxygenase and retroreduction of
phenethylamine hydroxylamine by human liver microsomes. J Pharmacol Exp Ther,
282(3): 1269-79.
44 Hadley MR, Svajdlenka E, Damani LA, Oldham HG, Tribe J, Camilleri P, Hutt AJ.
(1994) Species variability in the stereoselective N-oxidation of pargyline. Chilarity,
6(2): 91-7.
45 Kashiyama E, Yokoi T, Odomi M, Kamataki T. (1999) Stereoselective S-oxidation
and reduction of flosequinan in rat. Xenobiotica, 29(8): 815-26.
46 Ripp SL, Itagaki K, Philpot RM, Elfarra AA. (1999) Methionine S-oxidation in
human and rabbit liver microsomes: evidence for a high-affinity methionine S-oxidase
activity that is distinct from flavin-containing monooxygenase 3. Arch Biochem
Biophys, 367: 322-332.
47 Hines RN, Cashman JR, Philpot RM, Williams DE, Ziegler DM. (1994) The
mammalian flavin-containing monooxygenases: molecular characterization and
regulation of expression. Toxicol Appl Pharmacol, 125(1): 1-6.
48 Cashman JR, Akerman BR, Forrest SM, Treacy EP. (2000) Population-specific
polymorphisms of the human FMO3 gene: significance for detoxication. Drug Metab
Dispos, 28(2): 169-173.
49 Lang DH, Rettie AE. (2000) In vitro evaluation of potential in vivo probes for human
flavin-containing monooxygenase (FMO): metabolism of benzydamine and caffeine by
FMO and P450 isoforms. Br J Clin Pharmacol, 50: 311-314. 50 Kawaji A, Ohara K, Takabatake E. (1993) An assay of flavin-containing
monooxygenase activity with benzydamine N-oxidation. Anal Biochem, 214: 409-412.
78
51 Störmer E, Roots I, Brockmöller J. (2000) Benzydamine N-oxydation as an index
reaction reflecting FMO activity in human liver microsomes and impact of FMO3
polymorphisms on enzyme activity. Br J Clin Pharmacol, 50: 553-561.
52 Chasseaud LF, Catanese B. (1985) Pharmacokinetics of benzydamine. Int J Tissue
React, 7: 195-204. 53 Park CS, Chung WG, Kang JH, Roh HK, Lee KH, Cha YN. (1999) Phenotyping of
flavin-containing monooxygenase using caffeine metabolism and genotyping of FMO3
gene in a Korean population. Pharmacogenetics, 9(2): 155-164.
54 Bjeldanes LF, Kim JY, Grose KR, Bartholomew JC, Bradfield CA. (1991) Aromatic
hydrocarbon responsivness-receptor agonists generated from indole-3-carbinol in in
vitro and in in vivo:comparison with 2,3,7,8-tetrachloro-dibenzo-p-dioxin. Proc Natl
Acad Sci USA, 88: 9543-9547.
55 Cashman JR, Xiong Y, Lin J, Verhagen H, Poppel G, Bladeren PJ, Larsen-Su S,
Willimams DE. (1999) In vitro and in vivo inhibition of human flavin-containing
monooxygenase form 3 (FMO3) in the presence of dietary indoles. Biochem Pharmacol,
58: 1047-1055.
56 Katchamart S, Williams DE. (2001) Indole-3-modulation of hepatic monooxygenases
CYP1A1, CYP1A2 and FMO1 in guinea pig, mouse and rabbit. Comp Biochem Physiol
C Toxicol Pharmacol, 129: 377-384.
57 Ziegler DM. (1988) Flavin-containing monooxygenases: catalytic mechanism and
substrate specificities. Drug Metab Rev, 19: 1-32.
58 Ziegler DM. (1990) Flavin-containing monooxygenases: enzymes adapted for
multisubstrate specificity. Trends Pharmacol Sci, 11(8): 321-324.
79
59 Zhao Y, Christensen, Fankhauser C, Cashman JR, Cohen JD, Weigel D, Chory J.
(2001) A role for flavin monooxygenase-like enzymes in auxin biosynthesis. Science,
291: 306-309.
60 Suh JK, Poulsen LL, Ziegler DM, Robertus JD. (1999) Yeast flavin-containing
monooxygenase generates oxidizing equivalents controlling protein folding in the
endoplasmatic reticulum. Proc Natl Acad Sci USA, 96: 2687-2691.
61 Suh J, Robertus JD. (2000) Yeast FMO is induced by the unfolded protein response.
Proc. Natl. Acad. Sci. USA, 2000, 97:121-126.
62 Ziegler DM, Duffel MW, Poulsen LL. (1979) Studies on the nature and regulation of
the cellular thio:disulphide potential. Ciba Found Symp, 72: 191-204.
63 Jeitner TM, Lawrence DA. (2001) Mechanisms for the cytotoxicity of cysteamine.
Toxicol Sci, 62: 57-64.
64 Khomenko T, Deng X, Sandor Z, Tarnawski AS, Szabo S. (2004) Cystemanine alters
redox state, HIF-1α transcriptional interactions and reduces duodenal mucosal
oxygenation: novel insight into the mechanisms of duodenal ulceration. Biochem
Biophys Res Commun, 317: 121-127.
65 Hagen TM, Moreau R, Suh JH, Visioli F. (2002) Mitochondrial decay in the aging rat
heart: evidence for improvement by dietary supplementation with acetyl-carnitine
and/or lipoic acid. Ann N Y Acad Sci, 959: 491-507.
66 Cerny MA, Hanzlik RP. (2005) Cyclopropylamine in action of cytochrome P450: role
of metabolite intermediate complexes. Biochem Biophys, 436: 265-275.
67 Rodriguez RJ, Buckholz CS. (2003) Hepatotoxicity of ketoconazole in Sprague
Dawley rats: glutathione depletion, flavin-containing monooxygenases-mediated
bioactivation and hepatic covalent binding. Xenobiotica, 33: 429-441.
80
68 Cashman JR. (2003) The role of flavin-containing monooxygenases in drug
metabolism and development. Curr Opin Drug Discov Devel, 6(4): 486-493.
69 Ayesh R, Smith RL. (1990) Genetic polymorphism of trimethylamine N-oxidation.
Pharmacol Ther, 45: 387-401.
70 Treacy EP, Akerman BR, Chow LM, Youil R, Bibeau C, Lin J. (1998) Mutations of
the flavin-containing monooxygenase gene (FMO3) cause trimethylaminuria, a defect in
detoxication. Hum Mol Genet, 7: 839-45.
71 Mitchell SC, Smith RL. (2001) Trimethylaminuria: the fish malodor syndrome. Drug
Metab Dispos, 29: 517-521.
72 Humbert JR, Hammond KB, Hathaway WE, Marcoux JG, O’Brien D. (1970)
Trimethylaminuria: fish-odour syndrome. The Lancet, 4: 970-971. 73 Mitchell SC, Smith RL. (2003) Trimethylamine and odorous sweat. J Inherit Metab
Dis, 26: 415-16.
74 Mitchell SC, Zhang AQ, Barrett T, Ayesh R, Smith RL. (1997) Studies on the
dicontinous N-oxidation of trimethylamine among Jordanian, Ecuadorian and New-
Guinean populations. Pharmacogenetics, 7: 45-50.
75 McConnell HW, Mitchel SC, Smith RL, Brewster M. (1997) Trimethylaminuria
associated with seizures and behavioural disturbance: a case riport. Seizure, 6: 317-322.
76 Luo Z, Hines RN. (2001) Regulation of flavin-containing monooxygenase 1
expression by Ying Yang and Hepatic Nuclear Factors 1 and 4. Mol Pharmacol, 60:
1421-1430.
81
77 Luo Z, Hines RN. (1997) Further characterization of the major and minor rabbit
FMO1 promoters and identification of both positive and negative distal regulatory
elements. Arch Biochem Biophys, 346: 96-104.
78 El-Alfy, Larsen B, Schlenk D. (2002) Effect of cortisol and urea on flavin
monooxygenase activity and expression in rainbow trout, Oncorhynchus mykiss. Mar
Environ Res, 54: 275-278. 79 Ryu SD, Yi HG, Cha YN, Kang JH, Kang JS, Jeon YC, Park HK, Yu TM, Lee JN,
Park CS. (2004) Flavin-containing monooxygenase activity can be inhibited by nitric
oxide-mediated S-nitrosylation. Life Sci, 75(21): 2559-72. 80 Kaderlik RK, Weser E, Ziegler DM. (1991) Selective loss of liver flavin-containing
monooxygenase in rats on chemically defined diets. Prog Pharm Clin Pharm, 8(3): 95-
103.
81 Cashman JR, Lattard V, Lin J. (2004) Effect of total parenteral nutrition and choline
on hepatic flavin-containing and cytochrome P450 monooxygenase activity in rats.
Drug Metab Dispos, 32: 222-229. 82 Dixit A and Roche TE. (1984) Spectrophotometric assay of the flavin-containing
monooxygenase and changes in its activity in female mouse liver with nutritional and
diurnal conditions. Archs Biochem Biophys, 238 (1): 50-63.
83 Brodfuehrer JI and Zannoni VG. (1986) Ascorbic acid deficiency and flavin-
containing monooxygenase. Bichem Pharmacol, 35(4): 637-644.
84 Coecke S, Debast G, Phillips IR, Vercruysse A, Shepard EA, Rogiers V. (1998)
Hormonal regulation of microsomal flavin-containing monooxygenase activity by sex
steroids and growth hormone in co-cultured adult male rat hepatocytes. Biochem
Pharmacol, 56: 1047-1051.
82
85 Dannan GA, Guengerich FP, Waxman DJ. (1986) Hormonal regulation of rat liver
microsomal enzymes. J Biol Chem, 261: 10728-10735. 86 Hines RN, Cashman JR, Philpot RM, Williams DE, Ziegler DM. (1994) The
mammalian flavin-containing monooxygenases: molecular characterisation and
regulation of expression. Toxicol Appl Pharmacol, 125: 1-6.
87 Osimitz TG, Kulkarni AP. (1982) Oxidative metabolism of xenobiotics during
pregnancy. Significance of microsomal flavin-containing monooxygenase. Biochem
Biophys Res Commun, 109: 1164-1171.
88 Heinze E, Hlavica P and Kiese M. (1970) N-oxygenation of arylamines in
microsomes prepared from corpra lutea of the cycle and other tissues of the pig.
Biochem Pharmacol, 19: 641-649.
89 Roderick E. McGrew. Diabetes Mellitus. In: Roderick E. McGrew (Ed.),
Encyclopedia of medical history. Macmillan Press, London, 1985: 90-93.
90 Ádám V, Mandl J. A szénhidrátok anyagcseréje. In: Ádám V (Ed.), Orvosi biokémia.
Semmelweis Kiadó, Budapest, 1996: 76-120.
91 Tímár J. A szénhidrát-anyagcsere gyógyszertana. In: Fürst Zs (Ed.), Gyógyszertan.
Medicina Könyvkiadó Rt., Budapest, 1999: 742-757.
92 Dainith H, Stevenson IH, O’Malley K. (1976) Influence of diabetes mellitus on drug
metabolism in man. Int J Clin Pharmacol, 13: 55-58.
93 Adithan C, Danda D, Swaminathan RP, Indhiresan J, Shasindran CH, Bapna JS,
Chandrasekar S. (1988) Effect of type I diabetes mellitus on theophylline elimination.
Med Sci Res, 16: 427-428.
83
94 Adithan C, Sriram G, Swaminathan RP, Krishnan M, Bapna JS, Chandrasekar S.
(1989) Effect of type II diabetes mellitus on theophylline elimination. Int J Clin
Pharmacol Ther Toxicol, 27: 258-260.
95 Gwilt PR, Nahhas RR, Tracewell WG. (1991) The effects of diabetes mellitus on
pharmacokinetics and pharmacodynamics in humans. Clin Pharmacokinet, 20(6): 477-
490.
96 Adithan C, Danda D, Shasindran CH, Bapna JS, Swaminathan RP, Chandrasekar S.
(1989) Differential effect of type I and type II diabetes mellitus on antyipyrine
elimination. Meth and Find Exp Clin Pharmacol, 11(12): 755-758.
97 Matzke GR, Frye RF, Early JJ, Straka RJ, Carson SW. (2000) Evaluation of the
influence of diabetes mellitus on antipyrine metabolism and CYP1A2 and CYP2D6
activity. Pharmacotherapy, 20(2): 182-190.
98 Dajani RM, Kayyali S, Saheb SE, Birbari A. (1974) A study on the physiological
disposition of acetophenetidin by the diabetic man. Comp Gen Pharmacol, 5:1-9.
99 Sotaniemi EA, Pelkonen O, Arranto AJ, Tapanainen P, Rautio A, Pasanen M. (2002)
Diabetes and elimination of antipyrine in man: an analysis of 298 patients classified by
type of diabetes, age, sex, duration of disease and liver involvement. Pharmacol
Toxicol, 90: 155-160.
100 Zysset T, Wiwtholtz H. (1988) Differential effect of type I and type II diabetes on
antipyrine disposition in man. Eur J Clin Pharmacol, 34: 369-375.
101 Takamura T, Shakurai M, Ota T, Ando H, Honda M, Kaneko S. (2004) Genes for
systemic vascular complications are differentially expressed in the livers of type 2
diabetic patients. Diabetologia, 47: 638-647.
84
102 Elsner M, Guldbakke B, Tiedge M, Munday R, Lenzen S. (2000) Relative
importance of transport and alkylation for pancreatic β-cell toxicity of streptozotocin.
Diabetologia, 43: 1528-1533.
103 Gruppuso PA, Boylan JM, Posner BI, Faure R, Braitigan DL. (1990) Hepatic protein
phosphotyrosine phosphatase. Dephosphorylation of insulin receptor and epidermal
growth factor receptors in normal and alloxan diabetic rats. J Clin Invest, 85: 1754-
1760.
104 Dunn JS, Sheehan HL, McLethie NGB. (1943) Necrosis of islets of Langerhans
produced experimentally. Lancet, 1: 484-487.
105 Arison RN, Ciaccio EI, Glitzer MS, Cassaro JA, Pruss MP. (1967) Light and
electron microscopy of lesions in rats rendered diabetic with streptozotocin. Diabetes,
16: 51-56.
106 Dixon RL, Hart LG, Foust JR. (1961) The metabolism of drugs by liver microsomes
from alloxan diabetic rats. J Pharmacol Exp Ther, 133: 7-11.
107 Dajani RM and Saheb SE. (1971) In vitro and in vivo studies of the metabolism of
phenylbutazone in the alloxan rat and rabbit (Abstract). J Pharm Pharmacol, (Suppl) 23:
220S-221S.
108 Nishihata T, Yata N, Kamada A. (1979) Role of acetone bodies in the abnormal
pharmacokinetic behaviour of chlorpropramide in alloxan diabetic rabbits. Chem Pharm
Bull, 27: 1740-1746.
109 Dixon RL, Hart LG, Rogers LA, Fouts JR. (1963) The metabolism of drugs by liver
microsomes from alloxan diabetic rats: long-term diabetes. J Pharmacol Exp Ther, 142:
312- 317.
85

110 Ackerman DM and Leibman KC. (1977) Effect of experimental diabates on drug
metabolism in the rat. Drug Metab Dispos, 5(4): 405-410.
111 Rouer E, Lemoine A, Cresteil P, Rouet P, Leroux JP. (1987) Effects of genetic or
chemically induced diabetes on imipramine metabolism. Drug Metab Dispos, 15(4):
524-528.
112 Reinke LA, Stohs SJ, Rosenberg H. (1978) Altered activity of hepatic mixed-
function monooxygenase enzymes in streptozotocin-induced diabetic rats. Xenobiotica,
8(10): 611-619.
113 Barnett CR, Flatt PR, Ioannides C. (1994) Modulation of the rat hepatic cytochrome
P450 composition by long-term streptozotocin-induced insulin-dependent diabetes. J
Biochem Toxicol, 9(2): 63-69.
114 Yamazoe Y, Murayama N, Shimada M, Yamauchi K, Kato R. (1989) Cytochrome
P450 in livers of diabetic rats: regulation by growth hormone and insulin. Arch
Biochem Biophys, 268: 567-575.
115 Shimojo N, Ishizaki T, Imaoka S, Funae Y, Fujii S, Okuda K. (1993) Changes in
amounts of cytochrome P450 isozymes and levels of catalytic activities in hepatic and
renal microsomes of rats with streptozotocin-induced diabetes. Biochem Pharmacol,
46(4): 621-627.
116 Schenkman JB. (1991) Induction of diabetes and evaluation of diabetic state on P450
expression. Methods Enzymol, 206: 325-331.
117 Rouer E and Leroux JP. (1980) Liver microsomal cytochrome P-450 related
monooxygenase activities is genetically hyperglycemic (ob/ob and db/db) and lean
streptozotocin-treated mice. Biochem Pharmacol, 29: 1959-1962.
86
118 Rouer E, Rouet P, Delpech M, Leroux JP. (1988) Purification and comparison of
liver microsomal flavin-containing monooxygenase from normal and streptozotocin-
diabetic rats. Biocheml Pharmacol, 37(18): 3455-3459.
119 Wang T, Shankar K, Ronis MJJ, Mehendale HM. (2000) Potentiation of
thioacetamide liver injury in diabetic rats is due to induced CYP2E1. J Pharmacol Exp
Ther 294: 473-479.
120 Cavagnaro J, Rauckman EJ, Rosen GM. (1981) Estimation of FAD monooxygenase
in microsomal preparations. Anal Biochem, 118: 204-211.
121 Holloway CT, Garfield SA. (1981) Effect of diabetes and insulin replacement on the
lipid on properties of hepatic smooth endoplasmic reticulum. Lipids, 16: 525-532.
122 Rouer E, Lemoine A, Cresteil P, Rouet P, Leroux JP. (1987) Effects of genetic or
chemically induced diabetes on imipramine metabolism. Drug Metab Dispos, 15(4):
524-528.
123 Barnett CR, Wilson J, Wolf CR, Flatt PR, Ioannides C. (1992) Hyperinsulinaemia
causes a preferential increase in hepatic P4501A2 activity. Biochem Pharmacol, 43(6):
1255-1261.
124 Woodcroft KJ, Novak RF. (1999) Insulin differentially affects xenobiotic-
enchanced, cytochrome P450 (CYP)2E1, CYP2B, CYP3A and CYP4A expression in
primary cultured rat hepatocytes. J Pharmacol Exp Ther, 289: 1121-1127.
125 Pike MG, Martin YN, Mays DC, Benson LM, Naylor S, Lipsky JJ. (1999) Roles of
FMO and P450 in the metabolism in human liver microsomes of S-methyl-N,N-
diethyldithiocarbamate, a dilsulfiram metabolite. Alcohol Clin Exp Res, 23(7): 1173-
1179.
87
126 Lowry OH, Rosebrough NJ, Farr AL and Randall RJ. (1951) Protein measurement
with the folin phenol reagent. J Biol Chem, 193(1): 265-275.
127 Greim H. (1970) Synthesesteigerung und abbauhemmung bei der vermehrung der
mikrosomalen cytochrome P450 und b-5 durch pehenobarbital. Naunyn-Schmiedebergs
Arch Pharmak, 266: 261-275.
128 Burke MD. (1985) Ethoxy-, pentoxy- and benzyloxyphenoxazones and homologues:
A series of substrates distinguish between different induced cytochromes P450.
Biochem Pharmacol, 34: 33-37.
129 Nash T. (1953) The colorimetric estimation of formaldehyde by means of the
Hantzsch reaction. Biochem J, 55(3): 416-21.
130 Reinke LA, Moyer MJ. (1985) Para-nitrophenol hydroxylation: a microsomal
oxidation which is highly inducible by ethanol. Drug Metab Dispos, 13: 548-552.
131 Anderson CD, Wang J, Kumar JN, McMilan JM, Walle UK, Walle T. (1995)
Dexamethasone induction of taxol metabolism in the rat. Drug Metab Dispos, 23: 1286-
1291.
132 Woodcroft KJ, Hafner MS, Novak RF. (2002) Insulin signaling in the transcriptional
and posttranscriptional regulation of CYP2E1 expression. Hepatology, 35(2): 263-273.
133 Barnett CR, Gibson GG, Wolf CR, Flatt PR, Ioannides C. (1990) Induction of
cytochrome P450III and P450IV family proteins in streptozotocin-induced diabetes.
Biochem J, 286: 765-769.
134 Bellward GD, Chang T, Rodriguez B, McNeill JH, Mains S, Ryan DE, Levin W,
Thomas PE. (1988) Hepatic cytochrome P450 induction in the spontaneously diabetic
BB rat. Mol Pharmacol, 33: 140-143.
88
135 Ádám V, Faragó A. Extracelluláris jelek receptorai és a jelátviteli mechanizmusok.
In: Ádám V (Ed.), Orvosi biokémia. Semmelweis Kiadó, Budapest, 1996: 371-415.
136 Schenkman JB, Jansson I. (2003) The many roles of cytochrome b5. Pharmacol Ther,
97(2): 139-152.
137 Eck MG, Wynn JO, Carter WJ, Faas FH. (1979) Fatty acid desaturation in
experimental diabetes mellitus. Diabetes, 28(5): 479-485.
89
8 PUBLICATIONS Publications the dissertation based on
1. Balázs Dalmadi, János Leibinger, Szabolcs Szeberényi, Tímea Borbás, Sándor
Farkas, Zsolt Szombathelyi and Károly Tihanyi: Identification of metabolic
pathways involved in the biotransformation of tolperisone by human microsomal
enzymes. Drug Metabolism and Disposition, 31:631-636, 2003
2. Éva Szökő, Tamás Tábi, Tímea Borbás, Balázs Dalmadi, Károly Tihanyi and
Kálmán Magyar: Assessment of the N-oxidation of deprenyl, methamphetamine and
amphetamine enantiomers by chiral capillary electrophoresis; an in vitro metabolism
study. Electrophoresis, 25(16): 2866-75, 2004
3. Tímea Borbás, Bernadett Benkő, Imola Szabó, Balázs Dalmadi, Károly Tihanyi:
Insulin in flavin-monooxygenase regulation. Flavin-containing monooxygenase and
cytochrome P450 activities in experimental diabetes. European Journal of
Pharmaceutical Sciences, 28(1-2): 51-58, 2006
4. Borbás T, Zhang J, Cerny MA, Likó I, Cashman JR: Investigation of structure and
function of a catalytically efficient variant of the human flavin-containing
monooxygenase form 3 (FMO3). Drug Metabolism and Disposition, 34: 1995-2002,
2006
Other publications
1. Borbás Tímea, Hegyesi Hargita: Huntington chorea: genetika és biokémia,
diagnosztika és terápia. Acta Pharmaceutica Hungarica, 72(2):127-36, 2002
Oral presentations
1. Dalmadi Balázs, Leibinger János, Szeberényi Szabolcs, Borbás Tímea, Pásztor
Gabriella, Farkas Sándor, Tihanyi Károly: A tolperisone in-vitro metabolikus
vizsgálata. 30 ÉVES JUBILEUMI FARMAKOKINETIKA ÉS
GYÓGYSZERMETABOLIZMUS SZIMPÓZIUM, 2002. április 4-6., Mátraháza
2. Dalmadi Balázs, Leibinger János, Szeberényi Szabolcs, Borbás Tímea, Pásztor
Gabriella, Farkas Sándor, Tihanyi Károly: A tolperisone in-vitro metabolikus
vizsgálata. VI. CLAUDER OTTÓ EMLÉKVERSENY, 2002. szeptember 27-28.,
Budapest
90
3. Borbás Tímea, Dalmadi Balázs, Szeberényi Szabolcs, Leibinger János, Beke Gyula,
Tihanyi Károly: Korreláció az egyes citokróm P450 izoenzimek és a flavin-
monooxigenáz aktivitása között. VI. CLAUDER OTTÓ EMLÉKVERSENY, 2002.
szeptember 27-28., Budapest
4. Borbás Tímea, Benkő Bernadett, Dalmadi Balázs, Szeberényi Szabolcs, Leibinger
János, Beke Gyula, Tihanyi Károly: Koexpresszió CYP és FMO izoformák között
enzimatikus szinten, humán és patkány mikroszómán vizsgálva. Ph.D.
TUDOMÁNYOS NAPOK 2003, 2003. április 10-11., Budapest
5. Benkő Bernadett, Borbás Tímea, Dalmadi Balázs, Szeberényi Szabolcs, Leibinger
János, Tihanyi Károly: Intesztinális gyógyszermetabolizmus jelentősége és stabil
citokróm P450 tartalmú mikroszóma preparálása patkány vékonybélből. Ph.D.
TUDOMÁNYOS NAPOK 2003, 2003. április 10-11., Budapest
6. Rapavi Erika, Szeberényi Szabolcs, Borbás Tímea, Lugasi Andrea, Szentmihályi
Klára, Pallai Zsolt, Kurucz Tímea, Kocsis Ibolya, Taba Gabriella, Blázovics Anna:
Természetes eredetű gyógyszer hatása a szöveti redox-státuszra patkányban.
MAGYAR SZABADGYÖK-KUTATÓ TÁRSASÁG II. KONFERENCIÁJA, 2003.
szeptember 25-27., Sopron
7. Rapavi Erika, Kocsis Ibolya, Szentmihályi Klára, Lugasi Andrea, Fehér Erzsébet,
Bányai Éva, Rhenzo Gonzalez-Cabello, Székely Edit, Szeberényi Szabolcs, Borbás
Tímea, Pallai Zsolt, Kurucz Tímea, Balázs Andrea, Czinner Erika, Héthelyi Éva,
Hagymási Krisztina, Bárkovics Sarolta, Pintér Edina, Bíró Erzsébet, Fehér János,
Blázovics Anna: Újabb adatok a természetes hatóanyagok in vitro és in vivo
hatásmechanizmusának megértéséhez. SZÉCHENYI SZIMPÓZIUM, 2004. március
10., Budapest
8. Borbás Tímea, Benkő Bernadett és Tihanyi Károly: Streptozotocinnal kiváltott
diabétesz hatása a hepatikus gyógyszermetabolizmusra patkányban. Ph.D.
TUDOMÁNYOS NAPOK 2004. április 8-9., Budapest
9. Benkő Bernadett, Borbás Tímea és Tihanyi Károly: Streptozotocinnal kiváltott
diabétesz hatása az intesztinális gyógyszermetabolizmusra patkányban. Ph.D.
TUDOMÁNYOS NAPOK 2004. április 8-9., Budapest
91
10. Benkő Bernadett, Borbás Tímea, Győrke Imola: Streptozotocin-indukálta diabétesz
hatása az intesztinális és hepatikus gyógyszermetabolizmusra patkányban. VII.
CLAUDER OTTÓ EMLÉKVERSENY, 2004. október 14-15., Budapest
11. Borbás Tímea: Flavin-monooxigenáz (HBRI). FARMAKOKINETIKA KLUB,
2005. március 2., Budapest
Posters
1. Tímea Borbás, Balázs Dalmadi, János Leibinger, Szabolcs Szeberényi, Zsolt
Szombathelyi and Károly Tihanyi: Co-expression of CYP and FMO isoforms based
on enzymatic activity in rat and in human liver microsomes. 8. EUROPEAN
INTERNATIONAL SOCIETY FOR THE STUDY OF XENOBIOTICS MEETING, 27.
April - 01. May 2003.
2. Balázs Dalmadi, János Leibinger, Szabolcs Szeberényi, Tímea Borbás, Zsolt
Szombathelyi and Károly Tihanyi: Kinetic characterization of tolperisone
hydroxylation by human microsomal enzymes. 8. EUROPEAN INTERNATIONAL
SOCIETY FOR THE STUDY OF XENOBIOTICS MEETING-ISSX, 27. April - 01.
May 2003.
3. Borbás Tímea, Benkő Bernadett, Dalmadi Balázs, Győrke Imola, Vastag Mónika és
Tihanyi Károly: Humán hepatocita citokróm P450 izoenzimek adatainak statisztikai
kiértékelése. GYÓGYSZER AZ EZREDFORDULÓN V. TOVÁBBKÉPZŐ
KONFERENCIA, 2004 március 25-27., Sopron
4. Borbás Tímea, Benkő Bernadett, Galgóczy Kornél, Dalmadi Balázs, Győrke Imola
és Tihanyi Károly: Streptozotocin-indukálta diabétesz hatása a hepatikus és
intesztinális gyógyszermetabolizmusra patkányban. FARMAKOKINETIKAI ÉS
GYÓGYSZERMETABOLIZMUS TOVÁBBKÉPZŐ SZIMPÓZIUM, 2004. április
15-17., Mátraháza
5. Borbás Tímea, Benkő Bernadett, Dalmadi Balázs, Győrke Imola, Vastag Mónika és
Tihanyi Károly: Humán hepatocita citokróm P450 izoenzimek adatainak statisztikai
kiértékelése. FARMAKOKINETIKAI ÉS GYÓGYSZERMETABOLIZMUS
TOVÁBBKÉPZŐ SZIMPÓZIUM, 2004. április 15-17., Mátraháza
6. Rapavi Erika, Szeberényi Szabolcs, Borbás Tímea, Kocsis Ibolya, Fehér Erzsébet,
Lugasi Andrea, Blázovics Anna: Citrus flavonoidok hatása a drogmetabolizáló
92
enzimrendszerre és a szöveti antioxidáns kapacitásra eltérő eredetű
májkárosodásban, patkányban. Ph.D. TUDOMÁNYOS NAPOK 2004. április 8-9.,
Budapest
7. Borbás Tímea, Jun Zhang, Matt A. Cerny, István Likó, John Cashman: Investigation
of structure and function of a catalitically efficient variant of the human flavin-
containing monooxygenase form 3 (FMO3). FARMAKOKINETIKAI ÉS
GYÓGYSZERMETABOLIZMUS TOVÁBBKÉPZŐ SZIMPÓZIUM, 2006. április
19-21., Mátraháza
8. Borbás Tímea, Jun Zhang, Matt A. Cerny, István Likó, John Cashman: Investigation
of structure and function of a catalitically efficient variant of the human flavin-
containing monooxygenase form 3 (FMO3). A MAGYAR FARMAKOLÓGIAI
TÁRSASÁG EXPERIMENTÁLIS SZEKCIÓJÁNAK II. VÁNDORGYŰLÉSE,
2006. június 3., Pécs
9. Likó István, Borbás Tímea: A flavin-monooxigenáz enzimcsalád homológia
modellezése. MAGYAR BIOKÉMIAI EGYESÜLET 2006. ÉVI
VÁNDORGYŰLÉSE, 2006. aug.30- szept.2., Pécs
10. Borbás Tímea, Jun Zhang, Matt A. Cerny, István Likó, John Cashman: Investigation
of structure and function of a catalitically efficient variant of the human flavin-
containing monooxygenase form 3 (FMO3). 16th INTERNATIONAL
SYMPOSIUM ON MICROSOMES AND DRUG OXIDATIONS, 2006. szept. 3-7.,
Budapest
93
9 ACKNOWLEDGEMENTS In the first place, I would like to thank Professor András Falus for referring me to
Károly Tihanyi in order to do my Ph.D. studies.
I wish to thank my supervisor, Károly Tihanyi for tutoring me. His outstanding
knowledge on drug discovery and his way of thinking about scientific issues made a
strong impact on my work.
I am grateful to Éva Szökő, Szabolcs Szeberényi and Balázs Dalmadi for helping
me with their valuable advices throughout my Ph.D. student years.
I would like to express my sincere gratitude to several people for their
contributions to this thesis: Gyula Beke for synthetizing benzydamine N-oxide
metabolite; Kornél Galgóczy for sharing his experience on setting diabetic conditions;
Viktor Háda for carrying out HPLC-MS measurements; István Likó for helping me with
gene expression determination and also constructing a new model of human FMO3;
Mariann Borsos for providing consultation on data analysis and Teréz Merkl for
excellent technical assistance.
I thank Ottilia Elekes for being a cheerful company and for giving me insights in
systematic, intuitive and successful research work in drug development.
I appreciate a lot my colleagues Bernadett Benkő, Imola Szabó and Erika Czank
to be helpful and kind company and János Leibinger who explained me bioanalytical
methods with great enthusiasm.
I thank Monika Vastag for having me in the In Vitro Metabolism Laboratory and
giving me the possibility to prepare my thesis.
I am grateful to The Hungarian School of Ph.D. Studies, The Hungarian
Pharmaceutical Society Industrial Organization and the Hungarian Pharmaceutical
Chamber for financing my study tour to California and to Prof. John Cashman and Jun
Zhang for the possibility to spend four months in San Diego at the Human
BioMolecular Research Institute allowing me to see the beauty and difficulties of
research.
At last but not at least I thank my parents and my family for their patience, love
and care with which they helped me during these long years.
94