Embed Size (px)
Citation preview
CRYSTAL INSTITUTE Ltd.
H-3300 EGER, TELEKESSY U. 2.
Study report
STUDY ON THE HEMATOLOGIC EFFECTS OF FLAVIN7,
FRUIT EXTRACT WITH HIGH POLYPHENOL CONTENT
IN MICE WITH DAMAGED BONE MARROW
IN VIVO
STUDY CODE: FL-BM-002-2003
2003-2004
CONFIDENTIAL
CRYSTAL INSTITUTE Ltd.
STUDY CODE: FL-BM-002-2003 P 2 of 70
TITLE: STUDY ON THE HEMATOLOGIC EFFECTS OF FLAVIN7®, FRUIT EXTRACT WITH HIGH POLYPHENOL CONTENT IN MICE WITH DAMAGED BONE MARROW IN VIVO
STUDY LOCATED: Department of Pharmacology and Pharmacotherapy University of Debrecen. Medical and Health Science Center Address: H-4012 Debrecen. Nagyerdei krt. 98. POBox 12 Phone: + (36) 52 427-899 Fax: + (36) 52 427-899 SPONSOR: CRYSTAL INSTITUTE Ltd. Address: H-3300 Eger, Telekessy u. 2. Phone: + (36) 36-517688 Fax: + (36) 36-517644 PRINCIPAL INVESTIGATOR: Ilona Benkő, M.D., Ph.D. Assistant Professor START OF EXAMINATION: Nov 1, 2003 END OF EXAMINATION: March 10, 2004
CCOONNFFIIDDEENNTTIIAALL
This document contains confidential information which should not be released or published without written agreement of the Sponsor and the Principal Investigator.
BIZALMAS
Ez a dokumentum bizalmas információkat tartalmaz, amelyek sem részben, sem egészben nem publikálhatók nyilvánosan a szponzor és a vizsgálatvezető előzetes, írásbeli megállapodása nélkül. A dokumentum, eredeti formájában, a megfelelő engedélyező szakhatóságokhoz benyújtható. Ilona Benkő M.D., Ph.D. Zoltán Szilvássy M.D., Ph.D., D.Sc. Assistant Professor Full Professor and Director of Department of Principal investigator Pharmacology and Pharmacotherapy
signature:........................................ signature:........................................
Approved by (on behalf of the Sponsor) László Szabó, Director of Crystal Institute Ltd. signature:........................................
CONFIDENTIAL
CRYSTAL INSTITUTE Ltd.
STUDY CODE: FL-BM-002-2003 P 3 of 70
CONTENTS
1. INTRODUCTION........................................................................... 6
2. AIMS OF THE STUDY.................................................................. 7
3. SUMMARY.................................................................................... 8
4. METHODS ..............................................................................10
4.1. Materials ...............................................................10
4.2. Mice ...................................................................... 10
4.3. Drug administration ............................................11
4.4. Study design ......…............................................... 11
4.4.1. 1st stage experiments with flow chart ........... 11
4.4.2. 2nd stage experiments with flow chart .......... 13
4.5. Murine groups and treatment schedule ............. 15
4.6. Biological samples ...........…....….........…........... 16
4.7. CFU-GM colony assay .......................................... 16
4.7.1. Preparing bone marrow cultures ................. 16
4.7.2. Evaluation bone marrow cultures ................ 17
4.8. End points from peripheral blood samples ........ 17
4.9. End points from bone marrow ....................…..... 18
4.10. Statistical analysis .................................................19
CONFIDENTIAL
CRYSTAL INSTITUTE Ltd.
STUDY CODE: FL-BM-002-2003 P 4 of 70
5. RESULTS .................................................................................. 20
5.1. 1st TYPE EXPERIMENTS ................................................ 20
5.1.1. Results from body weights ....................................... 20
5.1.2. Results from peripheral blood .................................. 22
5.1.2.1. White blood cell counts ....................... 22
5.1.2.2. Absolute neutrophil cell counts .......... 23
5.1.3. Results from bone marrow evaluation ..................... 24
5.1.3.1. Cellularity of femoral bone marrow ..... 24
5.1.3.2. CFU-GM colonies in femoral bone marrow
5.1.3.3. CFU-GM content of femora of mice ..... 26
5.1.3.4. IC50 values of doxorubicin ................... 27
5.2. 2 nd TYPE EXPERIMENTS .................................................29
5.2.1. Results from body weights ....................................... 29
5.2.2. Results from peripheral blood ................................. 31
5.2.2.1. White blood cell counts ....................... 31
5.2.2.2. Absolute neutrophil cell counts .......... 32
5.2.3. Results from bone marrow evaluation ..................... 33
5.2.3.1. Cellularity of femoral bone marrow ..... 33
5.2.3.2. CFU-GM colonies in femoral bone marrow
5.2.3.3. CFU-GM content of femora of mice ..... 35
CONFIDENTIAL
CRYSTAL INSTITUTE Ltd.
STUDY CODE: FL-BM-002-2003 P 5 of 70
6. DISCUSSION AND CONCLUSIONS ....................... 36
6.1. EFFECTS OF DOXORUBICIN ON HEMOPOIESIS .... 36
6.2. EFFECTS OF THE STUDIED FRUIT EXTRACT ON
DAMAGE OF HEMOPOIESIS CAUSED BY A SINGLE
DOXORUBICIN DOSE ................................................. 37
7. SUGGESTIONS............................................................ 40
8. REFERENCES …………………...……………………. 40
9. APPENDIX ................................................................... 43
CONFIDENTIAL
CRYSTAL INSTITUTE Ltd.
STUDY CODE: FL-BM-002-2003 P 6 of 70
1. INTRODUCTION
Cancer is the second leading cause of death behind heart diseases.
Cancer incidence shows that a new cancer disease appears in about 10 % of the
population each year in USA. Cancer rates could further increase by 50 % until 2020
all over the world according to the WHO. About half of the cases need systemic
treatment by chemotherapy alone or together with irradiation. The most common
dose-limiting side effect of cytostatic drugs is bone marrow suppression. The major
mechanism of bone marrow suppression is inhibition of the proliferation of stem and
progenitor cells which have a function in the continuous compensation of lost mature
blood cells possessing a short life-span (Bond et al. 1965). Among these progenitors
granulocyte-macrophage colony forming units (CFU-GM) are capable of forming
colonies of granulocytes and/or macrophages in cell cultures. CFU-GM are supposed to
be the major target of agents damaging bone marrow (Lohrmann and Schreml 1982).
Damage of the CFU-GM pool has a great importance, as resulting neutropenia and
severe infections with high mortality may develop in patients. Leading causes of
mortality of patients with malignant tumours are infections associated with
neutropenia (Harrison 2001).
Numerous plant-derived polyphenolic compounds with antioxidant and free radical
scavenging properties can prevent tumour formation (Surh 1999). Cacao liquid
polyphenols inhibited DNA strand cleavage induced by mitomycin C, an antitumour
antibiotic in vitro (Yamagishi et al. 2001). Doxorubicin, an another antitumour antibiotic,
is used much more frequently in many different types of malignant diseases. If the
polyphenolic fruit extract we investigated could also decrease DNA damage, it might
protect bone marrow from damage caused by doxorubicin. The experimental
doxorubicin-induced damage of bone marrow has been a widely accepted
CONFIDENTIAL
CRYSTAL INSTITUTE Ltd.
STUDY CODE: FL-BM-002-2003 P 7 of 70
pharmacological tool for studying the preventive action of various, potentially useful
chemoprotectant agents.
2. AIM OF THE STUDY
The aim of this study is to investigate whether
the fruit extract with high polyphenol (FLAVIN7®), can protect bone marrow
from damage caused by doxorubicin in vivo in mice.
CONFIDENTIAL
CRYSTAL INSTITUTE Ltd.
STUDY CODE: FL-BM-002-2003 P 8 of 70
3. SUMMARY
Effects of a special fruit extract FLAVIN7® were analysed on hemopoiesis of mice with
damaged bone marrow in vivo. Bone marrow damage was induced by doxorubicin, a
widely used cytostatic drug. During anticancer chemotherapy myelotoxicity is the dose-
limiting side effect of cytostatic agents, which hinders the successful treatment of
malignant diseases.
Bone marrow damage was characterized by its cellularity and the features of
granulopoiesis. Granulocyte-macrophage progenitor cells (CFU-GM) are supposed to
be the major target, thus we measured directly their damage. To determine frequency
of CFU-GM special soft-gel bone marrow cell cultures were prepared under steril
conditions, in which only the CFU-GM cells could proliferate and formed colonies,
because their descendants remained together in the soft gel. Number of colonies grown
from 105 bone marrow cells shows intensity of granulopoiesis, which maintains the
CFU-GM pool to supply the body with macrophages and monocytes. Whole CFU-GM
content of femoral bone marrow was also studied. Results of the myelo- and
granulopoiesis, the mature blood cells were also measured from the peripheral blood of
the mice.
A single doxorubicin dose a caused dose-dependent decrease in the characteristics of
myelo- and granulopoiesis described previously. After the choose of the 50 mg/kgbw
doxorubicin dose we investigated whether pretreatment with the fruit extract FLAVIN7®
could influence bone marrow damage caused by doxorubicin. The fruit extract was
administered per orally for 7 consecutive days before the single doxorubicin i.p. dose.
CONFIDENTIAL
CRYSTAL INSTITUTE Ltd.
STUDY CODE: FL-BM-002-2003 P 9 of 70
Neither cellularity of bone marrow nor white blood cell counts were influenced by the
fruit extract. This special fruit extract FLAVIN7®, however, specifically protected the
granulocyte-macrophage progenitor cells. In the group pretreated with 4 ml/kgbw of the
fruit extract before doxorubicin CFU-GM colony numbers were significantly higher than
in the group treated with doxorubicin alone (P < 0.01). Due to the more intensive
proliferation replacing the damaged CFU-GM pool was not only faster but CFU-GM
pool expanded. It was greater than even the values of the control untreated group (P <
0.01). This could decrease the extent and duration of granulocytopenia namely
neutropenia. Even this early time the absolute neutrophil counts were a little higher but
not significantly in the group pretreated with 4 ml/kgbw of fruit extract. Effects on the
mature blood cells appear after a latent period when the differentiation of the progenitor
cells is completed.
From these results we can conclude that FLAVIN7® could protect granulocyte-
macrophage progenitor cells of bone marrow against damage caused by
doxorubicin. It is of great importance, as this could prevent developing of serious
infections associated to neutropenia. It can be concluded that FLAVIN7® can be
a promising product in the complex therapy of malignant diseases or
immunological disorders, but a number of in vitro and in vivo experiments are
needed to test its effectiveness. By supplying more progenitors for the more
intensive granulopoiesis this fruit extract could decrease the immuno- and
myelosuppressive effects of cytostatic drugs or other toxic molecules, which can
decrease mortality.
CONFIDENTIAL
CRYSTAL INSTITUTE Ltd.
STUDY CODE: FL-BM-002-2003 P 10 of 70
4. METHODS
4.1. Materials
adriamycin (Pallagicin BIOGAL-TEVA, 10 mg of lyophilised doxorubicin
hydrochloride/amp.) = DOXO
FLAVIN7® fruit extract with high polyphenol content (Crystal Institute Ltd)
Stock solution was prepared by acidic Aqua distillate in the following
concentration: 40 ml extract/100 ml vehicle
pH of the vehicle was about 2-3
Stock solutions were prepared freshly before each experiment.
4.2. Mice
C57black x DBA hibrid BDF1 male mice – weight: 20-35 g - obtained from the National
Institute of Oncology, Budapest, Hungary. Mice were given standard laboratory food
and water ad libitum. Keeping conditions were controlled by the Regional Ethical
Committee for Animal Experiments, conforming to the Standards of the European
Union.
Body weight of mice was measured twice, prior to the experiment and on the day of
their extermination.
CONFIDENTIAL
CRYSTAL INSTITUTE Ltd.
STUDY CODE: FL-BM-002-2003 P 11 of 70
4.3. Drug administration
The polyphenolic extract solutions have been administered by gavage orally.
Doxorubicin was administered intraperitoneally (i.p.). In both types of administration,
drugs were added to the mice in 0.1 ml/10 gbw volume dissolved in vehicles
described in the section “Materials”.
4.4. Study design
4.4.1. 1st stage experiments
Number of mice: 30
To find the proper doxorubicin dose to damage the bone marrow first the dose-
response curve was determined. 0, 25, 50, 100 and 200 mg/kgbw of doxorubicin was
administered to the murine groups intraperitoneally. The following day the mice were
exterminated to obtain bone marrow samples. Bone marrow hemopoiesis was
characterized by its cellularity and by culturing granulocyte-macrophage progenitor
cells. Under sterile condition special soft-gel bone marrow cultures were prepared, in
which only the granulocyte-macrophage progenitor cells could grow. During the 7-
day culturing period CFU-GM cells formed colonies. These colonies could be
counted under stereomicroscope. There were three mice in each group, and the
experiment was repeated twice.
A detailed flow chart can be found on page 10 (Table 1).
CONFIDENTIAL
CRYSTAL INSTITUTE Ltd.
STUDY CODE: FL-BM-002-2003 P 12 of 70
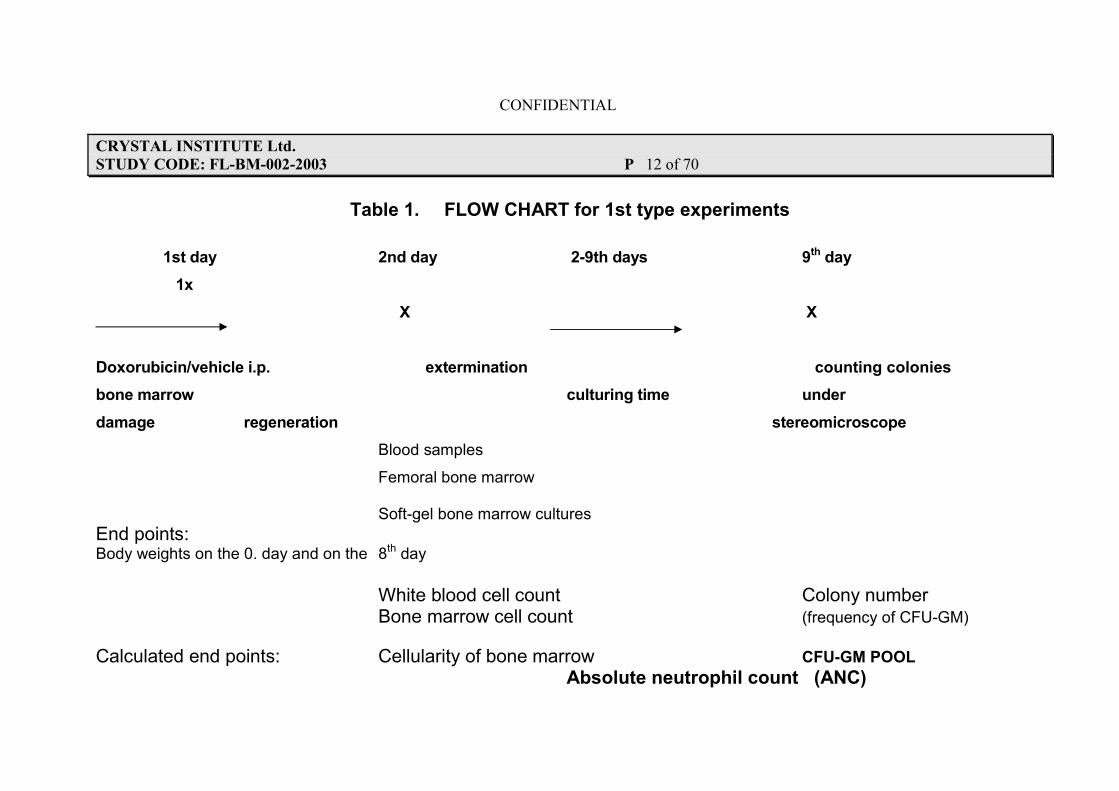
Table 1. FLOW CHART for 1st type experiments
1st day 2nd day 2-9th days 9th day
1x
X X
Doxorubicin/vehicle i.p. extermination counting colonies
bone marrow culturing time under
damage regeneration stereomicroscope
Blood samples
Femoral bone marrow Soft-gel bone marrow cultures
End points: Body weights on the 0. day and on the 8th day
White blood cell count Colony number Bone marrow cell count (frequency of CFU-GM)
Calculated end points: Cellularity of bone marrow CFU-GM POOL
Absolute neutrophil count (ANC)
CONFIDENTIAL
CRYSTAL INSTITUTE Ltd.
STUDY CODE: FL-BM-002-2003 P 13 of 70
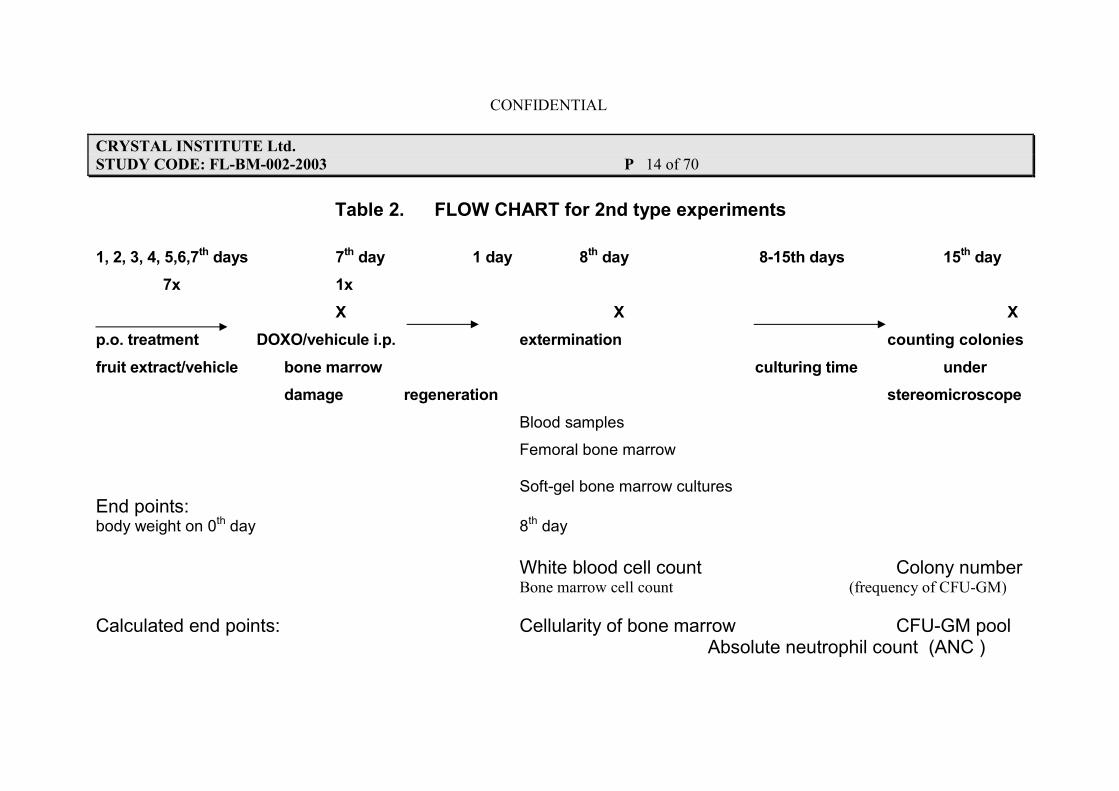
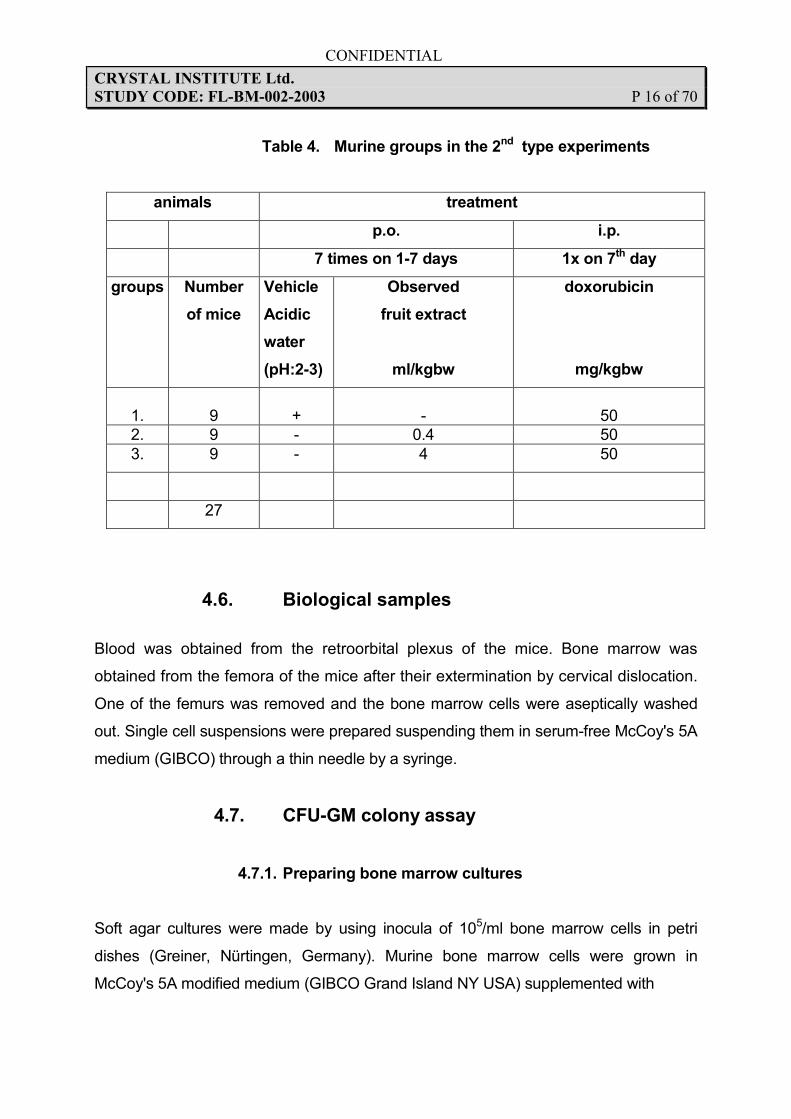
4.4.2. 2nd stage experiments
Number of mice: 27
To determine whether the studied fruit extract with high polyphenolic content could
influence granulopoiesis in bone marrow murine groups were pretreated with 0, 0.4 and
4 ml/kgbw of the extract, respectively. The mice were treated for 7 consecutive days.
Doxorubicin was administered 1 hour after the last dose of the extract on the 7th day.
Biological samples were obtained 24 hours later, on the following day. Mature white
blood cells were evaluated from the peripheral blood of the mice. Bone marrow
hemopoiesis was characterized by its cellularity and by culturing granulocyte-
macrophage progenitor cells. Under sterile condition special soft-gel bone marrow
cultures were prepared, in which only the granulocyte-macrophage progenitor cells
could grow. During the 7- day culturing period CFU-GM cells formed colonies. These
colonies could be counted under stereomicroscope. There were three mice in each
group, and the experiment was repeated 3 times.
A detailed flow chart can be found on page 12 (Table 2).
CONFIDENTIAL
CRYSTAL INSTITUTE Ltd.
STUDY CODE: FL-BM-002-2003 P 14 of 70
Table 2. FLOW CHART for 2nd type experiments
1, 2, 3, 4, 5,6,7th days 7th day 1 day 8th day 8-15th days 15th day
7x 1x
X X X
p.o. treatment DOXO/vehicule i.p. extermination counting colonies
fruit extract/vehicle bone marrow culturing time under
damage regeneration stereomicroscope
Blood samples
Femoral bone marrow Soft-gel bone marrow cultures
End points: body weight on 0th day 8th day
White blood cell count Colony number Bone marrow cell count (frequency of CFU-GM)
Calculated end points: Cellularity of bone marrow CFU-GM pool Absolute neutrophil count (ANC )
CONFIDENTIAL
CRYSTAL INSTITUTE Ltd.
STUDY CODE: FL-BM-002-2003 P 15 of 70
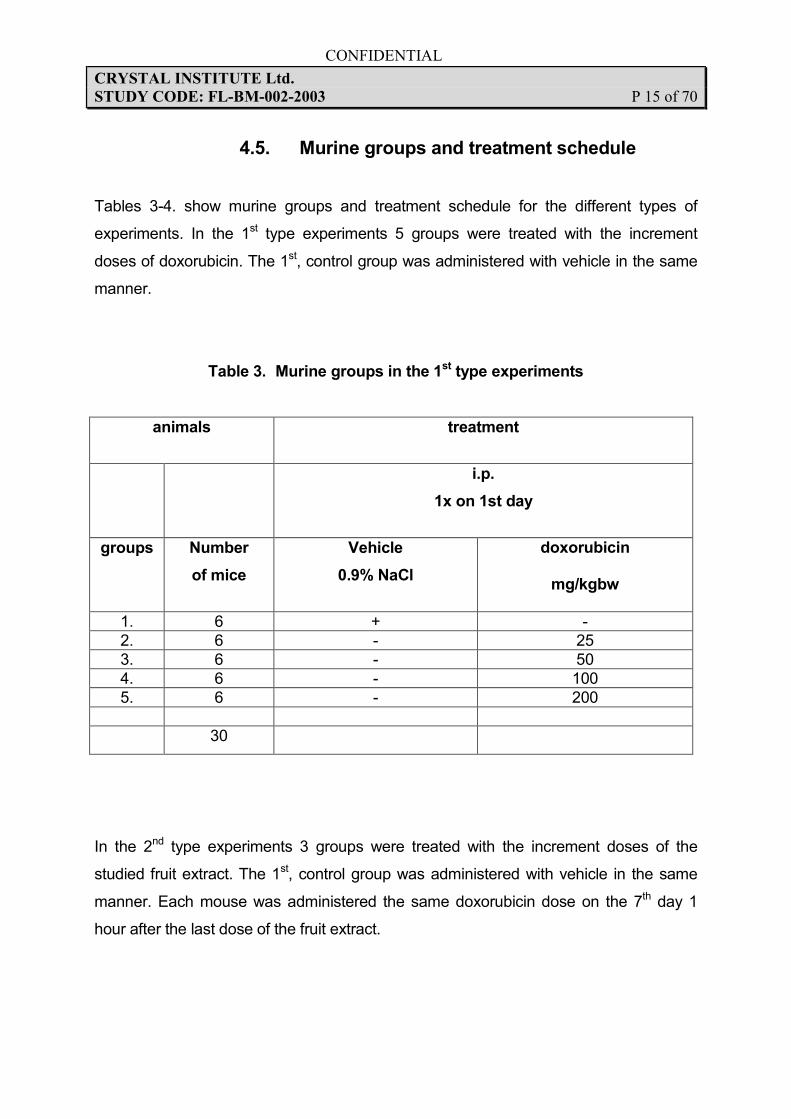
4.5. Murine groups and treatment schedule
Tables 3-4. show murine groups and treatment schedule for the different types of
experiments. In the 1st type experiments 5 groups were treated with the increment
doses of doxorubicin. The 1st, control group was administered with vehicle in the same
manner.
Table 3. Murine groups in the 1st type experiments
animals treatment
i.p.
1x on 1st day
groups Number
of mice
Vehicle
0.9% NaCl
doxorubicin
mg/kgbw
1. 6 + -
2. 6 - 25
3. 6 - 50
4. 6 - 100
5. 6 - 200
30
In the 2nd type experiments 3 groups were treated with the increment doses of the
studied fruit extract. The 1st, control group was administered with vehicle in the same
manner. Each mouse was administered the same doxorubicin dose on the 7th day 1
hour after the last dose of the fruit extract.
CONFIDENTIAL
CRYSTAL INSTITUTE Ltd.
STUDY CODE: FL-BM-002-2003 P 16 of 70
Table 4. Murine groups in the 2nd type experiments
animals treatment
p.o. i.p.
7 times on 1-7 days 1x on 7th day
groups Number
of mice
Vehicle
Acidic
water
(pH:2-3)
Observed
fruit extract
ml/kgbw
doxorubicin
mg/kgbw
1.
9
+
-
50
2. 9 - 0.4 50
3. 9 - 4 50
27
4.6. Biological samples
Blood was obtained from the retroorbital plexus of the mice. Bone marrow was
obtained from the femora of the mice after their extermination by cervical dislocation.
One of the femurs was removed and the bone marrow cells were aseptically washed
out. Single cell suspensions were prepared suspending them in serum-free McCoy's 5A
medium (GIBCO) through a thin needle by a syringe.
4.7. CFU-GM colony assay
4.7.1. Preparing bone marrow cultures
Soft agar cultures were made by using inocula of 105/ml bone marrow cells in petri
dishes (Greiner, Nürtingen, Germany). Murine bone marrow cells were grown in
McCoy's 5A modified medium (GIBCO Grand Island NY USA) supplemented with
CONFIDENTIAL
CRYSTAL INSTITUTE Ltd.
STUDY CODE: FL-BM-002-2003 P 17 of 70
amino acids, Na pyruvate, NaHCO3 and antibiotics (streptomycin, penicillin) according
to Pike and Robinson (1970) as well as with 0.3% agar (Ionagar No2, Oxoid, London,
Great Britain), as well as with 20-25% horse serum. The best batch of serum was
selected in preliminary experiments from several samples supplied by the
manufacturer. The source of colony-stimulating factor was the medium conditioned by
WEHI-3B cells (WEHI-3B-CM), produced and tested in our laboratory and used at a
concentration necessary for the growth of maximum number of colonies. WEHI-3B-CM
contains a variety of growth factors. Three parallel petri dishes (Greiner, Nürtingen,
Germany) containing the cultures were incubated for 7 days in a humidified atmosphere
containing 5% CO2 in CO2 incubator (JOUAN Co, France) .
4.7.2. Evaluation of bone marrow cultures
Seven days later, at the end of the culturing period, colonies - defined as groups of at
least 50 cells - were counted under a dissecting microscope (Olympus SM60,
Olympus, Hamburg, Germany). The above cultural conditions are suitable for
granulocyte-macrophage progenitor cells for proliferation and differentiation. Only
these cells can proliferate and due to soft agar medium descendants will remain
together and form colonies containing granulocytes and/or monocytes as we can
check it in smears or cytospin preparatums under microscope.
4.8. End points from peripheral blood
After the doxorubicin dose on the following day during the bone marrow regeneration
blood samples of mice were obtained from their retroorbital plexus immediately before
their extermination for blood smears and for counting white blood cell numbers. Blood
smears were stained with May-Grünwald-Giemsa. From the blood samples of the mice
white blood cell counts (WBC) and absolute neutrophil counts were determined. The
latter data were calculated from WBCs and the frequencies of neutrophil granulocytes
in blood smears.
CONFIDENTIAL
CRYSTAL INSTITUTE Ltd.
STUDY CODE: FL-BM-002-2003 P 18 of 70
End points are the following:
1. white blood cell count (WBC) 2. absolute neutrophil granulocyte count (ANC) = WBC * frequency of neutrophils
4.9. End points from bone marrow
Femoral bone marrow was obtained after the extermination of the mice. From bone
marrow cell suspensions cell numbers (BMC) were counted in a hemocytometer to
determine the cellularity of the bone marrow, which was expressed as nucleated cells
per femur.
Soft-gel cell cultures were prepared from their bone marrow cell suspensions and after
culturing period the number of CFU-GM (granulocyte-macrophage progenitor cells)
was determined by counting colonies under stereomicroscope.
Numbers of colonies grown from 105 bone marrow cells showed the intensity of
regeneration of CFU-GM pool after the bone marrow damage caused by doxorubicin.
The CFU-GM content of femur (CFU-GM pool) was calculated with the help of the
colony numbers and cellularity and was expressed as CFU-GM per femur.
End points are the following:
1. Bone marrow cell count (BMC)
2. Cellularity = BMC * volume of bone marrow cell suspension means the total nucleated cell number in the femora of mice
3. Frequency of CFU-GM = number of colonies of CFU-GM/ 105 bone marrow
cells = number of granulocyte-macrophage colony forming units/ 105 bone marrow cells
4. CFU-GM content in the whole femoral bone marrow = cellularity * frequency
of CFU-GM
CONFIDENTIAL
CRYSTAL INSTITUTE Ltd.
STUDY CODE: FL-BM-002-2003 P 19 of 70
4.10. Statistical analysis
Data for individual mice were used for statistical evaluation. Each hematologic variable
mentioned above was evaluated at each time with a non-parametric analysis of
variance, namely ANOVA. If ANOVA analysis revealed significant inhomogeneity,
multiple comparison test according to Bonferroni was used for evaluating statistical
differencies. The GraphPadPrism program (version 3.0, GraphPad Software, Inc., San
Diego, CA, USA) was used to perform these calculations. Differences were regarded as
statistically significant if p<0.05.
CONFIDENTIAL
CRYSTAL INSTITUTE Ltd.
STUDY CODE: FL-BM-002-2003 P 20 of 70
5. RESULTS
5.1. 1st TYPE EXPERIMENTS
5.1.1. Results from body weights
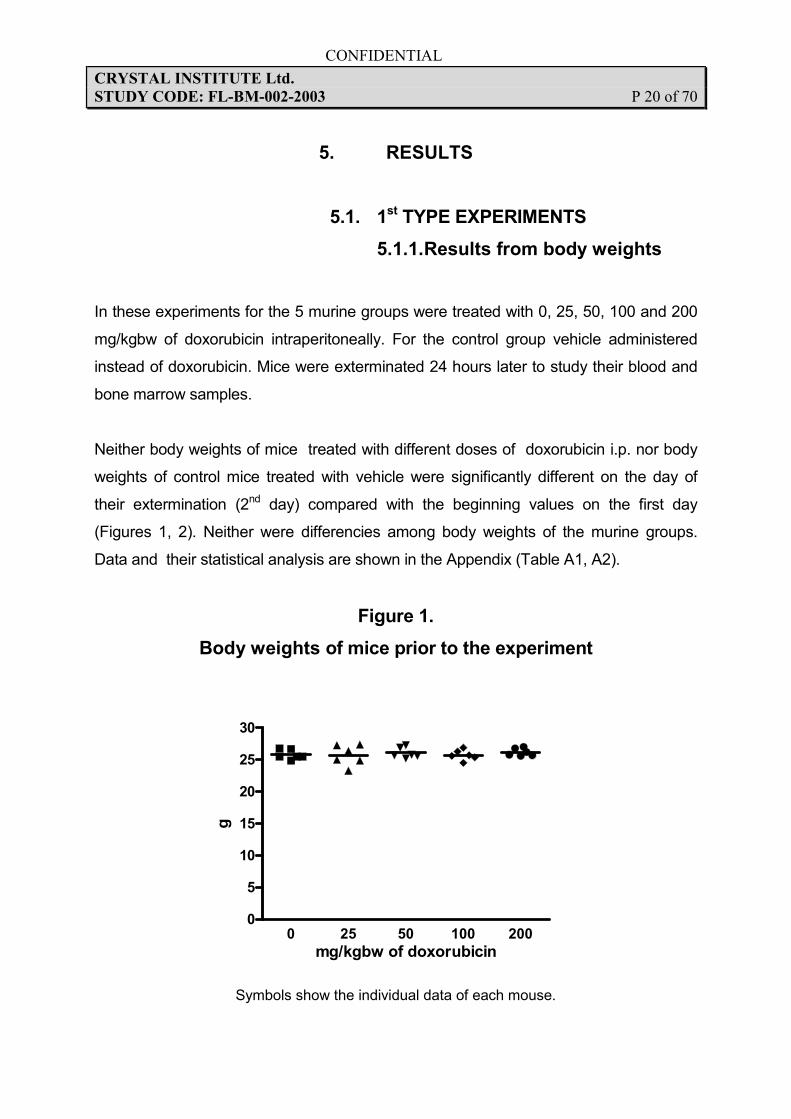
In these experiments for the 5 murine groups were treated with 0, 25, 50, 100 and 200
mg/kgbw of doxorubicin intraperitoneally. For the control group vehicle administered
instead of doxorubicin. Mice were exterminated 24 hours later to study their blood and
bone marrow samples.
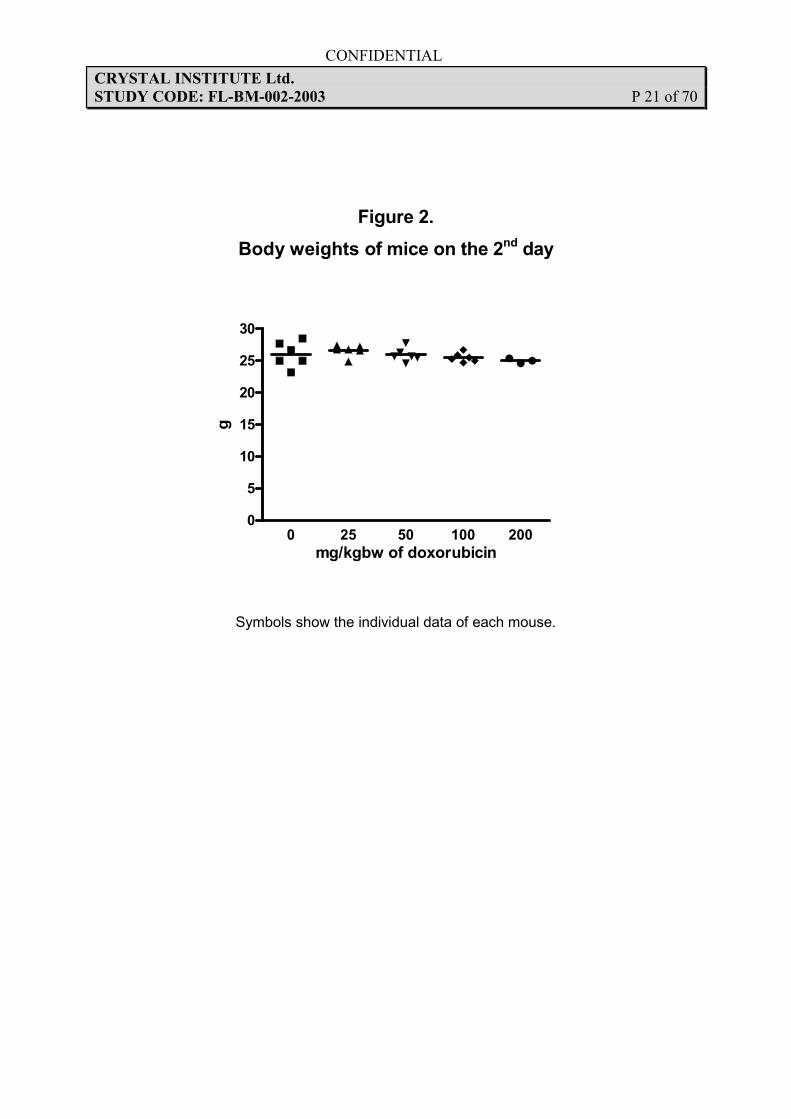
Neither body weights of mice treated with different doses of doxorubicin i.p. nor body
weights of control mice treated with vehicle were significantly different on the day of
their extermination (2nd day) compared with the beginning values on the first day
(Figures 1, 2). Neither were differencies among body weights of the murine groups.
Data and their statistical analysis are shown in the Appendix (Table A1, A2).
Figure 1.
Body weights of mice prior to the experiment
0 25 50 100 2000
5
10
15
20
25
30
mg/kgbw of doxorubicin
g
Symbols show the individual data of each mouse.
CONFIDENTIAL
CRYSTAL INSTITUTE Ltd.
STUDY CODE: FL-BM-002-2003 P 21 of 70
Figure 2.
Body weights of mice on the 2nd day
0 25 50 100 2000
5
10
15
20
25
30
mg/kgbw of doxorubicin
g
Symbols show the individual data of each mouse.
CONFIDENTIAL
CRYSTAL INSTITUTE Ltd.
STUDY CODE: FL-BM-002-2003 P 22 of 70
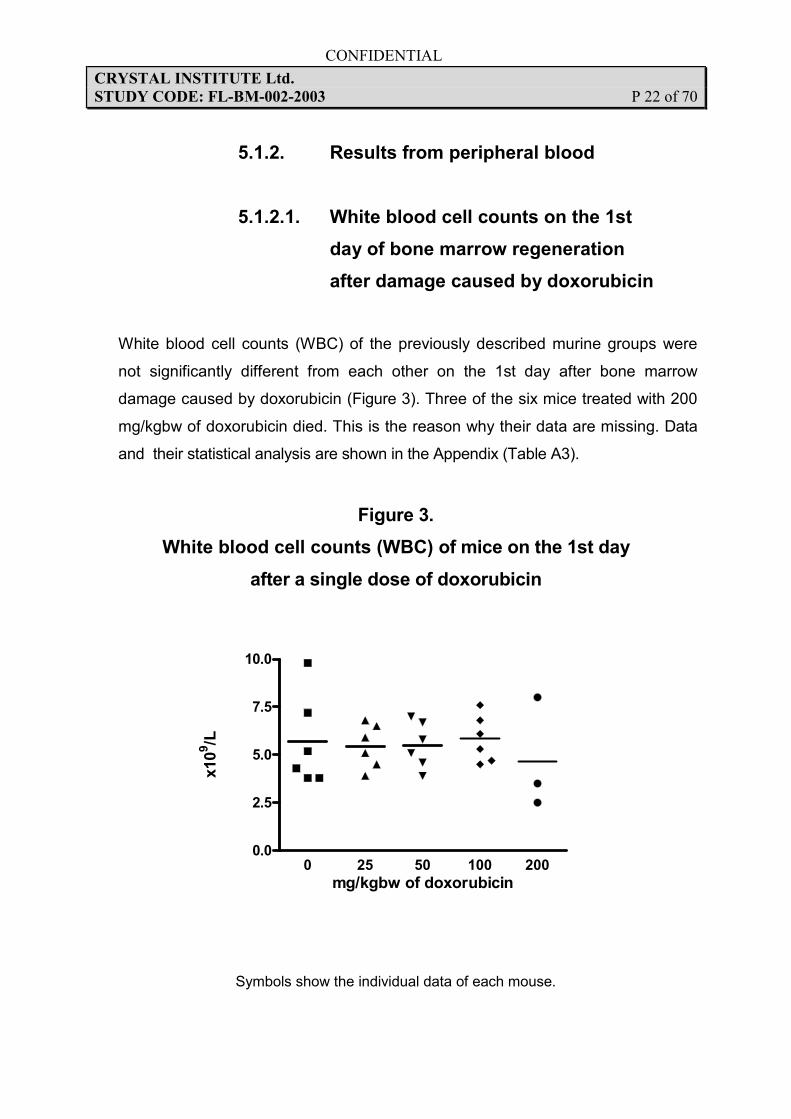
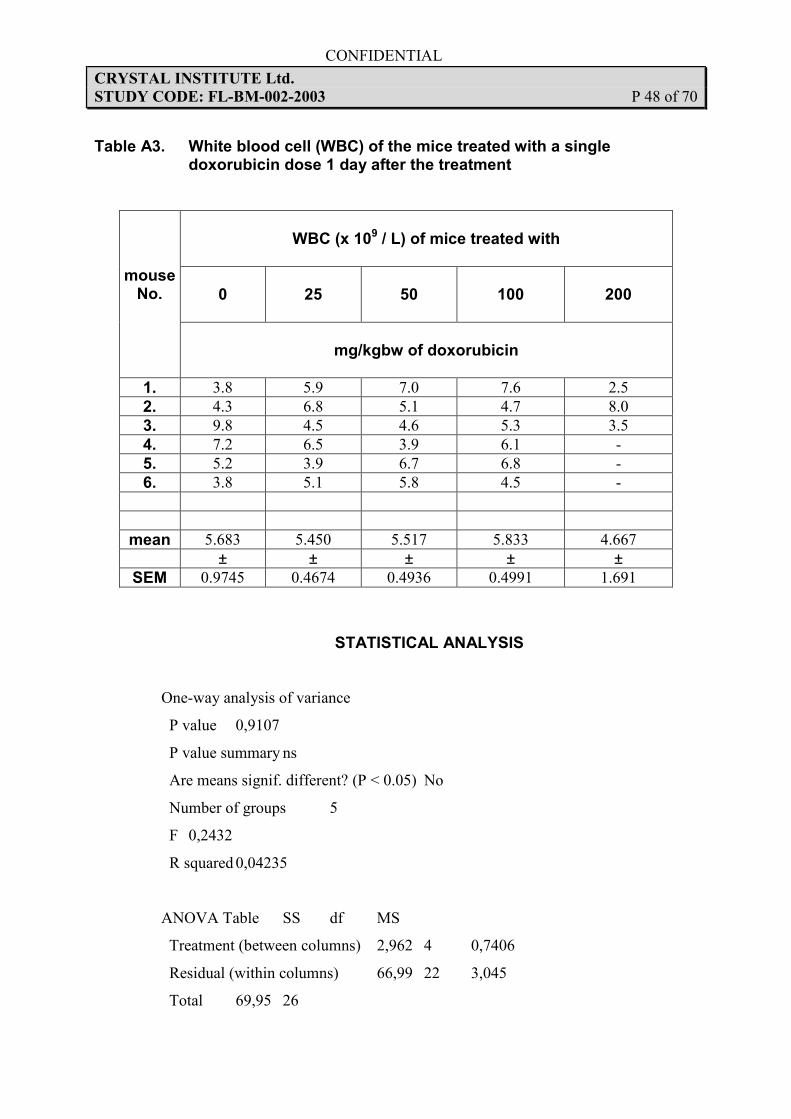
5.1.2. Results from peripheral blood
5.1.2.1. White blood cell counts on the 1st
day of bone marrow regeneration
after damage caused by doxorubicin
White blood cell counts (WBC) of the previously described murine groups were
not significantly different from each other on the 1st day after bone marrow
damage caused by doxorubicin (Figure 3). Three of the six mice treated with 200
mg/kgbw of doxorubicin died. This is the reason why their data are missing. Data
and their statistical analysis are shown in the Appendix (Table A3).
Figure 3.
White blood cell counts (WBC) of mice on the 1st day
after a single dose of doxorubicin
0 25 50 100 2000.0
2.5
5.0
7.5
10.0
mg/kgbw of doxorubicin
x109/L
Symbols show the individual data of each mouse.
CONFIDENTIAL
CRYSTAL INSTITUTE Ltd.
STUDY CODE: FL-BM-002-2003 P 23 of 70
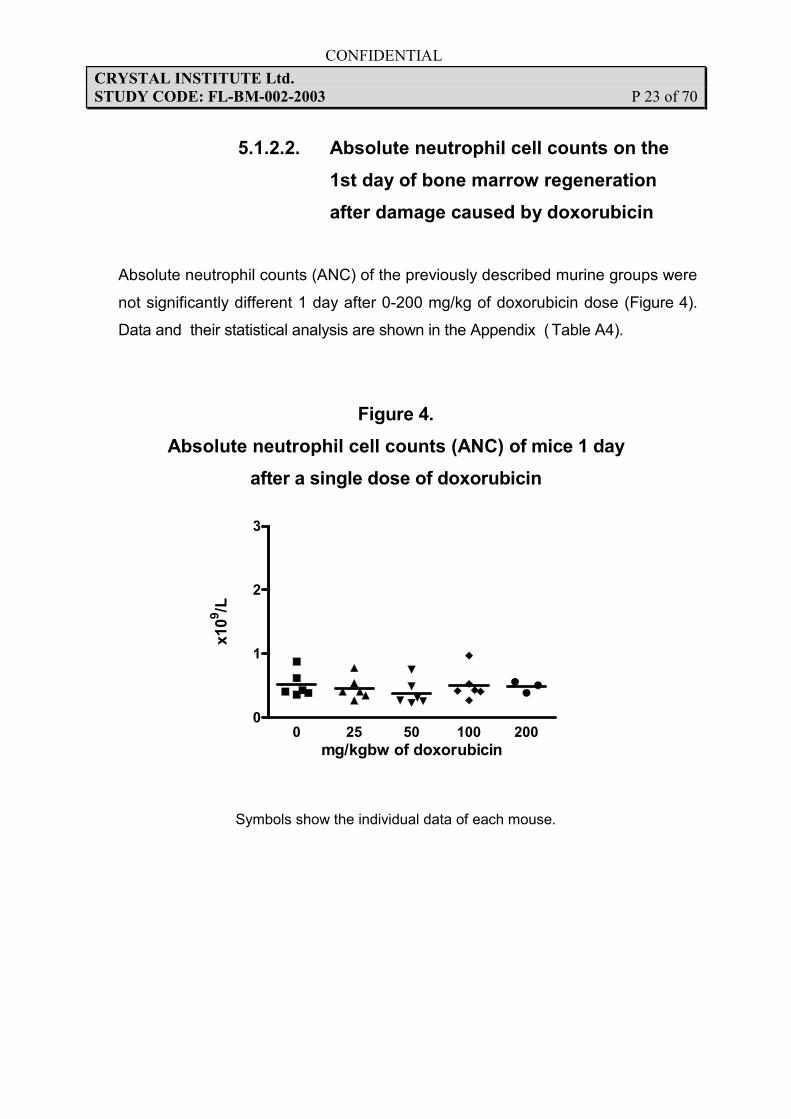
5.1.2.2. Absolute neutrophil cell counts on the
1st day of bone marrow regeneration
after damage caused by doxorubicin
Absolute neutrophil counts (ANC) of the previously described murine groups were
not significantly different 1 day after 0-200 mg/kg of doxorubicin dose (Figure 4).
Data and their statistical analysis are shown in the Appendix ( Table A4).
Figure 4.
Absolute neutrophil cell counts (ANC) of mice 1 day
after a single dose of doxorubicin
0 25 50 100 2000
1
2
3
mg/kgbw of doxorubicin
x109/L
Symbols show the individual data of each mouse.
CONFIDENTIAL
CRYSTAL INSTITUTE Ltd.
STUDY CODE: FL-BM-002-2003 P 24 of 70
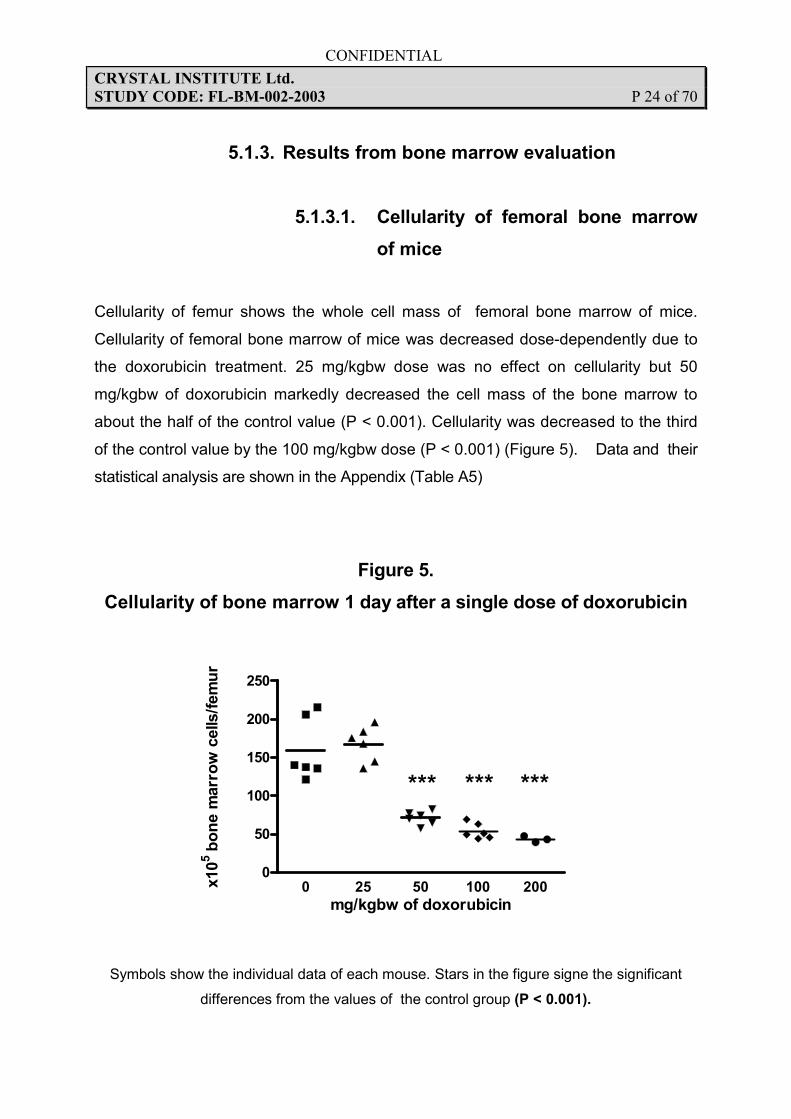
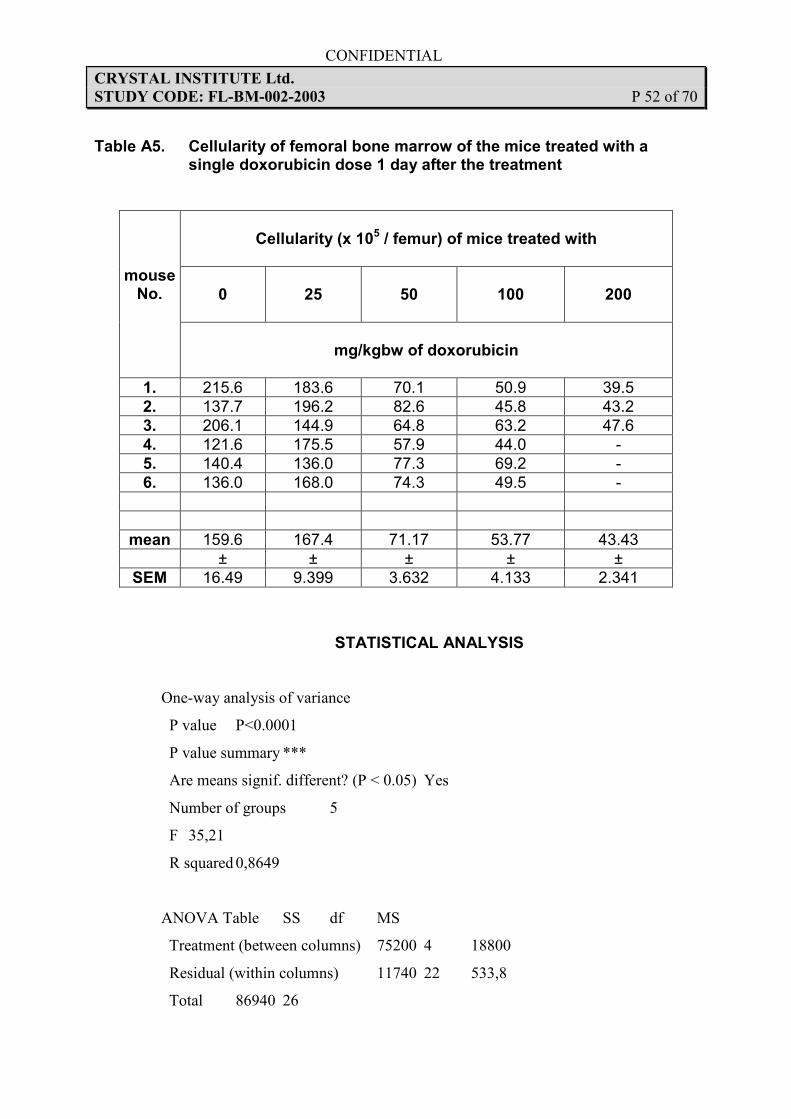
5.1.3. Results from bone marrow evaluation
5.1.3.1. Cellularity of femoral bone marrow
of mice
Cellularity of femur shows the whole cell mass of femoral bone marrow of mice.
Cellularity of femoral bone marrow of mice was decreased dose-dependently due to
the doxorubicin treatment. 25 mg/kgbw dose was no effect on cellularity but 50
mg/kgbw of doxorubicin markedly decreased the cell mass of the bone marrow to
about the half of the control value (P < 0.001). Cellularity was decreased to the third
of the control value by the 100 mg/kgbw dose (P < 0.001) (Figure 5). Data and their
statistical analysis are shown in the Appendix (Table A5)
Figure 5.
Cellularity of bone marrow 1 day after a single dose of doxorubicin
0 25 50 100 2000
50
100
150
200
250
*** *** ***
mg/kgbw of doxorubicin
x105bone marrow cells/femur
Symbols show the individual data of each mouse. Stars in the figure signe the significant
differences from the values of the control group (P < 0.001).
CONFIDENTIAL
CRYSTAL INSTITUTE Ltd.
STUDY CODE: FL-BM-002-2003 P 25 of 70
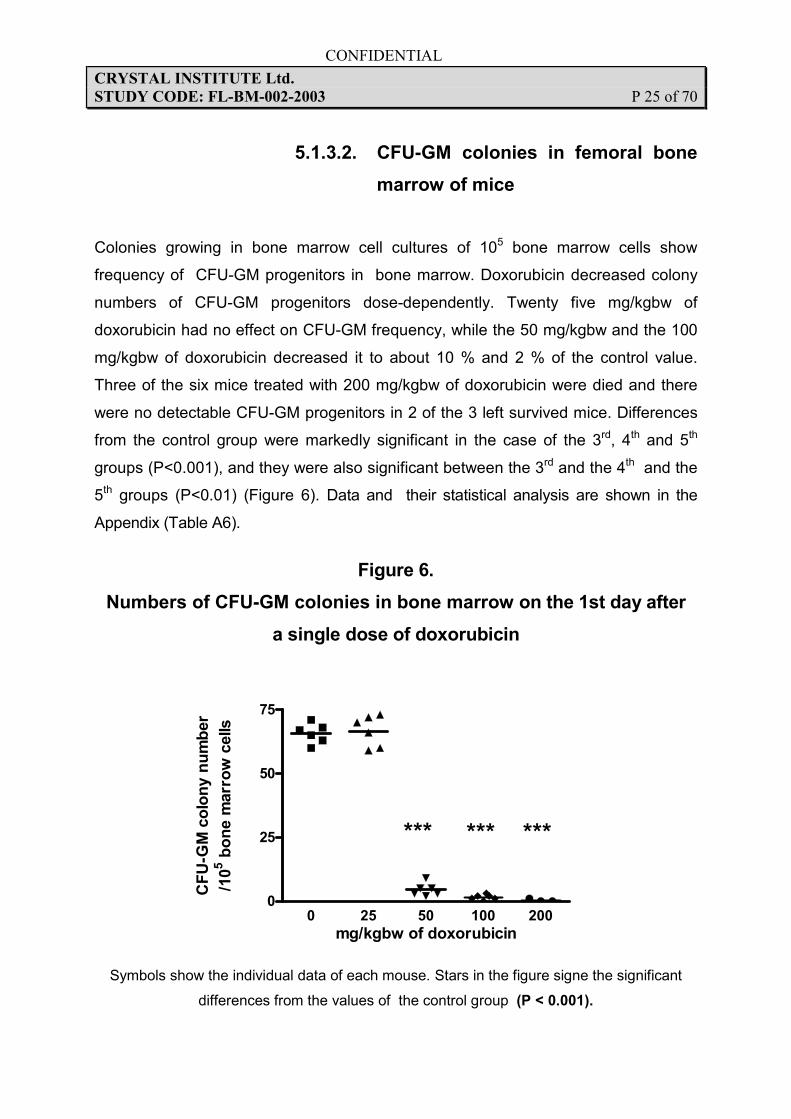
5.1.3.2. CFU-GM colonies in femoral bone
marrow of mice
Colonies growing in bone marrow cell cultures of 105 bone marrow cells show
frequency of CFU-GM progenitors in bone marrow. Doxorubicin decreased colony
numbers of CFU-GM progenitors dose-dependently. Twenty five mg/kgbw of
doxorubicin had no effect on CFU-GM frequency, while the 50 mg/kgbw and the 100
mg/kgbw of doxorubicin decreased it to about 10 % and 2 % of the control value.
Three of the six mice treated with 200 mg/kgbw of doxorubicin were died and there
were no detectable CFU-GM progenitors in 2 of the 3 left survived mice. Differences
from the control group were markedly significant in the case of the 3rd, 4th and 5th
groups (P<0.001), and they were also significant between the 3rd and the 4th and the
5th groups (P<0.01) (Figure 6). Data and their statistical analysis are shown in the
Appendix (Table A6).
Figure 6.
Numbers of CFU-GM colonies in bone marrow on the 1st day after
a single dose of doxorubicin
0 25 50 100 2000
25
50
75
*** ******
mg/kgbw of doxorubicin
CFU-GM colony number
/105 bone marrow cells
Symbols show the individual data of each mouse. Stars in the figure signe the significant
differences from the values of the control group (P < 0.001).
CONFIDENTIAL
CRYSTAL INSTITUTE Ltd.
STUDY CODE: FL-BM-002-2003 P 26 of 70
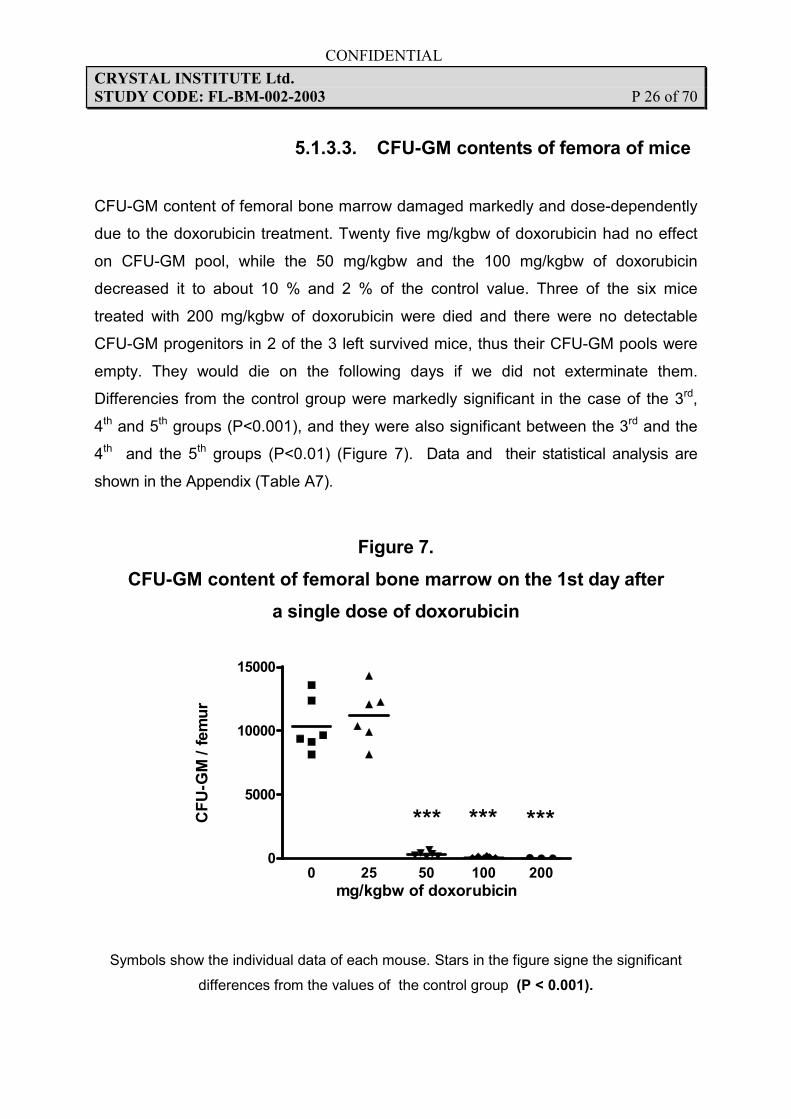
5.1.3.3. CFU-GM contents of femora of mice
CFU-GM content of femoral bone marrow damaged markedly and dose-dependently
due to the doxorubicin treatment. Twenty five mg/kgbw of doxorubicin had no effect
on CFU-GM pool, while the 50 mg/kgbw and the 100 mg/kgbw of doxorubicin
decreased it to about 10 % and 2 % of the control value. Three of the six mice
treated with 200 mg/kgbw of doxorubicin were died and there were no detectable
CFU-GM progenitors in 2 of the 3 left survived mice, thus their CFU-GM pools were
empty. They would die on the following days if we did not exterminate them.
Differencies from the control group were markedly significant in the case of the 3rd,
4th and 5th groups (P<0.001), and they were also significant between the 3rd and the
4th and the 5th groups (P<0.01) (Figure 7). Data and their statistical analysis are
shown in the Appendix (Table A7).
Figure 7.
CFU-GM content of femoral bone marrow on the 1st day after
a single dose of doxorubicin
0 25 50 100 2000
5000
10000
15000
*** ******
mg/kgbw of doxorubicin
CFU-GM / femur
Symbols show the individual data of each mouse. Stars in the figure signe the significant
differences from the values of the control group (P < 0.001).
CONFIDENTIAL
CRYSTAL INSTITUTE Ltd.
STUDY CODE: FL-BM-002-2003 P 27 of 70
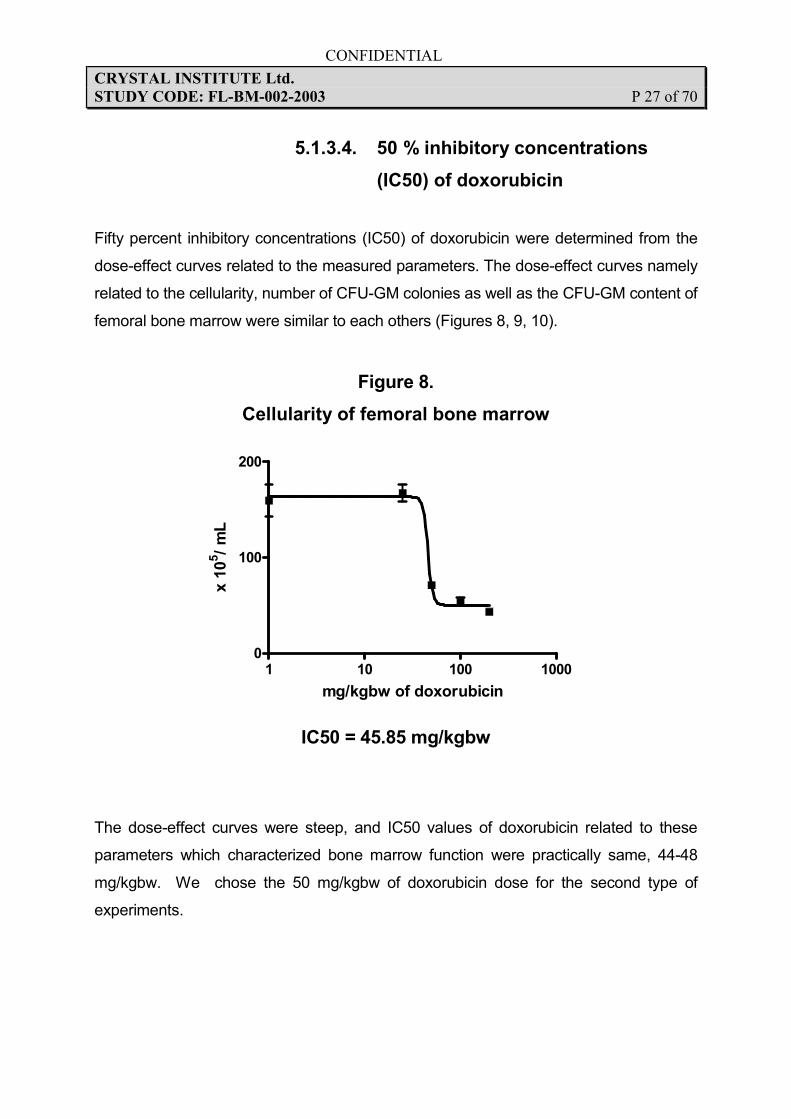
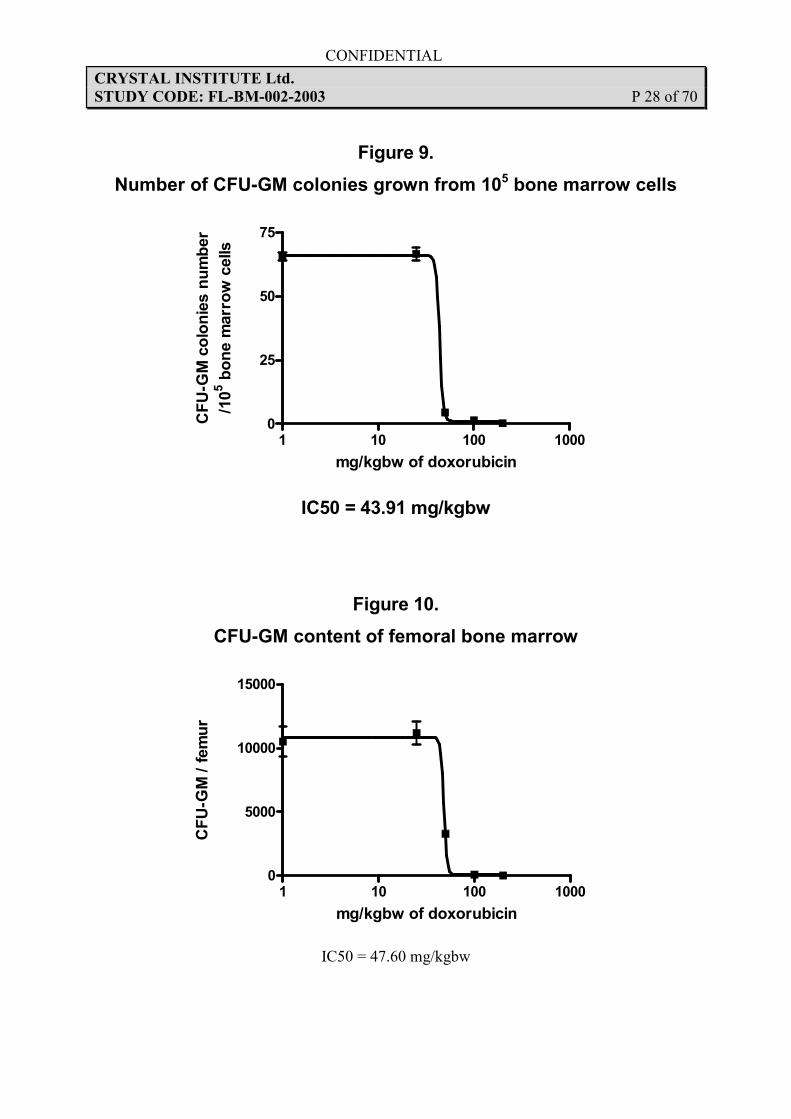
5.1.3.4. 50 % inhibitory concentrations
(IC50) of doxorubicin
Fifty percent inhibitory concentrations (IC50) of doxorubicin were determined from the
dose-effect curves related to the measured parameters. The dose-effect curves namely
related to the cellularity, number of CFU-GM colonies as well as the CFU-GM content of
femoral bone marrow were similar to each others (Figures 8, 9, 10).
Figure 8.
Cellularity of femoral bone marrow
1 10 100 10000
100
200
mg/kgbw of doxorubicin
x 105/ mL
IC50 = 45.85 mg/kgbw
The dose-effect curves were steep, and IC50 values of doxorubicin related to these
parameters which characterized bone marrow function were practically same, 44-48
mg/kgbw. We chose the 50 mg/kgbw of doxorubicin dose for the second type of
experiments.
CONFIDENTIAL
CRYSTAL INSTITUTE Ltd.
STUDY CODE: FL-BM-002-2003 P 28 of 70
Figure 9.
Number of CFU-GM colonies grown from 105 bone marrow cells
1 10 100 10000
25
50
75
mg/kgbw of doxorubicin
CFU-GM colonies number
/105 bone marrow cells
IC50 = 43.91 mg/kgbw
Figure 10.
CFU-GM content of femoral bone marrow
1 10 100 10000
5000
10000
15000
mg/kgbw of doxorubicin
CFU-GM / femur
IC50 = 47.60 mg/kgbw
CONFIDENTIAL
CRYSTAL INSTITUTE Ltd.
STUDY CODE: FL-BM-002-2003 P 29 of 70
5.2. 2 ND TYPE EXPERIMENTS
5.2.1. Results from body weights
In these 2nd type experiments 3 murine groups were. The mice of the control group
were administered doxorubicin alone and the mice of the 2nd and 3rd groups were
pretreated with 0.4 and 4 ml/kgbw of fruit extract respectively for 7 consecutive days
before the same doxorubicin dose. The 50 mg/kgbw of doxorubicin i.p. was used one
hour after the last p.o. dose of the fruit extract or vehicle.
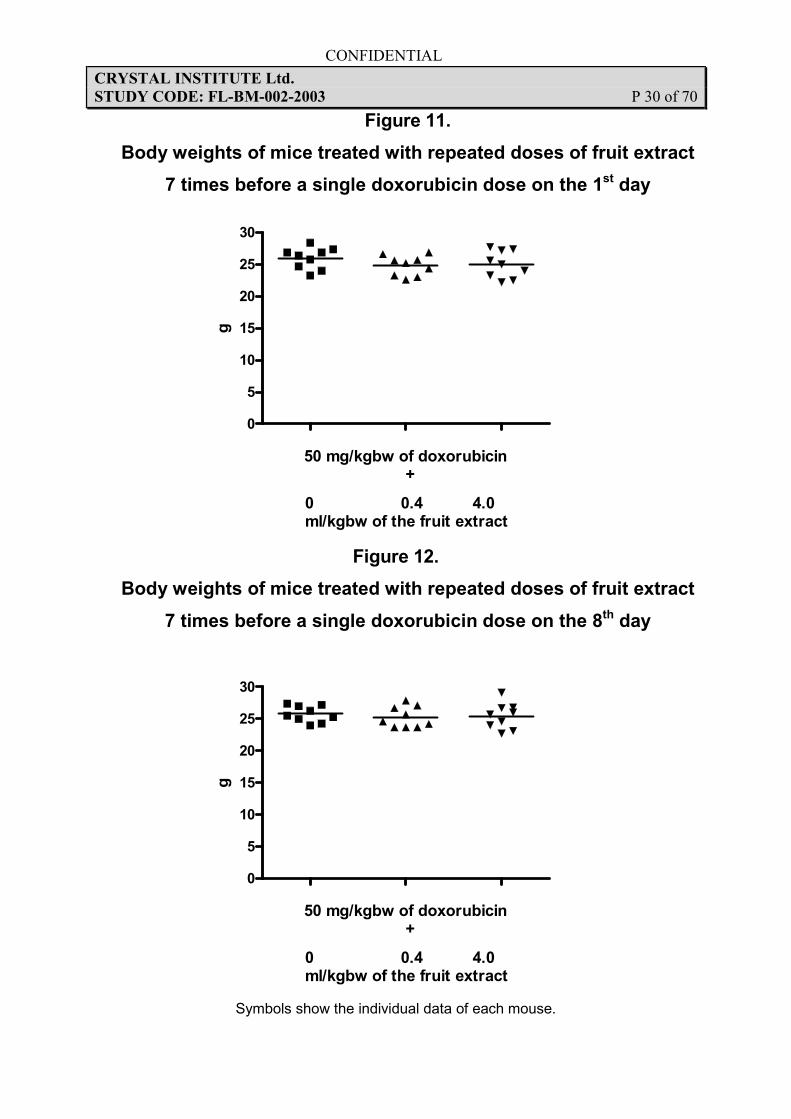
Neither body weights of mice pretreated with 2 different doses of the fruit extract for 7
consecutive days before the doxorubicin dose nor body weights of control mice treated
with doxorubicin alone were significantly different on the day of their extermination (8th
day) compared with the beginning values on the first day (Figures 11, 12). Neither were
differencies among the body weights of the murine groups. Data and their statistical
analysis are shown in the Appendix (Table A8).
CONFIDENTIAL
CRYSTAL INSTITUTE Ltd.
STUDY CODE: FL-BM-002-2003 P 30 of 70
Figure 11.
Body weights of mice treated with repeated doses of fruit extract
7 times before a single doxorubicin dose on the 1st day
0
5
10
15
20
25
30
0 0.4 4.0ml/kgbw of the fruit extract
50 mg/kgbw of doxorubicin+
g
Figure 12.
Body weights of mice treated with repeated doses of fruit extract
7 times before a single doxorubicin dose on the 8th day
0
5
10
15
20
25
30
0 0.4 4.0ml/kgbw of the fruit extract
50 mg/kgbw of doxorubicin+
g
Symbols show the individual data of each mouse.
CONFIDENTIAL
CRYSTAL INSTITUTE Ltd.
STUDY CODE: FL-BM-002-2003 P 31 of 70
5.2.2. Results from peripheral blood
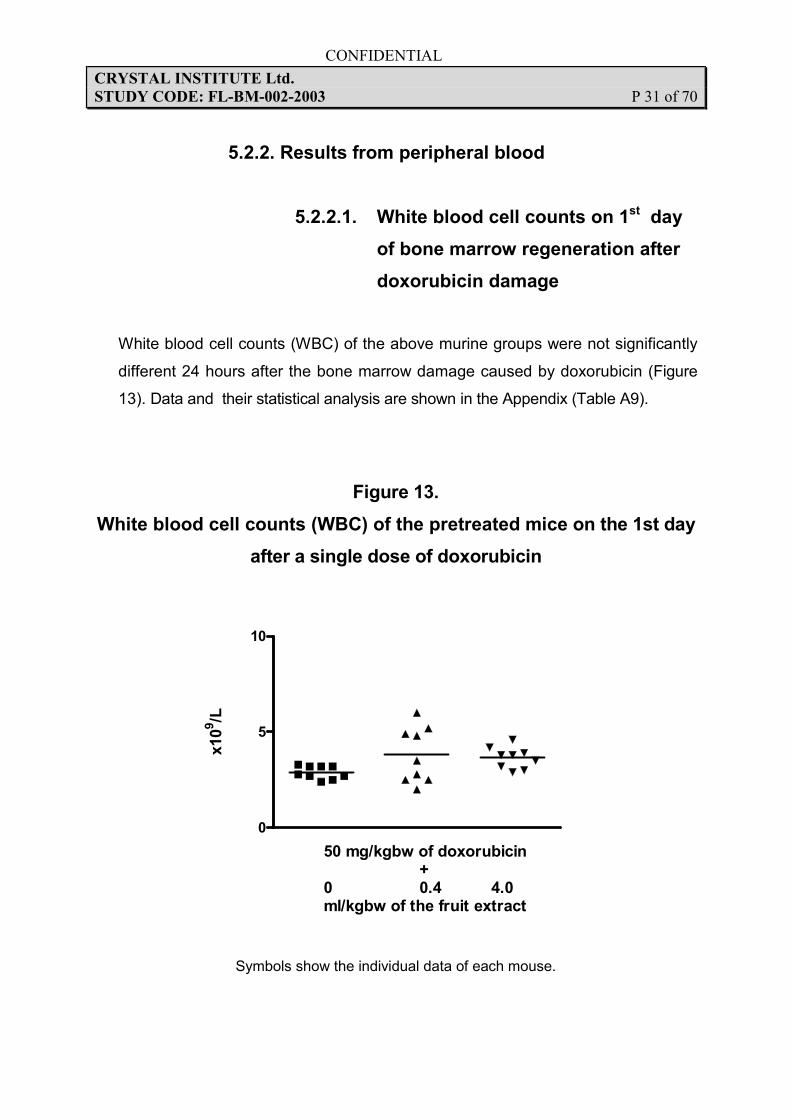
5.2.2.1. White blood cell counts on 1st day
of bone marrow regeneration after
doxorubicin damage
White blood cell counts (WBC) of the above murine groups were not significantly
different 24 hours after the bone marrow damage caused by doxorubicin (Figure
13). Data and their statistical analysis are shown in the Appendix (Table A9).
Figure 13.
White blood cell counts (WBC) of the pretreated mice on the 1st day
after a single dose of doxorubicin
0
5
10
50 mg/kgbw of doxorubicin+
0 0.4 4.0ml/kgbw of the fruit extract
x109/L
Symbols show the individual data of each mouse.
CONFIDENTIAL
CRYSTAL INSTITUTE Ltd.
STUDY CODE: FL-BM-002-2003 P 32 of 70
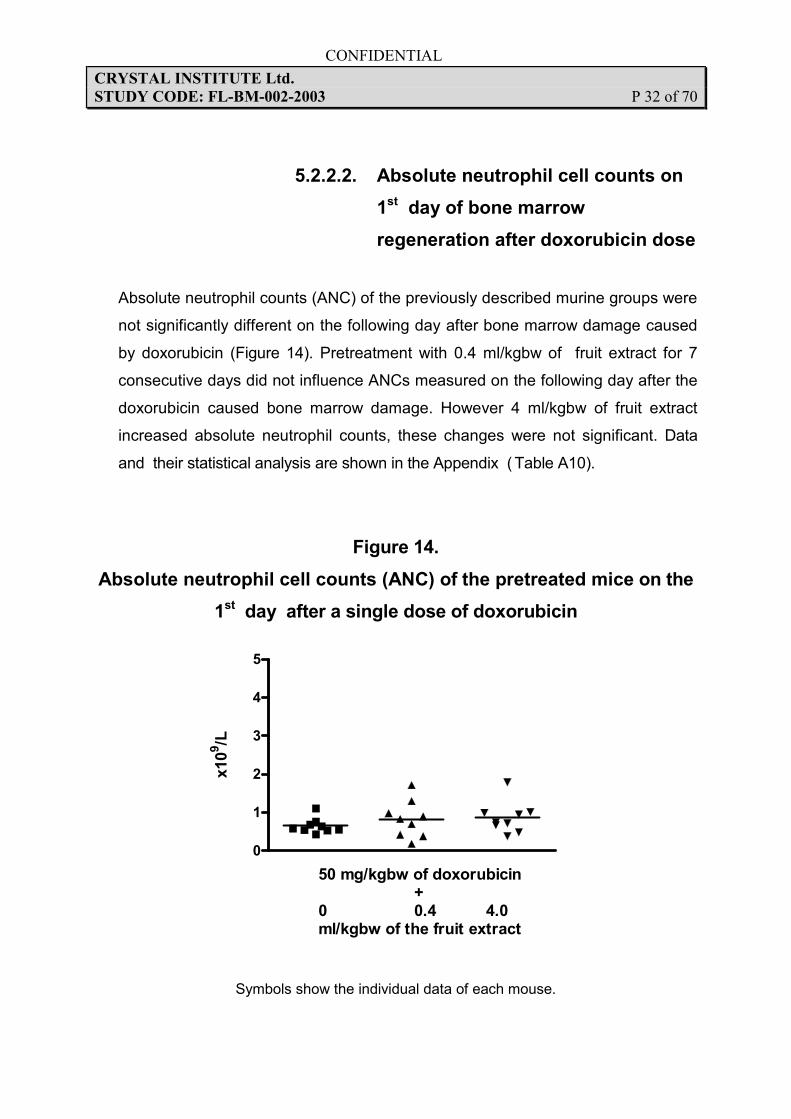
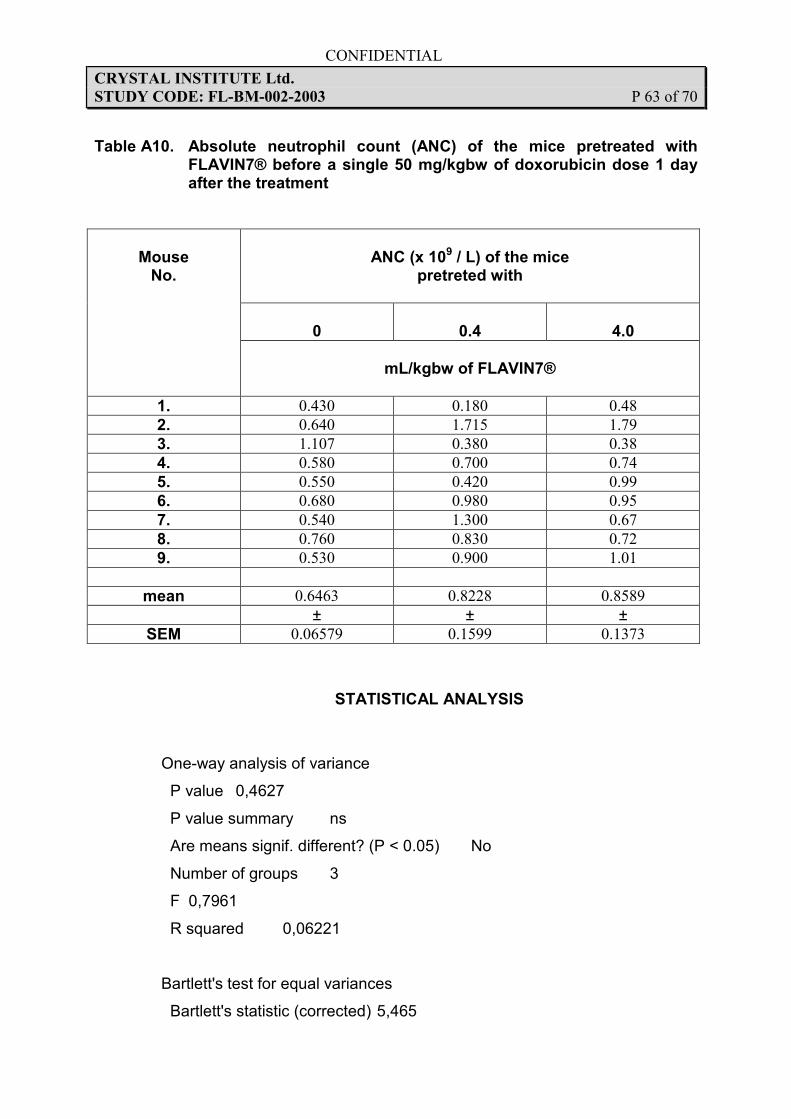
5.2.2.2. Absolute neutrophil cell counts on
1st day of bone marrow
regeneration after doxorubicin dose
Absolute neutrophil counts (ANC) of the previously described murine groups were
not significantly different on the following day after bone marrow damage caused
by doxorubicin (Figure 14). Pretreatment with 0.4 ml/kgbw of fruit extract for 7
consecutive days did not influence ANCs measured on the following day after the
doxorubicin caused bone marrow damage. However 4 ml/kgbw of fruit extract
increased absolute neutrophil counts, these changes were not significant. Data
and their statistical analysis are shown in the Appendix ( Table A10).
Figure 14.
Absolute neutrophil cell counts (ANC) of the pretreated mice on the
1st day after a single dose of doxorubicin
0
1
2
3
4
5
50 mg/kgbw of doxorubicin+
0 0.4 4.0ml/kgbw of the fruit extract
x109/L
Symbols show the individual data of each mouse.
CONFIDENTIAL
CRYSTAL INSTITUTE Ltd.
STUDY CODE: FL-BM-002-2003 P 33 of 70
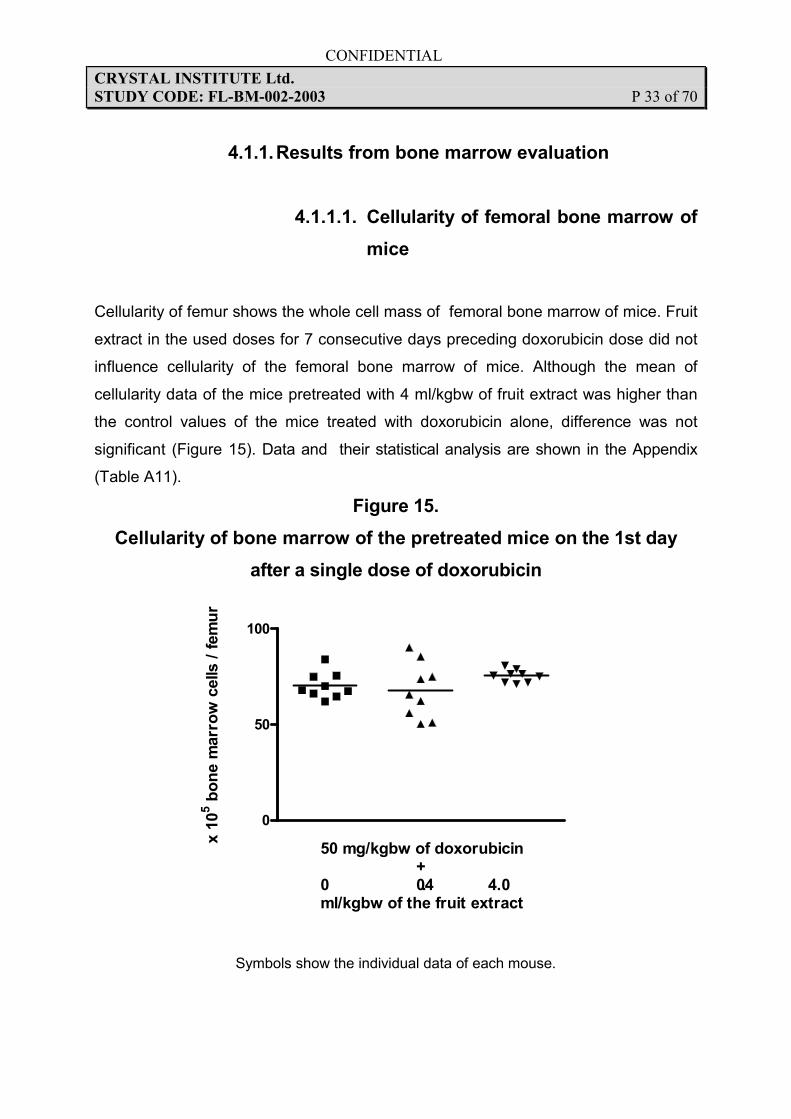
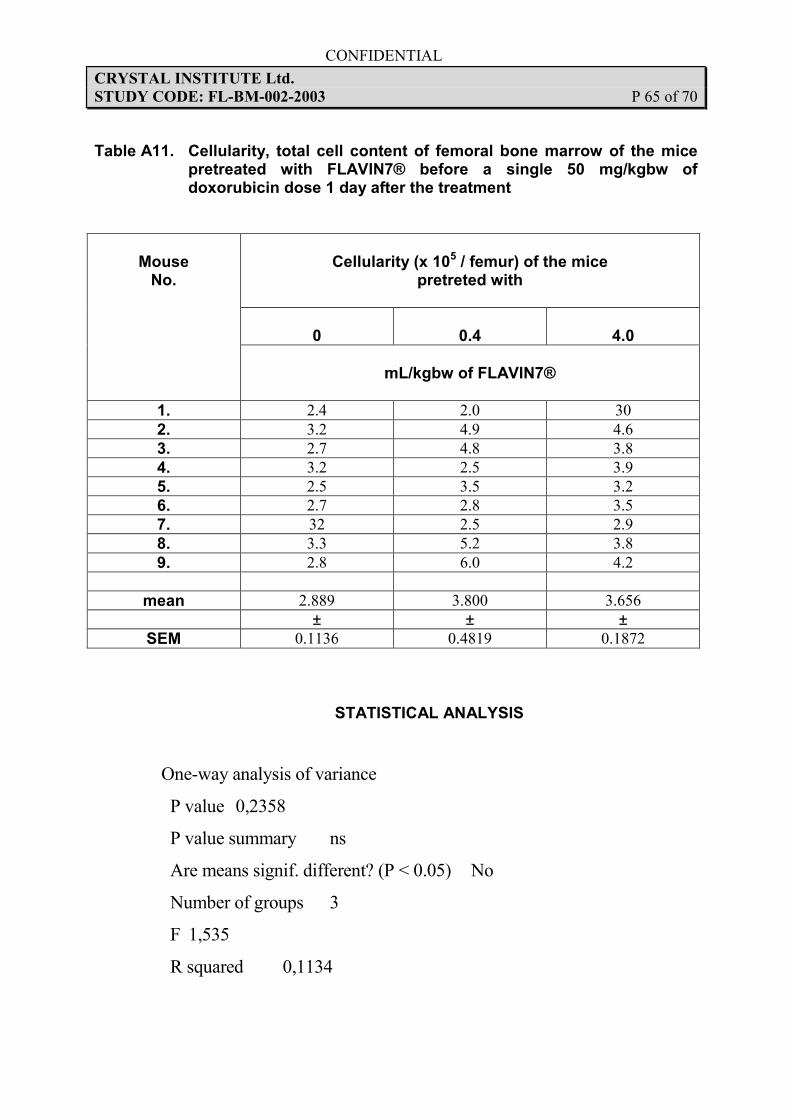
4.1.1. Results from bone marrow evaluation
4.1.1.1. Cellularity of femoral bone marrow of
mice
Cellularity of femur shows the whole cell mass of femoral bone marrow of mice. Fruit
extract in the used doses for 7 consecutive days preceding doxorubicin dose did not
influence cellularity of the femoral bone marrow of mice. Although the mean of
cellularity data of the mice pretreated with 4 ml/kgbw of fruit extract was higher than
the control values of the mice treated with doxorubicin alone, difference was not
significant (Figure 15). Data and their statistical analysis are shown in the Appendix
(Table A11).
Figure 15.
Cellularity of bone marrow of the pretreated mice on the 1st day
after a single dose of doxorubicin
0
50
100
50 mg/kgbw of doxorubicin+
0 0.4 4.0ml/kgbw of the fruit extract
x 105 bone marrow cells / femur
Symbols show the individual data of each mouse.
CONFIDENTIAL
CRYSTAL INSTITUTE Ltd.
STUDY CODE: FL-BM-002-2003 P 34 of 70
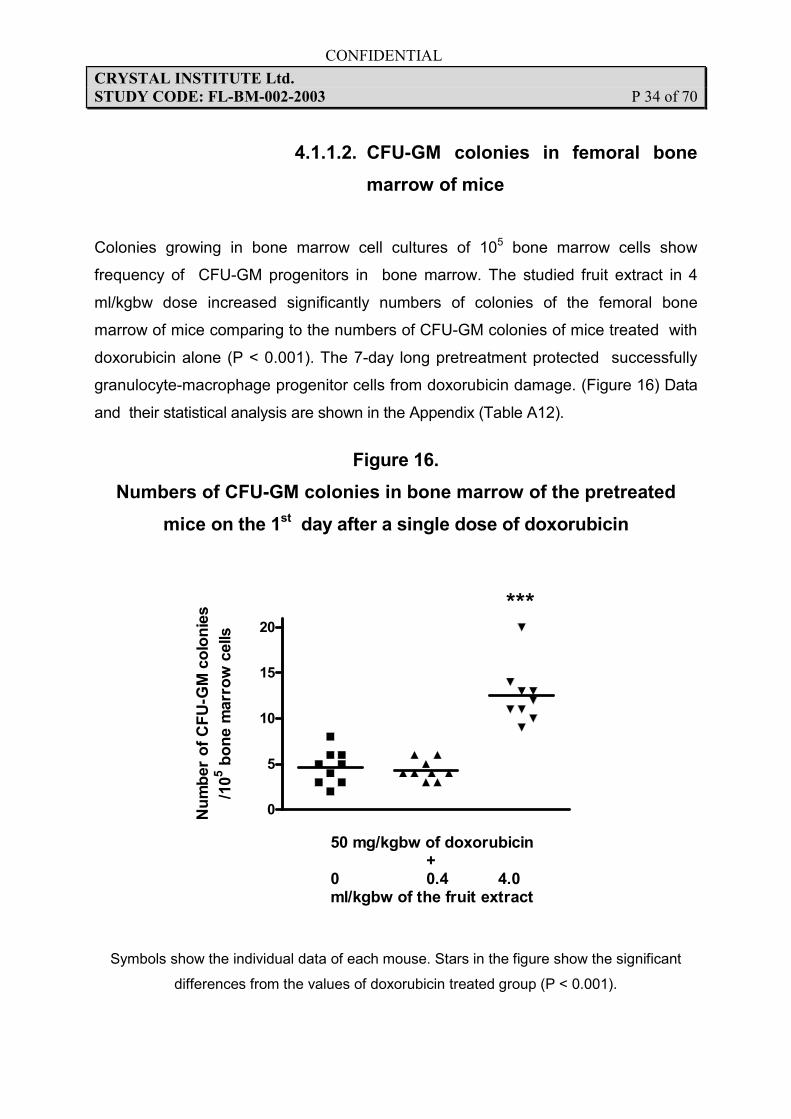
4.1.1.2. CFU-GM colonies in femoral bone
marrow of mice
Colonies growing in bone marrow cell cultures of 105 bone marrow cells show
frequency of CFU-GM progenitors in bone marrow. The studied fruit extract in 4
ml/kgbw dose increased significantly numbers of colonies of the femoral bone
marrow of mice comparing to the numbers of CFU-GM colonies of mice treated with
doxorubicin alone (P < 0.001). The 7-day long pretreatment protected successfully
granulocyte-macrophage progenitor cells from doxorubicin damage. (Figure 16) Data
and their statistical analysis are shown in the Appendix (Table A12).
Figure 16.
Numbers of CFU-GM colonies in bone marrow of the pretreated
mice on the 1st day after a single dose of doxorubicin
0
5
10
15
20
50 mg/kgbw of doxorubicin+
0 0.4 4.0ml/kgbw of the fruit extract
***
Number of CFU-GM colonies
/105 bone marrow cells
Symbols show the individual data of each mouse. Stars in the figure show the significant
differences from the values of doxorubicin treated group (P < 0.001).
CONFIDENTIAL
CRYSTAL INSTITUTE Ltd.
STUDY CODE: FL-BM-002-2003 P 35 of 70
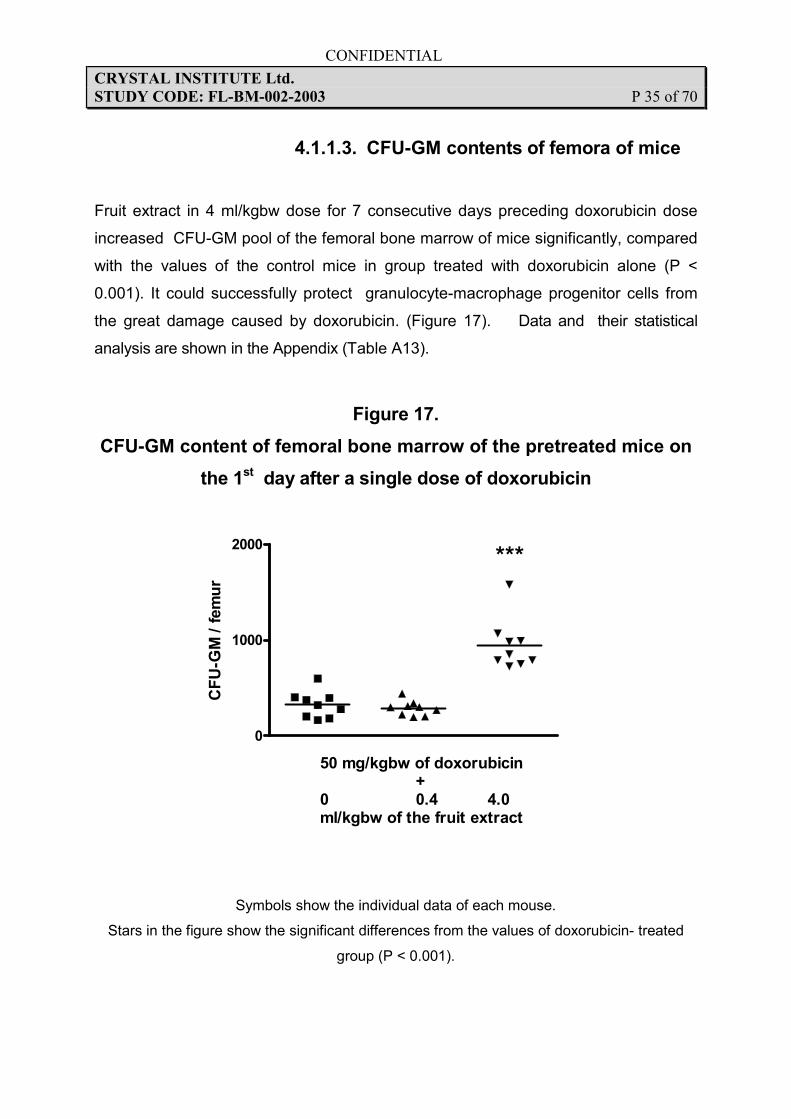
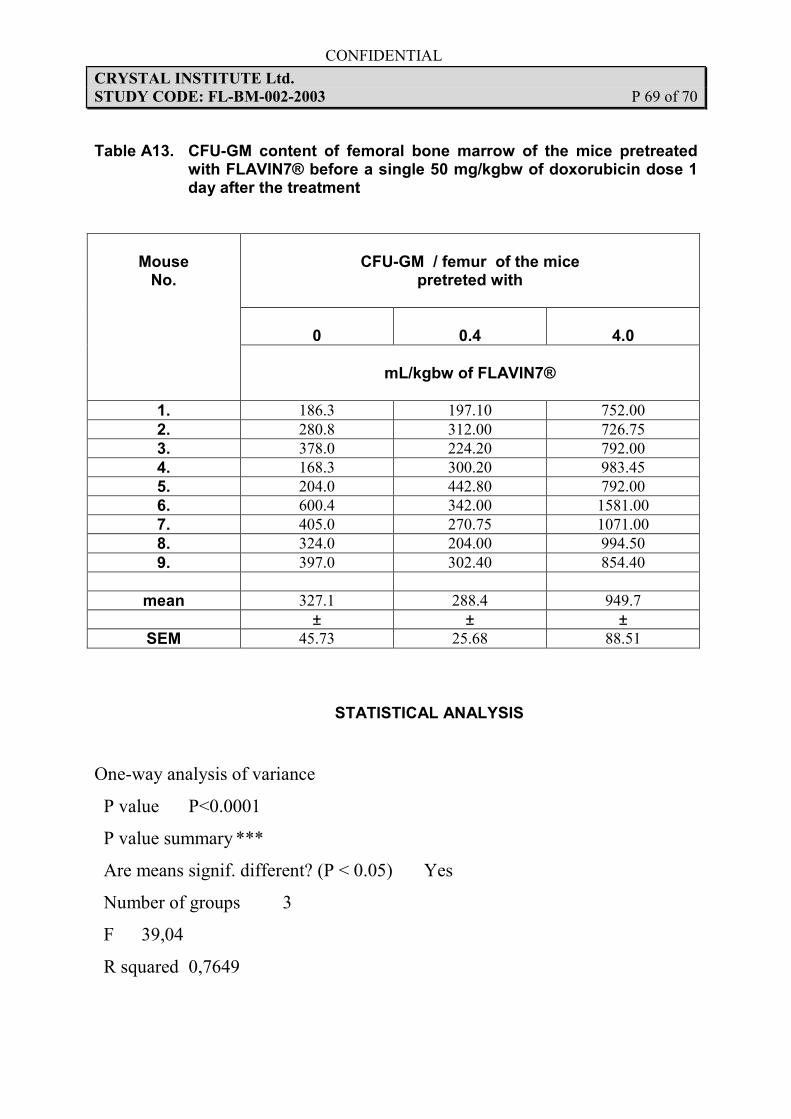
4.1.1.3. CFU-GM contents of femora of mice
Fruit extract in 4 ml/kgbw dose for 7 consecutive days preceding doxorubicin dose
increased CFU-GM pool of the femoral bone marrow of mice significantly, compared
with the values of the control mice in group treated with doxorubicin alone (P <
0.001). It could successfully protect granulocyte-macrophage progenitor cells from
the great damage caused by doxorubicin. (Figure 17). Data and their statistical
analysis are shown in the Appendix (Table A13).
Figure 17.
CFU-GM content of femoral bone marrow of the pretreated mice on
the 1st day after a single dose of doxorubicin
0
1000
2000***
50 mg/kgbw of doxorubicin+
0 0.4 4.0ml/kgbw of the fruit extract
CFU-GM / femur
Symbols show the individual data of each mouse.
Stars in the figure show the significant differences from the values of doxorubicin- treated
group (P < 0.001).
CONFIDENTIAL
CRYSTAL INSTITUTE Ltd.
STUDY CODE: FL-BM-002-2003 P 36 of 70
6. DISCUSSION AND CONCLUSIONS
6.1. EFFECTS OF DOXORUBICIN ON HEMOPOIESIS
The first aim of this study was to investigate damage of hemopoiesis after a
single doxorubicin dose in the early period of bone marrow regeneration, namely
on the 1st day after the damage.
Myelosuppression is the most common dose-limiting toxicity encountered with
cytostatic drugs (Wintrobe 1999). Cytostatic agents inhibit proliferation of hemopoietic
stem and progenitor cells in bone marrow. As stem cells have much longer duplicating
times than progenitors, progenitor cells are more sensitive to such damage. Due to
damage of hemopoietic progenitors they will not be able to compensate for the loss of
mature blood cells possessing a short life-span. The major target is the granulocyte-
macrophage progenitor cell (CFU-GM), which is responsible for supplying the human
body with monocytes and macrophages. If CFU-GM pool of bone marrow decreases,
neutropenia can be observed in blood.
A single doxorubicin dose causes damage in hemopoiesis dose-dependently in the
studied dose range. In the femoral bone marrow cellularity decreased to about half, due
to 50 mg/kbw of doxorubicin. Granulocyte-macrophage colony-forming cells (CFU-GM)
were especially sensitive to the damage caused by doxorubicin. Dose-effect curves
related to CFU-GM colony numbers and CFU-GM content of femora of the mice were
as steep as the dose-effect curve related to the cellularity, but 50 mg/kgbw of
doxorubicin caused greater decrease in these values than in the whole cellular content
of bone marrow. The fifty percent inhibitory concentrations were 44-48 mg/kgbw. Due to
the damage of granulocyte-macrophage progenitor cells the lack of the mature cells in
the peripheral blood could be seen only after a latent period, thus the absolute
neutrophil counts were normal on the 1st day of the bone marrow regeneration. To
evaluate whether the studied fruit extract, FLAVIN7® has any effect on all the
previously measured parameters of the bone marrow damage caused by doxorubicin
the 50 mg/kgbw of doxorubicin dose was chosen.
CONFIDENTIAL
CRYSTAL INSTITUTE Ltd.
STUDY CODE: FL-BM-002-2003 P 37 of 70
6.2. EFFECTS OF FLAVIN7® ON DAMAGE OF
HEMOPOIESIS CAUSED BY A SINGLE DOXORUBICIN
DOSE
The second aim of this study is to investigate whether
the fruit extract with high polyphenol content (Flavin7®), can protect
hemopoiesis of bone marrow from damage caused by doxorubicin in vivo in
mice.
Flavonoids are very common and widespread secondary plant metabolites. They
have a wide range of biological and physiological activities and serve as
chemotaxonomic marker compounds. Flavonoids and other polyphenol compounds
are present in all green plants. They have a great importance in life of plants. A plant
produces more flavonoids as a protective response when it undergoes stress, such
as attack by fungi and bacteria or exposure to ultraviolet radiation. They have some
protective effects in the cells in partly due to their antioxidant effects. Increased
flavonoid levels are thought to enhance certain biological functions in humans.
Indeed some flavonoids have antioxidative, cardioprotective, possibly
anticarcinogenic and chemopreventive effects. Therefore, they have been
extensively investigated both in the past and during recent years.
A number of naturally occurring flavonoids from herbs have shown chemopreventive
properties against carcinogenesis using in vitro and in animal models (Chen et al.
1998, Fukutake et al. 2000, Lahiri-Chatterjee et al. 1999, Zheng et al. 1997).
Chemoprevention refers to the application of compounds to block, reverse or prevent
the development of invasive cancers (Young and Wilson 2002). Numerous plant-
derived polyphenolic compounds with antioxidant and free radical scavenging
properties can prevent tumour formation (Surh 1999). Epidemiological evidence
suggests that diets rich in fruit and vegetables decrease the risk of premature
mortality from major clinical conditions, including cancer and heart disease (Andlauer
et al. 1998, Block et al. 1992, Duthie GG 2003). However, it is not yet clear which
components or
CONFIDENTIAL
CRYSTAL INSTITUTE Ltd.
STUDY CODE: FL-BM-002-2003 P 38 of 70
combination of components in fruit and vegetables are protective and what is their
mechanism of action.
As some chemoprotective agents have also myeloprotective effects we thought that it
is worth to investigate whether the FLAVIN7® can protect bone marrow from
damage caused by an anticancer drug. Cacao liquid polyphenols inhibited DNA strand
cleavage induced by mitomycin C, an antitumour antibiotic in vitro (Yamagishi et al.
2001). Doxorubicin, an another antitumour antibiotic, is used much more frequently in
many different types of malignant diseases. If the polyphenolic fruit extract we
investigated could also decrease DNA damage, it might protect bone marrow from
damage caused by doxorubicin.
Bone marrow hemopoiesis of mice was damaged by a single 50 mg/kgbw doxorubicin
dose. Effect of the fruit extract, FLAVIN7® on the damage caused in the previously
described way was studied. The question was whether it could influence the measured
parameters of the hemopoietic damage. Mice were pretreated with the fruit extract for 7
consecutive days before doxorubicin treatment. The fruit extract was administered by
gavage per orally. The control mice were given vehicle instead of the fruit extract before
the same doxorubicin dose.
Neither cellularity of bone marrow nor white blood cell counts were influenced by the
fruit extract. This fruit extract, however, specifically protected granulocyte-macrophage
progenitor cells. CFU-GM colony numbers were significantly higher in the group which
was treated with 4 ml/kgbw of fruit extract before doxorubicin (P < 0.01). It involved
more intensive proliferation of the granulocyte-macrophage progenitor cells than in the
control group treated with doxorubicin alone. Due to the more intensive proliferation
replacing the damaged CFU-GM pool was not only faster but CFU-GM pool
expanded. CFU-GM content of femur was significantly greater in mice treated with the
fruit extract in 4 ml/kgbw dose than the values of the control group (P < 0.01). In the
peripheral blood samples absolute neutrophil counts did not significantly differ in the
pretreated mice from the control values, however, mean was higher than the control
CONFIDENTIAL
CRYSTAL INSTITUTE Ltd.
STUDY CODE: FL-BM-002-2003 P 39 of 70
value, namely it was 0,86 x10⁹/L in the pretreated group and 0,67 x10⁹/L in the group
treated with doxorubicin alone.
From these results we can conclude that FLAVIN7® protects bone marrow’s
granulocyte-macrophage progenitor cells.
This is of great importance, as during neutropenic period originated from the damage of
granulocyte-macrophage progenitor cells severe infections may develop with high
mortality. An increased risk of infectious complications occurs directly related to the
degree and duration of granulocytopenia (Pizzo 1993). Leading causes of mortality of
patients with malignant tumours are infections associated with neutropenia (Harrison
2001). It is a clinical experience that despite modern antibiotic and antifungal therapy
these serious infections will not improve until ANC values of patients are normalized
(Bodey et al. 1994; Grauer et al. 1994). For these patients bacterio- and fungistatic
agents are not good for therapy because macrophages are not able to facilitate their
effects (Downhour et al. 2002). High toxic doses of antiinfective drugs are required for
patients with bad condition. This increases toxicity and worsens life expectancies.
On the other hand, flavonoids have antiproliferative effects in some tumour and
leukemia cell lines (Ito et al. 1999). The previous observations encourage to develop
also synthetic flavonoids against malignant diseases. A synthetic flavonoid,
flavopiridol is a hopeful anticancer effect in chronic B-cell leukemia (König et al.
1997). Flavonoids may have a very good combinative effects in malignant diseases
as they may protect normal bone marrow progenitor cells from damages caused by
anticancer drugs together with an antiproliferative effects on the malignant tumour
cells (Faderl et Estrov 2003).
By supplying more progenitors for the more intensive granulopoiesis this fruit
extract could decrease the immuno- and myelosuppressive effects of cytostatic
drugs or other toxic molecules, which can decrease mortality.
CONFIDENTIAL
CRYSTAL INSTITUTE Ltd.
STUDY CODE: FL-BM-002-2003 P 40 of 70
7. SUGGESTIONS
On the basis of our results, the fruit extract, FLAVIN7®, seems to be a very promising
product. Antracycline cytostatic drugs including doxorubicin are widely used and a n
agent or combination of various compounds which can prevent the myelotoxicity and
possibly the cardiotoxicity of these cytostatic drugs has a great importance. To
determine the effective dose range, of course, repeated experiments using several
other doses of the fruit extract are necessary.
It would be desirable to study, whether FLAVIN7® can show similar advantageous
effects on bone marrow regeneration after damage caused also by other cytostatic
agents, e.g. carboplatin, cyclophosphamide or damage caused by irradiation.
8. REFERENCES
1. Andlauer W, Stehle P, Furst P: Chemoprevention, a novel approach in
dietetics. Curr Opin Clin Nutr Metab Care 1: 539-547, 1998. 2. Bodey GP, Anaissie EJ, Elting L S, Estey E, O'Brien S, Kantarjian H:
Antifungal prophylaxis during remission induction therapy for acute leukemia fluconazole versus intravenous amphotericin B. Cancer 73: 2009-2106, 1994.
3. Bond VP, Fliedner TM, Archambeau JO: Mammalian radiation lethality, a
disturbance in cellular kinetics. Academic Press, New York, 1965. 4. Block G, Patterson B, Subar A: Fruit, vegetables and cancer prevention: a
review of the epidemiological evidence. Nutr Cancer 18: 1-29, 1992.
5. Chen XG, Liu HY, Lei XH, Fu ZD, Li Y, Tao LH, Han R: Cancer chemopreventive and therapeutic activities of red ginseng. J Ethnopharmacology 60: 71-78, 1998.
6. Downhour NP, Petersen EA, Krueger TS, Tangella KV, Nix DE: Severe
cellulitis/myositis caused by Stenotrophomonas maltophilia. Ann Pharmacother. 2002 Jan;36(1):63-6.
CONFIDENTIAL
CRYSTAL INSTITUTE Ltd.
STUDY CODE: FL-BM-002-2003 P 41 of 70
7. Faderl S, Estrov Z: Commentary: Effects of flavonoids on normal and
leukemic cells. Leuk Res 27: 471-473, 2003.
8. Grauer ME, Bokemeyer C, Bautsch W, Freund M, Link H : Successful
treatment of a Trichosporon beigelii septicemia in a granulocytopenic patient with amphotericin B and granulocyte colony stimulating factor. Infection 22:283-286, 1994.
9. Harrison’s Principles of Internal Medicine eds. by E Braunwald, AS Fauci, DL Kasper, SL Hauser, DL Longo, JL Jameson, McGraw Hill New York, 2001.
10. Ito T, Warnken SP, May WS: Protein synthesis inhibition by flavonoids:
roles of eukaryotic initiation factor 2 alpha kinases. Biochem Biophys Res Commun, 265: 589-594, 1999.
11. König A, Schwartz GK, Mohammad RM, Al-Katib A, Gabrilov JL: The novel
cyclin-dependent kinase inhibitor flavopiridol downregulates Bcl-2 and induces growth arrest and apoptosis in chronic B-cell leukemia lines. Blood, 90: 4307-4312, 1997.
12. Lahiri-Chatterjee M, Katiyar SK, Mohan RR, Agarwal R: A flavonoid
antioxidant, sylimarin, affords exceptionally high protection against tumor promotion in the SENCAR mouse skin tumorigenesis model. Cancer Research, 59: 622-632, 1999.
13. Lohrmann HP, Schreml W: Cytotoxic drugs and the granulopoietic system.
Springer Verlag, Berlin 1982.
14. Pike BL, Robinson WA: Human bone marrow colony growth in agar-gel. J Cell Physiol, 76:77-84, 1970.
15. Pizzo PA: Management of fever in patients with cancer and treatment-
induced neutropenia. N Engl J Med, 328:1323-1332, 1993.
16. Surh Y: Molecular mechanisms of chemopreventive effects of selected dietary and medicinal phenolic substances. Mutat Res, 428, 305-327, 1999
17. Wintrobe’s Clinical Hematology eds by GR Lee, J Foerster, J Lukens, F
Paraskevas, JP Greer, GM Rodgers, Williams and Wilkins a Waverly Company, Baltimore, 1999.
18. Zheng S, Yang H, Zhang S, Wang X, Yu LL, Lu JQ, Li J: Initial study on
naturally occurring products from traditionalChinese herbs and vegetables for chemoprevention. J Cell Biochem, 27 suppl.: 106-112, 1997.
CONFIDENTIAL
CRYSTAL INSTITUTE Ltd.
STUDY CODE: FL-BM-002-2003 P 42 of 70
19. Yamagishi M, Osakabe N, Natsume M, Adachi T, Takizawa T, Kumon H, Osawa T: Anticlastogenic activity of cacao: inhibitory effect of cacao liquor polyphenols against mitomycin C-induced DNA damage. Food Chem Toxicol, 39: 1279-1283, 2001.
20. Young RC, Wilson CM: Cancer prevention: Past, present and future. Clin
Cancer Res 8: 11-16, 2002.
CONFIDENTIAL
CRYSTAL INSTITUTE Ltd.
STUDY CODE: FL-BM-002-2003 P 43 of 70
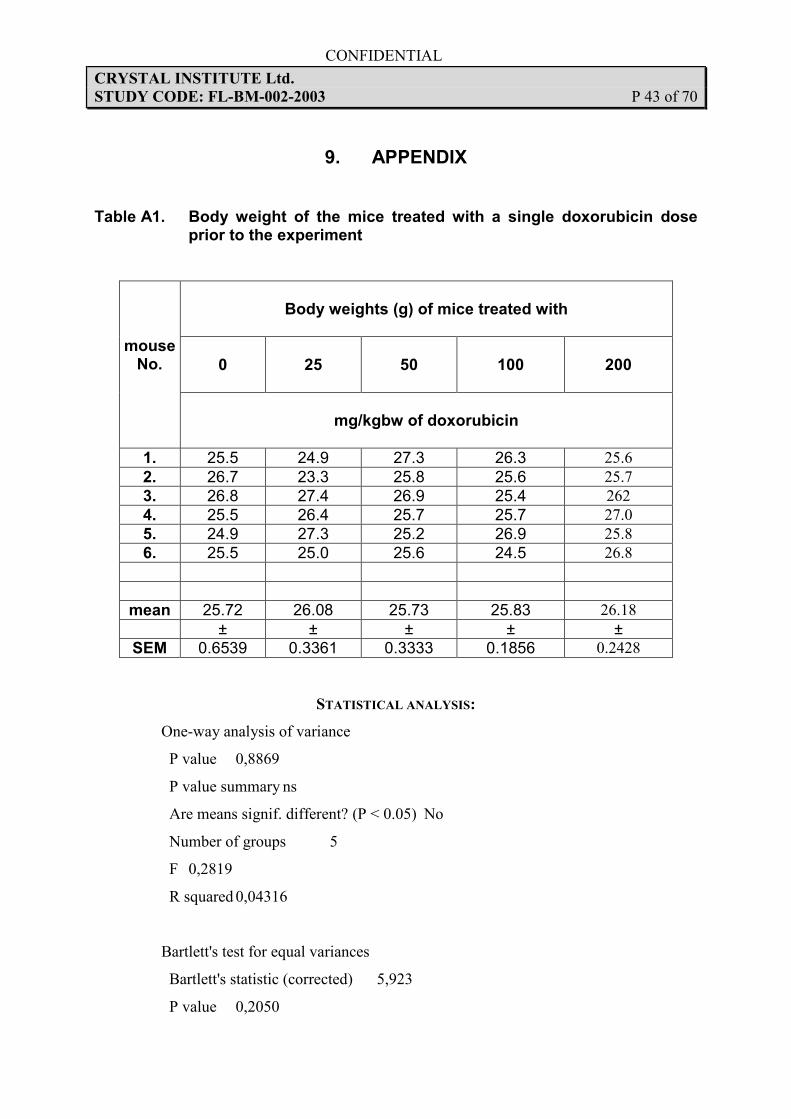
9. APPENDIX
Table A1. Body weight of the mice treated with a single doxorubicin dose prior to the experiment
Body weights (g) of mice treated with
0
25
50
100
200
mouse No.
mg/kgbw of doxorubicin
1. 25.5 24.9 27.3 26.3 25.6
2. 26.7 23.3 25.8 25.6 25.7
3. 26.8 27.4 26.9 25.4 262
4. 25.5 26.4 25.7 25.7 27.0
5. 24.9 27.3 25.2 26.9 25.8
6. 25.5 25.0 25.6 24.5 26.8
mean 25.72 26.08 25.73 25.83 26.18
± ± ± ± ±
SEM 0.6539 0.3361 0.3333 0.1856 0.2428
STATISTICAL ANALYSIS:
One-way analysis of variance
P value 0,8869
P value summary ns
Are means signif. different? (P < 0.05) No
Number of groups 5
F 0,2819
R squared 0,04316
Bartlett's test for equal variances
Bartlett's statistic (corrected) 5,923
P value 0,2050
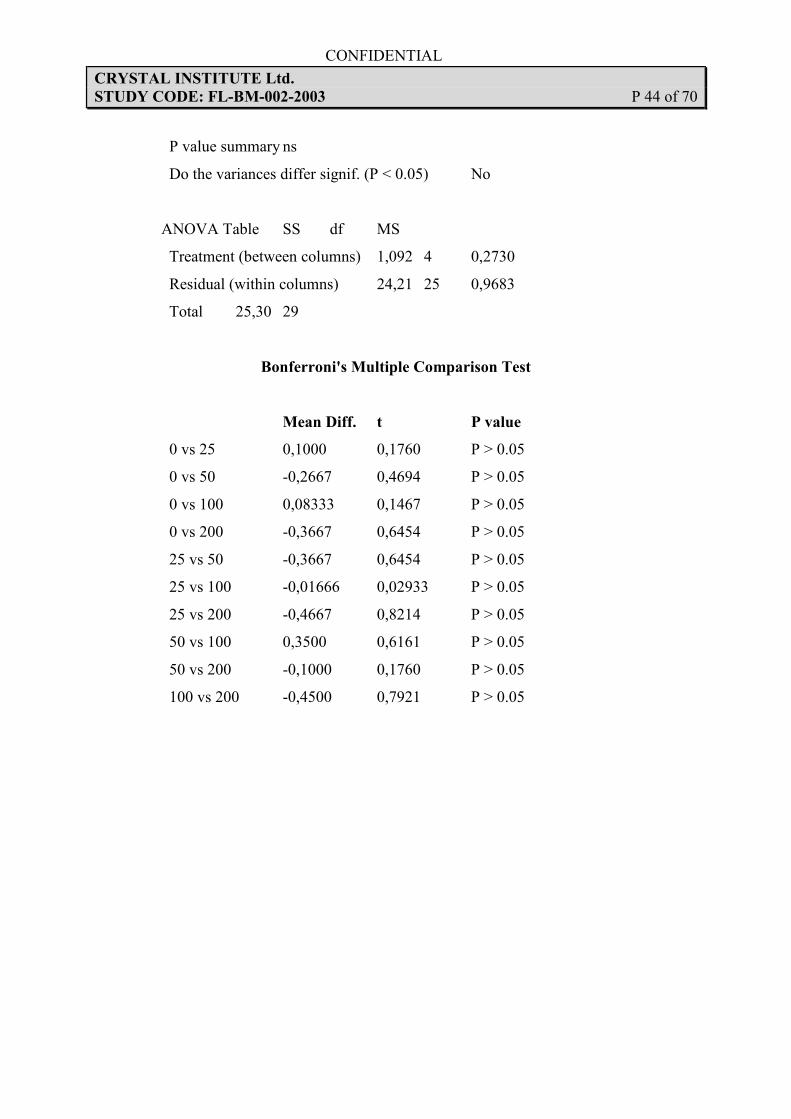
CONFIDENTIAL
CRYSTAL INSTITUTE Ltd.
STUDY CODE: FL-BM-002-2003 P 44 of 70
P value summary ns
Do the variances differ signif. (P < 0.05) No
ANOVA Table SS df MS
Treatment (between columns) 1,092 4 0,2730
Residual (within columns) 24,21 25 0,9683
Total 25,30 29
Bonferroni's Multiple Comparison Test
Mean Diff. t P value
0 vs 25 0,1000 0,1760 P > 0.05
0 vs 50 -0,2667 0,4694 P > 0.05
0 vs 100 0,08333 0,1467 P > 0.05
0 vs 200 -0,3667 0,6454 P > 0.05
25 vs 50 -0,3667 0,6454 P > 0.05
25 vs 100 -0,01666 0,02933 P > 0.05
25 vs 200 -0,4667 0,8214 P > 0.05
50 vs 100 0,3500 0,6161 P > 0.05
50 vs 200 -0,1000 0,1760 P > 0.05
100 vs 200 -0,4500 0,7921 P > 0.05
CONFIDENTIAL
CRYSTAL INSTITUTE Ltd.
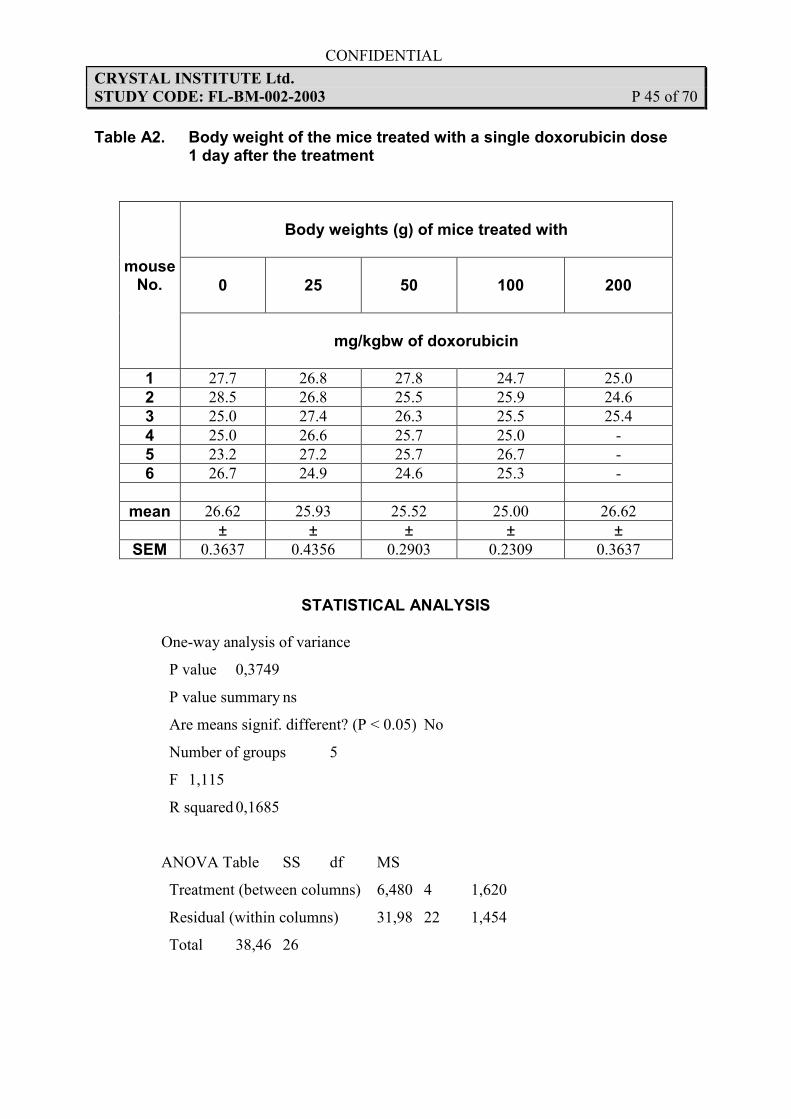
STUDY CODE: FL-BM-002-2003 P 45 of 70
Table A2. Body weight of the mice treated with a single doxorubicin dose 1 day after the treatment
Body weights (g) of mice treated with
0
25
50
100
200
mouse No.
mg/kgbw of doxorubicin
1 27.7 26.8 27.8 24.7 25.0
2 28.5 26.8 25.5 25.9 24.6
3 25.0 27.4 26.3 25.5 25.4
4 25.0 26.6 25.7 25.0 -
5 23.2 27.2 25.7 26.7 -
6 26.7 24.9 24.6 25.3 -
mean 26.62 25.93 25.52 25.00 26.62
± ± ± ± ±
SEM 0.3637 0.4356 0.2903 0.2309 0.3637
STATISTICAL ANALYSIS
One-way analysis of variance
P value 0,3749
P value summary ns
Are means signif. different? (P < 0.05) No
Number of groups 5
F 1,115
R squared 0,1685
ANOVA Table SS df MS
Treatment (between columns) 6,480 4 1,620
Residual (within columns) 31,98 22 1,454
Total 38,46 26
CONFIDENTIAL
CRYSTAL INSTITUTE Ltd.
STUDY CODE: FL-BM-002-2003 P 46 of 70
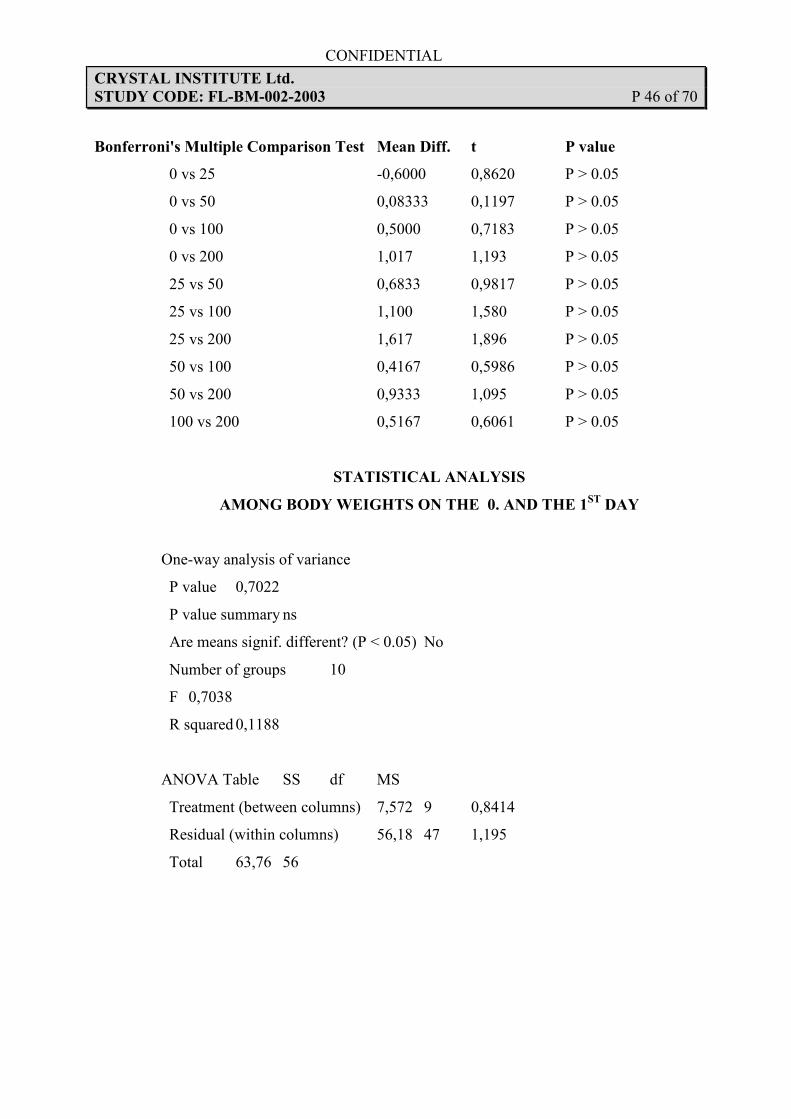
Bonferroni's Multiple Comparison Test Mean Diff. t P value
0 vs 25 -0,6000 0,8620 P > 0.05
0 vs 50 0,08333 0,1197 P > 0.05
0 vs 100 0,5000 0,7183 P > 0.05
0 vs 200 1,017 1,193 P > 0.05
25 vs 50 0,6833 0,9817 P > 0.05
25 vs 100 1,100 1,580 P > 0.05
25 vs 200 1,617 1,896 P > 0.05
50 vs 100 0,4167 0,5986 P > 0.05
50 vs 200 0,9333 1,095 P > 0.05
100 vs 200 0,5167 0,6061 P > 0.05
STATISTICAL ANALYSIS
AMONG BODY WEIGHTS ON THE 0. AND THE 1ST
DAY
One-way analysis of variance
P value 0,7022
P value summary ns
Are means signif. different? (P < 0.05) No
Number of groups 10
F 0,7038
R squared 0,1188
ANOVA Table SS df MS
Treatment (between columns) 7,572 9 0,8414
Residual (within columns) 56,18 47 1,195
Total 63,76 56
CONFIDENTIAL
CRYSTAL INSTITUTE Ltd.
STUDY CODE: FL-BM-002-2003 P 47 of 70
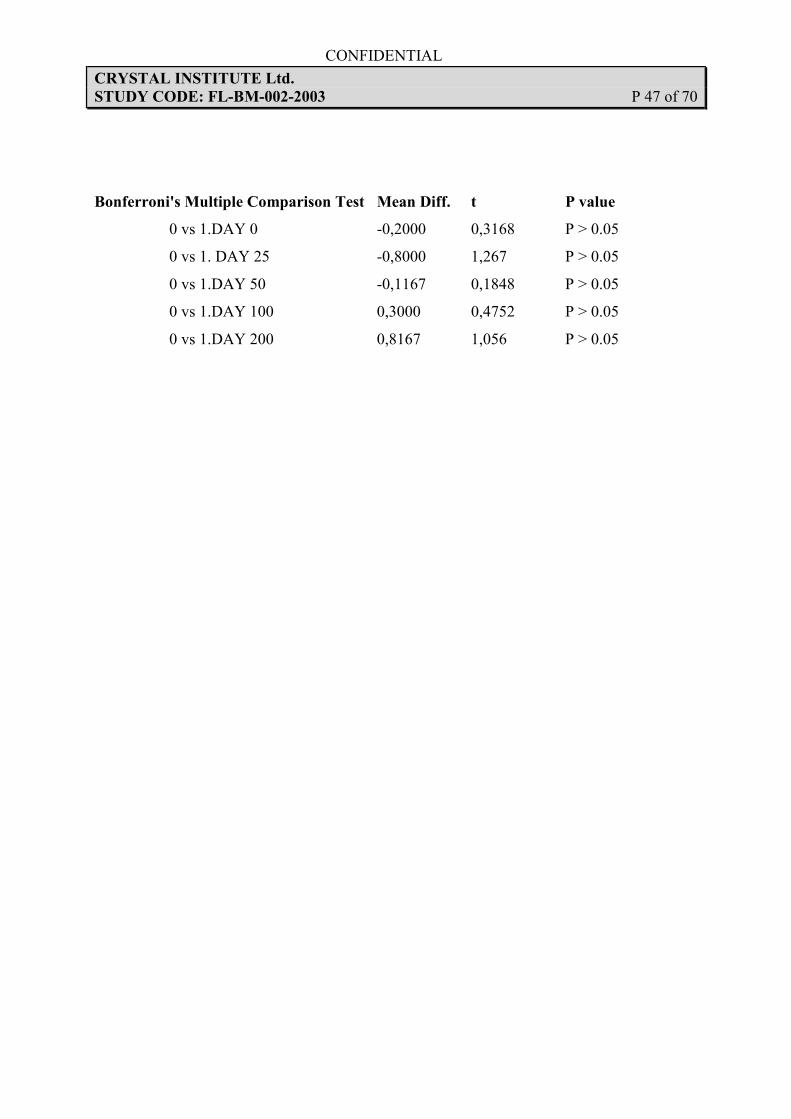
Bonferroni's Multiple Comparison Test Mean Diff. t P value
0 vs 1.DAY 0 -0,2000 0,3168 P > 0.05
0 vs 1. DAY 25 -0,8000 1,267 P > 0.05
0 vs 1.DAY 50 -0,1167 0,1848 P > 0.05
0 vs 1.DAY 100 0,3000 0,4752 P > 0.05
0 vs 1.DAY 200 0,8167 1,056 P > 0.05
CONFIDENTIAL
CRYSTAL INSTITUTE Ltd.
STUDY CODE: FL-BM-002-2003 P 48 of 70
Table A3. White blood cell (WBC) of the mice treated with a single doxorubicin dose 1 day after the treatment
WBC (x 109 / L) of mice treated with
0
25
50
100
200
mouse No.
mg/kgbw of doxorubicin
1. 3.8 5.9 7.0 7.6 2.5
2. 4.3 6.8 5.1 4.7 8.0
3. 9.8 4.5 4.6 5.3 3.5
4. 7.2 6.5 3.9 6.1 -
5. 5.2 3.9 6.7 6.8 -
6. 3.8 5.1 5.8 4.5 -
mean 5.683 5.450 5.517 5.833 4.667
± ± ± ± ±
SEM 0.9745 0.4674 0.4936 0.4991 1.691
STATISTICAL ANALYSIS
One-way analysis of variance
P value 0,9107
P value summary ns
Are means signif. different? (P < 0.05) No
Number of groups 5
F 0,2432
R squared 0,04235
ANOVA Table SS df MS
Treatment (between columns) 2,962 4 0,7406
Residual (within columns) 66,99 22 3,045
Total 69,95 26
CONFIDENTIAL
CRYSTAL INSTITUTE Ltd.
STUDY CODE: FL-BM-002-2003 P 49 of 70
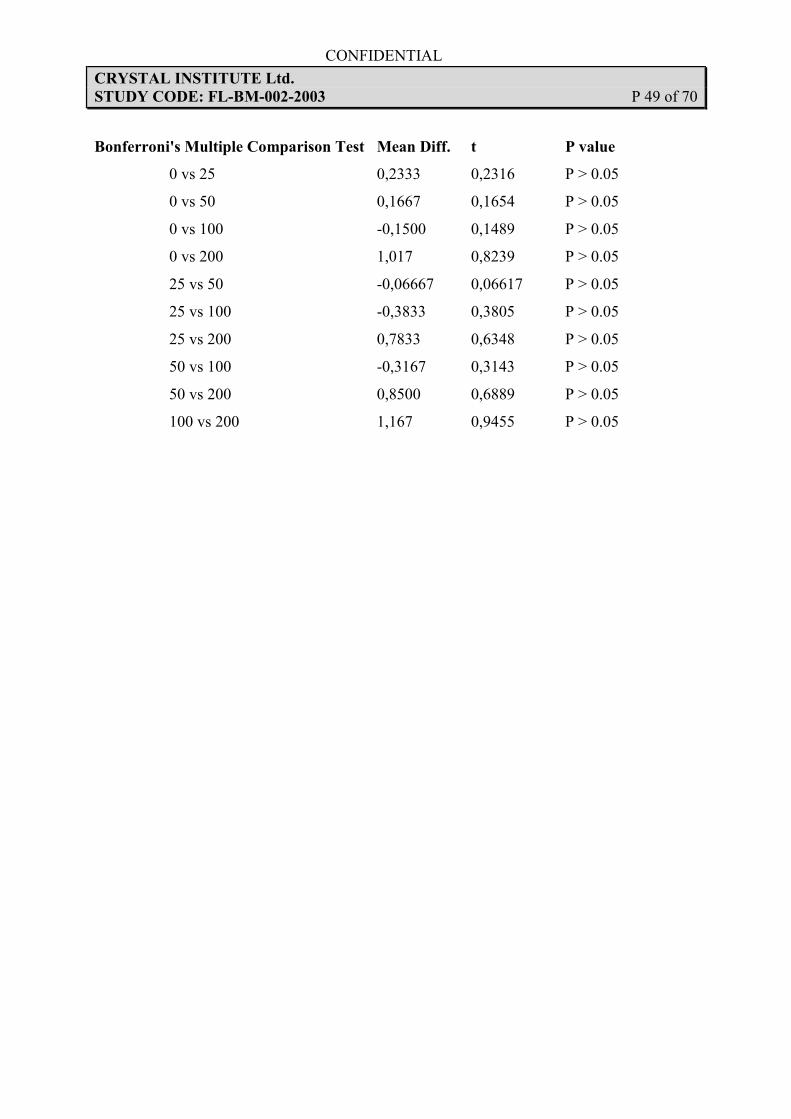
Bonferroni's Multiple Comparison Test Mean Diff. t P value
0 vs 25 0,2333 0,2316 P > 0.05
0 vs 50 0,1667 0,1654 P > 0.05
0 vs 100 -0,1500 0,1489 P > 0.05
0 vs 200 1,017 0,8239 P > 0.05
25 vs 50 -0,06667 0,06617 P > 0.05
25 vs 100 -0,3833 0,3805 P > 0.05
25 vs 200 0,7833 0,6348 P > 0.05
50 vs 100 -0,3167 0,3143 P > 0.05
50 vs 200 0,8500 0,6889 P > 0.05
100 vs 200 1,167 0,9455 P > 0.05
CONFIDENTIAL
CRYSTAL INSTITUTE Ltd.
STUDY CODE: FL-BM-002-2003 P 50 of 70
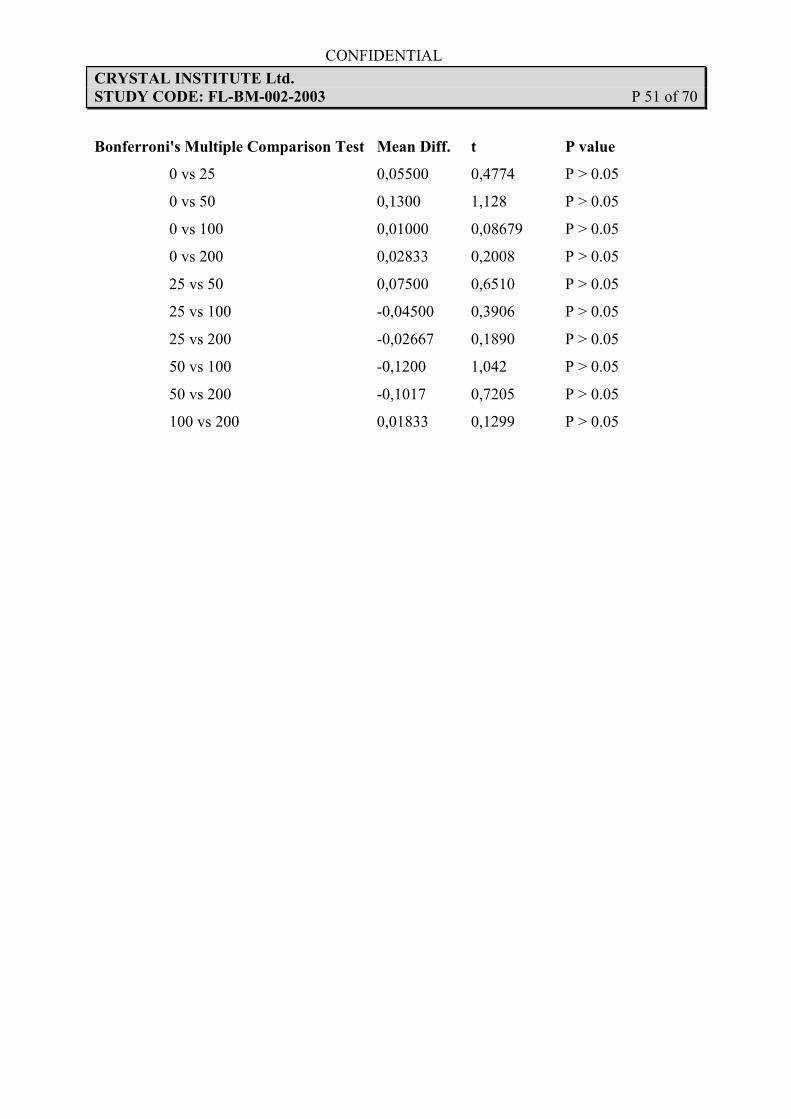
Table A4. Absolute neutrophil cell count (ANC) of the mice treated with a single doxorubicin dose 1 day after the treatment
ANC (x 109 / L) of mice treated with
0
25
50
100
200
mouse No.
mg/kgbw of doxorubicin
1. 0.41 0.35 0.49 0.97 0.51
2. 0.39 0.54 0.26 0.53 0.56
3. 0.88 0.41 0.23 0.42 0.39
4. 0.43 0.78 0.31 0.43 -
5. 0.36 0.27 0.27 0.27 -
6. 0.62 0.41 0.75 0.41 -
mean 5.683 5.450 5.517 5.833 4.667
± ± ± ± ±
SEM 0.9745 0.4674 0.4936 0.4991 1.691
STATISTICAL ANALYSIS
One-way analysis of variance
P value 0,8043
P value summary ns
Are means signif. different? (P < 0.05) No
Number of groups 5
F 0,4032
R squared 0,06830
ANOVA Table SS df MS
Treatment (between columns) 0,06422 4 0,01606
Residual (within columns) 0,8761 22 0,03982
Total 0,9403 26
CONFIDENTIAL
CRYSTAL INSTITUTE Ltd.
STUDY CODE: FL-BM-002-2003 P 51 of 70
Bonferroni's Multiple Comparison Test Mean Diff. t P value
0 vs 25 0,05500 0,4774 P > 0.05
0 vs 50 0,1300 1,128 P > 0.05
0 vs 100 0,01000 0,08679 P > 0.05
0 vs 200 0,02833 0,2008 P > 0.05
25 vs 50 0,07500 0,6510 P > 0.05
25 vs 100 -0,04500 0,3906 P > 0.05
25 vs 200 -0,02667 0,1890 P > 0.05
50 vs 100 -0,1200 1,042 P > 0.05
50 vs 200 -0,1017 0,7205 P > 0.05
100 vs 200 0,01833 0,1299 P > 0.05
CONFIDENTIAL
CRYSTAL INSTITUTE Ltd.
STUDY CODE: FL-BM-002-2003 P 52 of 70
Table A5. Cellularity of femoral bone marrow of the mice treated with a single doxorubicin dose 1 day after the treatment
Cellularity (x 105 / femur) of mice treated with
0
25
50
100
200
mouse No.
mg/kgbw of doxorubicin
1. 215.6 183.6 70.1 50.9 39.5
2. 137.7 196.2 82.6 45.8 43.2
3. 206.1 144.9 64.8 63.2 47.6
4. 121.6 175.5 57.9 44.0 -
5. 140.4 136.0 77.3 69.2 -
6. 136.0 168.0 74.3 49.5 -
mean 159.6 167.4 71.17 53.77 43.43
± ± ± ± ±
SEM 16.49 9.399 3.632 4.133 2.341
STATISTICAL ANALYSIS
One-way analysis of variance
P value P<0.0001
P value summary ***
Are means signif. different? (P < 0.05) Yes
Number of groups 5
F 35,21
R squared 0,8649
ANOVA Table SS df MS
Treatment (between columns) 75200 4 18800
Residual (within columns) 11740 22 533,8
Total 86940 26
CONFIDENTIAL
CRYSTAL INSTITUTE Ltd.
STUDY CODE: FL-BM-002-2003 P 53 of 70
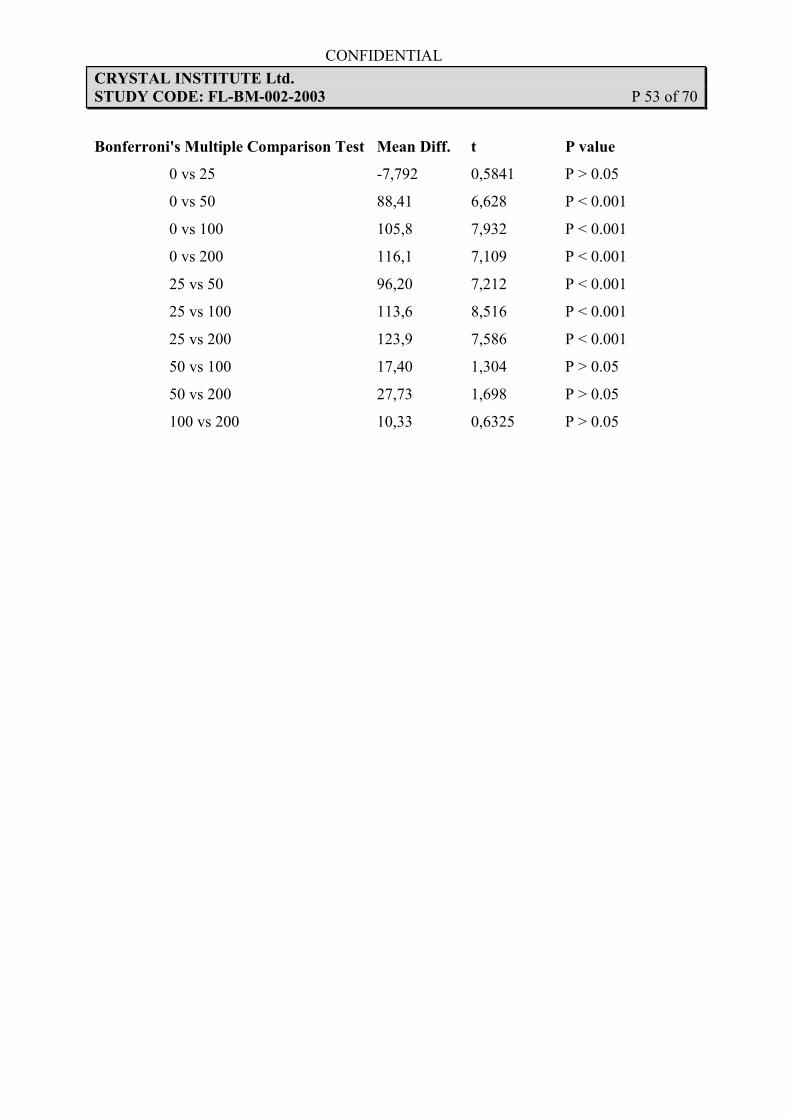
Bonferroni's Multiple Comparison Test Mean Diff. t P value
0 vs 25 -7,792 0,5841 P > 0.05
0 vs 50 88,41 6,628 P < 0.001
0 vs 100 105,8 7,932 P < 0.001
0 vs 200 116,1 7,109 P < 0.001
25 vs 50 96,20 7,212 P < 0.001
25 vs 100 113,6 8,516 P < 0.001
25 vs 200 123,9 7,586 P < 0.001
50 vs 100 17,40 1,304 P > 0.05
50 vs 200 27,73 1,698 P > 0.05
100 vs 200 10,33 0,6325 P > 0.05
CONFIDENTIAL
CRYSTAL INSTITUTE Ltd.
STUDY CODE: FL-BM-002-2003 P 54 of 70
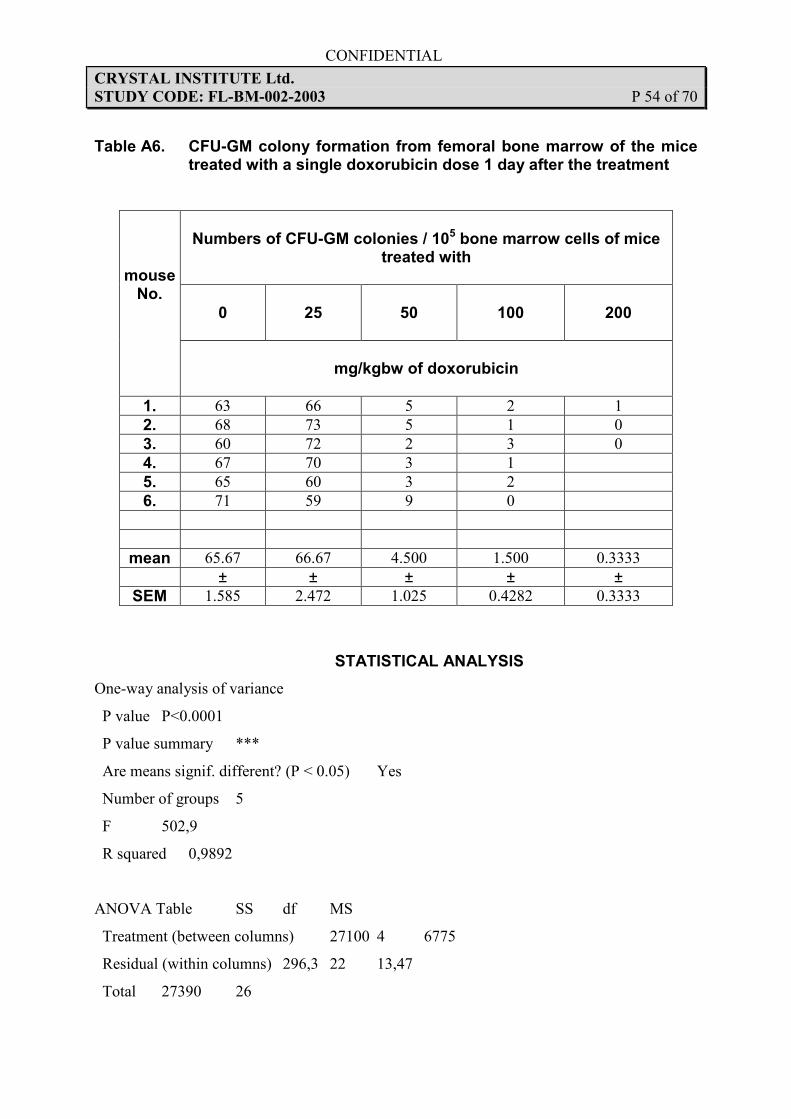
Table A6. CFU-GM colony formation from femoral bone marrow of the mice treated with a single doxorubicin dose 1 day after the treatment
Numbers of CFU-GM colonies / 105 bone marrow cells of mice
treated with
0
25
50
100
200
mouse No.
mg/kgbw of doxorubicin
1. 63 66 5 2 1
2. 68 73 5 1 0
3. 60 72 2 3 0
4. 67 70 3 1
5. 65 60 3 2
6. 71 59 9 0
mean 65.67 66.67 4.500 1.500 0.3333
± ± ± ± ±
SEM 1.585 2.472 1.025 0.4282 0.3333
STATISTICAL ANALYSIS
One-way analysis of variance
P value P<0.0001
P value summary ***
Are means signif. different? (P < 0.05) Yes
Number of groups 5
F 502,9
R squared 0,9892
ANOVA Table SS df MS
Treatment (between columns) 27100 4 6775
Residual (within columns) 296,3 22 13,47
Total 27390 26
CONFIDENTIAL
CRYSTAL INSTITUTE Ltd.
STUDY CODE: FL-BM-002-2003 P 55 of 70
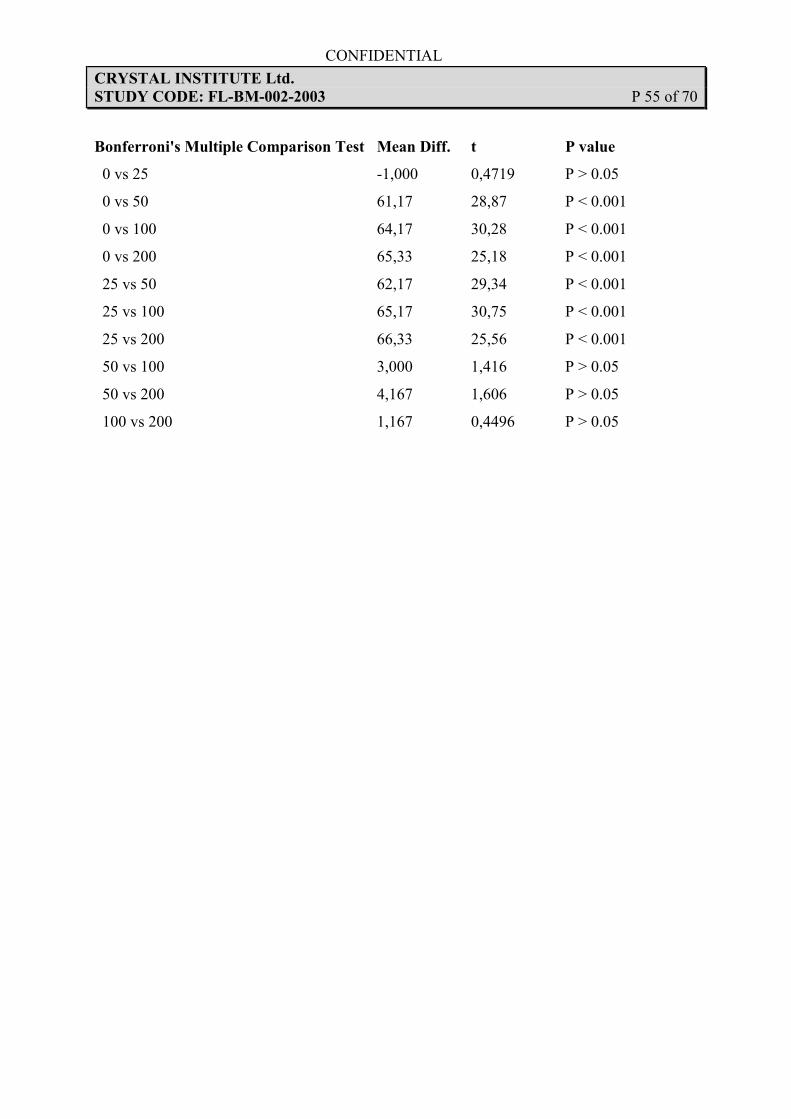
Bonferroni's Multiple Comparison Test Mean Diff. t P value
0 vs 25 -1,000 0,4719 P > 0.05
0 vs 50 61,17 28,87 P < 0.001
0 vs 100 64,17 30,28 P < 0.001
0 vs 200 65,33 25,18 P < 0.001
25 vs 50 62,17 29,34 P < 0.001
25 vs 100 65,17 30,75 P < 0.001
25 vs 200 66,33 25,56 P < 0.001
50 vs 100 3,000 1,416 P > 0.05
50 vs 200 4,167 1,606 P > 0.05
100 vs 200 1,167 0,4496 P > 0.05
CONFIDENTIAL
CRYSTAL INSTITUTE Ltd.
STUDY CODE: FL-BM-002-2003 P 56 of 70
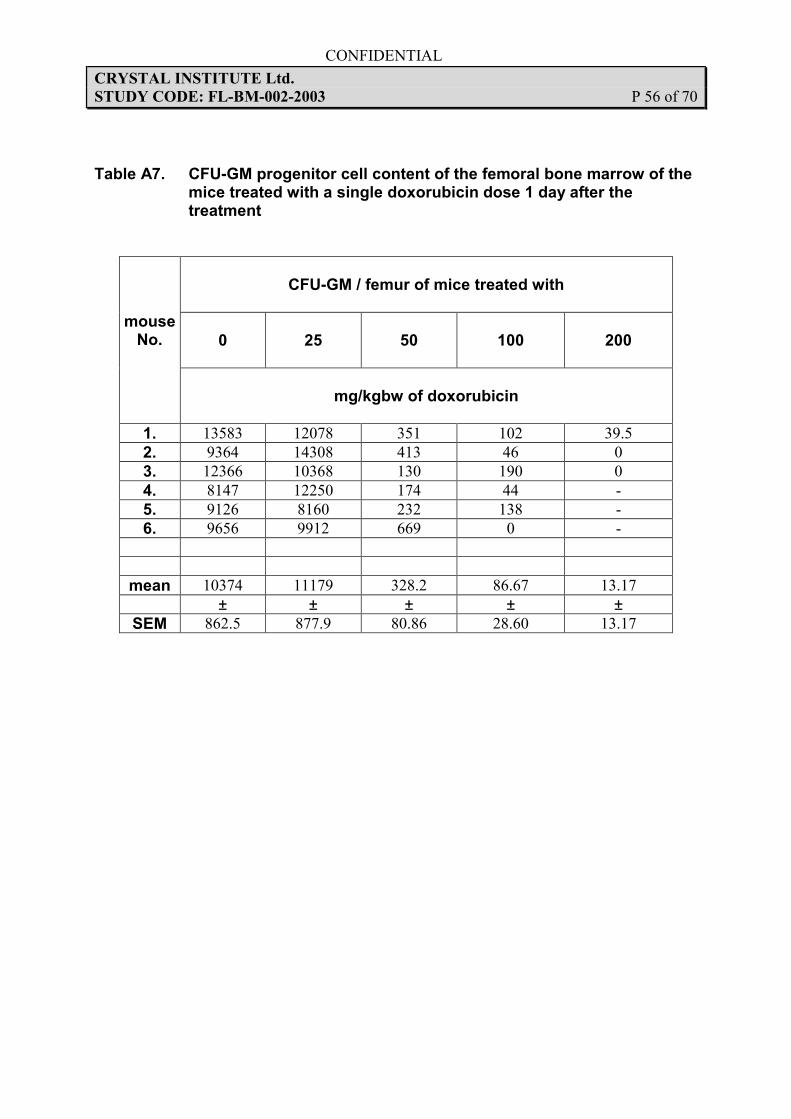
Table A7. CFU-GM progenitor cell content of the femoral bone marrow of the mice treated with a single doxorubicin dose 1 day after the treatment
CFU-GM / femur of mice treated with
0
25
50
100
200
mouse No.
mg/kgbw of doxorubicin
1. 13583 12078 351 102 39.5
2. 9364 14308 413 46 0
3. 12366 10368 130 190 0
4. 8147 12250 174 44 -
5. 9126 8160 232 138 -
6. 9656 9912 669 0 -
mean 10374 11179 328.2 86.67 13.17
± ± ± ± ±
SEM 862.5 877.9 80.86 28.60 13.17
CONFIDENTIAL
CRYSTAL INSTITUTE Ltd.
STUDY CODE: FL-BM-002-2003 P 57 of 70
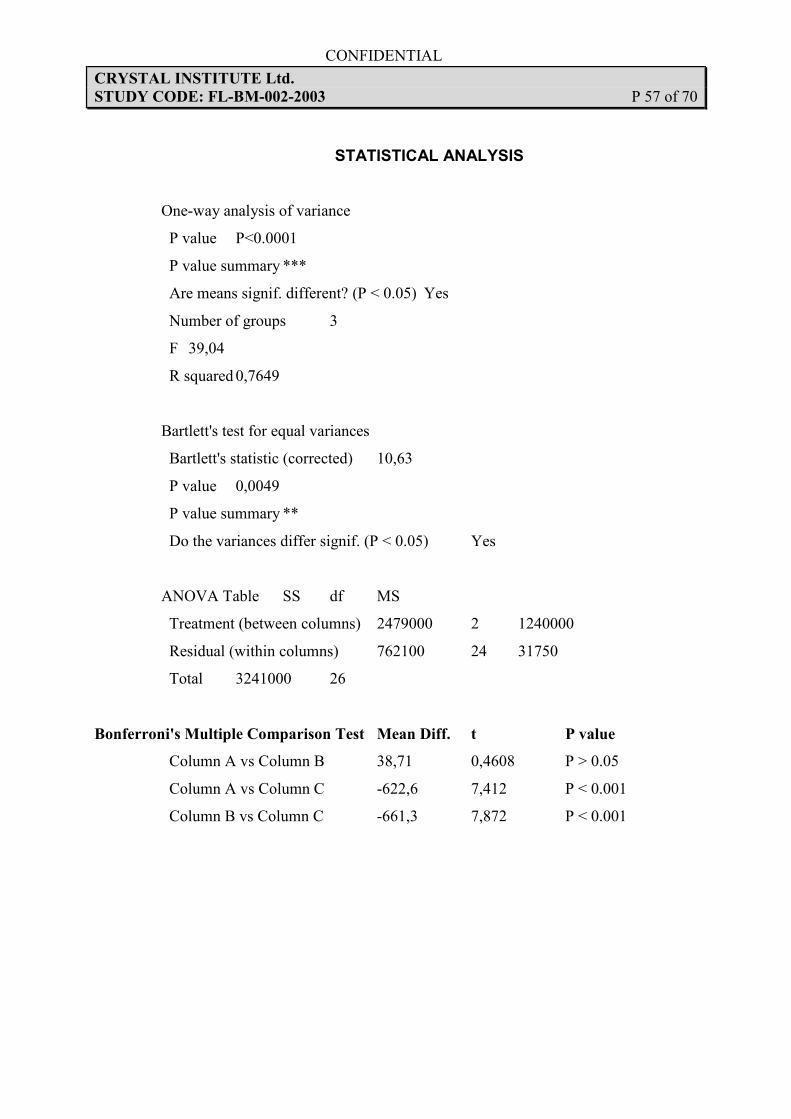
STATISTICAL ANALYSIS
One-way analysis of variance
P value P<0.0001
P value summary ***
Are means signif. different? (P < 0.05) Yes
Number of groups 3
F 39,04
R squared 0,7649
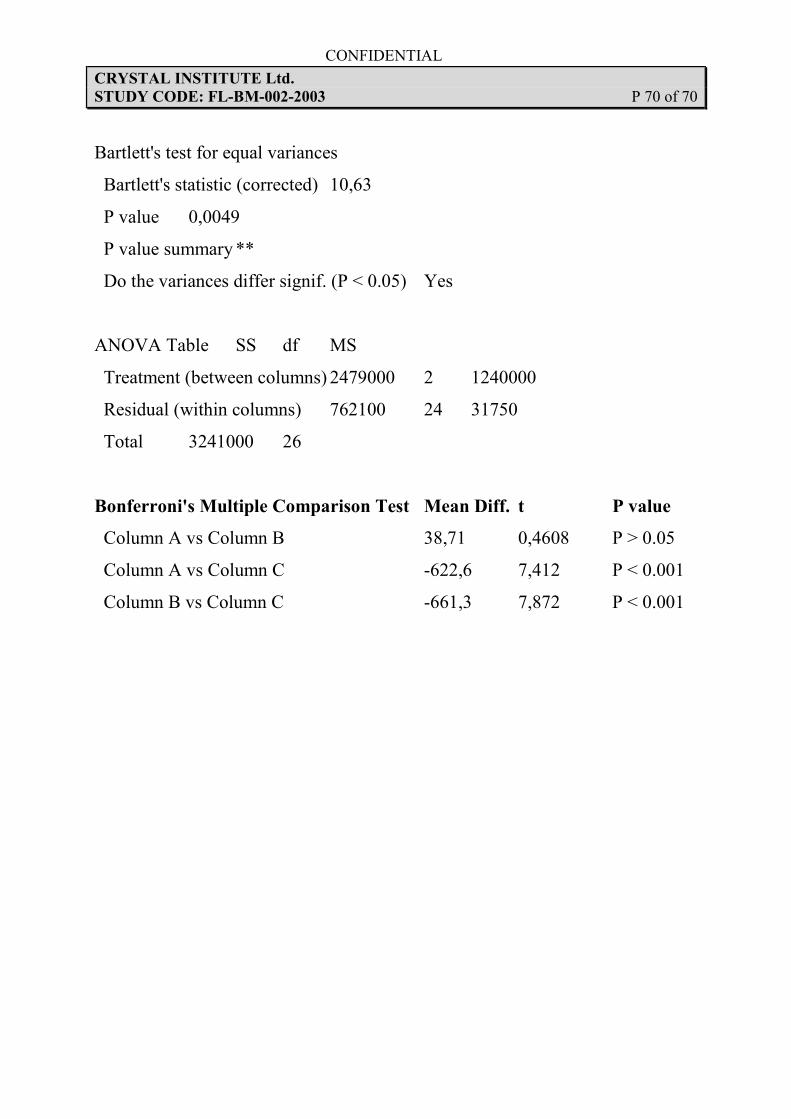
Bartlett's test for equal variances
Bartlett's statistic (corrected) 10,63
P value 0,0049
P value summary **
Do the variances differ signif. (P < 0.05) Yes
ANOVA Table SS df MS
Treatment (between columns) 2479000 2 1240000
Residual (within columns) 762100 24 31750
Total 3241000 26
Bonferroni's Multiple Comparison Test Mean Diff. t P value
Column A vs Column B 38,71 0,4608 P > 0.05
Column A vs Column C -622,6 7,412 P < 0.001
Column B vs Column C -661,3 7,872 P < 0.001
CONFIDENTIAL
CRYSTAL INSTITUTE Ltd.
STUDY CODE: FL-BM-002-2003 P 58 of 70
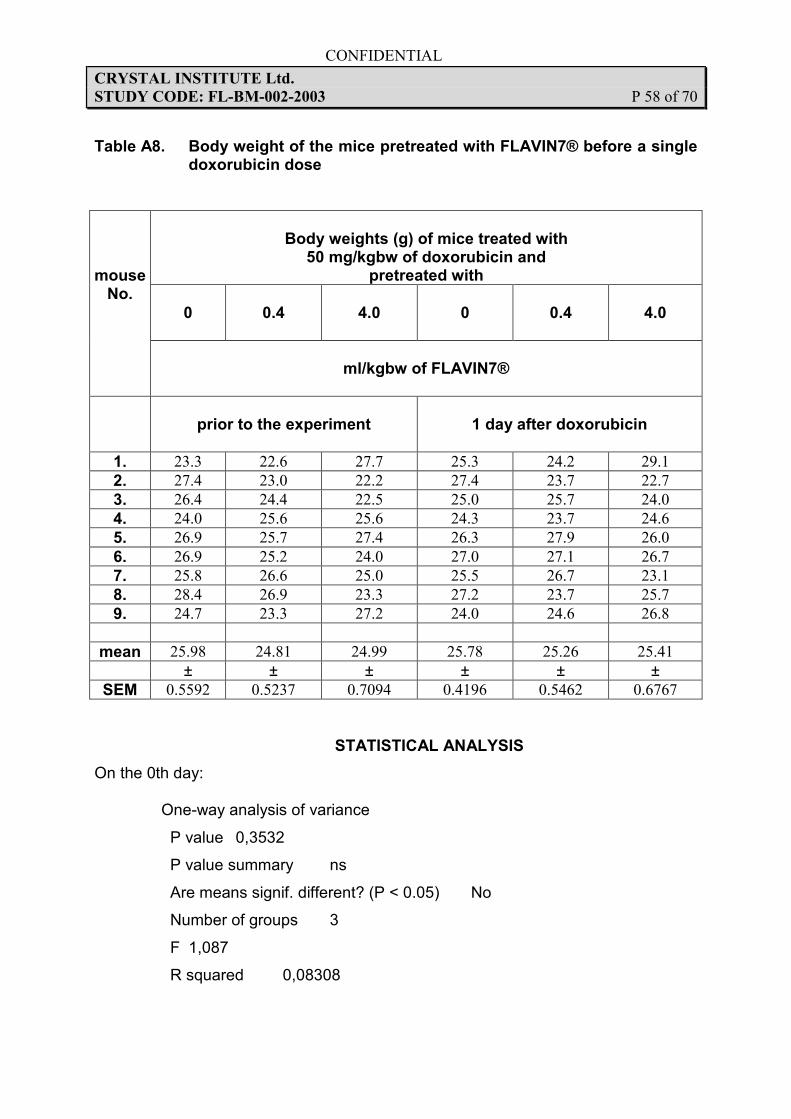
Table A8. Body weight of the mice pretreated with FLAVIN7® before a single doxorubicin dose
Body weights (g) of mice treated with 50 mg/kgbw of doxorubicin and
pretreated with
0
0.4
4.0
0
0.4
4.0
mouse No.
ml/kgbw of FLAVIN7®
prior to the experiment
1 day after doxorubicin
1. 23.3 22.6 27.7 25.3 24.2 29.1
2. 27.4 23.0 22.2 27.4 23.7 22.7
3. 26.4 24.4 22.5 25.0 25.7 24.0
4. 24.0 25.6 25.6 24.3 23.7 24.6
5. 26.9 25.7 27.4 26.3 27.9 26.0
6. 26.9 25.2 24.0 27.0 27.1 26.7
7. 25.8 26.6 25.0 25.5 26.7 23.1
8. 28.4 26.9 23.3 27.2 23.7 25.7
9. 24.7 23.3 27.2 24.0 24.6 26.8
mean 25.98 24.81 24.99 25.78 25.26 25.41
± ± ± ± ± ±
SEM 0.5592 0.5237 0.7094 0.4196 0.5462 0.6767
STATISTICAL ANALYSIS
On the 0th day:
One-way analysis of variance
P value 0,3532
P value summary ns
Are means signif. different? (P < 0.05) No
Number of groups 3
F 1,087
R squared 0,08308
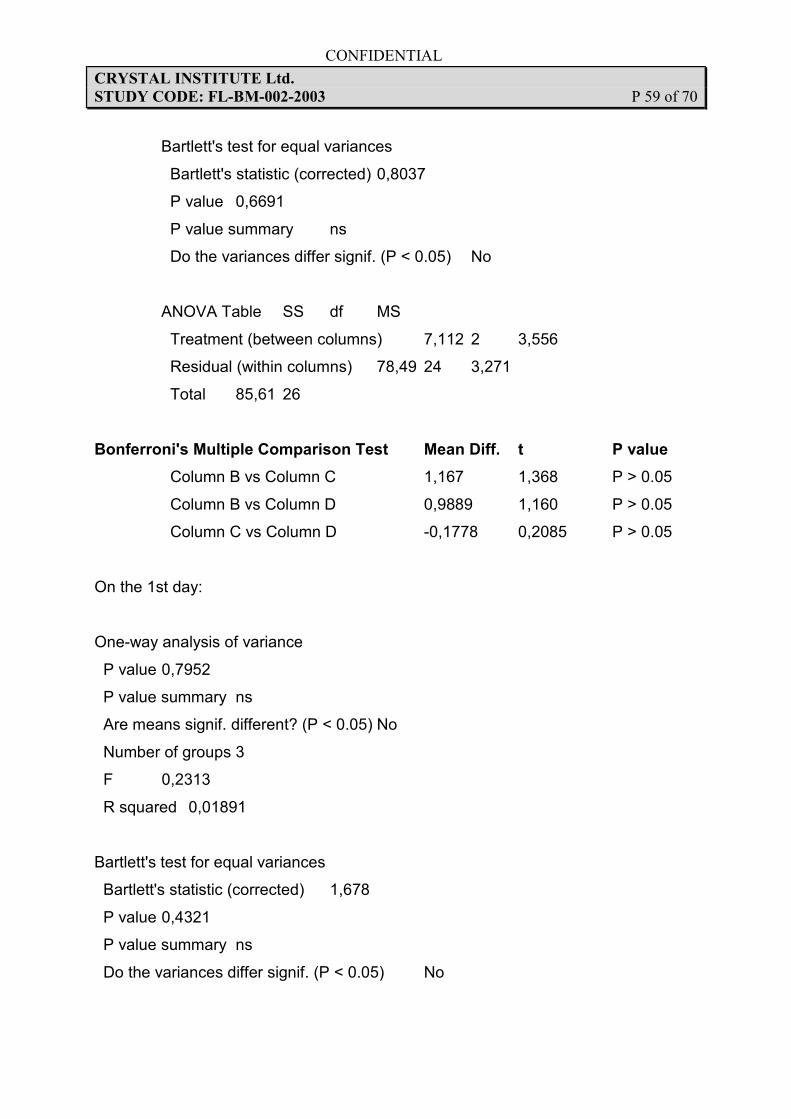
CONFIDENTIAL
CRYSTAL INSTITUTE Ltd.
STUDY CODE: FL-BM-002-2003 P 59 of 70
Bartlett's test for equal variances
Bartlett's statistic (corrected) 0,8037
P value 0,6691
P value summary ns
Do the variances differ signif. (P < 0.05) No
ANOVA Table SS df MS
Treatment (between columns) 7,112 2 3,556
Residual (within columns) 78,49 24 3,271
Total 85,61 26
Bonferroni's Multiple Comparison Test Mean Diff. t P value
Column B vs Column C 1,167 1,368 P > 0.05
Column B vs Column D 0,9889 1,160 P > 0.05
Column C vs Column D -0,1778 0,2085 P > 0.05
On the 1st day:
One-way analysis of variance
P value 0,7952
P value summary ns
Are means signif. different? (P < 0.05) No
Number of groups 3
F 0,2313
R squared 0,01891
Bartlett's test for equal variances
Bartlett's statistic (corrected) 1,678
P value 0,4321
P value summary ns
Do the variances differ signif. (P < 0.05) No
CONFIDENTIAL
CRYSTAL INSTITUTE Ltd.
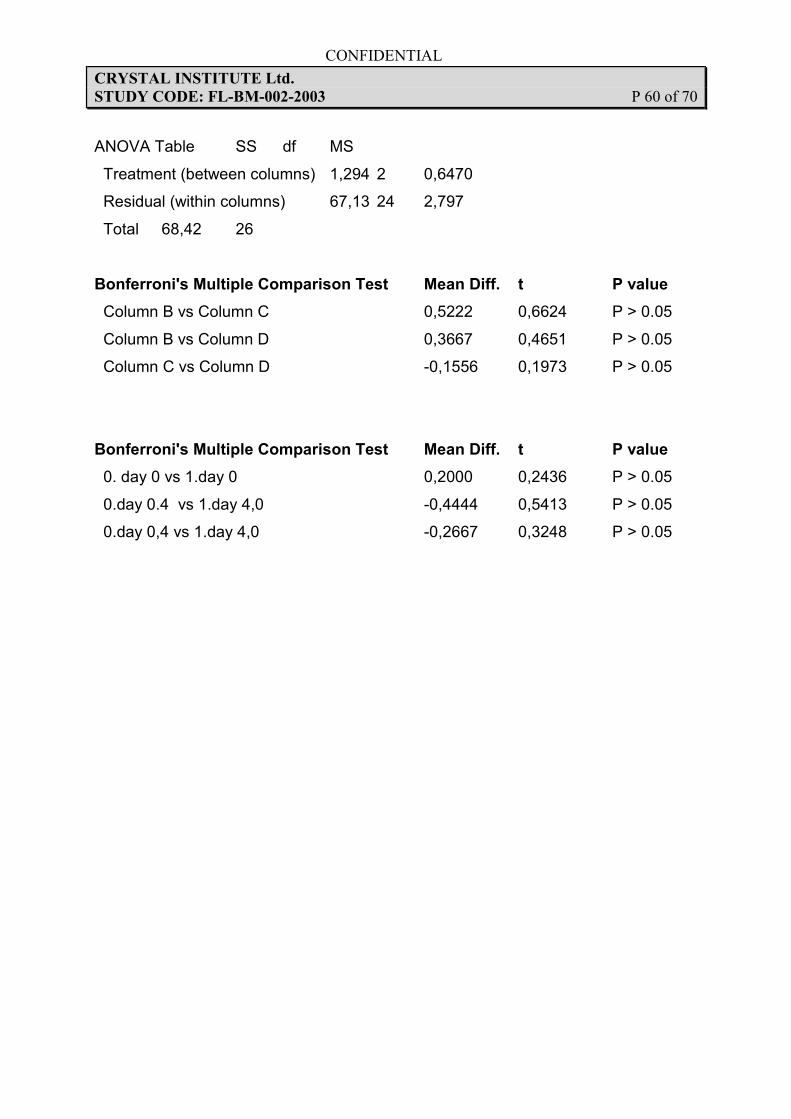
STUDY CODE: FL-BM-002-2003 P 60 of 70
ANOVA Table SS df MS
Treatment (between columns) 1,294 2 0,6470
Residual (within columns) 67,13 24 2,797
Total 68,42 26
Bonferroni's Multiple Comparison Test Mean Diff. t P value
Column B vs Column C 0,5222 0,6624 P > 0.05
Column B vs Column D 0,3667 0,4651 P > 0.05
Column C vs Column D -0,1556 0,1973 P > 0.05
Bonferroni's Multiple Comparison Test Mean Diff. t P value
0. day 0 vs 1.day 0 0,2000 0,2436 P > 0.05
0.day 0.4 vs 1.day 4,0 -0,4444 0,5413 P > 0.05
0.day 0,4 vs 1.day 4,0 -0,2667 0,3248 P > 0.05
CONFIDENTIAL
CRYSTAL INSTITUTE Ltd.
STUDY CODE: FL-BM-002-2003 P 61 of 70
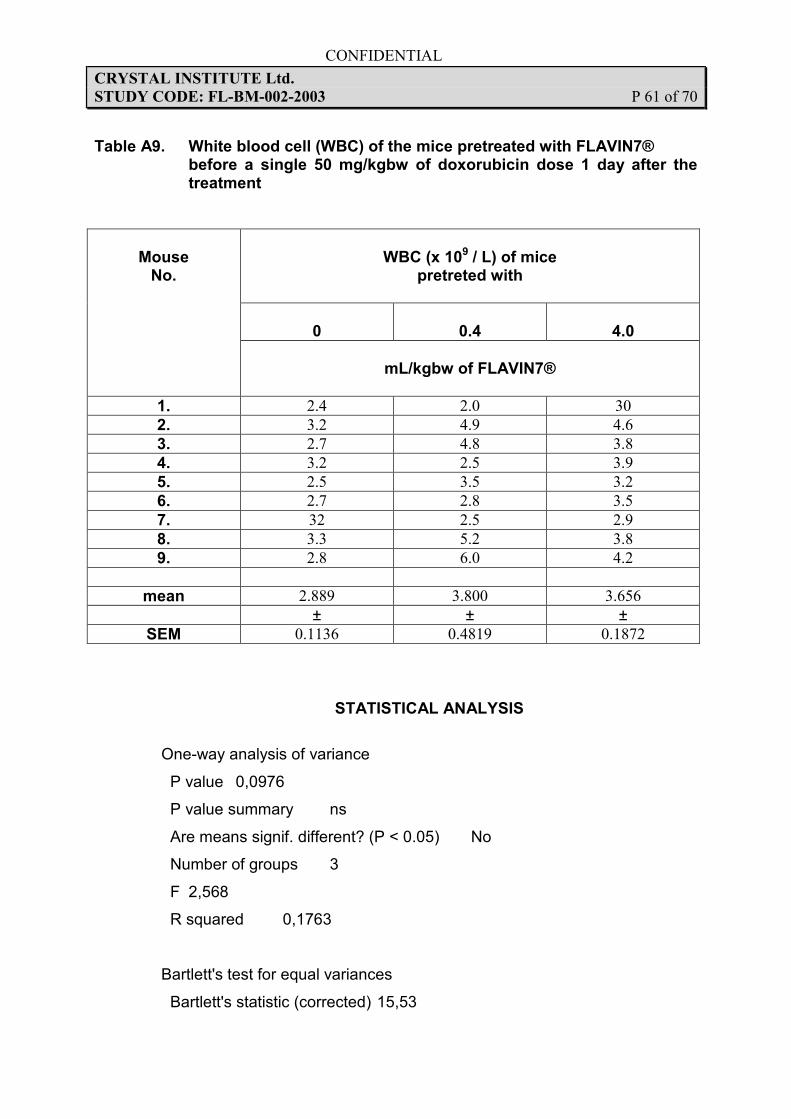
Table A9. White blood cell (WBC) of the mice pretreated with FLAVIN7® before a single 50 mg/kgbw of doxorubicin dose 1 day after the treatment
WBC (x 109 / L) of mice
pretreted with
0
0.4
4.0
Mouse No.
mL/kgbw of FLAVIN7®
1. 2.4 2.0 30
2. 3.2 4.9 4.6
3. 2.7 4.8 3.8
4. 3.2 2.5 3.9
5. 2.5 3.5 3.2
6. 2.7 2.8 3.5
7. 32 2.5 2.9
8. 3.3 5.2 3.8
9. 2.8 6.0 4.2
mean 2.889 3.800 3.656
± ± ±
SEM 0.1136 0.4819 0.1872
STATISTICAL ANALYSIS
One-way analysis of variance
P value 0,0976
P value summary ns
Are means signif. different? (P < 0.05) No
Number of groups 3
F 2,568
R squared 0,1763
Bartlett's test for equal variances
Bartlett's statistic (corrected) 15,53
CONFIDENTIAL
CRYSTAL INSTITUTE Ltd.
STUDY CODE: FL-BM-002-2003 P 62 of 70
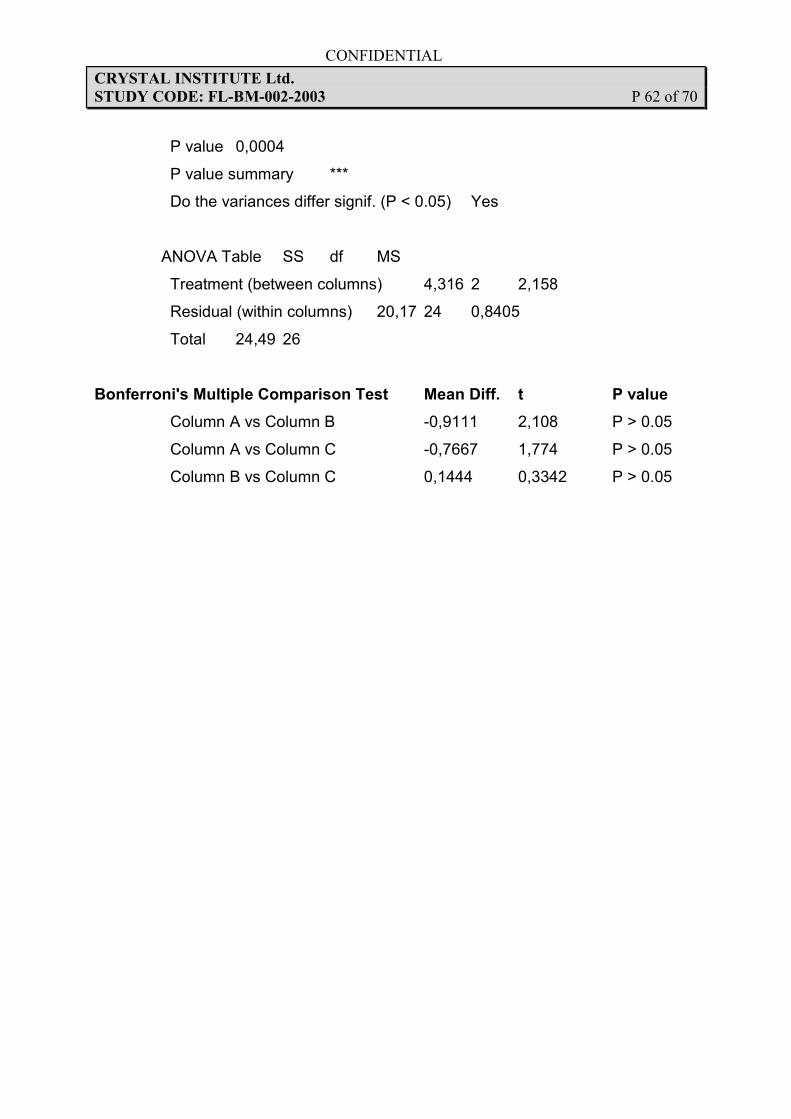
P value 0,0004
P value summary ***
Do the variances differ signif. (P < 0.05) Yes
ANOVA Table SS df MS
Treatment (between columns) 4,316 2 2,158
Residual (within columns) 20,17 24 0,8405
Total 24,49 26
Bonferroni's Multiple Comparison Test Mean Diff. t P value
Column A vs Column B -0,9111 2,108 P > 0.05
Column A vs Column C -0,7667 1,774 P > 0.05
Column B vs Column C 0,1444 0,3342 P > 0.05
CONFIDENTIAL
CRYSTAL INSTITUTE Ltd.
STUDY CODE: FL-BM-002-2003 P 63 of 70
Table A10. Absolute neutrophil count (ANC) of the mice pretreated with FLAVIN7® before a single 50 mg/kgbw of doxorubicin dose 1 day after the treatment
ANC (x 109 / L) of the mice
pretreted with
0
0.4
4.0
Mouse No.
mL/kgbw of FLAVIN7®
1. 0.430 0.180 0.48
2. 0.640 1.715 1.79
3. 1.107 0.380 0.38
4. 0.580 0.700 0.74
5. 0.550 0.420 0.99
6. 0.680 0.980 0.95
7. 0.540 1.300 0.67
8. 0.760 0.830 0.72
9. 0.530 0.900 1.01
mean 0.6463 0.8228 0.8589
± ± ±
SEM 0.06579 0.1599 0.1373
STATISTICAL ANALYSIS
One-way analysis of variance
P value 0,4627
P value summary ns
Are means signif. different? (P < 0.05) No
Number of groups 3
F 0,7961
R squared 0,06221
Bartlett's test for equal variances
Bartlett's statistic (corrected) 5,465
CONFIDENTIAL
CRYSTAL INSTITUTE Ltd.
STUDY CODE: FL-BM-002-2003 P 64 of 70
P value 0,0650
P value summary ns
Do the variances differ signif. (P < 0.05) No
ANOVA Table SS df MS
Treatment (between columns) 0,2328 2 0,1164
Residual (within columns) 3,510 24 0,1462
Total 3,743 26
Bonferroni's Multiple Comparison Test Mean Diff. t P value
Column A vs Column B -0,1764 0,9787 P > 0.05
Column A vs Column C -0,2126 1,179 P > 0.05
Column B vs Column C -0,03611 0,2003 P > 0.05
CONFIDENTIAL
CRYSTAL INSTITUTE Ltd.
STUDY CODE: FL-BM-002-2003 P 65 of 70
Table A11. Cellularity, total cell content of femoral bone marrow of the mice pretreated with FLAVIN7® before a single 50 mg/kgbw of doxorubicin dose 1 day after the treatment
Cellularity (x 105 / femur) of the mice
pretreted with
0
0.4
4.0
Mouse No.
mL/kgbw of FLAVIN7®
1. 2.4 2.0 30
2. 3.2 4.9 4.6
3. 2.7 4.8 3.8
4. 3.2 2.5 3.9
5. 2.5 3.5 3.2
6. 2.7 2.8 3.5
7. 32 2.5 2.9
8. 3.3 5.2 3.8
9. 2.8 6.0 4.2
mean 2.889 3.800 3.656
± ± ±
SEM 0.1136 0.4819 0.1872
STATISTICAL ANALYSIS
One-way analysis of variance
P value 0,2358
P value summary ns
Are means signif. different? (P < 0.05) No
Number of groups 3
F 1,535
R squared 0,1134
CONFIDENTIAL
CRYSTAL INSTITUTE Ltd.
STUDY CODE: FL-BM-002-2003 P 66 of 70
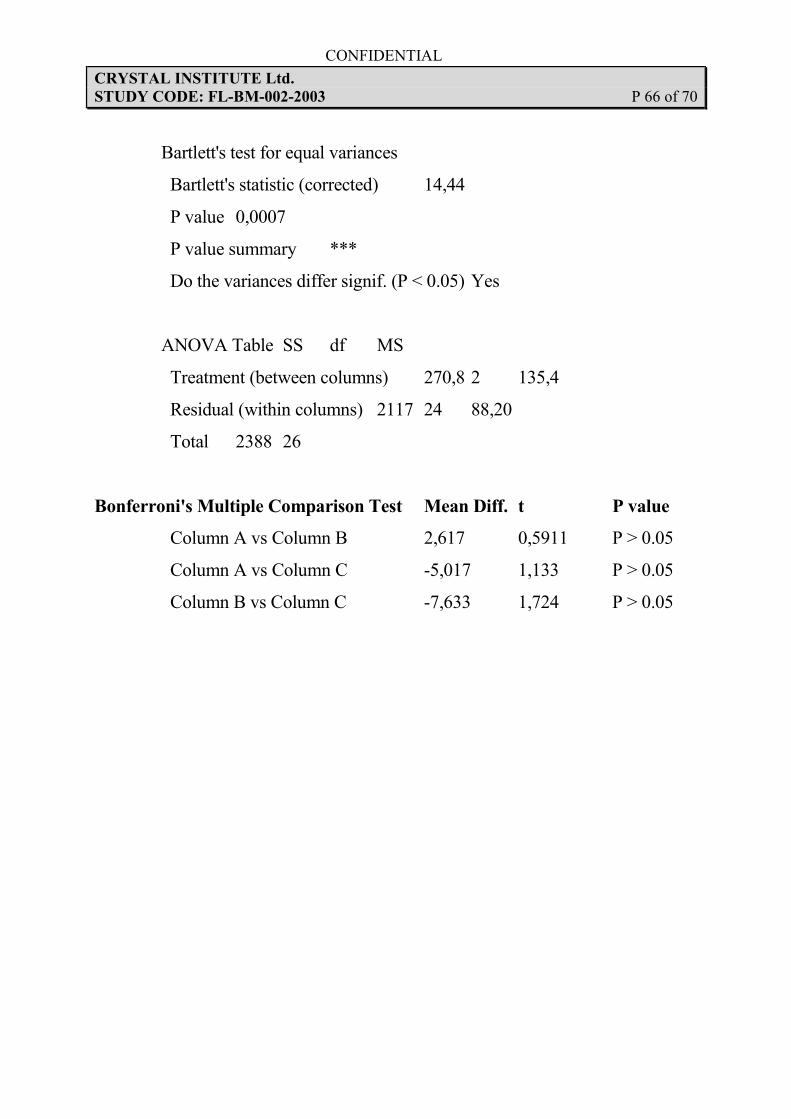
Bartlett's test for equal variances
Bartlett's statistic (corrected) 14,44
P value 0,0007
P value summary ***
Do the variances differ signif. (P < 0.05) Yes
ANOVA Table SS df MS
Treatment (between columns) 270,8 2 135,4
Residual (within columns) 2117 24 88,20
Total 2388 26
Bonferroni's Multiple Comparison Test Mean Diff. t P value
Column A vs Column B 2,617 0,5911 P > 0.05
Column A vs Column C -5,017 1,133 P > 0.05
Column B vs Column C -7,633 1,724 P > 0.05
CONFIDENTIAL
CRYSTAL INSTITUTE Ltd.
STUDY CODE: FL-BM-002-2003 P 67 of 70
Table A12. CFU-GM colony number of femoral bone marrow of the mice pretreated with FLAVIN7® before a single 50 mg/kgbw of doxorubicin dose 1 day after the treatment
CFU-GM colonies (x / 105 bone marrow cells) of the mice
pretreted with
0
0.4
4.0
Mouse No.
mL/kgbw of FLAVIN7®
1. 3 3 10
2. 4 5 9
3. 5 4 11
4. 2 4 13
5. 3 6 11
6. 8 4 20
7. 6 3 14
8. 5 4 13
9. 6 6 12
mean 4.667 4.333 12.56
± ± ±
SEM 0.6236 0.3727 1.069
STATISTICAL ANALYSIS
One-way analysis of variance
P value P<0.0001
P value summary ***
Are means signif. different? (P < 0.05) Yes
Number of groups 3
F 38,91
R squared 0,7643
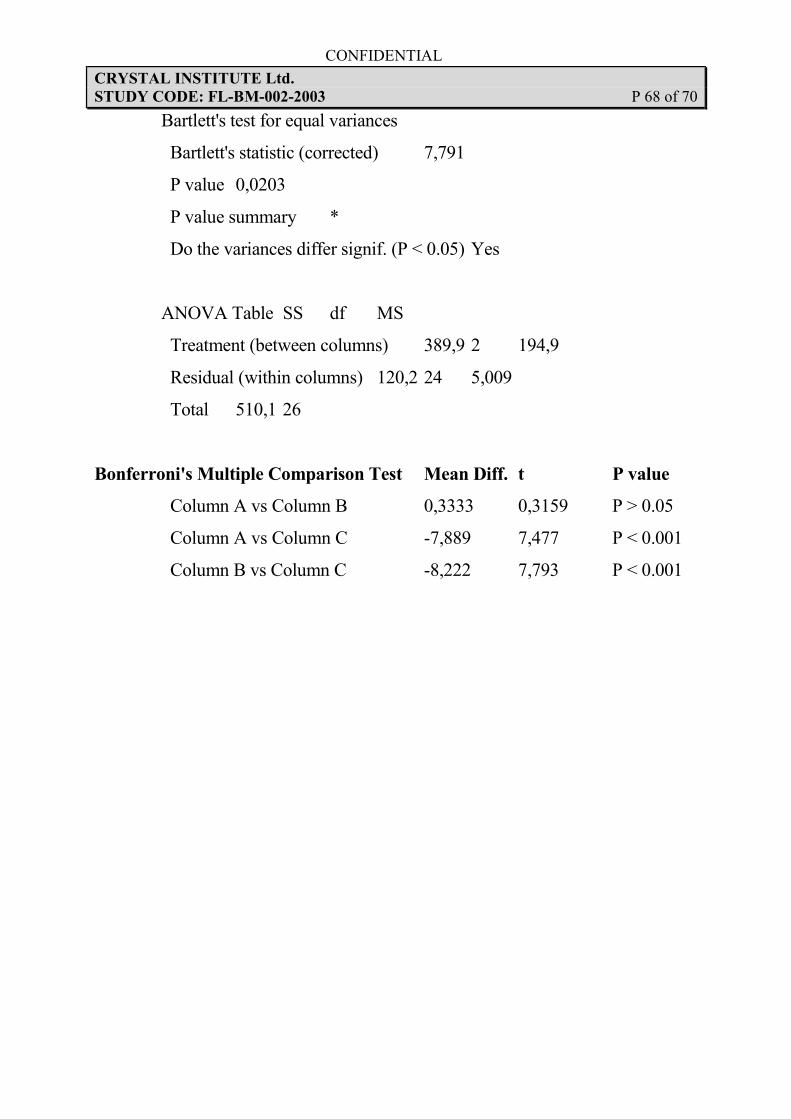
CONFIDENTIAL
CRYSTAL INSTITUTE Ltd.
STUDY CODE: FL-BM-002-2003 P 68 of 70
Bartlett's test for equal variances
Bartlett's statistic (corrected) 7,791
P value 0,0203
P value summary *
Do the variances differ signif. (P < 0.05) Yes
ANOVA Table SS df MS
Treatment (between columns) 389,9 2 194,9
Residual (within columns) 120,2 24 5,009
Total 510,1 26
Bonferroni's Multiple Comparison Test Mean Diff. t P value
Column A vs Column B 0,3333 0,3159 P > 0.05
Column A vs Column C -7,889 7,477 P < 0.001
Column B vs Column C -8,222 7,793 P < 0.001
CONFIDENTIAL
CRYSTAL INSTITUTE Ltd.
STUDY CODE: FL-BM-002-2003 P 69 of 70
Table A13. CFU-GM content of femoral bone marrow of the mice pretreated with FLAVIN7® before a single 50 mg/kgbw of doxorubicin dose 1 day after the treatment
CFU-GM / femur of the mice
pretreted with
0
0.4
4.0
Mouse No.
mL/kgbw of FLAVIN7®
1. 186.3 197.10 752.00
2. 280.8 312.00 726.75
3. 378.0 224.20 792.00
4. 168.3 300.20 983.45
5. 204.0 442.80 792.00
6. 600.4 342.00 1581.00
7. 405.0 270.75 1071.00
8. 324.0 204.00 994.50
9. 397.0 302.40 854.40
mean 327.1 288.4 949.7
± ± ±
SEM 45.73 25.68 88.51
STATISTICAL ANALYSIS
One-way analysis of variance
P value P<0.0001
P value summary ***
Are means signif. different? (P < 0.05) Yes
Number of groups 3
F 39,04
R squared 0,7649
CONFIDENTIAL
CRYSTAL INSTITUTE Ltd.
STUDY CODE: FL-BM-002-2003 P 70 of 70
Bartlett's test for equal variances
Bartlett's statistic (corrected) 10,63
P value 0,0049
P value summary **
Do the variances differ signif. (P < 0.05) Yes
ANOVA Table SS df MS
Treatment (between columns) 2479000 2 1240000
Residual (within columns) 762100 24 31750
Total 3241000 26
Bonferroni's Multiple Comparison Test Mean Diff. t P value
Column A vs Column B 38,71 0,4608 P > 0.05
Column A vs Column C -622,6 7,412 P < 0.001
Column B vs Column C -661,3 7,872 P < 0.001