Embed Size (px)
Citation preview

This is an Open Access document downloaded from ORCA, Cardiff University's institutional
repository: http://orca.cf.ac.uk/102239/
This is the author’s version of a work that was submitted to / accepted for publication.
Citation for final published version:
Cook, Laura, Munier, C. Mee Ling, Seddiki, Nabila, van Bockel, David, Ontiveros, Noé, Hardy,
Melinda Y., Gillies, Jana K., Levings, Megan K., Reid, Hugh H., Petersen, Jan, Rossjohn, Jamie,
Anderson, Robert P., Zaunders, John J., Tye-Din, Jason A. and Kelleher, Anthony D. 2017.
Circulating gluten-specific FOXP3 + CD39 + regulatory T cells have impaired suppressive function
in patients with celiac disease. Journal of Allergy and Clinical Immunology 140 (6) , pp. 1592-1603.
10.1016/j.jaci.2017.02.015 file
Publishers page: http://dx.doi.org/10.1016/j.jaci.2017.02.015
<http://dx.doi.org/10.1016/j.jaci.2017.02.015>
Please note:
Changes made as a result of publishing processes such as copy-editing, formatting and page
numbers may not be reflected in this version. For the definitive version of this publication, please
refer to the published source. You are advised to consult the publisher’s version if you wish to cite
this paper.
This version is being made available in accordance with publisher policies. See
http://orca.cf.ac.uk/policies.html for usage policies. Copyright and moral rights for publications
made available in ORCA are retained by the copyright holders.

Circulating gluten-specific forkhead box protein
3–positive CD391 regulatory T cells have impaired
suppressive function in patients with celiac disease
Q12 Laura Cook, PhD,a,b* C. Mee Ling Munier, PhD,a Nabila Seddiki, PhD,a,b� David van Bockel, PhD,a
No�e Ontiveros, MSc,c,d Melinda Y. Hardy, PhD,c,d Jana K. Gillies, MSc,e Megan K. Levings, PhD,e
Hugh Reid, PhD,f Jan Peterson, PhD,f Jamie Rossjohn, PhD,f,g,h Robert P. Anderson, PhD,c,d,i
John Zaunders, PhD,a,b Jason A. Tye-Din, PhD,c,d,j and Anthony D. Kelleher, PhDa,b Sydney, Parkville, Clayton, and
Brisbane, Australia; Vancouver, British Columbia, Canada; Cardiff, United Kingdom; and Cambridge, Mass
Background: Celiac disease is a chronic immune-mediated
inflammatory disorder of the gut triggered by dietary gluten.
Although the effector T-cell response in patients with celiac
disease has been well characterized, the role of regulatory
T (Treg) cells in the loss of tolerance to gluten remains poorly
understood.
Objective: We sought to define whether patients with celiac
disease have a dysfunction or lack of gluten-specific forkhead
box protein 3 (FOXP3)1 Treg cells.
Methods: Treated patients with celiac disease underwent oral
wheat challenge to stimulate recirculation of gluten-specific T
cells. Peripheral blood was collected before and after challenge.
To comprehensively measure the gluten-specific CD41 T-cell
response, we paired traditional IFN-g ELISpot with an assay to
detect antigen-specific CD41 T cells that does not rely on
tetramers, antigen-stimulated cytokine production, or
proliferation but rather on antigen-induced coexpression of
CD25 and OX40 (CD134).
Results: Numbers of circulating gluten-specific Treg cells and
effector T cells both increased significantly after oral wheat
challenge, peaking at day 6. Surprisingly, we found that
approximately 80% of the ex vivo circulating gluten-specific
CD41 T cells were FOXP31CD391 Treg cells, which reside
within the pool of memory CD41CD251CD127lowCD45RO1
Treg cells. Although we observed normal suppressive function
in peripheral polyclonal Treg cells from patients with celiac
disease, after a short in vitro expansion, the gluten-specific
FOXP31CD391 Treg cells exhibited significantly reduced
suppressive function compared with polyclonal Treg cells.
Conclusion: This study provides the first estimation of
FOXP31CD391 Treg cell frequency within circulating gluten-
specific CD41 T cells after oral gluten challenge of patients with
celiac disease. FOXP31CD391 Treg cells comprised a major
proportion of all circulating gluten-specific CD41 T cells but
had impaired suppressive function, indicating that Treg cell
dysfunction might be a key contributor to disease pathogenesis.
(J Allergy Clin Immunol 2017;nnn:nnn-nnn.)
Key words: Regulatory T cells, CD39, forkhead box protein 3, celiac
disease, gluten, OX40
Celiac disease is a chronic inflammatory disorder with featuresof autoimmune disease that results from a loss of glutentolerance.1 It is characterized by villous atrophy and the presenceof autoantibodies to tissue transglutaminase 2 (tTG), an enzyme
From athe Immunovirology and Pathogenesis Program, Kirby Institute, UNSWAustralia,
Sydney; bSt Vincent’s Centre for Applied Medical Research, St Vincent’s Hospital,
Sydney; cthe Immunology Division, Walter and Eliza Hall Institute, Parkville; dthe
Department of Medical Biology, University of Melbourne, Parkville; ethe Department
of Surgery, University of British Columbia, Vancouver; fthe Infection and Immunity
Program and Department of Biochemistry and Molecular Biology, Biomedicine Dis-
covery Institute, Monash University, Clayton; gthe ARC Centre of Excellence in
Advanced Molecular Imaging, University of Queensland, Brisbane; hthe Institute of
Infection and Immunity, Cardiff University School of Medicine, Heath Park, Cardiff;iImmusanT, Cambridge; and jthe Department of Gastroenterology, Royal Melbourne
Hospital, Parkville.
*Laura Cook, PhD, is currently affiliated with the Department of Medicine, University of
British Columbia, Vancouver, British Columbia, Canada.
�C. Mee Ling Munier, PhD, is currently affiliated with INSERM U955 and Universit�e
Paris-Est Cr�eteil (UPEC)/Vaccine Research Institute, Cr�eteil, France.
Supported by the Australian Government Department of Health and Ageing; the
NHMRC through a program (510448) grant, NHMRC project grant (1085875), an
NHMRC Australia Fellowship (to J.R.), and a Practitioner Fellowship (to A.D.K.); a
Coeliac Research Fund Grant (to N.S., R.P.A., J.T.-D., and A.D.K.); an Australian
Postgraduate Award; and a UNSW Research Excellence Scholarship (to L.C.).
Disclosure of potential conflict of interest: L. Cook has received a grant from the
Australian Postgraduate Award and the University of New South Wales Research
Excellence Award. N. Seddiki has received a grant from the Coeliac Research Fund
and is named inventor on a patent for the use of CD39 and the OX40 assay to identify
antigen-specific regulatory T cells held by St Vincent’s Hospital, Sydney, Australia. J.
Rossjohn has received payment from the National Health and Medical Research
Council Australia Fellowship. R. P. Anderson has received a grant from the Coeliac
Research Fund; is Chief Scientific Officer of ImmusanT; is a coinventor of patents
pertaining to the use of gluten peptides in therapeutics, diagnostics, and nontoxic
gluten; and is a shareholder of Nexpep and ImmusanT. J. Zaunders is named inventor
on a patent for the use of CD39 and the OX40 assay to identify antigen-specific
regulatory T cells held by St Vincent’s Hospital, Sydney, Australia. J. A. Tye-Din has
received a grant from the Coeliac Research Fund; has consultant arrangements with
ImmusanT; is coinventor of patents pertaining to the use of gluten peptides in
therapeutics, diagnostics, and nontoxic gluten; and is a shareholder in Nexpep. A. D.
Kelleher has received grants from the Australian Government Department of Health
and Ageing, the National Health and Medical Research Council (510448 and
1085875), and the Coeliac Research Fund; has received a Practitioner Fellowship
from the Australian Government Department of Health and Ageing; and is named
inventor on a patent for the use of CD39 and the OX40 assay to identify antigen-
specific regulatory T cells held by St Vincent’s Hospital, Sydney, Australia. The rest of
the authors declare that they have no relevant conflicts of interest.
Received for publication March 24, 2015; revised February 3, 2017; accepted for publi-
cation February 16, 2017.
Corresponding author: Laura Cook, PhD, Levings Lab, Child and Family Research
Institute, Room A4-102, 950 West 28th Ave, Vancouver, BC V5Z 4H4, Canada.
E-mail: [email protected].
0091-6749/$36.00
� 2017 American Academy of Allergy, Asthma & Immunology
http://dx.doi.org/10.1016/j.jaci.2017.02.015
1
FLA 5.4.0 DTD � YMAI12681_proof_–15-00411 � 20 March 2017 � 12:51 pm
1
2
3
4
5
6
7
8
9
10
11
12
13
14
15
16
17
18
19
20
21
22
23
24
25
26
27
28
29
30
31
32
33
34
35
36
37
38
39
40
41
42
43
44
45
46
47
48
49
50
51
52
53
54
55
56
57
58
59
60
61
62
63
64
65
66
67
68
69
70
71
72
73
74
75
76
77
78
79
80
81
82
83
84
85
86
87
88
89
90
91
92
93
94
95
96
97
98
99
100
101
102
103
104
105
106
107
108
109
110
111
112
113
114
115
116
117
118
119
120

Abbreviations used
APC: Antigen-presenting cell
CTV: CellTrace Violet
FOXP3: Forkhead box protein 3
PE: Phycoerythrin
SEB: Staphylococcal enterotoxin B
Tconv: Conventional T
Treg: Regulatory T
TSDR: Regulatory T cell–specific demethylated region
tTG: Tissue transglutaminase 2
that deamidates gluten. Intestinal damage is caused by CD41
T cells, which recognize deamidated gluten peptides presentedin complex with HLA-DQ2.5, HLA-DQ2.2, and/or HLA-DQ8,2,3
and the immunodominant hierarchy of wheat gliadin T-cellepitopes in HLA-DQ2.51 patients with celiac disease has beencomprehensively mapped.4 Although HLA susceptibilityhaplotypes are expressed by 30% to 40% of the generalpopulation, celiac disease affects only approximately 1%,indicating that immune tolerance to gluten is the norm. However,the mechanisms that underpin maintenance of gluten toleranceremain poorly described.
Gluten-responsive effector CD41 T cells can be detected in theperipheral blood of patients with celiac disease on a gluten-freediet 6 to 8 days after a 3-day oral gluten challenge.5 Onactivation, these cells secrete high levels of IFN-g,6,7 support Bcell–mediated production of antibodies to tTG and modifiedgluten peptides, and enhance lysis of stressed epithelial cells byCD81 T cells.4,6 Studies of total regulatory T (Treg) cells inpatients with celiac disease have provided evidence for bothnormal suppressive function8-10 and impaired function,11,12 aswell as suggesting that effector T cells have become resistant toTreg cell suppression.10,13,14 However, although forkhead boxprotein 3 (FOXP3)1 Treg cells have an important role inmaintaining peripheral tolerance, until now, the frequency andfunction of gluten-specific FOXP31 Treg cells in patients withceliac disease have not been studied.
For the first time, this study exploited acute in vivo glutenchallenge in patients with celiac disease to interrogate botheffector and regulatory components of the recall response togluten. Specifically, we aimed to estimate the frequency of Tregcells within gluten-specific CD41T-cell recall responses; identifychanges in the frequency of peripheral gut-homing memoryCD41 T-cell populations after gluten challenge; andphenotypically and functionally characterize gluten-specificTreg cells.
METHODS
Subjects and samplesPatients with celiac disease were recruited after provision of informed
consent (Human Research Ethics Committees: Royal Melbourne Hospital ID
2003.009; Walter and Eliza Hall Institute of Medical Research ID 03/04).
Enrollment criteria were biopsy-proved disease conforming to European
Society for Paediatric Gastroenterology Hepatology and Nutrition
guidelines,15HLA-DQ21, and compliancewith a gluten-free diet for 6months
or more. Healthy donor blood was obtained from the Australian Red Cross
Blood Service and volunteers (St Vincent’s Hospital Human Research Ethics
Committee ID HREC/13/SVH/145). Peripheral blood was collected into
lithium heparin vacutainers (BD, San Jose, Calif), transported at ambient
temperature, and processed within 8 hours of collection. Mononuclear cells
were obtained by means of centrifugation over Ficoll-Paque (GE Healthcare,
Fairfield, Conn).
Serology and HLA typingSerum titers of tTG IgA and deamidated gliadin peptide IgGwere evaluated
with commercial kits (INV 708760 and 704525; INOVA Diagnostics, San
Diego, Calif) by a diagnostic laboratory (Gribbles-Healthscope, nnn,
Australia) Q1. The presence of alleles encoding HLA-DQ2.5, HLA-DQ2.2, and
HLA_DQ8 was determined by detecting 5 single nucleotide polymorphisms
(rs2187668, rs2395182, rs4713586, rs7454108, and rs7775228), as previously
described.16,17 HLA-DQB1 and HLA-DQA1 alleles were determined by
using PCR sequence–specific oligonucleotide hybridization (Victorian
Transplantation and Immunogenetics Service, Victoria, Australia).
Oral gluten challengeAll participants undertook a gluten challenge5 from days 1 to 3 by
consuming 4 slices of commercial white bread daily (approximately 10 g/d
wheat gluten) and recorded symptoms daily to day 6, grading them as mild,
moderate, or severe.18
ReagentsWe used 2 HLA-DQ2.5–restricted 15mers that encompass the
immunodominant deamidated wheat gliadin T-cell epitopes DQ2.5-glia-a1/
a2 (LQPFPQPELPYPQPQ) andDQ2.5-glia-v1/v2 (QPFPQPEQPFPWQP).4
Gluten peptide mix contained an equimolar mixture of these two 15mers. An
HLA-DQ2.5–restricted 15mer that encompasses the immunodominant barley
hordein T-cell epitope DQ2.5-hor-3 (PEQPIPEQPQPYPQQ) acted as a
specificity control.4 Peptides were synthesized to 95% purity or greater, as
confirmed by means of high-performance liquid chromatography (Pepscan,
Lelystad, The Netherlands); dissolved in dimethyl sulfoxide (Sigma-Aldrich,
St Louis, Mo); and stored at2808C until use.5,18 Chymotrypsin digestion and
deamidation of gliadin (#101778; ICN Biomedicals, Cost Mesa, Calif) were
performed, as previously described.5,18 Tetanus toxoid was from CSL (nnn,
Australia) Q2, and staphylococcal enterotoxin B (SEB) and PHA were from
Sigma-Aldrich.
IFN-g secretion assaysAntigen-stimulated IFN-g secretion from PBMCs was assessed by using
either ELISpot (Mabtech, Nacka Strand, Sweden) or ELISA (Mabtech),
assays that are equivalent in their ability to detect gluten-specific responses.18
Gluten peptide mix and deamidated gliadin were used at 100 mg/mL and
tetanus toxoid was used at 10 LfU/mL, and assays were performed in
triplicate, as previously described.5,18,19
OX40 assayThe OX40 assay was performed, as previously described,20,21 with either
fresh whole blood (diluted 1:1 with RPMI 1640 media, Invitrogen) or PBMCs
at 2 3 106 cells/mL and incubation with antigen for 44 hours at 378C (5%
CO2). Antigen concentrations were as follows: SEB, 1mg/mL; tetanus toxoid,
2 LfU/mL; deamidated gliadin, 100 mg/mL; and DQ2.5-hor-3m 50 mg/mL.
Optimal concentrations of gluten antigens were determined in a pilot study
(see Fig E1, B, in this article’s Online Repository at www.jacionline.org).
DQ2.5-glia-a1/a2 and DQ2.5-glia-v1/v2 were used separately at
50 mg/mL and in an equimolar gluten peptide mix. Assay cutoffs were as
follows: greater than 0.02% of CD41 T cells (mean1 3 SDs Q3of unstimulated
wells) and greater than 20 cells.
Population tracking within the OX40 assayPostchallenge PBMCs were fluorescence-activated cell sorting purified
into 4 CD41 T-cell populations (Fig 3, A) Q4: (1) CD45RO2 T cells and
J ALLERGY CLIN IMMUNOL
nnn 2017
2 COOK ET AL
FLA 5.4.0 DTD � YMAI12681_proof_–15-00411 � 20 March 2017 � 12:51 pm
121
122
123
124
125
126
127
128
129
130
131
132
133
134
135
136
137
138
139
140
141
142
143
144
145
146
147
148
149
150
151
152
153
154
155
156
157
158
159
160
161
162
163
164
165
166
167
168
169
170
171
172
173
174
175
176
177
178
179
180
181
182
183
184
185
186
187
188
189
190
191
192
193
194
195
196
197
198
199
200
201
202
203
204
205
206
207
208
209
210
211
212
213
214
215
216
217
218
219
220
221
222
223
224
225
226
227
228
229
230
231
232
233
234
235
236
237
238
239
240

(2) CD45RO1CD127highCD25low conventional T (Tconv) cells, with the
CD45RO1CD127lowCD25high Treg cells subdivided into (3) CD391 and
(4) CD392 cells. Portions of the 3 CD45RO1 populations were stained with
CellTrace Violet (CTV) to enable cell tracking. In some experiments
PBMCs were stained with DQ2.5-glia a21/a2 tetramer and sorted into
tetramer-negative and tetramer-positive CD41 T cells that were then labeled
with CTV. PBMCs were reconstituted, maintaining ex vivo cell ratios, and
supplemented with CD3-depleted autologous PBMCs (Dynabeads CD3,
Invitrogen) to one sixth of the total cell number. Each well contained a single
CTV-labeled population, and the OX40 assay was performed and analyzed, as
described above.
Flow cytometryStaining was performed, as previously described,22 with anti-CD3–
peridinin-chlorophyll-protein complex–Cy5.5 (SK7), CD4–Alexa Fluor 700
(RPA-T4), CD25–allophycocyanin (2A3), OX40 (CD134)–phycoerythrin
(PE; L106), cytotoxic T lymphocyte–associated antigen 4–PE (BNI3),
GARP-BV711 (7B11), integrin b7–PE (FIB504; BD); CD45RO-ECD
(UCHL1; Beckman Coulter, Fullerton, Calif); CD127-eFluor450
(eBioRDR5), CD39-PECy7 (A1); LAP-PECy7Q5 (FNLAP; eBioscience),
Helios–Alex Fluor 488 (22F6), and anti-FOXP3–Alexa Fluor 488 (259D;
BioLegend, San Diego, Calif). FOXP3 staining was performed with the
FOXP3 buffer kit (BD), and the IgG1k-FITC antibody (BD) was used to set
analysis gates. All mAbswere used at manufacturers’ recommended dilutions.
Cell labeling was performed with the CTV Cell Proliferation Kit (Invitrogen)
and PKH26 Red Fluorescent Cell Linker Kit for General Cell Membrane
Labelling (Sigma-Aldrich) per the manufacturers’ recommendations by using
5 mmol/L dye concentrations. HLA-DQ2 proteins were synthesized with
bound DQ2.5-glia-a1, DQ2.5-glia-a2, or the HLA class II invariant peptide
by using previously described constructs and methods.23 Tetramers were
produced by means of addition of either NeutrAvidin R-allophycocyanin or
R-PE conjugate (Invitrogen) to biotinylated protein, as previously described.24
Staining was performed with 50 mg/mL tetramer in complete media at 378C
for 1 hour. A 4-laser LSRII flow cytometer (BD) was used, and analysis
was performed with FlowJo software (v8.8.7; TreeStar, Ashland, Ore).
In vitro expansion of T-cell populationsThe protocol used to expand Treg cells, Tconv cells, and DQ2.5-glia-a1/
a2–specific CD391 T cells was adapted from Gregori et al,25 as previously
described20; T-cell cloning was performed by plating cells at 1 cell/well.
Irradiated feeder cell mix consisted of 5 3 105 cells/mL of mixed PBMCs
(equal mix of autologous PBMCs and PBMCs from 2 allogeneic healthy
donors) and 5 3 104 cells/mL of an autologous EBV-transformed B-cell
line generated and maintained, as previously described.26
Quantitative RT-PCR and T-cell receptor clonotype
analysis by 59 Rapid Amplification of cDNA EndsQuantitative RT-PCR was performed on resting T-cell populations, and
relative expression levels to b-actin were calculated, as previously
described20: FOXP3 forward, 59-TCACCTACGCCACGCTCAT-39;
FOXP3 reverse, 59-TCATTGAGTGTCCGCTGCTT-39; TGF-b forward,
59-CCCTGGACACCAACTATTGC-39; and TGF-b reverse, 59-CAGA
AGTTGGCATGGTAGCC-39. T-cell receptor clonotypes were analyzed by
using 59RapidAmplification of cDNAEnds (Clontech,MountainView, Calif)
PCR, as previously described.27 Sequences were analyzed by using the
ImmunoGenetics V-quest database.28
Suppression assaySuppression assays were performed, as previously described.20
CD41CD1271CD252 responder T cells were labeled with CTV (Invitrogen),
and suppressor cells were labeled with PKH26 (Sigma-Aldrich). Wells
contained 50,000 irradiated autologous antigen-presenting cells (APCs) and
20,000 responder T cells, with suppressor T cells added at the ratios indicated.
Assays were stimulated for 4 days with 0.25 mg/mL soluble anti-CD3
(Invitrogen). CD39 enzyme activity was blocked in some assays with
250 mmol/L ARL67156 (Sigma-Aldrich). The division index was used to
calculate the percentage of suppression.29
Treg cell–specific demethylated region analysisGenomic DNAwas isolated, and bisulfite conversion was performed with
the EZ DNAMethylation-Direct kit (Zymo Research, Irvine, Calif). PCR was
performedwith the PyroMark PCR kit (Qiagen, Hilden, Germany) andHuman
FoxP3 Methylation Assay ADS783FS2 (EpigenDx, Ashland, Mass),
which reports the methylation of 8 representative CpG sites in the regulatory
T cell–specific demethylated region (TSDR). Pyrosequencing was performed
on a PyroMark Q96 ID (Qiagen) with PyroMark Gold Q96 reagents (Qiagen)
and Streptavidin Sepharose (GE Healthcare). All kits/reagents were used,
according to the manufacturer’s instructions. Analysis was performed on
female subjects, and the levels of methylation have not been adjusted to
account for X-inactivation.
StatisticsMann-Whitney U tests or 1-way ANOVAwere used unless samples were
matched, and then Wilcoxon signed-rank tests were performed. Correlation
analyses used Spearman rho (rs). P values were considered significant at
less than .05. Prism 6.0 software (GraphPad Software, La Jolla, Calif) was
used for all statistical analyses.
RESULTS
Numbers of circulating gluten-specific
FOXP31CD391 Treg cells are significantly increased
after gluten challengeTo investigate CD41 T-cell recall responses to gluten, we
recruited a cohort of 17 treated patients with celiac disease(see Tables E1 and E2 in this article’s Online Repository atwww.jacionline.org). We used our previously developed OX40assay, which detects antigen-specific CD41 T cells throughantigen-induced coexpression of CD25 and OX40,21 to measurechanges in the frequency of circulating gluten-specific CD41
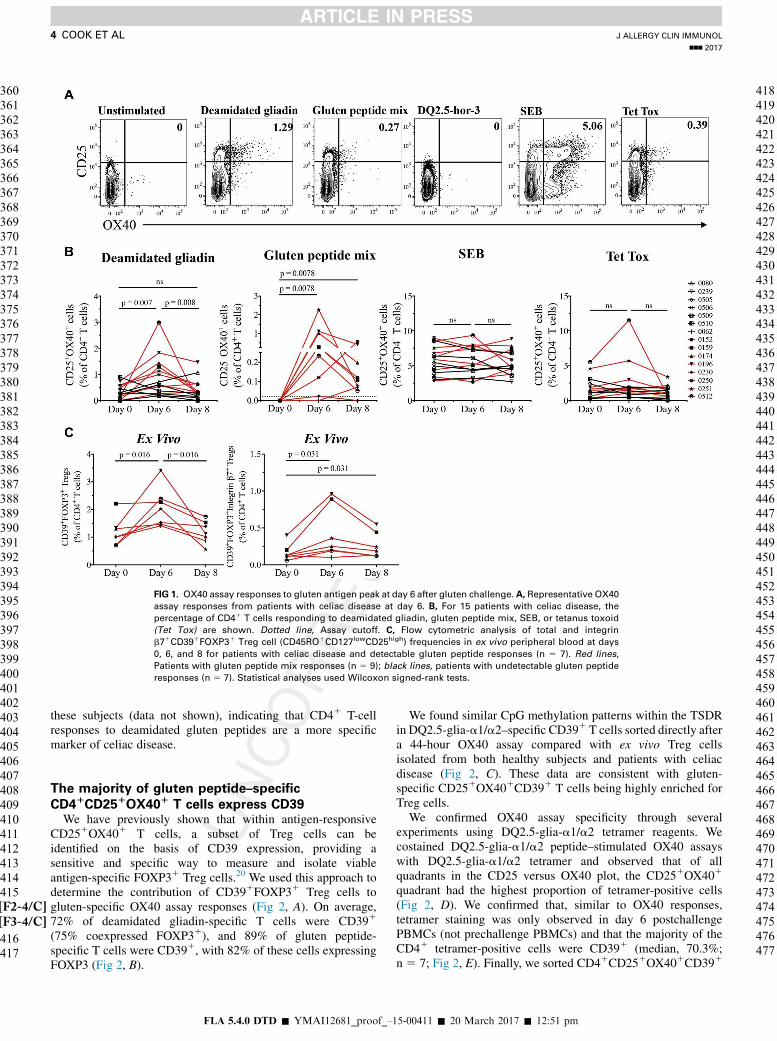
T cells in patients with celiac disease after gluten challenge(Fig 1 [F1-4/C], A). In a pilot study we found the optimal time for detectingresponses was 6 to 8 days after gluten challenge (termed days 6and 8; see Fig E1, A). At day 6, we observed significant increasesin deamidated gliadin levels (n5 15,P5.007) and gluten peptideresponses (n5 9,P5.008; Fig 1,B). The overall peak response togluten antigens occurred at day 6 (median response 0.27% ofCD41 T cells). There were no detectable responses to the barleyhordein peptide DQ2.5-hor-3 (Fig 1, A), indicating that the wheatpeptide responses are specifically induced by oral wheat glutenchallenge. Patients with detectable gluten peptide responsesalso had a significant increase in numbers of both total andgut-homing CD391FOXP31 Treg cells at day 6 (Fig 1,C), a trendnot seen in gluten peptide nonresponders (see Fig E2, A, in thisarticle’s Online Repository at www.jacionline.org). Q6There wereno significant changes observed within numbers of total orgut-homing CD41 Tconv cells (data not shown).
We assessed the presence of gluten-specific CD41 T cells in 6healthy volunteers (HLA-DQ genotypes were known for 4, andonly 1 carried HLA-DQ2.5). The median deamidatedgliadin-specific response for the non-HLA-DQ2.5 subjects was0.09% of CD41 T cells (range, 0% to 0.15%), and the responsefor all 6 subjects was 0.19% (range, 0% to 0.77%; see Fig E1,C). No deamidated gluten peptide responses were detected in
J ALLERGY CLIN IMMUNOL
VOLUME nnn, NUMBER nn
COOK ET AL 3
FLA 5.4.0 DTD � YMAI12681_proof_–15-00411 � 20 March 2017 � 12:51 pm
241
242
243
244
245
246
247
248
249
250
251
252
253
254
255
256
257
258
259
260
261
262
263
264
265
266
267
268
269
270
271
272
273
274
275
276
277
278
279
280
281
282
283
284
285
286
287
288
289
290
291
292
293
294
295
296
297
298
299
300
301
302
303
304
305
306
307
308
309
310
311
312
313
314
315
316
317
318
319
320
321
322
323
324
325
326
327
328
329
330
331
332
333
334
335
336
337
338
339
340
341
342
343
344
345
346
347
348
349
350
351
352
353
354
355
356
357
358
359
these subjects (data not shown), indicating that CD41 T-cellresponses to deamidated gluten peptides are a more specificmarker of celiac disease.
The majority of gluten peptide–specific
CD41CD251OX401 T cells express CD39We have previously shown that within antigen-responsive
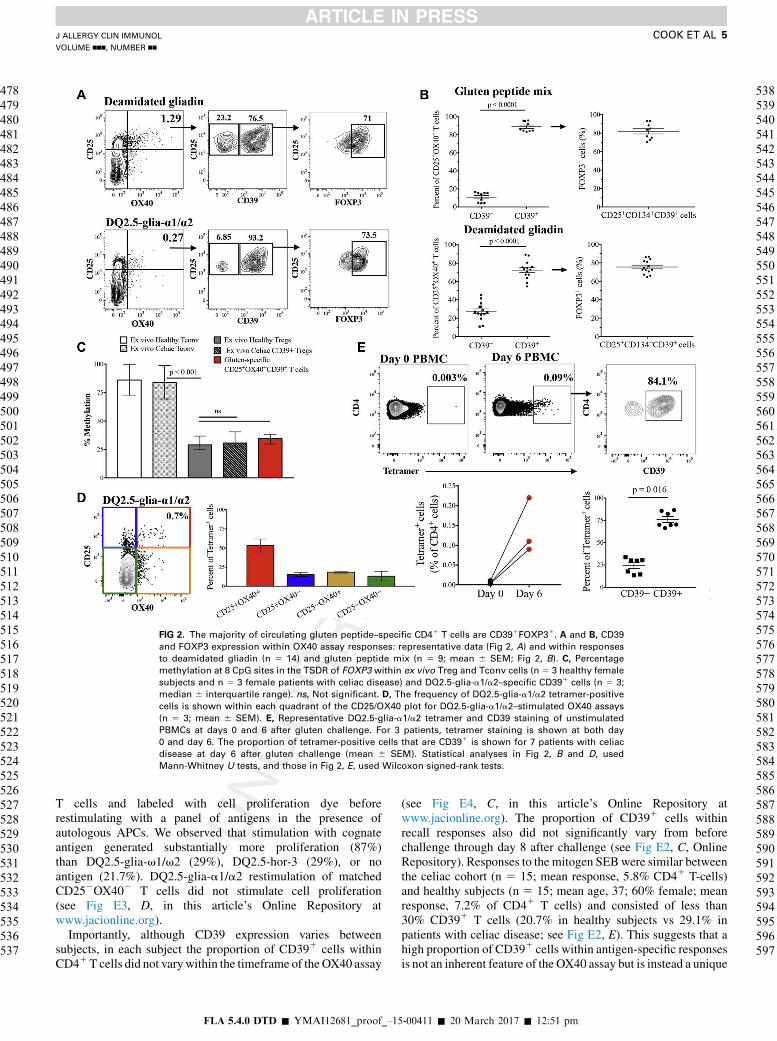
CD251OX401 T cells, a subset of Treg cells can beidentified on the basis of CD39 expression, providing asensitive and specific way to measure and isolate viableantigen-specific FOXP31 Treg cells.20 We used this approach todetermine the contribution of CD391FOXP31 Treg cells togluten-specific OX40 assay responses (Fig 2[F2-4/C]
[F3-4/C], A). On average,
72% of deamidated gliadin-specific T cells were CD391
(75% coexpressed FOXP31), and 89% of gluten peptide-specific T cells were CD391, with 82% of these cells expressingFOXP3 (Fig 2, B).
We found similar CpG methylation patterns within the TSDRin DQ2.5-glia-a1/a2–specific CD391 T cells sorted directly aftera 44-hour OX40 assay compared with ex vivo Treg cellsisolated from both healthy subjects and patients with celiacdisease (Fig 2, C). These data are consistent with gluten-specific CD251OX401CD391 T cells being highly enriched forTreg cells.
We confirmed OX40 assay specificity through severalexperiments using DQ2.5-glia-a1/a2 tetramer reagents. Wecostained DQ2.5-glia-a1/a2 peptide–stimulated OX40 assayswith DQ2.5-glia-a1/a2 tetramer and observed that of allquadrants in the CD25 versus OX40 plot, the CD251OX401
quadrant had the highest proportion of tetramer-positive cells(Fig 2, D). We confirmed that, similar to OX40 responses,tetramer staining was only observed in day 6 postchallengePBMCs (not prechallenge PBMCs) and that the majority of theCD41 tetramer-positive cells were CD391 (median, 70.3%;n 5 7; Fig 2, E). Finally, we sorted CD41CD251OX401CD391
FIG 1. OX40 assay responses to gluten antigen peak at day 6 after gluten challenge. A, Representative OX40
assay responses from patients with celiac disease at day 6. B, For 15 patients with celiac disease, the
percentage of CD41 T cells responding to deamidated gliadin, gluten peptide mix, SEB, or tetanus toxoid
(Tet Tox) are shown. Dotted line, Assay cutoff. C, Flow cytometric analysis of total and integrin
b71CD391FOXP31 Treg cell (CD45RO1CD127lowCD25high) frequencies in ex vivo peripheral blood at days
0, 6, and 8 for patients with celiac disease and detectable gluten peptide responses (n 5 7). Red lines,
Patients with gluten peptide mix responses (n 5 9); black lines, patients with undetectable gluten peptide
responses (n 5 7). Statistical analyses used Wilcoxon signed-rank tests.
J ALLERGY CLIN IMMUNOL
nnn 2017
4 COOK ET AL
FLA 5.4.0 DTD � YMAI12681_proof_–15-00411 � 20 March 2017 � 12:51 pm
360
361
362
363
364
365
366
367
368
369
370
371
372
373
374
375
376
377
378
379
380
381
382
383
384
385
386
387
388
389
390
391
392
393
394
395
396
397
398
399
400
401
402
403
404
405
406
407
408
409
410
411
412
413
414
415
416
417
418
419
420
421
422
423
424
425
426
427
428
429
430
431
432
433
434
435
436
437
438
439
440
441
442
443
444
445
446
447
448
449
450
451
452
453
454
455
456
457
458
459
460
461
462
463
464
465
466
467
468
469
470
471
472
473
474
475
476
477
T cells and labeled with cell proliferation dye beforerestimulating with a panel of antigens in the presence ofautologous APCs. We observed that stimulation with cognateantigen generated substantially more proliferation (87%)than DQ2.5-glia-v1/v2 (29%), DQ2.5-hor-3 (29%), or noantigen (21.7%). DQ2.5-glia-a1/a2 restimulation of matchedCD252OX402 T cells did not stimulate cell proliferation(see Fig E3, D, in this article’s Online Repository atwww.jacionline.org).
Importantly, although CD39 expression varies betweensubjects, in each subject the proportion of CD391 cells withinCD41T cells did not vary within the timeframe of theOX40 assay
(see Fig E4, C, in this article’s Online Repository atwww.jacionline.org). The proportion of CD391 cells withinrecall responses also did not significantly vary from beforechallenge through day 8 after challenge (see Fig E2, C, OnlineRepository). Responses to the mitogen SEBwere similar betweenthe celiac cohort (n 5 15; mean response, 5.8% CD41 T-cells)and healthy subjects (n 5 15; mean age, 37; 60% female; meanresponse, 7.2% of CD41 T cells) and consisted of less than30% CD391 T cells (20.7% in healthy subjects vs 29.1% inpatients with celiac disease; see Fig E2, E). This suggests that ahigh proportion of CD391 cells within antigen-specific responsesis not an inherent feature of the OX40 assay but is instead a unique
FIG 2. The majority of circulating gluten peptide–specific CD41 T cells are CD391FOXP31. A and B, CD39
and FOXP3 expression within OX40 assay responses: representative data (Fig 2, A) and within responses
to deamidated gliadin (n 5 14) and gluten peptide mix (n 5 9; mean 6 SEM; Fig 2, B). C, Percentage
methylation at 8 CpG sites in the TSDR of FOXP3 within ex vivo Treg and Tconv cells (n 5 3 healthy female
subjects and n 5 3 female patients with celiac disease) and DQ2.5-glia-a1/a2–specific CD391 cells (n 5 3;
median 6 interquartile range). ns, Not significant. D, The frequency of DQ2.5-glia-a1/a2 tetramer-positive
cells is shown within each quadrant of the CD25/OX40 plot for DQ2.5-glia-a1/a2–stimulated OX40 assays
(n 5 3; mean 6 SEM). E, Representative DQ2.5-glia-a1/a2 tetramer and CD39 staining of unstimulated
PBMCs at days 0 and 6 after gluten challenge. For 3 patients, tetramer staining is shown at both day
0 and day 6. The proportion of tetramer-positive cells that are CD391 is shown for 7 patients with celiac
disease at day 6 after gluten challenge (mean 6 SEM). Statistical analyses in Fig 2, B and D, used
Mann-Whitney U tests, and those in Fig 2, E, used Wilcoxon signed-rank tests.
J ALLERGY CLIN IMMUNOL
VOLUME nnn, NUMBER nn
COOK ET AL 5
FLA 5.4.0 DTD � YMAI12681_proof_–15-00411 � 20 March 2017 � 12:51 pm
478
479
480
481
482
483
484
485
486
487
488
489
490
491
492
493
494
495
496
497
498
499
500
501
502
503
504
505
506
507
508
509
510
511
512
513
514
515
516
517
518
519
520
521
522
523
524
525
526
527
528
529
530
531
532
533
534
535
536
537
538
539
540
541
542
543
544
545
546
547
548
549
550
551
552
553
554
555
556
557
558
559
560
561
562
563
564
565
566
567
568
569
570
571
572
573
574
575
576
577
578
579
580
581
582
583
584
585
586
587
588
589
590
591
592
593
594
595
596
597

feature of the recall response to gluten antigen in patients withceliac disease.
To confirm that gluten-specific CD251OX401CD391 T cellsoriginated from the pool of circulating Treg cells, we used ourpreviously described method for population tracking within theOX40 assay (Fig 3, A and B).20 We found that CD391 memoryTreg cells comprised an average of 88% of DQ2.5-glia-a1/a2-specific CD251OX401CD391 T cells, with CD392 Treg cellsalso the dominant population (average, 76%; n 5 4) within theCD251OX401CD392 T cells (Fig 3, E). Again, we observed
that during a 44-hour OX40 assay, CD39 expression was notaffected by cell activation (Fig 3, C). For 2 subjects, we trackedsorted, CTV-labeled CD41DQ2.5-glia-a1/a2 tetramer-positivecells within OX40 assays stimulated with DQ2.5-glia-a1/a2peptide. We observed that approximately 60% of theCD251OX401 cells were composed of CD391CTV1 cells(Fig 3, F). These data support our findings that peripheralCD41CD45RO1CD25highCD127low Treg cells constitute morethan 80% of the total DQ2.5-glia-a1/a2–specific CD251OX401
T-cell response after gluten challenge.
FIG 3. DQ2.5-glia-a1/a2–specific CD251OX401CD391 T cells originate from peripheral CD391 Treg cells.
A and B, Overview of the method and gating strategy used to conduct population tracking within an
OX40 assay performed as described in the Methods section with peripheral blood after gluten challenge.
C, Changes in CD39 expression between ex vivo isolation and after a 44-hour OX40 assay for Tconv cells,
CD392 Treg cells, and CD391 Treg cells (mean 6 SEM). D, Representative plots for unstimulated wells
and DQ2.5-glia-a1/a2–stimulated wells that contained CTV-labeled CD391 Treg cells. E, Proportion of Tconv
cells (gray), CD392 Treg cells (blue), and CD391 Treg cells (red) within the total DQ2.5-glia-a1/a2–specific
CD251OX401 T-cell response and the CD392 and CD391 fractions of this response. Data in Fig 3, C and E,
are the mean of 5 independent experiments with 4 patients with celiac disease. F, Tetramer-positive cells
were sorted from day 6 PBMCs, labeled with CTV, and either left unstimulated or stimulated for 44 hours
with DQ2.5-glia-a1/a2 peptide in the presence of autologous APCs. The proportion of CD391CTV1 cells
within the CD251OX401 quadrant is representative of 2.
J ALLERGY CLIN IMMUNOL
nnn 2017
6 COOK ET AL
FLA 5.4.0 DTD � YMAI12681_proof_–15-00411 � 20 March 2017 � 12:51 pm
598
599
600
601
602
603
604
605
606
607
608
609
610
611
612
613
614
615
616
617
618
619
620
621
622
623
624
625
626
627
628
629
630
631
632
633
634
635
636
637
638
639
640
641
642
643
644
645
646
647
648
649
650
651
652
653
654
655
656
657
658
659
660
661
662
663
664
665
666
667
668
669
670
671
672
673
674
675
676
677
678
679
680
681
682
683
684
685
686
687
688
689
690
691
692
693
694
695
696
697
698
699
700
701
702
703
704
705
706
707
708
709
710
711
712
713
714
715
716
717
DQ2.5-glia-a1/a2–specific CD391 T cells have
impaired suppressive functionDQ2.5-glia-a1/a2–specificCD41CD251OX401CD391Tcells
were expanded in vitro from post–gluten challenge PBMCs (sortpurities, >90%) to further investigate the phenotype and functionof gluten-specific FOXP31CD391 Treg cells. For femalepatients with celiac disease and healthy donors, we also expandednon–gluten-specific CD252OX402 T cells and, from unstimulatedPBMCs, CD25highCD127lowTreg cells and CD252CD1271Tconvcells. We generated 3 T-cell clones, 2 from patient #0174 (C1and C2) and 1 from patient #0251 (C3). Clonality wasconfirmed through sequencing the T-cell receptor b chain variableregion. Both T-cell clones from patient #0174 expressed thesame TRBV7-2 clonotype (CASSLRYTDTQYF), which mightbe a public clonotype, as previously identified in another celiaccohort.30
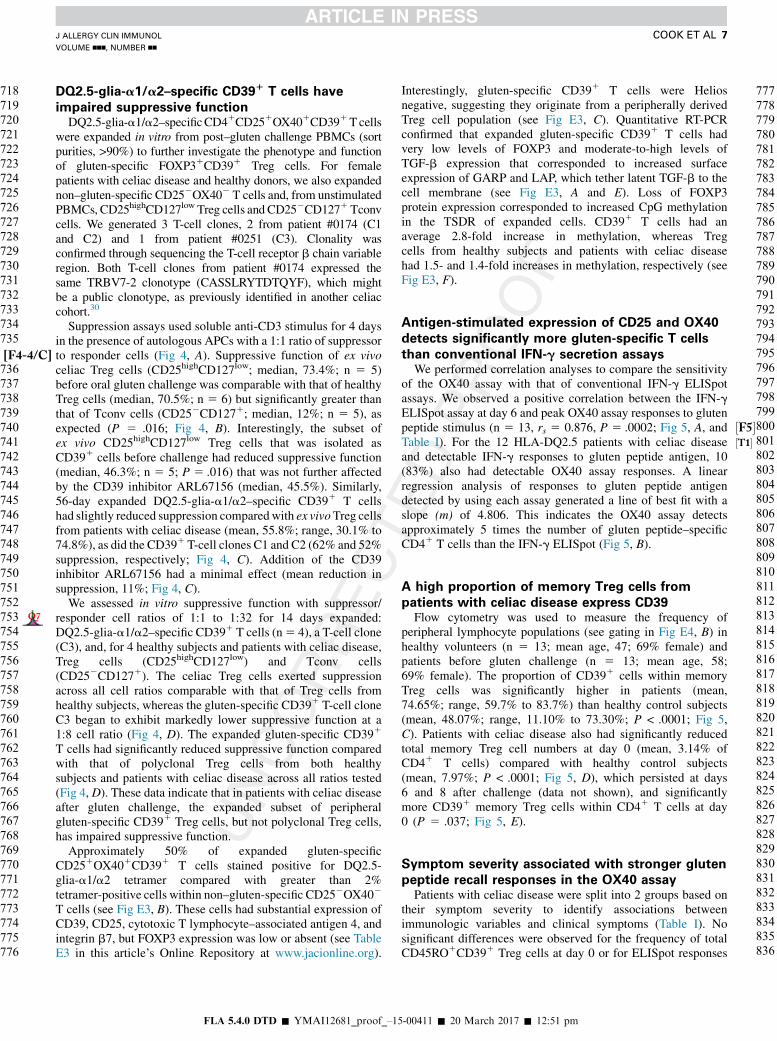
Suppression assays used soluble anti-CD3 stimulus for 4 daysin the presence of autologous APCs with a 1:1 ratio of suppressorto responder cells (Fig 4[F4-4/C] , A). Suppressive function of ex vivo
celiac Treg cells (CD25highCD127low; median, 73.4%; n 5 5)before oral gluten challenge was comparable with that of healthyTreg cells (median, 70.5%; n 5 6) but significantly greater thanthat of Tconv cells (CD252CD1271; median, 12%; n 5 5), asexpected (P 5 .016; Fig 4, B). Interestingly, the subset ofex vivo CD25highCD127low Treg cells that was isolated asCD391 cells before challenge had reduced suppressive function(median, 46.3%; n 5 5; P 5 .016) that was not further affectedby the CD39 inhibitor ARL67156 (median, 45.5%). Similarly,56-day expanded DQ2.5-glia-a1/a2–specific CD391 T cellshad slightly reduced suppression comparedwith ex vivoTreg cellsfrom patients with celiac disease (mean, 55.8%; range, 30.1% to74.8%), as did the CD391 T-cell clones C1 and C2 (62% and 52%suppression, respectively; Fig 4, C). Addition of the CD39inhibitor ARL67156 had a minimal effect (mean reduction insuppression, 11%; Fig 4, C).
We assessed in vitro suppressive function with suppressor/responder cell ratios of 1:1 to 1:32 for 14 days expandedQ7 :DQ2.5-glia-a1/a2–specific CD391 T cells (n5 4), a T-cell clone(C3), and, for 4 healthy subjects and patients with celiac disease,Treg cells (CD25highCD127low) and Tconv cells(CD252CD1271). The celiac Treg cells exerted suppressionacross all cell ratios comparable with that of Treg cells fromhealthy subjects, whereas the gluten-specific CD391 T-cell cloneC3 began to exhibit markedly lower suppressive function at a1:8 cell ratio (Fig 4, D). The expanded gluten-specific CD391
T cells had significantly reduced suppressive function comparedwith that of polyclonal Treg cells from both healthysubjects and patients with celiac disease across all ratios tested(Fig 4, D). These data indicate that in patients with celiac diseaseafter gluten challenge, the expanded subset of peripheralgluten-specific CD391 Treg cells, but not polyclonal Treg cells,has impaired suppressive function.
Approximately 50% of expanded gluten-specificCD251OX401CD391 T cells stained positive for DQ2.5-glia-a1/a2 tetramer compared with greater than 2%tetramer-positive cells within non–gluten-specific CD252OX402
T cells (see Fig E3, B). These cells had substantial expression ofCD39, CD25, cytotoxic T lymphocyte–associated antigen 4, andintegrin b7, but FOXP3 expression was low or absent (see TableE3 in this article’s Online Repository at www.jacionline.org).
Interestingly, gluten-specific CD391 T cells were Heliosnegative, suggesting they originate from a peripherally derivedTreg cell population (see Fig E3, C). Quantitative RT-PCRconfirmed that expanded gluten-specific CD391 T cells hadvery low levels of FOXP3 and moderate-to-high levels ofTGF-b expression that corresponded to increased surfaceexpression of GARP and LAP, which tether latent TGF-b to thecell membrane (see Fig E3, A and E). Loss of FOXP3protein expression corresponded to increased CpG methylationin the TSDR of expanded cells. CD391 T cells had anaverage 2.8-fold increase in methylation, whereas Tregcells from healthy subjects and patients with celiac diseasehad 1.5- and 1.4-fold increases in methylation, respectively (seeFig E3, F).
Antigen-stimulated expression of CD25 and OX40
detects significantly more gluten-specific T cells
than conventional IFN-g secretion assaysWe performed correlation analyses to compare the sensitivity
of the OX40 assay with that of conventional IFN-g ELISpotassays. We observed a positive correlation between the IFN-gELISpot assay at day 6 and peak OX40 assay responses to glutenpeptide stimulus (n 5 13, rs 5 0.876, P 5 .0002; Fig 5 ½F5�, A, andTable I ½T1�). For the 12 HLA-DQ2.5 patients with celiac diseaseand detectable IFN-g responses to gluten peptide antigen, 10(83%) also had detectable OX40 assay responses. A linearregression analysis of responses to gluten peptide antigendetected by using each assay generated a line of best fit with aslope (m) of 4.806. This indicates the OX40 assay detectsapproximately 5 times the number of gluten peptide–specificCD41 T cells than the IFN-g ELISpot (Fig 5, B).
A high proportion of memory Treg cells from
patients with celiac disease express CD39Flow cytometry was used to measure the frequency of
peripheral lymphocyte populations (see gating in Fig E4, B) inhealthy volunteers (n 5 13; mean age, 47; 69% female) andpatients before gluten challenge (n 5 13; mean age, 58;69% female). The proportion of CD391 cells within memoryTreg cells was significantly higher in patients (mean,74.65%; range, 59.7% to 83.7%) than healthy control subjects(mean, 48.07%; range, 11.10% to 73.30%; P < .0001; Fig 5,C). Patients with celiac disease also had significantly reducedtotal memory Treg cell numbers at day 0 (mean, 3.14% ofCD41 T cells) compared with healthy control subjects(mean, 7.97%; P < .0001; Fig 5, D), which persisted at days6 and 8 after challenge (data not shown), and significantlymore CD391 memory Treg cells within CD41 T cells at day0 (P 5 .037; Fig 5, E).
Symptom severity associated with stronger gluten
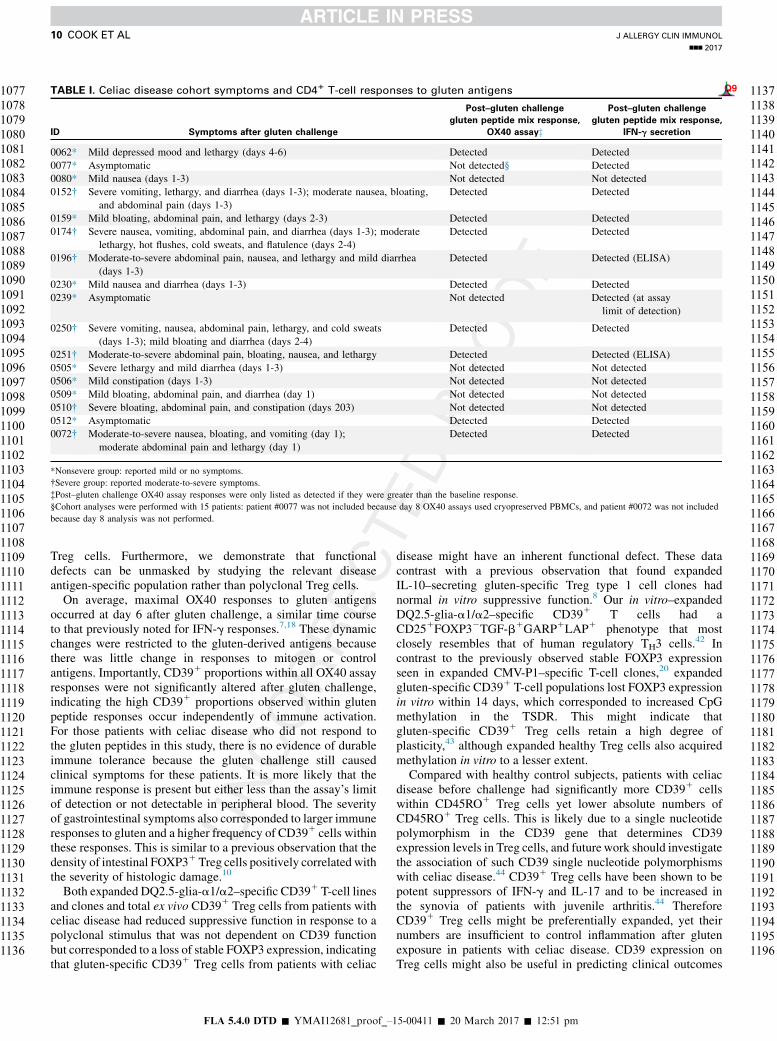
peptide recall responses in the OX40 assayPatients with celiac disease were split into 2 groups based on
their symptom severity to identify associations betweenimmunologic variables and clinical symptoms (Table I). Nosignificant differences were observed for the frequency of totalCD45RO1CD391 Treg cells at day 0 or for ELISpot responses
J ALLERGY CLIN IMMUNOL
VOLUME nnn, NUMBER nn
COOK ET AL 7
FLA 5.4.0 DTD � YMAI12681_proof_–15-00411 � 20 March 2017 � 12:51 pm
718
719
720
721
722
723
724
725
726
727
728
729
730
731
732
733
734
735
736
737
738
739
740
741
742
743
744
745
746
747
748
749
750
751
752
753
754
755
756
757
758
759
760
761
762
763
764
765
766
767
768
769
770
771
772
773
774
775
776
777
778
779
780
781
782
783
784
785
786
787
788
789
790
791
792
793
794
795
796
797
798
799
800
801
802
803
804
805
806
807
808
809
810
811
812
813
814
815
816
817
818
819
820
821
822
823
824
825
826
827
828
829
830
831
832
833
834
835
836

to gluten peptide mix (see Fig E5, A and C, in this article’s OnlineRepository at www.jacionline.org). However, patients with celiacdisease andmore severe symptoms had significantlymore CD391
cells within deamidated gliadin-specific CD251OX401 T cells(P 5 .014) and significantly larger OX40 assay responses togluten peptides (P 5 .011; see Fig E5, B and D).
DISCUSSIONThese data are the first report of the contribution of
FOXP31CD391 Treg cells to gluten-specific CD41 T-cellresponses in patients with celiac disease after in vivo glutenchallenge. Surprisingly, we observed that FOXP31CD391
Treg cells comprised more than 80% of circulating gluten
FIG 4. In vitro–expanded DQ2.5-glia-a1/a2–specific T cells retain suppressive function. A, Representative
responder cell proliferation showing division index (DI). B, Percentage of suppression of ex vivo Treg cells
from healthy subjects (n 5 6), Treg cells from patients with celiac disease (n 5 5), CD391 Treg cells from
patients with celiac disease (n 5 5), and Tconv cells from patients with celiac disease (n 5 5) at a 1:1 ratio
with responder T cells. ns, Not significant. C, Percentage suppression of 56-day expanded DQ2.5-glia-a1/a2–
specific CD391 T-cell populations (n5 2) and CD391 T-cell clones (C1 and C2). The CD39 inhibitor ARL67156
was added as indicated. D, Percentage suppression of 14-day expanded Treg cells (n 5 4), Tconv cells
(n 5 4), and DQ2.5-glia-a1/a2–specific CD391 T cells (n 5 4) from healthy subjects and patients with celiac
disease and T-cell clone C3 for 1:1 to 1:32 suppressor/responder cell ratios. Data in Fig 4, B-D, are
medians 1 interquartile ranges Q8of 1 to 3 independent experiments, and statistical analyses used
Mann-Whitney U tests.
J ALLERGY CLIN IMMUNOL
nnn 2017
8 COOK ET AL
FLA 5.4.0 DTD � YMAI12681_proof_–15-00411 � 20 March 2017 � 12:51 pm
837
838
839
840
841
842
843
844
845
846
847
848
849
850
851
852
853
854
855
856
857
858
859
860
861
862
863
864
865
866
867
868
869
870
871
872
873
874
875
876
877
878
879
880
881
882
883
884
885
886
887
888
889
890
891
892
893
894
895
896
897
898
899
900
901
902
903
904
905
906
907
908
909
910
911
912
913
914
915
916
917
918
919
920
921
922
923
924
925
926
927
928
929
930
931
932
933
934
935
936
937
938
939
940
941
942
943
944
945
946
947
948
949
950
951
952
953
954
955
956

peptide–specific CD41T cells in patients with celiac disease aftergluten challenge. We confirmed that more than 85% of the glutenpeptide–specific FOXP31CD391 T cells originated from theperipheral pool of CD391 Treg cells and that the extent of CpGmethylation in the TSDR within the FOXP3 loci of these cellsis similar to that seen in CD127lowCD25high Treg cells fromhealthy subjects.
Because the majority of FOXP31 Treg cells do not secreteIFN-g, our data indicate that IFN-g–based methods only detectapproximately 20% of the total CD41 T-cell response to glutenantigen (supported by our linear regression analysis). TheOX40 assay correlated with the IFN-g ELISpot for the detectionof gluten-specific CD41 T-cell responses. This concurs withprevious studies that found the OX40 assay has strong agreementwith IFN-g release assays for Mycobacterium tuberculosis31,32
and concordance with serology, proliferation, and cytokineresponses to HIV-1,21 hepatitis C virus,33 human papilloma-virus,34 Mycobacterium avium complex, varicella zostervirus, EBV, CMV, Candida albicans, and Streptococcus
pneumonia.21,35 For the first time, we also show that the OX40
assay corresponds with class II tetramer staining for responsesto the DQ2.5-glia-a1/a2 epitopes in patients with celiac diseaseafter gluten challenge.
These data complement our previous study showing thatCD391 Treg cells comprise a substantial proportion of CD41
T-cell recall responses to viral and bacterial antigens.20 Previousstudies of FOXP31 Treg cells within in vivo recall responses tovaricella zoster virus in human subjects36,37 and within secondaryimmune responses to influenza virus in mice38,39 identified a keyrole for pathogen-specific Treg cells in controlling the cellular im-mune response. Of particular interest is the recent discovery thatparticle-associated antigens drive a Treg cell response, whereasdistinct soluble antigens instead drive an effector T-cellresponse.40 In addition to the type of antigen, the balance betweenTreg and Tconv cells within antigen-specific responses is alsoinfluenced by chronicity of antigen exposure.41 This study is alarge contribution to the relatively underexplored area ofantigen-specific human Treg cells and shows that, for patientswith celiac disease on a gluten-free diet, the CD41 T-cellresponse to acute dietary gluten re-exposure is skewed toward
FIG 5. Analysis of assay correlation and peripheral Treg cell frequency and phenotype. A and B, Gluten
peptide mix IFN-g ELISpot responses (SFU/106 PBMCs; n 5 13) are correlated with OX40 assay responses
(n 5 13) expressed as either CD251OX401 cells as a percentage of CD41 T cells (Fig 5, A) or CD251OX401
cells/106 PBMCs (Fig 5, B). In Fig 5, A, the calculated Spearman rho (rs) and P values are shown, and in Fig 5,
B, the line of best fit (solid line) and 95% CIs (dashed line) are shown. C-E, Flow cytometric phenotyping data
from 13 patients with celiac disease were compared with those in healthy subjects (n 5 13) for the
proportion of CD41CD45RO1CD127lowCD25high Treg cells that expressed CD39 (Fig 5, C), the proportion
of CD45RO1 Treg cells within CD41 T cells (Fig 5, D), and the proportion of CD41 T cells that were
CD45RO1CD391 Treg cells (Fig 5, E). Error bars represent medians 6 interquartile ranges, and statistical
analyses used Mann-Whitney U tests.
J ALLERGY CLIN IMMUNOL
VOLUME nnn, NUMBER nn
COOK ET AL 9
FLA 5.4.0 DTD � YMAI12681_proof_–15-00411 � 20 March 2017 � 12:51 pm
957
958
959
960
961
962
963
964
965
966
967
968
969
970
971
972
973
974
975
976
977
978
979
980
981
982
983
984
985
986
987
988
989
990
991
992
993
994
995
996
997
998
999
1000
1001
1002
1003
1004
1005
1006
1007
1008
1009
1010
1011
1012
1013
1014
1015
1016
1017
1018
1019
1020
1021
1022
1023
1024
1025
1026
1027
1028
1029
1030
1031
1032
1033
1034
1035
1036
1037
1038
1039
1040
1041
1042
1043
1044
1045
1046
1047
1048
1049
1050
1051
1052
1053
1054
1055
1056
1057
1058
1059
1060
1061
1062
1063
1064
1065
1066
1067
1068
1069
1070
1071
1072
1073
1074
1075
1076
Treg cells. Furthermore, we demonstrate that functionaldefects can be unmasked by studying the relevant diseaseantigen-specific population rather than polyclonal Treg cells.
On average, maximal OX40 responses to gluten antigensoccurred at day 6 after gluten challenge, a similar time courseto that previously noted for IFN-g responses.7,18 These dynamicchanges were restricted to the gluten-derived antigens becausethere was little change in responses to mitogen or controlantigens. Importantly, CD391 proportions within all OX40 assayresponses were not significantly altered after gluten challenge,indicating the high CD391 proportions observed within glutenpeptide responses occur independently of immune activation.For those patients with celiac disease who did not respond tothe gluten peptides in this study, there is no evidence of durableimmune tolerance because the gluten challenge still causedclinical symptoms for these patients. It is more likely that theimmune response is present but either less than the assay’s limitof detection or not detectable in peripheral blood. The severityof gastrointestinal symptoms also corresponded to larger immuneresponses to gluten and a higher frequency of CD391 cells withinthese responses. This is similar to a previous observation that thedensity of intestinal FOXP31Treg cells positively correlated withthe severity of histologic damage.10
Both expanded DQ2.5-glia-a1/a2–specific CD391 T-cell linesand clones and total ex vivo CD391 Treg cells from patients withceliac disease had reduced suppressive function in response to apolyclonal stimulus that was not dependent on CD39 functionbut corresponded to a loss of stable FOXP3 expression, indicatingthat gluten-specific CD391 Treg cells from patients with celiac
disease might have an inherent functional defect. These datacontrast with a previous observation that found expandedIL-10–secreting gluten-specific Treg type 1 cell clones hadnormal in vitro suppressive function.8 Our in vitro–expandedDQ2.5-glia-a1/a2–specific CD391 T cells had aCD251FOXP32TGF-b1GARP1LAP1 phenotype that mostclosely resembles that of human regulatory TH3 cells.42 Incontrast to the previously observed stable FOXP3 expressionseen in expanded CMV-P1–specific T-cell clones,20 expandedgluten-specific CD391 T-cell populations lost FOXP3 expressionin vitro within 14 days, which corresponded to increased CpGmethylation in the TSDR. This might indicate thatgluten-specific CD391 Treg cells retain a high degree ofplasticity,43 although expanded healthy Treg cells also acquiredmethylation in vitro to a lesser extent.
Compared with healthy control subjects, patients with celiacdisease before challenge had significantly more CD391 cellswithin CD45RO1 Treg cells yet lower absolute numbers ofCD45RO1 Treg cells. This is likely due to a single nucleotidepolymorphism in the CD39 gene that determines CD39expression levels in Treg cells, and futurework should investigatethe association of such CD39 single nucleotide polymorphismswith celiac disease.44 CD391 Treg cells have been shown to bepotent suppressors of IFN-g and IL-17 and to be increased inthe synovia of patients with juvenile arthritis.44 ThereforeCD391 Treg cells might be preferentially expanded, yet theirnumbers are insufficient to control inflammation after glutenexposure in patients with celiac disease. CD39 expression onTreg cells might also be useful in predicting clinical outcomes
TABLE I. Celiac disease cohort symptoms and CD41 T-cell responses to gluten antigens Q9
ID Symptoms after gluten challenge
Post–gluten challenge
gluten peptide mix response,
OX40 assayz
Post–gluten challenge
gluten peptide mix response,
IFN-g secretion
0062* Mild depressed mood and lethargy (days 4-6) Detected Detected
0077* Asymptomatic Not detected§ Detected
0080* Mild nausea (days 1-3) Not detected Not detected
0152� Severe vomiting, lethargy, and diarrhea (days 1-3); moderate nausea, bloating,
and abdominal pain (days 1-3)
Detected Detected
0159* Mild bloating, abdominal pain, and lethargy (days 2-3) Detected Detected
0174� Severe nausea, vomiting, abdominal pain, and diarrhea (days 1-3); moderate
lethargy, hot flushes, cold sweats, and flatulence (days 2-4)
Detected Detected
0196� Moderate-to-severe abdominal pain, nausea, and lethargy and mild diarrhea
(days 1-3)
Detected Detected (ELISA)
0230* Mild nausea and diarrhea (days 1-3) Detected Detected
0239* Asymptomatic Not detected Detected (at assay
limit of detection)
0250� Severe vomiting, nausea, abdominal pain, lethargy, and cold sweats
(days 1-3); mild bloating and diarrhea (days 2-4)
Detected Detected
0251� Moderate-to-severe abdominal pain, bloating, nausea, and lethargy Detected Detected (ELISA)
0505* Severe lethargy and mild diarrhea (days 1-3) Not detected Not detected
0506* Mild constipation (days 1-3) Not detected Not detected
0509* Mild bloating, abdominal pain, and diarrhea (day 1) Not detected Not detected
0510� Severe bloating, abdominal pain, and constipation (days 203) Not detected Not detected
0512* Asymptomatic Detected Detected
0072� Moderate-to-severe nausea, bloating, and vomiting (day 1);
moderate abdominal pain and lethargy (day 1)
Detected Detected
*Nonsevere group: reported mild or no symptoms.
�Severe group: reported moderate-to-severe symptoms.
�Post–gluten challenge OX40 assay responses were only listed as detected if they were greater than the baseline response.
§Cohort analyses were performed with 15 patients: patient #0077 was not included because day 8 OX40 assays used cryopreserved PBMCs, and patient #0072 was not included
because day 8 analysis was not performed.
J ALLERGY CLIN IMMUNOL
nnn 2017
10 COOK ET AL
FLA 5.4.0 DTD � YMAI12681_proof_–15-00411 � 20 March 2017 � 12:51 pm
1077
1078
1079
1080
1081
1082
1083
1084
1085
1086
1087
1088
1089
1090
1091
1092
1093
1094
1095
1096
1097
1098
1099
1100
1101
1102
1103
1104
1105
1106
1107
1108
1109
1110
1111
1112
1113
1114
1115
1116
1117
1118
1119
1120
1121
1122
1123
1124
1125
1126
1127
1128
1129
1130
1131
1132
1133
1134
1135
1136
1137
1138
1139
1140
1141
1142
1143
1144
1145
1146
1147
1148
1149
1150
1151
1152
1153
1154
1155
1156
1157
1158
1159
1160
1161
1162
1163
1164
1165
1166
1167
1168
1169
1170
1171
1172
1173
1174
1175
1176
1177
1178
1179
1180
1181
1182
1183
1184
1185
1186
1187
1188
1189
1190
1191
1192
1193
1194
1195
1196
because low CD39 expression has been associated with betterCD41 T-cell recovery after antiretroviral therapy in HIV1
patients20 and methotrexate resistance in patients withrheumatoid arthritis.45
Together, the data presented here indicate that in patients withceliac disease after gluten challenge, FOXP31CD391 Treg cellsdominate peripheral recall responses to gluten and can be readilyexpanded on in vivo antigen challenge yet exhibit impairedin vitro suppressive function. Therefore one interpretation ofthese data is that, in response to gluten challenge,FOXP31CD391 Treg cells are induced in vivo in an attempt torestore homeostasis. However, the generated cells have impairedsuppressive function, possibly as a result of generation underinflammatory conditions in vivo. A key area for furtherinvestigation is whether in vivo challenge conditions could bemanipulated to drive expansion of functional Treg cells.
We thank Dr Anne Pesenacker and Dr Kate MacDonald for helpful
discussions; Ms Cathy Pizzey for her assistance with patient visit scheduling
and data and sample collection; andMs Lisa Xu,MsYinXu,MsAnnett Howe,
andMsMichelle Bailey for fluorescence-activated cell sorting isolation of cell
populations. All healthy subject and patients with celiac disease are thanked
for their participation in the study.
Key messages
d In patients with celiac disease, 6 days after gluten
challenge in vivo, a surprisingly large proportion of
circulating gluten-specific CD41 T cells are FOXP31
CD391 Treg cells.
d In patients with celiac disease after gluten challenge,
gluten-specific Treg cells exhibit impaired polyclonal sup-
pressive function in vitro, suggesting that an intrinsic
dysfunction of expanded CD391 Treg cells might
contribute to the loss of tolerance to gluten.
d Detection of gluten-specific CD41 T cells based on
antigen-induced coexpression of CD25 and OX40 is
more sensitive than traditional methods relying on
antigen-induced cytokine production and, for the first
time, allows detailed characterization of antigen-specific
Treg cells in patients with this disease.
REFERENCES
1. Sollid LM. Molecular basis of celiac disease. Annu Rev Immunol 2000;18:
53-81.
2. Molberg O, McAdam SN, Korner R, Quarsten H, Kristiansen C, Madsen L, et al.
Tissue transglutaminase selectively modifies gliadin peptides that are recognized
by gut-derived T cells in celiac disease. Nat Med 1998;4:713-7.
3. Sollid LM, Qiao S-W, Anderson RP, Gianfrani C, Koning F. Nomenclature and
listing of celiac disease relevant gluten T-cell epitopes restricted by HLA-DQ
molecules. Immunogenetics 2012;64:455-60.
4. Tye-Din JA, Stewart JA, Dromey JA, Beissbarth T, van Heel DA, Tatham A, et al.
Comprehensive, quantitative mapping of T cell epitopes in gluten in celiac disease.
Sci Transl Med 2010;2:41ra51.
5. Anderson RP, Degano P, Godkin AJ, Jewell DP, Hill AV. In vivo antigen challenge
in celiac disease identifies a single transglutaminase-modified peptide as the
dominant A-gliadin T-cell epitope. Nat Med 2000;6:337-42.
6. Abadie V, Discepolo V, Jabri B. Intraepithelial lymphocytes in celiac disease
immunopathology. Semin Immunopathol 2012;34:551-66.
7. Anderson RP, van Heel DA, Tye-Din JA, Barnardo M, Salio M, Jewell DP, et al.
T cells in peripheral blood after gluten challenge in coeliac disease. Gut 2005;
54:1217-23.
8. Gianfrani C, Levings MK, Sartirana C, Mazzarella G, Barba G, Zanzi D, et al.
Gliadin-specific type 1 regulatory T cells from the intestinal mucosa of treated
celiac patients inhibit pathogenic T cells. J Immunol 2006;177:4178-86.
9. Frisullo G, Nociti V, Iorio R, Patanella AK, Marti A, Assunta B, et al. Increased
CD41CD251Foxp31 T cells in peripheral blood of celiac disease patients:
correlation with dietary treatment. Hum Immunol 2009;70:430-5.
10. Zanzi D, Stefanile R, Santagata S, Iaffaldano L, Iaquinto G, Giardullo N, et al.
IL-15 interferes with suppressive activity of intestinal regulatory T cells expanded
in celiac disease. Am J Gastroenterol 2011;106:1308-17.
11. Granzotto M, dal Bo S, Quaglia S, Tommasini A, Piscianz E, Valencic E, et al.
Regulatory T-cell function is impaired in celiac disease. Dig Dis Sci 2009;54:
1513-9.
12. Hmida NB, Ben Ahmed M, Moussa A, Rejeb MB, Said Y, Kourda N, et al. Impaired
control of effector T cells by regulatory T cells: a clue to loss of oral tolerance and
autoimmunity in celiac disease? Am J Gastroenterol 2012;107:604-11.
13. Ben Ahmed M, Belhadj Hmida N, Moes N, Buyse S, Abdeladhim M, Louzir H,
et al. IL-15 renders conventional lymphocytes resistant to suppressive functions
of regulatory T cells through activation of the phosphatidylinositol 3-kinase
pathway. J Immunol 2009;182:6763-70.
14. DePaolo RW, Abadie V, Tang F, Fehlner-Peach H, Hall JA, Wang W, et al.
Co-adjuvant effects of retinoic acid and IL-15 induce inflammatory immunity
to dietary antigens. Nature 2011;471:220-4.
15. Revised criteria for diagnosis of coeliac disease. Report of Working Group of
European Society of Paediatric Gastroenterology and Nutrition. Arch Dis Child
1990;65:909-11.
16. Koskinen L, Romanos J, Kaukinen K, Mustalahti K, Korponay-Szabo I, Barisani D,
et al. Cost-effective HLA typing with tagging SNPs predicts celiac disease risk hap-
lotypes in the Finnish, Hungarian, and Italian populations. Immunogenetics 2009;61:
247-56.
17. Monsuur AJ, de Bakker PI, Zhernakova A, Pinto D, Verduijn W, Romanos J, et al.
Effective detection of human leukocyte antigen risk alleles in celiac disease using
tag single nucleotide polymorphisms. PLoS One 2008;3:e2270.
18. Ontiveros N, Tye-Din JA, Hardy MY, Anderson RP. Ex vivo whole blood secretion
of interferon (IFN)-g and IFN-g-inducible protein-10 (IP-10) measured by ELISA
are as sensitive as IFN-g ELISpot for the detection of gluten-reactive T cells in
HLA-DQ2.51 associated celiac disease. Clin Exp Immunol 2014;175:305-15.
19. Tye-Din JA, Anderson RP, Ffrench RA, Brown GJ, Hodsman P, Siegel M, et al. The
effects of ALV003 pre-digestion of gluten on immune response and symptoms in
celiac disease in vivo. Clin Immunol 2010;134:289-95.
20. Seddiki N, Cook L, Hsu DC, Phetsouphanh C, Brown K, Xu Y, et al. Human
antigen-specific CD41CD251CD1341CD391 T cells are enriched for regulatory
T cells and comprise a substantial proportion of recall responses. Eur J Immunol
2014;44:1644-61.
21. Zaunders JJ, Munier ML, Seddiki N, Pett S, Ip S, Bailey M, et al. High levels of
human antigen-specific CD4(1) T cells in peripheral blood revealed by stimulated
coexpression of CD25 and CD134 (OX40). J Immunol 2009;183:2827-36.
22. Seddiki N, Santner-Nanan B, Martinson J, Zaunders J, Sasson S, Landay A, et al.
Expression of interleukin (IL)-2 and IL-7 receptors discriminates between human
regulatory and activated T cells. J Exp Med 2006;203:1693-700.
23. Petersen J, Montserrat V, Mujico JR, Loh KL, Beringer DX, van Lummel M, et al.
T-cell receptor recognition of HLA-DQ2-gliadin complexes associated with celiac
disease. Nat Struct Mol Biol 2014;21:480-8.
24. Broughton SE, Petersen J, Theodossis A, Scally SW, Loh KL, Thompson A, et al.
Biased T cell receptor usage directed against human leukocyte antigen
DQ8-restricted gliadin peptides is associated with celiac disease. Immunity
2012;37:611-21.
25. Gregori S, Bacchetta R, Passerini L, Levings MK, Roncarolo MG. Isolation,
expansion, and characterization of human natural and adaptive regulatory T cells.
Methods Mol Biol 2007;380:83-105.
26. Kelleher AD, Long C, Holmes EC, Allen RL, Wilson J, Conlon C, et al.
Clustered mutations in HIV-1 gag are consistently required for escape from
HLA-B27-restricted cytotoxic T lymphocyte responses. J Exp Med 2001;193:
375-86.
27. Quigley MF, Almeida JR, Price DA, Douek DC. Unbiased molecular analysis of
T cell receptor expression using template-switch anchored RT-PCR. Curr Protoc
Cytom 2011 Chapter 10:Unt 10.33.
28. Giudicelli V, Brochet X, Lefranc MP. IMGT/V-QUEST: IMGT standardized
analysis of the immunoglobulin (IG) and T cell receptor (TR) nucleotide
sequences. Cold Spring Harb Protoc 2011;2011:695-715.
29. McMurchy AN, Levings MK. Suppression assays with human T regulatory cells: a
technical guide. Eur J Immunol 2012;42:27-34.
30. Qiao SW, Raki M, Gunnarsen KS, Loset GA, Lundin KE, Sandlie I, et al.
Posttranslational modification of gluten shapes TCR usage in celiac disease.
J Immunol 2011;187:3064-71.
J ALLERGY CLIN IMMUNOL
VOLUME nnn, NUMBER nn
COOK ET AL 11
FLA 5.4.0 DTD � YMAI12681_proof_–15-00411 � 20 March 2017 � 12:51 pm
1197
1198
1199
1200
1201
1202
1203
1204
1205
1206
1207
1208
1209
1210
1211
1212
1213
1214
1215
1216
1217
1218
1219
1220
1221
1222
1223
1224
1225
1226
1227
1228
1229
1230
1231
1232
1233
1234
1235
1236
1237
1238
1239
1240
1241
1242
1243
1244
1245
1246
1247
1248
1249
1250
1251
1252
1253
1254
1255
1256
1257
1258
1259
1260
1261
1262
1263
1264
1265
1266
1267
1268
1269
1270
1271
1272
1273
1274
1275
1276
1277
1278
1279
1280
1281
1282
1283
1284
1285
1286
1287
1288
1289
1290
1291
1292
1293
1294
1295
1296
1297
1298
1299
1300
1301
1302
1303
1304
1305
1306
1307
1308
1309
1310
1311
1312
1313
1314
1315
1316
31. Hsu DC, Zaunders JJ, Plit M, Leeman C, Ip S, Iampornsin T, et al. A novel assay
detecting recall response to Mycobacterium tuberculosis: comparison with existing
assays. Tuberculosis (Edinb) 2012;92:321-7.
32. Dan JM, Lindestam Arlehamn CS, Weiskopf D, da Silva Antunes R,
Havenar-Daughton C, Reiss SM, et al. A cytokine-independent approach
to identify antigen-specific human germinal center T follicular helper
cells and rare antigen-specific CD41 T cells in blood. J Immunol
2016;197:983-93.
33. Keoshkerian E, Helbig K, Beard M, Zaunders J, Seddiki N, Kelleher A, et al. A
novel assay for detection of hepatitis C virus-specific effector CD41 T cells via
co-expression of CD25 and CD134. J Immunol Methods 2012;375:148-58.
34. Tong WW, Shepherd K, Garland S, Meagher A, Templeton DJ, Fairley CK, et al.
HPV16-specific T-cell responses and spontaneous regression of anal high-grade
squamous intraepithelial lesions. J Infect Dis 2015;211:405-15.
35. Sadler R, Bateman EA, Heath V, Patel SY, Schwingshackl PP, Cullinane AC, et al.
Establishment of a healthy human range for the whole blood ‘OX40’ assay for the
detection of antigen-specific CD41 T cells by flow cytometry. Cytometry B Clin
Cytom 2014;86:350-61.
36. Vukmanovic-Stejic M, Sandhu D, Sobande TO, Agius E, Lacy KE, Riddell N, et al.
Varicella zoster-specific CD41Foxp31 T cells accumulate after cutaneous antigen
challenge in humans. J Immunol 2013;190:977-86.
37. Vukmanovic-Stejic M, Sandhu D, Seidel JA, Patel N, Sobande TO, Agius E, et al.
The characterization of varicella zoster virus-specific T cells in skin and blood
during aging. J Invest Dermatol 2015;135:1752-62.
38. Brincks EL, Roberts AD, Cookenham T, Sell S, Kohlmeier JE, Blackman MA,
et al. Antigen-specific memory regulatory CD41Foxp31 T cells control memory
responses to influenza virus infection. J Immunol 2013;190:3438-46.
39. Betts RJ, Prabhu N, Ho AW, Lew FC, Hutchinson PE, Rotzschke O, et al. Influenza
A virus infection results in a robust, antigen-responsive, and widely disseminated
Foxp31 regulatory T cell response. J Virol 2012;86:2817-25.
40. Bacher P, Heinrich F, Stervbo U, Nienen M, Vahldieck M, Iwert C, et al.
Regulatory T cell specificity directs tolerance versus allergy against aeroantigens
in humans. Cell 2016;167:1067-78.e16.
41. Su LF, Del Alcazar D, Stelekati E, Wherry EJ, Davis MM. Antigen exposure
shapes the ratio between antigen-specific Tregs and conventional T cells in human
peripheral blood. Proc Natl Acad Sci U S A 2016;113:E6192-8.
42. Weiner HL, da Cunha AP, Quintana F, Wu H. Oral tolerance. Immunol Rev 2011;
241:241-59.
43. He H, Ni B, Tian Y, Tian Z, Chen Y, Liu Z, et al. Histone methylation mediates
plasticity of human FOXP3(1) regulatory T cells by modulating signature gene
expressions. Immunology 2014;141:362-76.
44. Rissiek A, Baumann I, Cuapio A, Mautner A, Kolster M, Arck PC, et al. The
expression of CD39 on regulatory T cells is genetically driven and further
upregulated at sites of inflammation. J Autoimmun 2015;58:12-20.
45. Peres RS, Liew FY, Talbot J, Carregaro V, Oliveira RD, Almeida SL, et al. Low
expression of CD39 on regulatory T cells as a biomarker for resistance to
methotrexate therapy in rheumatoid arthritis. Proc Natl Acad Sci U S A 2015;
112:2509-14.
J ALLERGY CLIN IMMUNOL
nnn 2017
12 COOK ET AL
FLA 5.4.0 DTD � YMAI12681_proof_–15-00411 � 20 March 2017 � 12:51 pm
1317
1318
1319
1320
1321
1322
1323
1324
1325
1326
1327
1328
1329
1330
1331
1332
1333
1334
1335
1336
1337
1338
1339
1340
1341
1342
1343
1344
1345
1346
1347
1348
1349
1350
1351
1352
1353
1354
1355
1356
1357
1358
1359
1360
1361
1362
1363
1364
1365
1366
1367
1368
1369
1370
1371
1372
1373
1374
1375
1376
1377
1378
1379
1380
1381
1382
1383
1384
1385
1386
1387
1388
1389
1390
1391
1392
1393
1394
1395
1396
1397
1398
1399
1400
1401
1402
1403
1404
1405
1406
1407
1408
1409
1410
1411
1412
1413
1414
1415
1416
1417
1418
1419
1420
1421
1422
1423
1424
1425
1426
1427
1428
1429
1430
1431
1432
1433
1434
1435
1436
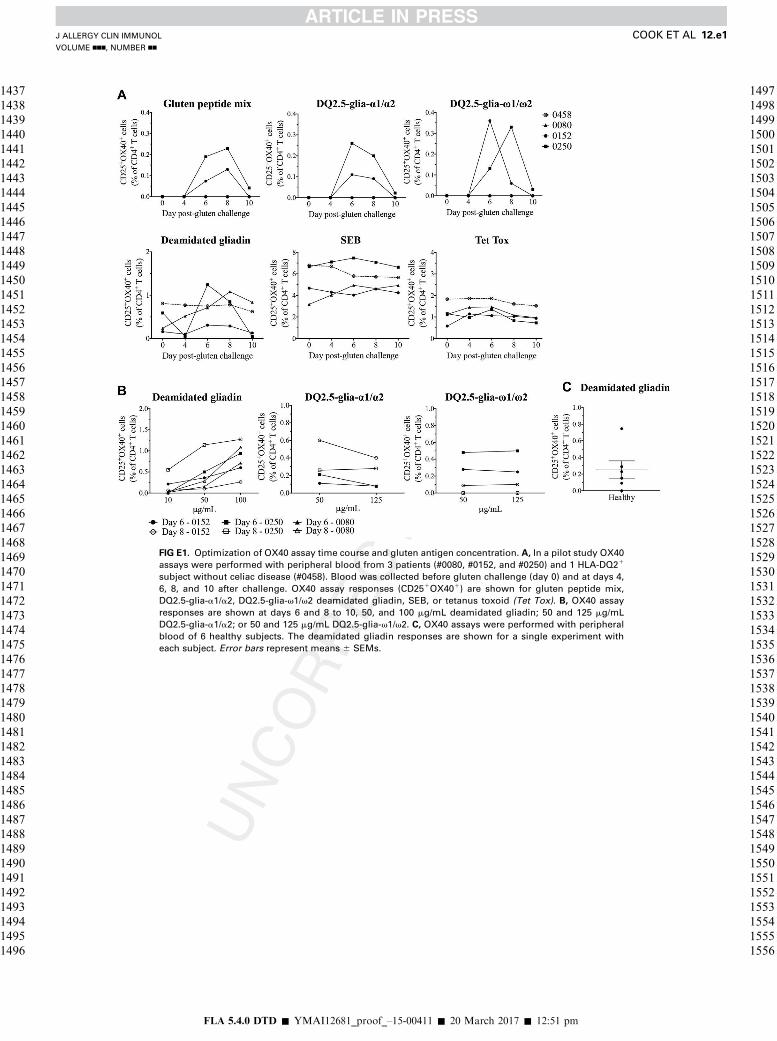
FIG E1. Optimization of OX40 assay time course and gluten antigen concentration. A, In a pilot study OX40
assays were performed with peripheral blood from 3 patients (#0080, #0152, and #0250) and 1 HLA-DQ21
subject without celiac disease (#0458). Blood was collected before gluten challenge (day 0) and at days 4,
6, 8, and 10 after challenge. OX40 assay responses (CD251OX401) are shown for gluten peptide mix,
DQ2.5-glia-a1/a2, DQ2.5-glia-v1/v2 deamidated gliadin, SEB, or tetanus toxoid (Tet Tox). B, OX40 assay
responses are shown at days 6 and 8 to 10, 50, and 100 mg/mL deamidated gliadin; 50 and 125 mg/mL
DQ2.5-glia-a1/a2; or 50 and 125 mg/mL DQ2.5-glia-v1/v2. C, OX40 assays were performed with peripheral
blood of 6 healthy subjects. The deamidated gliadin responses are shown for a single experiment with
each subject. Error bars represent means 6 SEMs.
J ALLERGY CLIN IMMUNOL
VOLUME nnn, NUMBER nn
COOK ET AL 12.e1
FLA 5.4.0 DTD � YMAI12681_proof_–15-00411 � 20 March 2017 � 12:51 pm
1437
1438
1439
1440
1441
1442
1443
1444
1445
1446
1447
1448
1449
1450
1451
1452
1453
1454
1455
1456
1457
1458
1459
1460
1461
1462
1463
1464
1465
1466
1467
1468
1469
1470
1471
1472
1473
1474
1475
1476
1477
1478
1479
1480
1481
1482
1483
1484
1485
1486
1487
1488
1489
1490
1491
1492
1493
1494
1495
1496
1497
1498
1499
1500
1501
1502
1503
1504
1505
1506
1507
1508
1509
1510
1511
1512
1513
1514
1515
1516
1517
1518
1519
1520
1521
1522
1523
1524
1525
1526
1527
1528
1529
1530
1531
1532
1533
1534
1535
1536
1537
1538
1539
1540
1541
1542
1543
1544
1545
1546
1547
1548
1549
1550
1551
1552
1553
1554
1555
1556

FIG E2. Changes in peripheral Treg cell frequencies and OX40 assay CD391 proportions after gluten
challenge. A and B, Frequencies of CD41 T cells that were memory CD391FOXP31 Treg cells (Fig E3, A)
and integrin b71CD391 memory Treg cells (Fig E3, B) are shown for patients who did not have detectable
gluten peptide responses (n 5 6). C, The proportion of CD39 expression within OX40 assay responses is
plotted for assays stimulated with SEB (n 5 15), tetanus toxoid (Tet Tox; n 5 15), deamidated gliadin
(n 5 10), and gluten peptide mix (n 5 7). Subjects were only included in analyses if they had detectable
responses at all 3 time points or, for gluten peptide mix, if they had detectable responses at both day 6
and day 8. Statistical analyses were performed with Wilcoxon signed-rank tests. ND, Not detected; ns,
not significant. Each subject is represented by a different symbol, and red connecting lines indicate those
subjects with gluten peptide responses. D and E, Total CD41CD251OX401 T-cell responses to SEB and
the proportion of CD391 cells within these responses are shown for healthy subjects (n 5 15; Fig E3, D)
and patients with celiac disease (n 5 15; Fig E3, E). Means 6 SEMs are shown.
J ALLERGY CLIN IMMUNOL
nnn 2017
12.e2 COOK ET AL
FLA 5.4.0 DTD � YMAI12681_proof_–15-00411 � 20 March 2017 � 12:51 pm
1557
1558
1559
1560
1561
1562
1563
1564
1565
1566
1567
1568
1569
1570
1571
1572
1573
1574
1575
1576
1577
1578
1579
1580
1581
1582
1583
1584
1585
1586
1587
1588
1589
1590
1591
1592
1593
1594
1595
1596
1597
1598
1599
1600
1601
1602
1603
1604
1605
1606
1607
1608
1609
1610
1611
1612
1613
1614
1615
1616
1617
1618
1619
1620
1621
1622
1623
1624
1625
1626
1627
1628
1629
1630
1631
1632
1633
1634
1635
1636
1637
1638
1639
1640
1641
1642
1643
1644
1645
1646
1647
1648
1649
1650
1651
1652
1653
1654
1655
1656
1657
1658
1659
1660
1661
1662
1663
1664
1665
1666
1667
1668
1669
1670
1671
1672
1673
1674
1675
1676
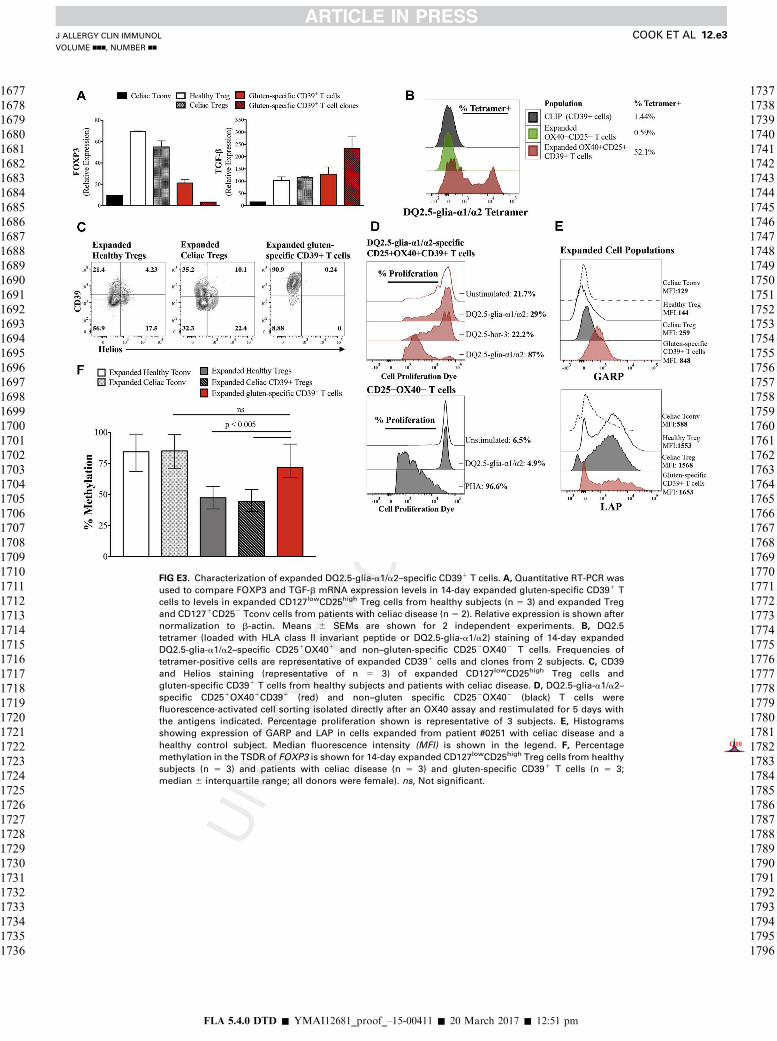
FIG E3. Characterization of expanded DQ2.5-glia-a1/a2–specific CD391 T cells. A, Quantitative RT-PCR was
used to compare FOXP3 and TGF-b mRNA expression levels in 14-day expanded gluten-specific CD391 T
cells to levels in expanded CD127lowCD25high Treg cells from healthy subjects (n 5 3) and expanded Treg
and CD1271CD252 Tconv cells from patients with celiac disease (n 5 2). Relative expression is shown after
normalization to b-actin. Means 6 SEMs are shown for 2 independent experiments. B, DQ2.5
tetramer (loaded with HLA class II invariant peptide or DQ2.5-glia-a1/a2) staining of 14-day expanded
DQ2.5-glia-a1/a2–specific CD251OX401 and non–gluten-specific CD252OX402 T cells. Frequencies of
tetramer-positive cells are representative of expanded CD391 cells and clones from 2 subjects. C, CD39
and Helios staining (representative of n 5 3) of expanded CD127lowCD25high Treg cells and
gluten-specific CD391 T cells from healthy subjects and patients with celiac disease. D, DQ2.5-glia-a1/a2–
specific CD251OX401CD391 (red) and non–gluten specific CD252OX402 (black) T cells were
fluorescence-activated cell sorting isolated directly after an OX40 assay and restimulated for 5 days with
the antigens indicated. Percentage proliferation shown is representative of 3 subjects. E, Histograms
showing expression of GARP and LAP in cells expanded from patient #0251 with celiac disease and a
healthy control subject. Median fluorescence intensity (MFI) Q10is shown in the legend. F, Percentage
methylation in the TSDR of FOXP3 is shown for 14-day expanded CD127lowCD25high Treg cells from healthy
subjects (n 5 3) and patients with celiac disease (n 5 3) and gluten-specific CD391 T cells (n 5 3;
median 6 interquartile range; all donors were female). ns, Not significant.
J ALLERGY CLIN IMMUNOL
VOLUME nnn, NUMBER nn
COOK ET AL 12.e3
FLA 5.4.0 DTD � YMAI12681_proof_–15-00411 � 20 March 2017 � 12:51 pm
1677
1678
1679
1680
1681
1682
1683
1684
1685
1686
1687
1688
1689
1690
1691
1692
1693
1694
1695
1696
1697
1698
1699
1700
1701
1702
1703
1704
1705
1706
1707
1708
1709
1710
1711
1712
1713
1714
1715
1716
1717
1718
1719
1720
1721
1722
1723
1724
1725
1726
1727
1728
1729
1730
1731
1732
1733
1734
1735
1736
1737
1738
1739
1740
1741
1742
1743
1744
1745
1746
1747
1748
1749
1750
1751
1752
1753
1754
1755
1756
1757
1758
1759
1760
1761
1762
1763
1764
1765
1766
1767
1768
1769
1770
1771
1772
1773
1774
1775
1776
1777
1778
1779
1780
1781
1782
1783
1784
1785
1786
1787
1788
1789
1790
1791
1792
1793
1794
1795
1796

FIG E4. Flow cytometric gating strategies. A, Gating strategy for OX40 assay analysis. Lymphocytes were
gated based on their forward- and side-scatter profiles, followed by gating CD31CD41 T cells. The
crosshatch gates used to define the antigen-specific CD251OX401 T cells were set initially on unstimulated
wells and refined by using responses in SEB-stimulated positive control wells. B,Gating strategy shown for
isolation and phenotypic analysis of peripheral CD41 memory T-cell populations. After gating on
lymphocytes and CD31CD41 T cells, the CD45RO1 memory cells were divided into Treg cells
(CD127lowCD25high) and the remaining non-Treg cells, with the Treg cells separated further into CD391
and CD392 populations. Expression of phenotypic markers, such as the gut-homing marker integrin b7,
was analyzed within each gated T-cell population. C, For 12 patients with celiac disease, the percentage
of CD391 cells within CD41 T cells is shown for PBMCs sourced directly ex vivo and from OX40 assay wells
after 44 hours of stimulation with no antigen, SEB, or gluten peptide mix.
J ALLERGY CLIN IMMUNOL
nnn 2017
12.e4 COOK ET AL
FLA 5.4.0 DTD � YMAI12681_proof_–15-00411 � 20 March 2017 � 12:51 pm
1797
1798
1799
1800
1801
1802
1803
1804
1805
1806
1807
1808
1809
1810
1811
1812
1813
1814
1815
1816
1817
1818
1819
1820
1821
1822
1823
1824
1825
1826
1827
1828
1829
1830
1831
1832
1833
1834
1835
1836
1837
1838
1839
1840
1841
1842
1843
1844
1845
1846
1847
1848
1849
1850
1851
1852
1853
1854
1855
1856
1857
1858
1859
1860
1861
1862
1863
1864
1865
1866
1867
1868
1869
1870
1871
1872
1873
1874
1875
1876
1877
1878
1879
1880
1881
1882
1883
1884
1885
1886
1887
1888
1889
1890
1891
1892
1893
1894
1895
1896
1897
1898
1899
1900
1901
1902
1903
1904
1905
1906
1907
1908
1909
1910
1911
1912
1913
1914
1915
1916
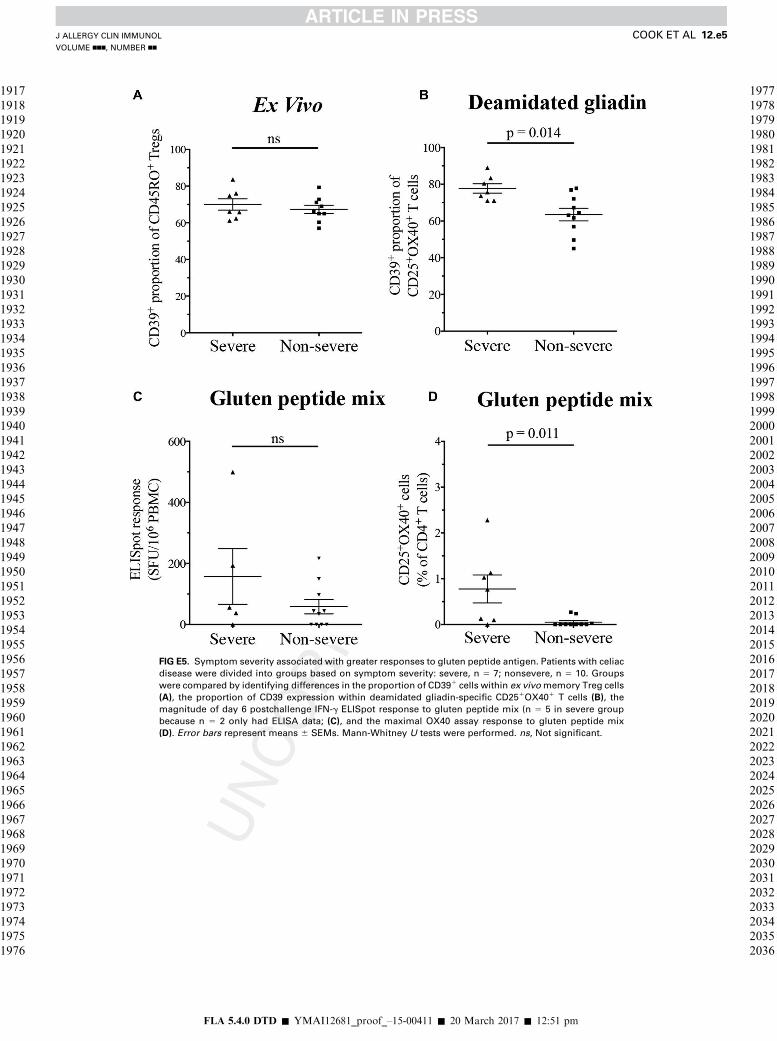
FIG E5. Symptom severity associated with greater responses to gluten peptide antigen. Patients with celiac
disease were divided into groups based on symptom severity: severe, n 5 7; nonsevere, n 5 10. Groups
were compared by identifying differences in the proportion of CD391 cells within ex vivomemory Treg cells
(A), the proportion of CD39 expression within deamidated gliadin-specific CD251OX401 T cells (B), the
magnitude of day 6 postchallenge IFN-g ELISpot response to gluten peptide mix (n 5 5 in severe group
because n 5 2 only had ELISA data; (C), and the maximal OX40 assay response to gluten peptide mix
(D). Error bars represent means 6 SEMs. Mann-Whitney U tests were performed. ns, Not significant.
J ALLERGY CLIN IMMUNOL
VOLUME nnn, NUMBER nn
COOK ET AL 12.e5
FLA 5.4.0 DTD � YMAI12681_proof_–15-00411 � 20 March 2017 � 12:51 pm
1917
1918
1919
1920
1921
1922
1923
1924
1925
1926
1927
1928
1929
1930
1931
1932
1933
1934
1935
1936
1937
1938
1939
1940
1941
1942
1943
1944
1945
1946
1947
1948
1949
1950
1951
1952
1953
1954
1955
1956
1957
1958
1959
1960
1961
1962
1963
1964
1965
1966
1967
1968
1969
1970
1971
1972
1973
1974
1975
1976
1977
1978
1979
1980
1981
1982
1983
1984
1985
1986
1987
1988
1989
1990
1991
1992
1993
1994
1995
1996
1997
1998
1999
2000
2001
2002
2003
2004
2005
2006
2007
2008
2009
2010
2011
2012
2013
2014
2015
2016
2017
2018
2019
2020
2021
2022
2023
2024
2025
2026
2027
2028
2029
2030
2031
2032
2033
2034
2035
2036

TABLE E1. Celiac disease cohort characteristics
ID Age (y) Sex Time since diagnosis tTG IgA (U/mL)* DGP IgA (U/mL)* HLA-DQ Haplotype
0062 66 F 5 y, 9 mo <20 <20 HLA-DQ2.5
0077 48 M 21 y <20 <20 HLA-DQ2.5
0080� 68 F 31 y <20 <20 HLA-DQ2.5
0152� 54 M 1 y, 9 mo <20 <20 HLA-DQ2.5
0159 67 F 14 y, 9 mo <20 <20 HLA-DQ2.5 (homozygous)
0174 51 F 15 y, 7 mo <20 <20 HLA-DQ2.5
0196 60 F 9 y, 3 mo <20 <20 HLA-DQ2.5
0230 53 F 12 y, 9 mo <20 <20 HLA-DQ2.5
0239 71 F 39 y, 3 mo <20 <20 HLA-DQ2.5 (homozygous)
0250 62 M 8 y, 5 mo <20 <20 HLA-DQ2.5
0251� 53 F 8 y, 2 mo <20 <20 HLA-DQ2.5
0505 35 F 34 y, 11 mo <20 <20 HLA-DQ2.2
0506 69 M 2 y, 1 mo <20 <20 HLA-DQ2.5 (heterozygous)
0509 29 F 7 y, 11 mo <20 <20 HLA-DQ2.5 (heterozygous)
0510 38 M 4 y, 11 mo 62 (strongly positive) 27 (weakly positive) HLA-DQ2.5 and HLA-DQ2.2
0512 52 F 1 y, 4 mo <20 29 (weakly positive) HLA-DQ2.5 (heterozygous)
0072 57 F 20 y, 2 mo <20 <20 HLA-DQ2.5 (heterozygous)
Mean 55 71% F
29% M
14 y, 1 mo <20 <20
All data were collected at the time of gluten challenge. All subjects have been on a gluten-free diet since diagnosis.
DGP, Deamidated gliadin peptide; F, female; M, male.
*Normal serology is less than 20 U/mL.
�Indicates subjects analyzed in the pilot study.
J ALLERGY CLIN IMMUNOL
nnn 2017
12.e6 COOK ET AL
FLA 5.4.0 DTD � YMAI12681_proof_–15-00411 � 20 March 2017 � 12:51 pm
2037
2038
2039
2040
2041
2042
2043
2044
2045
2046
2047
2048
2049
2050
2051
2052
2053
2054
2055
2056
2057
2058
2059
2060
2061
2062
2063
2064
2065
2066
2067
2068
2069
2070
2071
2072
2073
2074
2075
2076
2077
2078
2079
2080
2081
2082
2083
2084
2085
2086
2087
2088
2089
2090
2091
2092
2093
2094
2095
2096
2097
2098
2099
2100
2101
2102
2103
2104
2105
2106
2107
2108
2109
2110
2111
2112
2113
2114
2115
2116
2117
2118
2119
2120
2121
2122
2123
2124
2125
2126
2127
2128
2129
2130
2131
2132
2133
2134
2135
2136
2137
2138
2139
2140
2141
2142
2143
2144
2145
2146
2147
2148
2149
2150
2151
2152
2153
2154
2155
2156
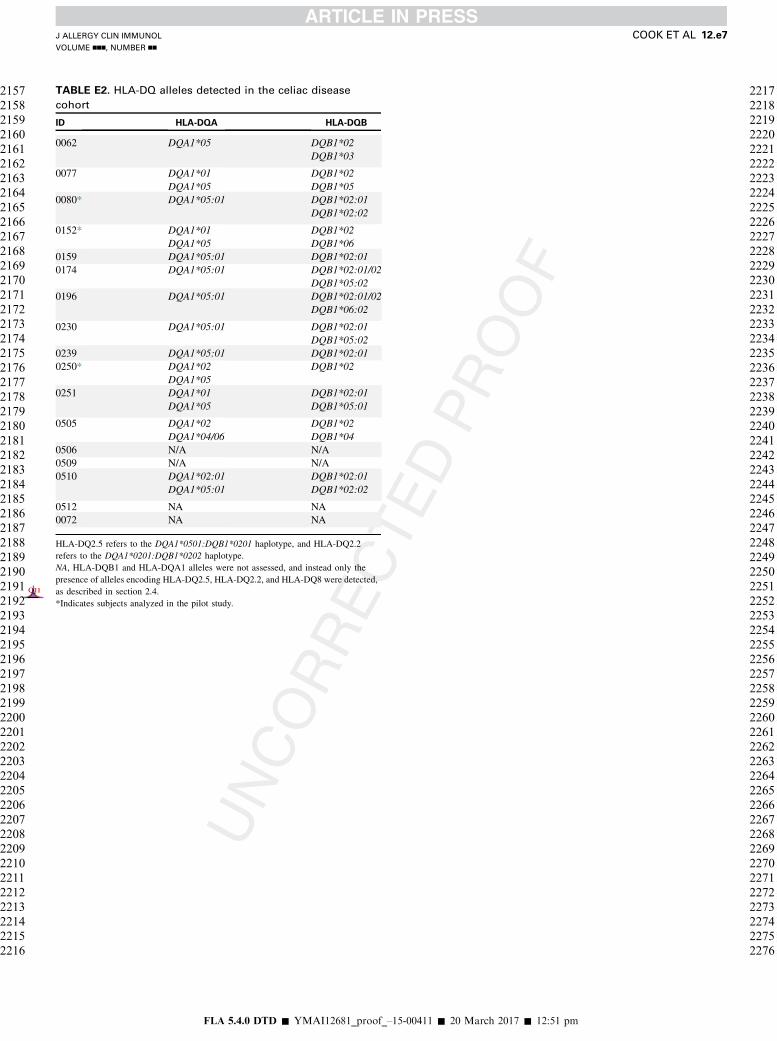
TABLE E2. HLA-DQ alleles detected in the celiac disease
cohort
ID HLA-DQA HLA-DQB
0062 DQA1*05 DQB1*02
DQB1*03
0077 DQA1*01
DQA1*05
DQB1*02
DQB1*05
0080* DQA1*05:01 DQB1*02:01
DQB1*02:02
0152* DQA1*01
DQA1*05
DQB1*02
DQB1*06
0159 DQA1*05:01 DQB1*02:01
0174 DQA1*05:01 DQB1*02:01/02
DQB1*05:02
0196 DQA1*05:01 DQB1*02:01/02
DQB1*06:02
0230 DQA1*05:01 DQB1*02:01
DQB1*05:02
0239 DQA1*05:01 DQB1*02:01
0250* DQA1*02
DQA1*05
DQB1*02
0251 DQA1*01
DQA1*05
DQB1*02:01
DQB1*05:01
0505 DQA1*02
DQA1*04/06
DQB1*02
DQB1*04
0506 N/A N/A
0509 N/A N/A
0510 DQA1*02:01
DQA1*05:01
DQB1*02:01
DQB1*02:02
0512 NA NA
0072 NA NA
HLA-DQ2.5 refers to the DQA1*0501:DQB1*0201 haplotype, and HLA-DQ2.2
refers to the DQA1*0201:DQB1*0202 haplotype.
NA, HLA-DQB1 and HLA-DQA1 alleles were not assessed, and instead only the
presence of alleles encoding HLA-DQ2.5, HLA-DQ2.2, and HLA-DQ8 were detected,
as described in section 2.4.Q11
*Indicates subjects analyzed in the pilot study.
J ALLERGY CLIN IMMUNOL
VOLUME nnn, NUMBER nn
COOK ET AL 12.e7
FLA 5.4.0 DTD � YMAI12681_proof_–15-00411 � 20 March 2017 � 12:51 pm
2157
2158
2159
2160
2161
2162
2163
2164
2165
2166
2167
2168
2169
2170
2171
2172
2173
2174
2175
2176
2177
2178
2179
2180
2181
2182
2183
2184
2185
2186
2187
2188
2189
2190
2191
2192
2193
2194
2195
2196
2197
2198
2199
2200
2201
2202
2203
2204
2205
2206
2207
2208
2209
2210
2211
2212
2213
2214
2215
2216
2217
2218
2219
2220
2221
2222
2223
2224
2225
2226
2227
2228
2229
2230
2231
2232
2233
2234
2235
2236
2237
2238
2239
2240
2241
2242
2243
2244
2245
2246
2247
2248
2249
2250
2251
2252
2253
2254
2255
2256
2257
2258
2259
2260
2261
2262
2263
2264
2265
2266
2267
2268
2269
2270
2271
2272
2273
2274
2275
2276

TABLE E3. Phenotype of in vitro–expanded DQ2.5-glia-a1/a2–specific CD41CD251CD1341CD391 T cells
Molecule Clone C1 (#0174) Clone C2 (#0174) Clone C3 (#0251) CD391 cells (#0174) CD391 cells (#0230) CD391 cells (#0196) CD391 cells (#0251)
CD25 111 111 111 111 111 111 111
CD39 111 111 111 111 111 111 111
FOXP3 1 2 11 1 2 1 1
CTLA-4 111 111 11 111 111 11 111
CD45RO 111 111 111 111 111 111 111
Integrin b7 11 11 11 11 111 1 1
LAP NA NA 111 NA NA 1 1
GARP NA NA 11 NA NA 11 11
Helios NA NA 2 NA NA 2 2
CTLA-4, Cytotoxic T lymphocyte–associated antigen 4; NA, not assessed; 111, expression on greater than 90% of cells; 11, expression on 50% to 90% of cells; 1, expression
on 10% to 50% of cells; 2, expression on less than 10% of cells.
J ALLERGY CLIN IMMUNOL
nnn 2017
12.e8 COOK ET AL
FLA 5.4.0 DTD � YMAI12681_proof_–15-00411 � 20 March 2017 � 12:51 pm
2277
2278
2279
2280
2281
2282
2283
2284
2285
2286
2287
2288
2289
2290
2291
2292
2293
2294
2295
2296
2297
2298
2299
2300
2301
2302
2303
2304
2305
2306
2307
2308
2309
2310
2311
2312
2313
2314
2315
2316
2317
2318
2319
2320
2321
2322
2323
2324
2325
2326
2327
2328
2329
2330
2331
2332
2333
2334
2335
2336
2337
2338
2339
2340
2341
2342
2343
2344
2345
2346
2347
2348
2349
2350
2351
2352
2353
2354
2355
2356
2357
2358
2359
2360
2361
2362
2363
2364
2365
2366
2367
2368
2369
2370
2371
2372
2373
2374
2375
2376
2377
2378
2379
2380
2381
2382
2383
2384
2385
2386
2387
2388
2389
2390
2391
2392
2393
2394
2395
2396