Embed Size (px)
Citation preview
Magn. Reson., 2, 129–138, 2021https://doi.org/10.5194/mr-2-129-2021© Author(s) 2021. This work is distributed underthe Creative Commons Attribution 4.0 License.
Open Access
Four-dimensional NOE-NOE spectroscopy ofSARS-CoV-2 Main Protease to facilitate resonance
assignment and structural analysis
Angus J. Robertson, Jinfa Ying, and Ad BaxLaboratory of Chemical Physics, National Institute of Diabetes and Digestive and Kidney Diseases,
National Institutes of Health, Bethesda, MD 20892, USA
Correspondence: Ad Bax ([email protected])
Received: 11 February 2021 – Discussion started: 22 February 2021Revised: 26 March 2021 – Accepted: 2 April 2021 – Published: 13 April 2021
Abstract. Resonance assignment and structural studies of larger proteins by nuclear magnetic resonance (NMR)can be challenging when exchange broadening, multiple stable conformations, and 1H back-exchange of thefully deuterated chain pose problems. These difficulties arise for the SARS-CoV-2 Main Protease, a homodimerof 2× 306 residues. We demonstrate that the combination of four-dimensional (4D) TROSY-NOESY-TROSYspectroscopy and 4D NOESY-NOESY-TROSY spectroscopy provides an effective tool for delineating the 1H–1H dipolar relaxation network. In combination with detailed structural information obtained from prior X-raycrystallography work, such data are particularly useful for extending and validating resonance assignments aswell as for probing structural features.
1 Introduction
The extension of conventional two-dimensional 1H–1HNMR spectroscopy of natural proteins (Wüthrich, 1986) tothree-dimensional (3D) homonuclear NMR experiments of-fered the ability to simplify spectral analysis by removingresonance overlap (Vuister et al., 1988; Oschkinat et al.,1988) and by providing access to a direct, more detailed anal-ysis of 1H–1H dipolar cross-relaxation networks. In particu-lar, the homonuclear 3D NOE-NOE experiment (Boelens etal., 1989; Breg et al., 1990) not only decreased resonanceoverlap, it also directly elucidated spin-diffusion pathways.This information complemented and validated the elegantrelaxation matrix analysis of spin diffusion (Boelens et al.,1988).
Such homonuclear 1H 3D experiments and analysis strate-gies were soon followed by a myriad of heteronuclear 3Dexperiments that required isotopic enrichment and thereforecloning and bacterial overexpression (Marion et al., 1989b;Zuiderweg and Fesik, 1989; Ikura et al., 1990; Marion etal., 1989a; Wagner, 1993). Most of these heteronuclear ex-periments simply served to disperse the regular 1H–1H 2D
spectrum into a third dimension, thereby removing spec-tral overlap but providing little or no new information onthe all-important 1H–1H spin-diffusion pathways. The 3DNOESY-HMQC experiment (Marion et al., 1989b; Zuider-weg and Fesik, 1989) subsequently was extended to four di-mensions (4D), thereby dispersing the conventional 2D 1H–1H NOESY experiment into two additional dimensions thatcorrespond to the chemical shifts of the nuclei to which eachof the protons is covalently bound (Kay et al., 1990; Clore etal., 1991; Zuiderweg et al., 1991).
These multi-dimensional experiments provided a tremen-dous degree of spectral simplification, in particular after ap-propriate analysis software became available. However, italso quickly became clear that extension to large, slowly tum-bling proteins was hampered by low signal to noise, causedby the relative inefficiency of the magnetization transfer stepswhen the dimensionality of a spectrum is increased. This de-crease in sensitivity was remedied by generating the proteinin a highly perdeuterated state while keeping the solvent-exchangeable backbone amide protons protonated (Torchiaet al., 1988; Lemaster and Richards, 1988). Combining theperdeuteration approach with both the triple-resonance as-
Published by Copernicus Publications on behalf of the Groupement AMPERE.
130 A. J. Robertson et al.: 4D NOE-NOE spectroscopy for protein assignment and structural analysis
signment strategy (Grzesiek et al., 1993) and the subse-quently introduced powerful TROSY line-narrowing method(Pervushin et al., 1997) made it possible to assign and an-alyze the structure of quite large proteins, as exemplifiedby the 723-residue protein malate synthase G (Tugarinov etal., 2002, 2005a). The sensitivity gained by perdeuteration,enabling the recording of 4D 15N-separated NOE spectra,also was key in solving the structure of a HIV-1 accessoryprotein that had been too challenging for analysis by moreconventional methods (Grzesiek et al., 1995). Zhu and co-workers introduced a TROSY-NOESY-TROSY version ofGrzesiek’s 4D NOESY experiment which, illustrated for apartially deuterated 27 kDa protein, yielded further improvedsensitivity and intrinsic 1H and 15N line widths (Xia et al.,2000). Their implementation relied on eight-step phase cy-cling, thereby limiting digitization of the time-domain dataand unable to exploit the improved TROSY relaxation in theindirect dimensions. Diercks et al. (2010) introduced an ele-gant method to suppress diagonal signals from a 4D TROSY-NOESY-TROSY spectrum (Diercks et al., 2010), a particu-larly useful feature when spectral resolution is limited. How-ever, we opted not to use this implementation as, at the longmixing times used, the diagonal resonances serve as conve-nient reference anchors during analysis and are sufficientlyattenuated such as not to obscure nearby peaks in our 4Dspectra that are of very high digital resolution.
In the present report, we merge the above-mentioned prioradvances, 3D NOE-NOE and 3D 15N-separated NOESY,into a 4D experiment. In combination with extensiveperdeuteration and gradient-enhanced encoding to enablea four-step phase cycle as well as non-uniform sampling(NUS) (Rovnyak et al., 2004), the experiments take betteradvantage of the improved resolution afforded by 4D NMR.We demonstrate the utility of the experiments by apply-ing them to the study of the main protease of SARS-CoV-2 (Mpro), which is the virus responsible for coronavirus-2019 disease (COVID-19). Mpro, also known as 3CLpro orNsp5, is a homodimeric cysteine protease of 2× 306 residuesthat does not have closely related mammalian homologuesand is therefore an intense target for drug development,with a promising inhibitor now entered in a phase I clini-cal trial (Boras et al., 2021). Its NMR analysis is challeng-ing, not only for its large size (67.6 kD), but also because ofthe presence of a minor conformer associated with the cis-isomer of one of its 13 Pro residues (P184), the difficulty inback-exchanging all backbone amide protons when the pro-tein is expressed in 2H2O, and the presence of intermedi-ate timescale motions that lead to exchange broadening inthe vicinity of the protein’s active site. Here we focus onan enzyme variant where the catalytic Cys145 residue hasbeen mutated to Ala (Mpro
C145A), a construct that is stable formultiple weeks at the high concentrations required for NMRspectroscopy. The assignment process and a full structuralanalysis of the protein will be presented elsewhere. The fo-cus of the present work is on technical innovations, includ-
ing recording two types of 4D NOE-based NMR spectra thatproved invaluable both for the validation of resonance assign-ments as well as the subsequent structural analysis.
2 Methods and experiments
2.1 Protein production
The gene encoding a C145A variant of Mpro (MproC145A) with
an N-terminal affinity (and solubility) tag was synthesizedby GenScript (USA) and then cloned into a Pet24a+ plasmidbetween BamH1 and Xho1 restriction sites. The fusion pro-tein encoded for 6His tag – GB1–SG rich linker–TEV cleav-age site – Mpro
C145A and was purified according to methodscollectively developed by the COVID-19 NMR consortium(Altincekic, 2021). In brief, following cell culture and har-vesting (see Supplement), the cell lysate was passed downa 6His-affinity column (IMAC) and eluted in a small vol-ume; the solubility tag was cleaved off to generate a na-tive N-terminus; the reaction mix was then passed throughan IMAC column to remove uncleaved protein before sizeseparation on a Sephadex G75 column. The resulting, exten-sively perdeuterated, 2H,15N-Mpro
C145A homodimer was usedfor experiments and, throughout the recombinant protein ex-pression, extensive care was taken to achieve a high (∼ 98 %)level of deuteration of the non-exchangeable hydrogens. Formore details, see the Supplement.
2.2 Recording of NMR data
Spectra were acquired on a sample containing 1.8 mM(0.9 mM dimer) 2H, 15N-Mpro
C145A in 10 mM sodium phos-phate, pH 7.0, 0.5 mM TCEP, 3 % v/v 2H2O and 0.3 mMsodium trimethylsilylpropanesulfonate (DSS; as an internalchemical shift reference), in a 300 µL Shigemi microcell. Allexperiments were recorded at 25 ◦C on an 800 MHz BrukerAvance III spectrometer, equipped with a 5 mm TCI probecontaining a triple-axis gradient accessory, and running Top-Spin software version 3.1.
Considering that the measurements are carried out forperdeuterated protein, the spectral windows in the indirect1H dimensions were limited to the region downfield fromthe water resonance, and EBURP2 pulses (Geen and Free-man, 1991) were used where needed to prevent excitation ofprotons outside of this region. For the 4D TROSY-NOESY-TROSY experiment (Fig. 1a), only a small fraction (0.54 %)of the full data matrix, consisting of 1536* (1H, t4, 119.8 ms)× 90* (15N, t3, 35.1 ms) × 91* (1H, t2, 20.0 ms) × 90* (15N,t1, 35.1 ms) complex points, was recorded (Table S1 in theSupplement) using nonuniform sampling for the indirect di-mensions. Selection of the sampled data points was un-weighted, randomly distributed, and without time ordering.The sampling schedule (included in the uploaded data sets;see Data availability) was automatically generated by Top-spin 3.1 when the experiment started, with the random seed
Magn. Reson., 2, 129–138, 2021 https://doi.org/10.5194/mr-2-129-2021
A. J. Robertson et al.: 4D NOE-NOE spectroscopy for protein assignment and structural analysis 131
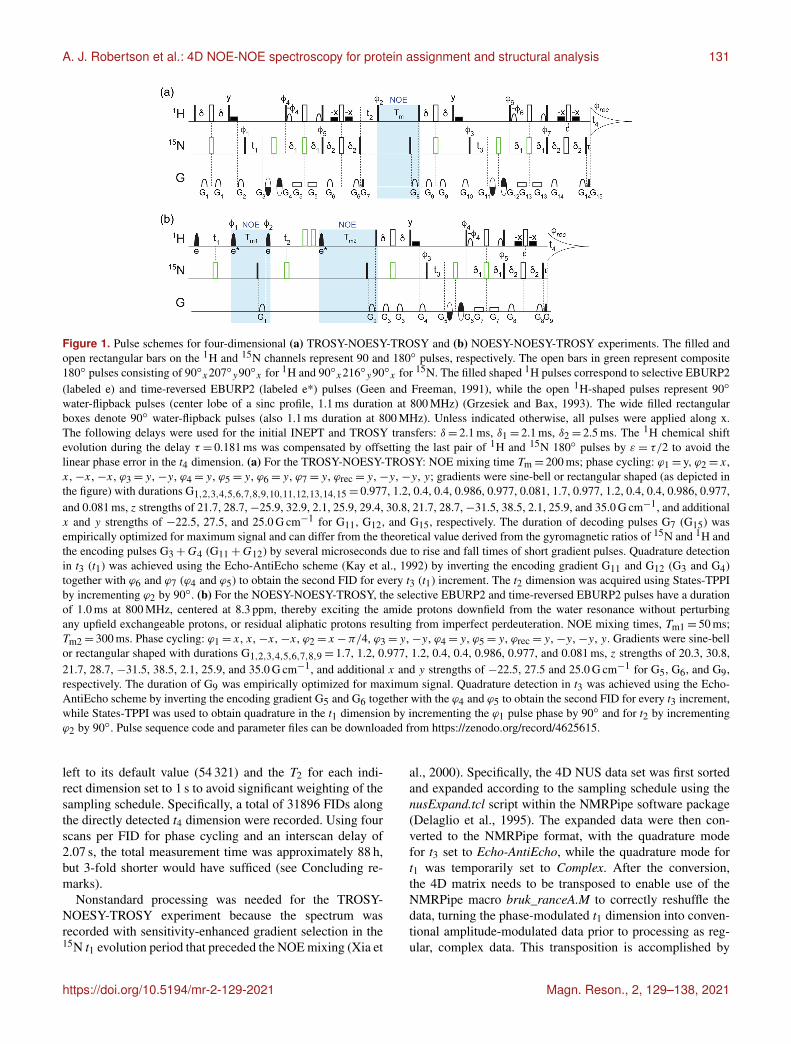
Figure 1. Pulse schemes for four-dimensional (a) TROSY-NOESY-TROSY and (b) NOESY-NOESY-TROSY experiments. The filled andopen rectangular bars on the 1H and 15N channels represent 90 and 180◦ pulses, respectively. The open bars in green represent composite180◦ pulses consisting of 90◦x207◦y90◦x for 1H and 90◦x216◦y90◦x for 15N. The filled shaped 1H pulses correspond to selective EBURP2(labeled e) and time-reversed EBURP2 (labeled e*) pulses (Geen and Freeman, 1991), while the open 1H-shaped pulses represent 90◦
water-flipback pulses (center lobe of a sinc profile, 1.1 ms duration at 800 MHz) (Grzesiek and Bax, 1993). The wide filled rectangularboxes denote 90◦ water-flipback pulses (also 1.1 ms duration at 800 MHz). Unless indicated otherwise, all pulses were applied along x.The following delays were used for the initial INEPT and TROSY transfers: δ= 2.1 ms, δ1= 2.1 ms, δ2= 2.5 ms. The 1H chemical shiftevolution during the delay τ = 0.181 ms was compensated by offsetting the last pair of 1H and 15N 180◦ pulses by ε = τ/2 to avoid thelinear phase error in the t4 dimension. (a) For the TROSY-NOESY-TROSY: NOE mixing time Tm= 200 ms; phase cycling: ϕ1= y, ϕ2= x,x, −x, −x, ϕ3= y, −y, ϕ4= y, ϕ5= y, ϕ6= y, ϕ7= y, ϕrec= y, −y, −y, y; gradients were sine-bell or rectangular shaped (as depicted inthe figure) with durations G1,2,3,4,5,6,7,8,9,10,11,12,13,14,15= 0.977, 1.2, 0.4, 0.4, 0.986, 0.977, 0.081, 1.7, 0.977, 1.2, 0.4, 0.4, 0.986, 0.977,and 0.081 ms, z strengths of 21.7, 28.7,−25.9, 32.9, 2.1, 25.9, 29.4, 30.8, 21.7, 28.7,−31.5, 38.5, 2.1, 25.9, and 35.0 G cm−1, and additionalx and y strengths of −22.5, 27.5, and 25.0 G cm−1 for G11, G12, and G15, respectively. The duration of decoding pulses G7 (G15) wasempirically optimized for maximum signal and can differ from the theoretical value derived from the gyromagnetic ratios of 15N and 1H andthe encoding pulses G3+G4 (G11+G12) by several microseconds due to rise and fall times of short gradient pulses. Quadrature detectionin t3 (t1) was achieved using the Echo-AntiEcho scheme (Kay et al., 1992) by inverting the encoding gradient G11 and G12 (G3 and G4)together with ϕ6 and ϕ7 (ϕ4 and ϕ5) to obtain the second FID for every t3 (t1) increment. The t2 dimension was acquired using States-TPPIby incrementing ϕ2 by 90◦. (b) For the NOESY-NOESY-TROSY, the selective EBURP2 and time-reversed EBURP2 pulses have a durationof 1.0 ms at 800 MHz, centered at 8.3 ppm, thereby exciting the amide protons downfield from the water resonance without perturbingany upfield exchangeable protons, or residual aliphatic protons resulting from imperfect perdeuteration. NOE mixing times, Tm1= 50 ms;Tm2= 300 ms. Phase cycling: ϕ1= x, x, −x, −x, ϕ2= x−π/4, ϕ3= y, −y, ϕ4= y, ϕ5= y, ϕrec= y, −y, −y, y. Gradients were sine-bellor rectangular shaped with durations G1,2,3,4,5,6,7,8,9= 1.7, 1.2, 0.977, 1.2, 0.4, 0.4, 0.986, 0.977, and 0.081 ms, z strengths of 20.3, 30.8,21.7, 28.7, −31.5, 38.5, 2.1, 25.9, and 35.0 G cm−1, and additional x and y strengths of −22.5, 27.5 and 25.0 G cm−1 for G5, G6, and G9,respectively. The duration of G9 was empirically optimized for maximum signal. Quadrature detection in t3 was achieved using the Echo-AntiEcho scheme by inverting the encoding gradient G5 and G6 together with the ϕ4 and ϕ5 to obtain the second FID for every t3 increment,while States-TPPI was used to obtain quadrature in the t1 dimension by incrementing the ϕ1 pulse phase by 90◦ and for t2 by incrementingϕ2 by 90◦. Pulse sequence code and parameter files can be downloaded from https://zenodo.org/record/4625615.
left to its default value (54 321) and the T2 for each indi-rect dimension set to 1 s to avoid significant weighting of thesampling schedule. Specifically, a total of 31896 FIDs alongthe directly detected t4 dimension were recorded. Using fourscans per FID for phase cycling and an interscan delay of2.07 s, the total measurement time was approximately 88 h,but 3-fold shorter would have sufficed (see Concluding re-marks).
Nonstandard processing was needed for the TROSY-NOESY-TROSY experiment because the spectrum wasrecorded with sensitivity-enhanced gradient selection in the15N t1 evolution period that preceded the NOE mixing (Xia et
al., 2000). Specifically, the 4D NUS data set was first sortedand expanded according to the sampling schedule using thenusExpand.tcl script within the NMRPipe software package(Delaglio et al., 1995). The expanded data were then con-verted to the NMRPipe format, with the quadrature modefor t3 set to Echo-AntiEcho, while the quadrature mode fort1 was temporarily set to Complex. After the conversion,the 4D matrix needs to be transposed to enable use of theNMRPipe macro bruk_ranceA.M to correctly reshuffle thedata, turning the phase-modulated t1 dimension into conven-tional amplitude-modulated data prior to processing as reg-ular, complex data. This transposition is accomplished by
https://doi.org/10.5194/mr-2-129-2021 Magn. Reson., 2, 129–138, 2021
132 A. J. Robertson et al.: 4D NOE-NOE spectroscopy for protein assignment and structural analysis
reading in the NMRPipe-formatted matrix with the z axisalong the t2 dimension, application of the macro, and restor-ing the data to its original axis order prior to regular process-ing, with the full script included with the raw time-domaindata sets (see Data availability). For the processing, the di-rect dimension was apodized with a squared, shifted sine-bellwindow, spanning from 72 to 176.4◦, whereas an additional15 Hz exponential line broadening was used to better matchthe apodization window to the natural decay of the signal,thereby improving the signal-to-noise ratio (S/N ). This wasfollowed by zero filling and Fourier transformation. Subse-quently, the indirect data points that were not experimentallysampled were reconstructed using the SMILE (Ying et al.,2017) program, and the reconstructed data were further pro-cessed in NMRPipe. To enhance the spectral resolution, bydefault the acquisition times in all indirect dimensions wereextended by 50 % during the SMILE reconstruction, leadingto an effective sampling sparsity of 0.16 %. The data matrixfor the final reconstructed 4D spectrum consists of 614 (1H,F4, 6.3 Hz per point)× 512 (15N, F3, 5.0 Hz per point)× 512(1H, F2, 8.9 Hz per point) × 512 (15N, F1, 5.0 Hz per point)real points (see Table S1).
The full time-domain data matrix of the 4D NOESY-NOESY-TROSY experiment (Fig. 1b) consists of 1536* (1H,t4, 95.8 ms) × 90* (15N, t3, 35.1 ms) × 60* (1H, t2, 12.0 ms)× 60* (1H, t1, 12.0 ms) complex points (Table S1). An un-weighted, random NUS sampling scheme with a sparsity of1.69 % (corresponding to 43 856 t4 FIDs) was used to recorda small subset of the data points. Using an interscan delay of1.77 s and four scans per FID, the total experimental time wasapproximately 110 h, but 3-fold shorter would have sufficed(see Concluding remarks). The data were processed and re-constructed in the same manner as described above with 50 %extension of all indirect dimensions during the SMILE re-construction, resulting in an effective sparsity of 0.50 % anda final spectral matrix size of 492 (1H, F4, 7.8 Hz per point)× 512 (15N, F3, 4.7 Hz per point) × 512 (1H, F2, 13.9 Hzper point) × 512 (1H, F1, 13.9 Hz per point) real points (Ta-ble S1). Note that since in the NOESY-NOESY-TROSY ex-periment the data were recorded using the Echo-AntiEchomode (Kay et al., 1992) only in the t3 dimension, immedi-ately preceding acquisition, the bruk_ranceA.M macro wasnot needed after the conversion of the expanded NUS data.The residual in-phase axial peaks along the F2 dimensionwere treated as real peaks and optimally reconstructed bySMILE to suppress the sampling artifacts of the axial signalsfrom spreading to the regions with NOE peaks. The process-ing macros used for both 4D spectra are included with theraw time-domain data (see Data availability).
2.3 Spectrum analysis
Spectra were processed using NMRPipe software (Delaglioet al., 1995); peak picking and spectrum analysis was per-formed using SPARKY software (Goddard and Kneller,
2008; Lee et al., 2015) as well as NMRDraw (Delaglio et al.,1995). Programs for visualization and analysis were writtenusing freely available python libraries (Hunter, 2007; Harriset al., 2020) as well as NMR-specific python libraries (Hel-mus and Jaroniec, 2013).
3 Results and discussion
Two types of complementary 4D NOE experiments wererecorded: (1) 4D TROSY-NOESY-TROSY and (2) 4DNOESY-NOESY-TROSY (Fig. 1). While the former is verysimilar to the HMQC-NOESY-TROSY experiment usedrecently for a single α-helical domain with a long ro-tational correlation time (Barnes et al., 2019), the 4DNOESY-NOESY-TROSY experiment extends earlier workby Kaptein and co-workers (Boelens et al., 1989; Breg et al.,1990).
3.1 Recording and analysis of the 4DTROSY-NOESY-TROSY spectrum
The rotational correlation time of the C145A variant of Mpro
(MproC145A) at 25 ◦C is ca. 27 ns, and consequently, transverse
relaxation is rapid for both 15N and 1HN nuclei. For thisreason, it proved beneficial to substitute a TROSY elementfor the HMQC or HSQC segment that was previously usedfor such measurements (Kay et al., 1990; Barnes et al.,2019). Even though the TROSY element only utilizes halfof the amide 1HN magnetization present at the start of thepulse sequence, combining its 15N evolution with sensitivity-enhanced gradient selection during the subsequent t2 evolu-tion period (Fig. 1a) limits the loss to
√2 or even somewhat
less when taking the gain from the 15N Boltzmann magne-tization into account (Pervushin et al., 1998). A 2D TROSYspectrum (Fig. S1) of this sample allowed identification of261 backbone amide peaks out of 293 non-proline residues,suggesting the feasibility of implementing the TROSY ver-sion of the 4D NOESY experiment. Conformational ex-change on a timescale that results in extensive line broaden-ing and incomplete back-exchange of amides when the pro-tein was purified in 1H2O are the primary causes of the ab-sence of the ca. 30 amide signals.
The high quality and S/N of the TROSY-HSQC spec-trum (Fig. 2b) suggested the feasibility of implementing theTROSY version of the 4D NOESY experiment. Combinedwith the enhanced relaxation properties during t1 and t2 evo-lution of the TROSY-selected coherence, we found exper-imentally that spectral quality attainable for Mpro
C145A withthe 4D TROSY-NOESY-TROSY was better than with theHMQC-NOESY-TROSY version of the experiment, consis-tent with the previous report that the TROSY implementa-tion improved both the sensitivity and resolution over the 4DHSQC-NOESY-HSQC (Xia et al., 2000). Figure 2 shows ex-panded regions of six (F1, F2) cross sections through the4D spectrum, each orthogonal to the (F3, F4) frequencies
Magn. Reson., 2, 129–138, 2021 https://doi.org/10.5194/mr-2-129-2021
A. J. Robertson et al.: 4D NOE-NOE spectroscopy for protein assignment and structural analysis 133
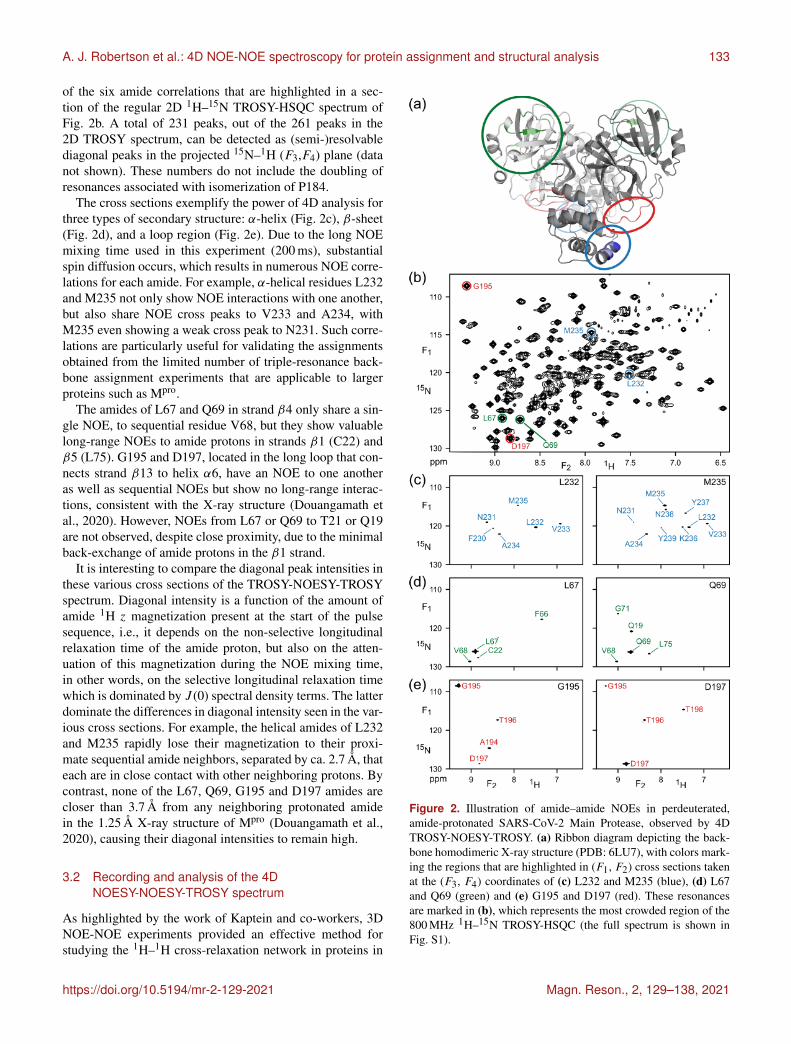
of the six amide correlations that are highlighted in a sec-tion of the regular 2D 1H–15N TROSY-HSQC spectrum ofFig. 2b. A total of 231 peaks, out of the 261 peaks in the2D TROSY spectrum, can be detected as (semi-)resolvablediagonal peaks in the projected 15N–1H (F3,F4) plane (datanot shown). These numbers do not include the doubling ofresonances associated with isomerization of P184.
The cross sections exemplify the power of 4D analysis forthree types of secondary structure: α-helix (Fig. 2c), β-sheet(Fig. 2d), and a loop region (Fig. 2e). Due to the long NOEmixing time used in this experiment (200 ms), substantialspin diffusion occurs, which results in numerous NOE corre-lations for each amide. For example, α-helical residues L232and M235 not only show NOE interactions with one another,but also share NOE cross peaks to V233 and A234, withM235 even showing a weak cross peak to N231. Such corre-lations are particularly useful for validating the assignmentsobtained from the limited number of triple-resonance back-bone assignment experiments that are applicable to largerproteins such as Mpro.
The amides of L67 and Q69 in strand β4 only share a sin-gle NOE, to sequential residue V68, but they show valuablelong-range NOEs to amide protons in strands β1 (C22) andβ5 (L75). G195 and D197, located in the long loop that con-nects strand β13 to helix α6, have an NOE to one anotheras well as sequential NOEs but show no long-range interac-tions, consistent with the X-ray structure (Douangamath etal., 2020). However, NOEs from L67 or Q69 to T21 or Q19are not observed, despite close proximity, due to the minimalback-exchange of amide protons in the β1 strand.
It is interesting to compare the diagonal peak intensities inthese various cross sections of the TROSY-NOESY-TROSYspectrum. Diagonal intensity is a function of the amount ofamide 1H z magnetization present at the start of the pulsesequence, i.e., it depends on the non-selective longitudinalrelaxation time of the amide proton, but also on the atten-uation of this magnetization during the NOE mixing time,in other words, on the selective longitudinal relaxation timewhich is dominated by J (0) spectral density terms. The latterdominate the differences in diagonal intensity seen in the var-ious cross sections. For example, the helical amides of L232and M235 rapidly lose their magnetization to their proxi-mate sequential amide neighbors, separated by ca. 2.7 Å, thateach are in close contact with other neighboring protons. Bycontrast, none of the L67, Q69, G195 and D197 amides arecloser than 3.7 Å from any neighboring protonated amidein the 1.25 Å X-ray structure of Mpro (Douangamath et al.,2020), causing their diagonal intensities to remain high.
3.2 Recording and analysis of the 4DNOESY-NOESY-TROSY spectrum
As highlighted by the work of Kaptein and co-workers, 3DNOE-NOE experiments provided an effective method forstudying the 1H–1H cross-relaxation network in proteins in
Figure 2. Illustration of amide–amide NOEs in perdeuterated,amide-protonated SARS-CoV-2 Main Protease, observed by 4DTROSY-NOESY-TROSY. (a) Ribbon diagram depicting the back-bone homodimeric X-ray structure (PDB: 6LU7), with colors mark-ing the regions that are highlighted in (F1, F2) cross sections takenat the (F3, F4) coordinates of (c) L232 and M235 (blue), (d) L67and Q69 (green) and (e) G195 and D197 (red). These resonancesare marked in (b), which represents the most crowded region of the800 MHz 1H–15N TROSY-HSQC (the full spectrum is shown inFig. S1).
https://doi.org/10.5194/mr-2-129-2021 Magn. Reson., 2, 129–138, 2021
134 A. J. Robertson et al.: 4D NOE-NOE spectroscopy for protein assignment and structural analysis
more detail. Here, we extend this powerful experiment tofour dimensions, making it more straightforward to analyzesuch a spectrum while limiting the relaxation pathways byperdeuteration of the protein.
The pulse scheme of this 4D NOESY-NOESY-TROSYis shown in Fig. 1b. It represents a straightforward exten-sion of the original NOE-NOE 3D experiment (Boelens etal., 1989) but with the detection period substituted by thegradient-enhanced 2D 1H–15N TROSY scheme (Pervushinet al., 1998). The latter enhances the attainable spectral res-olution in the t3 and t4 dimensions, while dispersing the de-tected 1HN resonances in the 15N dimension. A number ofminor technical considerations are also relevant in this re-spect. (1) First, in order to maximize the number of (t1, t2, t3)data points sampled, the phase cycling of the 4D experimentwas reduced to four steps, and the observed spectral win-dow was restricted to the region downfield of the H2O reso-nance. To prevent bleeding in of several weaker imperfectlydeuterated aliphatic or exchangeable resonances present inthe upfield spectral region, selective-EBURP2 and reverse-EBURP2 pulses (Geen and Freeman, 1991) were used toalso restrict the regions where 1H resonances were excitedto those resonating downfield from the water resonance. Asa result, no NOE peaks from a few amide protons resonatingnear water or upfield from water were observed. (2) Record-ing of a 4D NMR spectrum at adequate resolution requiresthe use of non-uniform sampling. High quality NUS recon-struction of a 4D NMR spectrum can be accomplished bythe SMILE program (Ying et al., 2017) but this as wellas most other NUS reconstruction software performs bet-ter if the various time domains are acquired in a mannerthat results in either a 0◦ or a 180◦ linear phase correctionacross the spectrum. For this purpose, and to ensure that thenon-suppressed axial peaks can be optimally reconstructed,which requires 0◦ linear phase correction, it was preferableto insert a non-selective 90◦x207◦y90◦x composite 1H inver-sion pulse (highlighted as the green open bar in Fig. 1b), fol-lowed by a second such pulse that reverses any phase imper-fections introduced by the first composite pulse (Hwang etal., 1997). Specifically, the ϕ1 phase cycling serves to elimi-nate axial peaks in the t1 dimension caused by pulse imper-fection as well as T1 relaxation and amide exchange with sol-vent during Tm1, while also suppressing axial peaks in the t2dimension resulting from T1 relaxation and water exchangeduring Tm2. To minimize the number of phase cycling steps,ϕ2 was not phase cycled. However, this resulted in smallresidual axial peaks along the F2 dimension caused by pulseimperfections. To ensure that these residual axial peaks wereabsorptive in the final spectrum, thereby simplifying SMILENUS reconstruction, an echo is generated by the applicationof two composite 1H 180◦ pulses in order to suppress ini-tial chemical shift evolution at t2 = 0, thereby eliminatingthe need for a linear phase correction. Considering that thereal and imaginary components of the residual axial signalshave the same amplitude, they result in a 45◦ phase error for
the axial peaks in the F2 dimension. Shifting the ϕ2 phaseby −45◦ ensures that the NOE and axial peaks both can bephased absorptive using the same phase correction, thus fa-cilitating NUS processing.
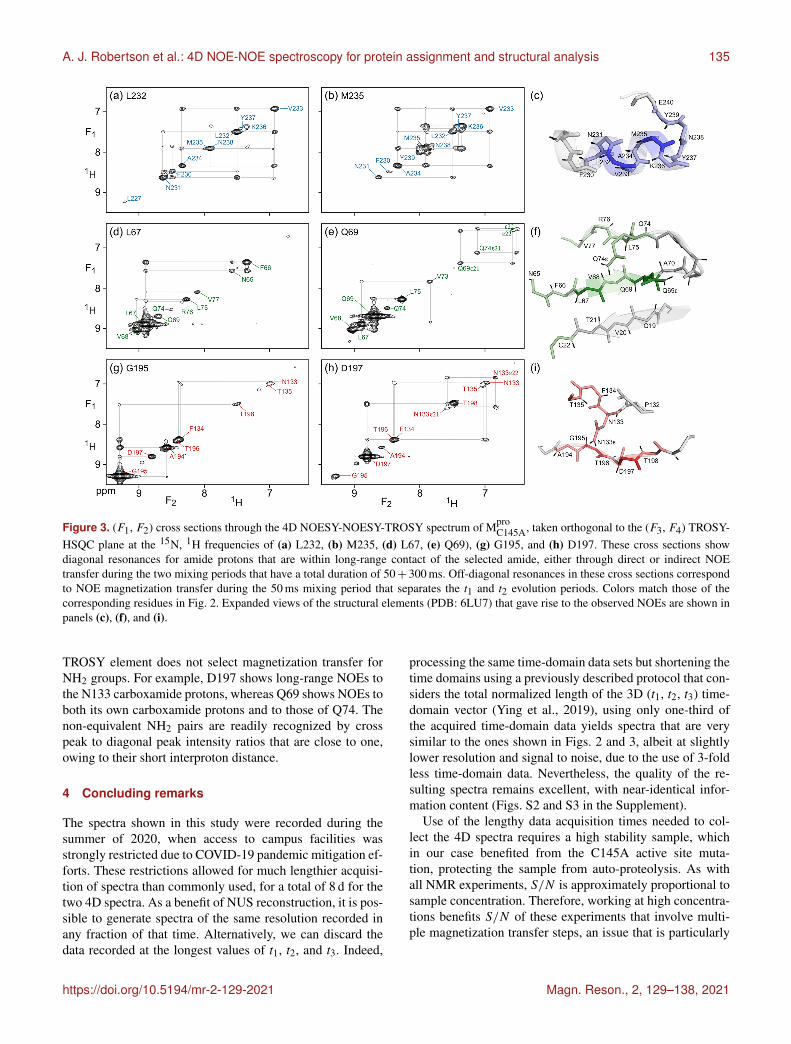
Compared to the 4D TROSY-NOESY-TROSY pulsescheme, the 4D NOESY-NOESY-TROSY experiment avoidsthe lossy magnetization transfer step from 1H to 15N andback (leading to a slightly larger number of 241 diagonalpeaks on the 15N–1H (F3, F4) projected plane, comparedto 231 for TROSY-NOESY-TROSY). Instead, its magneti-zation is simply transferred, in part, to its nearest neighborsby cross-relaxation during the first NOE mixing period ofduration Tm1 = 50 ms. There is virtually no loss in total spinpolarization summed over the initial “starting spin”, whoset1 evolution is monitored, and those of its immediate neigh-bors that are within cross-relaxation contact. As a result, theintrinsic sensitivity of such NOESY-NOESY-TROSY mea-surements is quite high, allowing the choice of a long dura-tion of 300 ms for the second NOE mixing time, Tm2. Duringthis second, much longer mixing time, the z magnetizationdistributes over considerable distances due to indirect trans-fers (Fig. 3). Even in this extensively perdeuterated protein,NOEs to nearly a dozen neighboring protons are observed onthe diagonals of the (F1, F2) cross sections, taken at the same(15N, 1H) frequencies used for illustrating the utility of the4D TROSY-NOESY-TROSY spectrum of Fig. 2. However,as pointed out by Boelens et al. (1989) and Breg et al. (1990),the NOE-NOE combination offers a wealth of new informa-tion on the cross-relaxation pathways that led to the long-distance NOEs, substantially aiding both the assignment andanalysis of distance information. Below, we briefly highlighta few examples.
As expected, α-helical residue L232 shows intense crosspeaks to both of its sequential neighbors, N231 and V233,as well as a weaker cross peak to F230. Despite the rela-tively short mixing time of only 50 ms that separates t1 andt2 evolution, the latter must result mostly from indirect trans-fer through N231, because N231 and F230 share an intensecross peak. So in effect, each cross section through the 4Dspectrum shown in Fig. 3 corresponds to a 2D NOESY spec-trum of a small, localized, region within the protein struc-ture – making its analysis far simpler. For residues with fewneighbors, direct NOE contacts between neighbors separatedby as much as 4.5 Å give rise to quite intense cross peaksafter 50 ms NOE mixing, as exemplified by the contacts be-tween G195 and its A194 and T196 neighbors (Fig. 3g). Aweaker cross peak between G195 and D197, at an interprotondistance of 6.4 Å, appears not to be mediated by spin diffu-sion because the G195 and D197 panels (Fig. 3g) show nocommon strong NOE to any visible resonance. However, thepossibility that the hydroxyl proton of T196 serves as a relaypartner cannot be excluded.
The NOESY-NOESY-TROSY spectrum also shows mul-tiple NOEs to sidechain amide protons that are not visi-ble in the TROSY-NOESY-TROSY spectrum because the
Magn. Reson., 2, 129–138, 2021 https://doi.org/10.5194/mr-2-129-2021
A. J. Robertson et al.: 4D NOE-NOE spectroscopy for protein assignment and structural analysis 135
Figure 3. (F1, F2) cross sections through the 4D NOESY-NOESY-TROSY spectrum of MproC145A, taken orthogonal to the (F3, F4) TROSY-
HSQC plane at the 15N, 1H frequencies of (a) L232, (b) M235, (d) L67, (e) Q69), (g) G195, and (h) D197. These cross sections showdiagonal resonances for amide protons that are within long-range contact of the selected amide, either through direct or indirect NOEtransfer during the two mixing periods that have a total duration of 50+ 300 ms. Off-diagonal resonances in these cross sections correspondto NOE magnetization transfer during the 50 ms mixing period that separates the t1 and t2 evolution periods. Colors match those of thecorresponding residues in Fig. 2. Expanded views of the structural elements (PDB: 6LU7) that gave rise to the observed NOEs are shown inpanels (c), (f), and (i).
TROSY element does not select magnetization transfer forNH2 groups. For example, D197 shows long-range NOEs tothe N133 carboxamide protons, whereas Q69 shows NOEs toboth its own carboxamide protons and to those of Q74. Thenon-equivalent NH2 pairs are readily recognized by crosspeak to diagonal peak intensity ratios that are close to one,owing to their short interproton distance.
4 Concluding remarks
The spectra shown in this study were recorded during thesummer of 2020, when access to campus facilities wasstrongly restricted due to COVID-19 pandemic mitigation ef-forts. These restrictions allowed for much lengthier acquisi-tion of spectra than commonly used, for a total of 8 d for thetwo 4D spectra. As a benefit of NUS reconstruction, it is pos-sible to generate spectra of the same resolution recorded inany fraction of that time. Alternatively, we can discard thedata recorded at the longest values of t1, t2, and t3. Indeed,
processing the same time-domain data sets but shortening thetime domains using a previously described protocol that con-siders the total normalized length of the 3D (t1, t2, t3) time-domain vector (Ying et al., 2019), using only one-third ofthe acquired time-domain data yields spectra that are verysimilar to the ones shown in Figs. 2 and 3, albeit at slightlylower resolution and signal to noise, due to the use of 3-foldless time-domain data. Nevertheless, the quality of the re-sulting spectra remains excellent, with near-identical infor-mation content (Figs. S2 and S3 in the Supplement).
Use of the lengthy data acquisition times needed to col-lect the 4D spectra requires a high stability sample, whichin our case benefited from the C145A active site muta-tion, protecting the sample from auto-proteolysis. As withall NMR experiments, S/N is approximately proportional tosample concentration. Therefore, working at high concentra-tions benefits S/N of these experiments that involve multi-ple magnetization transfer steps, an issue that is particularly
https://doi.org/10.5194/mr-2-129-2021 Magn. Reson., 2, 129–138, 2021
136 A. J. Robertson et al.: 4D NOE-NOE spectroscopy for protein assignment and structural analysis
important for NOE experiments where magnetization from asingle nucleus is distributed over many neighbors.
We note that the TROSY-NOESY-TROSY experimentused a long NOE mixing time of 200 ms, such as to in-crease the number of observed connectivities by adding indi-rect NOE effects, including spin diffusion through hydroxylprotons (Koharudin et al., 2003), thereby aiding the assign-ment process. The use of a 50 ms NOE mixing period in thesubsequent 4D NOESY-NOESY-TROSY experiment thenprovided a semi-quantitative measure of distance betweenthese protons and their neighbors. Indeed, as pointed outby Kaptein and co-workers, recording of NOE-NOE spec-tra provides important experimental data on the pathway ofmagnetization transfer during NOE mixing. Such informa-tion could be used to convert these data into more quantita-tive distance information than the typical qualitative analy-sis of NOE intensities, potentially leading to the generationof higher resolution structures (Vogeli et al., 2009, 2012).Quantitative NOE interpretation traditionally relied on therecording of a series of NOE buildup data, which can be-come comparably time-consuming as the recording of 4DNMR spectra if resonance overlap is a limiting factor, astypically is the case for NOE spectra. This problem is fur-ther exacerbated by the spectral crowding of large proteins,particularly in the 1H dimension, and while 3D spectra maygive higher signal-to-noise ratios than 4D spectra, down-stream analysis frequently requires extensive disambiguationof overlapped peaks. Our study of Mpro
C145A shows that a largenumber of semi-quantitative NOE distances become acces-sible by recording of 4D NMR spectra on a perdeuteratedlarger protein with little or no ambiguity about the nuclei in-volved.
While the high signal to noise and spectral simplicity ofworking with perdeuterated proteins has long been recog-nized (Torchia et al., 1988; Lemaster and Richards, 1988;Grzesiek et al., 1993; Tugarinov et al., 2004) the number ofstructural restraints accessible used to be small. Our presentstudy demonstrates that a much larger number of NOE in-teractions becomes available by the recording of 4D NOEspectra. Moreover, it highlights the exquisite detail and valueof NOE-NOE interaction analysis explored by the Kapteingroup and it demonstrates that this approach is highly suit-able for the larger biomolecules and biomolecular complexesbeing explored today, in particular when using extensiveperdeuteration. Therefore, we believe that the recording ofhigh quality 4D NMR spectra of the type presented in thisstudy is entirely practical and invaluable for the structuraland functional analysis of large proteins and their complexes,with possible extension to the study of nucleic acids. Wenote, however, that in the absence of extensive deuterationthe dilution of nuclear magnetization over sidechain reso-nances will strongly lower the sensitivity of the experiment,which is further exacerbated by decreased effectiveness ofTROSY-based line narrowing in such samples. On the otherhand, adaptations of the NOESY-NOESY-TROSY experi-
ment to methyl-protonated but otherwise perdeuterated pro-teins (Tugarinov et al., 2005b) are expected to be readily fea-sible.
Data availability. The raw Bruker NMR data sets including theacquisition parameters and NUS sampling lists, pulse programs, in-clude file, and NMRPipe processing scripts are available for down-load from Zenodo: https://zenodo.org/record/4625615 (Robertsonet al., 2021).
Supplement. The supplement related to this article is availableonline at: https://doi.org/10.5194/mr-2-129-2021-supplement.
Author contributions. AJR expressed and purified protein sam-ples, collected and analyzed the data, and edited the manuscript;JY optimized pulse sequence parameterization and processing andedited the manuscript; AB supervised the project and wrote themanuscript.
Competing interests. The authors declare that they have no con-flict of interest.
Special issue statement. This article is part of the special issue“Robert Kaptein Festschrift”. It is not associated with a conference.
Acknowledgements. We thank John M. Louis, Joseph Courtney,Yang Shen, James L. Baber and Dennis A. Torchia for helpful dis-cussions. This work was supported by the Intramural Research Pro-gram of the NIDDK and by the Intramural Antiviral Target Programof the Office of the Director, NIH.
This study is dedicated to Robert Kaptein on the occasion of his80th birthday.
Financial support. This research has been supported by the Na-tional Institute of Diabetes and Digestive and Kidney Diseases(grant nos. DK075023 and DK029046).
Review statement. This paper was edited by Isabella Felli andreviewed by four anonymous referees.
References
Altincekic, N.: Large-scale recombinant production of the SARS-CoV-2 proteome for high-throughput and structural biol-ogy applications, Frontiers in Molecular Biosciences, ac-cepted, available at: https://covid19-nmr.de/publications/large-scale- recombinant-production-of-the-sars-cov-2-proteome-for-high-throughput-and-structural-biology-applications/, last ac-cess: 12 April 2021.
Magn. Reson., 2, 129–138, 2021 https://doi.org/10.5194/mr-2-129-2021
A. J. Robertson et al.: 4D NOE-NOE spectroscopy for protein assignment and structural analysis 137
Barnes, C. A., Shen, Y., Ying, J. F., Takagi, Y., Torchia, D.A., Sellers, J. R., and Bax, A.: Remarkable Rigidity of theSingle alpha-Helical Domain of Myosin-VI As Revealed byNMR Spectroscopy, J. Am. Chem. Soc., 141, 9004–9017,https://doi.org/10.1021/jacs.9b03116, 2019.
Boelens, R., Koning, T. M. G., and Kaptein, R.: Determination ofBiomolecular Structures From Proton-Proton Noes Using a Re-laxation Matrix Approach, J. Mol. Struct., 173, 299–311, 1988.
Boelens, R., Vuister, G. W., Koning, T. M. G., and Kaptein, R.:Observation of spin diffusion in biomolecules by 3-dimensionalNOE-NOE spectroscopy, J. Am. Chem. Soc., 111, 8525–8526,https://doi.org/10.1021/ja00204a039, 1989.
Boras, B., Jones, R. M., Anson, B. J., Arenson, D., Aschenbrenner,L., Bakowski, M. A., Beutler, N., Binder, J., Chen, E., Eng, H.,Hammond, H., Hammond, J., Haupt, R. E., Hoffman, R., Kadar,E. P., Kania, R., Kimoto, E., Kirkpatrick, M. G., Lanyon, L.,Lendy, E. K., Lillis, J. R., Logue, J., Luthra, S. A., Ma, C., Ma-son, S. W., McGrath, M. E., Noell, S., Obach, R. S., O’Brien,M. N., O’Connor, R., Ogilvie, K., Owen, D., Pettersson, M.,Reese, M. R., Rogers, T. F., Rossulek, M. I., Sathish, J. G.,Shirai, N., Steppan, C., Ticehurst, M., Updyke, L. W., Weston,S., Zhu, Y., Wang, J., Chatterjee, A. K., Mesecar, A. D., Frie-man, M. B., Anderson, A. S., and Allerton, C.: Discovery ofa Novel Inhibitor of Coronavirus 3CL Protease for the Poten-tial Treatment of COVID-19, bioRxiv, 2020.2009.2012.293498,https://doi.org/10.1101/2020.09.12.293498, 2021.
Breg, J. N., Boelens, R., Vuister, G. W., and Kaptein, R.: 3D NOE-NOE spectroscopy of proteins – Observation of sequential 3DNOE cross peaks in Arc repressor, J. Magn. Reson., 87, 646–651, https://doi.org/10.1016/0022-2364(90)90324-3, 1990.
Clore, G. M., Kay, L. E., Bax, A., and Gronenborn, A. M.: Four-dimensional 13C/13C-edited nuclear Overhausesr enhancementspectroscopy of a protein in solution: Application to interleukin1β, Biochemistry, 30, 12–18, 1991.
Delaglio, F., Grzesiek, S., Vuister, G. W., Zhu, G., Pfeifer, J., andBax, A.: NMRpipe - a multidimensional spectral processing sys-tem based on Unix pipes, J. Biomol. NMR, 6, 277–293, 1995.
Diercks, T., Truffault, V., Coles, M., and Millett, O.: Diagonal-Free3D/4D HN,HN-TROSY-NOESY-TROSY, J. Am. Chem. Soc.,132, 2138–2139, https://doi.org/10.1021/ja910523q, 2010.
Douangamath, A., Fearon, D., Gehrtz, P., Krojer, T., Lukacik,P., Owen, C. D., Resnick, E., Strain-Damerell, C., Aimon, A.,Abranyi-Balogh, P., Brandao-Neto, J., Carbery, A., Davison, G.,Dias, A., Downes, T. D., Dunnett, L., Fairhead, M., Firth, J.D., Jones, S. P., Keeley, A., Keseru, G. M., Klein, H. F., Mar-tin, M. P., Noble, M. E. M., O’Brien, P., Powell, A., Reddi,R. N., Skyner, R., Snee, M., Waring, M. J., Wild, C., London,N., von Delft, F., and Walsh, M. A.: Crystallographic and elec-trophilic fragment screening of the SARS-CoV-2 main protease,Nat. Commun., 11, 5047, https://doi.org/10.1038/s41467-020-18709-w, 2020.
Geen, H. and Freeman, R.: Band-selective radiofrequency pulses, J.Magn. Reson., 93, 93–141, 1991.
Goddard, T. D. and Kneller D. G.: Sparky 3, University of Califor-nia, San Francisco, USA, 2008.
Grzesiek, S. and Bax, A.: The Importance of Not Saturating H2O inProtein NMR. Application to Sensitivity Enhancement and NOEMeasurement, J. Am. Chem. Soc., 115, 12593–12594, 1993.
Grzesiek, S., Anglister, J., Ren, H., and Bax, A.: 13C line narrowingby 2H decoupling in 2H/13C/15N-enriched Proteins. Applicationto triple resonance 4D connectivity of sequential amides, J. Am.Chem. Soc., 115, 4369–4370, 1993.
Grzesiek, S., Wingfield, P., Stahl, S., Kaufman, J. D., and Bax,A.: Four-dimensional 15N-separated NOESY of slowly tum-bling perdeuterated 15N-enriched proteins. Applications to HIV-1 Nef., J. Am. Chem. Soc., 117, 9594–9595, 1995.
Harris, C. R., Millman, K. J., van der Walt, S. J., Gommers, R., Vir-tanen, P., Cournapeau, D., Wieser, E., Taylor, J., Berg, S., Smith,N. J., Kern, R., Picus, M., Hoyer, S., van Kerkwijk, M. H., Brett,M., Haldane, A., del Rio, J. F., Wiebe, M., Peterson, P., Gerard-Marchant, P., Sheppard, K., Reddy, T., Weckesser, W., Abbasi,H., Gohlke, C., and Oliphant, T. E.: Array programming withNumPy, Nature, 585, 357–362, https://doi.org/10.1038/s41586-020-2649-2, 2020.
Helmus, J. J. and Jaroniec, C. P.: Nmrglue: an open source Pythonpackage for the analysis of multidimensional NMR data, J.Biomol. NMR, 55, 355–367, https://doi.org/10.1007/s10858-013-9718-x, 2013.
Hunter, J. D.: Matplotlib: A 2D graphics environment, Comput. Sci.Eng., 9, 90–95, https://doi.org/10.1109/mcse.2007.55, 2007.
Hwang, T. L., van Zijl, P. C. M., and Garwood, M.: Broadband adi-abatic refocusing without phase distortion, J. Magn. Reson., 124,250–254, 1997.
Ikura, M., Kay, L. E., and Bax, A.: A novel approach for sequen-tial assignment of 1H, 13C, and 15N spectra of larger proteins:heteronuclear triple-resonance three-dimensional NMR spec-troscopy. application to calmodulin, Biochemistry, 29, 4659–4667, 1990.
Kay, L. E., Clore, G. M., Bax, A., and Gronenborn, A. M.: Four-dimensional heteronuclear triple-resonance NMR spectroscopyof interleukin-1B in solution, Science, 249, 411–414, 1990.
Kay, L. E., Keifer, P., and Saarinen, T.: Pure Absorption Gradi-ent Enhanced Heteronuclear Single Quantum Correlation Spec-troscopy with Improved Sensitivity, J. Am. Chem. Soc., 114,10663–10665, 1992.
Koharudin, L. M. I., Bonvin, A., Kaptein, R., and Boelens, R.: Useof very long-distance NOEs in a fully deuterated protein: an ap-proach for rapid protein fold determination, J. Magn. Reson.,163, 228–235, https://doi.org/10.1016/s1090-7807(03)00149-6,2003.
Lee, W., Tonelli, M., and Markley, J. L.: NMRFAM-SPARKY: enhanced software for biomolecularNMR spectroscopy, Bioinformatics, 31, 1325–1327,https://doi.org/10.1093/bioinformatics/btu830, 2015.
Lemaster, D. M. and Richards, F. M.: NMR sequential as-signment of Escherichia-coli thioredoxin utilizing ran-dom fractional deuteration, Biochemistry, 27, 142–150,https://doi.org/10.1021/bi00401a022, 1988.
Marion, D., Driscoll, P. C., Kay, L. E., Wingfield, P. T., Bax,A., Gronenborn, A. M., and Clore, G. M.: Overcoming theoverlap problem in the assignment of 1H NMR spectra oflarger proteins by use of three-dimensional heteronuclear 1H-15N Hartmann-Hahn-multiple quantum coherence and nuclearOverhauser-multiple quantum coherence spectroscopy: applica-tion to interleukin 1β, Biochemistry, 28, 6150–6156, 1989a.
https://doi.org/10.5194/mr-2-129-2021 Magn. Reson., 2, 129–138, 2021
138 A. J. Robertson et al.: 4D NOE-NOE spectroscopy for protein assignment and structural analysis
Marion, D., Kay, L. E., Sparks, S. W., Torchia, D. A., and Bax, A.:Three-dimensional heteronuclear NMR of 15N-labeled proteins,J. Am. Chem. Soc., 111, 1515–1517, 1989b.
Oschkinat, H., Griesinger, C., Kraulis, P. J., Sorensen, O. W., Ernst,R. R., Gronenborn, A. M., and Clore, G. M.: 3-DimensionalNMR spectroscopy of a protein in solution, Nature, 332, 374–376, 1988.
Pervushin, K., Riek, R., Wider, G., and Wuthrich, K.: Attenuated T2relaxation by mutual cancellation of dipole-dipole coupling andchemical shift anisotropy indicates an avenue to NMR structuresof very large biological macromolecules in solution, Proc. Natl.Acad. Sci. USA, 94, 12366–12371, 1997.
Pervushin, K. V., Wider, G., and Wuthrich, K.: Single transition-to-single transition polarization transfer (ST2-PT) in [N15, H1]-TROSY, J. Biomol. NMR, 12, 345–348, 1998.
Robertson, A., Ying, J., and Bax, A.: Time domain data, acquisi-tion parameters, and processing scripts of 4D NMR data, Zen-odo, available at: https://zenodo.org/record/4625615, last access:9 April 2021.
Rovnyak, D., Frueh, D. P., Sastry, M., Sun, Z. Y. J., Stern, A. S.,Hoch, J. C., and Wagner, G.: Accelerated acquisition of high res-olution triple-resonance spectra using non-uniform sampling andmaximum entropy reconstruction, J. Magn. Reson., 170, 15–21,https://doi.org/10.1016/j.jmr.2004.05.016, 2004.
Torchia, D. A., Sparks, S. W., and Bax, A.: Delineation of Alpha-Helical Domains in Deuteriated Staphylococcal Nuclease By 2dNoe Nmr-Spectroscopy, J. Am. Chem. Soc., 110, 2320–2321,1988.
Tugarinov, V., Muhandiram, R., Ayed, A., and Kay, L. E.: Four-dimensional NMR spectroscopy of a 723-residue protein: Chem-ical shift assignments and secondary structure of malate synthaseG, J. Am. Chem. Soc., 124, 10025–10035, 2002.
Tugarinov, V., Hwang, P. M., and Kay, L. E.: Nuclear magnetic res-onance spectroscopy of high-molecular-weight proteins, Annu.Rev. Biochem., 73, 107–146, 2004.
Tugarinov, V., Choy, W. Y., Orekhov, V. Y., and Kay, L. E.: SolutionNMR-derived global fold of a monomeric 82-kDa enzyme, Proc.Natl. Acad. Sci. USA, 102, 622–627, 2005a.
Tugarinov, V., Kay, L. E., Ibraghimov, I., and Orekhov, V. Y.:High-resolution four-dimensional H-1-C-13 NOE spectroscopyusing methyl-TROSY, sparse data acquisition, and multidimen-sional decomposition, J. Am. Chem. Soc., 127, 2767–2775,https://doi.org/10.1021/ja044032o, 2005b.
Vogeli, B., Segawa, T. F., Leitz, D., Sobol, A., Choutko, A.,Trzesniak, D., van Gunsteren, W., and Riek, R.: Exact Dis-tances and Internal Dynamics of Perdeuterated Ubiquitinfrom NOE Buildups, J. Am. Chem. Soc., 131, 17215–17225,https://doi.org/10.1021/ja905366h, 2009.
Vogeli, B., Kazemi, S., Guntert, P., and Riek, R.: Spatial elucida-tion of motion in proteins by ensemble-based structure calcula-tion using exact NOEs, Nat. Struct. Mol. Biol., 19, 1053–1058,https://doi.org/10.1038/nsmb.2355, 2012.
Vuister, G. W., Boelens, R., and Kaptein, R.: Non-selective 3-dimensional NMR spectroscopy – The 3D NOE-HOHAHA ex-periment, J. Magn. Reson., 80, 176–185, 1988.
Wagner, G.: Prospects for NMR of large proteins, J. Biomol. NMR,3, 375–385, 1993.
Wüthrich, K.: NMR of Proteins and Nucleic Acids, John Wiley &Sons, New York, USA, 1986.
Xia, Y. L., Sze, K. H., and Zhu, G.: Transverse relaxation opti-mized 3D and 4D N-15/N-15 separated NOESY experimentsof N-15 labeled proteins, J. Biomol. NMR, 18, 261–268,https://doi.org/10.1023/a:1026590201757, 2000.
Ying, J., Delaglio, F., Torchia, D. A., and Bax, A.: Sparse multidi-mensional iterative lineshape-enhanced (SMILE) reconstructionof both non-uniformly sampled and conventional NMR data, J.Biomol. NMR, 68, 101–118, 2017.
Ying, J. F., Barnes, C. A., Louis, J. M., and Bax, A.: Importance oftime-ordered non-uniform sampling of multidimensional NMRspectra of A beta(1-42) peptide under aggregating conditions,J. Biomol. NMR, 73, 429–441, https://doi.org/10.1007/s10858-019-00235-7, 2019.
Zuiderweg, E. R. P. and Fesik, S. W.: Heteronuclear Three-Dimensional NMR Spectroscopy of the Inflammatory ProteinC5a , Biochemistry, 28, 2387–2391, 1989.
Zuiderweg, E. R. P., Petros, A. M., Fesik, S. W., and Olejniczak,E. T.: 4-Dimensional [C-13, H-1, C-13, H-1] Hmqc-Noe-HmqcNmr-Spectroscopy – Resolving Tertiary Noe Distance Con-straints in the Spectra of Larger Proteins, J. Am. Chem. Soc.,113, 370–372, https://doi.org/10.1021/ja00001a060, 1991.
Magn. Reson., 2, 129–138, 2021 https://doi.org/10.5194/mr-2-129-2021