Embed Size (px)
Citation preview

DOCUMENT RESUME
ED 113,A4f a- % .SE 018 907- ,
'TITLE,
Data Utilization :` A Key to Improved Science. 'Education.
INSTITUTION. ,Council of St Science supervisors, Inc., Richmond,.
Va.SPONS AGENCY National Science Foundation, Washington, P.C.PUB DATE \74NOTE ° 45p.; Occasional small type used in chartsAVAILABLE FROM The Council of State Science Supeivisqrs, Inc.,
1322-28 East Grace Street, Richmond, -Virginia23219 )
o
EDRS PRICE MF-$O.76 Hq-$1.95,Plus PostageDESCRIPTORS *Data Bases; Data Collection;. *Decisibn Making;
--... Educational Change; *Educational planning;Educational Policy; Higher Education; *InformationSystems; Policy; *Science Education
IDENTIFIERS Council of State Science Supervisors
t\iBSTRACTThe purpose of this project was to d termine what the f
availability of educational data in the state depart ent of educationis and what strategies can be applied to'improve state data systemsand snake the'be8t. use of them in-making national and stateeducational decisions. The project.A.nvolved two major activities.: thedesign and implementation of a survey to .determine the extent and'consistency of data collected by the states as well'as the frequencyand source ofnata collection'and a study of results of the survey inorder to make recommendations forfimproved'Aata gathering andutilization. Resultsindicated the available data in state data bankswould not be useful in determining training needs ,....of teachers o .
teacher competency-. There was little correlation between kinds Ofdata collected and problems related.to scieicec'teachers and teaching.Some of the recommendations dads were for Vie upgrading of state databa ks to collect, information which will be useful in makingucati nal policy decisions: A survey form which could be used to
collect data on science teachers employed in the 50 states is alsoincluded inthe project report. (4uthor/BR) ,
.,
. N ,
O
-******************************************************************0 -
* Doicuments acgbired by ERIC include many informalgunpublished ** -materials not available from other sourCes. ERIC [mires every. effort **. to obtaXn the pest dopy, available. Nevertheless, items of marginal *.
* reprodubibility areoflen encountered and this affects the, quality *.
* of the micrgiche and hardcopy reproductions EPIC makes avaiAble *
* via the ERIC Document Reproduction Service /Epps). EDRS is not*.rAspoAsible for the/quality of the original' document. Reproductions* supplied by EDRS are the best that can be made'from the original. *
***********t*************************************** *4/cis***************

Ui DEPARTMENT OF HEALTHEOUCATION & WELFARENATIONAL INSTITUTE OF
EDUCATION'Trlti DC( N F N
DU, En E 74A a, v5 5 t,
TIE .PERSON ;4' N "kr NA1-15., T. P() A "IN f,NSTATE' N5,5 , r .5 IlkfSE.NT ( (V. NA,,,`NA ,Nt'F60(.37,05.4 ,
r.-
r
r
r7---
L
411
_
/ OW SP 110
WO OW 164 1011_
alk OP WO ,-J107,
110
VO AO ill. Mk
IMP INV Oil 10III OS 1110;
NI 10.0 111%
11111
This publication is the report of a project conducted by the Council of State Science Supervisors, Inc.,undeY a grant from the National ,,Science Foundation.
, Dr. James W. Latham, Jr., Project Director
President, Counpil of State Science Supervisors
Mr. Franklin D. Kizer; Contracting OfficerExecutive Secretary, Cmincil of State Science Supervisors.
. .
Mr. Dallas Stewart, Member, .Plannmg CommitteePresident-Elect, Co until of-State Science Supervisors
Mr. John A.Hobser, Member, Planning Committee'Past President, Council of State Science Supervisors
Isabelle Rucker, Ek Officio Member, Planning Committee'President, Association pf State Super vistlirs-olMathematicS
'Ct
Mr. Carter B. Hart, Ex Officio Member,. Planning Com mittee
President, Council of State Social Studie.s Supervisors
Mr. Raymond E. Thiess, Data Collection and Analysis
Member, Council of State Science Supervisors
irDr. Kenneth' W. Dowling, Project ReporterPast President, Council of state Science Supervisors
Mr. Jadk S. 0' eery, Local Arrlrigements,Treasurer, Cou cil of State Science Supervisors ,'
.0
The Council of State Stience Supervisors, Inc.1322-28 East Grace StreetRichmond, Virginia 23219
a
t-%-
4
o
DATA UTILIZATION:
a .key to improvedsciencefeducation
The Council of StateScience Supervisors/ 1974
is
14.
0
4.
1 44
S
Table of Contents
Preface
Project Participants
Introduction
A Summary of Project Observations and Recommendations 5
Planning 'for Data UtilizationIt
Project Accornplishments, Observations and Recommendations
IDetcribing the Nature of the Data Available in State Data Banks on Science Teachers Employed in theStates
Describing the Information Available Concerning the Parameters of Science Teacher Supply in the States
Describing Ways of Using Data in Improving Science Education in the States
'Describing the Elethents Needed for the Creation of a Data C9kctind and4haring Network Embracing All 28
States1,,
,,
, . /4
,
Describing the Elements Currently Available for Constructing A Comprehensive Supply and Rentand Pic- 30. /,
tore of the Current Science Teacher,Market rProviding A Learning Experience fot: Conference Participants in Data Based Policy Formulation
Familiarizing Conference Participants With New Directions for Educational Programs of 'the National 31
Science Foundation
Providing An Opportunity for State Science Supervisors to React/Respond to NSF 'Education Program 32Changes
Data Utilization in the Future: Involvement of the kuncifof State Science Supervisors
Evaluation
Appendices,
d.
rVi

3
4.
Preface..r
The Council of State Science Supervisors has, sinceits initiation in 1963, cooperated with the NationalScience Foundation, Division of Pre-College Educe:,tion in Science, in a variety of projects. Throughoutthis association the Council has benefited irdmFoundation suppok while contributing the uniqueknowledge and experience its members. bring from
their involvement in the state departments of educa-tion. This particular project /was an outgrowth ofmany discussions and planning sessions with staffmempers from the Foundation who recognized theneed for better inTormation about the status. ofscience education when making program decisions.This study of the availability and quality of meaning-ful data from the data banks maintained by the statedepartments of education was conducted to deter-mine whether these data-resources are adequate tomeet a minimal need and how they might be im-proved to be more valuable in' giving 'direction toeducational programs. Although scie edUcation
was the first concern, it was realized the onsetthat the data utilization process is applicable to 411study areas.
Project Participants
A
Thi project could not have been conducted with- ttout t operation of the individual chief stateschool officers and the members of their ,staffs. TheCouncil expresses its appreciation for the assistancethey received, especially from those in the data pro-cessing divisio assisted by responding to thesurvey instr ent that as used in each state..
Beca e of the- inte isciplinary nature of theproblems- associated with data utilization, it wasappropriate that the it of State Social StudiesSpecialists and the Association of State Supervisors ofMathematics be involved. The representatives of thesetwo organizations of state ernployfes made' majorcontributions to the conference phase of the project,as well as to the planning that. preCeded the con-ferenCe. The Council of State Science Supervisors isgrateful for this Cooperation.
Throughout the various stages of this project alarge number of 'individuals, institutions, and com-mercial organizations made important contributions.This support was critical to successful comriletion ofthe work that was planned. The Council wishes toexpress its thanks to everyone who gave their assis-tance. Finally, the Council expresses its thankt to theNational Science Foundation for the financial supportthat made this project possible.
Members of the Council of State Science Suptrvisors who participated in the project conference:
LaMar Allred, UtahRichard Barnhart, HawaiiGeorge Bohl, WyomingWilliam Bolles, PennsylvaniaW. L. Carmichael, GeorgiaWendell Cave, KentuckyRichard Clark, MinnesotaJerry Co [glazier, IndianaJames Cook, Canal ZoneKenneth Dowling, WisconsinGary Do Wns, IowaIrvin Edgar, PennsylvaniaJohn Favitta, New YorkGeorge Fors, North DakotaDillard Haley, Jr., Virginia
'John Harrit,,New JerseyJohn Hooser, MissouriJack Hopper, FloridaJoseph Huckestein, TexasRichard Kay, Idaho
0
Dave 'Kennedy, WashingtonFranklin Kizer, Virginia_James Lathani, Jr., MarylandAlice Linder, South CarolinaDavid Maliette, North CarolinaH. Donn 'McCafferty, VermontLarry McKinney, OklahomaArthur McMahon, Rhode IslandAlan Nicholson, MontanaJack O'Leary, NevadaRichard Peterson, UtahReuben G. Pierce, Washington, D.C.Douglas Reynolds, New YorkJerry Rice, TennasieeRobert C. Roberts, MisgskippiRobert Seymour, West VirginiaRichard Stebbins, MinnesotaDefies Stewart, GeorgiaCalvin Story, Texas 'Raymond Thiess, Oregon
Note: State science supervisors and other state department of education personnel who contributed to theproject by completing andieturning survey instruments are not listed. However, their contribution wlis very'important and greatly appreciated.
6

Members of the Council of State Social Studies Supervisors who participated in the project conferencp:
Jellies Bean, NevadaCarter B. Hart, New Hampshire
4 H. Mike Hartoonian, Wiiconsin.
"t'Members of the Association of State Supervisors of Ma
--James M. Bagby, VirginiaGeorge L. Henderson, Wisconsin
Hyndsr South Carolina
.June Gilliard, North Carolina,Geralene M. Sutton, Virginia
Conference speakerrancl consultants:
Dr. J. Myron ttkin, Dean,.College of EducationUniversity of Illinois
Dr. Michael M. FrociymaProgram Manager,Instructional Improvement I mple-
mentation SectionPre-College Educ. in Science Div.National science Foun on
Dr. William S. GraybealAssistant Director, Research Div.National Education Association
Dr. Kenneth Hansen, SuperintendentNevada State Dept. of Education
4
ematics who participated in the project conference:
Ronald Gutzman, NevadaJames Oakes, Tennessee
-
Dr. Howard J. 'HausmanActing Division DirectdrPre-College Education in ScienceNational Science Foundation
Mr. Edward J. MeadeEducational DirectorFotd Foundation
Dr. William Richardson, DirectorAdvance Planning and DevelopmentMontgomery County Maryland Berard
of Education
Dr. Herbert WahlburgResearch ProfesgErr of Urban EducationUniversity of IllinOis
Special Evaluafor: Dr. Jack Hassard, Georgia State University
A
Guests attending prOject conference:
Mr. James V. Bei"nardoNational Center for Resource
Recovery
Or. John R. Bolig, Del Mod System, Dover, Del,
Mr. James G. COokThomas Alva gdison Foundation
Mr. Mike CrawfordAddison-Wesley
Mr: Leonard D. Garlicknd Stag Dept.'of Education
Mr. Bud GlasgloHolt, Rinehart & nston, Inc.
Mr. Om HurdHolt,`Rinehart & Winston
Mr. James McNeely.Addison-Wesley
Mr. William B. MillerRand McNally & Company,
Mr. Robert NessRand McNally & Cpmpany
Dr. K. W. PalmerNevada State Dept. of Education
Mrs. Charlotte H. Purnell rDel Mod Systems, Dover, Del.
Mr. Jack StephensRand McNally & Company
Dr. Ertle Thompson .
University of Virginia
Mr. Robert H. VaninganAddison-WesleyS
Dr. Wayne W. WelchNation-al-Science Foundation
Mr. Lee 0. WorthingAmerican Book Company

Introduction$.1d.The Council of State Science SuPervisors with
6 ifm m ers t p in most of the fifty states and territoriesof the United States has listed, among other highpriority concerns, the problerhs of inservice and pre-service ethfation. In their first efforts to discover themagnitude of the problem in this special area theofficers of the Council contacted staff members ofthe Precollege Education in Science Division of theNational Science Foundation for their assistance: As aresult, the Council, with financial .sponsokhip. fromthe, National Science Foundation, conducted sevenregional conference * throughout the nation early in1972. Although the conferences were designed tos4rve several purposes, a major emphasig Was brought
' to bear upon the problems of providing high qualityscience teachers and science teaching riethods in theschool systems ckthe country. A major contributionat -these conferences came in the form of positionpapers- prepared by riepr9seritatives pf 'die state de-partments of education. In order to get the broadestpossible interpretation of existing problems thesepapers were prepared cooperatively by representativesof the Council of 'State Science *Sppervisors, the
I Council of State Social StOdies' Specialists and theAssociation of State Supervisors of Mathematics Mtheir respective states. This first cooperative effortamong three similar organizationsoin three academicareas has continued to the present time.
!le position papers presented by the states re-vealed a commonality in problems - encounteredthroughout the country, but several characteristics ofthe positron papers were rurged that reduced thecredibility of arguments presented. Among these
9 were:Most of the papers presented were subjective andcontained little or no valid data for making deci-sions about teaches education.The writers of the position,papers were unable tpidaitify the educational needs of students.There was' Mille evidence that the states were, atthat time, capable of assessing student progress orof establishing criteria for accddntability within thqtsbi
se in/Ming&
the position papers were genuinely11-herested-in improvingteadidr education but lackedadequate information for making° necessary .deci-sions.
5
Overall it became apparent that the specialists inscience, social studies and mathematits in the statedepartments of education did notAave the kinds ofdata available that would make it. possible for them tojustify the aVgarent.high expenditure's of funds neces-sary to establish now strategies for insersice andspre-ser.vice educatiori. As a result, a fellow-up study wasinitiated to detediine what data are available within 'the state data systems and what steps w II beneces-neces-
sary to improve and supplement those sy tems to theiff. point wherp accurate, reliable informatio will have.
maximum use' in making national and state educe-bona! decisions. This ,report indicates the proceduresfollowed in that study and the recommendations andfindings that have resulted from it.
The major activities of the study tvere planned and.. -
conducted by the Council of State Science Super-visors in cooperation with the Coundl of State Social
>
Studies Specialists and the Association of*StateSupervisors of Mathematics. Financial Assistance wasprovided by the National. Science Foundationthrough a grant-to the Council of State ScienceSupervisors, IrTorporated.
A Sunimary of Project Observationsand Recommendations,
The, need fqr sound reason in making educationaldecisions has become increasingly apparent in a
period of history where public scrutiny of the schoolsis at its highest. Taxpayers, minority groups, eco-nomic interests and academic fadists are exerting newinfluences on educational decision making.
To react positivelN/ to societal pressures it has be-come more important than ever that educators gobeyond intuition and professional expertise M sup=porting continuing programs and in designing needones. They need to have the most objective rationalepossible to support change, and that rationale must inturn be basedupon objective data utiliition.
----Few....,these reasons the Couqcil beState ScienceSupervisors in cooperation with the Council of State
,1 Social StA1ies Supervisors and the Association ofState Supervisors of Mathematics, and with the finan-cial support of the National Science Foundation,undertook the task of determining what the availa-bility of educational data irythe state departments ofeducatign is and what strategies can 'be applied toimprove state data systems and make the best use ofthem.
The project involved two major/ activities: (1) thedesign and imPlementation of a survey study to deter-mine the extent and consistency of data collected bythe, states as well as the frequency and source of datacollection, and (2)° a conference geld at Las Vegas,Nevada, attended by state supervisors for the purposeof studying the results of the survey and making rec-ommendations for improved data gathering and utiWzation..The results of the project may be stated intwo categories: observations and recommendations.
Observations
The survey of state departme(nts of edgpatiory pro-vidpd observations that describe the nature of theeduCational data collected by the states.There is little consistency in the kinds'of data itemscollected by the departments of education in thevarious states.
The frequency of collection and the sources of edu-cational data are highly varied among the states.'Me data most consistently collected are relatedprimarily to identification and easily quantifiedcharacteristics of teachers.Data that reflect value judgements are practicallynever collected. .
There is a' lack of consistency in ,omputer treat-, ment and codingiof the data that are collected in
- A
Mos ta items are neither colledted nor stored insuch a way that th'ey, could be retrieved to answernational, or even regional, questions.
s The sources. of data and the frequency of collectionare very diverse. Greatest consistency is found -indata from annual reports to state departments N
Recommendations.t
education.In spite of limitations, the state departments ofeducation are, collectively, an extensive source-foreducation 'data' and have the potential for beingmuch better.
During the ,conference a study-of data utilization pro-cedures produced observations that are significant injudging the value of state data systems. .
There is considerable difference between usingexisting data banks to develop a rationale to sup-port decision making and actually attempting toanswer research questions using existing data.As they exist the state databanks cannot be effec-tively used in doing basic research.Diverse sources of data and varied frequency ofcollection limits the use of state data in making.regional or national decisions.Generalized surveys within states can be Used suc-cessfully to collect data for later use in making de-clsions,' establishing policies and generatin4 research-able questions.Usefulness of state data systems is dependent uponthe methods of collection. In particular, collectionof data related to special subject areas requires fullknowledge of the unique features of such areas.Usefulness of state data banks is dependent uponuniformity among states in the procedures-used to
------aof(ect and process data and in the kinds of dataitems collected.When a need for edUcational inforkation is identi-fied, the data availableiffrom the state departmentsof education, no n7.1-ter how limited, are useful innaking educational decisions.
It was assumed at the> conferenceithat the.limita-.
tions of the existing. state data banks is not innate in-the ,systems of the state departments of education.Hence, recommendations were presented with thehope that in the future useful data. could -be °easily 44retrieved to meet certain kirids of' educational needs.
Tiie state departments of education should co-,operate td produce uniform data collection anddata processing procedures.Most prObable uses of data shobld be identified toavoici Collection of trivia and to Improve chancesthatneeded data will be available.
Chief state school officers should make commit- °ment to collecting the data that are identified'as.needed.
Subject area specialists should be consulted in 19modification of state data systems so that the datacollected *ill be useful in improving instructionwithin subject areas.
In most 'states s/eps should be taken to improve. communicationsi-between subject area specialisti
and data processing specialists. JProcedure's should be established to promote" utili-zation of state collected educational data by otheragencies.' Such agencies should include federal, stateand local, governmental ,agencies, universities,
10'iprivate foundations and professional associations
that are involved in making decisions that affecteducation.Data utilization practices should be encouraged thatpromote positive change to meet educationalchange rather than for derogatory or.negative pur-poses
In parti6ular, data that relate the characteristics ofteacher supply and demand should be collected andMade available by the states for regional and na-tional studies.The National Science Foundation and the UnitedSthtes.Office of Education should provide financialassistance to states in order to collect and processdata that could support existing programs in filhesciences or give direction to new ones.Agencies funding educational programs shouldmake use of existing state data in establishing pro-grams and making grants. Specifically, the NationalScience Foundation, Division of Pre-College Educa-tion. In Science, should use data from the statesystems to establish the need that exists for pro-grams that will be undertaken by the EducationMaterials and Instruction Development Section andthe Instructional Improvement ImplementationSection.,
More specific and-detailed observations and recom-mendations are given within the body of the report
. along with a description of the procedures that wereused to accomplish the objectives that were estab-lished for the total project. In reading this report, it is
4
\ "
CP
4

important to realize thatit is a progress'report on a-project that is intended to continue through several'phase's. It cannot be considered-completed until im-proved data collection and utilization hps actuallybecome paFtof the probedures used in the states taimprove education in the sciences.ghe Council ofState Science Supervisors and colleagues, in mathe.-matics and social studies in state departments of edu-tCation are 'obligated to continue efforts to improvethis asspect ,qithe services they provide. In this effort,
, it is hoped that other groups such asthe.U, S. Office'of Education, j,the Council of Chief State hoolOfficers, the Association for Educational lkta Sys-tems and other specialized groups of educators in-volved in state departmentrof education will becomeinvolved.
Planning for Dat Utilization
tie *ailments of education of the states andterritories of the -United Stites form a unique net-work for.providing educational services as well as forcollectingeducational information that can be used inmaking decisions on a broad scale. However, becauseof the *diversity of given functions within these de-partments it is sometimes difficult to find common-alities among thtm that will make interdepartmentalprojects feasible. Data collection is a function, that isgiven different priorities deoending upon the natureof educational policies that have been adopted by thestates. In addition, geographical size and location,
. totar and localized population, and organizationalstructure of school systems within states, are amongfactors that enhance, or limit, data collection abilitiesof the state departments. From p?qous,experiencewith preservice and - inservice teacher kucation pfob-lems, the %embers of the Council of State Science
pervisiSrs recognized the value of systematic collec-and use of data that describe characteristics of
scien e teachers and science teaching practices. How-ever, it rapidly became known that any effort todevelop a national assessment of such teacher -basedcharacteristics vvbuld be hampered by the limitationsand iritssmi......latibilities of the existing data systems. Ifthe unique network of state partments of educa-tiontion is to function in pr 'ding-data to nationalstudies, the differences in the collection aid use ofteacher data among the states must be identified. Theproblems believed to exist initially were: ,
es Easily available data are neither consistent enoughnor extensive enough to describe the attributes of
, the existing teaching population in science, socialscience and mathematics in the States. ,
Student needs have not been identified and, there-fore, existing data do, not relate teacher characteris-tics to she ability of teachers to meet student needs.
. .s
-`q7 0
Instruments and methods do not exist foressessing'4 sfqdent achieves:dent in existing programs. .
. There is ,a- lack in uniformity of ots7ectives ofscienceducation that could be used to structureassessment of students. .
Data that could be used to determine the character-istics of the teacber supply and demand at the stateand national levels are not available.Data that could be used tp assess quality of teach-ing practices are- not readily available nor hasquality teaching been defined..If more effective and More appropriate programs
for inservice and preservice education of teachers re
to be designed on the, basis of knowledge ab theexisting teaching staff, these limitations must be re-moved'or alleviated. It was assumed that correctingthese,limitations thrOugh a national effort would have
Nimplications.for local and state programs in teacher_education as well as national prograins such as thosethat.haye been undertaken by the NationatScience.
'cally stated
the role of the states in improving.teacher- data collec-tion and utilization* These ,assumptions were specifi-
Foundation. Assumptions made concerning
There is a need for more and better informationfi-om the states in order toa Describe the nature of the teaching population.
in science, social science, and mathematics inthe states.Assess student progrels in existing programs.
ps 1 Assess teacher supply in science, social scienceand mathematics.Assess the quality of teaching occurring inexisting- classes of science, social science andmathematics.
There is a need for a better description of the edu-cational needs of t ay's youth.State departments o education and their respectivesubject specialists ave a major contribution tomake in ?he col ction and analysis of _educationaldata.State subject speciah will need specialized train-ing in data collection nd'analysis if meaningfuldata is to be collected in the states.New sources of funding and strategies of implemen-tation will be needed to initiate comprehensivestate data collection and analysis systems which willbe useful in determining the preservice and inserviceneeds of the nation's teachers.
I-
In response to these assumptions plebs were made,to take'ihe first steps necessary to Meet the needs
were recognized. The immediate.objectives estab-. listed Were:
to describe the nature of-the data available in statee .
data banks on science teachers employed in thestates.To escribe the information available concerningthe arameters of science teacher supply in thestate
To describe vyaYs of using data in improving scienceeducation in .the states. - a
, To describe the elements needed<for the creation ofthe data-collecting and sharing network embracingall states.
To describe the elethents currently available forconstructing a comprehensive supply and demandpicture of the current science teacher marketTo provide a learning pxperience for participants indata based policy formWati6n.To familiaFize state science supervisors *till newdirections for education programs of the NationalScience Foundatihn.To provide opportunities for state science super-visors to react and respond to National ScienceFoundation eduntional progiam changes.
o
Project Accomplishni nts, Observationsand Recommendatio
rThe established project objectives were, such that
some could best be accomplished through the workof small planning groups, mail surveys and telephon,econtacts. Other objectives could only be accom-plished by having representatives of the stateemeet inconcert to discuss the value and feasibility.of collect-ing data through state departments of education toanswer question; relative to the characteristics ofscience teachers and science teaching;
The procedures used to accomplish each of theproject objectives are descr'ibed separately along wit4interpretations and recommendations for futureaction.
11,
Describing the Nature of the Data Available in
State Data Banks on Science Teachers Employed in
the States
limited value, it was also realized that pe,arly' all statedepartments of education.have develgped systematicdata banks "using annual reports, teacher certificationJcords, federal program reports° and other periodic
sources of teacher information, to renew and update.,their data collections and that these data can providebackground'infarmation for making educational deci-sions. There was no known effort to investigate thecompatibility of the various state systems in terms ofcollection, coding, categdrizing, and other proceduresthat would affect the use of data in application tonational or regioni problents related to inservicescience teachers.SiMilarly, the-degree of consistencyused in identification of specific items of data to be.collected was not klown.
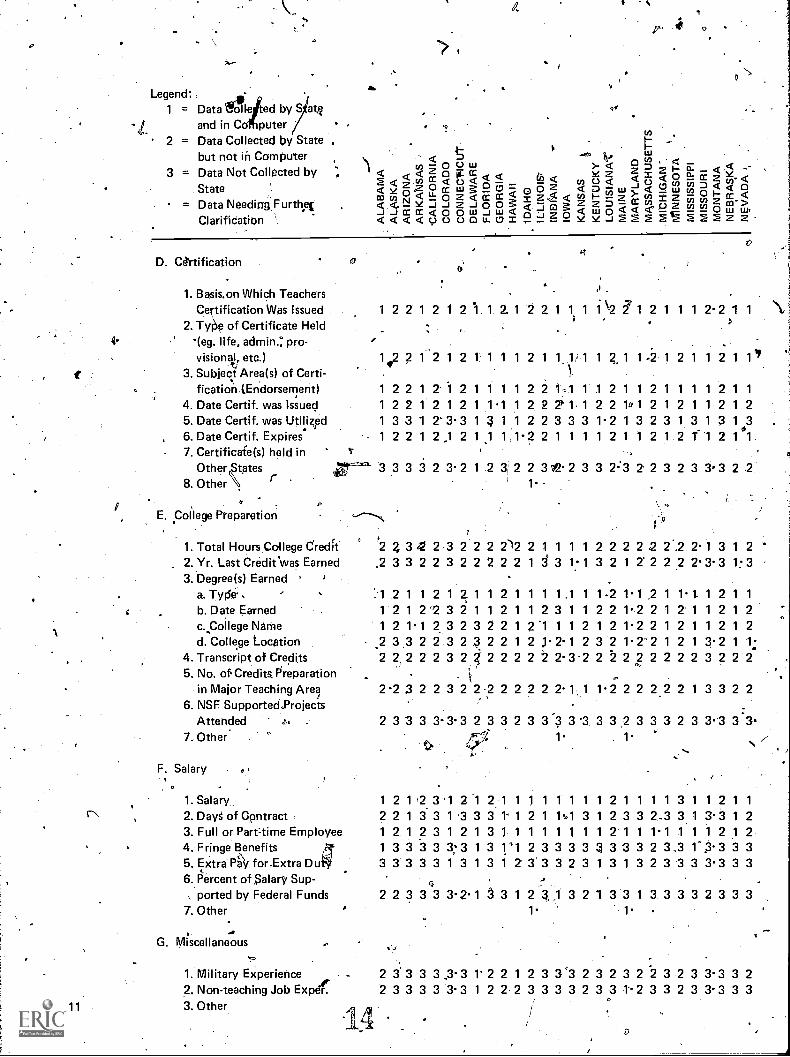
In order to describe the existing data, the projectplanning committee developed a Survey instrumentthat was used in each .of the states plus. he District of'Columbia and e Canal Zone. Data items related tothe characte tics of science teachers were put intoseven categories: personal, teaching assignment,teaching experience, certification, college prepara-tion, salary, and miscellaneous. These categories wereestablished after contacting a sample of state consul-tants to determine'the range of dal.a they had avail-able to them. For each category the final r item"other" was added to give an indication of the com-pleteness of the data. There is a noticeable lack ofitems Mated to teacher understanding of science Idcompetence in teaching Which is due to the observa-tion that states make very little effort to establish
. evaluative criteria that could be applied to teachers inthe public schools.
An important item of information related to use-fulness of the state data is the cqndition in which theyare stored and the ease of retrieving them. For thisreason, each state was asked to indicate Whether ornot eNch iteni was contained in a computerized sys-tem. This made three possible responses availab e:data collected by state and in computer, dates col-'elected by state but not in compUter, and data not
Fr_eyallected by state. The actual survey instrument thatwas used is irlbluded in the appendices. The tabulateddata relative to teacher information (items A throughG on the survey.instrument) are inctulowing four pages.
Aft initial task in determining the feasibility ofusing data collected from the states to answer criticaleducatiObaL,questions was to describe the nature ofexisting eile'Realizing thardata collected prior' toidentifibation of the question to be answered has
11
(16
0
a
o.

A
'
tegend:1 = Data Collected by State
and in Comp ter2 = Data tollectdd by state
but npt in Computdr3 = Data No,t Collected by
State
= Data Needing FurClarification .
-
0
,RESULTS OF SURVEY OF STATE DATA SYSTEMS
COI-I- ,
111 .
Di tr3 QZ Z.1-- E << a) < ? < 1 < 0 a" CC 2< ...1 C.) u) F,3 2)
Will } tn. 0CC ,..< I Z < < An Z cc otn =z 0. 0 ZLUC) >< < zi 3 5 8 ,7t ct ,`<nt Y. -. 5f3 tn 0O x ..9_ =1 ..... 2' -2 2 2.2 2 2 2
r")- (D= OZ <it0LL
A. Personal
1. Teacher Name .2..SocialSeyurity Number3. Sex tA. Race5. Date of Birth.6. Place of Birth7. Home Addrvs'8. Mein' Status9. Citizenship
10. Other
° B. Teaching Assignment
1. Name of Schdol2. Addiess of School3. Name of School District4. Name of Courses taight
'11 5. Name Of Cciurses AssignedEach Period
6. Name Of Text(s) Used in. Each U,urse '-
7. No, of Pupils Per Course8, Duration of CoLirse
(weeks or month)9. NO: of Minutes Per Week
4,ta'ch Course Meets10. Credit Per Curse11. Grade Level f Cours012.-As4gnmen ()per Than
Scien e. eaching 4
13. Other
. Teaching Experience
1. Total Years Teach. Exper.2. Years of Teaching,Exper.
in State3. New to Stqe
,4. New to bistrict5. Previous Years Place of
Employment6. Years Teadking Present
Coursels)
7. Other
z,
1 2 1 1 2 1 2 1 1 1 1 1 1 V 1 1, 1 2 1 1 1 1' 1 1 1 3. 1 11 2 1 1 2 1.2 1 2 1 1 1 1.1 1 1 1 1 1 f' 1 1 1 1 3. 1 1
01 2 1 .1 2 1 2 1 1 1 1 '1 1 1,1 1 1 211.1 1 1 1 1 1 2 1 1
1 3, 1 3 2 1 3 18 2 1 3 3 3 2.3 ., 3.3 3 1 1 3 1 3. 1 3..3 2 3s 1 2 1 .1 2 1 2 1 1 1 1 1 1 1 1 1 1 3 1, 1 1 1-.1 1 1 2 1 1,
a 3 2 3 2 3 2.2 2 2 1 2 3 3 1 2 3'3 2 1 3 2 2 3 3.3 3 3'.1 2 2 1 3 3 2 2 1 1 1 .1,2'3 ) 2 1.3 t 2 3 2 2 3 1. 3 2 32 2 1 3 3 1 2';2 1 2 1 3 1 3 12 2.3 1 3 2 2. 3 1 33 3-3 2 2 3 3 3:2 2 1 1 1. 2,2 3 1 2' 3' 3 3 2 3 2 2 1' 3.2 2
1.. k
', 4
1 2 1 2 3 .1 2 1.1.1 1 1 3 1.1 1 1 .2 1 1 .1- 1 1 1 1 2 1 1
2 1 2 3 1 2'1 1 1 1, 1 3 1 '1 1 1,2 1 1 1 1 1 41 .2 1 1
2 2 1 2 q 1 2 1 1 1 1 1 ,1 1 1. 1 1 2 1 1 -1 1 1 1 1 2 1 1
1 3 1 2.3 1 3 ) 1 2 2 1 1. 1 1 1 1 2 1 1 1 1 1.2 1 2.1 1
.3'3 3 2 3 3.3 2 1 2 2 1 3, 3 1 1.1 2 3 1 3 3 3. 2 1`.2 3 1
3- 3 3 3 3 3 3 2'3 3.2.2.3 2.3 3 3 3 3 33 3.3 2.3.3 1.32 3 3 2 3 3 2 1 '2 2 1 3 3 3-1 1 2 1 1 1 3 1 1 1 2 1 3
. 0' I
n. 3 3, g 3 3 3 2 1 2 2 2 3 2-3.3 1 2 1 3 1 3 1 1 1 3 1.3./ ,
.
3 3 2 3 p- 3 2 1.3 2 2 3' 21.2. 1 2 1 3 1 3 1 1 '1..2.3 32 3 3 2 3.3.3 2 32.2 2 3 2. 3' 2' 1 2 3;2 1 3.3 1 1 3 1 3.,
2 3 3 .2 3 3.3 2 2 2 2 1 3 1 1 .2 1 3 .1 2 1 3 1 3 1 .? '11
2 3;1 2 3 3.3 2 2 2 2 2 1. 1- 1 1 2 1 T 3 1 .1 1.1 2 1 3
1b ,
o
1 2 1 1 3 1 3 1 1 2 1 1 1, 1,1..1 2 1 1 2 1 3 1 1 3 1 .11.0
2 2'1 1 3 13 1 1 1 1 1 1 3.1 3 3,2.2 1 2 3 1 1,33 1 1
2 2 1 2 3 1 _1 `'l 3 2 1 3. 1. 1 1.1 2 1 1.02 2 2 1 1 3.22 3 1 / 3.1 3 1 1 1 2 1 1 1 1.1 1 3 1 1 2 2 1.1 -1 3 2 3
2 3 3 3 ,3 1' 3 1 2 3 2 1 8 3 3 1.3 3.1 2 2%3 1 3 1 3 3 10
3 3 3, 3.3-3.3 2 3 3.2,3 3 3 3 3'3 3 33.3.5 3 3 3.3 1 3
. - 1.
1:*

oI
INFORMATIOWON CHARACTERISTICS OF SCIENCE TEACHERS
JV<
til Z < < 0r et c i c, Z z
< CC tii Ri o z -=W ' 2 >- 11 1 i 0 u) W.
t . i 8 LI, W O O ,i cc w iZ Z Z Z Z Z'O 000. CC
0
J ilZtI- 1 D
O. Z k- ...I
til 0 - 07 LI-t)
O Zi 14 4 in 0 2DI- Z < 1 2 ,7; i4I- 0 0ZX<CC
Er 11 tiiC/ CU t0 DI- 0.1
>3 I- I- 5 5
00
Personal -./c .A. -
/.
1 11111.13111111:111 11111 f 1.20 87 .4=
.,. .
'2. 1 1111'13.111;11131111'1111\124, 83.--3. 1111113-1111111111111,1-112 87
4.31 3 1 . 1 3 3.1' 3 3 3- 1 31 1 -3 3 1 3 3- 3 3-1 3 355., 1 1- 2 1 1 1 3.2 1 1 1 1 1 2 .2 1 1 1 1 1 1 1 1 2 79 .
6. 1 3 2 2 1 3 3.'2 2 3 1 1 3 3 3 3 3 2 2 3.2 3.2 2 12
7. 1 3 1 2 3 3-2 2 q 1 , 1 3 3 3 1 1 2 2 1 2 1 1 2 33- 8. 1 3 1 1
33.23.2 3 1 1 1 3 3 3 1 1 1 3 3.2 1 1 2 ; 38.
9. 1 3 2 2 2 3 1 3 3 2 2 33 22 2 1 1 2 2 17
10. 1. 2.."
B. T Aing Assignmentde*
1. 1 1 1 1 1 1 1..1 1,1 1 1 1' 1 1 1 1 1 1 1 ;1 1 1 2 85 °'-2. .1.2 1 .1 1. 1 1 1 1 1 1 1 g 2 1 1 .1 1 1 1 =1 1.1 2 77
'3. 1 1 1 '1 1 1 1 1 1 1 31 1 1 1. 1 1 1 1 1 1 1 2 3 81
z.'' 4. 1.1 1 1 3 1 1 1 1.1 1 1 1 2 1 1 1 1'.1 1 1 1 -1 2, a, 77a 5. .i
",..1.3 1 1 3 1 3.2-3 3 3 1 2 2 1 1 3 1 3 1.2 1-1 2 37 -..
6. t3 3 3.'3.3 3 3 2 3 3 2 3 3. 2 3 3 3 2 3 2 3 3-2 2. 2
7. 1.01 1 1 3 1 1 1 3 1 3 1. 2 2 1 1 1 1 1 1 2.1 1 1 56 -. t,
8.O C
10 4.
.
.. '45/5/2'10 8 43/5/412 2 ' 45/611
8 58 18/4730 .
17.
4 41/9/23837 ..
5031 17
20/265/16
25 37 20/13/1946 37 9/24/19
Q
12 4.- 0 44/6/219 4 40/10/213 6 . 42/7/315 8 4.0/8/4
.
23 40 19112/21
23 75 1/12/3919 25 29/1A413
23 40., 019/12/21
31'11, 40 15/16/2131 46 12/16/24.29 29 422/15/15
21 . 19 31/11/10
t13 8 41/7/4
15 23 3118/12.-23 19 30/12/1015 25 31/8/13 429 50 11/15/26
,11= 81 4/6/42''
1 3 1 1 1 3 1 1 2 58 23 19 30/12/104. 3 1.1 1 /1 1 1 1 1 1 3 1 1 3 3 1 1 2 1 3.3 1 2 3 60 15 25 31/8/13 451
cp
3 3 2 3.3 1 1.2 3 3 2,233 2 33 3 2 2 2 1 2 2 21 29 50 11/15/266. ,
3 3 3 1 3 3 3 1 3 3 1 3 3 3 2 3 3 3 3 3.3 2 2 2 8 11= 81 4/6/42''7. 1.1. 1 1
1 1 3e1 3 1 3 c2'3 3 3 1.2 2 2 3 1 1 1,1 3 I 12 '\37;
1 1 2 1#3 1 3 2 3 3 2 1 2 2 2 3'1 3 1.1 3 3.2 2 2910.3 1 2 1.3 1 3 2 3 3 3 1 2.2 2 3 3 1 2 3.3 3.1 1 3
11. 1 1 2 1 3 1 1 2 3 3.2 1 2 2 1 1 1 1 1 3.3 1 2 1
12. .1 3 1 1 3,1 1 1 1 1 3;1 2 2 1 1 1 1 1 1 3. 1 1 1 60
13. 1. 1. 1 1. 1 1
C. Teaching Experience
1. 1 1 1 1 -1 1 1 1 1 1 1 1 1 1 2, 1 1 1 1 1 1 2 792. 1
1 1 1 1 3 1 1 1 1 1 1 1 1 2 2 3 3,1 1 1 3 1 1 2 62 ,
3. 3 1.1 2 3 1 1 1 1 1 1 1 1 3 2 1 3 1 1 1 3 1 1 2 584. 3 1.1 1 /1 1 1 1 1 1 3 1 1 3 3 1 1 2 1 3.3 1 2 3 60
cp
t
51
3 3 2 3.3 1 1.2 3 3 2,233 2 33 3 2 2 2 1 2 2 21
6.
3 3 3 1 3 3 3 1 3 3 1 3 3 3 2 3 3 3 3 3.3 2 2 2 8
7. 1.1. 1 1
t
10.10.
Legend:,1 = Data' ale ed by S at&
and in C puter2 = Data Collected by State .
but not in Computer3 = Data Not Collected by
State= Data Needing: Further
Clarification
6..
41
...43 li,<ca - 0 ow - < ° g 15.< de < Z_ 0 X CC ta < X z 3 3.
0 a2 < 2 0 < ° < < < c n 0 < - ; 0 - . . , c , )- . 0 5 z (c 0 ,,,- Ili - < sa IliCI C I)4 N 1 OC C ZU 4i Ei. C C 4 L <= j_Z ... 1*(11 g zt cc ( / ), g . zZ< Q. - :1- -1 Z -1 0 0 6 < w 0 < < cr --1 -rxx<oou3_33u< in ,..1 z< < < < 0 0 0 0 U. (.7 I - It le -J 2 2 2 EE
0
<, < ,-<< 0<
0 LuZ ar
W.E z
D. Unification
1. Basis.on Which TeachersCertification Was Issued
2. TN/0 of Certificate Heldleg. life, admin.: pro-vision* etc.)
3. Subject Area(s) of Certi-fication (Endorsement)
4. Date Certif. was Issued5. Date Certif. was Utilizsed6. Date Certif. Expires7. Certificate(s) held in
Other States r .8. Other
E. College Preparation
44.
1 2 2 1 2 1 2 1 1 2. 1 2 2 1 1 1 0-2 2' 1 2 1 1 1 2.2 1 19
1,2 2 1 2 1 2 1 1 1 1 2 1 1 1 1 1 2 1 1 - 2 1 2 1 1 2 1 1'f
1 2 2 1 2 i 2 1 1 1 1 2 2 1.1 1 1 2 1 1 2 1 1 1 1 2 1 1
1 2 2 1 2 1 2 1 1.1 1 2 2 2'1 1 2 2 101 2 1 2 1 1 2 1 21 3 3 1 2'3.3 1 3 1 1 2 2 3 3 3 1.2 1 3 2 3 1 3 1 3 1831 2 2 1 2,1 2 1 .1 1 1 2 2 1 1 1 1 2 1 1 2 1 2 T 1 2 1 1.
'r
a"--- 3 3 3 3 2 3. 2 1 2 3 2 2 312.2 3 3 2:3 2 3 2 3 3.3 2 .21.
1. Total Hours College Credit°
2
2. Yr. Last Crediewas Earned .2
3. Degree(s) Earned °
23e2 2 3 2 2 2 2-12 2 1 1 1 1 2 2 2 2 2 2.2 2- 1 3 1 2
3 3 2 2 3 2 2 2 2 2 1 d 3 1.1 3 2 1 2 2 2 2 2. 3- 3 1: 3
a. Type.. , 11 2 1 1 2 1 2 1 1 2 1 1 1 1 .1 1 1 -2 1. 1 .2 1 1. 1 1 2 1 1
t b. Date Earned 1 2 1 2 '2 3 2 1 1 2 1 1 2 3 1 1 2 2 1.2 2 1 2 1 1 2 1 2
c.College Name 1 2 1. 1 2 3 2 3 2 2 1 2 '1 1 1 2 1 2 1.2 2 1 2 1 1 2 1 2
d. College Location 2 3 3 2 2 3 2 3 2 2 1 2 j 2. 1 2 3 2 1.2- 2 1 2 1 3.2 1 1..4. Transcript of Credits 2 2 2 2 2 3 2 2 2 2 2 2 2 2.3.2 2 2 2 2 2 2 2 3 2 2 2)5. No. of Credits. Preparation .
,
in Major Teaching Area 2.23 2 2 3 2 2 2 2 2 2 2 2.1 1 1.; 2 2 2.2 2 1 3 3 2 2,
6. NSF SupportedProjects :Attended .b . 2 3 3 3 3-33 2 3 3 2 3 3 "p 3 "3 3 3 2 3 3 3 2 3 3.3 3 3.
7. Other. - 1 . 1 N /
F. Salary.
1. Salary2. DayS of Contract3. Full or Part:time Employee4. Fringe Benefits5. Extra Pay for-Extra Du6. Percent of Salary Sup-
, ported by Federal Funds7. Other
G. Miscellaneous-
1. Military Experience2. Non-teaching Job Expetr3. Other
/
1 2 12 3'1 2 1 2.1 1 1 1 1 1 1 1 2 1 1 1 1 3 1 1 2 1 1
2 2 1 3 3 1 3 3 1. 1 2 1 1%1 3 1 2 3 3 2.3 3 1 3 3 1 2
1 2 1 2 3 1 2 1 3 1 1 1 1 1 1 1 1 2 1 1 1.1 1 1 1 2 1 2
1 3 3 3 3 3:3 1 3 1'1 2 3 3 3 3 3 3 -3 3 2 3_3 1-3.3 3 33 3 3 3 3 1 3 1 3 1 2 3 3 3 2 3 1 3 1 3 2 3 3 3 3. 3 3 3
2 2 3 3 3 3.2.1 3 3 1 2 1,1 3 2 1 3'3 1 3 3 3 3 2 3 3 31 1
2 3 3 3 3.3.3 1'2 2 1 2 3 3'3 2 3 2 3 2 2 3 2 3 3.3 3 22 3 3 3 3 3. 3 1 2 2- 2 3 3 3 3 2 3 3 t 2 3 3 2 3 3 3 3 3
. aa ES
< 0 Z < < Zi- D, 0 0 Z -J W
'-' D cc w o - Oz> < < W i- ,4 1- 0 Z 0 0z -J LI) 0 0 2 Z - (-9 CC c7) 0_,-, )>- . L , ozz50,.,=0 N
- J'' (470 F F zW .C1).< 1 2 3 t 1- - g L.: <0 zw z 0 p z x < Cc U) cf) 8 %.., r- ZCC w i 0 0 Lu Lu 1- W ... <w->T<omomm 1- 1- J>> CI <4,
*
;b
§ dz
0C
D. Certification -
11 3 1 2 3.1 2 1 2 2 1 1 2 1'1 2 1 2 2 50. .
,26/24/2
2.1 1 1 1 1 1. 1 1 2.1 1 1 1 1 ? 1 1 1 1 1 2 3 75 3 2 39/12/1
3. 1 1 1 1 1 1 1 J 1.1 1 1 1 1 2 1 1 1 3 1 1 T 2 2 751 1 1 2 1 1 1I 1 11 1 1 1 2 1 1 1 2 1 1 1 2 2 65 .
4, 3 3 3 2 1 1 1 2 3 1 3. 2 3 3 2 3 3 3 2 3- 3° 1. 2 3 295. 1 3 1 2 1 1 1 1 1 1 1 1. 1 1 2 1 1 1 2 1 1 1 2 3 1 696.7, 3 2 2 2 2 3 3 2 3 3 3 3 3 3 3 3 3 2 2 3. 1 1 2 i 4 40 56 2/21/29
, 8.
1.4t
23
352127
2-0
50 '4-
3'9/12/134/18/015/11/26
'36/14/2 .
E. 'College Preparation, 2 1 2 2 2 1 3.21 1.1 21 1-3 2 1 2 2 2 2'1 22 29 62 10 E15/32/5
1. 2.3.2 2 3 1 3 2 3 3-2 2 2 3 3 1 1 3 2 2 2 1-2 2 17 50 33 9/26/17'2.
.... 3. 1 1-1 1 1 1 1 2 2 1-1 1 1' 1 2 1 1 1 1 1 1 1-2 2 77 23 . 0 40/12/01 3.2 2 1 1 1.2 21.1 '1 3.2 2 1 3 3 1.1 1 1 2 2 50 40 10 26/21/5
. 1 3.2 2 1 1 1.2 2 1-1 1 3-1 2 1.3 A 2 1 1 2 2 2 48 42, 10 25/22/51 3.2 2 1 1 1 - 2 2 1 . 1 23.1 2 1 3 2 2 2 1 2 2 2 33 50 17 17/26/92 2- 2 2 2 1 2 2 2 3.1 2 2 2 3 2 3 2 2 2 2 2 2 2 4 85 12 2/44/6
a 4.
5. 2 2 2 2 2 1 2 2 3 3- 1 2 2 2 3 2 3 2 2 2 2 12 73 .15 6/38/8
6. 2 3 2 2.3 3 3 3 3 3-3 3 3 p 3 3 3.2 2.3 3-2 2 0 23 77 0/12/40.7.
F: Salary /,
1 1.1 1 1 1 1/1 1,1 1 1 1 1'2 1 .1 1 1 -1 1 1 1 1 '1
1. 1 3 1 3.1 1 2 1 1 3 3.1 1 1 2.1 .3 1 /1 1 3 1 2 t-2."1 3 1 1 1 1 /I 1. 1 1 1 .1 1 1 2 11 1 1 1. sis 1 1 1
3. 3 3 3 3 2 3/s 3 3 3 3 3 33' 3 3 3 3 3 1 2 3 3.1 24. 1 3 3 3- 2 1 / 3 3 1 3 3 3 2 3 3 2 3 3 1 3- 3 1 1 2 .
5: / (''''%v"
6. 3 3 '3 3.1 ,3 3.1 3.3 3 3 3 2 '3, 3 3 3 3 3 2 2 31-- , 2- =.
7 . /
G. Miscellanecaii3 2 2 /2 293 2 1 3. 3 2 2.3 2 3'3 3 3 2 2 3 1 2 2
1. 1 3 2/2 3 3 3 3 3 3 2 3 3 3 3 3 3 3 2 3.3 1 2 22. 1/3. 15
83 13
46 17
81 13
13 1021 1
15 17
4 43/7/237 24/9/19
6 42/7/377 7/5/4065 11/7/34
67 , 8/9/35
42 50 4/22/2625 67 4/13/35
12

3
13
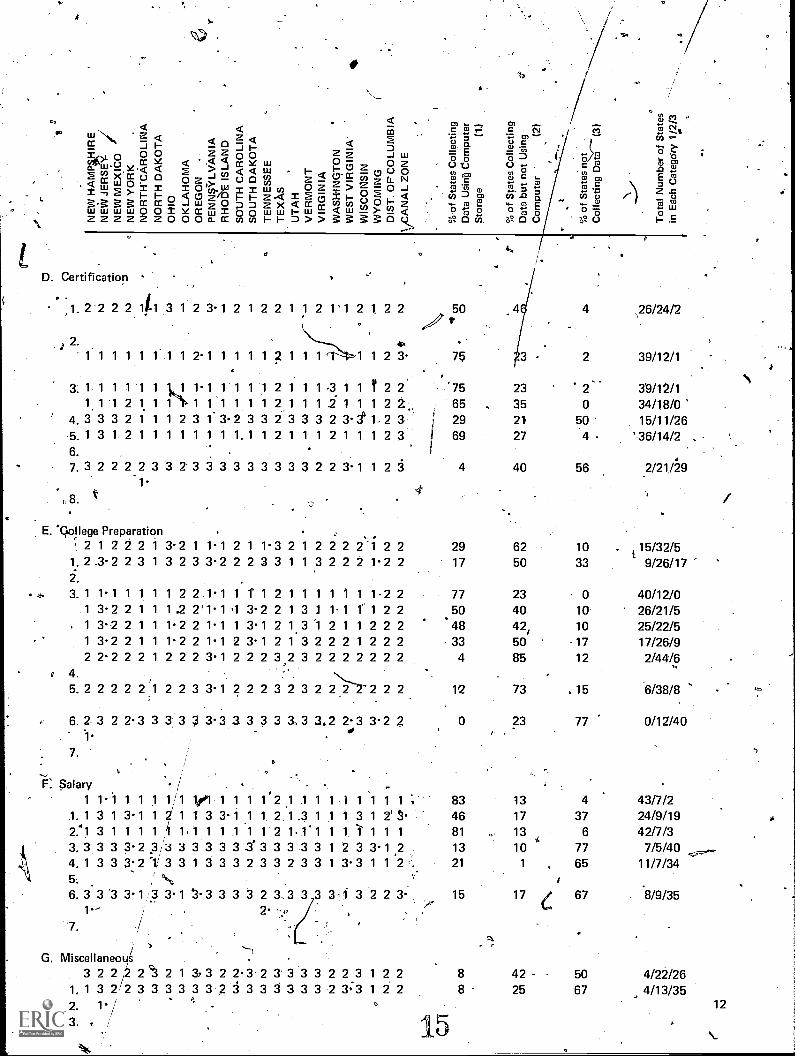
The data collected in the survey were presented topartif*ants at the Las Vegas Conference where theywere Carefully considered in 'group discussions inorder-to identify tatterns that would be important inassessing the 'value or existing data for answeringquestions, pertirtert\I to science education. The follow-ing general and specific observations were recorded,during those discussion-s:
The dat*Inosee readily and most consistently avail-able are related more to identification than toteaching characteristics.Those data bf a highly personal nature, such as race,place .of birth, &id marital status, are not consis-tently recorded.Much of the information that is collected andcomputerized appears to be primarily related to
" state financing of school systems and to teachercertification. a
The quantitative nature of the data being collecteddoes not reflect competency of teachers or effec-*tiveness of programs.Data related to the nature of programs such asname of text, number of pupils, duratfon of courseand credit per course are not bonsistently.collected.The data most collected tend to have greater valueat the state level than at the national level.There is little reciprosit" record keeping amongstaid. r)The kinds of data collected consistently have little
,reMvance to the Nique aspects of science educa-tion.There are practically no items of data, other thanthose related to identification' and ,certification,that are collected uniformly in all states.Approximately 15% of the states do not have a wayto correlate teachers names with social securitynumbers.There is almost no information kept on militaryexperience and jobs outside of teaching fields.There are very- few data collected that indicate ex-
peience teaching specific courses.Many other observations of a specific nature are
obvious from studying the data matrix. It is especially.interesting to compare the percentage figures given inthe three columns at the right side of the matrix.
The conference participants came to iome cpnclu-.sions following their discps
ciburvem:
The available data will nomining inservice and presscience teachers.Competency of science toscience teaching programsfrom da %kept in state dataIt is knolinthat some stattions on da gathering. tvalidity of national studiesThere is little correlation belected and the pkoblems relaand science teaching.Analysis of the data from t
cated considerable conaaencYnot indicate in, any ihray wh
fo,(low-up to the origi al yrunder which the vario s states
' appehdix) was designed anddetermi e the frequency o
ion of the result's of the'
be very useful in deter-rvice training needs of
chers and adequacy, ofcannot be determinedanks
have statutory limita-at, in turn, will limitsing state data banks.
en k'incli of data col-ed to science teachers
he initial survey *indi-in data items but didt the conditions areollect their data. As a
sources'as thosttaruabl
ing thetion. Bformatilation or As a
identifi0.0.,(1) Per
doArep
CeiYid
do
licePropa
aboproFin
t, p
8, a secosent to-data c
id form (seehe states toIlection and
f data for the same categories of informationon the original instrumen These data arein-judging the reliability of ih data describ-
characteristics of the science teat er poputa-cause of the interaction of the sour of in-n with the frequency of collection, the tabu-
,
these data is unusually complex.matter of clarification, the data sources wered as follows:onalreport forms submitted by local educa-agencies to state departments of education.
ommon example would be the fall or annualrts that are often required.
(2) ficationreport forms submit-recl by indi-als of local education agencies, tn artifice-sections of state departments of ecification.
se could intlude applications for teachingses.
ramreport forms submitted to the state de-ment of education providing informationt an individual teacher who is involved in aram involving state or fe bral funding.
(4) ncereport forms su fitted to the state de-pa ment of education hich provide informa-tio on, nearly all teachers in the state. Suchrep rts are related to state financial aids to locale u ation agencils.
, The r s Its of this second survey are included ort thefolio ing five pages. °
(3)
7<
,<
IlU
).
"<
Z <
r.,
w-
_,.-
7,i_
<A
L wi
oo o
o 0 oz E
D z
:U
)>
"0
I)-4, la- Y
< <
CC
<C
CIL
< <
Ul
0 6U
)- <
1:1U
)
1<
< ct
cr-Z
Z 1
<E
0 oii
.1-..1-.
cc0
u) 0 <,L1r,
2°I
c c. e f ,
2z <
0z
<0 71 -
0 5 z-
<D
'E
T)
LI!),_
°D
C) x-
2} ± i-----
r 1 01 1
111U
)o E
'-'_z 5,,-
c3
-F
elc
c5
< <
< <
_1U
.IU
. 0..,.
< _I
In g z wz
s27: E
,01 1"
.g°-"*.
C)
-IZ
Y2E
>u, w w
<Z Z
Z Z
Z Z
Z 0 0 0
LULU
0 0 iF
Ci
ICIC
° 51-
1-z <
1
g 2IT
ill15
>r 5
LI
D D
Z X
< C
C0
g -g g i z 6 < tn
I-z tc 2 i
,o
.,
7. Hom
o address-
24 22 23 23 25 66 25 11 25 66 15 11 25 66 66 28 34 66 31025 41 66 2266 6625 66 25 66 22 11 h 66 27 25 22 66 11 25 22 24 25 11
1121 51 25 11
1111
..
31o
,.
21 55t7
27
21 141
'21
31414
.41
311
,. '51
478. M
arital status24 22 11 23 66 55 66.11 25 25 15 27 11 66 15 66 66 66.31 25 66 66 22
25 66 66 66 25 66 11 27 25 11 66 25 66 11 17 51 11'45 25 11111 25 21 66
-1111
11...e.
21,'5525
2125
31...,=
.41
471'_
4151
`61 Citizenship
24 22 23 66 66 66 25 11 25 25 15 11 25 66 66 25 66 66 66 25 66 66 22 52 6625 25 15 25 66 25 27 25 66 06 25 22 66 17 25 22 66 25 66 66 55 21 25 25 66
15 25.
2125
,0.
..41
,,,,,,45
<:,
,51
1
8. Teaching A
ssignment ,
,)-4.
\f%
1. Nam
e of school41 11
11 31 66 51 31 1111 41 11
11 51 11 11 11111 3131 25 41 66 21 10 31 31 41
11 2111
1111
11 11 51 1111 51 11 51 11
11 5111
11 3 1 '31 51
1111
1131
/ '51
2131-
2741
3127
2141
21
41.
7--,--ri'
4147
)357
.1
472. ,A
ddress of school\----i
41 1123 66 66'66 11
11 41 11 11 511,1
11 1111
3131 25 41 66 21 10 31
31-41
11 21 66 1111
1111 51
11 4751 11
5111
11 5111
1131 31 51
1111
1131
5121
27-41
3127
.21
4121
..
314
4141
3141
.-
573. N
ame of school district
.41 1111
31 66 51 31 '1,1-11 4111
11 4111 11 11
11 31 31 25'41 11 21 10 31 31 4111 21
11. 111,1
1111 51
1111
1111 51
1111 51
1111 31 31 51 11 11 66 66
5121
27 51041
3127
3121
4131
'41
4141
AlF,
'41,
.I,
5751
4. Nam
e Of courses taught
41 6631 66 $1 66111 11 31 11 66,11-
.1111
1131 31 31'41 31 21 10 31 31 41
11 2111
1111 66 11 51
11 3111 17 51
1111 51 11
11 31'31 5111
3115 30
5131- 41
.. 27
4727
,25
1.41
4731
'10
-..ii,41101,`
,57
-----
5. Nam
e of courses assigned51 66
66 66 66,66 66 66 31,1,1 66 66 66 .66 1111
31 66 31 66 66 21 66 3131 66 11 21 66 11 66 66.11
11 66 66 17 5111
11 5511'66
31 66 51 5231
31 30each period
.
'
,41
f27
,'p -
.a..
47...
57
6. Nam
e Of text(s) used in
41 66--31 66 66 66'66 66 66 66 66-66 32 66 66 6,p 66 66 66 66 66 66 66 66 66 66 66 66 66
1166 66 66 11
66 13 51 66 66 54 66 66 31 66 51 66 66 3131
..--27
each course.
'.-''47
.057
-,.:),
.-...
.
7. Num
ber of pupils per51 06
31 66 66 66 66 11 211151 56 66 31 31a 11 11.31-31 31 66 66 21 66-31 -66 66 66 21 .1111
66 .11$1 11 31 66 17 66 11 11154 11. 11
31 31.51 52 66 31 3541
..:
....
27,
-47
*,
-E57
.8. D
uration of course41 66
31 6'6 66 66 5711 -31
51 66 66 55. 3111
11,31
.31 66 66 66 21 66 31 66 41 66 2111 66 66 66 11 51
1131 66 17 51
11 11-54 66 11 31 31 51 66 31 31 35:,
goe s or months)
514
4147
e.
a57
.(....-
.51 6631 66-66 66 57 11..31 51 66 66 55 66 11 11<
31°31 66 66 66 21 66 31 66 41 66 21 11 31 6666 11 5'
1166 '1-3 51
11 11 5411 31 31 51 66 31 31 35
41.
--2'7
..,.
47 .4'''...
57
CO
111,-e
umber of m
inutes perw
eek each course meets
z
RE
SU
LTS
OF
SU
RV
EY
OF
ST
AT
E D
AT
A S
YS
TE
MS
Frequency of D
ata Collettion apd S
ource 'of Data
Coding S
ystem
Explanation: E
acrr item on the qta survey form
isprovided space for four (4) double digit num
bers.T
he 10's digit of any double digit number
represents the source of data and the 1's digitrepresents the frequency of collection.
A. P
ersonal
1. TeZ
cher name
2rtrt
0N7:2
24 1111 23 25 55 25.11
51'
31213141
23 25 54 2511213141
24 1111 23 25 55'25 112131
2. Social security num
ber51 11
11
3. Sex
Race
5. Date of birth
6.. Place of birth
\
6
OU.
cc0
Source of D
ataC
ode N.
10P
ersonal20
Certification
30P
rogram40
Finance
50O
ther.60
Not C
ollected
OI 211-
O _1r
OO
tr)E
T)
5O
Frequency of D
ata C011ectiqn
Code N
o.0
6 months
1A
nnually2
2-5 years3
6-10 years4
10 years and over5"
One tim
e only6
Not collected
7O
ther
a
2(3
Occ
11 25 15 11 1111
11 11 11 31'31 35 41 11 21 15 25 31 25 15 21 1125 41
27 25 27 25 25"41
.31
-5'31
4155
3141
r
25 25 1511.11 11.
11-16 11 41P 31 25-4-1 66 21 15 25 25 25 15 21 11
55 41,27 25 27 25 25-
.131
3141
31'r
41
ti
Coding S
ample
The S
tate of Louisiaria collects data on:teacher nam
es from tw
o sources(i.e,, '
Program
30,and Finance 40). T
he'frequency of collection is annually (i.e., 1).T
his information w
ill appear in the column
of data under Louisiana as 3141.
11 11 25 11 412741
11 11 25 11 4127
Ai..
25 25 15$11 11 11 11 25 11.
31 25 66 11 21 15 25 66 25 15 25 11 11 11 25 1195
4',2525
3141
27
25 ,,15 11 11 66 11 66 66 66 31 25 6666;66115
25 25 24 66 66 1166 25 11 66 25 66 11 66 51 66 45 41 66 66 25 66 66 66 66 45 66
.,'`
27 25-
k.' 31
41
i25 25 15 11
11 11.11 25 11 66 31 25 66 1i.' 21 15 25 25 25.15 25 11 25 11 25 11 66 25 11 11 1725 11 24 25`11 11 25 21 25 11
5527 25 27 25
3141
2741
21-
454151
25 25 15 11 25 66 66 66'66 66 31 25 66 66 21 15.66 66 66 66 25 66 26 27 66 66 6625 66
66
17 2521
24.66 11-zr.645 65 66' 15
=21-
5
41f
24 22 11 23 25 55 25 11213141
24 2223 25 66 66 1121
t 3141
21 11 1111 51 11
2721
3141
4151
25 11 11, 17 5127
2141
4151
41 25 1111 11
2221
414151
11 41 11 11 25 21 51 11 11,11 .3124
2521
413145
11 66 41 11 11 25 21 51 1111
11 45213145
51 11 24 4111 11 25 21 51 11 11 11 15
45213145
274151
11 15 25-253245
66 24 25 66 66 25 21 25 25 66 15 25"
45.
2545

.<
<I
ID
0es - <
DY
0SC
Y0 0 w
-----0
to 0 lea
aa
< a
co-
17,--cr- < <
le z>
" <z
2a
stm
u' x cco
Qa
t./) <Z
wF7
2<2 to ---4c.)<
0_w
0 ttes <
in 00 Z
<,...,Z
_1/4.--jrw
tg-...08Z<
7 (7)I L
i- i>
7 < <
0, 2
>-
zZ
0iss. w
jzi---gr'-`1- o z < - -tc-cc----, z z <
a , u)cn°
lico'
§a
,_ 0 < cal,
. m
/7:frE -;:¢
-6 8 8 851'
(u;1
...,...,
..,0
..,
.zto
_1z o
3cc
UJ 0
(1)0
In11.111.111.1
I 0 8C
OY
7 7I I
, - Y IL
-J g.
222ZZ
Z Z
Zse
se0 0
t
4. Date certificate w
as24 22 23.23 25 25 25 11 25 25 25 27 25 27 25 22 21 25 '51 25 15 66 21 22 25 25
25 15 25 25 22 27 21 11 25 22 27 25sil
4121
11issued
A..
I
t5. D
ate certificate was
°41 66
23 25 66 66 1 1 66 25 66 66 66 66 66 66 27 -66 31 66 15 66 21 22 66 66 2566 66 66 22 27 22 66 25 22
25 11 66'86 66 25 6621
s
Lu7
0a
11 25-32 24-25 21 11 25 21 25 27 11 15 2521 2545
utilized51'
45Ir
6. Date certificate 'expires
24 66 23 23 25 25 25 11 25 25 66 27 66 27 2522 21 66.51 25. 66 66 21 22 25 25 2615 25 25 22 27 22 11 25 22 27 25
.45
7. Certificate(s) held in other
66 66'66 25 25
11 66 25 66 27 66 66 66 27 25 66 25 15 66 66 22 66 25 25 1566 25 66 27'6655 25
25 11 25 66 66 25 66 66 66 21 25 26 66' 15 66a
states,
0.
E. C
ollege Preparation. -
25 21 66 66.66 15 252545
11 51 32 24 25 21 11 25 21.25 27 11 15 6621
4121 2547
2125
1. Total hours college ,credit
24 22 23 23 25 15 66 11 25 27 21? 27 25 -'1111
11, 27 25 21 25 15 66 22 22 25 26,25 15 25( 11 22 27 66 11 27 22 11 25 11 25 1124 25 52 11 22 21 25 27 11
15. 2121
27 25 2231
2541
4121
3141
32
2. Year last credit w
as earned
0
3. Degree(s) earned
a. Type
j24 22 23 23 25 66 66 11 25 25 27 27 25 66 66 22 2127 31 25 66 66 22 22 25 25
26/66 25 25 22 28 66 11 28 2141
2151
313T
66 11 51 32 24 25 -1111 22 21 25 27 11 15 21
2121
-32
24 22'23 23 25 15 66 11 25 25 N 27 11 27'11,22 11 25 31 25 15 21 22 2
5 25 25 15 25 11 22 27 25 11 27 25 .11 25 11 51 32 11 25 11 11 27 21 25 1111 15 25
412055-
.25
25.'
4141
21.-
2421 25
5131
'41
3547
b. Date earned
24 22 7 3 23 25 15 66 1 1 25 25 25 27 25 27 11 2225 41 25 15 6
22 22 25 25 25 15 25 25 22 27 25 11 27 26 27 25 11 25 32 24 25 11 66 27 2125 11
11 15 2541
21 5525
^4
2121 2S
\. 51
31'(
s '.
4%,
35
147
.c.
College nam
e24 22 23 23 25 15 35 1 1 25 25 25 27 1 1
1 1 22 1 1 25 31 25 15 66 22 22 25 25 25 15 25 25 22 27 25 11 27 25 2725 11 25 32 24 25 11 66 27 21 25 '11
21 15 2541'
21.5525
2521
25.
5131
.32
-\,.
24 22 23 23 25 15 35 11 25 25 25 27 25 27 66 66 11 25 31 25 15 66 22 22 2566 25 15.25 25 22 -27 25 66 27 25 27 55 11 25 66 24 25 11 66 27 21 25
11 15 25-41
2121
21 2551
3132
d. College localion
LA
I
54-
Transcript of credits
--.
24 22 23 23 25 15 35 11 25 25 27 27 25'27 25 22 23 25 21 25 15 66 25 22 66 2525 15 25 25 22 27 25 66 27 2.
2711 25 32 24 25 22 66 27 21 25 25 11 16 25
'21
4121
2531
cs)

,11.co
<Z <
r.<
,_
.,
0 --,z
0Z
D`I- . °- -
Y <
<<
CC
M<
leco
0c-)
w>
et0
(11
<ci
<0
F.
cc.
z1
.,:t0 1- t cc
2ct 0 0
2<0
<'2
<,- Z
ulz<
c.)<
<<
,..,co ,<
coc) <
< c)
<0
10 Z1
>2
m ' 0
c c w D
° 0-<
0e5 z
< D
63 W....
. <-I
0 28 <
00
Q .
N.,
z < <
, - z --I z.,7, . 6-
<>
....=
r.-, w
;I- 0<
0 Z2 2F
- .1--01<
23
0 F-
<' < <
0Z
< C
CC
C
-1Z
0 01
...2...._2
0 0_
1w
< 3
`2.0'<
Y---D
--.<-<
< 5' z w
w °
>w w
7 7X
<cc
2,2 gcrg
w F
-<
< <
--<0 0 011.0
IC) C
/Y
---;r2 2 2 -E2 2 2
Z z
0 -LO
.j
0 0ro w
i- 75
g 270(9.
LL
_Z 0
2
10. Credit per course
51 6631 66 66 66 57 66 31 51 66 66 55 31 11 11 31 66 31 66 66 66 66 31 66 41.0 66
11 66 41 66 11 51;1166 17 51 11
11 57 66 66b
131 51 60 66.31 35
4127
51.r^
47
"457'
11. Grade level of course
51 66 1 1 31 66 86 66 57.11 31 51 66 11 55 3111
11 66 31 66 41 66 21 66 31 31 41 66 2111 31 11 66 11.51 11
66 13 5111
11 57 11 11 31 31 51 66 31 31 3541
4121
-4757
12. Assignm
ents other than41 66
31 66 51 66 57 11 31 51 66 11.11 11 1111
3131.031 66 66 21.66.31 31 41 66 21 66 11 27 66 11
66 1111 13 51 11
11 57 1111
3131 51
31 47 35
4iiin,ceteaching
51-.
41,.
....A2141
457
C. T
eaching Experience
,r-%
1
.-
1T
otal years teaching41
1111 23 25 51 66 11 25 27 11.2727 11 11
1111 31.31 41 41 66 21 15 31 66 41 11 25 11
11 27 2111
41 21 1111 17 51
11 41 41 1111 21 21 2'1-4411 15 41
2541
experience51 22
21 55 41.
.51
4141
2125
31-
e41
32.
--e-41
5145
2. Years of teaching
451 22 11 23. 25 51 66 11 25 66 11 27 11 66 66 11 66 31 21 51
66 2166
41
11 25 11 11 27 66 11 41 2f 1111 17 25 11 41 25 66 66 21
21
21.66 11 11 41'
experience in state21
2741
4121
oa21
3141
'32
41a
'51
45.
3. New
to state41 22 11 23 25 51
6611 25 66 15 6611 11 66 21 11 66 31 45 41 66.66 15 66 66 41.11 66 11
11 66 66 11 66 25 11 66 17 25 11 41 25 11 66 21 21 21 66 11 15 35
o51
0.
21r
4121
-25
(.:N.1
3147
31
4151
45
4.l'tto district
41 22 11 23 25 51 31 11.1115 66 66 11
1111
11 66 31 45 41-66 21 15 31 66 41 66 66 1141.11 2111 66 25 11
11 17 51 11 41 25 11 11 21 21 21 66,11 1551
21°
31
4151
..
.
41 41.41
2725
4731
S.
4157
45
5. Previous years placem
ent41 227,
66 25 25 66 11 25 215 27 11 66 66 11 66 66 31 41 41 66 21 66 31 66 66 11 66 66 22 27 21 1_1'27 21
66 17 25 66 41 41 66 66 6621 66 35 66 15 45
of employm
ent51
21 5541
...
4121
25-
31.s,
.41
32
.-,,'
,41
51
6. Years teaching .present
51 66066 25 66 66 11
2566 16.'66 27 66 66 66 66 66 66 66 41 11 66 66
66 41 56 66 66 66 27 66 66,6621
66 17 66 66 66 25 66 66 21 66 66 66 66 15 31
course(%)
21.27
25
)31
.,O
.
41
i47
31
57
.\
A.
ji5. C
ertification;
1.figsit--on w
hich teacher24 22 23 23 25 25 25 11 25 25 25 27 25 27 11 22.23 25 21 25 15 21 21 22 25 25
25 15 25 25 22 27 22 6622 25 66 11' 25 '32 24 25 66 11 25 21 25 27
15 25
certification was issued
'31 5525
.t
2141
25'10.4..
..
.sional, etc.)
....:-
/1-..-7.±
:722 it'2. Type
Type of certificate held
'22 27 1111 51 32 24 25 21 11 27 21 25 27 11 15 66-
(e.g.,-41
31.
2141
25(e.g., life, adm
in., provi-31 2555
47
3.Subject areas) cif C
ertifica-tion (endorsem
ent)
- - -
24 22 23 23 25 2525.1t
25 25 25 27 25 27 25 22 11 25 31 25 15 21 21 22 25 25 25 15 25 25 22 27 2211127 22 27 11 21 51 32 24 25 21
11 25 66 25 2, 11 15 2 L31 55
31
_21
2457
-41

F)
E P P.
A P
§ t2 '6. m133 c'CD m-n
F De., F, i7 .4a -0 .
.2 Z' 13 < 0,'0 Fo 0. 0 <CU : g 2 c7)x -.a.-o e
.9,
-"4 .. = Cy":-...1
a- Z I. . le.,
.s i.0. . xc-
2. co _
!
4. . 0 .1.3 A a) 0 0 A 0 N ALABAMA
J C.0 ...-1! ... W 1:1) -a -.. r -A A
a) a) a) a) a) a) a) - IN ALASKA. a) a) a) . a) a) a) _. N
; :, N ARIZONAc..)
, a) to to 05 to .c.) a) Na) a) a) a) 0 c..) ARKANSASa) a) a) a) a) r.3a) a) a) a) a) an an CALIFORNIA
0 ca a) _. COLORADO- a) 0a) CI a) a) . CONNECTICUTa) a) a)
Aa) it c..)
IQ 1 - A - A DELAWAREA
Wa)a) d a)
a)a)or a)
a)a)a) m
a)a)a) 0N FLORIDA
N IN A A A A A A 's 1.3
0 an k GEORGIA-. -. 0 0....
_. - _. -. _. N N0 0 - ..1 - -A a) cn HAWAII a;
.7.:0a)
a)a)a)
a)a) a)
a) -- a) IDAHOa) a) a) Ul N 0 A N a)a) a) 47) `-,: - a) - - a) a ILLINOIS'_. -.... - _.
a) :: -' 1 r..t1 INDIANA
. f. - a)a) 1,,`A -"IOWA
A al a) a) AN. 0 A N CI) A N -A
a) a) A ..,: A A A A ar,
KANSASa) a) e . . a) - r.3 -
a) cm , - a) KENTUCKY
to to to to A .0 A .4 A .0 a) N LOUISIANAa) a) a) ... -a a) 00 -0 , t4 a) c..) a) c..) N N MINE4
N N ...IVIHINEa) _. a) a) - .,
0 0 a) a) N.0 'MARYLAND0 A A
A. A A A._. . _. a)
a) a) a) a) - .... , a)a) a) a) a) - ..s a) m MIC.HIGAN
N N to to to to toa)a)a)a)a)a).
a) MINNESOTA0 0 ,
MISSISSIPPI
a) a) c..) .2a) ..) c..) a)
a) a) a) - a) MISSOURI
0 to to ii...,- to GA to Na)a)0.. MONTANAa) a) a) ,, a)
' a)a)
a) a)a) a)
a) A A A a)a) NEBRASKA
NEVADAa) 0 a) ::. 0a) N a) N N N N0 a) 0 NEW HAMPSHIRE
a) a) a) a) - a) a) 40) I 0 0) . a) a) ..1 a) cn to NEW JERSEYN N :: _.0 0 a)
a) a)a) _ r.3
N NEW MEXICOto A 1.3 A a) A A, A A NC1) NN a) -. , P J J NEW YORKa) r.3 A r.3 A r.3 A. r.3 A. IJ A 1.3 A 1.3 N Na) - _. _. 0 0
.cn a) a) a) 2 -.a) . a) a) a)
P
to
. in CU FD. CI/ la, 5
5 w Ebr-o-0 o 0
Sa,0 a 0 a-0 3 ElLa. ";"
H7 -s.
1,101/1.111,
I
A N
(71
a)to N
a) a) a)a) a) a)
a) ai
\a)
Ui
to to to to Ul
Ts)to to -A
CO CO CO -.CO CO CO - CO
CO -.Ul....,j ...)
N -A...)
a)
0 IQ -A U1 IQ 0 IQ -A...1 -A - ...1 -. ...-
Na) a)
a)
a) a) _.a) a) _.
A A toa)
0 A
a) a) a)a) a) a)a)
a)a)
a)a)0 .4 a).4
.r, 4,. -.
N N0 e 0 Ua) l
a) a) to a)a) a) to a)
W 0 to 0 - 0 A a cn .,.) r.0 0 .4- A
ca
N N UI A..T1 . 0 0
to
a)
A
- C.0
Ul r J Ul IQ
A A
Ul Ul
-6 A
a)a)
tiNtAu;DUI4 A A
'NORTH CAROLINAcn NORTH DAKOTAa)a)a) 1..3 " OHIO
1;3 OKLAHOMANal OREGON
0 PENNSYLVANIAN
N -_._. RHODE ISLANDN0 - SOUTH CAROLINA
., .SOUTH. DAKOTA
.1V TENNESSEE
21
TEXAS
UTAH \m' VERMONTa)
a) VIRGINIA 'a)a)a)
ar WASHINGTON
0 WEST VIRGINIA0a)o') WISCONSIN
WYOMINGad co r.3 GIST. OF COLUMBINall 0
CANAL ZONE,
64,
V)
9 V
0
. 18

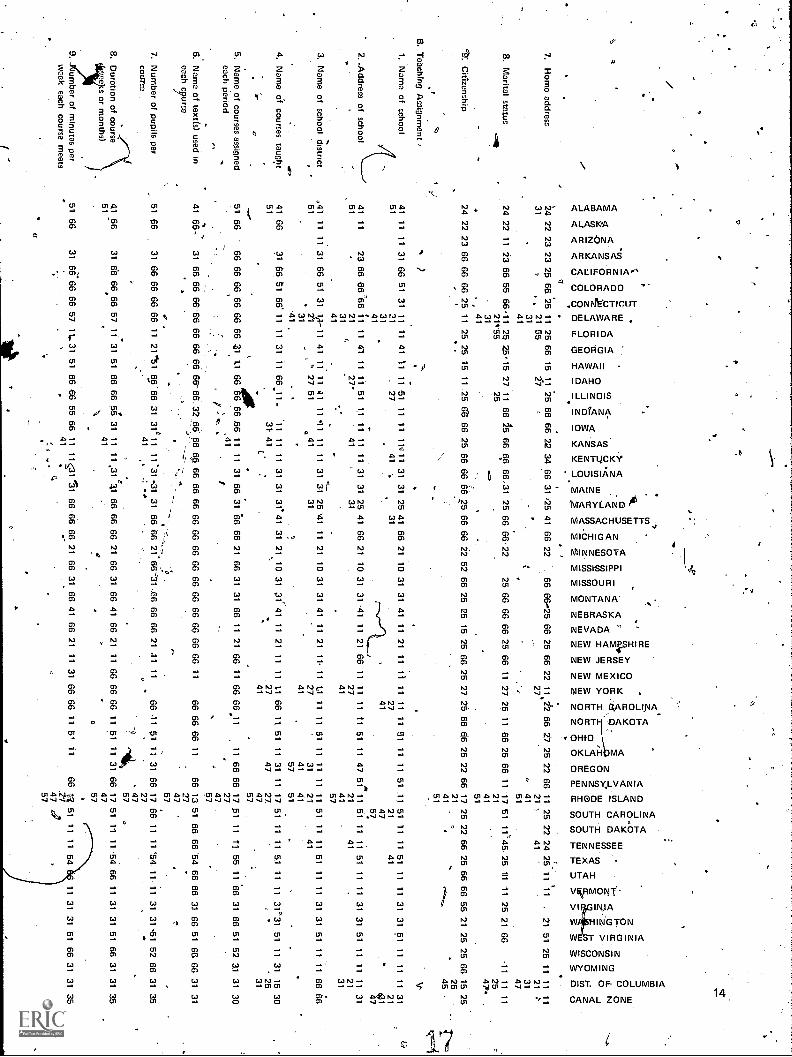
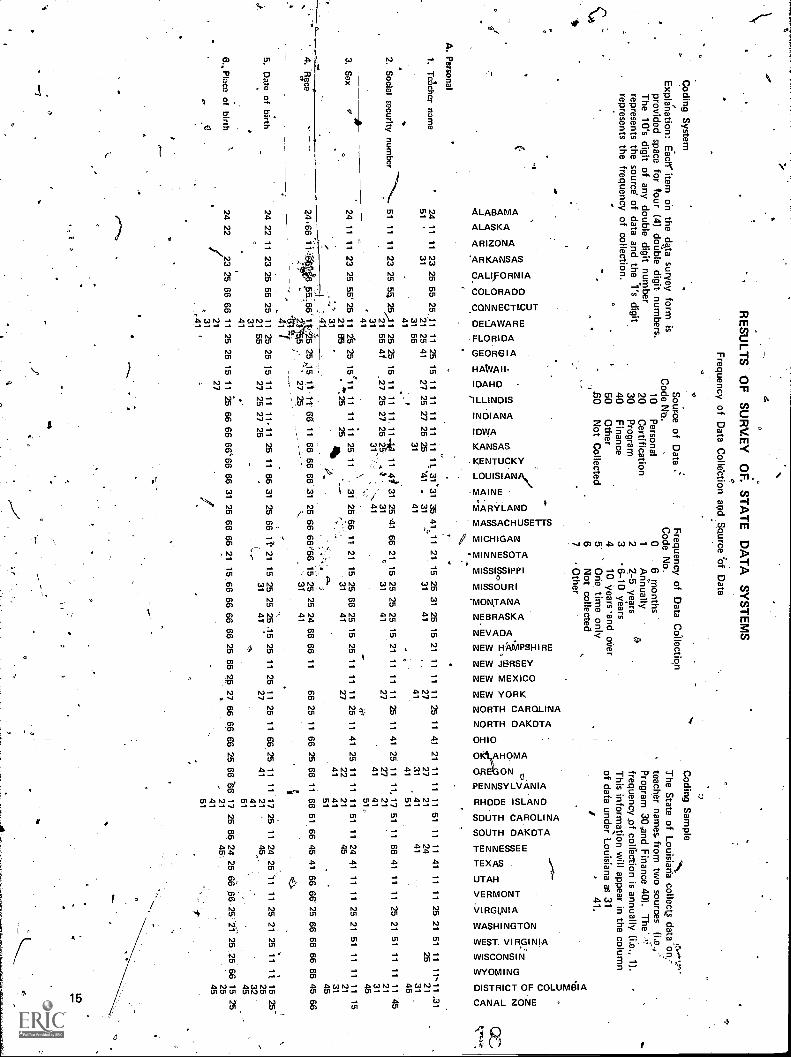
40 An analysis of the tabulated data reveals. a numberof pertinent Observations:
As might be expected, there is very little consis-tency in source or in frequencylbf collection amongstates.The most common source of data is from petsonalreports. This is particularly true for data relatingpersonal characteristics, teaching assignments,tpaching experience and salary.The most common frequency of collection is onceeach year.Moit states collect data items froth only one source.Those states using multiple sources tend to be stateswith fewer districts although there are exceptions.As would be expected, the certification data comesprimarily from certification reports.The primary sources for data on college preparationare certification reports.Data from certification reports are usually collectedone time only, presumably at the time a license isissued.Lack of uniformity of sources and frequency of
. collection limits ways in which state data relatingteacher characteristics may be'utilized.Many other specific observations concerning indi-
vidual state systems and geographical regions of thecountry may be made by studying the tabulated data,and relating conclusions to the data on teachepcharacteristics that were included earlier.
!S9
aw
'Describing the Information A4afiable Concerning the
Parameters of Science Teacher Supply in the States
The magnitude and distribution of the scienceteacher population nationally, regionally, and within ,
the states is importapt to decisions aftecti'ng preser-vice and nservice teacher education. In fact, the needfor programs for isiserifice and preservice education Ofscience teachers is established through knowledge ofthe number of well prepared teachers that are avail:able and the number of well prepared teachers thatwill be needed in the future. This knowledge shouldbe national in scope if funding for teacher trainingprograms is to come from federal sources. As with the`data that describe teacher characteristics, it wasknown that some states systematically Collect datathat can be used to describe teacher supply. However,the questions of compatibilitT,--cisistency, source,frequency of collection anq others' arise as they didrelative to assessing teacher characteristics. On the.original survey sentto the states items H And I weredesigned to determine whether the data being col-lected could be useful in determining the nature ofthe science teacher supply (seethe survey instrument -in the appendices). The results of the survey are tabu,lated on the following two pages.
11.
ft
V
:RESULTS OF pURVO' OF STATE.DATA SYSTEMS
0
Legend:1 = Data Collected by State
and in Computercn
2" -a.- Data Collected by,S?ate ' .but not in CompUter a
'-D
>- Q. ° .1g 2 1..< F. < acn E 0 0 1.1-1
...V 2 z x3= Data Not Collected by < 0 a 11 z le <2 < < g ct ac 1 F.) act < 5 CA <<C11 Sy.(71 >1 <0 wf1.1 LuCA u,(7) r,...n <LI/State < he ,..,2 z 0 ct
LLI ° 0 = 00203 u) "' < LL 0 2 < CC CC < -r- 2 < < Cil I- - 2 Cil E 2 (7) cr) ' CV-'= Data Needing Further N he 7.,-.1 ,.../ CC cc ci 02 LU-j 21 2 -c./:1 -JD ZE1 g ci LJ 8 .7 5 (.2 c")= K. 14- Li' 02 LUC° >LUClarification aaaa0000u.0 he he -J 2 222222222
. ,--
H. Teacher Supply and Need
. Data Collected by Subject, or° Grade
1. Projected. Vacancies forSeptember Assignments
2. Projected Vacancies forJanuary Assignments
3. Positions Remaining Un-filled after SeptemberAssignnients
4, Positions Remaining Un-filled after JanuaryAssignments
5. Teachers Teaching out ofTheir Area of Certif.
6. Projected Teacher Graduatesfroni State InstitutionsWithin the State
7. St#9, Institution TeacherGraduates Employed by theState
8. State Institution TeacherGraduates Unemployed
9. Other
I. Teacher Aides
1. Data on ParaprofessionalEmployees
J.
2 3 3 3 3 3.2 2 2- 2 2 3 3 1.2 3 3 3 2 2 .2 3 2 3 2 3 2 3
3 3 3 3 3 3.2 2 2 3'2 3 3 3 2 3 3 3 2 2 2 3 3.3 3.3 2 3
2 3 33 3.2 2 2 2 2 3'2 3.2 3 3.3 2 2 2 3'2 3 3.3 2 3
3-2-3-3---3-3 2 2 2 3 2 3 2 3 2 3 3 3 2 2 2 3 2 3 3.3 2 3
1 3 3 2 2 3.3 2 1 1 2 2 3.2 2 1 1 2.1 1 2 2 1 1 1 2 1
3 3 3 3 2 3. 2 2 2 2 2 2 2 1 2 3 2 3 2 2 2 2 2 1 3. 3 2 3
1 3 3 3 2.3.3 2 3 3 2 3 2 3 3 1 1 3 2 2 2 1 2 1 1 3 2 3
. 3 3 3 3 3 3.3 2 3 3 3 3 2 3 2 3 3 3 2 2 2 3 2 a 3.3 3 3
2 3 1 3 '3 3 3 1 1. 1 2 1.2.1 2 2 1 3 1 3 2 2 3. 1. 2 2 2 3
0119
20

<
<<-2 >
INFORMATION ON CHARACTERISTIC
1
OF SCIENCE TEACHERS
0 J.,
<<z Fri< .
IO < 2
:I I-0 0 , Z E - D- 1 LL1
< CC IL ILI 0 0 Z0-1 < EtC 111,
1- 0. Z 0 0.*(' 0 CC ;7, %-d0 0 u)(/)
11.1 cs. i z 5 z- Z u6 N'- 1
Q 1E. 1- Z < 1 2 E.5 i I- CS E <i,i w C/)O » n Z X < CC tru C/3 cn 0 0cn cn0 0 U-I 1.1.1 1- III < IllCC (/) WO- 1- n ? 5 5 a 0./.
..
D
3 3 3 3.1 3 3 3 3 1 1.3 3 3 2 2 3 3 2 3. 3 -2 1 2 '10 35 '56 5/18/29
3 3 3 3. 1 3 3 3 3 3 1. 3 3 3 2 2 3 3 3 3. 3 2 1 3 6 23 /1 3/12/37
2 3 3 3. 1 3 3 3 3 1 1.3 3 3 2 2 3 3 2 3.3 2 1 3 1- 8 35. 58 4/18/30
3 3 3 3. 1 2 a 3 3 3 3.-3 3-3 2 2 3-3 2 3.3 -4- 29 _ 2/15/35
3.3 1'1 3 1 1 2 3 1 1 1 1 2 2 1 3 1 2 1 3 1.2 2
2 3 2 2 3 3 2 2 2 1 2-3 3 3 2 1 2 2 2 3.3 3.2 3
3 3 2 3.1 3 2 2 3 t 2 1a3 3 2 1 2 2 2 1 1 1 2 3D
45 35 21 23/18/11
8 54 38 4/28/20
25 35 40 13/18/21,
. 3 3 2 .3. 3 3 3 3 3 1 3. 2 3 3 2 3 3 3 2 3. 3 3- 2 3. 2 23 75 1/12/391
21 1 ' 3. 1 1 3 1 1. 2 2 1 2 1 -1 3 2 3 1 3 3. 1 2 2 1 3 38 31 31 20/16/16

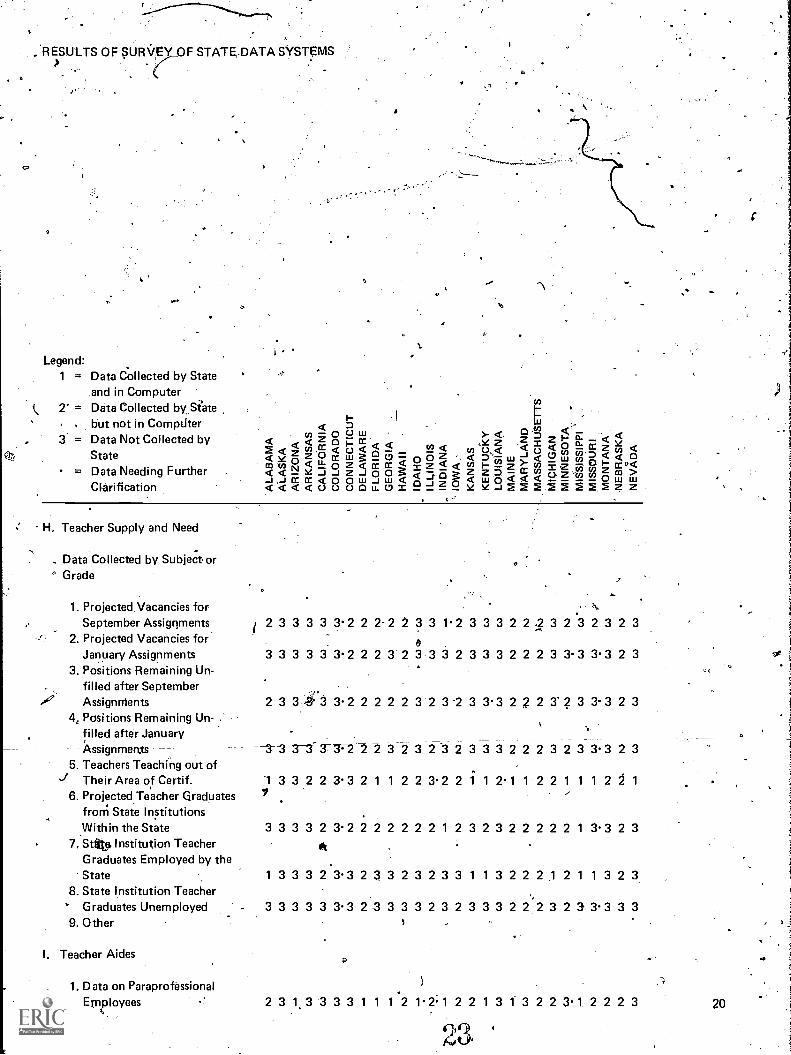
. As with the other data, the participants at theproject conference cOnsildered the feasibility of using -the available data to assess the science teacher supply.The following observations were made:
,I)Compared to collection of data in oth'er areas, the?number of states collecting data oil teacher supplyand need is very low. The percentage of states notcollecting' specific items ranges from-22% to 74%,Data onj teachers teaching outside their area o1Certific4ion is Collected more consistently than,other items althOugh 22% of thastateS do not have-this information in any form.
,
A relatively largelnumber of states collect elati9 onteachers graduating from state ingtitutlons.Data on paraprofessionals is gathered in a majorityof states. .
By' hoting vertical columns it may be seen that- ,. many states make- practically no effort to collect
data reflecting teachet supply and need. ,
;From these observations it ii Oparent that theincrinsistency 'in data collection and, in fact, the latgenumber of -states, not involved in collecting such datamakes broad. generalization to the nature of scienceteacher supplies on a regional or national basis im-
If questions are to be answered that willhave meaning for,preservice and inservice educationof science teachers) on a national basis, such as thosethat have-been
,isponsored by the',National Science
, ,Foundation, it will be necessary to seek soukes ofinformation other than the existing state data baltics,
The second survey to establish frequency of data'',collection and sources of data was also applied toteacher supply and need. The results of that surveyfollow: a
a
4
s
25
fa
1.

."
toding,System
ti?lanation: Each item
on the data survey form is
_- ,provided space for -four (4) double digit num
bers.- T
he 10's digit di any double digit number
represents the source of data-anethedigit
represents the frequency of collection.
ji ES
U LT
S O
F S
UR
VE
Y"
OF
ST
AT
E sQ
AT
A S
YS
TE
MS
oF
requency of Data C
ollection and Source of D
ata
,
k
H.T
eace; Susfply. and N
eed
1. Projected vacancies for
all 66S
eptember assignm
ents*
2. Projected A
racancites for66
January assignmentS
,
3. Position's rem
aining unfilled51 66
after Septem
ber assignments.
0N
Source of D
ataC
ode No.
- 10P
ersonal20
Certification:-
30P
rogram40
Finance
50O
ther60
Not C
ollected
66 ,66 66 66 21 51 21411 11
66 66 66 66 21 66 66 11 66
66 66 66 40 21 51 66 1111,
4. Position,. rem
aining unfilled51 66
66 66 66 40 21 66 66 11 66-after January assignm
ents'
5. Teachers leaching out of
'
their area7pfC'erS
fication
,6. P
rojected teacher graduateaf rooi state irjahutions
"
within the state
".S
tate institution teachergraduates erpployed by the
*"!'.
state,.8. S
tate institution teach ergraduates tofem
ploVed
I.T
eacher. Aides
-
1.D
ata on paraprofessional
employees
41 6651
66 25,66 66 21 66 41 66 11
.21 6666 66 66266 21 55 21 66 1.1.
66 5666
66 66 66 21 55 66 11 .11
66 6§6 66 66 66 21 55 66 66 11
23 66 11 66 66 51 66 21- 66 41 664151.
V
Frequency 'of D
ata Collettion
Code N
o.0
6 months
1A
nnually2
2-5 years3 .`
6.710 years4
10 years, and man-
5O
ne time on Y
6N
ot collecte7
Other
.
21 21 66 66 66 21 21 66 66 27 66
66 66 66 66 66 21 21 66 66 27
2 co <<
<09
2cr
>5
,Z z z
0WW
WW
cc
0
I-C
) 0O
CC
C.)
<C
CC
.)W
1CC
CC
w. w
0 0Z
"2 2 2OO
QI
0'
mg S
ample
The S
tate of Louisiana collects data onteacher nam
es from tw
o sources(i.e.:°
Program
30 anerinance 40). The
frequency ofcollection is annually (i.e., 1).T
his information W
ill appear in the. column
of data under Louisiana as 3141.
O
XI-
u.
7,2
20
20NQ.
2
51 66 51 66 66 66'66 52 21 66 66 66 66 51 21 66 66*66 21 66 66 66 66 66 66 66 1131
2031
66 66 -66 51 66 66 66 66 66 66 66 66 66 66 66 21 66 66 66 21 66 66 66 66 6666 66 11 57
20,31
b
66 66 66 66 66 21 21 66 66,27 66 66 66 51 66 51 66 66 52 21 66 66 66 '66 51 2166 66 66 22
66 666616
66 21,21
66 66 21 641
66 66 27 66 66 66 51 66 66 6616 66 643\66 66 66 66 66 21 66 66 66 22
66 21 66 11 2111 31 66 41 11 66 66 21 42 66 66 41 21 66 57 21 51 11
21 21 2/ 66 6621 51 66 66"11 66 66 51.66 21 66 21'42 21
66 66 66 66 66\ 66 66 10 66213141
66 66 66 66 66 66 66 10 57*313141
11 22 51 66 21 31 21 66 66 10'312041
66 66 21 21 51 21 66 31 6651
22 21 51 212166 66 66 10 57
21 21 66 6a21 21 66 6611 66 66 51"66 66 66 66 66 21 66.66 21t21 51 21 66 66 66 22 11 51 21 21 66 57 66 66
5751
1466 66 21 51 66 6611 66 66 61 66 66 66 66 66 21 66 66 66 31 51 21 66. 66 66 22 66 66 66 21 66
51
11-21 21,66 .66 31 51 41
66 66 11 31 66 51 66 21 17 211141
66 66
2111 66 21 21 51 11 52 31 41 41 66 11 66 66 51 11 66 47 57
5121

As was noted earlier,, the number of states collect-.ing data do teacher supply and demand is relativelysmall. In fact, the percentage 4s from 25% for stategraduates unemployed to 79% for-teacher's who areteaching outside their area of certification. The notedinconsistency of sources and frequency of collectionreiterates that the ,available data on teacher supplyand demand has little use beyond local and specificquestions that may be asked. Itemized Ibiervationsare:
The persistence of the source category "others; indi-cates randomness of collection procedures.Certification reports, provide data on supply anddemand in the greatest number of states. This isparticularly true for data items reflecting graduates .
of state institutions.More states (30) collect data on teachers teachingout of their area of certificatiomIthan any otheritem relating supply and derivnd.More states (33) collect data orrteacher aides thanany item relating supply and demand.
.4?
N
Describing Ways of Using Data in Improving
Science Education in the States
It may be generally assumed that the more infor-mation one has for Planning the more successful hewill be in bringing about the changes h&has judged tobe desirable. However,. it may be just as easilyassumed that information will have limited use unlessit is used systematically with conclusions restricted tothose allowed by 'rigorous analysis procedures. Toapply data to the process of improving science educa-tion requires careful study to avoid the temptation .tobase judgements on insufficient data processing. Thisproject initiated that study by involving consultantswho had varied experiences and responsibilities re-lated to educational decision making in the projectconterenbe. Following formal presentation by theconsultants small group discussions were held wherequestions were raised for further reaction in plesessions. There were six individuals who gave majorpresentations at the conference. For the purposes ofthis report only the context of their presentationsand the major points they made will be included.These presentations are described in the order inwhich they welt given at the conference.
Dr. Michael M. FrodymaProgram Manager 4Instructional Improvement Implementation SectionPre-College Education in Science DivisionNational Science Foundation
(Special Note: It was largely because of Dr. frodyma's recog-nition of the need for data that could be applied to nationalproblems in preservice and inserviee education that theCouncil of State Science Supervisors undertook this project.His help has been essential to the progress that has beenmade.)
Dr. Frodyma indicated that the purpose of hispresentation :vas to describe the development ofNational Science Foundation programs over a sixyear period and to offer two options to the estab-lished.Yirection that may offer hope to do a betterjob in the future. He identified three models fordecision making: the rational approach model, thebureaucratic model and the political -expediencymodel. Originally, the development of NSF pro-grams appeared to tallow the rational model, butthe involvement of various interests caused anevolution to a combination of all three with theemphasis gradually shifting to - political expedi-ency. The need now is tos=provide a rational basefor bureaucratic and political decisions. This basewill require systematic collection of data-in themonths and years to comeein order to build arationale for new programs as well as a defense for
fold ones.
-
,,
24
D.
25
Five types of information sources in increasingorder of complexity were described: budget data,prograM data, modifi0 .program data, secondaryanalysis: of existing data and designed studies.ExaMples of use of each of these sources as 'heyhave related to NSF programs were given. It waspointed out that in all cases data gathering andanalysis must precede the recognition of need forit or bureaucratic and political Zlecisions will bemade 'under some other influence.
9Two alternatives were offered:
1) Build summative and formative evaluationsystems into original program structures in orderto prevent misinformation . in decision *making.This kind of evaluation was built into the Compre-hensive Program which required continuous evalt,ation °VI the four year period of the grant.2) Data collection in a matrix format to providemaximum communication to decision makers.Essential to this system is the ability to select,prior to use, those data that will have maximumimpact on decision making.
Dr. Frddyma predicted that the need ;for datain decisioni:making will be even greater in thefuture than fit has been in the past. He proposedthat existingdpia banks be improved and used-'asextensively as possible in developing the rationalefor new 'programs for improved education in thesciences.
Dr. William Richardson
A
Director of Adiance Planning and DevelopmentMontgomery County, Maryland Board of Education
Dr. Richardson has been extensively involved insystems development making extensive use ofcomputer analysis. His objective at the conferencewas to ways in which the computer maybe put to use with the data based conceptusinghard data as the basis for developing school pro-grams.
In the data based concept, a central data file isestablished in such a way that many independentcomputer applications are possible. In this systemthe general file is_referral to as the data base. Thisconcept requiresithat the data base be organized socomputer applications can be made directly to thebase in order to make decisions. The early applica-
tions have been directed at administrative manage-ment Within the Montgomery County schools al-though the program of hard data utilization is
being expanded into program development. Theintent is to go from a Planned Program BudgetingSystem (PPBS) to a Planned Program BudgetingaridEValuation System (PPBES).
Dr. Richardson was enthusiastic in his recom-mendation for data based decision Making throughcomputer utilization. .Further information may behadpom a publication-entitled The School Infor-mation System produced by the MontgomeryCounty Public Schools, Rockville, Maryland.
Dr. William S. Grayly's'Assistant DirectorResearch DivisionNational, Education Association
Dr. Grayb al hasb n extensively involved indata collection and analysis related to scienceteachers and science teaching positions. This in-volvement has led him to carefully study systemsfor data gathering.
To demonstrate the effectiveness of: datagathering to identify trends in science edgCation,Dr. Graybeal discussed in considerable detail theresults of studies on science teacher sup* anddemand and used these results to extrapolate intothe future. He proposed, for example, that the in-creasing supply, ikj,ch he verified usingilard data,will lead to high teacRer competency in the future.He also identified a trend toward increased num-bers of women entering the science teaching field.
The sources used by NEA in gathering educa-tional data include. direct contact with teachers,school systems, institutions of higher learning andstate departhrnts of education. Reliable sourcesof professional literature are also used as exten-sively as possible.
Dr. Graybeal indicated that the NEA couldbenefit considerably by' improved specification ofdata to be collected by state departments of edu-cation. He asserted that characteristics of dataaffecting their usefulness are relevance, timeliness;objectivity, validity and credibility. Perhaps evenmore important to data usefulness is'ptior assess-ment of information needs of constituent educa-tors. This assessment is critical to effective dissemi-nation of research results which leads to effectiveeducational planning.
Dr. &Myron Atkin, DeanDo / /c!'3 of EducationUnivgrsity of Illindis
Dr. Atkin began his presentatjon with the verystrong statement brat using the -available data is"exactly the wrong approach." He suggested thatit is much better-4o ask "How do we get the datawe need?" He equated the need for data basedresearch with the desire for positive change. It isassumed by many that research and developmentactivities have broad implications for change. Thisquest by the researcher for generalizable character-listics that may cause change is in error in that itoverlooks the social-political climate in whichchange must occur. To formulate edticational
' policy the total climate must be known. In state-federal relationships it must 'be reinembered thateducational change really occurs in the classroom.Thus, teachers,must be resportsible for change andin the future,it should be expected that they willhave a greater input into decisions that will resultin change.
In general, the broader and more transplintablean educational concept is the more trivial, accord-ing to Dr. Atkin, it will be. H,e cited recent struc-tures 'for individualizing qducation as an exampleof generalized trivia. He also referred to the .dis-crepancy between goals established in the NationalAssessment of Educational Progress and the mea-sures that were used as an example where general-izing to a format for testing defeated assessmentpurposes.
In identifying models for educational change,Dr. Atkin proposed a problem solving model forteachers as an alternative to (formal research anddevelopment. However, the lack of a well definedproblem is a difficulty teachers face as theymodify their activity. Change Tust involve theunique nature of each situation and, therefore,projects designed to educate teachers for changeshould deal with the processes of change thatmake it possible to accommodate that uniqueness.
If education is treated as a craft, there areobvious shortcomings in applying a scientific (databased) approach to assessing educational change.Dr. Atkin recommends highly localized empiricalapprdaches over the broad based experimentalefforts. He sees the state supervisors as being in anadvantageous, position for disseminating local
empirical results in an effort to combat generalized',societal pressures that tend to overwhelm local antiindividual values.
Dr. Atkin identified three conditions that pre;vent educational change: the concept of the roleof schools in society, the limitations placed onsupport and the quality of those enteringAhe edu-cation profession. He noted that we have lostesteem br-failing to bring about the changes weadvocate. In the future we should base our deci-eons for progress on the recommendations ofaccomplished practitioners ,(teachers) rather thanon specialists with central authority. The decisionsshould not be based on incomplete factual datasuch as that now available from the states.
Dr. Herbert J. Wahlburd.-Research Professor of Urban EducationUniversity of Illinois
Dr. Wahlburg prefaced his remarks on "method-ological suggestions" with a quote from MarkTwain: "There are lies, damn lies, and statistics."On that note, Dr. Wahlburg proposed some cau-tions:1) Do not be misled by statistical reporting.2) Realize that survey studies are, by nature, verycomplex. 0
3) Be careful in using social data in decision mak-ing.
Dr. Wahlburg pointed out that there must 0
always be trade-offs in collecting educational datato . answer specific questions. deals are neverreached in collecting data and, brrespondingly,care must be used in accepting r sults. EffeCtivecollection requires future, orientation and anticipa-tion of new questions. Immediacy in accumulating
.data causes limitations that result in ineffective-ness.
Budgeting is a necessary and important com-ponent of educational research. Research is expen-sive and efficiency is low. Therefore,.simplicity indesign of great importance and there should be aprefer nce for continuing questions over specificone-ti e questions.
Dependence on existing data banks does reducecost but such use bf data should be limited to spotsurveys that must be done in a short period oftime. Data collected from various' sources havequestionable Value because of inconsistency in col-lection practices. Such data may, have its greatestvalue in pilot studies that precede Planning formore complex research designs.
Where surveys are conducted to obtain specificdata, short simple questionnaires have many ad-vantages. Even so, such studies are complicated bythe necessity of randomness and stratification.Non-returns always' bias the sample as can thenature of the items on' the questionnaire.
29
Data analysis Should also be kept as simple aspossible in order to make it easy to communicateresults. Often simple tabulation, cross tabulationand use of means provide sufficient answers. Morecomplex methods, use of computers and involve-ment with outside contractors create problemsthaeVvill jecjitire wisdom and choice of decisionmakers. However, Dr. Wahiburg concluded, it mustalways be remembered that trade-offs in simplicityand cost must depend upon the original informa-tional need and availableuresources.
Mr. Edward J. MeadeEducational DirectorFord Foundation
hi his discussion of the Ford Foundation Cam-?rehensive School Improvement Prograin (see re-..port entitled A Foundation Goes to School pro-duced by Ford Foundation, Office of Reports,320 East 43rd Street, New York, New York10017). Mr. Meade cast doubt updn the assump-tion that we should learn from the past. Theschool projects in the Comprehensive Programwere directed at innovation of the mechanicalaspects of school operations. The report on' theseprojects is subjective, but it measures the.extent towhich changes were successfully implemented.
Mr. Meade recognized a need for "educationalpathology"a looking at experience where asmuch can be learned from failures as from suc-cesses. It was learned through the evaluation thatfunding alone will not assure Change. General non-categorical grants were not effective in causingchange. Also, the ,size of the grant did not affectits success. Success, it was discovered, was depen-dent upon local involvement and the inclusion oflocal funds in the project budget. Planning moneywas more effective than operational money. Aninteresting observation was that higher educationdid not effectively serve the project schools. AsMight be expected, other factors being equal, small
Isimple) schools changed more easily than didlarge (complex) schools. Projects wasted moneywhere internal conflicts existed while it appeared,that teachers received the most help in teachercenters that were established away from univer-sities. Above all, it was shown that local peopleteachers, administrators and other school em-ployeesare critical .to change and, hence, theymust be involved.
The importance of Mr. Meade's presentation isin 'the nature of the evaluation he described. Manyof the observations were made subjectively with-out dependence on hard data. This procedure issignificant when presented at a conference di-rected at effective data utilization whether thosedata be hard or soft.
30
Althdugh the six consultant-presenters at theconfererice prepared individually Pend al/hough
. there are major differences in the philosophies andstrategies they used it is possible to see definiteinterrelationships in the recommendations madeand the discussions thatollowed. Among other.
.things, there is an apparent interrelation betweenpurpose and strategy in data utilization. Where thepurpose is to collect and tabulate data as a simpleindicator of trends and events, the strategy is
simple and the use of existing data banks is appro-priate. However, when the purpose is to inquireinto the subtle aspects of education that deal withprogram or educational competencies the strategyfor research becomes correspondingly subtle andcomplex From the presentations and discussionsat the crriference it is possible to establish severalobservations that provide direction in using data toimprove science educition in the states: .,
In working with bureaucratic and political enter-prises it is essential that objective data be col-lected and analyzed on a continuous basis inorder to establish the rationale for initiating;continuing or changing educational programs. Inthe 'competition for° funding; intuition and p
fessional testimony is not enough.In developing the rationale for educational prgrams, some data is better than no data.Using objective data to support proposed govern-mental action at the local, state or federahlevel isnot the same as using data in educational re-
°search. ,
Computer technology is essential to data utiliedon. However, at the present state of tremblogyand computer' theory, computer application todata systems is more app'r'opriate to administra-tive management than 'to program developmentand assessment.When the purpose of data utilization is echica1tional research, it is essential that the questionbe clarified and the design established before thesearch for data begins. Research proceduresforbid designing a study to accommodate exist- 'ing data.Reliance on objective, quantitative data in thestudy of educational procedures may limit thekifids of questions that may be asked. Subjec-tive, empirical observations have definite applica-tion in making educational decisions.
t, implicity in design and in reporting of results is\s
important in translating educational researchinto educational change. .Where die ultimate purpose of data utilization isto produce a chAlge in educational practice thepractitioners must be involved i making deci-sibns based on the data. Decisions y centralauthorities have not been effectiti in producingchange. 14

a
Describing the Elements Needed for the Creation
of a Data Collecting and Sharing Network Embracing
All States I
Fjorn the efforts to study ways of using.data toi rove education in the sciences, a generalizationemerged that identified the major value of data iys-
t tems as being the source of support for administrativedecision making. However, for supervisors working instate departments Of education who are involved withnational as well as state and local programs, this func-tion may often have greater importance than the pureresearch function as it is applied to educational pro-
, grams. Therefore, state supervisors continue to beinterested in the development of a data system that iscompatible among states and has sufficient data itemsto provide application to a broad assortment of edu-cational questions that have administrative implica-tions. In small group discussions, the conference par-ticipants identified a series df informational needs that.could be 'satisfied by an interstate data network.Examples of These needs not met by the existing databanks are expressed in terms of the ability to deter-mine or describe the following:
ClassroOm practices employed in local schools!The number of semester hours oi; quarter hoursaccumulated by teachers in each teaching area.Special programs aCi:omplished by teachers for cer-tificatiori, i.e., student teaching, internship.The amount budgeted for teaching equipment and
. materials 'in the sciences.EXt0 duties that are assigned to teachers and extrapay that is derived. 'Consultant help available to teachers from the localsystem.the_kind of program taught (elementary as well assecondary) and associated texts and printed ma-terials.The percent of instructional time spent in labora-tory activities.The nature of the organization of academic depart-ments in Iota) schools.
Special offerings such as mini-courses, independent .study and other innovative practices.The percent of certified teachers who because ofupgraded standards do not meet present certifica-tion requirements.The number of years specific courses have been.,offered in given schools.Total experience of teachers by gitien course andgrade level.
:Preparation time available to teachers of sciencecourses. .
These needs represent those that could be met by anextension and improved consistency and teliability.ofthe present state data systems. However, it is notpossible with such systems to answer other questionswhich kept emerging unless it becomes possible tocollect data that reflect competencies in teaching aswell as affective attributes of teadhers and students.Some of the questions recorded at the conference are:
What are tide perceptions of teachers in relation tovarious program rationales? 0How do teachers perceive student achievement?What do teachers believe to be their-needs forinser-vice education?What is the extent of teacher competency?What do students regard as needed changes in theirclassroom?How do teacheis value the subjects they are teach-ing?
From such questions and a knowledge of the limi-tations of data systems a design was outlined that isincluded here as a model for state departments ofeducation to consider as their efforts in data collec-tion evolve. Recognizing that there are limited possi-bilities for collecting items of data that will be en-tirely useful in answering questions that must beasked after the data is collected, it is obvious thatthere are advantages in having state data banks with ahigh degree,of uniformity among the states. To pro-mote this uniformity the number ckf items recom-mended is minimized.
In order to make these data systems as useful andcomprehensive as possible it is necessary to gqbeyond the basic identification data that are nowavailable in many, but not all, of the states.
To' prom.ote uniforrfiity it is recommended thatthree levels of data be identified based upon thenature and apparent complexity of these data. Theselevels may be described
Complexity Level Ibasic identification data suchas these being presently collected and describedearlier in this report.
Complexity Level IIdata describing teachers andteaching situations. Some of these data areunique to science education.
Complexity Level Ill data reflecting specificcogn itive and affective characteristics ofteachers and teaching programs.1
31.
CI
9z,
28

If should be recognized that as the complexitylevel increases there is a decreasing, value in data thatmay be collected prior to identifying specific ques-tions and research designs for answering them. Forthis reason it may not be as important that state databanks Level III items as Level I items. Thenature ?f Level III data should be identified bu thespecific informationNneeded may vary from state tostate. However, site data'systems should be gearedto collecting higher level data when the need for it
.arises. It is important at all levels of data that there bea uniform coding systein in 'the states so that itemscan be pulled out of given state systems to answerregional or nationalquesiOns.
Level I isunique in that most of the data existingat the present time in the state data banks falls intothis category. However, because some states collectalmost none of these data, and because there is a con-spicuous, lack of certain important items \in otherstates!, it is recommended that eventually of thefollowing identification items be collected in all ofthe states and kepVn comitterized systems.
29'
Level 'I
A. PersonaLciat.. 1. Teacher name
2. Social security number3. Date of birth4. Home address5. Status of citizenship
B. Teaching assignment data1. Name of school2. Address of school3. Name of school district4. Name of courses taught5. Name of texts used in science courses6. NUmbdr of pupils in each course7. Credit per course,8.' Grade level of each course
C. Teaching experience data1. Total years teaching experience2.. Years of teaching experience in state3. Years of, teaching experience in present
school district4, Years teaching present courses
D. Certification data1. Basis on which certification was issued,2. Type of certification held
. ubject area(s) of certification4. Dateicertification was issued5. Date certification was utilized6. Date certification expir0
E. College,prgparation data1. Total hours of college credit2. Year,last credit was earned3. Degree(s) earned
a. typeb date earnedvtic. college named. college location
4. Transcript of credits
5. Number of credits preparation in majorteaching area
6. N.S.F. supported projects attended7. Other special teacher training programs
attendedF. Salary data
1'. Annual salary2. Full- or part-time employee
Level II data is of a more subjective nature thanLevel I. The following is an attempt ki illustrate theseitems' but is in no way intended to, be all inclusive.These items are classified in the same way as thosd inLevel I.
Level II
AA. Personal data
1. Nature' and amount of. administrative. duties required of teacher
2. Extra duties such as department head,curriculum, coordinator, etc.
,32
B.
3. Additional duties and extra pay4, Profile of teaching philosophy
methodology5. Involvement in innovative programs and
materials development6. Evaluation of degree of happiness with
present teaching assignment7. List of previous teaching assignments indi-
cating grade levels, subjects and yearstaughtPreparation and planning time each day
and
8.9. Inservice training needs
10. Curriculum projects used and teacherpreparation in each
11. Membership in local, state and national'professidna! organizations
12. Evaluation of facilities, program, equip-ment, etc.
13. Special awards or contributions to scienceeducation
141 Special interests or skillsTeaching assignment1. Name of school,.2. Address of school
3. Name of system4. Name and schedule of all courses,taught
(including planning time)5. Satisfaction with present assignment
(subject, grade, school)6. Non-teaching duties7. Teacher freedom in selection of texts,
equipment, assignments8. Relation gof classroom strategies to stu-
dentachievementNames of textbooks used in each course
0. Identify interest in net/4 curricula11. Summer institutes, workshops attended
every two years12. Evaluation of suitability of program,
equipment, materials for laboratory-oriented teaching

1\\t3. Clerical assistance (number of people and
hours/week)14. Curriculum projects used
C. Teaching experience1. Courses, curriculum projects taught by
number years2. Number of years teaching special courses
or curriculum projects3. Non-teaching experience (military skills,
. hobbies)4. Participation in professional activities or
groups5. Experience in innovative assignments or
programs (open-space, modular schedul-ing, etc.) s'
D. Certification1. Correlation of degree training with salary2. Summary of coursework completed
.(narne, content, date, location) each twoyears
3. Certification categories based' on char-acteristics, skills,isf other systems ratherthan academic preparation
College preparation1. Non subject area preparation in other
areas Such as social studies and specialconcerns
°The highest level of dg,ta-gathering and analysis is
d veloped and studied in order to includeLevel III. categories of this data base must'be carefullythe complex information in° this area. Only twoexamples have been listed for demonstrational kurposes. 4
00,
g.
These recommendations for the design of the datacollection and sharing nefwork were made without aneffort to incorporate the' Elementary-SecondaryGeneral Information System (ELSEGIS) which. hesbeen developed by the United State's Office of Educe-don. Comparison of the survey forms for that pro-grain (O.M.B. .051-s1037) with the recommenda-tions in this report will show that many of the dataitems included here as Level 9.coincide with itemsthat will sbon be collected in a uniform way throughthe Office of Education. Howeier, Level II and LevelIII items are not ;included. For further information,see Department Of Health, Education and -WelfareP blication No. (O.E.) 73-11400.
Level IIIA. Teacher attitude. and job . compatibilit
analysis1. Development f data to compare succe s
of program imp mentation With teach reffectiveness an student achievement
2. identification of obstacles to effectiveteaching
3. Identifickon of needs (material, ed ca-tional, financial) of teachers, students, d-ministrators
4. Determination of teacher attitude to ardstudenti and teaching
5. Determination of student attitude t' and
science education and teacher
6. DeterMine non-subjective training n edqto assist teachers in clasaroorn man Be-ment procedures
B. Financial planning systeltis1. Analysis of expenses involved for various
programs or matei:jals and comparisons ofalternative systemS-
2. Collection of expenses and analysis of ex-p,priditures in each state and federal po-
, f*?gram.
(
escribing the Elements Currently Available for
nstruCting Comprehensive Supply and DemandPiIcture of the urrerit Science Teacher Market
The survey, of the "states for information related toscience teacher supply and demarid left little doubtthat the state data banks are not adequate to establisha reliable quantitative distribution of science teachersin the United Statesilln a few states it would be pos-sible to make deterntinations of teacher supply butobviously, to use data from .,only those states thatcollect sufficient dati, would bias the sample soseriously that few gerferalizatinns could be made fromit. Other sources and 'I'Prtipleted studies, such as thatdescribed by Dr., GraYbeal provide an adequate nib-ture of the national trends but becaUp such studiesare based upon national samples there is no way pro-vided to compare a giVen state to the national situa-tion nor to make compArlsons among states.
The, responsibility df state departrifents of educa-tion
: ,
7to teachers: and toeacher education programsmakes it important for itete, personnel to be well in-formed about the raid of trained teachers withspecific training in given :fields to the demand forsuch teachers: It is alsoArnporterit to, be aware oftrends in teacher competencies as a result of prepara-tion programs as well as the competency expectationsof school systems seeking to employ teachers. Thisdynamic interaction requires constant monitoring if asatisfact6ry balance is to exist between adequateteachers and teaching opportunities. In 'this area ofconcern, there are few characteristics that are uniqueto science education although t specific questionsto be asked abort science teacher and science teach-ing positions may differ somewhat from other teach-ing areas. ,
1
'31-)
Most of the data that apply to assessing scienceteacher supply and demand are basic, quantitativeidentification items corresponding to the Level I
items identified for the data network describedearlier. To adequately conduct an assessment in thisarea the same uniform collection and coding proce-dures should be applied to a specific set of items thatcould be included as part of a more general survey ofthe schools conducted by the state departments ofeducation. Data items recommended as necessary bythe conferenceparticipants are:A. Teacher supply and demand (data collected by
subject or grade)1. Projected vacancies for September assignments2. Pi-ojected vacancies for January assignments3. Teachers teaching'out of their area of certifica-
..tion
4. Projected teacher graduates from state institu-tions within the state
5. State institution graduates e loyed by thestate
6). State institution graduates unemployedB. Teacher aide dab
1. Nurnber of paraprofessionals employed2. Preparation required for licensing \For a more complete picture of the nature of
teacher supJ.y and demand it would be necessary to.identify diose items in the model prese&d earlier inthe report that relate to expectations for teachers andteaching conditions.
Providing A Learning Experience for Conference
Participants in Data Bged Policy Formulation
° The role of the science supervisor irr a state depart-ment of public instruction is primarily one of leader-ship,. He is often involved in problem situations onlyto the extent that decisionVare made and then imple-mentation is left to others. Because of this early in-volverndnt he i4expected to have sound informationand to be able to supply supporting data when heexpresses views. There is, definitely a need for' him tobe ware of the positive values and limitations of datautilization in making judgements within school pro-grams. He needs) to know how to use data and heneeds to have the necessary data accessible when heneeds them. -
The total project on data utilization was designedto give participants an introduction to as manyaspects of the art as possible. the survey of the statedata systems made all of the superv,,isori involvedmore aware than they had been of the advantages anddisadvantages of the data collection procedures
empldyed by their states. Perhaps afore important,the survey provided an opportunity to compare ord-
.)cedures of all the states as they contribute to Whatmay be considered a sort of national data bank. Inthis comparison, the problems of using these accumu-lated data to make regional and national .decisions
became obvious to the extent that recommendationsemerged that may lead to more comprehensive datacollection in thepants recognized
e. At the same time, the partici-m their discussions that there are
barriers within states presented by traditions, policies,-and legislation that cannot be easily overcome for thesake of better data Collection.
The opportunity at the conference to hear presen-tations from experts and practitioners involved in abroad spectrum of data belated activities gave a per-
spective to data utilization that most of the partici-pants had not been exposed to before. The range ofactivities disctissed included developing data-basedrationale for decisions, Computer application in datasystemS, problems of national surveys in education,strategies for ,educational research, and appealing todirect sources for empirical data. The interaction withthe speakerconSultants and the group' discussionsmade it possible for the participants to formulate theobservations and recommendations that are includedin this report.
As a follow-up to the learning eXpeTience for thosewho participated'in the pioject will be the efforts ofthe Council of State Science Supervisors to ask ques-tions pertinent to imp?oving science education in thestates and to have participants in their positionslOiththe departments of education supply necessary dataorb data sources and become involved in analyzing thedata to formulate answers. Hopefully, the educationalexperience and service to improved science educationwill continue to be concurrent.
Familiarizing Conference Participants With New
Directions for Educational Progiams of the National .
Science Foundation
Science specialists in state departments of educa-tion, by the nature of their work, have had a verydirect involvement with the teacher educationprojects and curriculum development projects of theNational Science Fbundation Division of Pre-CollegeEducation in Science. In many cases, state specialistshave been directly .involved in assessing needs withintheir states or regions and in generating proposals tothe National Science Foundation that have resulted insuccessful projects. In addition, the state sciencespecialists, including those in social studies andmathematics, have been constantly involved throughtheir respective onjanizations, the Council of StateScience Supervisors7' the Council of 'State SocialStudies Specialists and the Association of StateSupertisors of Mathematics, with conferences andprojects tfiat relate to National Science Foundationprojects. Through all,,Of these activities it has beenessential that individ01 specialists be well informedof plans for futute".: educational programs of theFoundation and that' they have an opportunity to'present their perception of needs in science educationas they might affect future programS to the Founda-
tion staff embers. For these reasons, a specialgeneral sessi n was included in the conference for apresentation y the Director of the Division of Pre-College Education in Science.
Dr. Howard J. Haosman, DirectorDivision of Pre-Co lege Education in ScienceNational Science Foundation
Dr. Hausm n prefaced his prese tation by en-dorsing the da a gathering process that had beenunder discussio throughout the onference. Heindicated that th use of data gath red from inde-pendent sources.' important to king the kindsof educational de isions that his d vision constant-ly faces. ,
The major purp se of Dr. Hausman's presenta-tion was to acquaint 3 conference participantswith the -new directions the Fourfdation's educa-tional programs would be taking in the immediatefuture and in Fiscal Year 1974. He indicated that .0
the changes to be made were not due to lack ofsuccess in the past, but rather, they were due tochanging educational needs as well as financialrestrictions that were being applied to the Founda-tion's educational bu-dget.
In this first public discussion of comingchanges, Dr. Hausman. announced the terminationof the institute program as the participants hadknown it along With termination of the compre-hensive program that had originated only a s orttime before. Systems grants were to be aft halfalong with grants for resource personne work-shops., A most` significant change was the with-drawal of participant support in terms of stipendsand expenses. ..
Four new themes had been adopted by P.E.S.They are:'
Improvement of education for careers in science.Development of scientific literacy.Increasing efficiency of educational processes.Experimental projects and problem assessment.
Dr. Hausman elaborated on each of these themesand stated that a major effort will be given in thecoming fiscal year to programs directed at thedevelopment of scientific literacy.
Developing new programs has required a reor-ganization of the Division of Pre-College Educa-tion in Science. In this structure there 90e twomajor sections that are directly responsiblgjo theDivision Director. These are the Educational Ma-terials and Instruction Development Section andthe Instructional. Improvement ImplementationSection. In each section the programs will be con-ducted by a program head and program managersalong with support personnel. Dr. Hauirnan ex-plained that it is intended that funding will beclosely aligned with the need for course contentmaterials and that implementation will be con-fined to NSF-sponsored materials. However, at thetime of Dr. HausMan's presentation the nature of
the irriplementatiOn activities to be conducted wasnot developed. (Since the conference, the NationalScience Foundationhas prepared and distributed"Guidelines for Preparation of Proposals for In-structional Improvement Implementation,'! publi-cation number.. E-74-4. Another publication,E-74-1 entitled "Announcement of Education Pro-grams" details many of the points included in ;the %conference presentation.)
Dr. Hausman concluded his remarks by urgingthe science, social studies and mathematics stateconsultants, as well as the Organizations that repre-sent them, to continue their close communicationand interaction with the Foundation. Finally, heindicated that grants will be made to'proposalsthat originate from outside the Foundation andthus emphasized ;be importance of state consul-tants working with educators at the local level togenerate proposals to meet local needs.
Providing an Opportunity for State Science
Supervisors to React/Respond to NSF Educational
Program changes
Throughout the conference, Dr. Frodyma and Dr.Hausman were available fo'r individual and smallgroup informal discbssions., Also, Di. Wayne W.Welch, who was serving with the Foundation while ona one-year lealie from the University of Minnesota,was available to interact with participants. Dr. Welchhad also been involved with the Conference PlanningCommittee in establishing guidelines for the confer-ence.
These opportunities to discuss Foundation involve-ments within the states, as well as new direction theFoundation was taking, were culminated by a sessionheld immediately after Dr. Hausman's presentationwhere individuals were able, to take the floor topresent their concerns to the group and to ask forresponses to their questions. Many expressed concernfor the established programs that had served well inthe past. Others were concerned that newer programssuch as those funded by Com)Errehensive Grants andSystems Grants would not be carried to completion.However, it was inevitable that the fiscal pressuresunder which Foundation programs must now operatewere recognized and general satisfaction was ex-pressed lith the statement by Dr. Hausman that con-tinuing consultation by the Foundation with stateconsultants would be important to refining the newdirections that have been established.
To provide further Opportunity for interaction,Dr. Hausman invited the participants to attendregional meetings of grant directors to be held inWashington, D.C., New Orleans, Chicago and SanFrancisco during the month of February, 1973
3532

Data Utilization in the Future: Involvementof the Council of State Science SuperVis'ors
This project was undertaken because the state con-sultants in science, social studies and mathematicsrecognized the need for information that would helpthem, individually and ,0ollectively, to make educa-tional decisions. If the project had revealed that thestate data systems were an ideal source of the neededinformation, the next steps to be taken would ob-viously be to identify questions and formulateanswers' using those systems. However, as was ex-pected at the outset, the state data systems fell farshort of ideal' when applied to the specific character-istics of science education. Therefore, with a muchmore precise picture of the nature of existing data,the Council of State Science Supervisors and theircolle'agues in the other areas are in a position to iden-tify alternatives that will most probably solve theproblems that were recognized in the position paperspresented at the NSF Regickial Conference in 1972.The following procedures may be undertaken by theCouncil in the future dependent upon the resourcesavailable and the priorities that will be established.
Because of the national involvement of the Council,a coonerative effort with agencies involved in col-lection of educational data on a national scale couldprovide data on a sampling basis relative to scienceteacher characteristics. The most probable agencyto work with is the National Center for EducationalStatistics, a division of the United States Office ofEducation pnder, the di /ection of the 'AssistantCommissioner for Educational Statistics. TheCouncil, in this role, would provide consultant ser-vice that will result in identification of useful andneeded data items. The advantage of workingthe Center for Educational Statistics would be com-plete consistency in sampling and in data collectionand treatment procedures. A recent project of theCenter, the development of the Elementary-Secon-dery Information System, is an indication of this
o
,.ability to standardize. A major disadvantage wouldbe the apparent inability of the Center to collectdata on a regular basis with a frequency that wouldkeep data current.A second alternative for cooperative effort wouldbe for the Council to work with the Committee onEvaluation and Information Systerris (CEIS), a com-mittee functioning un $r the Council of Chief State,
School Officers. This committee, with a memberfrom each state department of education, offers anexcellent opportunity for interaction with memberso f the Council of State Science 'Supervisors.Through such interaction the recommendations ofthe Council for improved data gathering (see pages28-30) could be consistently incorporated into statedata systems.The Council, with support from the NationalScience "Foundation or other interested agencies,could do its own data gathering in an effort to iden-tify the characteristics of the science teaching staffwithin the states as well as the nation. From such astudy the inservice anal preservice needs of scienceteachers could be determined. Such a study wouldhave to be based on the assumption that studentneeds can be translated into teacher needs. Such astudy would have to be done on a one-time basisbut its successful completion could be used todemonstrate the value of data relating the status ofteachers in subject areas. Results of such a studycould be instrumental in establishing nationalscience teacher education programs and developingthe rationale for federal funding of programs thatare shownto be needed.The Council could support.and cooperate with indi-vidual members to conduct pilot studies withintheir particular states. The results of such studieswould be meaningful in planning teacher educationprojects within states and regions and in developingproposals for funding. State pilot studies could alsobe used as precedents to regional' or nationalstudies. The Council; and individual members withinformation fr0q7 the Council, could on a limitedbasis act as a 'clearinghouse for science education'data. HoweverAthirlimction Could be best accom-plished by cooperation with other agencies or or-ganizations.Throughout this project and in its succeeding
phases the limitation of the Council of State ScienceSupervisors must be considered. The Council mustoperate primarily'with contributed time of its mem-bers. For financial needs the Council :is entirely de-pendent upon external grants to conduct worthyprojects. Therefore, wi/h limited professional timeand unassured funding, it is difficult for the Councilto undertake a project as massive as the proposedimprovement of the data gathering and processing'systems of he fifty states and the territories. For thisreason, the Council encourages those agenci9, organi-zations and foundations with a greater capacity forcausing change to cooperate in the effort to provideinformation that Can establish and maintain a direc-tion toward improved science edugation.
.41

Evaluation
In the initial planning for this project, eight welldefined objectives were established. In conducting theproject a specific activity was directed at each ofthese'objectiyes. Each of these tivities is discussedf...),4in the eight subections o this report under thechapter entitled` "Project Accomplishments, Observa-tions and Recommendations." .
In addition to planning sessions, the preconferenceactivities were very critical to the success of theproject. The data gathered by surveying the state de-partdients of education were essential to meeting fourof the project objectives and were closely related tothe remaining four. The judgement of the success ofthe data gathering activity may be accomplished byobserving the fact that all states-responded to bothforms and that-the responses were cOMplete in everycase. In addition, the data from the first major surveywer tabulated and made available to the participantspri r to the conference. Because the need for these on survey was not recognized until the data fromt first survey were inspected, those results wered livered to the person in charge of data collectionnd analysis on the first day of the conference. Theombined sets of data were the basis for much of the
discussion at the conference and made it possible forparticipants to establish guidelines for their planningfor future data utilization.
The conference was such a critical aspect of theproject that an independent evaluator was hired tomake observations during all of the sessions as a basisfor judging the degree of success in meeting the objec-tives that had been established. The results of thisevaluation were largely positive. The following isexcerpted from the evaluator's report:
In general, the sessions were considered success-ful by the conferees. All were well prepared, andtogether presented an assortment of ideas and
f., philosophies concerning the use of data in policyformation. The points of view of 'Richardson com-pared with Atkin provided the conferees withextreme positions not only from a theoreticalanalysis, but from the point of view of practice.They may have caused participants to reflect uponthe use of data and tempered some initial points ofview.
412
The small group work sessions were a second%major type ofd conference activity. Although re-.
ported in the proposal that work and study ses-sions would dominate the conference, the fact wasthat Many of the work sessions tended to berushed and participants felt they did not have suf-fiCient time to complete their tasks.
Apparently, however, this fact was observed bythe confdence planning committee as the com-ments and evaluation of the work sessions weremore positive for later sessions. The high meanscore for thd first session, particularly with respectto productivity and relevancy to the charge, wasprobably the result of the conferees' need to estab-lish who they were, and to find who their col-leagues were. Once this was taken care of, thegroups tended to become more prOductive as thedata shows.
The success of the group sessions, which will besignificant to the success of the entire conference,will only be known by examination of the Con-ference Planning Committee's final report. How-ever, based on the,written reports of the groups inLas Vegas, a tentative conclusion can,be preparedstng that they addressed their tasks in a profes-sin! manner and were conscientious in providingwritten summaries of their efforts.The complete evaluation report enti d "Evalua-
tion of Ps Conference on pan Utilization i °Assessing
the Needs of Science Education in the Stet s" may be.seen by contacting the Council ° of State ScienceSupervisors, Inc.
The actual measure of success for this project mustbe based upon changes brought about in state datasystems and their use in application to problerns inscience education. In the post-conferenceldIsc.ussionsit has been suggested that a possible foll0Kup surveymight be conducted at a time to be deSIgnated to
determine the extent of change in state data collec-tion as a result of this project. At this time nodefinite plans exist for carrying out this suggestion.

O
A
*it
Survey form used to collect data on the nature of state data bankson science teachers employed in the states.
(..
Co0uncil of State Science Supervisors Science Teacher Data Survey
STATE: Prepared by:
Title: Phone:
O
.Directions: Place an "X" in the appropriate space and list other it9rns of data that your state collects onindividual teachers in the appropriate spaces.
Data collected Data collected Data notby state and by state but collected by
ITEM in computer not in computer state
A. Personal
1. Teacher name
2. Social security number'
3. Sex
4. Race
5. Date of birth
6. Place of birth
7. Home address
8. Marital status
9. Citizenship
10.
12.
B. Teaching Assignment
1. Name of school
2. Address of school
3. Name of school district
4. Name of courses taught°
5. Name of courses assigned each period
6. Name of text(s) used in each course
7. Number of pupils per,course
8. DuVation of course (wks. or mo.)
35 , 9. Number of minutes per week each course meets
I
1
a
1
1
.

10. Credit per course
11. Grade level of course
12. Assignments other than science teaching.
ITEM
13.
14.
15.
C. Teaching Experietf&
1. Total years teaching experience
2. Years of teaching experiend in state
3. New to state------
4. New to district
5 Previous-years place of employment
6. Y4rs teaching present course(s)
7.
8.
9..
D. 'Certification
.%,
1. Basis on which teachers ce ti.fication was issued
2. --79beof-certificate held ( , rfe, admin., pro-visional, etc.)
3. Subject area(s) of certificat n endorsement)
4. Date certificate was issued.
5. pate certificke utilized
6f Date certificate expires
7. Certificate(s) held in,other states
8.
9.
10.
Data collectedby state andin computer
Data collected Data notby state but collected by
not in computer state
I
1
6
36

ITEM
E. College qreparation ,
1. Total hours college credit
2. Year last credit was earned .
3. Degree(s) earned
a. type
b. date earned
c. college name
d. college locaticin
lr
Transcript of credits 0,
Data collected a ata collected Data notby state and by state but , collected byin computer not in computer state
1
<5. Number of ore'dits preparation in major-teach-ine&ea
6. NSF supported projects attended
7.
of . Salaryet.
1. Salary
2. Dayi of contract
3. Full or part time employee
4. Fringe benefits.
5. Extra pay for extra duty
6. Percent of salary supported by federal funds
7.
8.
.9.
G. MiscellaneoUs\
1. Military experiencee.
2. Non-teaching job experience
3.
37 4.
I

urn/
Data collected Data collected Data notby state and by state but collected b9 ,in computer not in computer state..-
H. Teacher Supply and Need Data collected by sub-ject or grade1. Projeoted vacancies for September assignments
2. Projected vacancies for January assignments
3. Positibns remaining unfilled after Sept. assign-ments
4. Positions remainirt unfilled after January"assignments
5. Teachers teaching out of their\area of certifica-tion °
6. Projected teacher graduates from state institu-tions within the state
7. State institution teacher graduates employedby the state
8. State institution teacher graduates unemployed
9. a
10.
I. Teacher Aides
1. Data on Para-professional employees
ATTENTION: The DEADLINE for the return of thii data surveylorm is
OCTOBER 25, 1972
Return all requested information and materials to:
Ray Thiess, SpecialistScience EducationState Department of Education942 Lancaster Drive, N.E.Salem, Oregon 97310
I.
p
1
38.
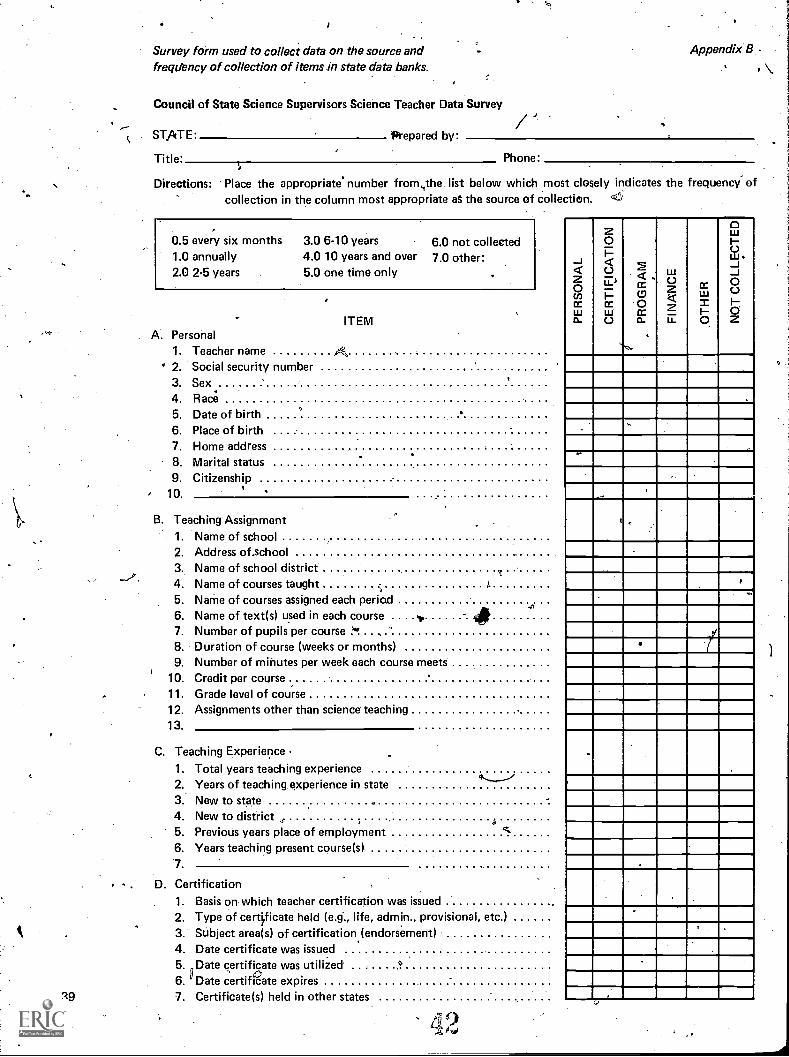
39
Survey form used to collect data on the source andfreqdency of collection of items in state data banks.
Council of State Science Supervisors Science Teacher Data Survey
Appendix B
STATE: Prepared by:
Title: Phone
Directions: Place the appropriate' number from,the list below which most closely indicates the frequency ofcollection in the column most appropriate ag the source of collection. </
0.5 every six months1.0 annually2.0 2-5 years
3.0 6-10 years4.0 10 years and over5.0 one time only
6.0 not collected7.0 other:
ITEMA. Personal
1. Teacher name° 2. Social security number
3. Sex.4. Race
5. Date of birth6. Place of birth7. Home address8. Marital status9. Citizenship
10.
B. Teaching Assignment1. Name of school2. Address of.school3. Name of school district4. Name of courses taught5. Name of courses assigned each period6. Name of text(s) used in each course7. Number of pupils per course 'a, ,
8. Duration of course (weeks or months)9. Number of minutes per week each course meets
10. Credit per course11. Grade level of course12. Assignments other than science teaching13.
C. Teaching Experience1. Total years teaching experience2. Years of teaching experience in state3. New to state4. New to district5. Previous years place of employment6. Years teaching present course(s)7.
D. Certification1. Basis on which teacher certification was issued2. Type of certificate held (e.g., life, admin., provisional, etc.)3. Subject area(s) of certification(endorsement)4. Date certificate was issued5. Date certificate was utilized6. If Date certificate expires7. Certificate(s) held in other states
s 3 9
...,
<z(/)CCLLIci,
zOP<( )ID1-CCLUo
--
tccr
°CC0_
w0krZ-U-
cc
1I-0
ow1-
2 ....1I0I-0Z
-
....
P
.4
11
,- ....
,- _....

o.
E. College Preparation
1. Total hours college credit2. Year last credit was earned3. Degree(s) earned
a. Typeb. Date earned 1.
c. College named. College location
4. Transcript of credits5. Number of credits preparation in major teaching area6. NSF supported projects attended7.
F. Salary
1. Salary2. Days of contract3. Full-tirne or part1ime employee4. Fringe benefits5. Extra pay for extra duty6. Percent of salary supported by federal funds7
G. Miscellaneous
1.. Military experience2. Non-teaching job experiences3
. Teacher Supply and Need
Data collected by subject or grade
1. Data on parapiofessioal employees2
Teacher Aides
1. Projected vacancies fdr September assignments2.- Projected vacancies for January assignments3. Positions remaining unfilled after September assignments4. Positions remaining unfilled after January assignments5. Teachers teaching out of their area of certification6. Projected teacher graduateffrom state institutions within the state7. State institution teacher graduates employed by the state8. State institution teacher graduates unemployed9.
_1<0cc .ILIa..
zOI-<0a-.
ccw
. cj
ct,..,
0CCa:
u,C.)Z
u.
-,
Ic.
0w II0w ,_1J000z
., .
.
...
.
4,-
,ft
ATTENTION: The source and frequency of collection information which is requested at thisthe last charge to you paor to the CS3 National Conference in Las Vegas,2530, 1973
You must bring this information with you to the congence and be prepareddata at the first general assembly.
11 3
time constitutesNevada, January
to surrender the
7
z
40

4,1 I
1001141104
Illimunsam
m01111M
imm
isamm
sa
kXO
NN
IIN
rnMaM
O
1I
(;=
116"
aisill=)
asslam
morm
ort6`111.11111.1111.1.111110
4 X
f