Embed Size (px)
Citation preview
The business of sustainability
Installation and Operation of the METISS Subsea Cable System to be Landed in Amanzimtoti, South Africa Final Environmental Impact Assessment Report
25 July 2019
ERM Project No.: 0482086
www.erm.com Project No.: 0482086 Client: ASN and Liquid Telecom
ERM
Document details
Document title Installation and Operation of the METISS Subsea Cable System to be Landed in Amanzimtoti, South Africa
Document subtitle Final Environmental Impact Assessment Report
ERM Project No. 0482086
Date 25 July 2019
Version 1.0
Author Reinett Mogotshi, Vicky Stevens, Amy Barclay
Client Name ASN and Liquid Telecom
Document history
ERM approval to issue
Version Revision Author Reviewed by Name Date Comments
Draft 01 Reinett Mogotshi, Vicky Stevens, Amy Barclay
Henry Camp Philip Johnson
30 May 2019 Issued for public comment
Final 01 Reinett Mogotshi, Vicky Stevens, Amy Barclay
Henry Camp Philip Johnson
22 July 2019 Issued for submission to DEA
www.erm.com Project No.: 0482086 Client: ASN and Liquid Telecom
ERM
25 July 2019
Installation and Operation of the METISS Subsea Cable System to be Landed in Amanzimtoti, South Africa Final Environmental Impact Assessment Report
Phil Johnson Partner
ERM
Cape Town Office
1st Floor, Great Westerford
240 Main Road, Rondebosch 7700,
Cape Town, South Africa
T: +27 21 681 5400
© Copyright 2019 by ERM Worldwide Group Ltd and / or its affiliates (“ERM”). All rights reserved. No part of this work may be reproduced or transmitted in any form, or by any means, without the prior written permission of ERM.
www.erm.com Project No.: 0482086 Client: ASN and Liquid Telecom Page 1
METISS FINAL EIA REPORT EXECUTIVE SUMMARY
EXECUTIVE SUMMARY
Introduction This executive summary provides a summary of the Final Environmental Impact Assessment (EIA) Report for the METISS Subsea Cable System Project, which includes a description of the proposed Project and the associated Scoping and EIA process.
This Final EIA Report has been updated based on comments received on the Draft EIA Report. The report was updated to address stakeholder concerns and clarifications (Appendix C). These changes are underlined to enable stakeholders to easily see that their comments have been taken into consideration.
Project Description The Project involves the installation and operation of the Melting Pot Indianoceanic Submarine System (METISS) in South Africa. METISS is a proposed new subsea, fibre optic cable system that will connect Mauritius to South Africa and provide high-speed connectivity of 24 terabytes per second to the global telecommunications network, as well as low latency access to enhance business operations across multiple industries.
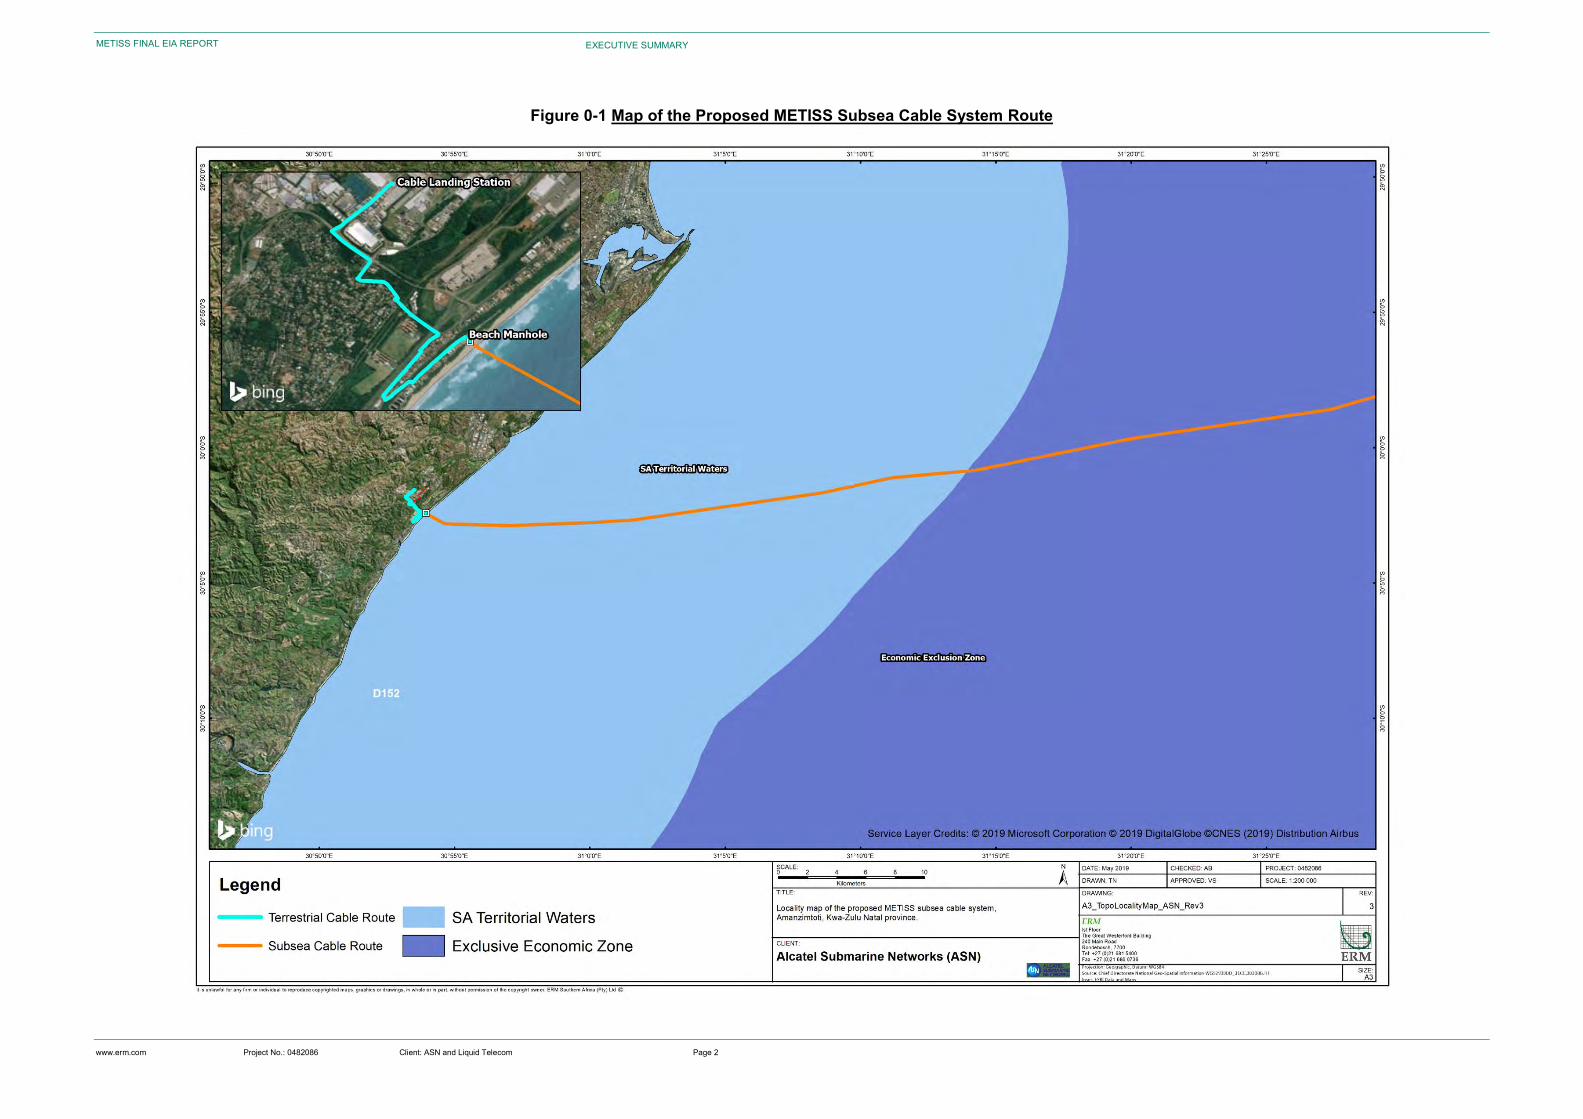
The METISS main cable (‘trunk’) will run more than 3,200 km from Mauritius to South Africa and splits at Branching Units off the main trunk to landing sites in Reunion Island and Madagascar. In South Africa specifically, the METISS subsea cable will run approximately 538 km (inclusive of Territorial Waters and Economic Exclusive Zone (EEZ)). The system includes a 14 mm to 35 mm diameter subsea cable that will enter the South African EEZ (approximately 370 km from the seashore) and continue through Territorial Waters (approximately 22 km from the seashore), and onto land until it reaches the Cable Landing Station (CLS) at Pipeline Beach in Amanzimtoti, KwaZulu-Natal (Figure 0-1). The Project is provisionally scheduled to be installed in the first quarter of 2020 and is expected to be completed and operational by the end of the third quarter of 2020.
Direct Area of Influence The Project Area of Influence comprises the spatial area in which there will be a direct or indirect impact on biophysical and socio-economic resources or receptors from the Project. The Project Area of Influence includes both the Direct Area of Influence (AoI) and Indirect AoI.
The Direct AoI is defined as the area directly affected by Project activities and comprises mainly the Peroject’s physical footprint. The scale of the Direct AoI will be dependent on the source and cause of the impacts and will not be consistent for every environmental or social aspect i.e., the Direct AoI for air quality impacts could differ from the Direct AoI for the consideration of social impacts. In deciding upon the Project AoI, the larger affected area between the environmental aspects is selected.
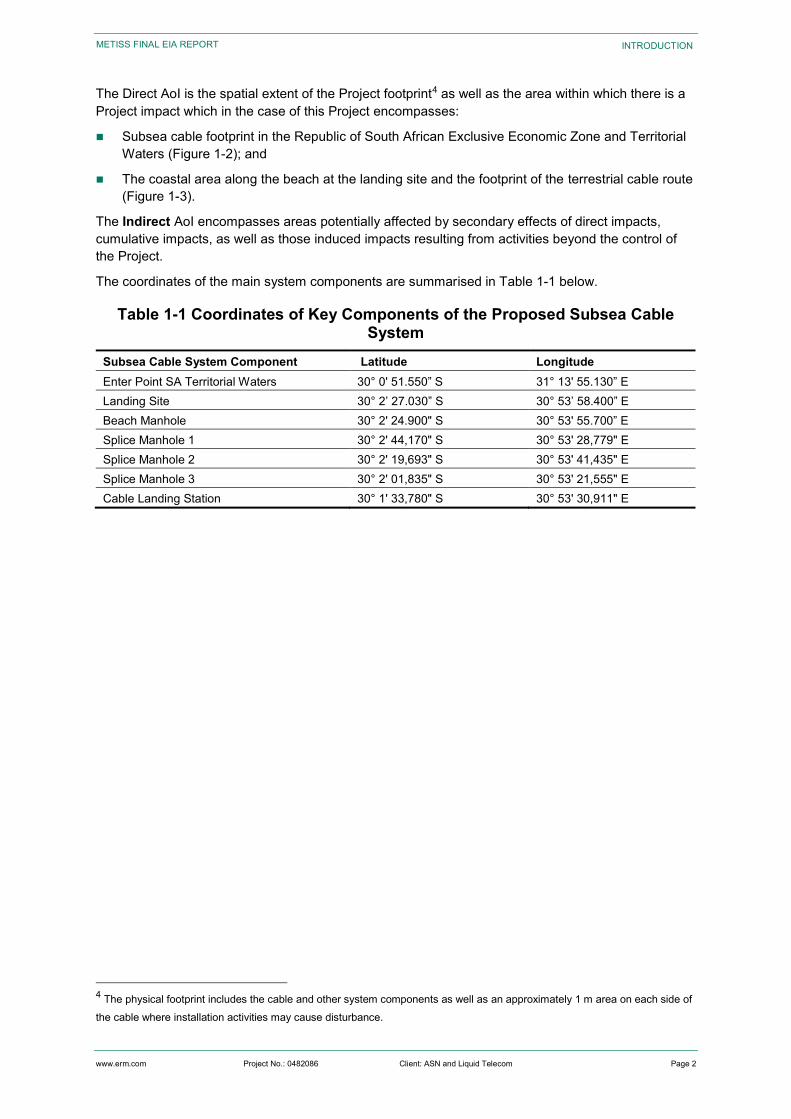
The Direct AoI is the spatial extent of the Project footprint1 as well as the area within which there is a Project impact which in the case of this Project encompasses:
Subsea cable footprint in the Republic of South African Exclusive Economic Zone and Territorial Waters (Figure 0-1); and
The coastal area along the beach at the landing site and the footprint of the terrestrial cable route (Figure 0-1).
The Indirect AoI encompasses areas potentially affected by secondary effects of direct impacts, cumulative impacts, as well as those induced impacts resulting from activities beyond the control of the Project.
1 The physical footprint includes the cable and other system components as well as an approximately 1 m area on each side of the cable where installation activities may cause disturbance.
www.erm.com Project No.: 0482086 Client: ASN and Liquid Telecom Page 2
METISS FINAL EIA REPORT EXECUTIVE SUMMARY
Figure 0-1 Map of the Proposed METISS Subsea Cable System Route
www.erm.com Project No.: 0482086 Client: ASN and Liquid Telecom Page 3
METISS FINAL EIA REPORT EXECUTIVE SUMMARY
Administrative Framework The National Environmental Management Act (No.107 of 1998), as amended (NEMA) is the South African framework legislation governing environmental protection and management. This, along with the 2014 EIA Regulations (GN R.326 of April 2014) as amended (EIA Regulations) provides a framework for the integration of environmental issues into the planning, design, decision-making and implementation of plans and development proposals that are likely to have a negative effect on the environment.
Numerous listed activities have been identified for this Project in terms of all the NEMA listing notices (GNR 324, 325 and 327 of 2017). In instances where all the listing notices are triggered (as in this Project), GNR 325 requirements takes precedent and the Project is subject to a full Scoping & Environmental Impact Assessment process prior to commencement of any of the associated activities. Based on the EIA Regulations, the Competent Authority for this Project is the National Department of Environmental Affairs (DEA). As such, the Project is required to obtain a positive Environmental Authorisation from the DEA prior to commencement of the proposed activities.
Project Components The Project involves the installation and operation of the subsea cable system, which has been separated into subsea (i.e. marine) and terrestrial components.
The subsea cable components include the following:
Fibre-optic subsea cable;
Repeaters and Branching Units (BU);
Beach Manhole (BMH); and
System earth.
The terrestrial cable system components include the following:
Cable Landing Station (CLS) (in the case of the Project this will be an existing building); and
Terrestrial fibre optic cable (herein referred to as terrestrial cable) and splicing manholes.
Project Activities The Project activities can be divided into three phases as follows:
Pre-installation and Installation;
Operations; and
Decommissioning.
EIA Process The EIA process involves two phases, namely:
Scoping Phase; and
Impact Assessment Phase.
The EIA process was initiated in November 2018 by ERM updating the stakeholder database and collecting the information required, from Liquid Telecom and ASN, to draft the application for Environmental Authorisation and the Scoping Report.
www.erm.com Project No.: 0482086 Client: ASN and Liquid Telecom Page 4
METISS FINAL EIA REPORT EXECUTIVE SUMMARY
During the Scoping Phase (February to March 2019), the Terms of Reference (ToR) for the detailed EIA Report was formulated and requirements from the authorities clarified, and potential issues and concerns identified via consultation.
After completion of Scoping Phase, the specialist studies were undertaken in order to evaluate the key issues identified during consultation. Specialists provided a description of the existing baseline conditions for their particular area of investigation as well as the identification of project actions that will or could result in significant impacts. Specialists recommend ways in which adverse impacts could be mitigated to reduce their severity, and positive impacts enhanced. ERM utilised these specialist studies to compile the Draft EIA Report and associated Environmental Management Programme (EMPr).
In June 2019, ERM released the Draft EIA Report for public review and comment. All comments made by stakeholders and I&APs were captured in a Comments and Response Report (Appendix B). This Final EIA Report addresses the issues and concerns raised during the public review and comment period for both the Scoping and EIA Phase.
All recommendations cited in this Final EIA Report are also detailed in an EMPr, which defines the mitigation/ enhancement actions to be implemented. The EMPr is recognised as important tool for the sound environmental management of the Project. A key component of the EIA process is public participation. In South Africa public participation is required for an Environmental Authorisation process in terms of the EIA Regulations. Table 0-1 provides a breakdown of the public participation tasks undertaken during this process.
Table 0-1 Public Participation Activities Activity Description and Purpose Timelines Pre-Application Activities Preparation of a preliminary stakeholder database
A preliminary database2 was compiled and included authorities (local and provincial), Non-Governmental Organisations, neighbouring landowners and other key stakeholders (Appendix B). This database of identified I&APs has been maintained and updated during the ongoing EIA process.
November 2018
Scoping Phase Erection of Site Notices
Site notices (in English) were placed at the following locations: • Near the proposed Beach Manhole location in
Amanzimtoti Pipeline Beach • Kingsburgh Library; and • Amanzimtoti Library.
These notices presented the details of the application and the public participation process; including where further information on the application and the Draft Scoping Report could be obtained. The notice also requested the registration of stakeholders and provided information as to the manner in which comments may be made.
29 January 2019
2 The preliminary database was compiled for the initial notification purposes, and was made up of initially identified and potentially affected parties. Following the project being advertised, and additional stakeholders registering, all identified stakeholders are now referred to as ‘registered stakeholders’ and notified of all activities been undertaken during the EIA Process.
www.erm.com Project No.: 0482086 Client: ASN and Liquid Telecom Page 5
METISS FINAL EIA REPORT EXECUTIVE SUMMARY
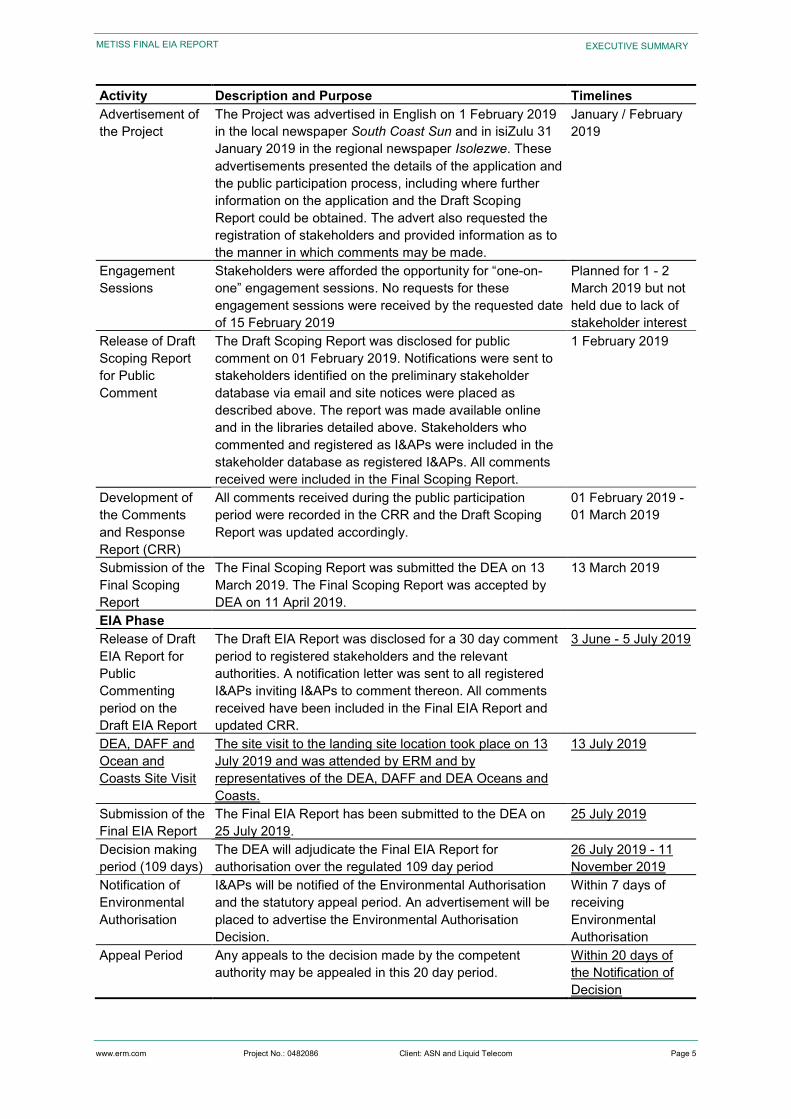
Activity Description and Purpose Timelines Advertisement of the Project
The Project was advertised in English on 1 February 2019 in the local newspaper South Coast Sun and in isiZulu 31 January 2019 in the regional newspaper Isolezwe. These advertisements presented the details of the application and the public participation process, including where further information on the application and the Draft Scoping Report could be obtained. The advert also requested the registration of stakeholders and provided information as to the manner in which comments may be made.
January / February 2019
Engagement Sessions
Stakeholders were afforded the opportunity for “one-on-one” engagement sessions. No requests for these engagement sessions were received by the requested date of 15 February 2019
Planned for 1 - 2 March 2019 but not held due to lack of stakeholder interest
Release of Draft Scoping Report for Public Comment
The Draft Scoping Report was disclosed for public comment on 01 February 2019. Notifications were sent to stakeholders identified on the preliminary stakeholder database via email and site notices were placed as described above. The report was made available online and in the libraries detailed above. Stakeholders who commented and registered as I&APs were included in the stakeholder database as registered I&APs. All comments received were included in the Final Scoping Report.
1 February 2019
Development of the Comments and Response Report (CRR)
All comments received during the public participation period were recorded in the CRR and the Draft Scoping Report was updated accordingly.
01 February 2019 - 01 March 2019
Submission of the Final Scoping Report
The Final Scoping Report was submitted the DEA on 13 March 2019. The Final Scoping Report was accepted by DEA on 11 April 2019.
13 March 2019
EIA Phase Release of Draft EIA Report for Public Commenting period on the Draft EIA Report
The Draft EIA Report was disclosed for a 30 day comment period to registered stakeholders and the relevant authorities. A notification letter was sent to all registered I&APs inviting I&APs to comment thereon. All comments received have been included in the Final EIA Report and updated CRR.
3 June - 5 July 2019
DEA, DAFF and Ocean and Coasts Site Visit
The site visit to the landing site location took place on 13 July 2019 and was attended by ERM and by representatives of the DEA, DAFF and DEA Oceans and Coasts.
13 July 2019
Submission of the Final EIA Report
The Final EIA Report has been submitted to the DEA on 25 July 2019.
25 July 2019
Decision making period (109 days)
The DEA will adjudicate the Final EIA Report for authorisation over the regulated 109 day period
26 July 2019 - 11 November 2019
Notification of Environmental Authorisation
I&APs will be notified of the Environmental Authorisation and the statutory appeal period. An advertisement will be placed to advertise the Environmental Authorisation Decision.
Within 7 days of receiving Environmental Authorisation
Appeal Period Any appeals to the decision made by the competent authority may be appealed in this 20 day period.
Within 20 days of the Notification of Decision
www.erm.com Project No.: 0482086 Client: ASN and Liquid Telecom Page 6
METISS FINAL EIA REPORT EXECUTIVE SUMMARY
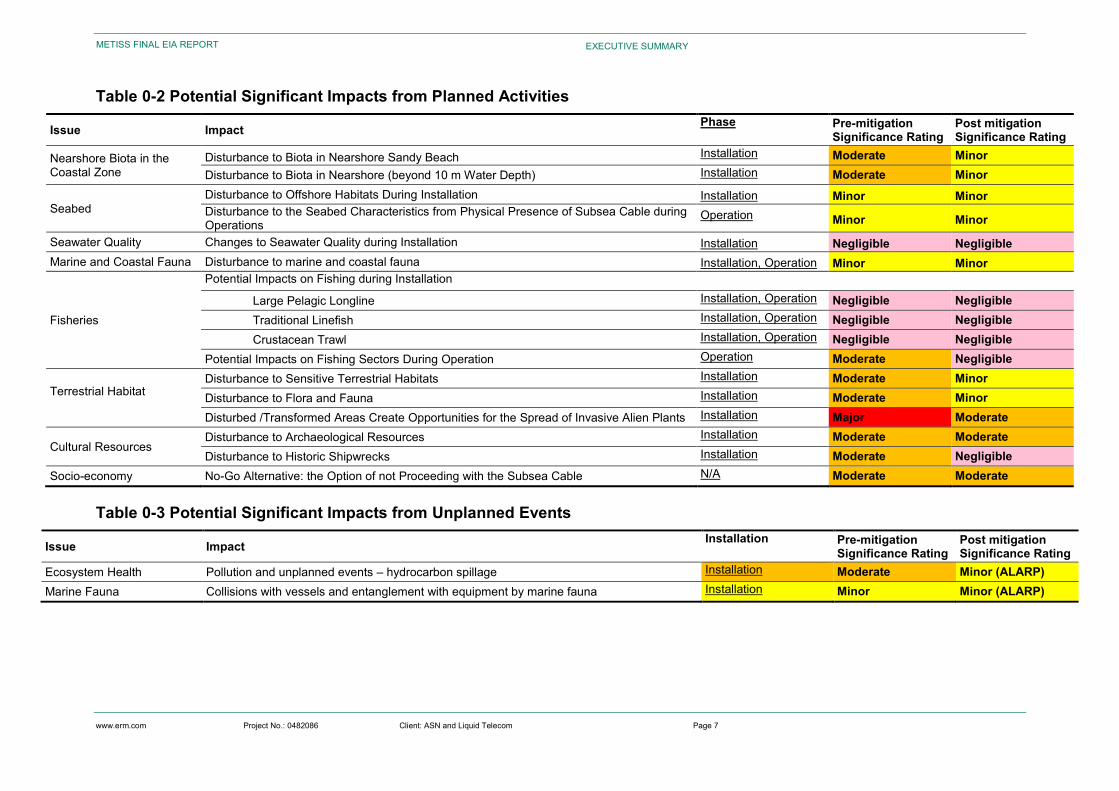
Impact Identification The Impact Assessment identifies and evaluates the potential impacts that the Project may have on the biophysical and socio-economic environments and specifies mitigation and management measures that will be implemented to avoid, minimize or reduce negative impacts and enhance positive impacts.
Table 0-2 and Table 0-3 provides an overview of likely aspects arising from each of the key Project activities and considers their likely interaction with socio-economic and environmental resources and receptors. It should be noted that the potential impacts identified, will be mainly associated with the installation activities.
www.erm.com Project No.: 0482086 Client: ASN and Liquid Telecom Page 7
METISS FINAL EIA REPORT EXECUTIVE SUMMARY
Table 0-2 Potential Significant Impacts from Planned Activities
Issue Impact Phase Pre-mitigation Significance Rating
Post mitigation Significance Rating
Nearshore Biota in the Coastal Zone
Disturbance to Biota in Nearshore Sandy Beach Installation Moderate Minor Disturbance to Biota in Nearshore (beyond 10 m Water Depth) Installation Moderate Minor
Seabed Disturbance to Offshore Habitats During Installation Installation Minor Minor Disturbance to the Seabed Characteristics from Physical Presence of Subsea Cable during Operations
Operation Minor Minor
Seawater Quality Changes to Seawater Quality during Installation Installation Negligible Negligible Marine and Coastal Fauna Disturbance to marine and coastal fauna Installation, Operation Minor Minor
Fisheries
Potential Impacts on Fishing during Installation
Large Pelagic Longline Installation, Operation Negligible Negligible Traditional Linefish Installation, Operation Negligible Negligible Crustacean Trawl Installation, Operation Negligible Negligible
Potential Impacts on Fishing Sectors During Operation Operation Moderate Negligible
Terrestrial Habitat
Disturbance to Sensitive Terrestrial Habitats Installation Moderate Minor Disturbance to Flora and Fauna Installation Moderate Minor Disturbed /Transformed Areas Create Opportunities for the Spread of Invasive Alien Plants Installation Major Moderate
Cultural Resources Disturbance to Archaeological Resources Installation Moderate Moderate Disturbance to Historic Shipwrecks Installation Moderate Negligible
Socio-economy No-Go Alternative: the Option of not Proceeding with the Subsea Cable N/A Moderate Moderate
Table 0-3 Potential Significant Impacts from Unplanned Events
Issue Impact Installation Pre-mitigation Significance Rating
Post mitigation Significance Rating
Ecosystem Health Pollution and unplanned events – hydrocarbon spillage Installation Moderate Minor (ALARP) Marine Fauna Collisions with vessels and entanglement with equipment by marine fauna Installation Minor Minor (ALARP)
www.erm.com Project No.: 0482086 Client: ASN and Liquid Telecom Page 8
METISS FINAL EIA REPORT EXECUTIVE SUMMARY
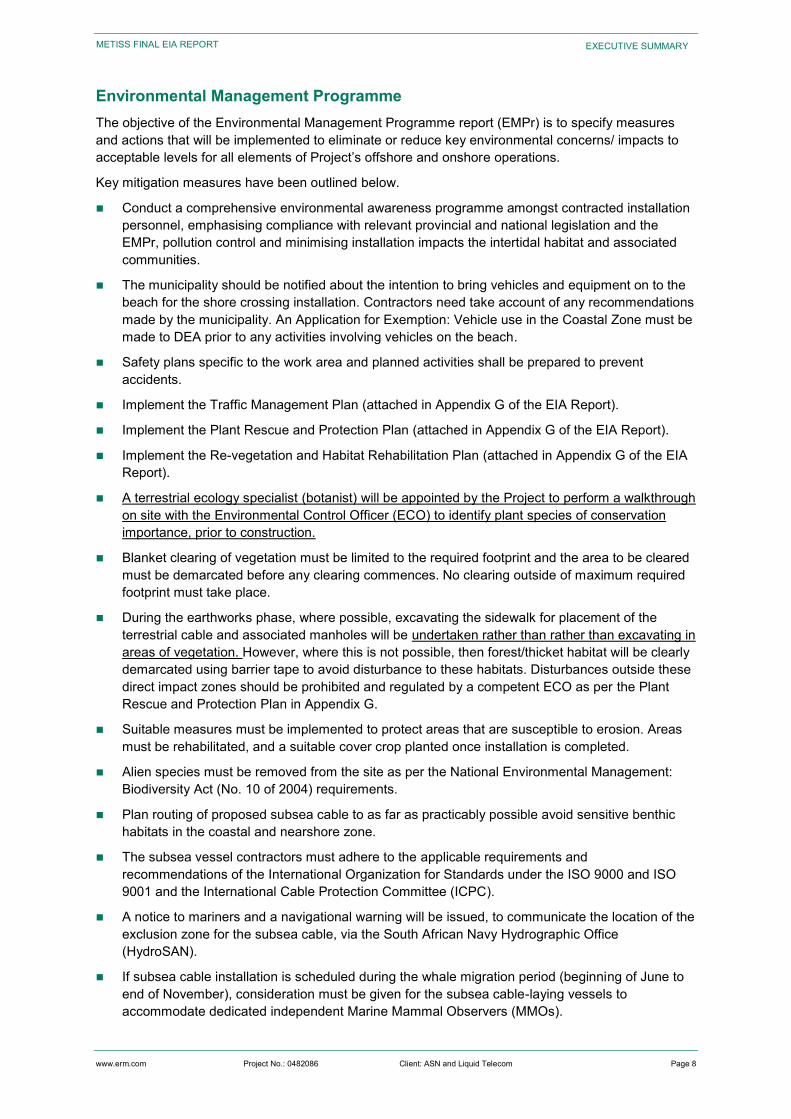
Environmental Management Programme The objective of the Environmental Management Programme report (EMPr) is to specify measures and actions that will be implemented to eliminate or reduce key environmental concerns/ impacts to acceptable levels for all elements of Project’s offshore and onshore operations.
Key mitigation measures have been outlined below.
Conduct a comprehensive environmental awareness programme amongst contracted installation personnel, emphasising compliance with relevant provincial and national legislation and the EMPr, pollution control and minimising installation impacts the intertidal habitat and associated communities.
The municipality should be notified about the intention to bring vehicles and equipment on to the beach for the shore crossing installation. Contractors need take account of any recommendations made by the municipality. An Application for Exemption: Vehicle use in the Coastal Zone must be made to DEA prior to any activities involving vehicles on the beach.
Safety plans specific to the work area and planned activities shall be prepared to prevent accidents.
Implement the Traffic Management Plan (attached in Appendix G of the EIA Report).
Implement the Plant Rescue and Protection Plan (attached in Appendix G of the EIA Report).
Implement the Re-vegetation and Habitat Rehabilitation Plan (attached in Appendix G of the EIA Report).
A terrestrial ecology specialist (botanist) will be appointed by the Project to perform a walkthrough on site with the Environmental Control Officer (ECO) to identify plant species of conservation importance, prior to construction.
Blanket clearing of vegetation must be limited to the required footprint and the area to be cleared must be demarcated before any clearing commences. No clearing outside of maximum required footprint must take place.
During the earthworks phase, where possible, excavating the sidewalk for placement of the terrestrial cable and associated manholes will be undertaken rather than rather than excavating in areas of vegetation. However, where this is not possible, then forest/thicket habitat will be clearly demarcated using barrier tape to avoid disturbance to these habitats. Disturbances outside these direct impact zones should be prohibited and regulated by a competent ECO as per the Plant Rescue and Protection Plan in Appendix G.
Suitable measures must be implemented to protect areas that are susceptible to erosion. Areas must be rehabilitated, and a suitable cover crop planted once installation is completed.
Alien species must be removed from the site as per the National Environmental Management: Biodiversity Act (No. 10 of 2004) requirements.
Plan routing of proposed subsea cable to as far as practicably possible avoid sensitive benthic habitats in the coastal and nearshore zone.
The subsea vessel contractors must adhere to the applicable requirements and recommendations of the International Organization for Standards under the ISO 9000 and ISO 9001 and the International Cable Protection Committee (ICPC).
A notice to mariners and a navigational warning will be issued, to communicate the location of the exclusion zone for the subsea cable, via the South African Navy Hydrographic Office (HydroSAN).
If subsea cable installation is scheduled during the whale migration period (beginning of June to end of November), consideration must be given for the subsea cable-laying vessels to accommodate dedicated independent Marine Mammal Observers (MMOs).
www.erm.com Project No.: 0482086 Client: ASN and Liquid Telecom Page 9
METISS FINAL EIA REPORT EXECUTIVE SUMMARY
Undertaking all maritime operations in line with International Maritime Law and safe practice guidelines.
In the event that an unknown or unrecorded shipwreck is encountered during the installation of the subsea cable, the Project archaeologist and South African Heritage Resources Agency (SAHRA) must be notified immediately. If the wreck will be impacted by the subsea cable laying, all work must cease until the archaeologist and SAHRA have assessed the significance of the site and a decision has been taken as to how to deal with it.
Should archaeological sites or material be encountered during installation, the archaeologist must have the authority to notify the and Amafa aKwaZulu-Natali (Amafa), stop work until the find has been assessed and any sampling or excavation that is necessary to rescue the archaeological material in question has been carried out.
Cable repair contractors must be immediately mobilised, and repairs be undertaken as efficiently as possible.
Conclusion During this EIA process, certain control measures have been specified as part of the Project to manage the anticipated impacts. These control measures also ensure that the Project is compliant with South African Regulations as well as international policies, frameworks and industry good practise during its activities. Over and above the recommended controls, mitigation and management measures have been drafted and form part of the EMPr developed with this EIA Report.
All mitigations listed in the EMPr are to be implemented during the course of the Project (throughout installation and operation where applicable) to ensure compliance and to ensure that the potential negative impacts associated with the establishment of the Project are respectively mitigated to a level that is deemed adequate for the Project to proceed.
In summary, based on the findings of this assessment and taking into account the benefits this Project poses for the South African economy, the proposed installation of the METISS Subsea Cable System, should be authorised. This is, however, contingent on the implementation of the mitigation measures and monitoring for potential environmental and socio-economic impacts as outlined in the EIA Report and EMPr being implemented by the Project.
www.erm.com Project No.: 0482086 Client: ASN and Liquid Telecom Page 10
METISS FINAL EIA REPORT EXECUTIVE SUMMARY
CONTENTS
EXECUTIVE SUMMARY ......................................................................................................................... I Introduction ................................................................................................................................................... i Project Description ........................................................................................................................................ i Direct Area of Influence ................................................................................................................................ i Administrative Framework ........................................................................................................................... iii Project Components .................................................................................................................................... iii Project Activities........................................................................................................................................... iii EIA Process ................................................................................................................................................. iii Impact Identification ..................................................................................................................................... vi Environmental Management Programme .................................................................................................. viii Conclusion ................................................................................................................................................... ix
1. INTRODUCTION .......................................................................................................................... 1 1.1 Project Overview ............................................................................................................................ 1 1.2 Project Area of Influence................................................................................................................ 1 1.3 Background .................................................................................................................................... 6 1.4 Purpose of this Report ................................................................................................................... 6 1.5 Applicable Legislation .................................................................................................................... 7
1.5.1 National Environmental Management Act ..................................................................... 7 1.5.2 Environmental Impact Assessment Regulations ........................................................... 7
1.6 Project Proponent .......................................................................................................................... 8 1.7 Competent Authority ...................................................................................................................... 8 1.8 EIA Consultant ............................................................................................................................... 8 1.9 Specialist Team ............................................................................................................................. 9 1.10 Undertaking by EAP ...................................................................................................................... 9 1.11 EIA Report Contents Requirements as per 2014 EIA Regulations .............................................. 10 1.12 Report Structure .......................................................................................................................... 12
2. PROJECT DESCRIPTION ......................................................................................................... 14 2.1 Overview ...................................................................................................................................... 14 2.2 Purpose and Need ....................................................................................................................... 14 2.3 Subsea Cable Components ......................................................................................................... 15
2.3.1 Subsea Fibre Optic Cable ........................................................................................... 15 2.3.2 Repeaters and Branching Units .................................................................................. 16 2.3.3 Landing Site Location ................................................................................................. 16 2.3.4 Beach Manhole Construction ...................................................................................... 17 2.3.5 System Earth .............................................................................................................. 18
2.4 Terrestrial Cable Components ..................................................................................................... 21 2.4.1 Terrestrial Fibre Optic Cable ....................................................................................... 21 2.4.2 Cable Landing Station (existing building) .................................................................... 28
2.5 Project Activities .......................................................................................................................... 28 2.5.1 Pre-Installation ............................................................................................................ 29 2.5.2 Installation Phase ........................................................................................................ 32 2.5.3 Operation of the System ............................................................................................. 41 2.5.4 Employment Opportunities .......................................................................................... 43 2.5.5 Decommissioning ........................................................................................................ 43
3. CONSIDERATION OF ALTERNATIVES ................................................................................... 44 3.1 Subsea Cable Route Alternatives ................................................................................................ 44 3.2 Landing Site Location Alternatives ............................................................................................... 44
3.2.1 Description of Alternatives .......................................................................................... 46 3.2.2 Comparison of Site Alternatives .................................................................................. 46 3.2.3 Selection of the Preferred Landing Site Location Alternative ...................................... 47
3.3 Terrestrial Cable Route Alternatives ............................................................................................ 47
www.erm.com Project No.: 0482086 Client: ASN and Liquid Telecom Page 11
METISS FINAL EIA REPORT EXECUTIVE SUMMARY
3.3.1 Description of Alternatives .......................................................................................... 47 3.4 Activity Alternatives ...................................................................................................................... 53
3.4.1 Description of Alternatives .......................................................................................... 53 3.4.2 Comparison of Alternatives ......................................................................................... 53
3.5 Technology Alternatives............................................................................................................... 54 3.5.1 System Earth .............................................................................................................. 54 3.5.2 Subsea Cable Installation at the Shore Crossing ........................................................ 54 3.5.3 Terrestrial Cable from BMH to CLS ............................................................................ 55 3.5.4 Impacts Associated with the Technology Alternatives Identified ................................. 55
3.6 No-Go Alternative ........................................................................................................................ 57
4. ADMINISTRATIVE FRAMEWORK ............................................................................................ 58 4.1 Introduction .................................................................................................................................. 58 4.2 Environmental Authorisation Legislative Process ........................................................................ 58
4.2.1 NEMA Environmental Authorisation ............................................................................ 58 4.3 Other Applicable Legislation, Polices and/or Guidelines .............................................................. 60
4.3.1 National Legislation ..................................................................................................... 60 4.3.2 National Guidelines ..................................................................................................... 63
4.4 Integrated Environmental Management ....................................................................................... 63
5. PUBLIC PARTICIPATION ......................................................................................................... 64 5.1 Objectives .................................................................................................................................... 64 5.2 Legislative Context ...................................................................................................................... 64
5.2.1 Scoping Phase ............................................................................................................ 64 5.2.2 Impact Assessment Phase ......................................................................................... 65
5.3 Public Participation Activities ....................................................................................................... 67 5.4 Comments Raised During Scoping Phase ................................................................................... 68 5.5 Comments Raised During EIA Phase .......................................................................................... 69
6. ENVIRONMENTAL AND SOCIAL BASELINE CONDITIONS .................................................. 70 6.1 Biophysical Baseline Environment ............................................................................................... 70
6.1.1 Climate Change .......................................................................................................... 70 6.1.2 Air Quality ................................................................................................................... 70
6.2 Terrestrial Environment................................................................................................................ 70 6.2.1 Climatic Conditions ..................................................................................................... 70 6.2.2 Terrestrial Biodiversity ................................................................................................ 71 6.2.3 National Threatened Ecosystems ............................................................................... 76 6.2.4 Areas of Provincial and Municipal Conservation Importance ...................................... 79 6.2.5 Flora Species .............................................................................................................. 82 6.2.6 Fauna Species ............................................................................................................ 88
6.3 Topography .................................................................................................................................. 88 6.4 Marine Environment ..................................................................................................................... 89
6.4.1 Water Masses and Circulation .................................................................................... 89 6.4.2 Bathymetry and Seabed Sediments ............................................................................ 94 6.4.3 Biological Environment ............................................................................................... 95
6.5 Protected and Conservation Areas ............................................................................................ 110 6.5.1 Marine and Protected Areas ..................................................................................... 110 6.5.2 World Heritage Site ................................................................................................... 111 6.5.3 Ecologically and Biologically Significant Area (EBSAs) ............................................ 112
6.6 Socio-Economic Baseline Description ....................................................................................... 113 6.6.1 Government Institutions ............................................................................................ 113 6.6.2 Demographics ........................................................................................................... 113 6.6.3 Employment .............................................................................................................. 114 6.6.4 Economy and Livelihoods ......................................................................................... 114
www.erm.com Project No.: 0482086 Client: ASN and Liquid Telecom Page 12
METISS FINAL EIA REPORT EXECUTIVE SUMMARY
6.6.5 Social Services and Infrastructure ............................................................................ 114 6.6.6 Dumping Waste ........................................................................................................ 116 6.6.7 Mineral and Petroleum and Exploration Rights and Activities ................................... 116 6.6.8 Tourism ..................................................................................................................... 116 6.6.9 Marine Traffic ............................................................................................................ 116 6.6.1 Subsea Cables.......................................................................................................... 116 6.6.2 Fisheries ................................................................................................................... 119 6.6.3 Cultural Heritage and Archaeology ........................................................................... 129
6.7 Planning Context for the Future Development in the Project Area of Influence ......................... 133 6.7.1 The Spatial Development Framework ....................................................................... 133
7. IMPACT ASSESSMENT METHODOLOGY............................................................................. 135 7.1 Impact Identification and Characterisation ................................................................................. 135 7.2 Determining Magnitude .............................................................................................................. 136
7.2.1 Determining Receptor Sensitivity .............................................................................. 137 7.2.2 Reversibility and Loss of Resource ........................................................................... 138 7.2.3 Assessing Significance ............................................................................................. 138
7.3 Mitigation Potential and Residual Impacts ................................................................................. 139 7.3.1 Residual Impact Assessment .................................................................................... 140 7.3.2 Cumulative Impacts .................................................................................................. 140
7.4 Assessing Significance of Risks for Accidental / Unplanned Events .......................................... 140 7.5 Assumptions and Limitations ..................................................................................................... 142
8. IMPACT ASSESSMENT .......................................................................................................... 143 8.1 Overview .................................................................................................................................... 143 8.2 Impact Assessment ................................................................................................................... 144
8.2.1 Areas of Potential Impacts from Planned Activities: .................................................. 148 8.2.2 Areas of Potential Impacts from Unplanned Events: ................................................. 148
8.3 Planned Activities: Key Environmental and Social Impacts ....................................................... 148 8.3.1 Disturbance of the Coastal Zone ............................................................................... 148 8.3.2 Disturbance to the Seabed ....................................................................................... 151 8.3.3 Changes to Seawater Quality during Installation ...................................................... 154 8.3.4 Disturbance to Marine and Coastal Fauna ................................................................ 155 8.3.5 Disturbances to Fishing and Fisheries ...................................................................... 158 8.3.6 Disturbance to Terrestrial Ecology ............................................................................ 161 8.3.7 Disturbance to Cultural Resources ........................................................................... 166 8.3.8 No-Go Alternative ..................................................................................................... 168 8.3.9 Decommissioning Phase .......................................................................................... 169
8.4 Unplanned / Accidental Events: Key Environmental and Social Impacts ................................... 169 8.4.1 Pollution and Accidental Events - Hydrocarbon Spills ............................................... 169 8.4.2 Collisions with Vessel and Entanglement with Equipment by Marine Fauna ............ 170
8.5 Cumulative Impacts ................................................................................................................... 171 8.5.1 Planned Projects and Activities in the Project Area of Influence ............................... 172 8.5.2 Identification and Screening of Potential Cumulative Impacts .................................. 172 8.5.3 Evaluation of Potential Cumulative Impacts .............................................................. 172 8.5.4 Mitigation Options for Cumulative Impacts ................................................................ 173
9. ENVIRONMENTAL MANAGEMENT PROGRAMME .............................................................. 174 9.1 Introduction ................................................................................................................................ 174 9.2 Objectives .................................................................................................................................. 174 9.3 Contents of the Environmental Management Programme ......................................................... 174 9.4 Details of Environmental Assessment Practitioner .................................................................... 176 9.5 Site and Project Description....................................................................................................... 177
9.5.1 Overview ................................................................................................................... 177 9.6 Potential Impacts ....................................................................................................................... 180
www.erm.com Project No.: 0482086 Client: ASN and Liquid Telecom Page 13
METISS FINAL EIA REPORT EXECUTIVE SUMMARY
9.7 Implementation of Environmental Management Programme ..................................................... 182 9.7.1 Roles and Responsibilities ........................................................................................ 182 9.7.2 Environmental Awareness Training .......................................................................... 184 9.7.3 Environmental Monitoring ......................................................................................... 184
9.8 Specific Management Plans ...................................................................................................... 185 9.8.1 Waste Management Plan .......................................................................................... 185 9.8.2 Traffic Management Plan .......................................................................................... 186 9.8.3 Plant Rescue and Protection Plan ............................................................................ 186 9.8.4 Re-vegetation and Habitat Rehabilitation Plan ......................................................... 187
9.9 Environmental Management Programme Commitments Register ............................................. 187 9.10 Auditing ...................................................................................................................................... 201
10. CONCLUSION .......................................................................................................................... 202 10.1 Introduction ................................................................................................................................ 202 10.2 Summary of Impacts Identified and Assessed ........................................................................... 202
10.2.1 Planned Activities ...................................................................................................... 202 10.2.2 Unplanned / Accidental Events ................................................................................. 204
10.3 Recommendations ..................................................................................................................... 205
11. REFERENCES ......................................................................................................................... 206
List of Appendices
Appendix A: Undertaking By The EAP And The Project Team CVs
Appendix B: Stakeholder Engagement Records
Appendix B1: Stakeholder Database
Appendix B2: Notification Letter
Appendix B3: Site Notices
Appendix B4: Newspaper Advertisements
Appendix B5: Authority Communication
Appendix B6: Comments Received
Appendix B7: Final Scoping Report Notifications
Appendix C: Comments and Response Report
Appendix D: Layout Plans and Maps
Appendix E: DEA Pre-Application Meeting Records
Appendix F: Specialist Reports
Appendix G: Standalone Environmental Management Programme
www.erm.com Project No.: 0482086 Client: ASN and Liquid Telecom Page 14
METISS FINAL EIA REPORT EXECUTIVE SUMMARY
List of Tables Table 0-1 Public Participation Activities ................................................................................................. iv Table 0-2 Potential Significant Impacts from Planned Activities ............................................................. 7 Table 0-3 Potential Significant Impacts from Unplanned Events ............................................................ 7 Table 1-1 Coordinates of Key Components of the Proposed Subsea Cable System ............................ 2 Table 1-2 Applicable Listed Activities ..................................................................................................... 7 Table 1-3 The EIA Team ......................................................................................................................... 9 Table 1-4 List of EIA Specialists ............................................................................................................. 9 Table 1-5 Legislated Content of an EIA Report and Corresponding Sections in this Report ............... 10 Table 2-1 Project Installation Methods .................................................................................................. 39 Table 2-2 Approximate Duration of Installation Activities ..................................................................... 40 Table 3-1 Comparison of Landing Site Location Alternatives ............................................................... 47 Table 3-2 Comparison of Activity Alternatives ...................................................................................... 53 Table 3-3 Comparison of Installation Method Alternatives (Subsea Cable) ......................................... 56 Table 3-4 Comparison of Installation Method Alternatives (Terrestrial Cable) ..................................... 56 Table 4-1 Project Specific Listed Activities ........................................................................................... 59 Table 5-1 Public Participation Activities ................................................................................................ 67 Table 5-2 Summary of Key Comments raised during the Scoping Phase ........................................... 68 Table 5-3 Summary of Key Comments raised during the EIA Phase ................................................... 69 Table 6-1 Summary of Indigenous Plant Species Recorded within the Study Area along Terrestrial Cable Route 2 ....................................................................................................................................... 82 Table 6-2 Invasive Alien Plants Recorded within the Study Area along Terrestrial Cable Route 2 ..... 84 Table 6-3 Summary of the Vegetation Structure along Sections of Terrestrial Cable Route 2 from the Point of Termination of the Subsea Cable. ........................................................................................... 85 Table 6-4 Ecosystem Threat Status for Marine and Coastal Habitat Types in the Project Area of Influence ................................................................................................................................................ 98 Table 6-5 Important Linefish Species Landed by Commercial and Recreational Boat Fishers along the East Coast ........................................................................................................................................... 106 Table 6-6 Education Profile ................................................................................................................. 115 Table 6-7 Present and Projected HIV/AIDS Infections in the eThekwini Municipality ........................ 115 Table 6-8 Basic Services Backlog in the eThekwini Municipality ....................................................... 115 Table 6-9 Total Catch (t) and Number of Active Domestic and Foreign-Flagged Vessels Targeting Large Pelagic Species for the period 2005 to 2014 ............................................................................ 121 Table 6-10 Annual catch of linefish species (t) from 2002 to 2016 (DAFF, 2018) .............................. 124 Table 6-11 Annual Total Allowable Effort (TAE) and Activated Effort per Linefish Management Zone from 2006 to 2012 (DAFF, 2016) ........................................................................................................ 125 Table 6-12 Annual Total Annual catch of the KZN prawn trawl fishery (t) (Source: DAFF, 2016) ..... 128 Table 7-1 Impact Characteristics ........................................................................................................ 135 Table 7-2 Biological and Species Value / Sensitivity Criteria ............................................................. 137 Table 7-3 Socio-Economic Sensitivity Criteria .................................................................................... 137 Table 7-4 Accidental Events Risk Significance ................................................................................... 141 Table 8-1 Potential Impacts and Risks to Various Resources and Receptors by Project Phase ....... 144 Table 8-2 Scoping Out of Non-Significant Issues ............................................................................... 146 Table 8-3 Impact of Trenching and Installation on Biota in Nearshore Sandy Beach ........................ 150 Table 8-4 Impacts of Trenching and Installation on Biota in Nearshore Unconsolidated Sediments . 151 Table 8-5 Impacts of Subsea Cable Laying on Biota in the Offshore Seabed ................................... 153 Table 8-6 Impacts on Seabed Biological Characteristics from Physical Presence of Subsea Cable. 154 Table 8-7 Impact of Trenching and Installation Activities on Seawater Quality .................................. 155 Table 8-8 Comparison of noise sources in the ocean ........................................................................ 156 Table 8-9 Impact of Noise Associated with Installation Activities on Nearshore Marine Fauna ......... 157 Table 8-10 Impact of Noise Associated with Installation Activities on Offshore Marine Fauna (Behavioural Changes and Masking of Sound) .................................................................................. 158 Table 8-11 Impact of Installation on Fishing Sectors .......................................................................... 159 Table 8-12 Impact of Operations on Fishing ....................................................................................... 161
www.erm.com Project No.: 0482086 Client: ASN and Liquid Telecom Page 15
METISS FINAL EIA REPORT EXECUTIVE SUMMARY
Table 8-13 Impacts of Installation on Terrestrial Habitats .................................................................. 163 Table 8-14 Impacts of Installation on Flora and Fauna ...................................................................... 165 Table 8-15 Impacts of Installation on Spread of IAPs ......................................................................... 165 Table 8-16 Impacts of Installation on Archaeological Resources ....................................................... 166 Table 8-17 Impacts of Installation on Historical Shipwrecks ............................................................... 168 Table 8-18 Impacts of the No-Go Alternative ...................................................................................... 168 Table 8-19 Significance of Water/ Sediment Contamination and/ or Disturbance to Intertidal and Subtidal Biota ...................................................................................................................................... 170 Table 8-20 Collisions with and Entanglement by Marine Fauna ......................................................... 171 Table 8-21 Identification of Developments in the Project Area of Influence that may Contribute to a Cumulative Impact .............................................................................................................................. 172 Table 9-1 Contents of an Environmental Management Programme .................................................. 175 Table 9-2 The EIA Team ..................................................................................................................... 176 Table 9-3 List of EIA Specialists ......................................................................................................... 177 Table 9-4 Potential Significant Impacts from Planned Activities ......................................................... 181 Table 9-5 Potential Significant Impacts from Unplanned Events ........................................................ 181 Table 9-6 EMPr Commitments Register ............................................................................................. 188 Table 10-1 Summary of Impacts Identified from the Project Activities ............................................... 204 Table 10-2 Summary of Potential Risks or Unplanned / Accidental Events and their Significance Ratings ................................................................................................................................................ 204
List of Figures Figure 0-1 Map of the Proposed METISS Subsea Cable System Route ............................................... 2 Figure 1-1 Map of the Proposed METISS Subsea Cable Route ............................................................ 3 Figure 1-2 Map of the Proposed METISS Subsea Cable System Route ............................................... 4 Figure 1-3 Map of the Terrestrial Cable Route ....................................................................................... 5 Figure 2-1 Proposed ASN OALC-5 Cable Types.................................................................................. 15 Figure 2-2 Amanzimtoti Pipeline Beach from BMH looking towards the Landing Point ....................... 16 Figure 2-3 Proposed Beach Manhole Location at Amanzimtoti Pipeline Beach .................................. 17 Figure 2-4 Typical Beach Manhole Layout ........................................................................................... 18 Figure 2-5 Schematic of Beach Plate Design ....................................................................................... 19 Figure 2-6 Typical Rod Type System Earth Array ................................................................................ 19 Figure 2-7 Proposed Beach Earth Plate Location ................................................................................ 20 Figure 2-8 Proposed Earth Rods Location ............................................................................................ 20 Figure 2-9 Terrestrial Cable Route 2 – Part 1 ....................................................................................... 22 Figure 2-10 Terrestrial Cable Route 2 – Part 2 ..................................................................................... 23 Figure 2-11 Terrestrial Cable Route 2 – Part 3 ..................................................................................... 24 Figure 2-12 Terrestrial Cable Route 2 – Part 4 ..................................................................................... 25 Figure 2-13 Terrestrial Cable Route 2 – Part 5 ..................................................................................... 26 Figure 2-14 Terrestrial Cable Route 2 – Part 6 ..................................................................................... 27 Figure 2-15 Proposed Location of One of the Splice Manholes ........................................................... 28 Figure 2-16 PLGR Grapnel Gear .......................................................................................................... 30 Figure 2-17 Terrestrial Cable Route Alternative 1 ................................................................................ 31 Figure 2-18 Terrestrial Cable Route Alternative 2 (Preferred) .............................................................. 32 Figure 2-19 Elettra – Taurus 2 SMD Plough System ............................................................................ 33 Figure 2-20 Animation of Cable Burial Plough on Seabed ................................................................... 34 Figure 2-21 Elettra – ROV Phoenix II ................................................................................................... 34 Figure 2-22 Example of Installation of the Subsea Cable in the Nearshore ......................................... 35 Figure 2-23 Proposed Burial Jet ........................................................................................................... 36 Figure 2-24 Example of Articulated Pipe .............................................................................................. 36 Figure 2-25 Example of Subsea Cable Installation by Trenching ......................................................... 38 Figure 2-26 Waste Hierarchy ................................................................................................................ 41 Figure 3-1 Landing Site Location Alternatives ...................................................................................... 45
www.erm.com Project No.: 0482086 Client: ASN and Liquid Telecom Page 16
METISS FINAL EIA REPORT EXECUTIVE SUMMARY
Figure 3-2 Section of the Terrestrial Cable Route 1 ............................................................................. 48 Figure 3-3 Section of the Terrestrial Cable Route 2 (Preferred, as presented in the Scoping Report) 50 Figure 3-4 Section of the Terrestrial Cable Route 2 (Preferred, Modified) ........................................... 51 Figure 3-5 Section of the Terrestrial Cable Route 2 (Preferred) ........................................................... 51 Figure 6-1 Average Midday Temperature (˚C) for Amanzimtoti ............................................................ 71 Figure 6-2 Average Night-time Temperature (˚C) for Amanzimtoti ....................................................... 71 Figure 6-3 Map of the Terrestrial Ecology Study Area Illustrating the Terrestrial Cable Route 1 and the Preferred Terrestrial Cable Route 2 ...................................................................................................... 73 Figure 6-4 Vegetation Types and their Conservation Status occurring within the Terrestrial Ecology Study Area............................................................................................................................................. 75 Figure 6-5 Nationally Threatened and Protected Ecosystems within the Study Area (after SANBI and DEAT, 2009) ......................................................................................................................................... 78 Figure 6-6 Provincially Important Conservation Areas occurring within the Study Area (after EKZNW, 2016) ..................................................................................................................................................... 80 Figure 6-7 Important Conservation Areas for the eThekwini Municipality on occurring within the Study Area (after D'MOSS, 2011) ................................................................................................................... 81 Figure 6-8 Predominance of the Agulhas Current in the Oceanography of the Subsea Cable Route (blue line)............................................................................................................................................... 90 Figure 6-9 VOS Wind Speed vs Wind Direction for Richards Bay Breakwater (28.8°S and 32.1° E) (left) and Port Shepstone (30.0° to 30.9° S and 31.0° to 31.9° E) (1960-02-15 to 2012-04-13; 7,369 records) (right) ....................................................................................................................................... 92 Figure 6-10 VOS Wave Height (Hmo) vs Wave Direction for a Deepwater Location Offshore of Richards Bay (29.0°S and 32.5° E) (left) and for Port Shepstone (30.0° to 30.9° S and 31.0° to 31.9° E) (1960-02-15 to 2012-04-13; 4,515 records) (right) ........................................................................... 93 Figure 6-11 South Africa Inshore and Offshore Bioregions in Relation to the Subsea Cable Route (red line) ........................................................................................................................................................ 95 Figure 6-12 Ecosystem Threat Status for Coastal and Offshore Benthic Habitat Types on the South African East Coast in Relation to the Subsea Cable Route (red line) ................................................. 96 Figure 6-13 Benthic and Coastal Habitat Types on the Continental Shelf of the Subsea Cable Route (red line) ................................................................................................................................................ 97 Figure 6-14 Phytoplankton and Zooplankton associated with Upwelling Cells on the Thukela Bank .. 99 Figure 6-15 Major Fish Spawning, Nursery and Recruitment Areas along the KwaZulu-Natal Coast in Relation to the Subsea Cable Route (red line) ................................................................................... 100 Figure 6-16 Reefs in KwaZulu-Natal Inshore of Approximately 200 m Depth in Relation to the Subsea Cable Route (red line) ......................................................................................................................... 102 Figure 6-17 Reefs in KwaZulu-Natal are Characterized by Diverse Fish Fauna ................................ 102 Figure 6-18 Great White Shark (left) and Whale Shark (right) ............................................................ 103 Figure 6-19 Long-distance Return Migrations of Two Tracked Great White Sharks along the South African Coast in relation to the Subsea Cable Route (red line) .......................................................... 104 Figure 6-20 Leatherback (left) and Loggerhead Turtles (right) Occur along the East Coast of South Africa ................................................................................................................................................... 107 Figure 6-21 Home and Core Ranges of Loggerheads and Leatherbacks during Inter-Nesting Relative to the Subsea Cable Route (red line) .................................................................................................. 109 Figure 6-22 Marine Protected Area (MPAs) within the Exclusive Economic Zone (grey shading) off the KZN Coast in Relation to the Subsea Cable Route (red) line) ............................................................ 111 Figure 6-23 Population Composition within the eThekwini Metropolitan Municipality ........................ 113 Figure 6-24 Sectoral Composition in the eThekwini Municipality ....................................................... 114 Figure 6-25 Subsea Cables in Africa .................................................................................................. 117 Figure 6-26 Subsea Cables around the World.................................................................................... 118 Figure 6-27 Percentage of Landings by Weight (left) and Wholesale Value (right) of each Commercial Fishery Sector as a Contribution to the Total Landings and Value for all Commercial Fisheries Sectors Combined (2016) ................................................................................................................................ 120 Figure 6-28 Inter-Annual Variation of Catch Landed and Effort Expended by the Large Pelagic Longline Sector over the Period 2000 to 2014.................................................................................... 121
www.erm.com Project No.: 0482086 Client: ASN and Liquid Telecom Page 17
METISS FINAL EIA REPORT EXECUTIVE SUMMARY
Figure 6-29 Spatial Distribution of National Fishing Effort Expended by the Longline Sector Targeting Large Pelagic Species in Relation to the Subsea Cable Route .......................................................... 122 Figure 6-30 Photograph of a Typical Large-Scale Tuna Longline Vessel .......................................... 123 Figure 6-31 Typical Configuration of Surface Longline Gear Targeting Tuna, Swordfish and Shark Species ................................................................................................................................................ 123 Figure 6-32 Photographs Showing Marker Buoys (left), Radio Buoys (centre) and Monofilament Branch Lines (right) ............................................................................................................................. 123 Figure 6-33 Spatial Distribution of Fishing Effort Expended by the Traditional Linefish Sector in Relation to the Subsea Cable Route ................................................................................................... 125 Figure 6-34 Spatial Distribution of Fishing Effort Expended by the Crustacean Trawl Sector in Relation to the Subsea Cable Route ................................................................................................................. 126 Figure 6-35 Photograph of a Typical Crustacean Trawl Vessel ......................................................... 127 Figure 6-36 Annual Catch and Effort for the Deep-Water Trawl Fishery (1990 to 2012) ................... 128 Figure 6-37 Monthly Catch and Effort for the Deep-Water Trawl Fishery (1990 to 2012 ................... 129 Figure 6-38 Known and Recorded Wrecks in the Subsea Cable Route Maritime Archaeological Study Area within 24 Nautical Miles of the Coastline .................................................................................... 132 Figure 7-1 Impact Significance............................................................................................................ 138 Figure 8-1Subsea Cables around Africa ............................................................................................. 143 Figure 8-2 Areas of Conservation within the Terrestrial Ecology Study Area ..................................... 162 Figure 9-1 Map of the METISS Subsea Cable System Layout ........................................................... 178 Figure 9-2 Study Area Map Illustrating the Terrestrial Cable Route 1 (TCR 1) and the Preferred Terrestrial Cable Route (TCR 2) ......................................................................................................... 179 Figure 9-3 Provincially Important Conservation Areas occurring within the Terrestrial Ecology Study Area (after EKZNW, 2016) .................................................................................................................. 180 Figure 9-4 Waste Hierarchy ................................................................................................................ 186
www.erm.com Project No.: 0482086 Client: ASN and Liquid Telecom Page 18
METISS FINAL EIA REPORT EXECUTIVE SUMMARY
Acronyms and Abbreviations Name Description ALARP As Low as Reasonably Possible AoI Area of Influence ASN Alcatel Submarine Networks BMH Beach Manhole BU Branching Unit CA Competent Authority CBA Critical Biodiversity Area CBD Convention on Biological Diversity CITES Convention on International Trade in Endangered Species CLS Cable Landing Station cm Centimetre CMS Convention on Migratory Species CPT Cone Penetrometer Tests CPUE Catch Per Unit Effort CR Critically Endangered CRR Comments and Responses Report CV Curriculum Vitae DAR Double Armour DAFF Department of Agriculture, Forestry and Fisheries DEA National Department of Environmental Affairs DEAT Department of Environmental Affairs and Tourism EA Environmental Authorisation EAP Environmental Assessment Practitioner EBSA Ecologically or Biologically Significant Areas EEZ Exclusive Economic Zone EIA Environmental Impact Assessment EKZNW Ezemvelo KwaZulu-Natal Wildlife EMPr Environmental Management Programme EN Endangered ERM Environmental Resources Management ESA Ecologically Sensitive Areas EWS EThekwini Municipality Water and Sanitation GDP Gross Domestic Product GHG Greenhouse Gas GNR Government Notice Regulations GSLWP Greater St Lucia Wetland Park Ha Hectares HDD Horizontal Directional Drilling HDPE High Density Polyethylene HIA Heritage Impact Assessment HWM High Water Mark I&AP Interested and Affected Party ICCAT International Commission for the Conservation of Atlantic Tunas ICPC International Cable Protection Committee ICT Information and Communications Technology
www.erm.com Project No.: 0482086 Client: ASN and Liquid Telecom Page 19
METISS FINAL EIA REPORT EXECUTIVE SUMMARY
IDP Integrated Development Plan IDZ Industrial Development Zone IOS International Organization for Standardization IOTC Indian Ocean Tuna Commission ITU International Telecommunications Union IUCN International Union for the Conservation of Nature Km Kilometre KZN KwaZulu Natal LT Liquid Telecom LW Lightweight LWM Low Water Mark LWP Lightweight Protected m Meter MBES Multibeam Echosounder MLRA Marine Living Resources Act MPA Marine Protected Areas NEMA National Environmental Management Act (Act No. 107 of 1998, as amended) NEMBA National Environmental Management: Biodiversity Act NEMICMA National Environmental Management: Integrated Coastal Management Act NHRA National Heritage Resources Act nm Nautical miles OSP Outside Plant PASA Petroleum Agency of South Africa PF Power Feed PGS Petroleum Geo Services PLB Post-Lay Burial PLIB Post-Lay Inspection and Burial PLGR Pre-Lay Grapnel Run PPP Public Participation RA Rock Armour ROV Remotely Operated Vehicle SAHRA South African Heritage Resources Agency SAMSA South African Maritime Safety Authority SANBI South African National Biodiversity Institute SAR Single Armour SMH Splicing Manhole TAE Total Allowable Effort TBps Terabytes Per Second TCR Terrestrial Cable Route UNFCCC United Nations Framework Convention on Climate Change WMP Waste Management Plan WWTW Wastewater Treatment Works
www.erm.com Project No.: 0482086 Client: ASN and Liquid Telecom Page 1
METISS FINAL EIA REPORT INTRODUCTION
1. INTRODUCTION
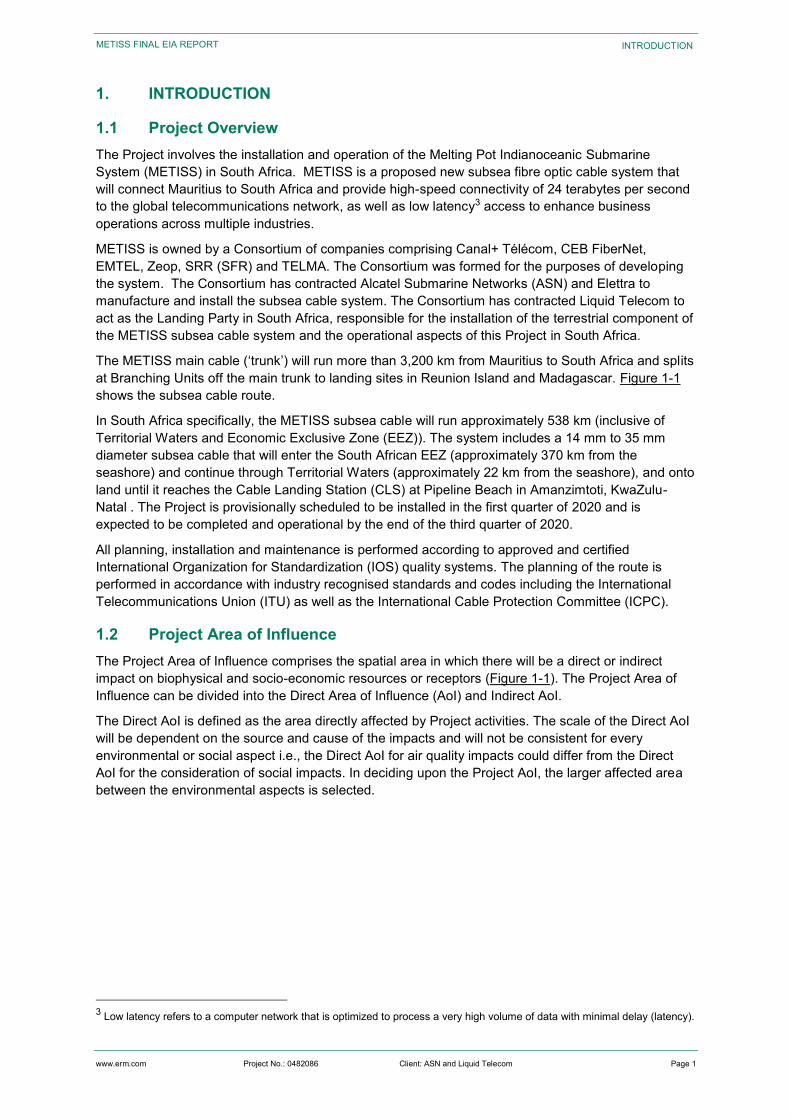
1.1 Project Overview The Project involves the installation and operation of the Melting Pot Indianoceanic Submarine System (METISS) in South Africa. METISS is a proposed new subsea fibre optic cable system that will connect Mauritius to South Africa and provide high-speed connectivity of 24 terabytes per second to the global telecommunications network, as well as low latency3 access to enhance business operations across multiple industries.
METISS is owned by a Consortium of companies comprising Canal+ Télécom, CEB FiberNet, EMTEL, Zeop, SRR (SFR) and TELMA. The Consortium was formed for the purposes of developing the system. The Consortium has contracted Alcatel Submarine Networks (ASN) and Elettra to manufacture and install the subsea cable system. The Consortium has contracted Liquid Telecom to act as the Landing Party in South Africa, responsible for the installation of the terrestrial component of the METISS subsea cable system and the operational aspects of this Project in South Africa.
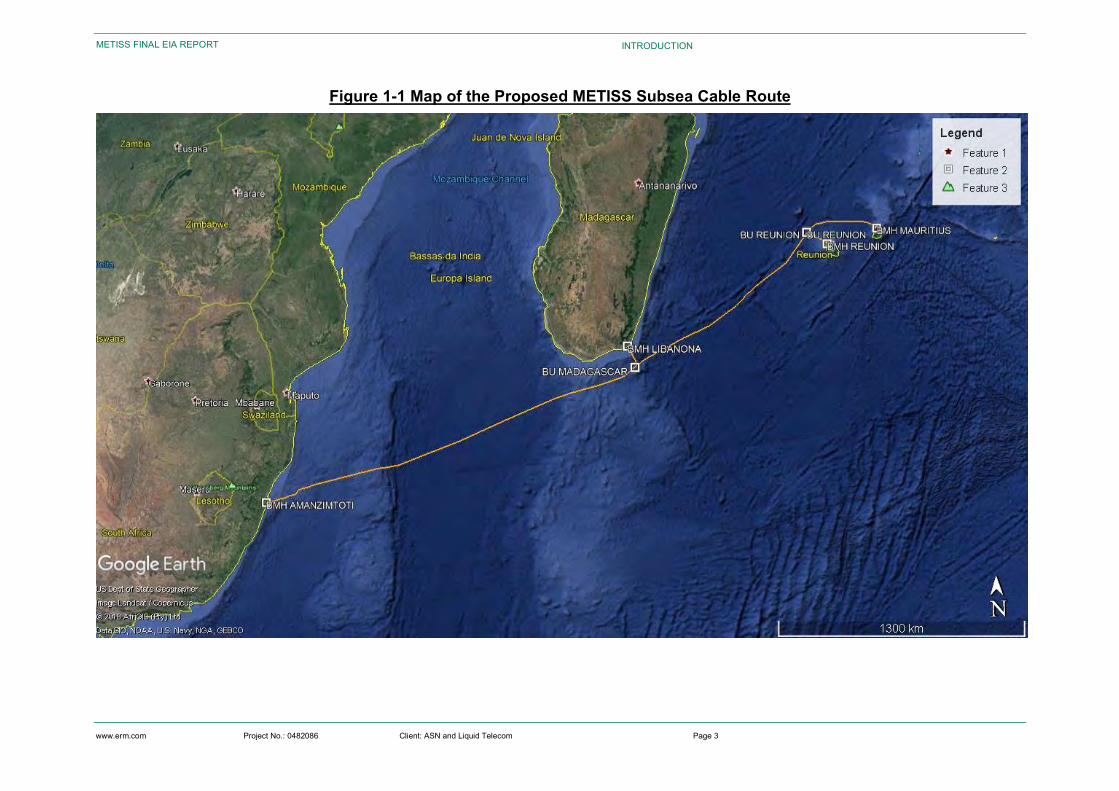
The METISS main cable (‘trunk’) will run more than 3,200 km from Mauritius to South Africa and splits at Branching Units off the main trunk to landing sites in Reunion Island and Madagascar. Figure 1-1 shows the subsea cable route.
In South Africa specifically, the METISS subsea cable will run approximately 538 km (inclusive of Territorial Waters and Economic Exclusive Zone (EEZ)). The system includes a 14 mm to 35 mm diameter subsea cable that will enter the South African EEZ (approximately 370 km from the seashore) and continue through Territorial Waters (approximately 22 km from the seashore), and onto land until it reaches the Cable Landing Station (CLS) at Pipeline Beach in Amanzimtoti, KwaZulu-Natal . The Project is provisionally scheduled to be installed in the first quarter of 2020 and is expected to be completed and operational by the end of the third quarter of 2020.
All planning, installation and maintenance is performed according to approved and certified International Organization for Standardization (IOS) quality systems. The planning of the route is performed in accordance with industry recognised standards and codes including the International Telecommunications Union (ITU) as well as the International Cable Protection Committee (ICPC).
1.2 Project Area of Influence The Project Area of Influence comprises the spatial area in which there will be a direct or indirect impact on biophysical and socio-economic resources or receptors (Figure 1-1). The Project Area of Influence can be divided into the Direct Area of Influence (AoI) and Indirect AoI.
The Direct AoI is defined as the area directly affected by Project activities. The scale of the Direct AoI will be dependent on the source and cause of the impacts and will not be consistent for every environmental or social aspect i.e., the Direct AoI for air quality impacts could differ from the Direct AoI for the consideration of social impacts. In deciding upon the Project AoI, the larger affected area between the environmental aspects is selected.
3 Low latency refers to a computer network that is optimized to process a very high volume of data with minimal delay (latency).
www.erm.com Project No.: 0482086 Client: ASN and Liquid Telecom Page 2
METISS FINAL EIA REPORT INTRODUCTION
The Direct AoI is the spatial extent of the Project footprint4 as well as the area within which there is a Project impact which in the case of this Project encompasses:
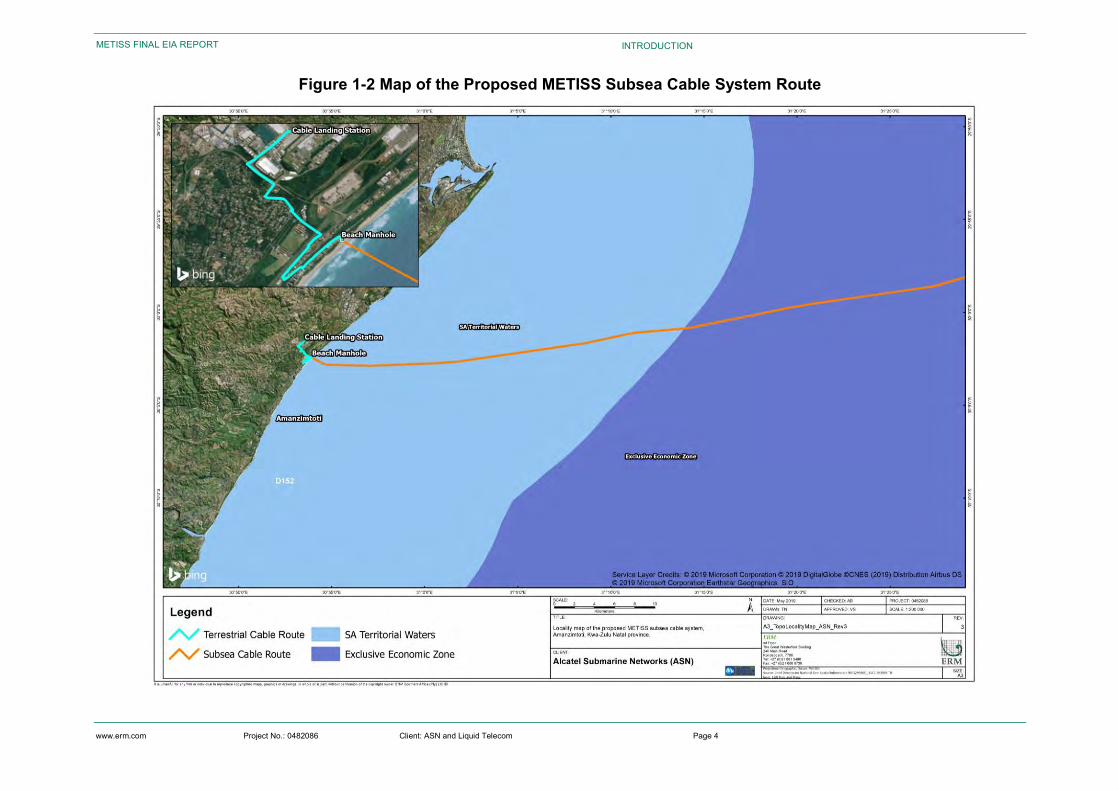
Subsea cable footprint in the Republic of South African Exclusive Economic Zone and Territorial Waters (Figure 1-2); and
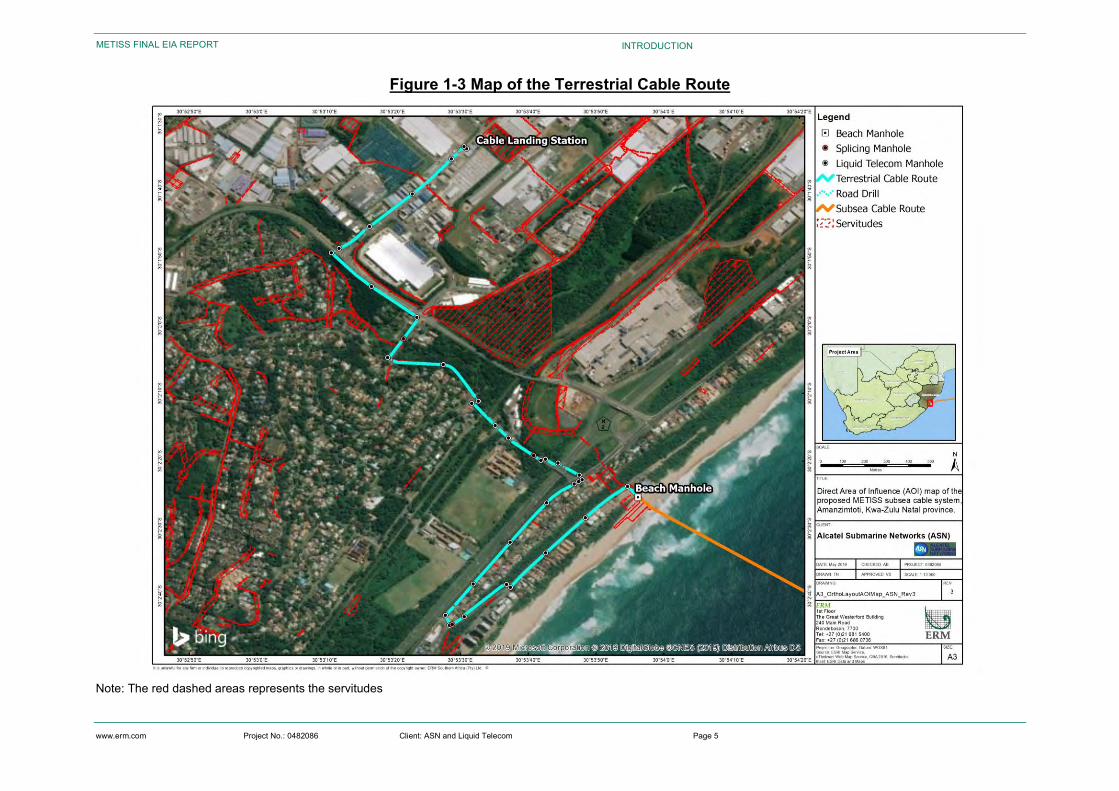
The coastal area along the beach at the landing site and the footprint of the terrestrial cable route (Figure 1-3).
The Indirect AoI encompasses areas potentially affected by secondary effects of direct impacts, cumulative impacts, as well as those induced impacts resulting from activities beyond the control of the Project.
The coordinates of the main system components are summarised in Table 1-1 below.
Table 1-1 Coordinates of Key Components of the Proposed Subsea Cable System
Subsea Cable System Component Latitude Longitude Enter Point SA Territorial Waters 30° 0' 51.550” S 31° 13' 55.130” E Landing Site 30° 2’ 27.030” S 30° 53’ 58.400” E Beach Manhole 30° 2' 24.900" S 30° 53' 55.700” E Splice Manhole 1 30° 2' 44,170" S 30° 53' 28,779" E Splice Manhole 2 30° 2' 19,693" S 30° 53' 41,435" E Splice Manhole 3 30° 2' 01,835" S 30° 53' 21,555" E Cable Landing Station 30° 1' 33,780" S 30° 53' 30,911" E
4 The physical footprint includes the cable and other system components as well as an approximately 1 m area on each side of the cable where installation activities may cause disturbance.
www.erm.com Project No.: 0482086 Client: ASN and Liquid Telecom Page 3
METISS FINAL EIA REPORT INTRODUCTION
Figure 1-1 Map of the Proposed METISS Subsea Cable Route
www.erm.com Project No.: 0482086 Client: ASN and Liquid Telecom Page 4
METISS FINAL EIA REPORT INTRODUCTION
Figure 1-2 Map of the Proposed METISS Subsea Cable System Route
www.erm.com Project No.: 0482086 Client: ASN and Liquid Telecom Page 5
METISS FINAL EIA REPORT INTRODUCTION
Figure 1-3 Map of the Terrestrial Cable Route
Note: The red dashed areas represents the servitudes
www.erm.com Project No.: 0482086 Client: ASN and Liquid Telecom Page 6
METISS FINAL EIA REPORT INTRODUCTION
1.3 Background Historically international telecommunications traffic was carried by radio, satellite or analogue cable systems. With the introduction of fibre optic cables and the increased quality and capacity they provide, telecommunication companies have switched to this as a primary means of connectivity. Fibre optic subsea cables now carry up to 95 percent of international voice and data traffic (ICPC website).
Currently the SEACOM, EASSy and SAFE systems land on the East Coast of South Africa. The SEACOM and the EASSy systems serve countries along the Indian Ocean in East Africa and North Africa, whereas the SAFE system extends from South Africa to the Far East via Mauritius and Reunion. The SAFE system is close to the end of its design lifespan, furthermore its capacity is limited for current growth requirements, resulting in high costs and limited data transmission, particularly when maintenance activities are required. In addition, the IOX Subsea Cable System (currently under application) is another subsea cable system proposed to land on the East Coast of South Africa from India. Thus, the purpose of this Project is to provide high speed and low latency network access to enhance businesses in South Africa and across industries through direct connectivity to the Mauritius market.
1.4 Purpose of this Report Environmental Resources Management (ERM) was appointed to conduct the Environmental Impact Assessment (EIA) for the Project in terms of the National Environmental Management Act (NEMA) (Act No. 107 of 1998, as amended) for Environmental Authorisation (EA). This Final EIA Report has been compiled in accordance with the regulatory requirements stipulated in the 2014 EIA Regulations GN R.326 (April 2014, as amended), promulgated in terms of Section 24(5) of NEMA (the 2014 EIA Regulations).
The EIA process involves three phases, namely:
Scoping;
Specialist Studies; and
Impact Assessment.
Scoping was initiated by the submission of the Environmental Authorisation Application to the Competent Authority (CA) namely the National Department of Environmental Affairs (DEA). At the same time, the Draft Scoping Report was disclosed to the public for comment. The Final Scoping Report was submitted to the DEA on 12 March 2019. ERM received a letter of acceptance of the Final Scoping Report (Ref: 14/12/16/3/3/2/111/) on 11 April 2019 (Appendix B). This Final EIA Report documents the findings of the Specialist Study and Impact Assessment Phases.
The purpose of this report is to present the following:
A detailed description of the proposed Project and Project alternatives;
The EIA process and a legal review of legislation and guidelines pertinent to the Project and associated EIA Report;
The outcomes associated with stakeholder engagement activities carried out to date;
A detailed baseline review of the physical, biological and socio-economic characteristics of the study area;
An assessment of impacts to the physical, biological and socio-economic environments related with the different phases (construction, operational and decommissioning phases) of the Project;
Mitigation measures that aim to avoid /minimise/manage the severity of identified impacts; and
An assessment of cumulative impacts associated with Project-related developments in the study area.
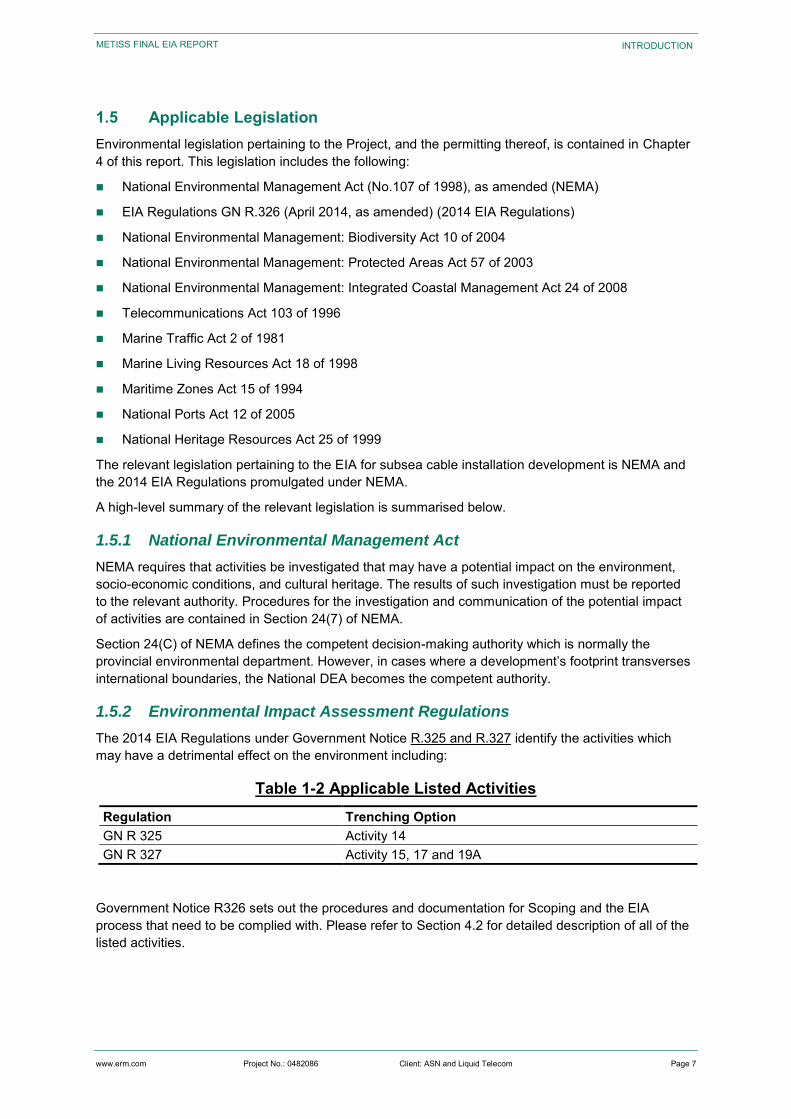
www.erm.com Project No.: 0482086 Client: ASN and Liquid Telecom Page 7
METISS FINAL EIA REPORT INTRODUCTION
1.5 Applicable Legislation Environmental legislation pertaining to the Project, and the permitting thereof, is contained in Chapter 4 of this report. This legislation includes the following:
National Environmental Management Act (No.107 of 1998), as amended (NEMA)
EIA Regulations GN R.326 (April 2014, as amended) (2014 EIA Regulations)
National Environmental Management: Biodiversity Act 10 of 2004
National Environmental Management: Protected Areas Act 57 of 2003
National Environmental Management: Integrated Coastal Management Act 24 of 2008
Telecommunications Act 103 of 1996
Marine Traffic Act 2 of 1981
Marine Living Resources Act 18 of 1998
Maritime Zones Act 15 of 1994
National Ports Act 12 of 2005
National Heritage Resources Act 25 of 1999
The relevant legislation pertaining to the EIA for subsea cable installation development is NEMA and the 2014 EIA Regulations promulgated under NEMA.
A high-level summary of the relevant legislation is summarised below.
1.5.1 National Environmental Management Act
NEMA requires that activities be investigated that may have a potential impact on the environment, socio-economic conditions, and cultural heritage. The results of such investigation must be reported to the relevant authority. Procedures for the investigation and communication of the potential impact of activities are contained in Section 24(7) of NEMA.
Section 24(C) of NEMA defines the competent decision-making authority which is normally the provincial environmental department. However, in cases where a development’s footprint transverses international boundaries, the National DEA becomes the competent authority.
1.5.2 Environmental Impact Assessment Regulations
The 2014 EIA Regulations under Government Notice R.325 and R.327 identify the activities which may have a detrimental effect on the environment including:
Table 1-2 Applicable Listed Activities Regulation Trenching Option GN R 325 Activity 14 GN R 327 Activity 15, 17 and 19A
Government Notice R326 sets out the procedures and documentation for Scoping and the EIA process that need to be complied with. Please refer to Section 4.2 for detailed description of all of the listed activities.
www.erm.com Project No.: 0482086 Client: ASN and Liquid Telecom Page 8
METISS FINAL EIA REPORT INTRODUCTION
1.6 Project Proponent Liquid Telecom is the Project Proponent and Applicant for the purposes of the Environmental Authorisation in South Africa. The contact details for the Proponent are presented below:
Box 1.1 Applicant Contact Details Liquid Telecom
Contact: Mervin Chetty
Telephone: +27 11 5851827
Email: [email protected]
Postal Address: 41 Old Pretoria Main Road Halfway House Midrand 1685
1.7 Competent Authority The Competent Authority (CA) in terms of the Environmental Impact Assessment (EIA) Regulations is the DEA. The contact details for the assigned case officer for the DEA are as follows:
Box 1.2 Component Authority Contact Details Department of Environmental Affairs
Contact: Thando Booi
Telephone: +27 12 399 9387
Email: [email protected]
1.8 EIA Consultant The requirement for environmental consultants to act independently and objectively is an established principle in South African law. The 2014 EIA Regulations under GN R.326 specifically state:
“…an EAP (environmental assessment practitioner) (must have) no business, financial, personal or other interest in the activity, application or appeal in respect of which that EAP is appointed in terms of these Regulations other than fair remuneration for work performed in connection with that activity; or that there are no circumstances that may compromise the objectivity of that EAP in performing such work.”
The role of the environmental consultants is to provide credible, objective and accessible information to government and other stakeholders, so that an informed decision can be made about whether a proposed development should proceed or not.
ERM is a privately-owned company registered to conduct business in South Africa. ERM has no financial ties to, nor is ERM a subsidiary, legally or financially, of Liquid Telecoms, the Project owners, ASN, or Elettra. Remuneration for the services to ERM is not linked to an approval by the decision-making authority. Furthermore, ERM has no secondary interest in the development.
The ERM team selected for this Project possess the relevant expertise and experience to undertake this EIA Report. As such, ERM has signed the legally required declaration of independence to function as an objective Environmental Assessment Practitioner (EAP).
The CVs and details of the Independent Environmental Practitioner are presented in Appendix A. The contact details of the EAP for the application are presented in Box 1.3 below.
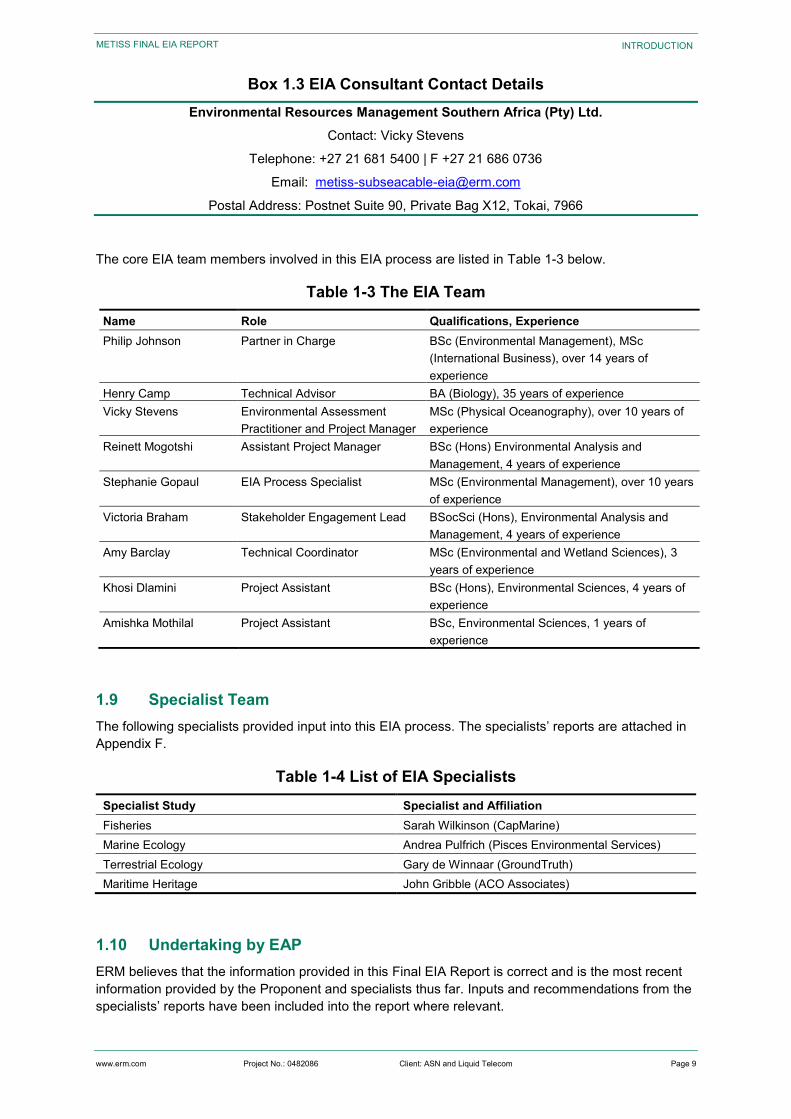
www.erm.com Project No.: 0482086 Client: ASN and Liquid Telecom Page 9
METISS FINAL EIA REPORT INTRODUCTION
Box 1.3 EIA Consultant Contact Details Environmental Resources Management Southern Africa (Pty) Ltd.
Contact: Vicky Stevens
Telephone: +27 21 681 5400 | F +27 21 686 0736
Email: [email protected]
Postal Address: Postnet Suite 90, Private Bag X12, Tokai, 7966
The core EIA team members involved in this EIA process are listed in Table 1-3 below.
Table 1-3 The EIA Team Name Role Qualifications, Experience Philip Johnson Partner in Charge BSc (Environmental Management), MSc
(International Business), over 14 years of experience
Henry Camp Technical Advisor BA (Biology), 35 years of experience Vicky Stevens Environmental Assessment
Practitioner and Project Manager MSc (Physical Oceanography), over 10 years of experience
Reinett Mogotshi Assistant Project Manager BSc (Hons) Environmental Analysis and Management, 4 years of experience
Stephanie Gopaul EIA Process Specialist MSc (Environmental Management), over 10 years of experience
Victoria Braham Stakeholder Engagement Lead BSocSci (Hons), Environmental Analysis and Management, 4 years of experience
Amy Barclay Technical Coordinator MSc (Environmental and Wetland Sciences), 3 years of experience
Khosi Dlamini Project Assistant BSc (Hons), Environmental Sciences, 4 years of experience
Amishka Mothilal Project Assistant BSc, Environmental Sciences, 1 years of experience
1.9 Specialist Team The following specialists provided input into this EIA process. The specialists’ reports are attached in Appendix F.
Table 1-4 List of EIA Specialists Specialist Study Specialist and Affiliation Fisheries Sarah Wilkinson (CapMarine) Marine Ecology Andrea Pulfrich (Pisces Environmental Services) Terrestrial Ecology Gary de Winnaar (GroundTruth) Maritime Heritage John Gribble (ACO Associates)
1.10 Undertaking by EAP ERM believes that the information provided in this Final EIA Report is correct and is the most recent information provided by the Proponent and specialists thus far. Inputs and recommendations from the specialists’ reports have been included into the report where relevant.
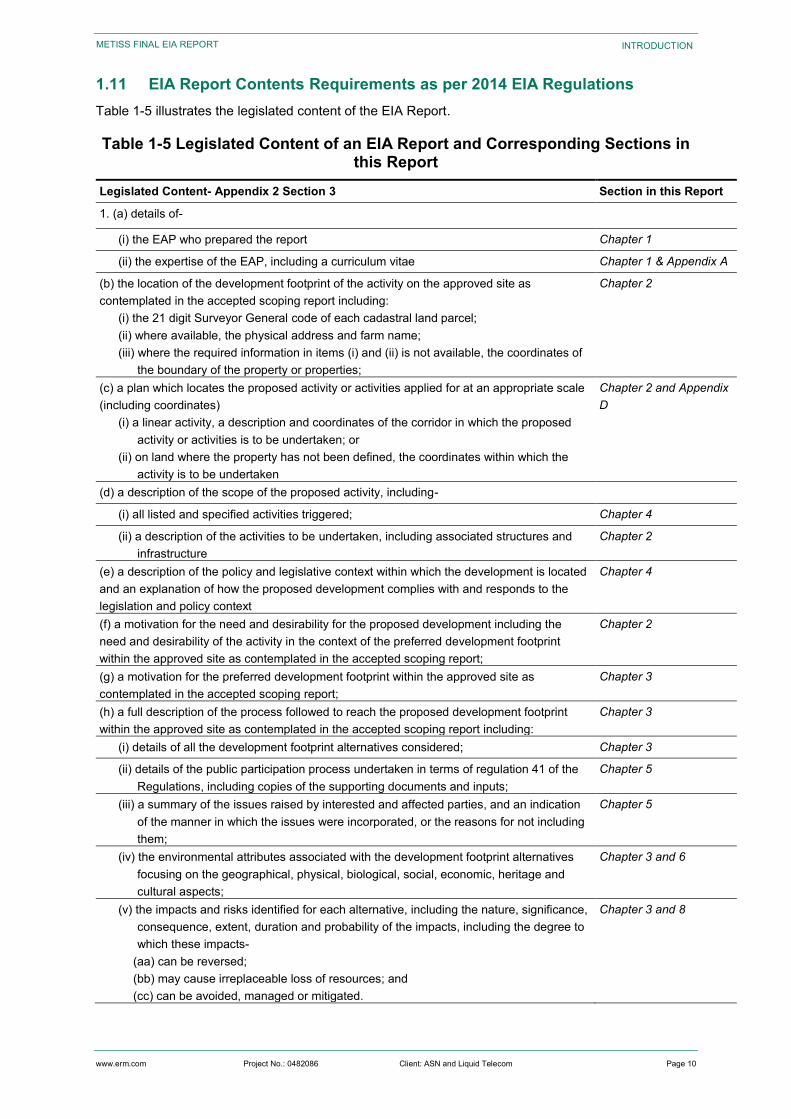
www.erm.com Project No.: 0482086 Client: ASN and Liquid Telecom Page 10
METISS FINAL EIA REPORT INTRODUCTION
1.11 EIA Report Contents Requirements as per 2014 EIA Regulations Table 1-5 illustrates the legislated content of the EIA Report.
Table 1-5 Legislated Content of an EIA Report and Corresponding Sections in this Report
Legislated Content- Appendix 2 Section 3 Section in this Report
1. (a) details of-
(i) the EAP who prepared the report Chapter 1
(ii) the expertise of the EAP, including a curriculum vitae Chapter 1 & Appendix A
(b) the location of the development footprint of the activity on the approved site as contemplated in the accepted scoping report including:
(i) the 21 digit Surveyor General code of each cadastral land parcel; (ii) where available, the physical address and farm name; (iii) where the required information in items (i) and (ii) is not available, the coordinates of
the boundary of the property or properties;
Chapter 2
(c) a plan which locates the proposed activity or activities applied for at an appropriate scale (including coordinates)
(i) a linear activity, a description and coordinates of the corridor in which the proposed activity or activities is to be undertaken; or
(ii) on land where the property has not been defined, the coordinates within which the activity is to be undertaken
Chapter 2 and Appendix D
(d) a description of the scope of the proposed activity, including-
(i) all listed and specified activities triggered; Chapter 4
(ii) a description of the activities to be undertaken, including associated structures and infrastructure
Chapter 2
(e) a description of the policy and legislative context within which the development is located and an explanation of how the proposed development complies with and responds to the legislation and policy context
Chapter 4
(f) a motivation for the need and desirability for the proposed development including the need and desirability of the activity in the context of the preferred development footprint within the approved site as contemplated in the accepted scoping report;
Chapter 2
(g) a motivation for the preferred development footprint within the approved site as contemplated in the accepted scoping report;
Chapter 3
(h) a full description of the process followed to reach the proposed development footprint within the approved site as contemplated in the accepted scoping report including:
Chapter 3
(i) details of all the development footprint alternatives considered; Chapter 3
(ii) details of the public participation process undertaken in terms of regulation 41 of the Regulations, including copies of the supporting documents and inputs;
Chapter 5
(iii) a summary of the issues raised by interested and affected parties, and an indication of the manner in which the issues were incorporated, or the reasons for not including them;
Chapter 5
(iv) the environmental attributes associated with the development footprint alternatives focusing on the geographical, physical, biological, social, economic, heritage and cultural aspects;
Chapter 3 and 6
(v) the impacts and risks identified for each alternative, including the nature, significance, consequence, extent, duration and probability of the impacts, including the degree to which these impacts-
(aa) can be reversed; (bb) may cause irreplaceable loss of resources; and (cc) can be avoided, managed or mitigated.
Chapter 3 and 8
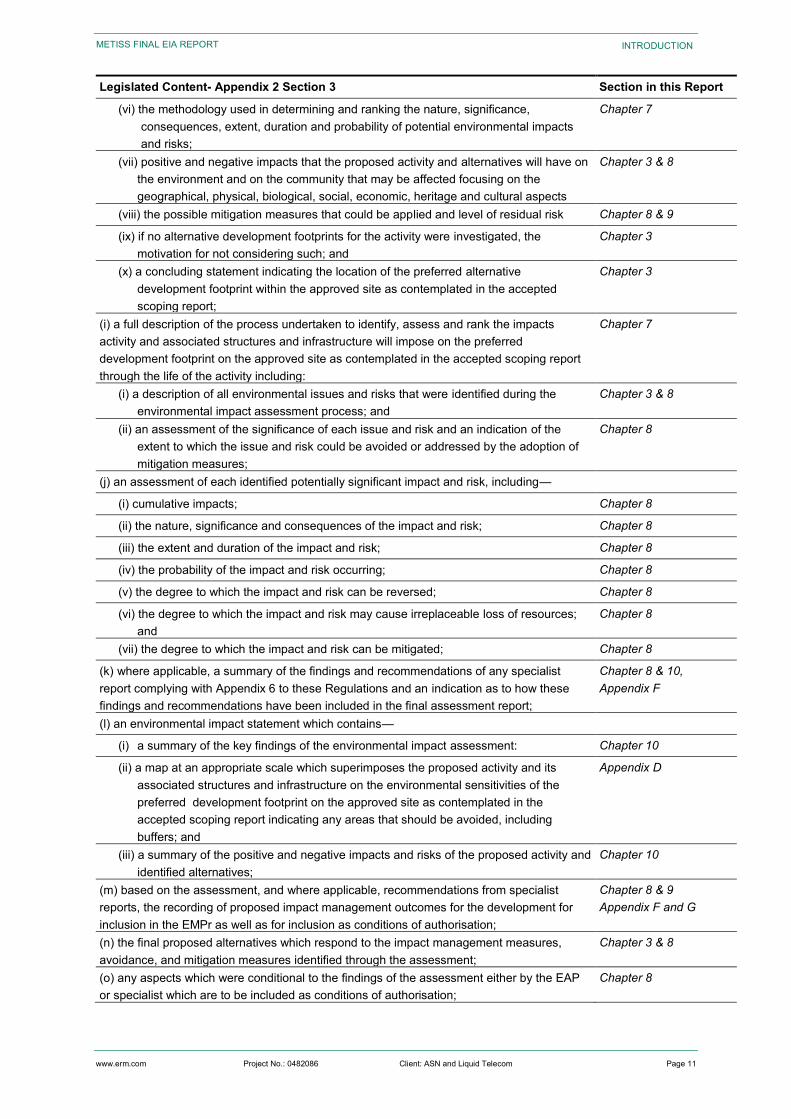
www.erm.com Project No.: 0482086 Client: ASN and Liquid Telecom Page 11
METISS FINAL EIA REPORT INTRODUCTION
Legislated Content- Appendix 2 Section 3 Section in this Report
(vi) the methodology used in determining and ranking the nature, significance, consequences, extent, duration and probability of potential environmental impacts and risks;
Chapter 7
(vii) positive and negative impacts that the proposed activity and alternatives will have on the environment and on the community that may be affected focusing on the geographical, physical, biological, social, economic, heritage and cultural aspects
Chapter 3 & 8
(viii) the possible mitigation measures that could be applied and level of residual risk Chapter 8 & 9
(ix) if no alternative development footprints for the activity were investigated, the motivation for not considering such; and
Chapter 3
(x) a concluding statement indicating the location of the preferred alternative development footprint within the approved site as contemplated in the accepted scoping report;
Chapter 3
(i) a full description of the process undertaken to identify, assess and rank the impacts activity and associated structures and infrastructure will impose on the preferred development footprint on the approved site as contemplated in the accepted scoping report through the life of the activity including:
Chapter 7
(i) a description of all environmental issues and risks that were identified during the environmental impact assessment process; and
Chapter 3 & 8
(ii) an assessment of the significance of each issue and risk and an indication of the extent to which the issue and risk could be avoided or addressed by the adoption of mitigation measures;
Chapter 8
(j) an assessment of each identified potentially significant impact and risk, including—
(i) cumulative impacts; Chapter 8
(ii) the nature, significance and consequences of the impact and risk; Chapter 8
(iii) the extent and duration of the impact and risk; Chapter 8
(iv) the probability of the impact and risk occurring; Chapter 8
(v) the degree to which the impact and risk can be reversed; Chapter 8
(vi) the degree to which the impact and risk may cause irreplaceable loss of resources; and
Chapter 8
(vii) the degree to which the impact and risk can be mitigated; Chapter 8
(k) where applicable, a summary of the findings and recommendations of any specialist report complying with Appendix 6 to these Regulations and an indication as to how these findings and recommendations have been included in the final assessment report;
Chapter 8 & 10, Appendix F
(l) an environmental impact statement which contains—
(i) a summary of the key findings of the environmental impact assessment: Chapter 10
(ii) a map at an appropriate scale which superimposes the proposed activity and its associated structures and infrastructure on the environmental sensitivities of the preferred development footprint on the approved site as contemplated in the accepted scoping report indicating any areas that should be avoided, including buffers; and
Appendix D
(iii) a summary of the positive and negative impacts and risks of the proposed activity and identified alternatives;
Chapter 10
(m) based on the assessment, and where applicable, recommendations from specialist reports, the recording of proposed impact management outcomes for the development for inclusion in the EMPr as well as for inclusion as conditions of authorisation;
Chapter 8 & 9 Appendix F and G
(n) the final proposed alternatives which respond to the impact management measures, avoidance, and mitigation measures identified through the assessment;
Chapter 3 & 8
(o) any aspects which were conditional to the findings of the assessment either by the EAP or specialist which are to be included as conditions of authorisation;
Chapter 8
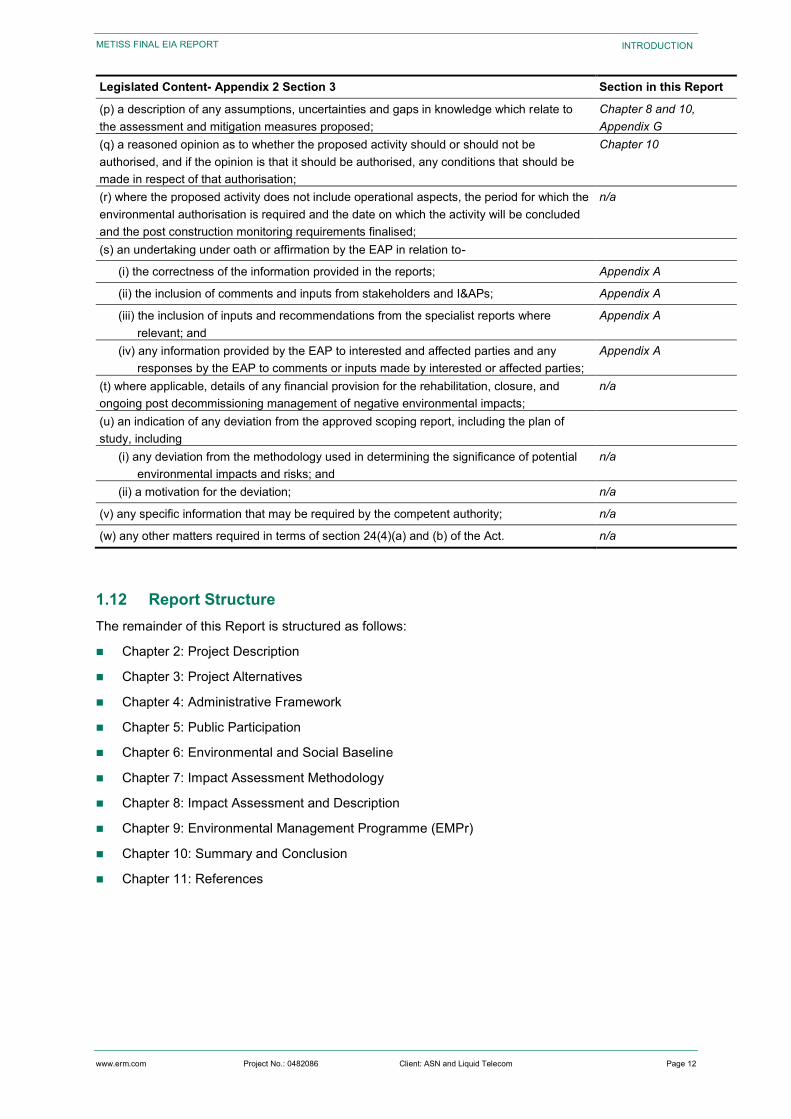
www.erm.com Project No.: 0482086 Client: ASN and Liquid Telecom Page 12
METISS FINAL EIA REPORT INTRODUCTION
Legislated Content- Appendix 2 Section 3 Section in this Report
(p) a description of any assumptions, uncertainties and gaps in knowledge which relate to the assessment and mitigation measures proposed;
Chapter 8 and 10, Appendix G
(q) a reasoned opinion as to whether the proposed activity should or should not be authorised, and if the opinion is that it should be authorised, any conditions that should be made in respect of that authorisation;
Chapter 10
(r) where the proposed activity does not include operational aspects, the period for which the environmental authorisation is required and the date on which the activity will be concluded and the post construction monitoring requirements finalised;
n/a
(s) an undertaking under oath or affirmation by the EAP in relation to-
(i) the correctness of the information provided in the reports; Appendix A
(ii) the inclusion of comments and inputs from stakeholders and I&APs; Appendix A
(iii) the inclusion of inputs and recommendations from the specialist reports where relevant; and
Appendix A
(iv) any information provided by the EAP to interested and affected parties and any responses by the EAP to comments or inputs made by interested or affected parties;
Appendix A
(t) where applicable, details of any financial provision for the rehabilitation, closure, and ongoing post decommissioning management of negative environmental impacts;
n/a
(u) an indication of any deviation from the approved scoping report, including the plan of study, including
(i) any deviation from the methodology used in determining the significance of potential environmental impacts and risks; and
n/a
(ii) a motivation for the deviation; n/a
(v) any specific information that may be required by the competent authority; n/a
(w) any other matters required in terms of section 24(4)(a) and (b) of the Act. n/a
1.12 Report Structure The remainder of this Report is structured as follows:
Chapter 2: Project Description
Chapter 3: Project Alternatives
Chapter 4: Administrative Framework
Chapter 5: Public Participation
Chapter 6: Environmental and Social Baseline
Chapter 7: Impact Assessment Methodology
Chapter 8: Impact Assessment and Description
Chapter 9: Environmental Management Programme (EMPr)
Chapter 10: Summary and Conclusion
Chapter 11: References
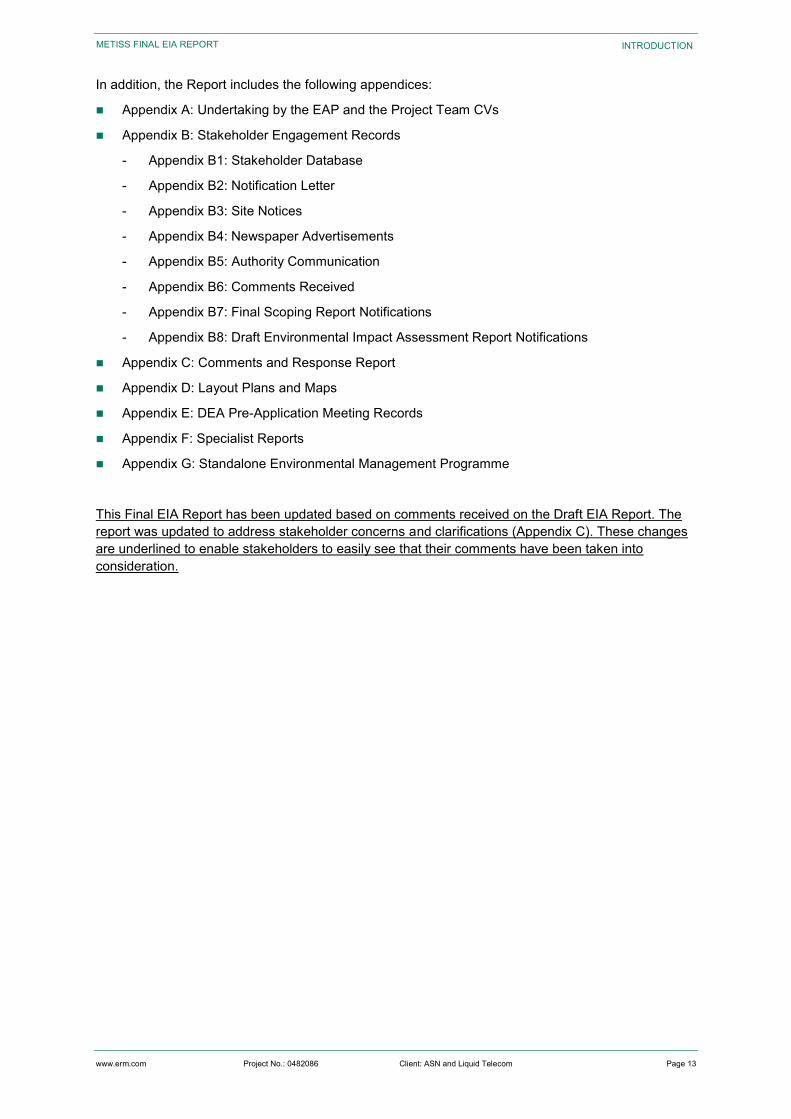
www.erm.com Project No.: 0482086 Client: ASN and Liquid Telecom Page 13
METISS FINAL EIA REPORT INTRODUCTION
In addition, the Report includes the following appendices:
Appendix A: Undertaking by the EAP and the Project Team CVs
Appendix B: Stakeholder Engagement Records
- Appendix B1: Stakeholder Database
- Appendix B2: Notification Letter
- Appendix B3: Site Notices
- Appendix B4: Newspaper Advertisements
- Appendix B5: Authority Communication
- Appendix B6: Comments Received
- Appendix B7: Final Scoping Report Notifications
- Appendix B8: Draft Environmental Impact Assessment Report Notifications
Appendix C: Comments and Response Report
Appendix D: Layout Plans and Maps
Appendix E: DEA Pre-Application Meeting Records
Appendix F: Specialist Reports
Appendix G: Standalone Environmental Management Programme
This Final EIA Report has been updated based on comments received on the Draft EIA Report. The report was updated to address stakeholder concerns and clarifications (Appendix C). These changes are underlined to enable stakeholders to easily see that their comments have been taken into consideration.
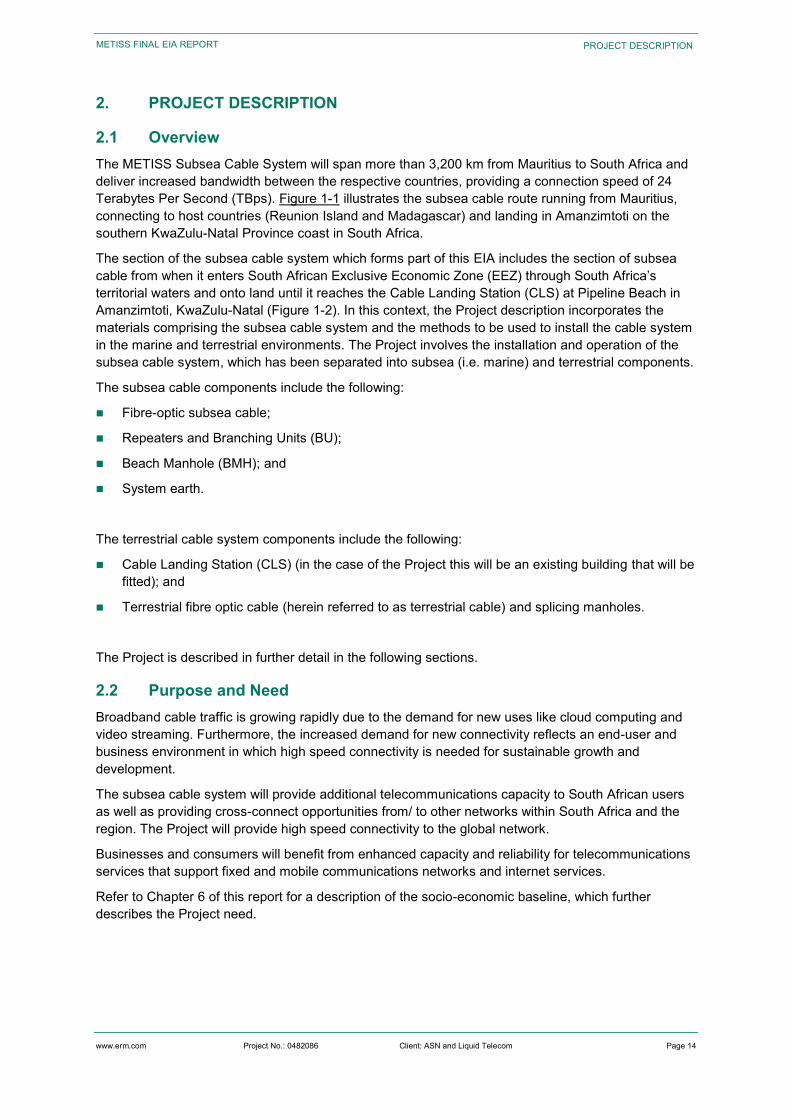
www.erm.com Project No.: 0482086 Client: ASN and Liquid Telecom Page 14
METISS FINAL EIA REPORT PROJECT DESCRIPTION
2. PROJECT DESCRIPTION
2.1 Overview The METISS Subsea Cable System will span more than 3,200 km from Mauritius to South Africa and deliver increased bandwidth between the respective countries, providing a connection speed of 24 Terabytes Per Second (TBps). Figure 1-1 illustrates the subsea cable route running from Mauritius, connecting to host countries (Reunion Island and Madagascar) and landing in Amanzimtoti on the southern KwaZulu-Natal Province coast in South Africa.
The section of the subsea cable system which forms part of this EIA includes the section of subsea cable from when it enters South African Exclusive Economic Zone (EEZ) through South Africa’s territorial waters and onto land until it reaches the Cable Landing Station (CLS) at Pipeline Beach in Amanzimtoti, KwaZulu-Natal (Figure 1-2). In this context, the Project description incorporates the materials comprising the subsea cable system and the methods to be used to install the cable system in the marine and terrestrial environments. The Project involves the installation and operation of the subsea cable system, which has been separated into subsea (i.e. marine) and terrestrial components.
The subsea cable components include the following:
Fibre-optic subsea cable;
Repeaters and Branching Units (BU);
Beach Manhole (BMH); and
System earth.
The terrestrial cable system components include the following:
Cable Landing Station (CLS) (in the case of the Project this will be an existing building that will be fitted); and
Terrestrial fibre optic cable (herein referred to as terrestrial cable) and splicing manholes.
The Project is described in further detail in the following sections.
2.2 Purpose and Need Broadband cable traffic is growing rapidly due to the demand for new uses like cloud computing and video streaming. Furthermore, the increased demand for new connectivity reflects an end-user and business environment in which high speed connectivity is needed for sustainable growth and development.
The subsea cable system will provide additional telecommunications capacity to South African users as well as providing cross-connect opportunities from/ to other networks within South Africa and the region. The Project will provide high speed connectivity to the global network.
Businesses and consumers will benefit from enhanced capacity and reliability for telecommunications services that support fixed and mobile communications networks and internet services.
Refer to Chapter 6 of this report for a description of the socio-economic baseline, which further describes the Project need.
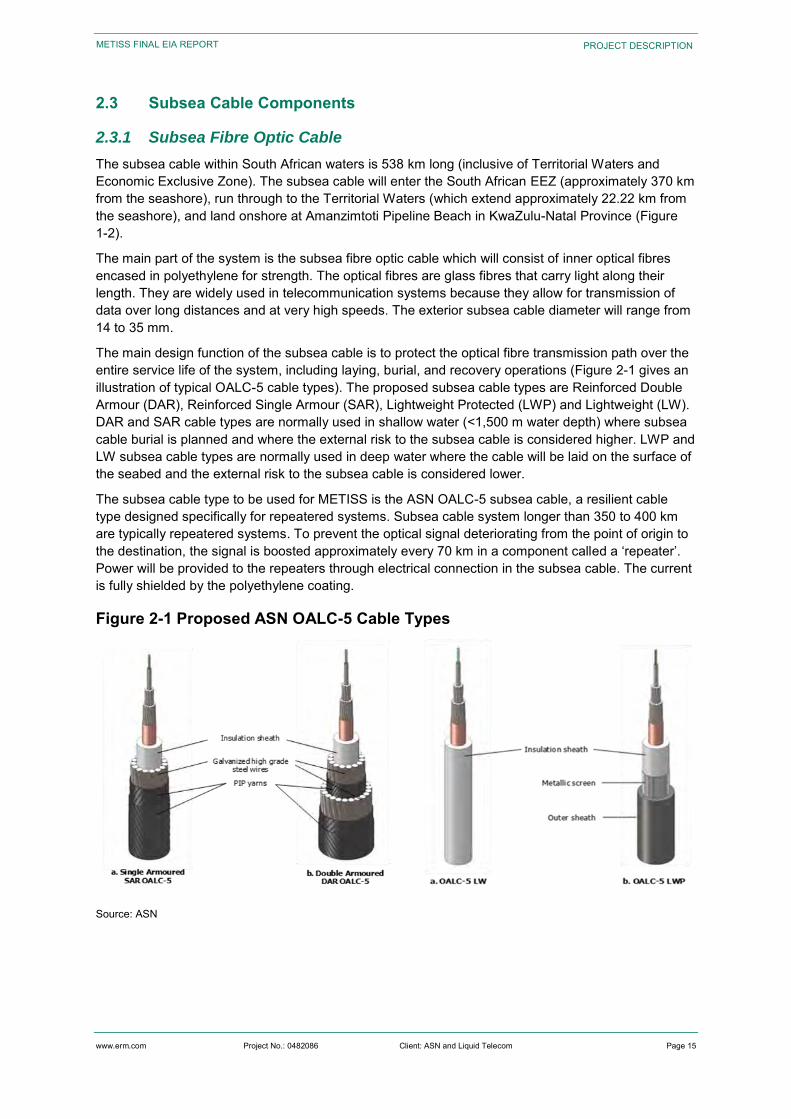
www.erm.com Project No.: 0482086 Client: ASN and Liquid Telecom Page 15
METISS FINAL EIA REPORT PROJECT DESCRIPTION
2.3 Subsea Cable Components
2.3.1 Subsea Fibre Optic Cable
The subsea cable within South African waters is 538 km long (inclusive of Territorial Waters and Economic Exclusive Zone). The subsea cable will enter the South African EEZ (approximately 370 km from the seashore), run through to the Territorial Waters (which extend approximately 22.22 km from the seashore), and land onshore at Amanzimtoti Pipeline Beach in KwaZulu-Natal Province (Figure 1-2).
The main part of the system is the subsea fibre optic cable which will consist of inner optical fibres encased in polyethylene for strength. The optical fibres are glass fibres that carry light along their length. They are widely used in telecommunication systems because they allow for transmission of data over long distances and at very high speeds. The exterior subsea cable diameter will range from 14 to 35 mm.
The main design function of the subsea cable is to protect the optical fibre transmission path over the entire service life of the system, including laying, burial, and recovery operations (Figure 2-1 gives an illustration of typical OALC-5 cable types). The proposed subsea cable types are Reinforced Double Armour (DAR), Reinforced Single Armour (SAR), Lightweight Protected (LWP) and Lightweight (LW). DAR and SAR cable types are normally used in shallow water (<1,500 m water depth) where subsea cable burial is planned and where the external risk to the subsea cable is considered higher. LWP and LW subsea cable types are normally used in deep water where the cable will be laid on the surface of the seabed and the external risk to the subsea cable is considered lower.
The subsea cable type to be used for METISS is the ASN OALC-5 subsea cable, a resilient cable type designed specifically for repeatered systems. Subsea cable system longer than 350 to 400 km are typically repeatered systems. To prevent the optical signal deteriorating from the point of origin to the destination, the signal is boosted approximately every 70 km in a component called a ‘repeater’. Power will be provided to the repeaters through electrical connection in the subsea cable. The current is fully shielded by the polyethylene coating.
Figure 2-1 Proposed ASN OALC-5 Cable Types
Source: ASN
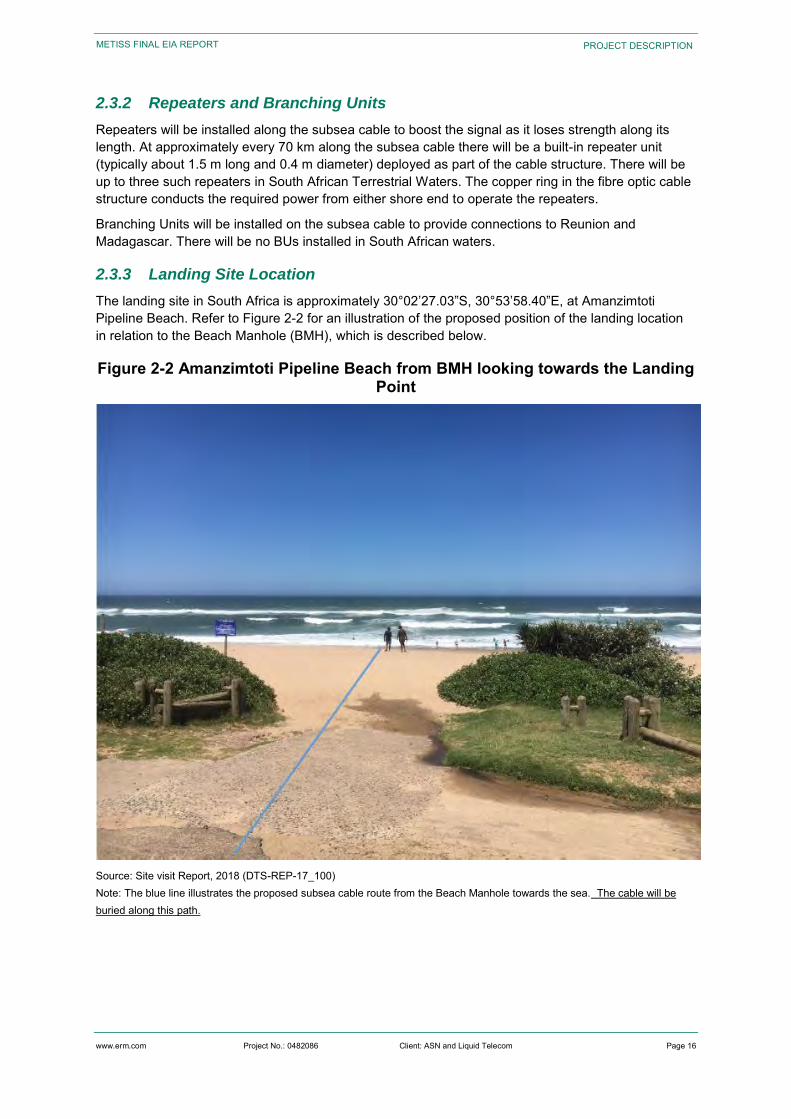
www.erm.com Project No.: 0482086 Client: ASN and Liquid Telecom Page 16
METISS FINAL EIA REPORT PROJECT DESCRIPTION
2.3.2 Repeaters and Branching Units
Repeaters will be installed along the subsea cable to boost the signal as it loses strength along its length. At approximately every 70 km along the subsea cable there will be a built-in repeater unit (typically about 1.5 m long and 0.4 m diameter) deployed as part of the cable structure. There will be up to three such repeaters in South African Terrestrial Waters. The copper ring in the fibre optic cable structure conducts the required power from either shore end to operate the repeaters.
Branching Units will be installed on the subsea cable to provide connections to Reunion and Madagascar. There will be no BUs installed in South African waters.
2.3.3 Landing Site Location
The landing site in South Africa is approximately 30°02’27.03”S, 30°53’58.40”E, at Amanzimtoti Pipeline Beach. Refer to Figure 2-2 for an illustration of the proposed position of the landing location in relation to the Beach Manhole (BMH), which is described below.
Figure 2-2 Amanzimtoti Pipeline Beach from BMH looking towards the Landing Point
Source: Site visit Report, 2018 (DTS-REP-17_100) Note: The blue line illustrates the proposed subsea cable route from the Beach Manhole towards the sea. The cable will be buried along this path.
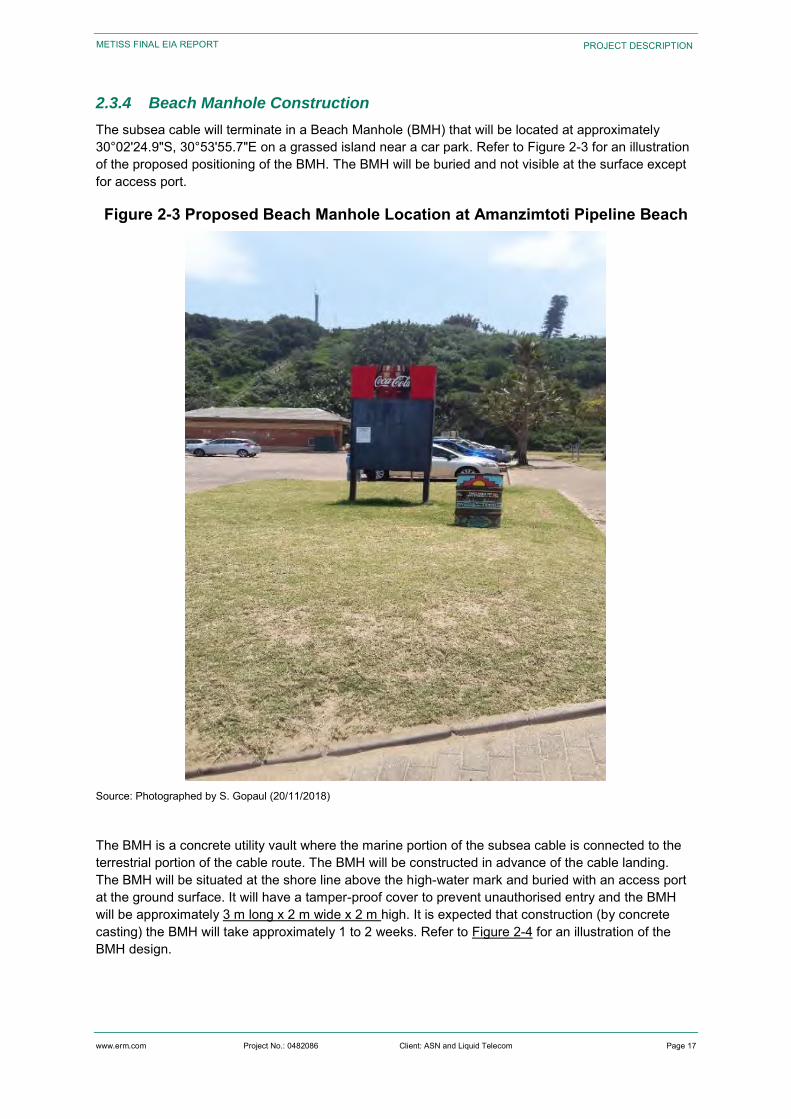
www.erm.com Project No.: 0482086 Client: ASN and Liquid Telecom Page 17
METISS FINAL EIA REPORT PROJECT DESCRIPTION
2.3.4 Beach Manhole Construction
The subsea cable will terminate in a Beach Manhole (BMH) that will be located at approximately 30°02'24.9"S, 30°53'55.7"E on a grassed island near a car park. Refer to Figure 2-3 for an illustration of the proposed positioning of the BMH. The BMH will be buried and not visible at the surface except for access port.
Figure 2-3 Proposed Beach Manhole Location at Amanzimtoti Pipeline Beach
Source: Photographed by S. Gopaul (20/11/2018)
The BMH is a concrete utility vault where the marine portion of the subsea cable is connected to the terrestrial portion of the cable route. The BMH will be constructed in advance of the cable landing. The BMH will be situated at the shore line above the high-water mark and buried with an access port at the ground surface. It will have a tamper-proof cover to prevent unauthorised entry and the BMH will be approximately 3 m long x 2 m wide x 2 m high. It is expected that construction (by concrete casting) the BMH will take approximately 1 to 2 weeks. Refer to Figure 2-4 for an illustration of the BMH design.
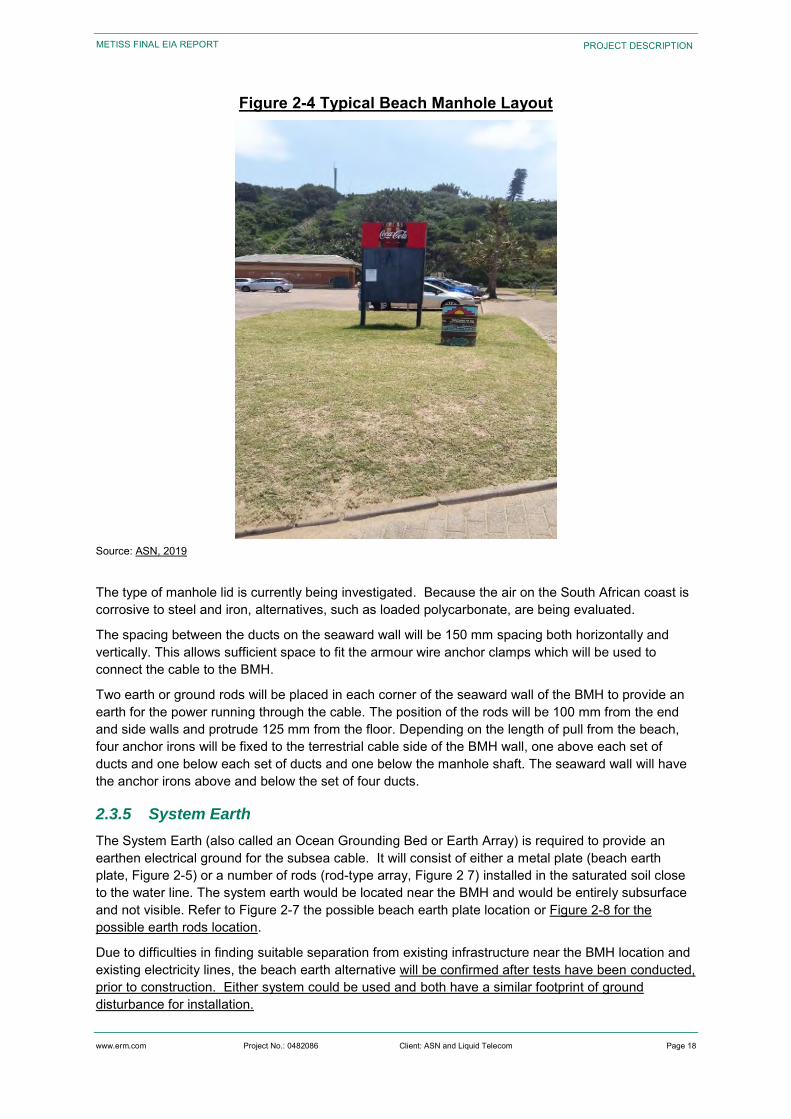
www.erm.com Project No.: 0482086 Client: ASN and Liquid Telecom Page 18
METISS FINAL EIA REPORT PROJECT DESCRIPTION
Figure 2-4 Typical Beach Manhole Layout
Source: ASN, 2019
The type of manhole lid is currently being investigated. Because the air on the South African coast is corrosive to steel and iron, alternatives, such as loaded polycarbonate, are being evaluated.
The spacing between the ducts on the seaward wall will be 150 mm spacing both horizontally and vertically. This allows sufficient space to fit the armour wire anchor clamps which will be used to connect the cable to the BMH.
Two earth or ground rods will be placed in each corner of the seaward wall of the BMH to provide an earth for the power running through the cable. The position of the rods will be 100 mm from the end and side walls and protrude 125 mm from the floor. Depending on the length of pull from the beach, four anchor irons will be fixed to the terrestrial cable side of the BMH wall, one above each set of ducts and one below each set of ducts and one below the manhole shaft. The seaward wall will have the anchor irons above and below the set of four ducts.
2.3.5 System Earth
The System Earth (also called an Ocean Grounding Bed or Earth Array) is required to provide an earthen electrical ground for the subsea cable. It will consist of either a metal plate (beach earth plate, Figure 2-5) or a number of rods (rod-type array, Figure 2 7) installed in the saturated soil close to the water line. The system earth would be located near the BMH and would be entirely subsurface and not visible. Refer to Figure 2-7 the possible beach earth plate location or Figure 2-8 for the possible earth rods location.
Due to difficulties in finding suitable separation from existing infrastructure near the BMH location and existing electricity lines, the beach earth alternative will be confirmed after tests have been conducted, prior to construction. Either system could be used and both have a similar footprint of ground disturbance for installation.
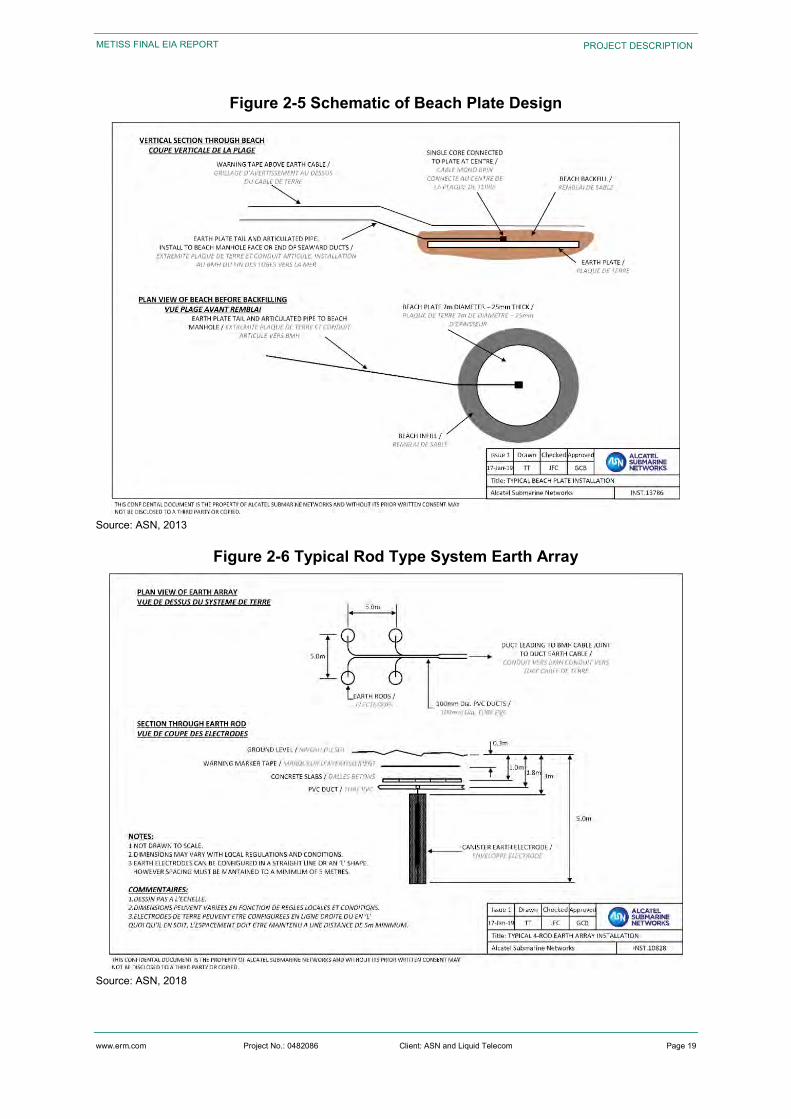
www.erm.com Project No.: 0482086 Client: ASN and Liquid Telecom Page 19
METISS FINAL EIA REPORT PROJECT DESCRIPTION
Figure 2-5 Schematic of Beach Plate Design
Source: ASN, 2013
Figure 2-6 Typical Rod Type System Earth Array
Source: ASN, 2018
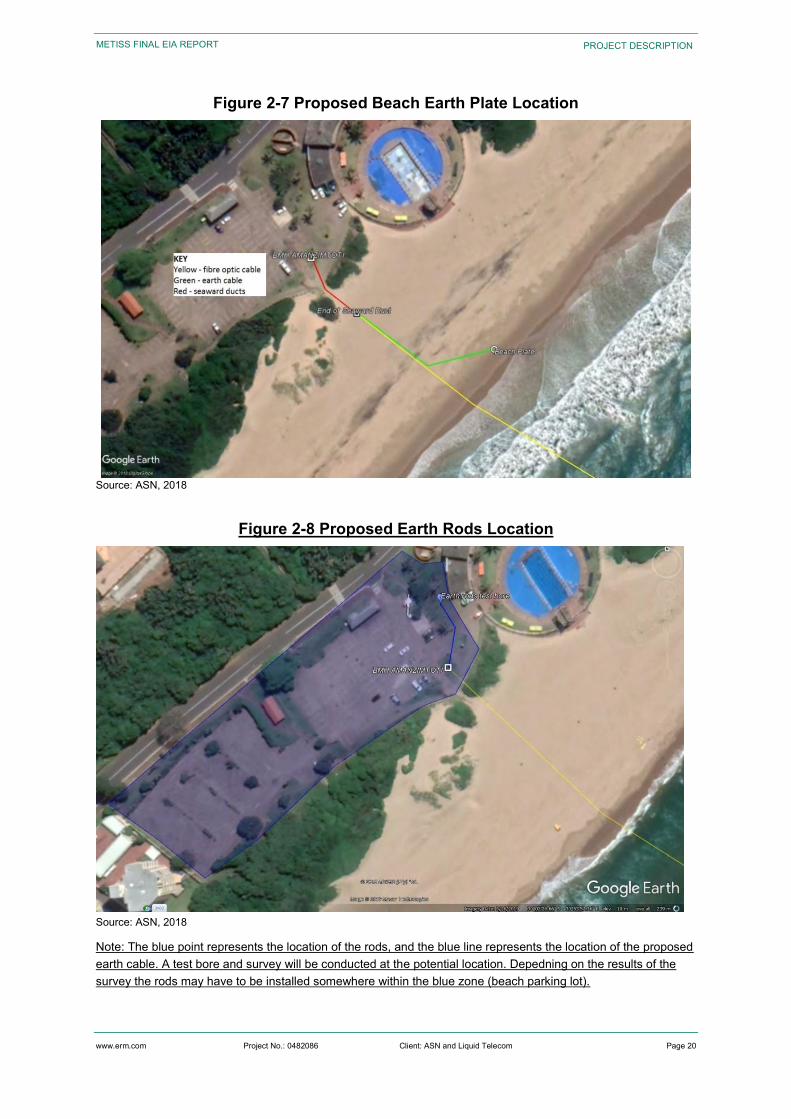
www.erm.com Project No.: 0482086 Client: ASN and Liquid Telecom Page 20
METISS FINAL EIA REPORT PROJECT DESCRIPTION
Figure 2-7 Proposed Beach Earth Plate Location
Source: ASN, 2018
Figure 2-8 Proposed Earth Rods Location
Source: ASN, 2018
Note: The blue point represents the location of the rods, and the blue line represents the location of the proposed earth cable. A test bore and survey will be conducted at the potential location. Depedning on the results of the survey the rods may have to be installed somewhere within the blue zone (beach parking lot).
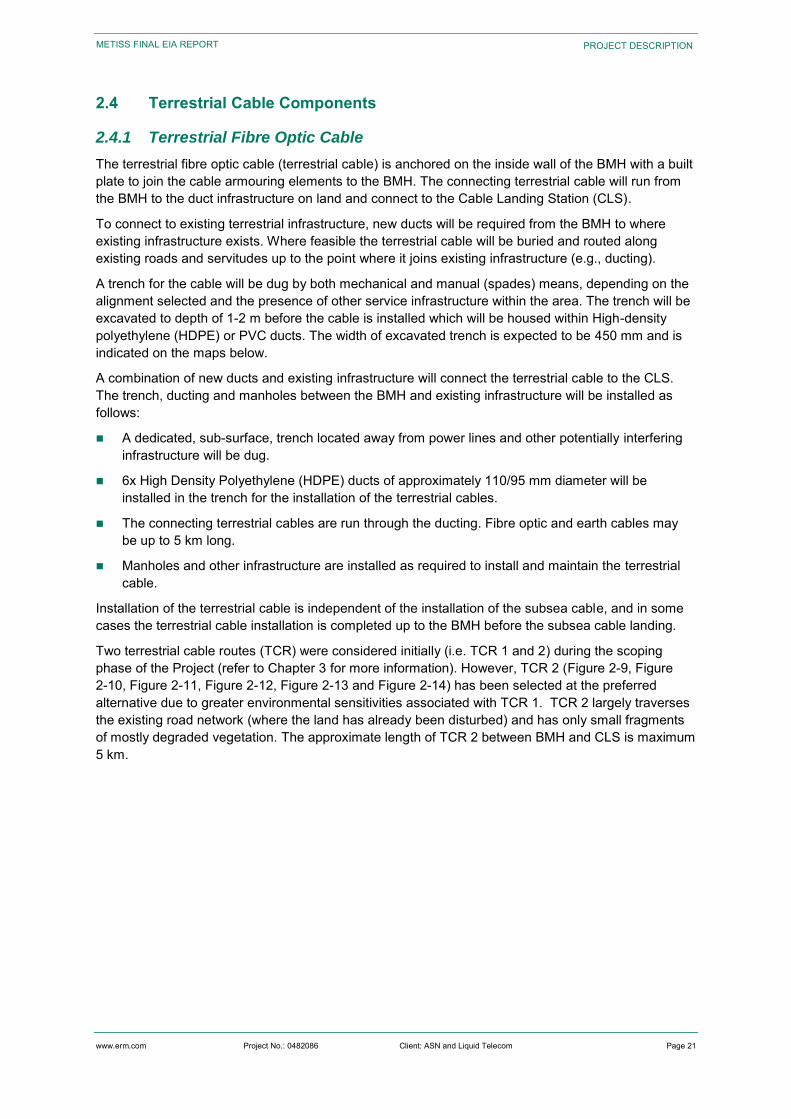
www.erm.com Project No.: 0482086 Client: ASN and Liquid Telecom Page 21
METISS FINAL EIA REPORT PROJECT DESCRIPTION
2.4 Terrestrial Cable Components
2.4.1 Terrestrial Fibre Optic Cable
The terrestrial fibre optic cable (terrestrial cable) is anchored on the inside wall of the BMH with a built plate to join the cable armouring elements to the BMH. The connecting terrestrial cable will run from the BMH to the duct infrastructure on land and connect to the Cable Landing Station (CLS).
To connect to existing terrestrial infrastructure, new ducts will be required from the BMH to where existing infrastructure exists. Where feasible the terrestrial cable will be buried and routed along existing roads and servitudes up to the point where it joins existing infrastructure (e.g., ducting).
A trench for the cable will be dug by both mechanical and manual (spades) means, depending on the alignment selected and the presence of other service infrastructure within the area. The trench will be excavated to depth of 1-2 m before the cable is installed which will be housed within High-density polyethylene (HDPE) or PVC ducts. The width of excavated trench is expected to be 450 mm and is indicated on the maps below.
A combination of new ducts and existing infrastructure will connect the terrestrial cable to the CLS. The trench, ducting and manholes between the BMH and existing infrastructure will be installed as follows:
A dedicated, sub-surface, trench located away from power lines and other potentially interfering infrastructure will be dug.
6x High Density Polyethylene (HDPE) ducts of approximately 110/95 mm diameter will be installed in the trench for the installation of the terrestrial cables.
The connecting terrestrial cables are run through the ducting. Fibre optic and earth cables may be up to 5 km long.
Manholes and other infrastructure are installed as required to install and maintain the terrestrial cable.
Installation of the terrestrial cable is independent of the installation of the subsea cable, and in some cases the terrestrial cable installation is completed up to the BMH before the subsea cable landing.
Two terrestrial cable routes (TCR) were considered initially (i.e. TCR 1 and 2) during the scoping phase of the Project (refer to Chapter 3 for more information). However, TCR 2 (Figure 2-9, Figure 2-10, Figure 2-11, Figure 2-12, Figure 2-13 and Figure 2-14) has been selected at the preferred alternative due to greater environmental sensitivities associated with TCR 1. TCR 2 largely traverses the existing road network (where the land has already been disturbed) and has only small fragments of mostly degraded vegetation. The approximate length of TCR 2 between BMH and CLS is maximum 5 km.
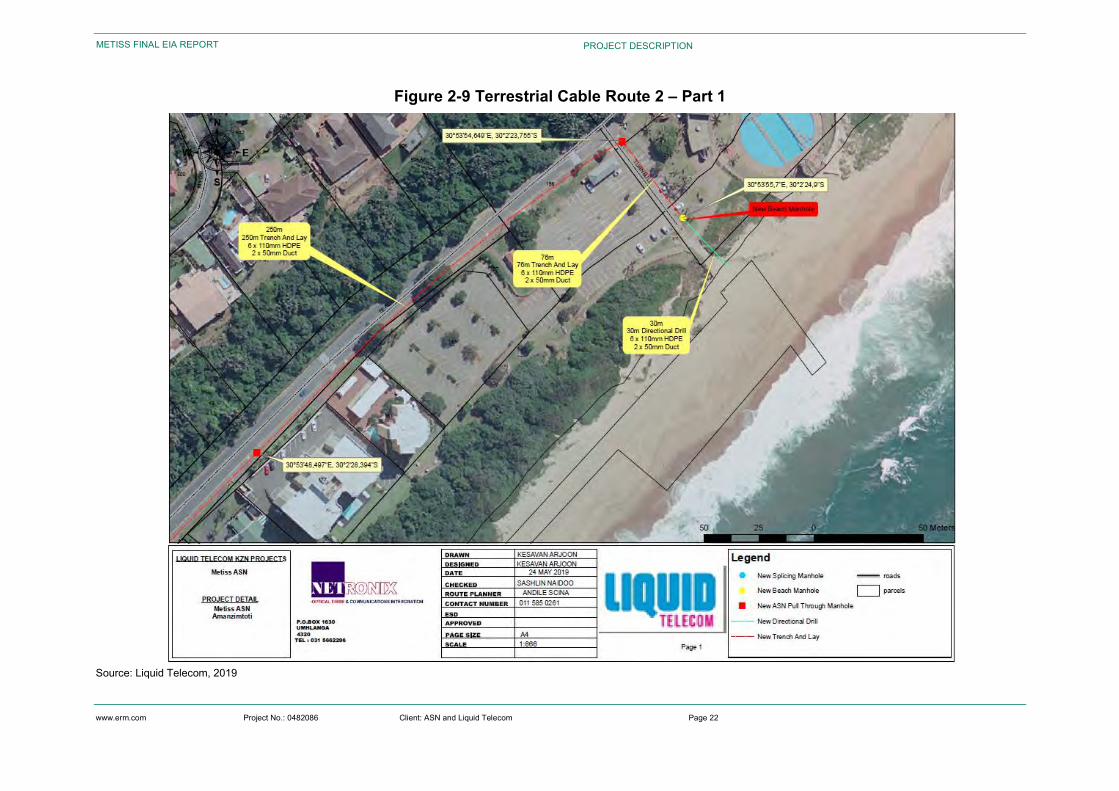
www.erm.com Project No.: 0482086 Client: ASN and Liquid Telecom Page 22
METISS FINAL EIA REPORT PROJECT DESCRIPTION
Figure 2-9 Terrestrial Cable Route 2 – Part 1
Source: Liquid Telecom, 2019
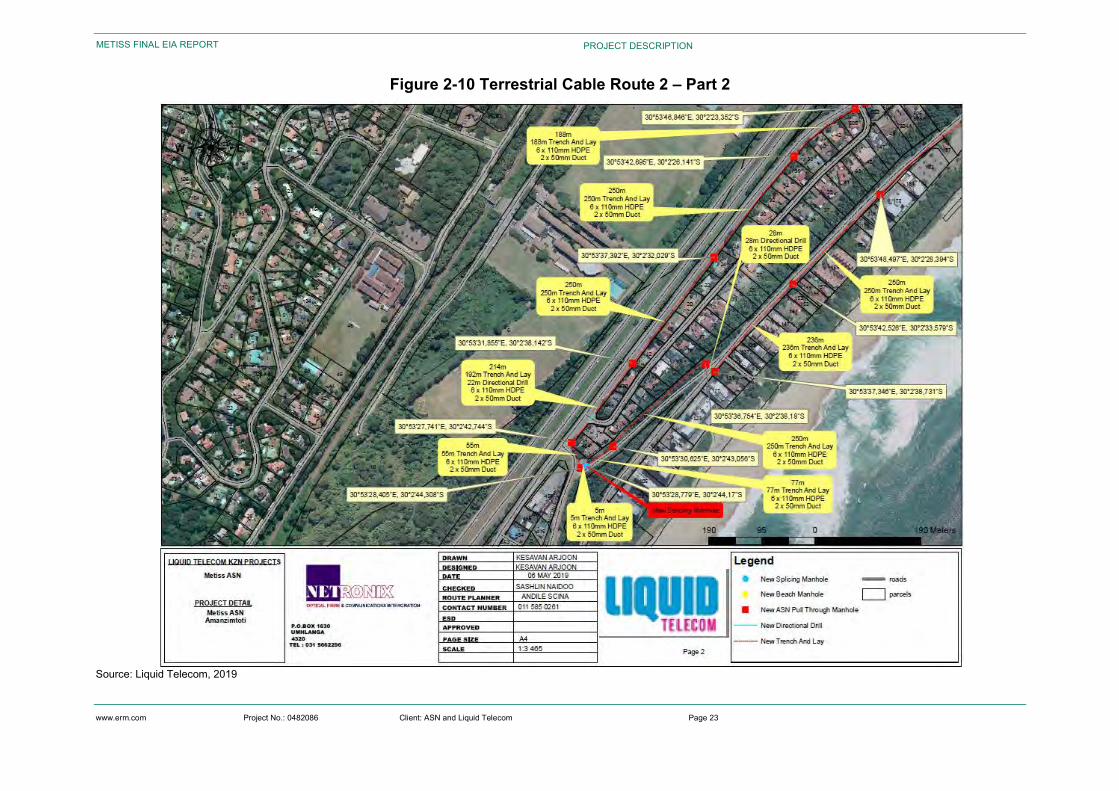
www.erm.com Project No.: 0482086 Client: ASN and Liquid Telecom Page 23
METISS FINAL EIA REPORT PROJECT DESCRIPTION
Figure 2-10 Terrestrial Cable Route 2 – Part 2
Source: Liquid Telecom, 2019
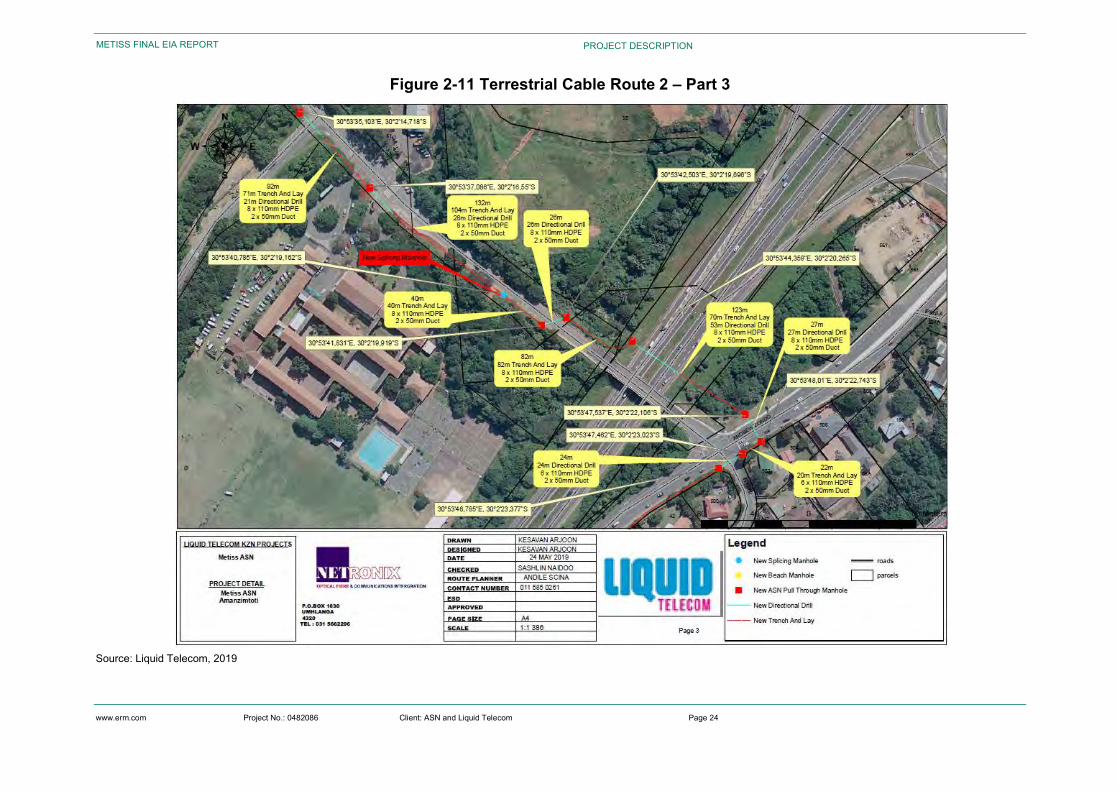
www.erm.com Project No.: 0482086 Client: ASN and Liquid Telecom Page 24
METISS FINAL EIA REPORT PROJECT DESCRIPTION
Figure 2-11 Terrestrial Cable Route 2 – Part 3
Source: Liquid Telecom, 2019
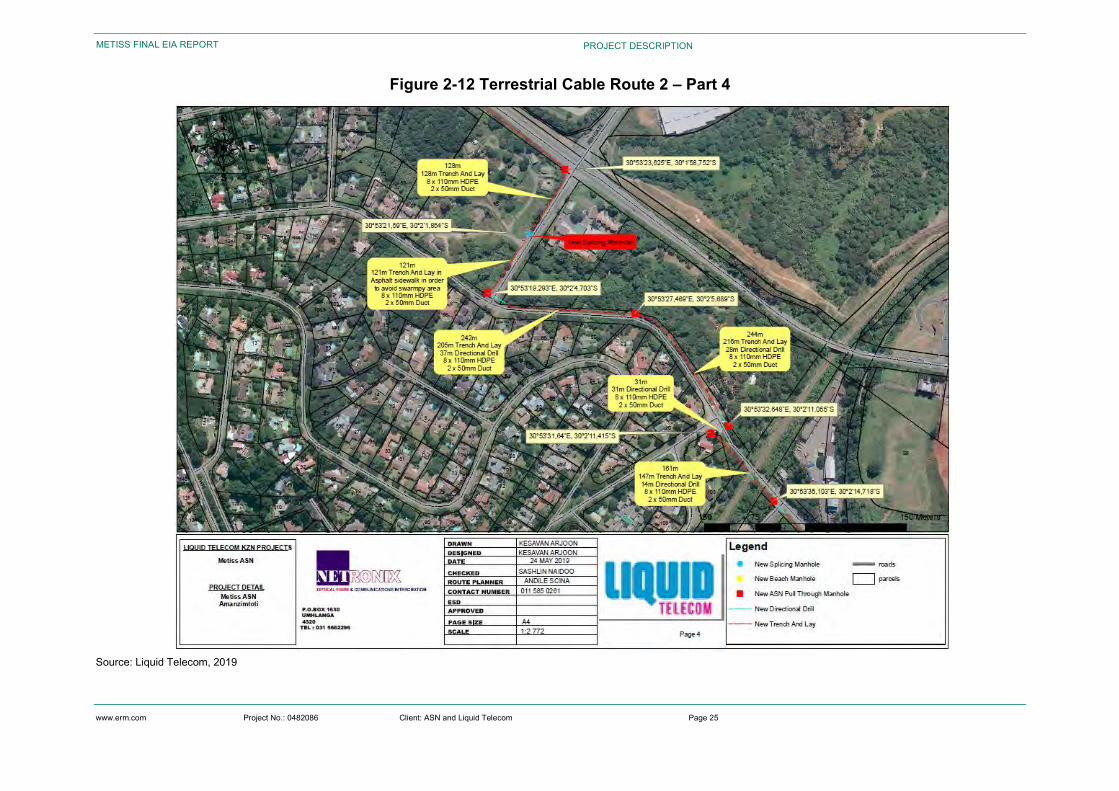
www.erm.com Project No.: 0482086 Client: ASN and Liquid Telecom Page 25
METISS FINAL EIA REPORT PROJECT DESCRIPTION
Figure 2-12 Terrestrial Cable Route 2 – Part 4
Source: Liquid Telecom, 2019
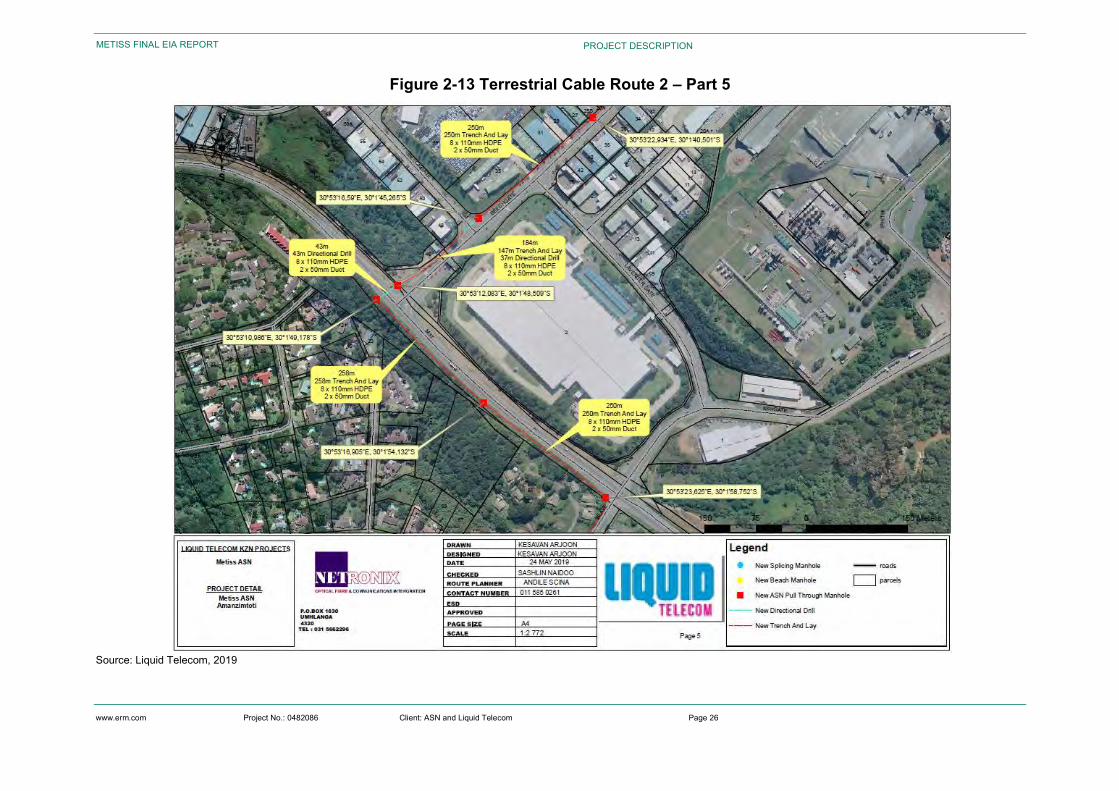
www.erm.com Project No.: 0482086 Client: ASN and Liquid Telecom Page 26
METISS FINAL EIA REPORT PROJECT DESCRIPTION
Figure 2-13 Terrestrial Cable Route 2 – Part 5
Source: Liquid Telecom, 2019
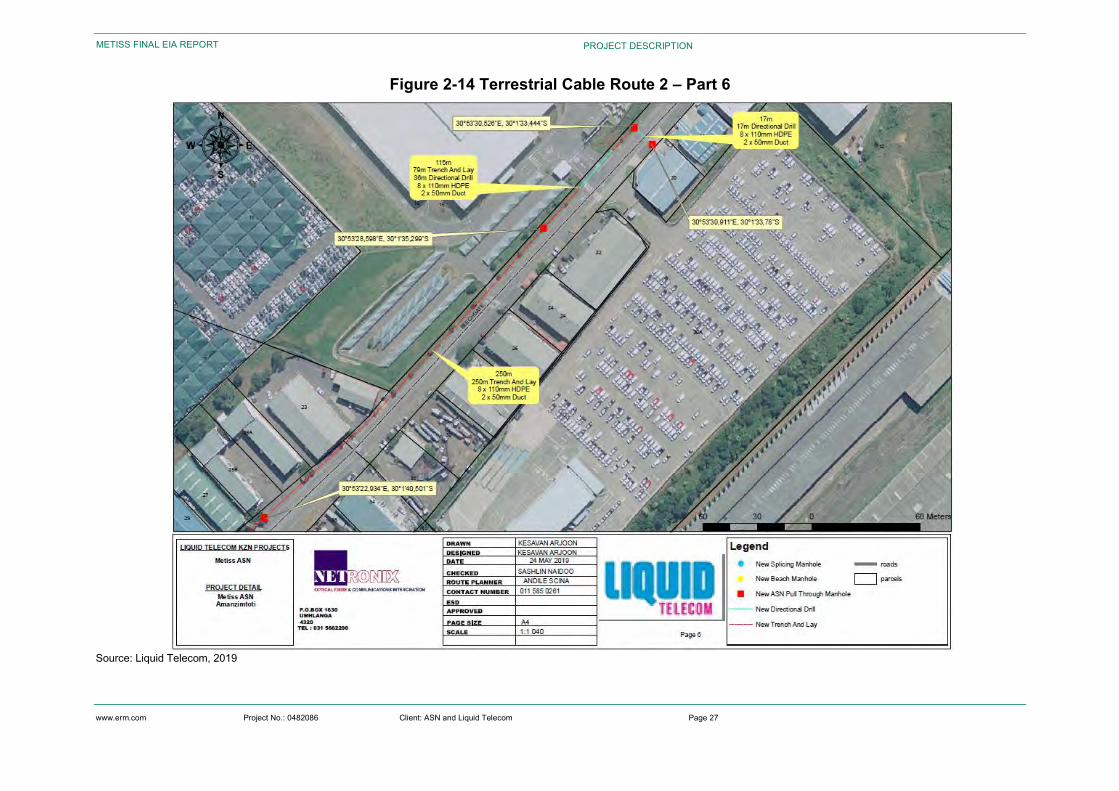
www.erm.com Project No.: 0482086 Client: ASN and Liquid Telecom Page 27
METISS FINAL EIA REPORT PROJECT DESCRIPTION
Figure 2-14 Terrestrial Cable Route 2 – Part 6
Source: Liquid Telecom, 2019
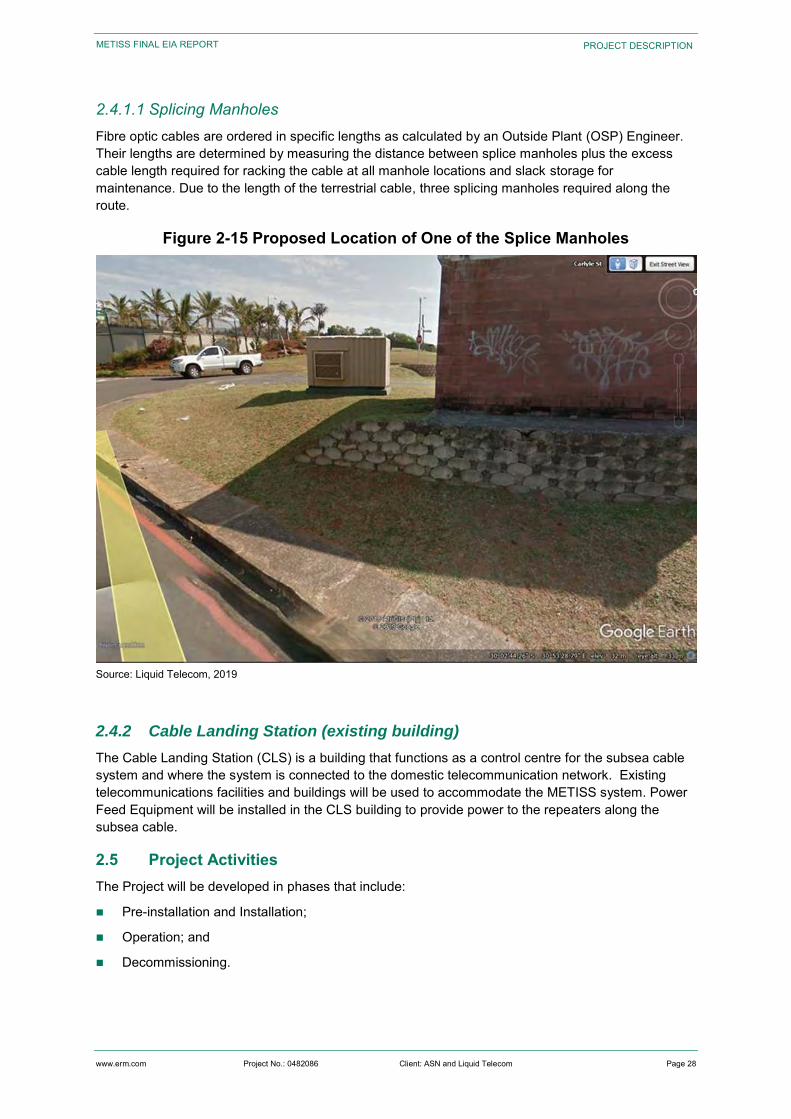
www.erm.com Project No.: 0482086 Client: ASN and Liquid Telecom Page 28
METISS FINAL EIA REPORT PROJECT DESCRIPTION
2.4.1.1 Splicing Manholes Fibre optic cables are ordered in specific lengths as calculated by an Outside Plant (OSP) Engineer. Their lengths are determined by measuring the distance between splice manholes plus the excess cable length required for racking the cable at all manhole locations and slack storage for maintenance. Due to the length of the terrestrial cable, three splicing manholes required along the route.
Figure 2-15 Proposed Location of One of the Splice Manholes
Source: Liquid Telecom, 2019
2.4.2 Cable Landing Station (existing building)
The Cable Landing Station (CLS) is a building that functions as a control centre for the subsea cable system and where the system is connected to the domestic telecommunication network. Existing telecommunications facilities and buildings will be used to accommodate the METISS system. Power Feed Equipment will be installed in the CLS building to provide power to the repeaters along the subsea cable.
2.5 Project Activities The Project will be developed in phases that include:
Pre-installation and Installation;
Operation; and
Decommissioning.
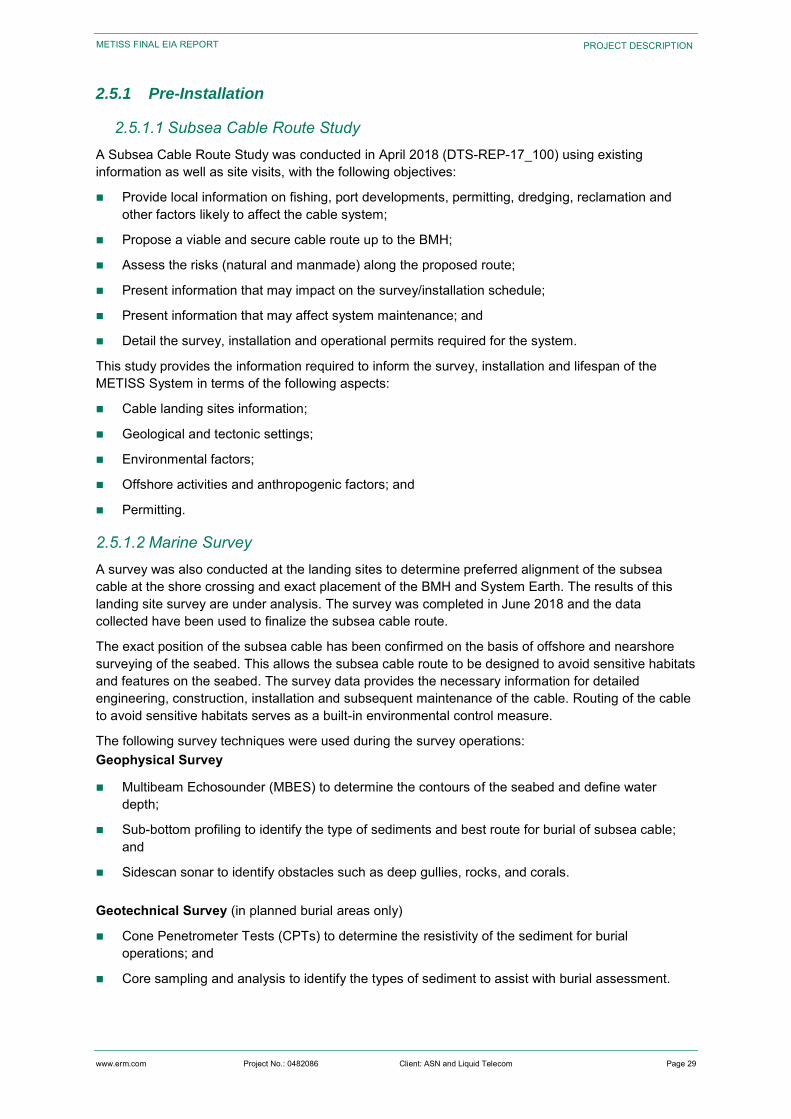
www.erm.com Project No.: 0482086 Client: ASN and Liquid Telecom Page 29
METISS FINAL EIA REPORT PROJECT DESCRIPTION
2.5.1 Pre-Installation
2.5.1.1 Subsea Cable Route Study A Subsea Cable Route Study was conducted in April 2018 (DTS-REP-17_100) using existing information as well as site visits, with the following objectives:
Provide local information on fishing, port developments, permitting, dredging, reclamation and other factors likely to affect the cable system;
Propose a viable and secure cable route up to the BMH;
Assess the risks (natural and manmade) along the proposed route;
Present information that may impact on the survey/installation schedule;
Present information that may affect system maintenance; and
Detail the survey, installation and operational permits required for the system.
This study provides the information required to inform the survey, installation and lifespan of the METISS System in terms of the following aspects:
Cable landing sites information;
Geological and tectonic settings;
Environmental factors;
Offshore activities and anthropogenic factors; and
Permitting.
2.5.1.2 Marine Survey A survey was also conducted at the landing sites to determine preferred alignment of the subsea cable at the shore crossing and exact placement of the BMH and System Earth. The results of this landing site survey are under analysis. The survey was completed in June 2018 and the data collected have been used to finalize the subsea cable route.
The exact position of the subsea cable has been confirmed on the basis of offshore and nearshore surveying of the seabed. This allows the subsea cable route to be designed to avoid sensitive habitats and features on the seabed. The survey data provides the necessary information for detailed engineering, construction, installation and subsequent maintenance of the cable. Routing of the cable to avoid sensitive habitats serves as a built-in environmental control measure.
The following survey techniques were used during the survey operations: Geophysical Survey
Multibeam Echosounder (MBES) to determine the contours of the seabed and define water depth;
Sub-bottom profiling to identify the type of sediments and best route for burial of subsea cable; and
Sidescan sonar to identify obstacles such as deep gullies, rocks, and corals. Geotechnical Survey (in planned burial areas only)
Cone Penetrometer Tests (CPTs) to determine the resistivity of the sediment for burial operations; and
Core sampling and analysis to identify the types of sediment to assist with burial assessment.
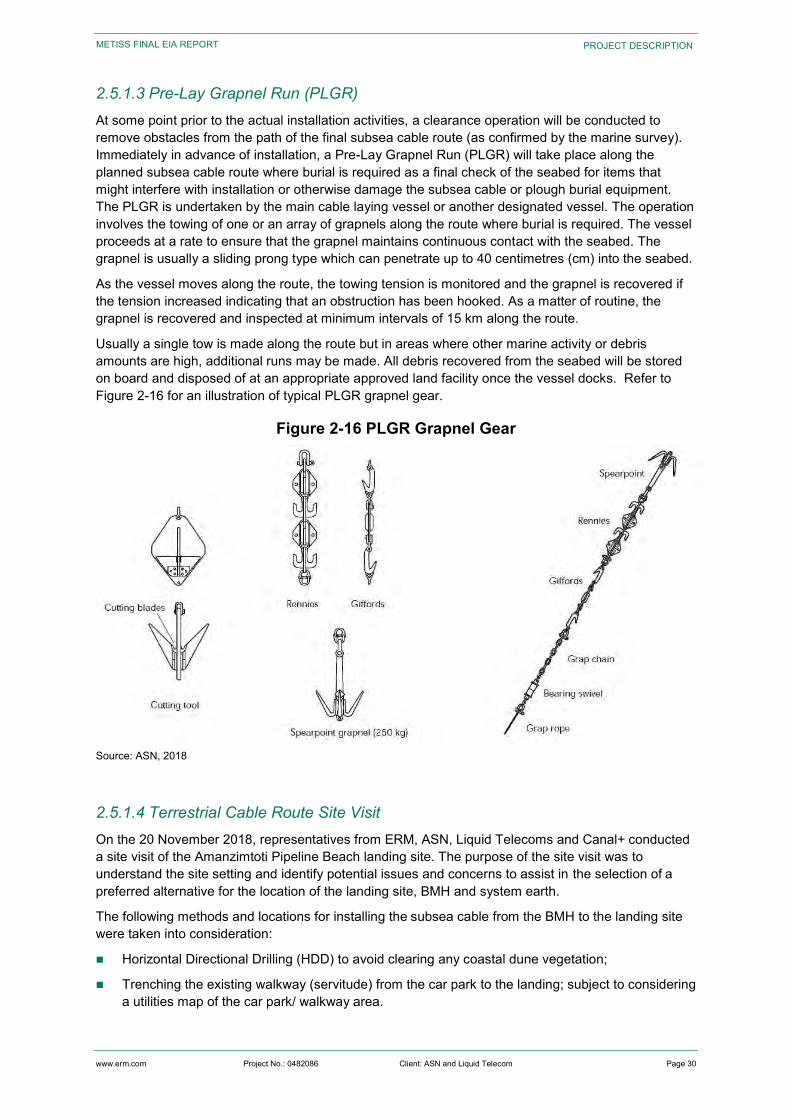
www.erm.com Project No.: 0482086 Client: ASN and Liquid Telecom Page 30
METISS FINAL EIA REPORT PROJECT DESCRIPTION
2.5.1.3 Pre-Lay Grapnel Run (PLGR) At some point prior to the actual installation activities, a clearance operation will be conducted to remove obstacles from the path of the final subsea cable route (as confirmed by the marine survey). Immediately in advance of installation, a Pre-Lay Grapnel Run (PLGR) will take place along the planned subsea cable route where burial is required as a final check of the seabed for items that might interfere with installation or otherwise damage the subsea cable or plough burial equipment. The PLGR is undertaken by the main cable laying vessel or another designated vessel. The operation involves the towing of one or an array of grapnels along the route where burial is required. The vessel proceeds at a rate to ensure that the grapnel maintains continuous contact with the seabed. The grapnel is usually a sliding prong type which can penetrate up to 40 centimetres (cm) into the seabed.
As the vessel moves along the route, the towing tension is monitored and the grapnel is recovered if the tension increased indicating that an obstruction has been hooked. As a matter of routine, the grapnel is recovered and inspected at minimum intervals of 15 km along the route.
Usually a single tow is made along the route but in areas where other marine activity or debris amounts are high, additional runs may be made. All debris recovered from the seabed will be stored on board and disposed of at an appropriate approved land facility once the vessel docks. Refer to Figure 2-16 for an illustration of typical PLGR grapnel gear.
Figure 2-16 PLGR Grapnel Gear
Source: ASN, 2018
2.5.1.4 Terrestrial Cable Route Site Visit On the 20 November 2018, representatives from ERM, ASN, Liquid Telecoms and Canal+ conducted a site visit of the Amanzimtoti Pipeline Beach landing site. The purpose of the site visit was to understand the site setting and identify potential issues and concerns to assist in the selection of a preferred alternative for the location of the landing site, BMH and system earth.
The following methods and locations for installing the subsea cable from the BMH to the landing site were taken into consideration:
Horizontal Directional Drilling (HDD) to avoid clearing any coastal dune vegetation;
Trenching the existing walkway (servitude) from the car park to the landing; subject to considering a utilities map of the car park/ walkway area.
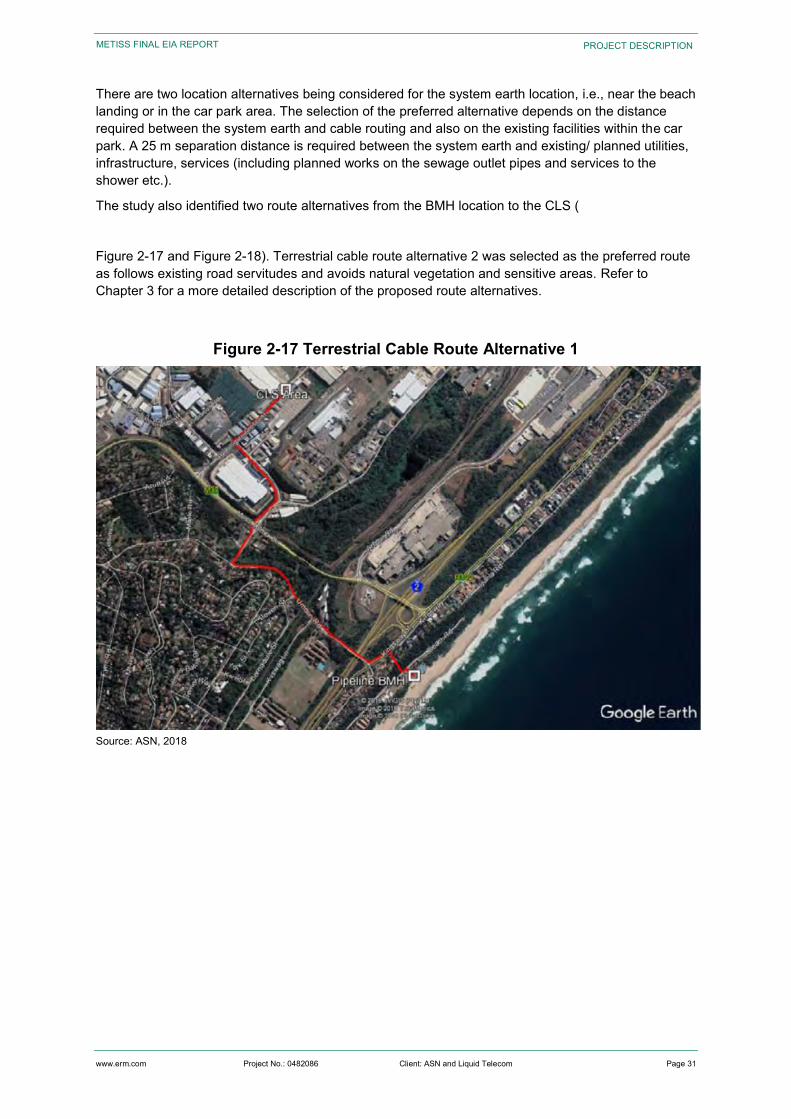
www.erm.com Project No.: 0482086 Client: ASN and Liquid Telecom Page 31
METISS FINAL EIA REPORT PROJECT DESCRIPTION
There are two location alternatives being considered for the system earth location, i.e., near the beach landing or in the car park area. The selection of the preferred alternative depends on the distance required between the system earth and cable routing and also on the existing facilities within the car park. A 25 m separation distance is required between the system earth and existing/ planned utilities, infrastructure, services (including planned works on the sewage outlet pipes and services to the shower etc.).
The study also identified two route alternatives from the BMH location to the CLS (
Figure 2-17 and Figure 2-18). Terrestrial cable route alternative 2 was selected as the preferred route as follows existing road servitudes and avoids natural vegetation and sensitive areas. Refer to Chapter 3 for a more detailed description of the proposed route alternatives.
Figure 2-17 Terrestrial Cable Route Alternative 1
Source: ASN, 2018
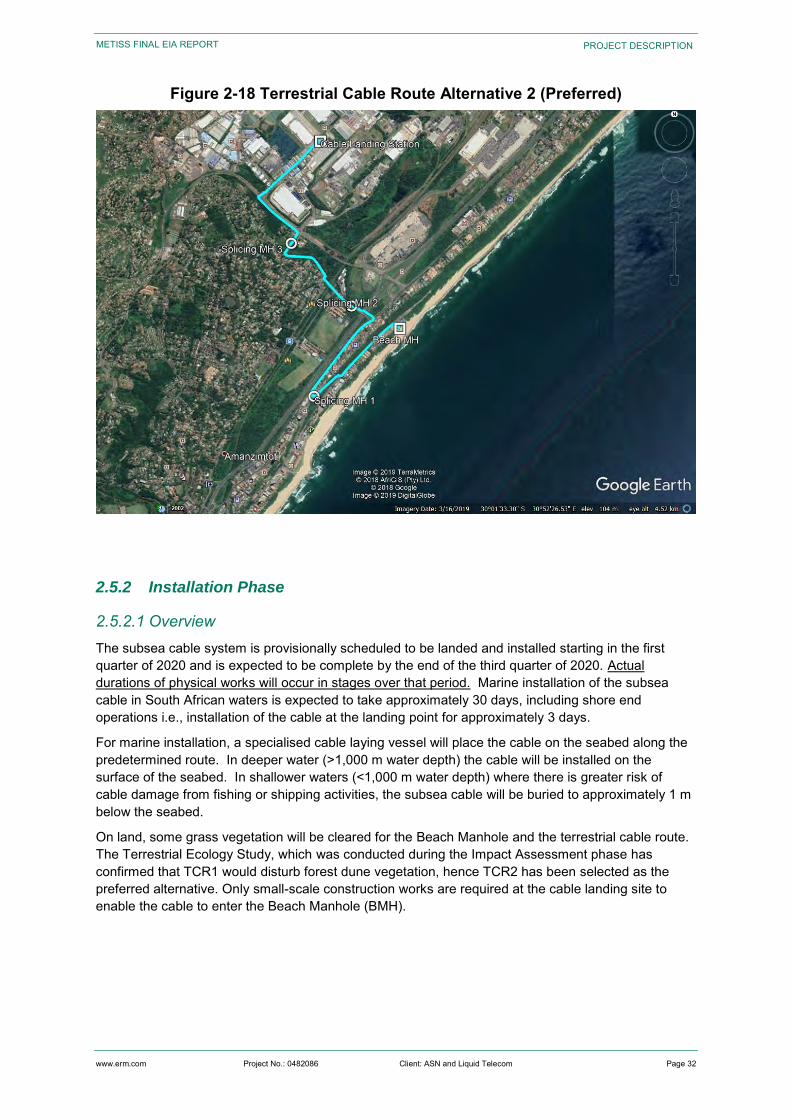
www.erm.com Project No.: 0482086 Client: ASN and Liquid Telecom Page 32
METISS FINAL EIA REPORT PROJECT DESCRIPTION
Figure 2-18 Terrestrial Cable Route Alternative 2 (Preferred)
2.5.2 Installation Phase
2.5.2.1 Overview The subsea cable system is provisionally scheduled to be landed and installed starting in the first quarter of 2020 and is expected to be complete by the end of the third quarter of 2020. Actual durations of physical works will occur in stages over that period. Marine installation of the subsea cable in South African waters is expected to take approximately 30 days, including shore end operations i.e., installation of the cable at the landing point for approximately 3 days.
For marine installation, a specialised cable laying vessel will place the cable on the seabed along the predetermined route. In deeper water (>1,000 m water depth) the cable will be installed on the surface of the seabed. In shallower waters (<1,000 m water depth) where there is greater risk of cable damage from fishing or shipping activities, the subsea cable will be buried to approximately 1 m below the seabed.
On land, some grass vegetation will be cleared for the Beach Manhole and the terrestrial cable route. The Terrestrial Ecology Study, which was conducted during the Impact Assessment phase has confirmed that TCR1 would disturb forest dune vegetation, hence TCR2 has been selected as the preferred alternative. Only small-scale construction works are required at the cable landing site to enable the cable to enter the Beach Manhole (BMH).
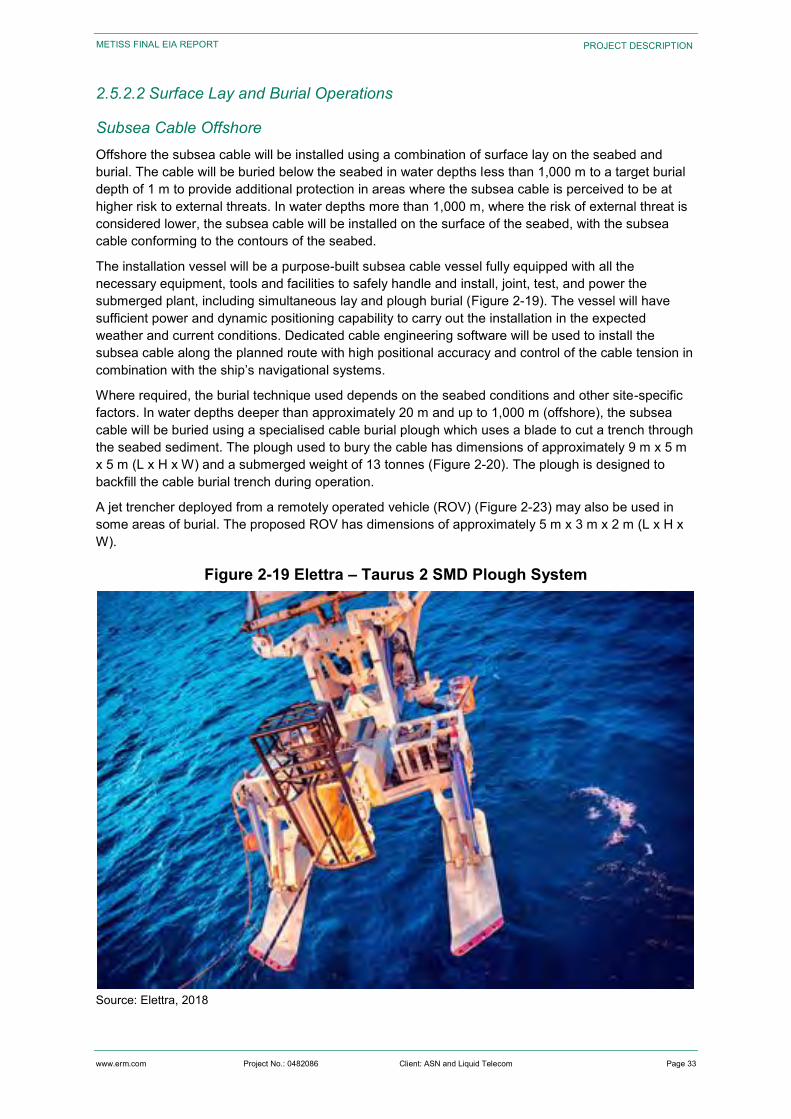
www.erm.com Project No.: 0482086 Client: ASN and Liquid Telecom Page 33
METISS FINAL EIA REPORT PROJECT DESCRIPTION
2.5.2.2 Surface Lay and Burial Operations
Subsea Cable Offshore Offshore the subsea cable will be installed using a combination of surface lay on the seabed and burial. The cable will be buried below the seabed in water depths less than 1,000 m to a target burial depth of 1 m to provide additional protection in areas where the subsea cable is perceived to be at higher risk to external threats. In water depths more than 1,000 m, where the risk of external threat is considered lower, the subsea cable will be installed on the surface of the seabed, with the subsea cable conforming to the contours of the seabed.
The installation vessel will be a purpose-built subsea cable vessel fully equipped with all the necessary equipment, tools and facilities to safely handle and install, joint, test, and power the submerged plant, including simultaneous lay and plough burial (Figure 2-19). The vessel will have sufficient power and dynamic positioning capability to carry out the installation in the expected weather and current conditions. Dedicated cable engineering software will be used to install the subsea cable along the planned route with high positional accuracy and control of the cable tension in combination with the ship’s navigational systems.
Where required, the burial technique used depends on the seabed conditions and other site-specific factors. In water depths deeper than approximately 20 m and up to 1,000 m (offshore), the subsea cable will be buried using a specialised cable burial plough which uses a blade to cut a trench through the seabed sediment. The plough used to bury the cable has dimensions of approximately 9 m x 5 m x 5 m (L x H x W) and a submerged weight of 13 tonnes (Figure 2-20). The plough is designed to backfill the cable burial trench during operation.
A jet trencher deployed from a remotely operated vehicle (ROV) (Figure 2-23) may also be used in some areas of burial. The proposed ROV has dimensions of approximately 5 m x 3 m x 2 m (L x H x W).
Figure 2-19 Elettra – Taurus 2 SMD Plough System
Source: Elettra, 2018
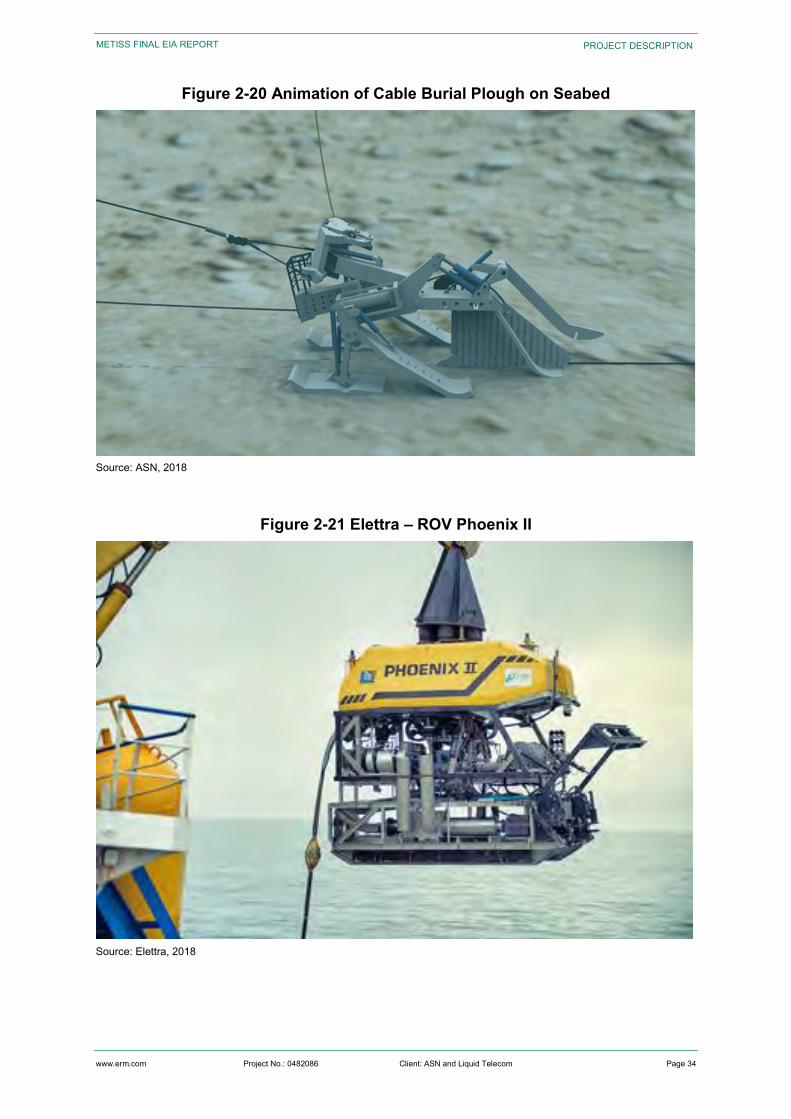
www.erm.com Project No.: 0482086 Client: ASN and Liquid Telecom Page 34
METISS FINAL EIA REPORT PROJECT DESCRIPTION
Figure 2-20 Animation of Cable Burial Plough on Seabed
Source: ASN, 2018
Figure 2-21 Elettra – ROV Phoenix II
Source: Elettra, 2018
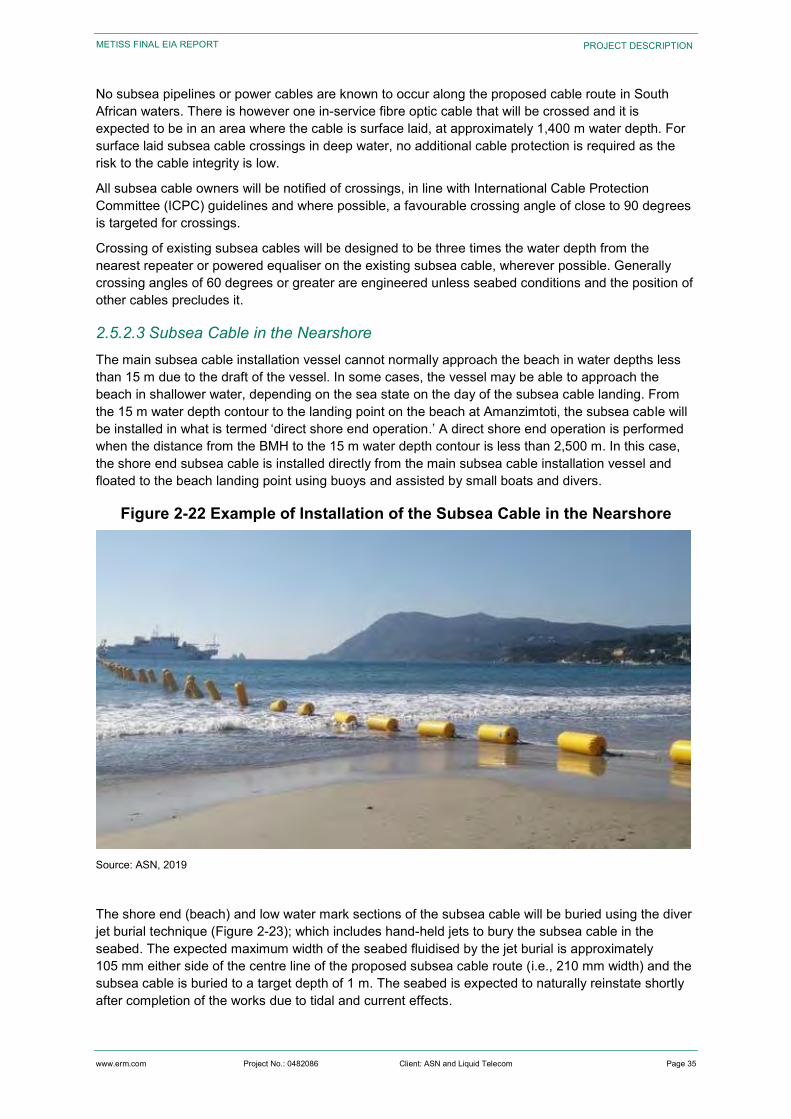
www.erm.com Project No.: 0482086 Client: ASN and Liquid Telecom Page 35
METISS FINAL EIA REPORT PROJECT DESCRIPTION
No subsea pipelines or power cables are known to occur along the proposed cable route in South African waters. There is however one in-service fibre optic cable that will be crossed and it is expected to be in an area where the cable is surface laid, at approximately 1,400 m water depth. For surface laid subsea cable crossings in deep water, no additional cable protection is required as the risk to the cable integrity is low.
All subsea cable owners will be notified of crossings, in line with International Cable Protection Committee (ICPC) guidelines and where possible, a favourable crossing angle of close to 90 degrees is targeted for crossings.
Crossing of existing subsea cables will be designed to be three times the water depth from the nearest repeater or powered equaliser on the existing subsea cable, wherever possible. Generally crossing angles of 60 degrees or greater are engineered unless seabed conditions and the position of other cables precludes it.
2.5.2.3 Subsea Cable in the Nearshore The main subsea cable installation vessel cannot normally approach the beach in water depths less than 15 m due to the draft of the vessel. In some cases, the vessel may be able to approach the beach in shallower water, depending on the sea state on the day of the subsea cable landing. From the 15 m water depth contour to the landing point on the beach at Amanzimtoti, the subsea cable will be installed in what is termed ‘direct shore end operation.’ A direct shore end operation is performed when the distance from the BMH to the 15 m water depth contour is less than 2,500 m. In this case, the shore end subsea cable is installed directly from the main subsea cable installation vessel and floated to the beach landing point using buoys and assisted by small boats and divers.
Figure 2-22 Example of Installation of the Subsea Cable in the Nearshore
Source: ASN, 2019
The shore end (beach) and low water mark sections of the subsea cable will be buried using the diver jet burial technique (Figure 2-23); which includes hand-held jets to bury the subsea cable in the seabed. The expected maximum width of the seabed fluidised by the jet burial is approximately 105 mm either side of the centre line of the proposed subsea cable route (i.e., 210 mm width) and the subsea cable is buried to a target depth of 1 m. The seabed is expected to naturally reinstate shortly after completion of the works due to tidal and current effects.
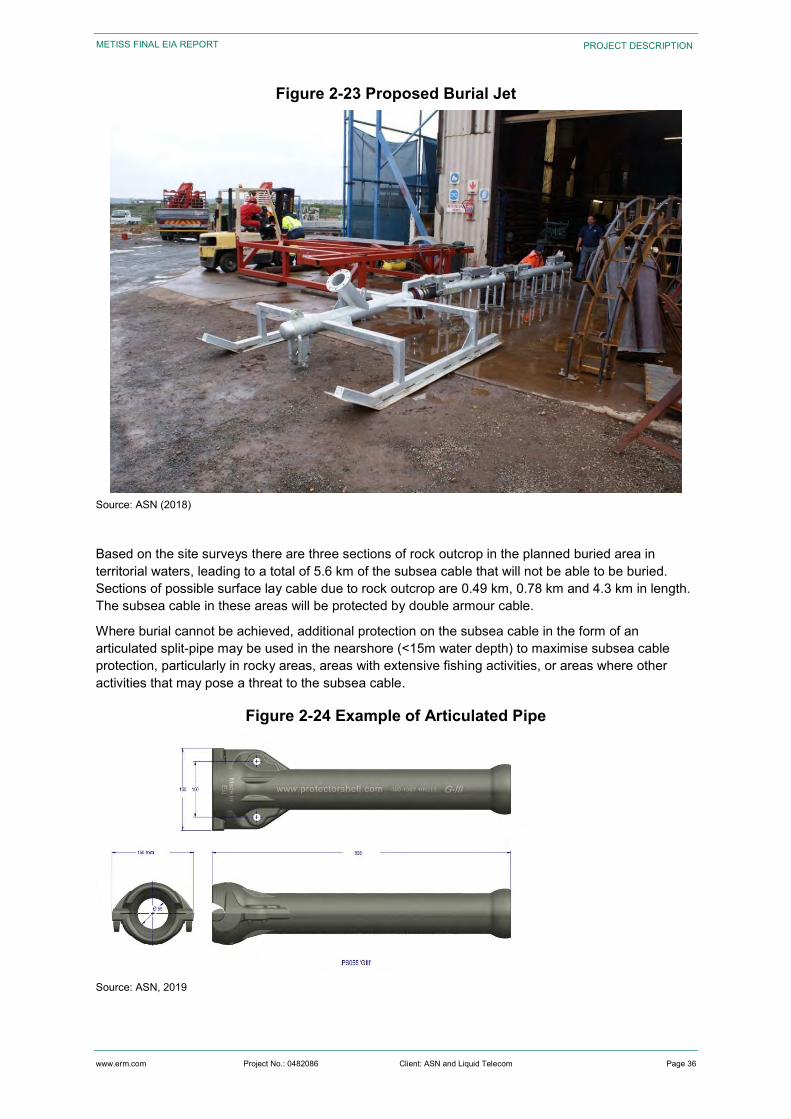
www.erm.com Project No.: 0482086 Client: ASN and Liquid Telecom Page 36
METISS FINAL EIA REPORT PROJECT DESCRIPTION
Figure 2-23 Proposed Burial Jet
Source: ASN (2018)
Based on the site surveys there are three sections of rock outcrop in the planned buried area in territorial waters, leading to a total of 5.6 km of the subsea cable that will not be able to be buried. Sections of possible surface lay cable due to rock outcrop are 0.49 km, 0.78 km and 4.3 km in length. The subsea cable in these areas will be protected by double armour cable.
Where burial cannot be achieved, additional protection on the subsea cable in the form of an articulated split-pipe may be used in the nearshore (<15m water depth) to maximise subsea cable protection, particularly in rocky areas, areas with extensive fishing activities, or areas where other activities that may pose a threat to the subsea cable.
Figure 2-24 Example of Articulated Pipe
Source: ASN, 2019
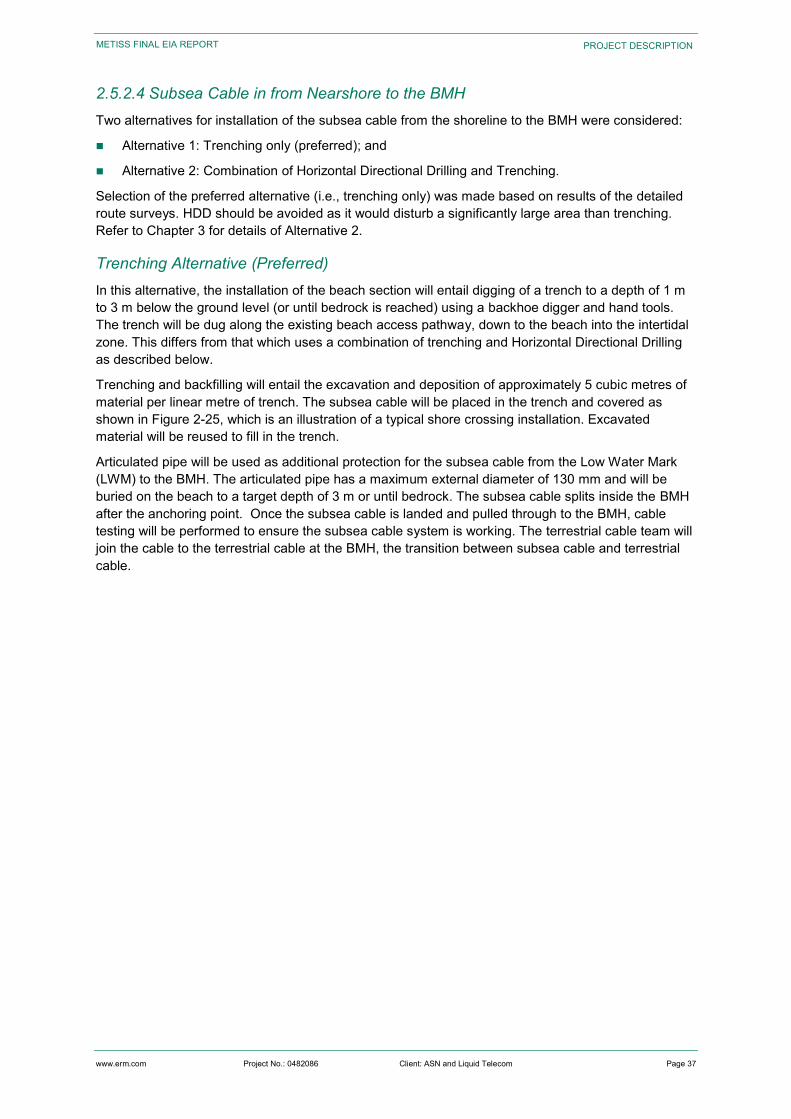
www.erm.com Project No.: 0482086 Client: ASN and Liquid Telecom Page 37
METISS FINAL EIA REPORT PROJECT DESCRIPTION
2.5.2.4 Subsea Cable in from Nearshore to the BMH Two alternatives for installation of the subsea cable from the shoreline to the BMH were considered:
Alternative 1: Trenching only (preferred); and
Alternative 2: Combination of Horizontal Directional Drilling and Trenching.
Selection of the preferred alternative (i.e., trenching only) was made based on results of the detailed route surveys. HDD should be avoided as it would disturb a significantly large area than trenching. Refer to Chapter 3 for details of Alternative 2.
Trenching Alternative (Preferred) In this alternative, the installation of the beach section will entail digging of a trench to a depth of 1 m to 3 m below the ground level (or until bedrock is reached) using a backhoe digger and hand tools. The trench will be dug along the existing beach access pathway, down to the beach into the intertidal zone. This differs from that which uses a combination of trenching and Horizontal Directional Drilling as described below.
Trenching and backfilling will entail the excavation and deposition of approximately 5 cubic metres of material per linear metre of trench. The subsea cable will be placed in the trench and covered as shown in Figure 2-25, which is an illustration of a typical shore crossing installation. Excavated material will be reused to fill in the trench.
Articulated pipe will be used as additional protection for the subsea cable from the Low Water Mark (LWM) to the BMH. The articulated pipe has a maximum external diameter of 130 mm and will be buried on the beach to a target depth of 3 m or until bedrock. The subsea cable splits inside the BMH after the anchoring point. Once the subsea cable is landed and pulled through to the BMH, cable testing will be performed to ensure the subsea cable system is working. The terrestrial cable team will join the cable to the terrestrial cable at the BMH, the transition between subsea cable and terrestrial cable.
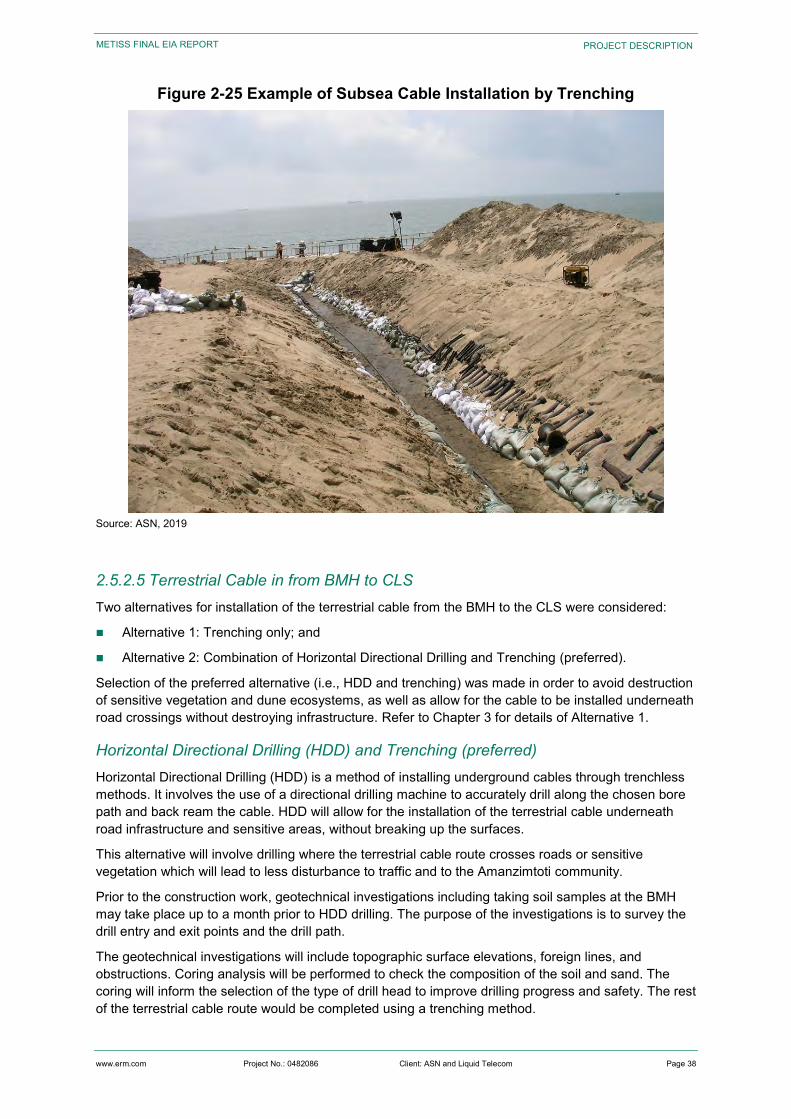
www.erm.com Project No.: 0482086 Client: ASN and Liquid Telecom Page 38
METISS FINAL EIA REPORT PROJECT DESCRIPTION
Figure 2-25 Example of Subsea Cable Installation by Trenching
Source: ASN, 2019
2.5.2.5 Terrestrial Cable in from BMH to CLS Two alternatives for installation of the terrestrial cable from the BMH to the CLS were considered:
Alternative 1: Trenching only; and
Alternative 2: Combination of Horizontal Directional Drilling and Trenching (preferred).
Selection of the preferred alternative (i.e., HDD and trenching) was made in order to avoid destruction of sensitive vegetation and dune ecosystems, as well as allow for the cable to be installed underneath road crossings without destroying infrastructure. Refer to Chapter 3 for details of Alternative 1.
Horizontal Directional Drilling (HDD) and Trenching (preferred) Horizontal Directional Drilling (HDD) is a method of installing underground cables through trenchless methods. It involves the use of a directional drilling machine to accurately drill along the chosen bore path and back ream the cable. HDD will allow for the installation of the terrestrial cable underneath road infrastructure and sensitive areas, without breaking up the surfaces.
This alternative will involve drilling where the terrestrial cable route crosses roads or sensitive vegetation which will lead to less disturbance to traffic and to the Amanzimtoti community.
Prior to the construction work, geotechnical investigations including taking soil samples at the BMH may take place up to a month prior to HDD drilling. The purpose of the investigations is to survey the drill entry and exit points and the drill path.
The geotechnical investigations will include topographic surface elevations, foreign lines, and obstructions. Coring analysis will be performed to check the composition of the soil and sand. The coring will inform the selection of the type of drill head to improve drilling progress and safety. The rest of the terrestrial cable route would be completed using a trenching method.
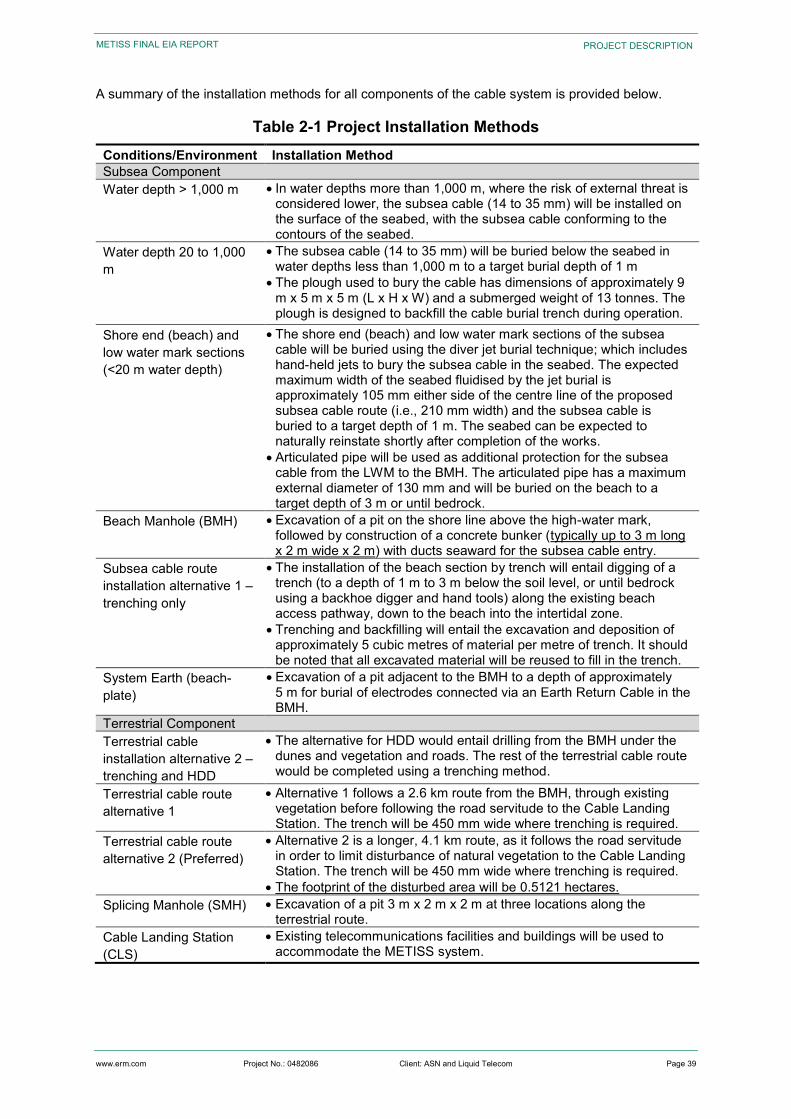
www.erm.com Project No.: 0482086 Client: ASN and Liquid Telecom Page 39
METISS FINAL EIA REPORT PROJECT DESCRIPTION
A summary of the installation methods for all components of the cable system is provided below.
Table 2-1 Project Installation Methods Conditions/Environment Installation Method Subsea Component Water depth > 1,000 m In water depths more than 1,000 m, where the risk of external threat is
considered lower, the subsea cable (14 to 35 mm) will be installed on the surface of the seabed, with the subsea cable conforming to the contours of the seabed.
Water depth 20 to 1,000 m
The subsea cable (14 to 35 mm) will be buried below the seabed in water depths less than 1,000 m to a target burial depth of 1 m
The plough used to bury the cable has dimensions of approximately 9 m x 5 m x 5 m (L x H x W) and a submerged weight of 13 tonnes. The plough is designed to backfill the cable burial trench during operation.
Shore end (beach) and low water mark sections (<20 m water depth)
The shore end (beach) and low water mark sections of the subsea cable will be buried using the diver jet burial technique; which includes hand-held jets to bury the subsea cable in the seabed. The expected maximum width of the seabed fluidised by the jet burial is approximately 105 mm either side of the centre line of the proposed subsea cable route (i.e., 210 mm width) and the subsea cable is buried to a target depth of 1 m. The seabed can be expected to naturally reinstate shortly after completion of the works.
Articulated pipe will be used as additional protection for the subsea cable from the LWM to the BMH. The articulated pipe has a maximum external diameter of 130 mm and will be buried on the beach to a target depth of 3 m or until bedrock.
Beach Manhole (BMH) Excavation of a pit on the shore line above the high-water mark, followed by construction of a concrete bunker (typically up to 3 m long x 2 m wide x 2 m) with ducts seaward for the subsea cable entry.
Subsea cable route installation alternative 1 – trenching only
The installation of the beach section by trench will entail digging of a trench (to a depth of 1 m to 3 m below the soil level, or until bedrock using a backhoe digger and hand tools) along the existing beach access pathway, down to the beach into the intertidal zone.
Trenching and backfilling will entail the excavation and deposition of approximately 5 cubic metres of material per metre of trench. It should be noted that all excavated material will be reused to fill in the trench.
System Earth (beach-plate)
Excavation of a pit adjacent to the BMH to a depth of approximately 5 m for burial of electrodes connected via an Earth Return Cable in the BMH.
Terrestrial Component Terrestrial cable installation alternative 2 – trenching and HDD
The alternative for HDD would entail drilling from the BMH under the dunes and vegetation and roads. The rest of the terrestrial cable route would be completed using a trenching method.
Terrestrial cable route alternative 1
Alternative 1 follows a 2.6 km route from the BMH, through existing vegetation before following the road servitude to the Cable Landing Station. The trench will be 450 mm wide where trenching is required.
Terrestrial cable route alternative 2 (Preferred)
Alternative 2 is a longer, 4.1 km route, as it follows the road servitude in order to limit disturbance of natural vegetation to the Cable Landing Station. The trench will be 450 mm wide where trenching is required.
The footprint of the disturbed area will be 0.5121 hectares. Splicing Manhole (SMH) Excavation of a pit 3 m x 2 m x 2 m at three locations along the
terrestrial route. Cable Landing Station (CLS)
Existing telecommunications facilities and buildings will be used to accommodate the METISS system.
www.erm.com Project No.: 0482086 Client: ASN and Liquid Telecom Page 40
METISS FINAL EIA REPORT PROJECT DESCRIPTION
The expected duration of the installation activities are noted below:
Table 2-2 Approximate Duration of Installation Activities Activities Duration Subsea Cable Installation (including shore crossing) 30 days Terrestrial Cable Route Installation including SMH 3.5 months BMH, and System Earth Construction 7-10 days
*All durations are approximate and assume favourable weather conditions.
2.5.2.6 Existing Services and Project Implementation During installation of the terrestrial cable, the following services will be utilised by the appointed contractors and subcontractors.
Water Water for installation purposes will be sourced from the closest municipal supply point and tankered to site when required.
Sewage During installation, chemical toilets will be provided for construction workers to utilise. These toilets will be serviced routinely and all waste to be disposed of at a licenced waste treatment facility in the area.
Waste Offshore and onshore Waste Management Plans (WMP) will be developed before the Project commences. The WMP establishes the procedures adopted for the management of waste to be generated during the course of conducting offshore and onshore. It covers collection, storage, transport, disposal, discharge, reporting and data management.
The following are key recommended measures for the Waste Management Plan Development:
Waste will be dealt by the installation contractors on either aquatic or terrestrial land in accordance with the waste hierarchy presented in Figure 2-26;
Suitably approved and fully licensed companies providing waste disposal services will be selected by review and evaluation in line with international good practice;
Waste tracking procedures will be defined in the WMP to provide traceability from source of generation to end point; and
Non-hazardous waste will be segregated and recycled where possible.
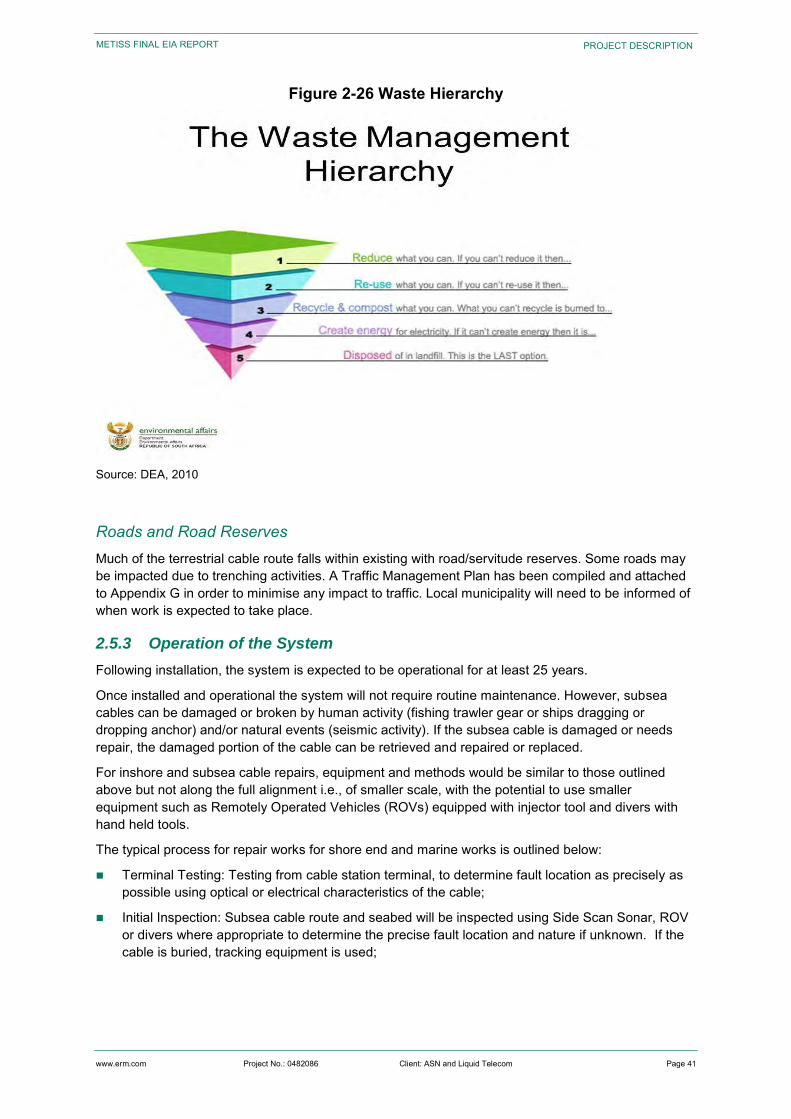
www.erm.com Project No.: 0482086 Client: ASN and Liquid Telecom Page 41
METISS FINAL EIA REPORT PROJECT DESCRIPTION
Figure 2-26 Waste Hierarchy
Source: DEA, 2010
Roads and Road Reserves Much of the terrestrial cable route falls within existing with road/servitude reserves. Some roads may be impacted due to trenching activities. A Traffic Management Plan has been compiled and attached to Appendix G in order to minimise any impact to traffic. Local municipality will need to be informed of when work is expected to take place.
2.5.3 Operation of the System
Following installation, the system is expected to be operational for at least 25 years.
Once installed and operational the system will not require routine maintenance. However, subsea cables can be damaged or broken by human activity (fishing trawler gear or ships dragging or dropping anchor) and/or natural events (seismic activity). If the subsea cable is damaged or needs repair, the damaged portion of the cable can be retrieved and repaired or replaced.
For inshore and subsea cable repairs, equipment and methods would be similar to those outlined above but not along the full alignment i.e., of smaller scale, with the potential to use smaller equipment such as Remotely Operated Vehicles (ROVs) equipped with injector tool and divers with hand held tools.
The typical process for repair works for shore end and marine works is outlined below:
Terminal Testing: Testing from cable station terminal, to determine fault location as precisely as possible using optical or electrical characteristics of the cable;
Initial Inspection: Subsea cable route and seabed will be inspected using Side Scan Sonar, ROV or divers where appropriate to determine the precise fault location and nature if unknown. If the cable is buried, tracking equipment is used;
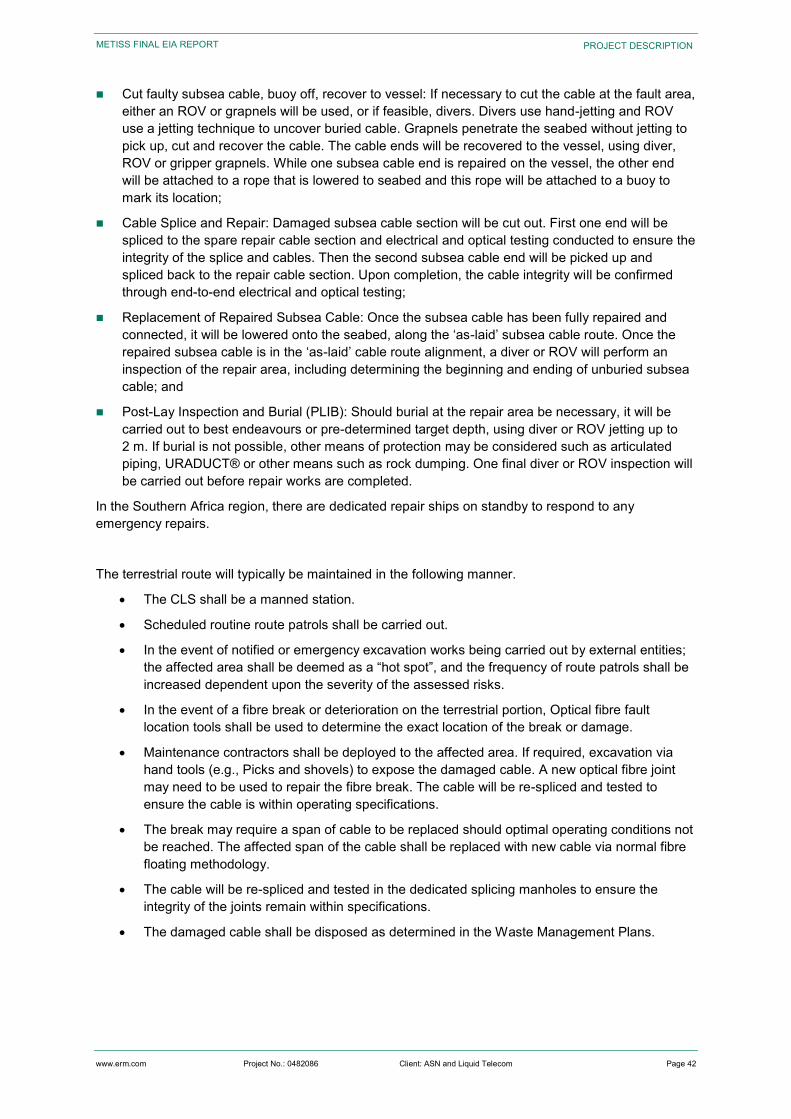
www.erm.com Project No.: 0482086 Client: ASN and Liquid Telecom Page 42
METISS FINAL EIA REPORT PROJECT DESCRIPTION
Cut faulty subsea cable, buoy off, recover to vessel: If necessary to cut the cable at the fault area, either an ROV or grapnels will be used, or if feasible, divers. Divers use hand-jetting and ROV use a jetting technique to uncover buried cable. Grapnels penetrate the seabed without jetting to pick up, cut and recover the cable. The cable ends will be recovered to the vessel, using diver, ROV or gripper grapnels. While one subsea cable end is repaired on the vessel, the other end will be attached to a rope that is lowered to seabed and this rope will be attached to a buoy to mark its location;
Cable Splice and Repair: Damaged subsea cable section will be cut out. First one end will be spliced to the spare repair cable section and electrical and optical testing conducted to ensure the integrity of the splice and cables. Then the second subsea cable end will be picked up and spliced back to the repair cable section. Upon completion, the cable integrity will be confirmed through end-to-end electrical and optical testing;
Replacement of Repaired Subsea Cable: Once the subsea cable has been fully repaired and connected, it will be lowered onto the seabed, along the ‘as-laid’ subsea cable route. Once the repaired subsea cable is in the ‘as-laid’ cable route alignment, a diver or ROV will perform an inspection of the repair area, including determining the beginning and ending of unburied subsea cable; and
Post-Lay Inspection and Burial (PLIB): Should burial at the repair area be necessary, it will be carried out to best endeavours or pre-determined target depth, using diver or ROV jetting up to 2 m. If burial is not possible, other means of protection may be considered such as articulated piping, URADUCT® or other means such as rock dumping. One final diver or ROV inspection will be carried out before repair works are completed.
In the Southern Africa region, there are dedicated repair ships on standby to respond to any emergency repairs.
The terrestrial route will typically be maintained in the following manner.
The CLS shall be a manned station.
Scheduled routine route patrols shall be carried out.
In the event of notified or emergency excavation works being carried out by external entities; the affected area shall be deemed as a “hot spot”, and the frequency of route patrols shall be increased dependent upon the severity of the assessed risks.
In the event of a fibre break or deterioration on the terrestrial portion, Optical fibre fault location tools shall be used to determine the exact location of the break or damage.
Maintenance contractors shall be deployed to the affected area. If required, excavation via hand tools (e.g., Picks and shovels) to expose the damaged cable. A new optical fibre joint may need to be used to repair the fibre break. The cable will be re-spliced and tested to ensure the cable is within operating specifications.
The break may require a span of cable to be replaced should optimal operating conditions not be reached. The affected span of the cable shall be replaced with new cable via normal fibre floating methodology.
The cable will be re-spliced and tested in the dedicated splicing manholes to ensure the integrity of the joints remain within specifications.
The damaged cable shall be disposed as determined in the Waste Management Plans.
www.erm.com Project No.: 0482086 Client: ASN and Liquid Telecom Page 43
METISS FINAL EIA REPORT PROJECT DESCRIPTION
2.5.4 Employment Opportunities
During the installation of the subsea cable system, a few temporary jobs are expected to be created. Although numerous skilled workers will be imported to undertake the installation of the system, some jobs will be available to local community members during the installation phase. Specific measures will be put in place to ensure job opportunities for local communities.
It is estimated that a maximum of 370 temporary jobs will be available to the local labour force, given that the majority of the opportunities will be filled by vessel contractors during the construction phase of the project. These opportunities will only be available for 3 to 4 months.
During the operation of the cable, the proposed Project is not expected to create many jobs. With the work force at the CLS comprising of a handful if individuals who will be responsible for the operation and maintenance of the cable system.
2.5.5 Decommissioning
Decommissioning of the system would usually involve demolition and recovery and removal of terrestrial components. The subsea portion of the subsea cable could be recovered and removed along certain segments if required, and abandonment in place along others. The METISS subsea cable system, will not however, be removed. The subsea portion of the cable is likely be retired in place, as per current global industry practice.
The following steps shall be undertaken for decommissioning:
To ensure that due consideration is given to all alternatives a detailed evaluation of facilities decommissioning options will be carried out. The evaluation will consider environmental issues in conjunction with technical, safety and cost implications to establish the best practicable environmental options for the decommissioning of the cable and associated infrastructure.
A risk assessment will also be conducted to ensure that nothing which could be constituted as a hazard for other users of the area or for the environment in general will be left at the site. The site will be left in a safe and environmentally acceptable condition.
The appropriate authorities shall be consulted and notified of the system status (including if the system is retired in place).
A detailed Project Decommissioning Plan will be developed as the Project nears the end of its lifetime.
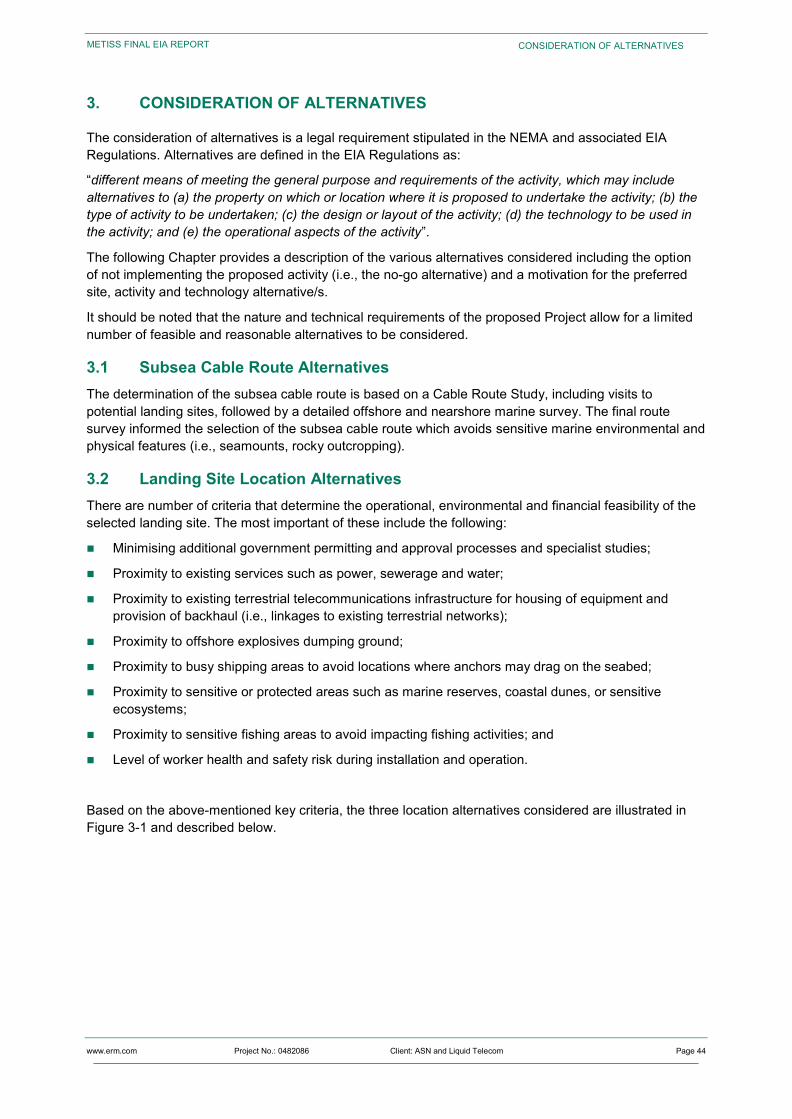
www.erm.com Project No.: 0482086 Client: ASN and Liquid Telecom Page 44
METISS FINAL EIA REPORT CONSIDERATION OF ALTERNATIVES
3. CONSIDERATION OF ALTERNATIVES
The consideration of alternatives is a legal requirement stipulated in the NEMA and associated EIA Regulations. Alternatives are defined in the EIA Regulations as:
“different means of meeting the general purpose and requirements of the activity, which may include alternatives to (a) the property on which or location where it is proposed to undertake the activity; (b) the type of activity to be undertaken; (c) the design or layout of the activity; (d) the technology to be used in the activity; and (e) the operational aspects of the activity”.
The following Chapter provides a description of the various alternatives considered including the option of not implementing the proposed activity (i.e., the no-go alternative) and a motivation for the preferred site, activity and technology alternative/s.
It should be noted that the nature and technical requirements of the proposed Project allow for a limited number of feasible and reasonable alternatives to be considered.
3.1 Subsea Cable Route Alternatives The determination of the subsea cable route is based on a Cable Route Study, including visits to potential landing sites, followed by a detailed offshore and nearshore marine survey. The final route survey informed the selection of the subsea cable route which avoids sensitive marine environmental and physical features (i.e., seamounts, rocky outcropping).
3.2 Landing Site Location Alternatives There are number of criteria that determine the operational, environmental and financial feasibility of the selected landing site. The most important of these include the following:
Minimising additional government permitting and approval processes and specialist studies;
Proximity to existing services such as power, sewerage and water;
Proximity to existing terrestrial telecommunications infrastructure for housing of equipment and provision of backhaul (i.e., linkages to existing terrestrial networks);
Proximity to offshore explosives dumping ground;
Proximity to busy shipping areas to avoid locations where anchors may drag on the seabed;
Proximity to sensitive or protected areas such as marine reserves, coastal dunes, or sensitive ecosystems;
Proximity to sensitive fishing areas to avoid impacting fishing activities; and
Level of worker health and safety risk during installation and operation.
Based on the above-mentioned key criteria, the three location alternatives considered are illustrated in Figure 3-1 and described below.
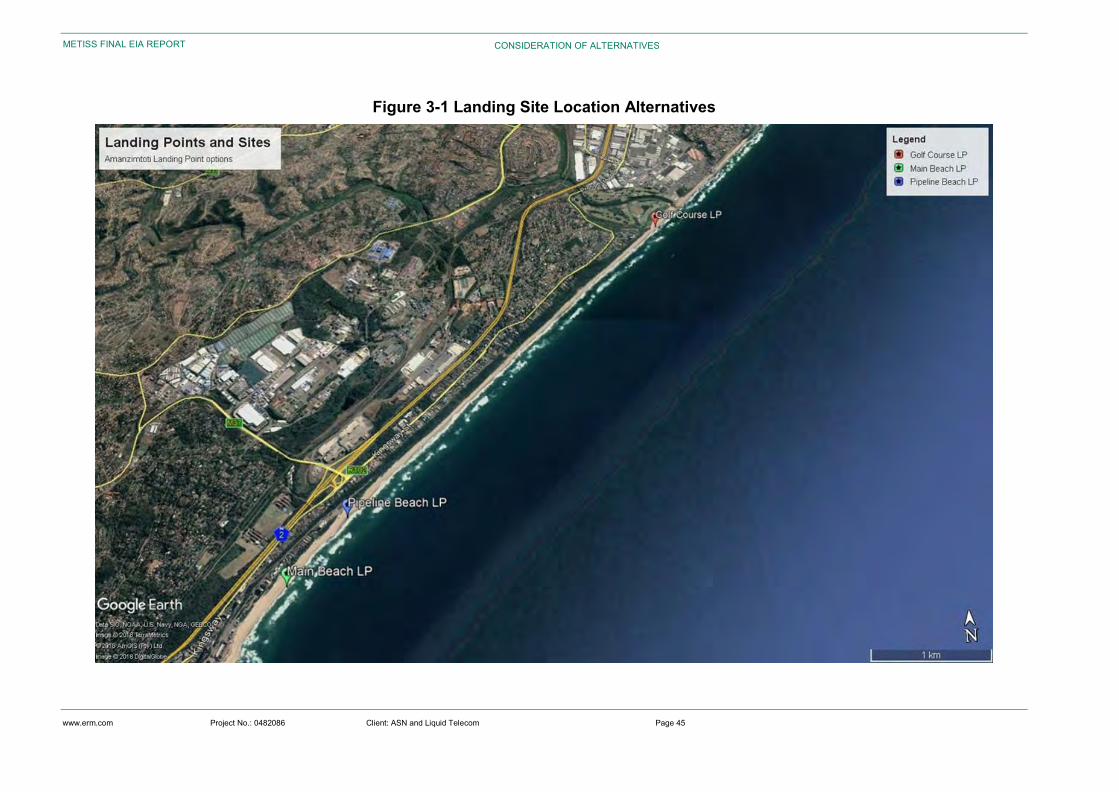
www.erm.com Project No.: 0482086 Client: ASN and Liquid Telecom Page 45
METISS FINAL EIA REPORT CONSIDERATION OF ALTERNATIVES
Figure 3-1 Landing Site Location Alternatives
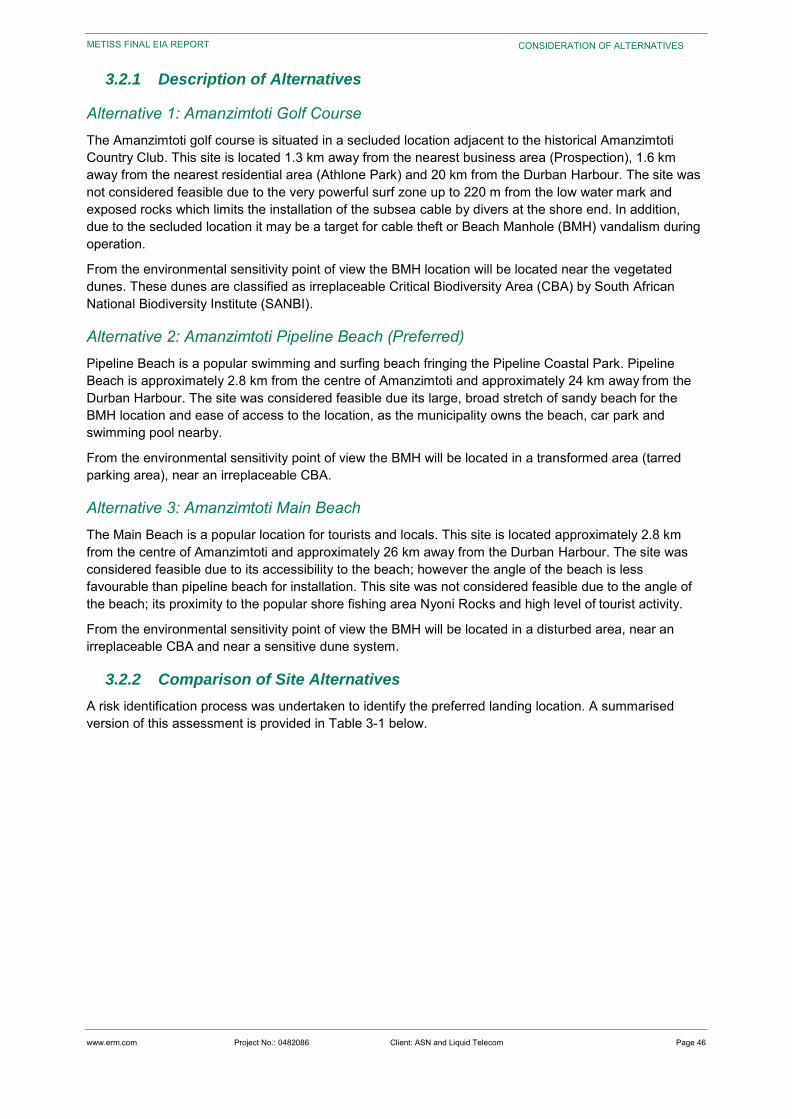
www.erm.com Project No.: 0482086 Client: ASN and Liquid Telecom Page 46
METISS FINAL EIA REPORT CONSIDERATION OF ALTERNATIVES
3.2.1 Description of Alternatives
Alternative 1: Amanzimtoti Golf Course The Amanzimtoti golf course is situated in a secluded location adjacent to the historical Amanzimtoti Country Club. This site is located 1.3 km away from the nearest business area (Prospection), 1.6 km away from the nearest residential area (Athlone Park) and 20 km from the Durban Harbour. The site was not considered feasible due to the very powerful surf zone up to 220 m from the low water mark and exposed rocks which limits the installation of the subsea cable by divers at the shore end. In addition, due to the secluded location it may be a target for cable theft or Beach Manhole (BMH) vandalism during operation.
From the environmental sensitivity point of view the BMH location will be located near the vegetated dunes. These dunes are classified as irreplaceable Critical Biodiversity Area (CBA) by South African National Biodiversity Institute (SANBI).
Alternative 2: Amanzimtoti Pipeline Beach (Preferred) Pipeline Beach is a popular swimming and surfing beach fringing the Pipeline Coastal Park. Pipeline Beach is approximately 2.8 km from the centre of Amanzimtoti and approximately 24 km away from the Durban Harbour. The site was considered feasible due its large, broad stretch of sandy beach for the BMH location and ease of access to the location, as the municipality owns the beach, car park and swimming pool nearby.
From the environmental sensitivity point of view the BMH will be located in a transformed area (tarred parking area), near an irreplaceable CBA.
Alternative 3: Amanzimtoti Main Beach The Main Beach is a popular location for tourists and locals. This site is located approximately 2.8 km from the centre of Amanzimtoti and approximately 26 km away from the Durban Harbour. The site was considered feasible due to its accessibility to the beach; however the angle of the beach is less favourable than pipeline beach for installation. This site was not considered feasible due to the angle of the beach; its proximity to the popular shore fishing area Nyoni Rocks and high level of tourist activity.
From the environmental sensitivity point of view the BMH will be located in a disturbed area, near an irreplaceable CBA and near a sensitive dune system.
3.2.2 Comparison of Site Alternatives
A risk identification process was undertaken to identify the preferred landing location. A summarised version of this assessment is provided in Table 3-1 below.
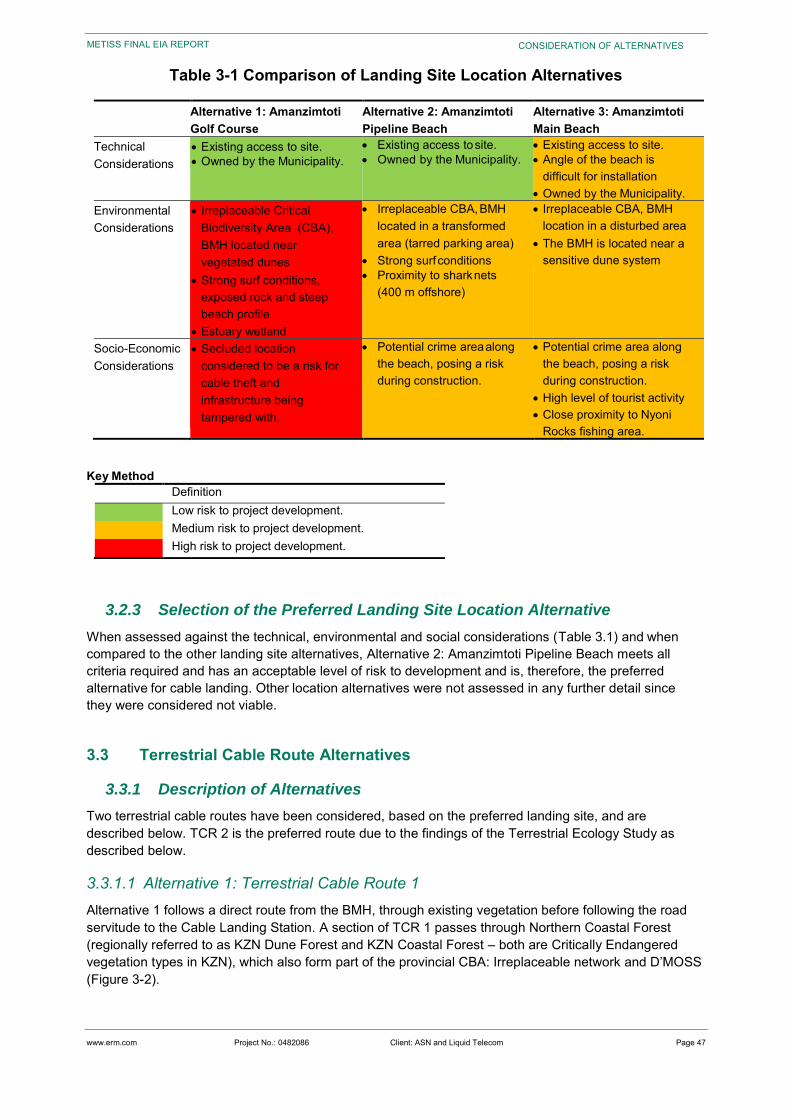
www.erm.com Project No.: 0482086 Client: ASN and Liquid Telecom Page 47
METISS FINAL EIA REPORT CONSIDERATION OF ALTERNATIVES
Table 3-1 Comparison of Landing Site Location Alternatives
Alternative 1: Amanzimtoti Golf Course
Alternative 2: Amanzimtoti Pipeline Beach
Alternative 3: Amanzimtoti Main Beach
Technical Considerations
Existing access to site. Owned by the Municipality.
Existing access to site. Owned by the Municipality.
Existing access to site. Angle of the beach is
difficult for installation Owned by the Municipality.
Environmental Considerations
Irreplaceable Critical Biodiversity Area (CBA), BMH located near vegetated dunes
Strong surf conditions, exposed rock and steep beach profile
Estuary wetland
Irreplaceable CBA, BMH located in a transformed area (tarred parking area)
Strong surf conditions Proximity to shark nets
(400 m offshore)
Irreplaceable CBA, BMH location in a disturbed area
The BMH is located near a sensitive dune system
Socio-Economic Considerations
Secluded location considered to be a risk for cable theft and infrastructure being tampered with.
Potential crime area along the beach, posing a risk during construction.
Potential crime area along the beach, posing a risk during construction.
High level of tourist activity Close proximity to Nyoni
Rocks fishing area.
Key Method
Definition
Low risk to project development.
Medium risk to project development.
High risk to project development.
3.2.3 Selection of the Preferred Landing Site Location Alternative
When assessed against the technical, environmental and social considerations (Table 3.1) and when compared to the other landing site alternatives, Alternative 2: Amanzimtoti Pipeline Beach meets all criteria required and has an acceptable level of risk to development and is, therefore, the preferred alternative for cable landing. Other location alternatives were not assessed in any further detail since they were considered not viable.
3.3 Terrestrial Cable Route Alternatives
3.3.1 Description of Alternatives
Two terrestrial cable routes have been considered, based on the preferred landing site, and are described below. TCR 2 is the preferred route due to the findings of the Terrestrial Ecology Study as described below.
3.3.1.1 Alternative 1: Terrestrial Cable Route 1 Alternative 1 follows a direct route from the BMH, through existing vegetation before following the road servitude to the Cable Landing Station. A section of TCR 1 passes through Northern Coastal Forest (regionally referred to as KZN Dune Forest and KZN Coastal Forest – both are Critically Endangered vegetation types in KZN), which also form part of the provincial CBA: Irreplaceable network and D’MOSS (Figure 3-2).
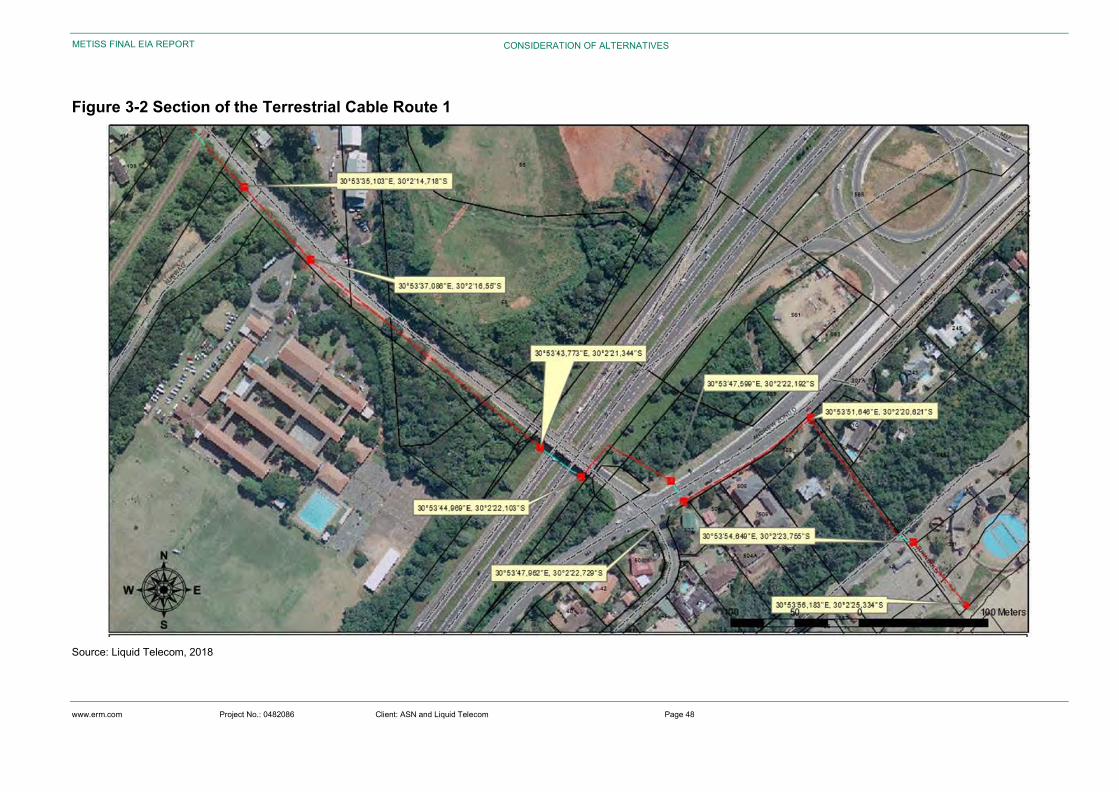
www.erm.com Project No.: 0482086 Client: ASN and Liquid Telecom Page 48
METISS FINAL EIA REPORT CONSIDERATION OF ALTERNATIVES
Figure 3-2 Section of the Terrestrial Cable Route 1
Source: Liquid Telecom, 2018
www.erm.com Project No.: 0482086 Client: ASN and Liquid Telecom Page 49
METISS FINAL EIA REPORT CONSIDERATION OF ALTERNATIVES
3.3.1.2 Alternative 2: Terrestrial Cable Route 2 (Preferred) Route alternative 2 is a longer route, as it follows the road servitude in order to limit disturbance of natural vegetation (Figure 3-3) to the Cable Landing Station. TCR 2 largely traverses the existing road network and smaller fragments of mostly degraded vegetation. Terrestrial Cable Route Alternative 2 is presented in Figure 3-3, Figure 3-4 and Figure 3-5.
Following the submission of the Final Scoping Report, the road crossing for TCR 2 along the N2 was re-aligned i.e., moved 20 meters North of the Umdoni Road Bridge (Figure 3-5). This was due to comments received from South African National Roads Agency regarding the technical considerations for approval of the wayleave application. The terrestrial ecologist has incorporated the road crossing re-alignment into the terrestrial ecology specialist study. The specialist has confirmed that this re-alignment will not change the overall assessment of impacts on terrestrial ecology presented in this report.
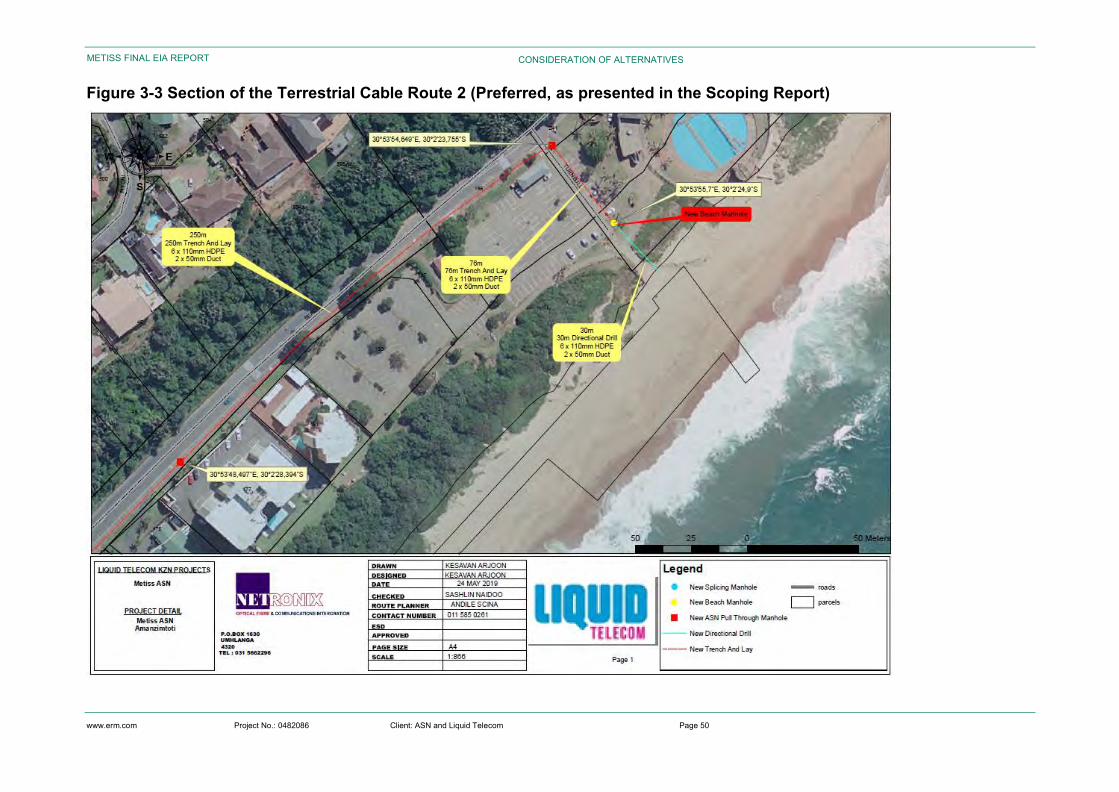
www.erm.com Project No.: 0482086 Client: ASN and Liquid Telecom Page 50
METISS FINAL EIA REPORT CONSIDERATION OF ALTERNATIVES
Figure 3-3 Section of the Terrestrial Cable Route 2 (Preferred, as presented in the Scoping Report)
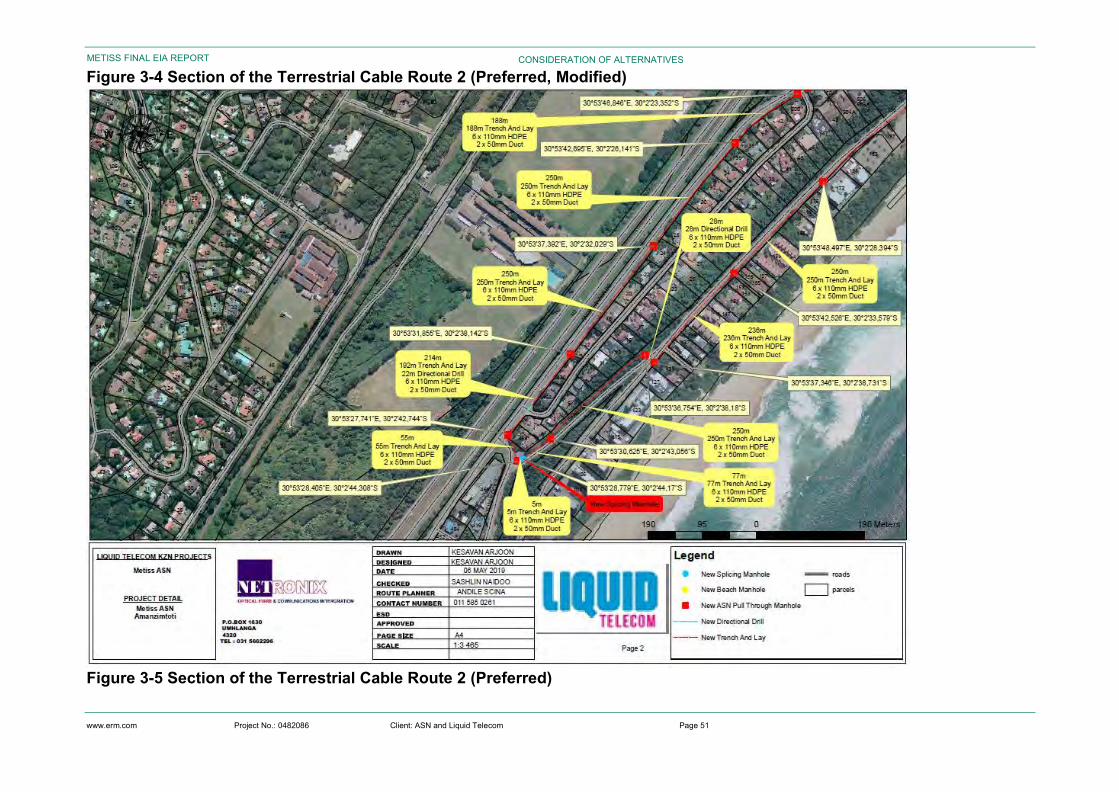
www.erm.com Project No.: 0482086 Client: ASN and Liquid Telecom Page 51
METISS FINAL EIA REPORT CONSIDERATION OF ALTERNATIVES
Figure 3-4 Section of the Terrestrial Cable Route 2 (Preferred, Modified)
Figure 3-5 Section of the Terrestrial Cable Route 2 (Preferred)
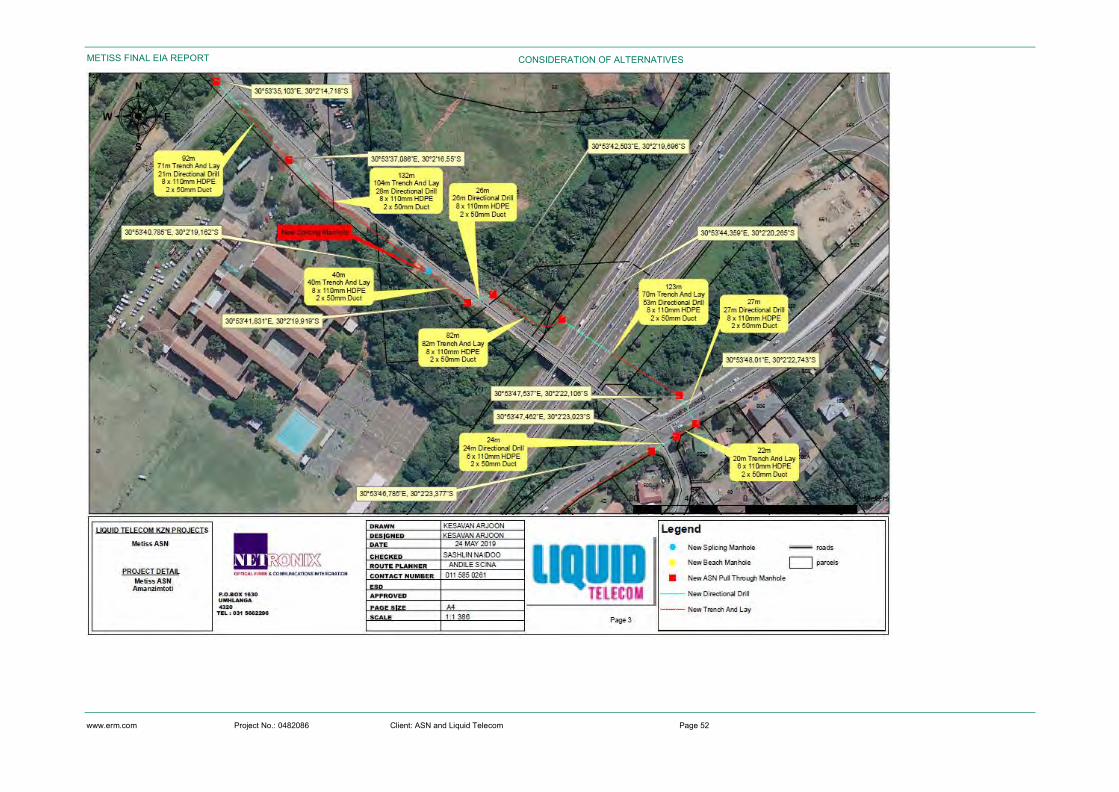
www.erm.com Project No.: 0482086 Client: ASN and Liquid Telecom Page 52
METISS FINAL EIA REPORT CONSIDERATION OF ALTERNATIVES
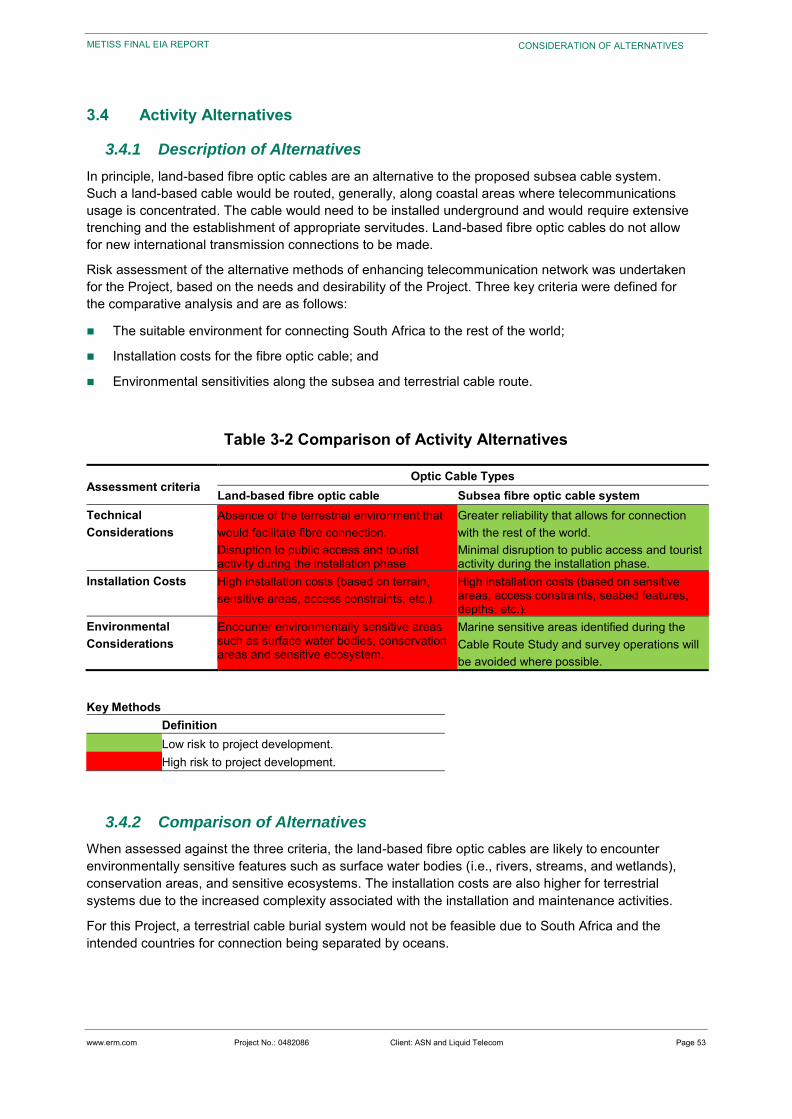
www.erm.com Project No.: 0482086 Client: ASN and Liquid Telecom Page 53
METISS FINAL EIA REPORT CONSIDERATION OF ALTERNATIVES
3.4 Activity Alternatives
3.4.1 Description of Alternatives
In principle, land-based fibre optic cables are an alternative to the proposed subsea cable system. Such a land-based cable would be routed, generally, along coastal areas where telecommunications usage is concentrated. The cable would need to be installed underground and would require extensive trenching and the establishment of appropriate servitudes. Land-based fibre optic cables do not allow for new international transmission connections to be made.
Risk assessment of the alternative methods of enhancing telecommunication network was undertaken for the Project, based on the needs and desirability of the Project. Three key criteria were defined for the comparative analysis and are as follows:
The suitable environment for connecting South Africa to the rest of the world;
Installation costs for the fibre optic cable; and
Environmental sensitivities along the subsea and terrestrial cable route.
Table 3-2 Comparison of Activity Alternatives
Assessment criteria Optic Cable Types
Land-based fibre optic cable Subsea fibre optic cable system Technical Considerations
Absence of the terrestrial environment that would facilitate fibre connection. Disruption to public access and tourist activity during the installation phase.
Greater reliability that allows for connection with the rest of the world. Minimal disruption to public access and tourist activity during the installation phase.
Installation Costs High installation costs (based on terrain, sensitive areas, access constraints, etc.).
High installation costs (based on sensitive areas, access constraints, seabed features, depths, etc.).
Environmental Considerations
Encounter environmentally sensitive areas such as surface water bodies, conservation areas and sensitive ecosystem.
Marine sensitive areas identified during the Cable Route Study and survey operations will be avoided where possible.
Key Methods Definition Low risk to project development. High risk to project development.
3.4.2 Comparison of Alternatives
When assessed against the three criteria, the land-based fibre optic cables are likely to encounter environmentally sensitive features such as surface water bodies (i.e., rivers, streams, and wetlands), conservation areas, and sensitive ecosystems. The installation costs are also higher for terrestrial systems due to the increased complexity associated with the installation and maintenance activities.
For this Project, a terrestrial cable burial system would not be feasible due to South Africa and the intended countries for connection being separated by oceans.
www.erm.com Project No.: 0482086 Client: ASN and Liquid Telecom Page 54
METISS FINAL EIA REPORT CONSIDERATION OF ALTERNATIVES
A subsea cable system with its perceived relatively lower impact and greater reliability allows for connection with the rest of the world, therefore, offers the best option to achieve the Project’s objectives of improving telecommunication services. These factors make the subsea cable system the preferred activity alternative for the Project.
As a result, this is the only activity alternative being taken forward to the Impact Assessment Phase.
3.5 Technology Alternatives
3.5.1 System Earth
The System Earth (also called an Ocean Ground Bed or earth array) is required to provide an earthen electrical ground for the subsea cable. It would consist of either a number of rods (rod-type array) installed in the car park area or a metal plate (sea earth plate) installed in the saturated soil close to the water line.
Due to difficulties in finding suitable separation from existing infrastructure near the BMH location and existing electricity lines, the beach earth alternative will be confirmed after tests have been conducted, prior to construction.
3.5.2 Subsea Cable Installation at the Shore Crossing
In terms of installation technology alternatives, two alternatives for installation of the subsea cable at the shoreline are under consideration:
Alternative 1: Trenching (preferred);
Alternative 2: Combination of Horizontal Directional Drilling and Trenching).
Alternative 1: Trenching (Preferred) In this alternative, the installation of the beach section will entail digging of a trench to a depth of 1 m to 3 m below the ground level (or until bedrock is reached) using a backhoe digger and hand tools. The trench will be dug along the existing beach access pathway, down to the beach into the intertidal zone. This differs from that which uses a combination of trenching and Horizontal Directional Drilling as described below.
Trenching and backfilling will entail the excavation and deposition of approximately 5 cubic metres of material per linear metre of trench. The subsea cable will be placed in the trench and covered. Excavated material will be reused to fill in the trench. Seaward ducts will be connected to the Beach Manhole (BMH) and installed in a trench for approximately 0.5 – 1 m, to allow connection of the marine cable from the beach.
Articulated pipe will be used as additional protection for the subsea cable from the Low Water Mark (LWM) to the BMH. The articulated pipe has a maximum external diameter of 130 mm and will be buried on the beach to a target depth of 3 m or until bedrock. The subsea cable splits inside the BMH after the anchoring point.
Once the subsea cable is landed and pulled through to the BMH, cable testing will be performed to ensure the subsea cable system is working. The terrestrial cable team will join the cable to the terrestrial cable at the BMH, the transition between subsea cable and terrestrial cable.
Alternative 2: Horizontal Directional Drilling (HDD) and Trenching For the connection to the BMH via seaward ducts, the alternative for HDD would entail drilling from the BMH under the dunes and vegetation to the high water mark (HWM) on the beach.
www.erm.com Project No.: 0482086 Client: ASN and Liquid Telecom Page 55
METISS FINAL EIA REPORT CONSIDERATION OF ALTERNATIVES
The construction activities will entail installation of a new 100 mm internal diameter duct from the BMH location. HDD may also be required for the system earth cable. HDD is a trenchless, boring method for installing underground cables, pipes and conduits in a shallow curve along a prescribed bore path with the use of a surface-launched rig/machine, which minimises the disruption of the surrounding area
Prior to the construction work, geotechnical investigations including taking soil samples at the landing site may take place up to a month prior to HDD drilling. The purpose of the investigations is to survey the drill entry and exit points and the drill path. The geotechnical investigations will include topographic surface elevations, foreign lines, and obstructions. Coring analysis will be performed to check the composition of the soil and sand. The coring will inform the selection of the type of drill head to improve drilling progress and safety.
The rest of the shoreline crossing into the intertidal area would be completed using a trenching method.
3.5.3 Terrestrial Cable from BMH to CLS
Two alternatives for installation of the terrestrial cable from the BMH to the CLS were considered:
Alternative 1: Trenching only; and
Alternative 2: Combination of Horizontal Directional Drilling and Trenching (preferred).
Alternative 1: Trenching only This method of installation of subsea cable entails digging a trench in the ground to install cables underground. When the installation of the cable is completed, the trench is backfilled with the excavated material, and disturbed ground is returned to its original state, insofar as possible.
The trenching of the entire terrestrial cable route would result in destruction of roads as well as sensitive vegetation and dune ecosystems.
Alternative 2: Horizontal Directional Drilling (HDD) and Trenching (Preferred) Horizontal Directional Drilling (HDD) is a method of installing underground cables through trenchless methods. It involves the use of a directional drilling machine to accurately drill along the chosen bore path and back ream the cable. HDD will allow for the installation of the terrestrial cable underneath road infrastructure and sensitive areas, without breaking up the surfaces.
This alternative will involve drilling where the terrestrial cable route crosses roads or sensitive vegetation which will lead to less disturbance to traffic and to the Amanzimtoti community.
Prior to the construction work, geotechnical investigations including taking soil samples at the BMH may take place up to a month prior to HDD drilling. The purpose of the investigations is to survey the drill entry and exit points and the drill path. The geotechnical investigations will include topographic surface elevations, foreign lines, and obstructions. Coring analysis will be performed to check the composition of the soil and sand. The coring will inform the selection of the type of drill head to improve drilling progress and safety.
The rest of the terrestrial cable route would be completed using a trenching method.
3.5.4 Impacts Associated with the Technology Alternatives Identified
The technology alternatives considered are discussed below. Two technology alternatives for installation of both the subsea cable and terrestrial cable are considered for this Project, Alternative 1 being trenching and Alternative 2 a combination of HDD and trenching.
A risk identification process was undertaken to identify the preferred technology alternative for both the subsea cable and the terrestrial cable. A summarised version of this assessment is provided in Table 3-3 and Table 3-4..
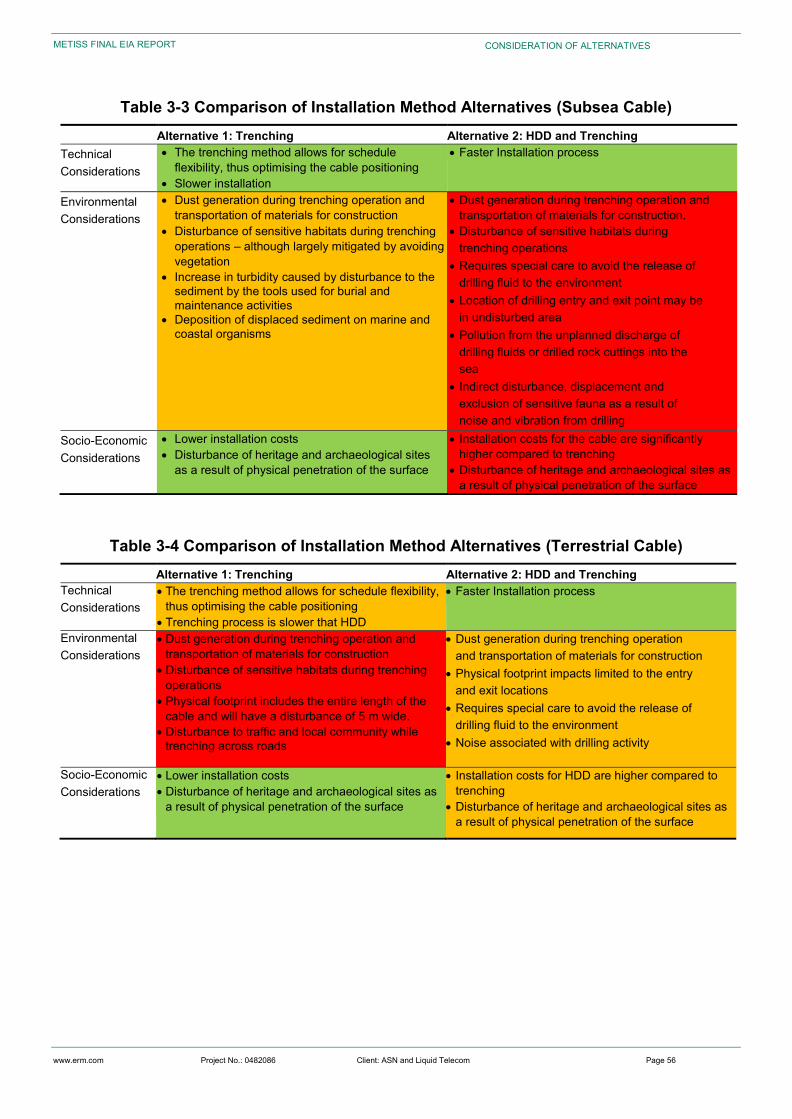
www.erm.com Project No.: 0482086 Client: ASN and Liquid Telecom Page 56
METISS FINAL EIA REPORT CONSIDERATION OF ALTERNATIVES
Table 3-3 Comparison of Installation Method Alternatives (Subsea Cable) Alternative 1: Trenching Alternative 2: HDD and Trenching Technical Considerations
The trenching method allows for schedule flexibility, thus optimising the cable positioning
Slower installation
Faster Installation process
Environmental Considerations
Dust generation during trenching operation and transportation of materials for construction
Disturbance of sensitive habitats during trenching operations – although largely mitigated by avoiding vegetation
Increase in turbidity caused by disturbance to the sediment by the tools used for burial and maintenance activities
Deposition of displaced sediment on marine and coastal organisms
Dust generation during trenching operation and transportation of materials for construction.
Disturbance of sensitive habitats during trenching operations
Requires special care to avoid the release of drilling fluid to the environment
Location of drilling entry and exit point may be in undisturbed area
Pollution from the unplanned discharge of drilling fluids or drilled rock cuttings into the sea
Indirect disturbance, displacement and exclusion of sensitive fauna as a result of noise and vibration from drilling
Socio-Economic Considerations
Lower installation costs Disturbance of heritage and archaeological sites
as a result of physical penetration of the surface
Installation costs for the cable are significantly higher compared to trenching
Disturbance of heritage and archaeological sites as a result of physical penetration of the surface
Table 3-4 Comparison of Installation Method Alternatives (Terrestrial Cable) Alternative 1: Trenching Alternative 2: HDD and Trenching Technical Considerations
The trenching method allows for schedule flexibility, thus optimising the cable positioning
Trenching process is slower that HDD
Faster Installation process
Environmental Considerations
Dust generation during trenching operation and transportation of materials for construction
Disturbance of sensitive habitats during trenching operations
Physical footprint includes the entire length of the cable and will have a disturbance of 5 m wide.
Disturbance to traffic and local community while trenching across roads
Dust generation during trenching operation and transportation of materials for construction
Physical footprint impacts limited to the entry and exit locations
Requires special care to avoid the release of drilling fluid to the environment
Noise associated with drilling activity
Socio-Economic Considerations
Lower installation costs Disturbance of heritage and archaeological sites as
a result of physical penetration of the surface
Installation costs for HDD are higher compared to trenching
Disturbance of heritage and archaeological sites as a result of physical penetration of the surface
www.erm.com Project No.: 0482086 Client: ASN and Liquid Telecom Page 57
METISS FINAL EIA REPORT CONSIDERATION OF ALTERNATIVES
3.6 No-Go Alternative Under the no-go alternative, the proposed Project would not be executed. Assuming that no other subsea cable system was installed, in this scenario, the region would continue to be constrained by the lack of telecommunications capacity, especially in the area of international data transfer. This could hinder economic growth and cause South Africa to become increasingly more isolated from the global community, as sophisticated data transfer mechanisms are employed elsewhere that South Africa would not be able to access.
Should the no-go alternative be selected, METISS would not be able to facilitate an improved communication capacity and internet service to South Africa.
www.erm.com Project No.: 0482086 Client: ASN and Liquid Telecom Page 58
METISS FINAL EIA REPORT ADMINISTRATIVE FRAMEWORK
4. ADMINISTRATIVE FRAMEWORK
4.1 Introduction This section provides an overview of legislation, guidelines and information documents that have informed the scope and content of this report as well as the approach to the Environmental Impact Assessment (EIA) process.
4.2 Environmental Authorisation Legislative Process The Environmental Authorisation (EA) process in South Africa is governed by the National Environmental Management Act (Act 107 of 1998), as amended (NEMA), as well as the 2014 EIA Regulations GN R.326 (April 2014, as amended) (2014 EIA Regulations). The relevant legislation is summarised below.
4.2.1 NEMA Environmental Authorisation
Chapter 5 of NEMA outlines the general objectives and implementation of Integrated Environmental Management. This provides a framework for the integration of environmental issues into the planning, design, decision-making and implementation of plans and projects that are likely to have a detrimental effect on the environment. Whilst Section 23 sets out the basic objectives and principles of the Integrated Environmental Management procedure, Section 24 sets out how these objectives and principles are to be accomplished.
Regulations governing the environmental authorisation process have been promulgated in terms of NEMA and include the following:
Environmental Impact Assessment Regulations (GNR 326);
Environmental Impact Assessment Regulations Listing Notice 1 (GNR 327);
Environmental Impact Assessment Regulations Listing Notice 2 (GNR 325); and
Environmental Impact Assessment Regulations Listing Notice 3 (GNR 324).
Activities triggered in GNR 327 and GNR 324 require a Basic Assessment Report (BAR) process to be undertaken, whereas activities identified in terms of GNR 325 will require a full Scoping and Environmental Impact Assessment process. GNR 326 sets out the general procedure to follow when conducting either a BAR or EIA process.
Numerous trigger activities have been identified for this Project in terms of all the NEMA listing notices (Table 4.1). In instances where all the listing notices are triggered (as in this Project), GNR 325 requirements will take precedent and the Project will be subject to a full Scoping & Environmental Impact Assessment process prior to commencement of any of the associated activities.
Section 24(C) of the Act defines the competent decision-making authority, which is normally the provincial environmental department. However, in cases where the Project footprint transverses territorial boundaries, the National DEA becomes the competent authority’.
Table 4.1 lists the potential listed activities from the 2014 EIA Regulations Listing Notices 1 and 2 for the Project.
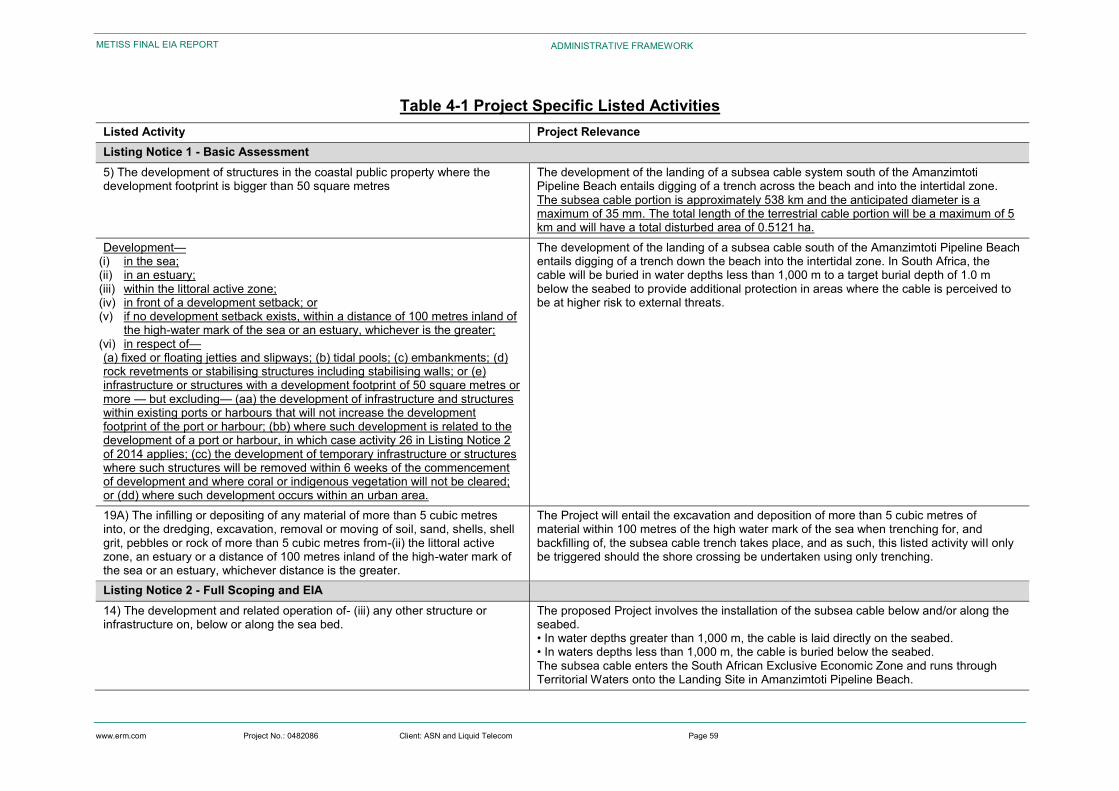
www.erm.com Project No.: 0482086 Client: ASN and Liquid Telecom Page 59
METISS FINAL EIA REPORT ADMINISTRATIVE FRAMEWORK
Table 4-1 Project Specific Listed Activities Listed Activity Project Relevance Listing Notice 1 - Basic Assessment 5) The development of structures in the coastal public property where the development footprint is bigger than 50 square metres
The development of the landing of a subsea cable system south of the Amanzimtoti Pipeline Beach entails digging of a trench across the beach and into the intertidal zone. The subsea cable portion is approximately 538 km and the anticipated diameter is a maximum of 35 mm. The total length of the terrestrial cable portion will be a maximum of 5 km and will have a total disturbed area of 0.5121 ha.
Development— (i) in the sea; (ii) in an estuary; (iii) within the littoral active zone; (iv) in front of a development setback; or (v) if no development setback exists, within a distance of 100 metres inland of
the high-water mark of the sea or an estuary, whichever is the greater; (vi) in respect of— (a) fixed or floating jetties and slipways; (b) tidal pools; (c) embankments; (d) rock revetments or stabilising structures including stabilising walls; or (e) infrastructure or structures with a development footprint of 50 square metres or more — but excluding— (aa) the development of infrastructure and structures within existing ports or harbours that will not increase the development footprint of the port or harbour; (bb) where such development is related to the development of a port or harbour, in which case activity 26 in Listing Notice 2 of 2014 applies; (cc) the development of temporary infrastructure or structures where such structures will be removed within 6 weeks of the commencement of development and where coral or indigenous vegetation will not be cleared; or (dd) where such development occurs within an urban area.
The development of the landing of a subsea cable south of the Amanzimtoti Pipeline Beach entails digging of a trench down the beach into the intertidal zone. In South Africa, the cable will be buried in water depths less than 1,000 m to a target burial depth of 1.0 m below the seabed to provide additional protection in areas where the cable is perceived to be at higher risk to external threats.
19A) The infilling or depositing of any material of more than 5 cubic metres into, or the dredging, excavation, removal or moving of soil, sand, shells, shell grit, pebbles or rock of more than 5 cubic metres from-(ii) the littoral active zone, an estuary or a distance of 100 metres inland of the high-water mark of the sea or an estuary, whichever distance is the greater.
The Project will entail the excavation and deposition of more than 5 cubic metres of material within 100 metres of the high water mark of the sea when trenching for, and backfilling of, the subsea cable trench takes place, and as such, this listed activity will only be triggered should the shore crossing be undertaken using only trenching.
Listing Notice 2 - Full Scoping and EIA 14) The development and related operation of- (iii) any other structure or infrastructure on, below or along the sea bed.
The proposed Project involves the installation of the subsea cable below and/or along the seabed. • In water depths greater than 1,000 m, the cable is laid directly on the seabed. • In waters depths less than 1,000 m, the cable is buried below the seabed. The subsea cable enters the South African Exclusive Economic Zone and runs through Territorial Waters onto the Landing Site in Amanzimtoti Pipeline Beach.
www.erm.com Project No.: 0482086 Client: ASN and Liquid Telecom Page 60
METISS FINAL EIA REPORT ADMINISTRATIVE FRAMEWORK
4.3 Other Applicable Legislation, Polices and/or Guidelines
4.3.1 National Legislation
National environmental legislation relevant to the Project (in addition to those presented in preceding sections) is listed below.
Constitution of the Republic of South Africa (Act No. 108 of 1996);
National Environmental Management: Biodiversity Act (Act No. 10 of 2004);
National Environmental Management: Protected Areas Act (Act No. 57 of 2003);
National Environmental Management: Integrated Coastal Management Act (Act No. 24 of 2008);
Telecommunications Act (Act No. 103 of 1996);
Marine Traffic Act (Act No. 2 of 1981);
Marine Living Resources Act (Act No.18 of 1998);
Maritime Zones Act (Act No.15 of 1994);
National Ports Act (Act No.12 of 2005);
National Water Act (Act 36 of 1998);
National Heritage Resources Act (Act No. 25 of 1999); and
White Paper for Sustainable Coastal Development in South Africa (2000).
Applicable provisions from these laws and regulations will be incorporated into the design and implementation of the Project. These laws are described below.
4.3.1.1 Constitution of the Republic of South Africa (Act 108 of 1996) South African law, including environmental law, is underpinned by the Constitution (No. 108 of 1996) which promotes specific moral, social and political values. The Constitution is the highest law of the land, and all South African law has to follow in the spirit of the Constitution.
The Constitution commits to the establishment of a society based on democratic values, social justice and fundamental human rights through improving the quality of life of all citizens and realising the potential of each person. Sections 7, 8 and 24 of the Bill of Rights give constitutional force to sustainable development and provide that all people in South Africa have the right to a clean and healthy environment.
These sections oblige government to pass reasonable legislation to protect the environment, prevent pollution and ecological degradation, and secure sustainable development.
4.3.1.2 National Environmental Management: Biodiversity Act 10 of 2004 Amongst other objectives, this Act seeks to provide for the management and conservation of biological diversity and its components, the sustainable use of indigenous biological resources, and the fair and equitable sharing of benefits arising from bio-prospecting of indigenous biological resources. It further seeks to provide for co-operative governance in biodiversity management and conservation.
Chapter 1 provides that the Act give effect to conventions affecting biodiversity to which South Africa is a party. These would include the United Nations Convention on Biological Diversity (CBD), the Convention on Trade in Endangered Species (CITES), and the Bonn Convention.
Significantly, the Act provides for the protection of ecosystems and species that are threatened or in need of protection and seeks to prevent the introduction and spread of alien or invasive species. As such, it controls and regulates:
www.erm.com Project No.: 0482086 Client: ASN and Liquid Telecom Page 61
METISS FINAL EIA REPORT ADMINISTRATIVE FRAMEWORK
Certain threatening activities occurring in identified ecosystems;
Certain activities which may negatively impact on the survival of identified threatened or protected species; and
Certain restricted activities involving alien or listed invasive species.
In accordance with the Biodiversity Act, an important function of the EIA Report and associated specialist studies is to ensure that sensitive vegetation is not detrimentally affected by the installation and construction activities associated with the terrestrial components of the subsea cable, including the cable station.
4.3.1.3 National Environmental Management: Protected Areas Act (57 of 2003) This law is commonly known as the Protected Areas Act. It creates a national system of protected areas in order to protect and conserve ecologically viable areas representative of biodiversity in the country. It further seeks to achieve co-operative environmental governance and to promote sustainable and equitable utilisation and community participation.
The legislation requires the State to act as trustee of protected areas, and to implement the Act ‘in partnership with the people' to achieve the progressive realisation of the environmental rights contained in Section 24 of the Constitution.
The statute acknowledges the following types of protected areas: special nature reserves, national parks, nature reserves (including wilderness areas), protected environments, world heritage sites, marine protected areas, specially protected forest areas, forest nature reserves and forest wilderness areas (under the National Forests Act) and mountain catchment areas (under the Mountain Catchment Areas Act). Areas may be declared protected under these various categories in order, for example, to protect highly sensitive, outstanding ecosystems (special nature reserves), if the area is of national or international biodiversity importance (national parks) or has significant features of biodiversity (nature reserve).
Landowners, acting individually or collectively, may request their land to be declared a special nature reserve, national park, nature reserve or protected environment.
There are no protected areas directly impacted by the proposed Project.
4.3.1.4 National Environmental Management: Integrated Coastal Management Act (24 of 2008)
The National Environmental Management: Integrated Coastal Management Act (No. 24 of 2008) (NEMICMA) sets out a system of integrated coastal and estuarine management in South Africa to promote the conservation of the coastal environment and to ensure that the development and the use of natural resources within the coastal zone are socially and economically justifiable and ecologically sustainable. NEMICMA has also provided for the repeal of the former Seashore Act 21 of 1935 and the Dumping at Sea Control Act 73 of 1980.
Section 69 of the NEMICMA prohibits the discharge of effluent that originates from a source on land into coastal waters except in terms of a CWDP issued by the DEA.
The Project does not require a Coastal Water Discharge Permit.
4.3.1.5 Marine Traffic Act (2 of 1981) The function of this Act is to regulate marine traffic in South African waters and matters incidental thereto. It is governed by the South African Maritime Safety Authority (SAMSA) established by Section 2 of the South African Maritime Safety Authority Act 5 of 1998, under the Department of Transport.
www.erm.com Project No.: 0482086 Client: ASN and Liquid Telecom Page 62
METISS FINAL EIA REPORT ADMINISTRATIVE FRAMEWORK
Section 8B(1) of the Act stipulates that it is an offence by “the master or any person on board a ship in charge of the navigation of such ship” if through his act or omission in connection with the navigation of the ship in question, an offshore installation or any part thereof is damaged; the ship, except while rendering an emergency service or previously agreed service to the offshore installation in question, enters a safety zone, or drops or drags anchor nearer than 1 nm to a pipeline or a telecommunications line; or while engaged in fishing, the ship bottom trawls nearer than 1 nm to such a pipeline or telecommunications line. The definition of ‘offshore installation’ includes a telecommunications line as defined in section 1 of the Post Office Act, 1958 (Act No. 44 of 1958).
4.3.1.6 Marine Living Resources Act (18 of 1998) The purpose of this Act is to provide for the conservation of the marine ecosystem, the long-term sustainable utilisation of marine living resources and the orderly access to exploitation, utilisation and protection of certain marine living resources. This Act exercises control over marine living resources to ensure fair and equitable use in a manner that benefit all.
4.3.1.7 Maritime Zones Act (15 of 1994) The purpose of this Act is to determine and define the territorial sea, internal waters, Exclusive Economic Zone (EEZ) and continental shelf of South Africa. In compliance with the United Nation Law of the Sea, the Act declares the territorial sea of South Africa to be the sea within a distance of 12 nautical miles (nm) measured from the low water line. All of the country’s laws shall apply in the territorial sea and the airspace above the territorial waters.
The sea beyond the territorial waters but within 200 nm of the baseline shall be the EEZ of South Africa. Within the EEZ, South Africa shall have the same rights and powers as it has in its territorial waters, in respect of natural resources.
Regarding installations, which are defined to include telecommunications lines as defined in section 1 of the Post Office Act, 1958 (Act No. 44 of 1958), situated within internal waters, territorial waters or the EEZ or on or above the continental shelf. Any law in force in the Republic, including the common law, shall also apply on and in respect of an installation. An installation shall be deemed to be within the district, as defined in section 1 of the Magistrates' Courts Act, 1944 (Act No. 32 of 1944), designated by the Minister of Justice. In the absence of a designation, an installation shall be deemed to be within the district nearest to that installation.
Consequently, the Maritime Zones Act, read with the Post Office Act of 195, ensures that the law governing EIAs in South Africa and any associated conditions of EIA approval are relevant to the entire installation both within and beyond territorial waters up to the boundary of the EEZ.
4.3.1.8 National Ports Act (12 of 2005) This Act provides for the establishment of the National Ports Authority and the Ports Regulator. In terms of the Act, all ports fall under the jurisdiction of the National Ports Authority, which must own, manage, control and administer ports to ensure their efficient and economic functioning. Part of this control includes the control of entry of vessels into ports, and their stay, movements or operations in and departures from ports, as well as the exercise of licensing and controlling functions in respect of port services and port facilities.
4.3.1.9 National Water Act (36 of 1998) Section 21 of the NWA identifies eleven water use types and requires that those who intend to undertake a development which involves one or more of these water uses must apply for authorisation in terms of the Act. The installation of the terrestrial cable triggers Section 21 (c) and (i) and as such, authorisation should be sought. This does not fall within the scope of this EIA Process. Liquid Telecom will conduct a risk matrix assessment to determine whether the risk to the watercourse is High, Medium, Low or No Risk, prior to construction. This will determine whether a Water Use Licence or a General Authorisation is required or whether neither is required.
www.erm.com Project No.: 0482086 Client: ASN and Liquid Telecom Page 63
METISS FINAL EIA REPORT ADMINISTRATIVE FRAMEWORK
4.3.1.10 National Heritage Resources Act (25 of 1999). Section 38 (1) of the NHRA requires any person who intends to undertake a development which exceeds 5 000 m² in extent or 300 m in length to notify the responsible heritage resources authority, viz. the South African Heritage Resources Agency (SAHRA) or the relevant provincial heritage agency. The applicable authority will in turn indicate whether a full Heritage Impact Assessment (HIA) would need to be undertaken.
Applicable provisions from these laws and regulations will be incorporated into the design and implementation of the Project.
Both SAHRA and Amafa were notified of the Project. A marine Heritage specialist study was conducted on request by. Letter of Exemption for a Heritage Impact Assessment on the terrestrial portion of the Project was submitted to Amafa on 4 March 2019, and the exemption was approved on 5 April 2019.
4.3.2 National Guidelines
National Guidelines relevant to the Project is listed below.
DEA Integrated Environmental Management Guidelines (2010);
DEA Companion Guideline on the Implementation of the Environmental Impact Assessment Regulations (2014);
DEA Public Participation Guideline (2017);
DEA Guideline on Need & Desirability (2017); and
DEA South African Water Quality Guidelines for Coastal Marine Waters (2012).
4.4 Integrated Environmental Management Due to nature of the Project, other environmental legislation will be applicable. In order to meet the various legislative requirements, a single, integrated EIA process will be run, which will also meet the requirements in terms of the following:
National Heritage Resources Act (No. 25 of 1999).
www.erm.com Project No.: 0482086 Client: ASN and Liquid Telecom Page 64
METISS FINAL EIA REPORT PUBLIC PARTICIPATION
5. PUBLIC PARTICIPATION
5.1 Objectives The public participation process is designed to provide information to and receive feedback from Interested and Affected Parties (I&AP) for use throughout the EIA process, thus providing organisations and individuals with an opportunity to raise concerns and make comments and suggestions regarding the proposed Project. By being part of the assessment process, stakeholders have the opportunity to influence the Project layout and design, input into mitigation measures and technical solutions.
The main objectives of public participation are:
To ensure that adequate and timely information is provided to those potentially affected by the Project;
To provide these groups with sufficient opportunity to voice their opinions and concerns; and
To ensure that comments are received in a timely manner so that they can be taken into account in Project decisions.
5.2 Legislative Context Public participation for EIA processes in South Africa are guided by the principles of the NEMA and the specifications of the 2014 EIA regulations specifically GN R.326. The process is further supported by the DEA Public Participation Guideline (2017).
Any public participation process in terms of the EIA Regulations must be conducted for a period of at least 30 days and should provide I&APs with all information in respect of the application, in an accessible manner.
I&APs should be notified of the application by: (1) Placing notices at the proposed site of the activity, at a publicly accessible place, and at any site alternatives; (2) Providing written notice in the form of an email or letter; (3) Placing an advertisement in a local newspaper (and in a regional newspaper should the potential impact of the activity cover a regional area), or an official gazette; and (4) Using reasonable alternative methods, in instances where a person is unable to participate in the process due to illiteracy, disability, or any other disadvantage.
All I&APs should be provided with a reasonable opportunity to participate in the public participation process and are given the opportunity to comment on the application or proposed application within the public participation process time frame. A register of I&APs should be compiled and maintained in order to record the names, contact details and addresses of all persons who have registered as an I&AP, who have commented on the application, and all relevant organs of state.
5.2.1 Scoping Phase
In accordance with the regulatory requirements stipulated in GNR 326 of the 2014 EIA Regulations, this Draft Scoping Report (including Plan of Study), was prepared as part of the EIA process.
The Draft Scoping Report was made available to stakeholders through the Project website, selected libraries, and hard copies provided on request for a period of 30 days in July 2018. After the 30-day public commenting period, a Comments and Response Report (CRR) was compiled and included in the Final Scoping Report along with any other updates or changes necessitated by the received comments. The Final Scoping Report (including Plan of Study) was submitted to the DEA for their consideration on 13 March 2019.
Identified I&APs were notified of the submission of the Final Scoping Report to the competent authority on 19 March 2019.
www.erm.com Project No.: 0482086 Client: ASN and Liquid Telecom Page 65
METISS FINAL EIA REPORT PUBLIC PARTICIPATION
Box 5.1 The Objectives of the Scoping Process in terms of the 2014 EIA Regulations as per GNR 326 1. The objective of the scoping process is to, through a consultative process— (a) Identify the relevant policies and legislation relevant to the activity; (b) Motivate the need and desirability of the proposed activity, including the need and desirability
of the activity in the context of the preferred location; (c) Identify and confirm the preferred activity and technology alternative through an identification of
impacts and risks and ranking process of such impacts and risks; (d) identify and confirm the preferred site, through a detailed site selection process, which includes
an identification of impacts and risks inclusive of identification of cumulative impacts and a ranking process of all the identified alternatives focusing on the geographical, physical, biological, social, economic, and cultural aspects of the environment;
(e) Identify the key issues to be addressed in the assessment phase; (f) agree on the level of assessment to be undertaken, including the methodology to be applied,
the expertise required as well as the extent of further consultation to be undertaken to determine the impacts and risks the activity will impose on the preferred site through the life of the activity, including the nature, significance, consequence, extent, duration and probability of the impacts to inform the location of the development footprint within the preferred site; and
(g) Identify suitable measures to avoid, manage or mitigate identified impacts and to determine the extent of the residual risks that need to be managed and monitored.
5.2.2 Impact Assessment Phase
The final phase of the EIA process is the Integration and Assessment Phase, which is described in detail in the Impact Assessment for EIA Report (Chapter 8).
The assessment of impacts proceeds through an iterative process in three steps:
Prediction of the significance of impacts on the natural and social environment resulting from the proposed development;
Development of mitigation measures to avoid, reduce and manage the impacts; and
Assessment of residual significant impacts after the application of mitigation measures.
The Draft EIA Report that includes the Environmental Management Programme (EMPr) (i.e., this report) was made available to I&APs for a 30 days public commenting period. I&APs were notified of the release of the Draft EIA Report and where the report could be reviewed.
Following the 30-day period, comments received on the Draft EIA Report and EMPr were assimilated and the EIA Project team have provided appropriate responses to all comments. A CRR has been appended to this Final EIA Report, which has been submitted to the DEA for decision-making.
All registered I&APs will be notified within 14 days of the Environmental Authorisation has been issued by the DEA. A 90 day (maximum time should an appeal be submitted) appeal period will follow the issuing of the Environmental Authorisation.
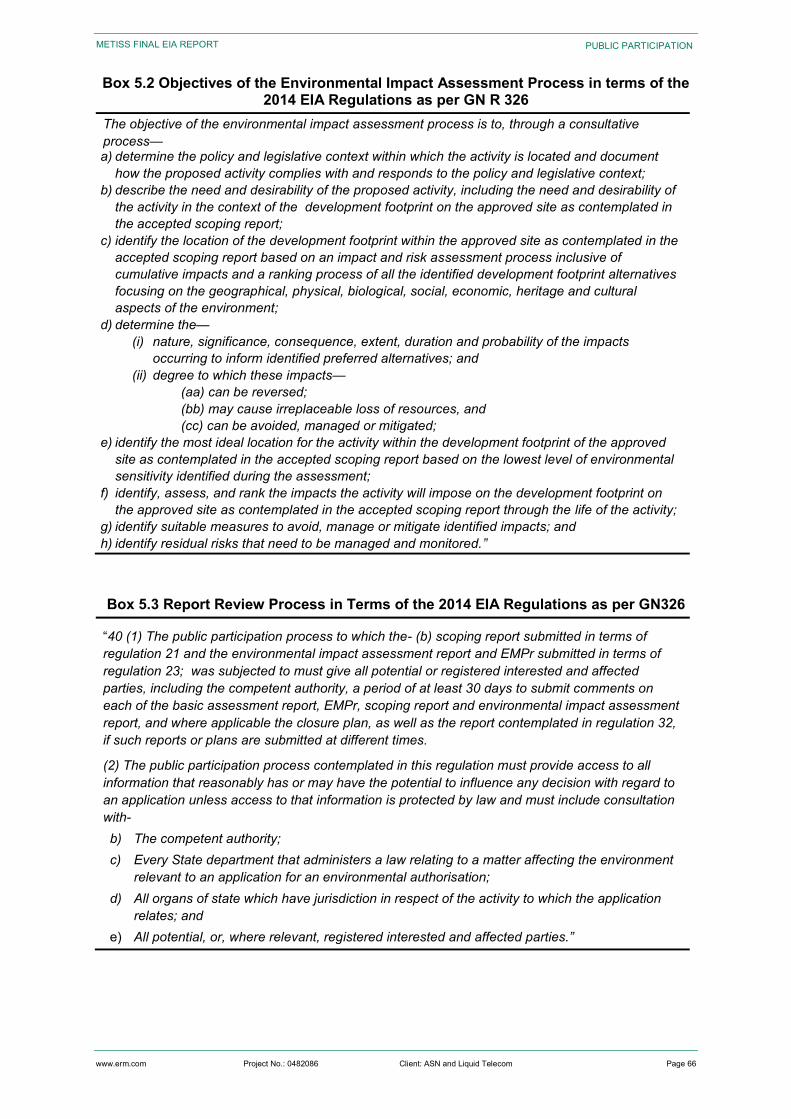
www.erm.com Project No.: 0482086 Client: ASN and Liquid Telecom Page 66
METISS FINAL EIA REPORT PUBLIC PARTICIPATION
Box 5.2 Objectives of the Environmental Impact Assessment Process in terms of the 2014 EIA Regulations as per GN R 326
The objective of the environmental impact assessment process is to, through a consultative process— a) determine the policy and legislative context within which the activity is located and document
how the proposed activity complies with and responds to the policy and legislative context; b) describe the need and desirability of the proposed activity, including the need and desirability of
the activity in the context of the development footprint on the approved site as contemplated in the accepted scoping report;
c) identify the location of the development footprint within the approved site as contemplated in the accepted scoping report based on an impact and risk assessment process inclusive of cumulative impacts and a ranking process of all the identified development footprint alternatives focusing on the geographical, physical, biological, social, economic, heritage and cultural aspects of the environment;
d) determine the— (i) nature, significance, consequence, extent, duration and probability of the impacts
occurring to inform identified preferred alternatives; and (ii) degree to which these impacts—
(aa) can be reversed; (bb) may cause irreplaceable loss of resources, and (cc) can be avoided, managed or mitigated;
e) identify the most ideal location for the activity within the development footprint of the approved site as contemplated in the accepted scoping report based on the lowest level of environmental sensitivity identified during the assessment;
f) identify, assess, and rank the impacts the activity will impose on the development footprint on the approved site as contemplated in the accepted scoping report through the life of the activity;
g) identify suitable measures to avoid, manage or mitigate identified impacts; and h) identify residual risks that need to be managed and monitored.”
Box 5.3 Report Review Process in Terms of the 2014 EIA Regulations as per GN326
“40 (1) The public participation process to which the- (b) scoping report submitted in terms of regulation 21 and the environmental impact assessment report and EMPr submitted in terms of regulation 23; was subjected to must give all potential or registered interested and affected parties, including the competent authority, a period of at least 30 days to submit comments on each of the basic assessment report, EMPr, scoping report and environmental impact assessment report, and where applicable the closure plan, as well as the report contemplated in regulation 32, if such reports or plans are submitted at different times.
(2) The public participation process contemplated in this regulation must provide access to all information that reasonably has or may have the potential to influence any decision with regard to an application unless access to that information is protected by law and must include consultation with- b) The competent authority; c) Every State department that administers a law relating to a matter affecting the environment
relevant to an application for an environmental authorisation; d) All organs of state which have jurisdiction in respect of the activity to which the application
relates; and e) All potential, or, where relevant, registered interested and affected parties.”
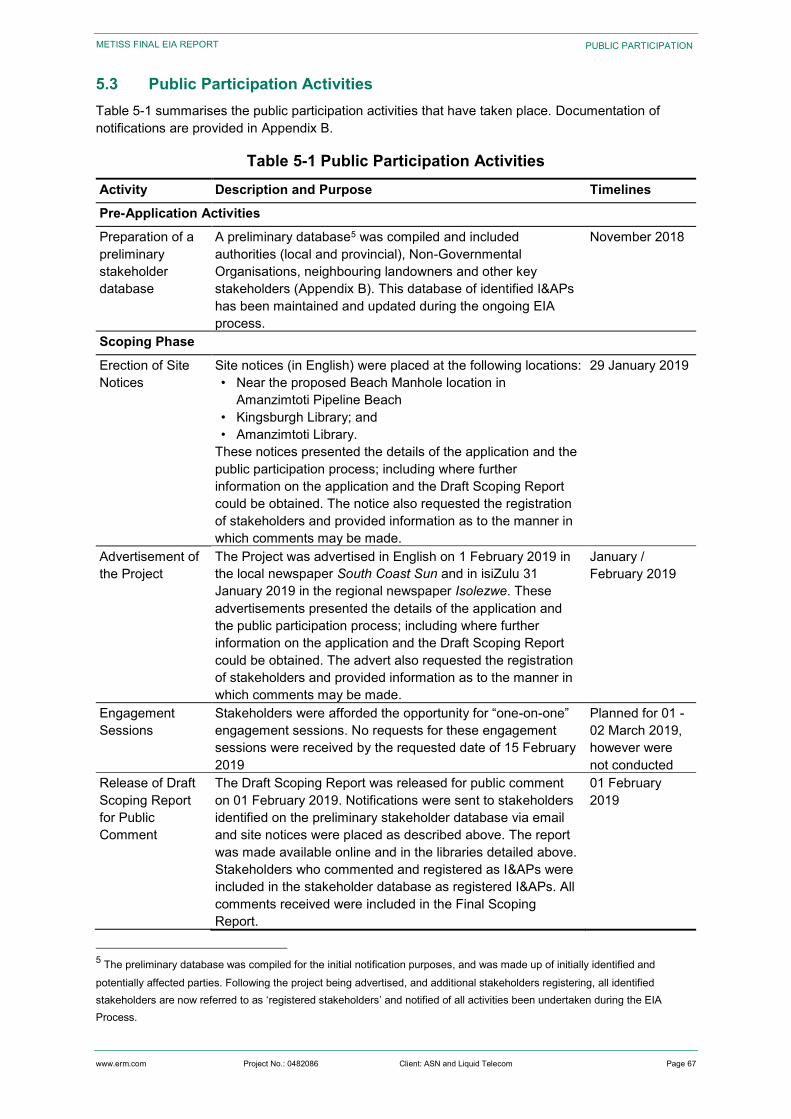
www.erm.com Project No.: 0482086 Client: ASN and Liquid Telecom Page 67
METISS FINAL EIA REPORT PUBLIC PARTICIPATION
5.3 Public Participation Activities Table 5-1 summarises the public participation activities that have taken place. Documentation of notifications are provided in Appendix B.
Table 5-1 Public Participation Activities Activity Description and Purpose Timelines Pre-Application Activities Preparation of a preliminary stakeholder database
A preliminary database5 was compiled and included authorities (local and provincial), Non-Governmental Organisations, neighbouring landowners and other key stakeholders (Appendix B). This database of identified I&APs has been maintained and updated during the ongoing EIA process.
November 2018
Scoping Phase
Erection of Site Notices
Site notices (in English) were placed at the following locations: • Near the proposed Beach Manhole location in
Amanzimtoti Pipeline Beach • Kingsburgh Library; and • Amanzimtoti Library.
These notices presented the details of the application and the public participation process; including where further information on the application and the Draft Scoping Report could be obtained. The notice also requested the registration of stakeholders and provided information as to the manner in which comments may be made.
29 January 2019
Advertisement of the Project
The Project was advertised in English on 1 February 2019 in the local newspaper South Coast Sun and in isiZulu 31 January 2019 in the regional newspaper Isolezwe. These advertisements presented the details of the application and the public participation process; including where further information on the application and the Draft Scoping Report could be obtained. The advert also requested the registration of stakeholders and provided information as to the manner in which comments may be made.
January / February 2019
Engagement Sessions
Stakeholders were afforded the opportunity for “one-on-one” engagement sessions. No requests for these engagement sessions were received by the requested date of 15 February 2019
Planned for 01 - 02 March 2019, however were not conducted
Release of Draft Scoping Report for Public Comment
The Draft Scoping Report was released for public comment on 01 February 2019. Notifications were sent to stakeholders identified on the preliminary stakeholder database via email and site notices were placed as described above. The report was made available online and in the libraries detailed above. Stakeholders who commented and registered as I&APs were included in the stakeholder database as registered I&APs. All comments received were included in the Final Scoping Report.
01 February 2019
5 The preliminary database was compiled for the initial notification purposes, and was made up of initially identified and potentially affected parties. Following the project being advertised, and additional stakeholders registering, all identified stakeholders are now referred to as ‘registered stakeholders’ and notified of all activities been undertaken during the EIA Process.
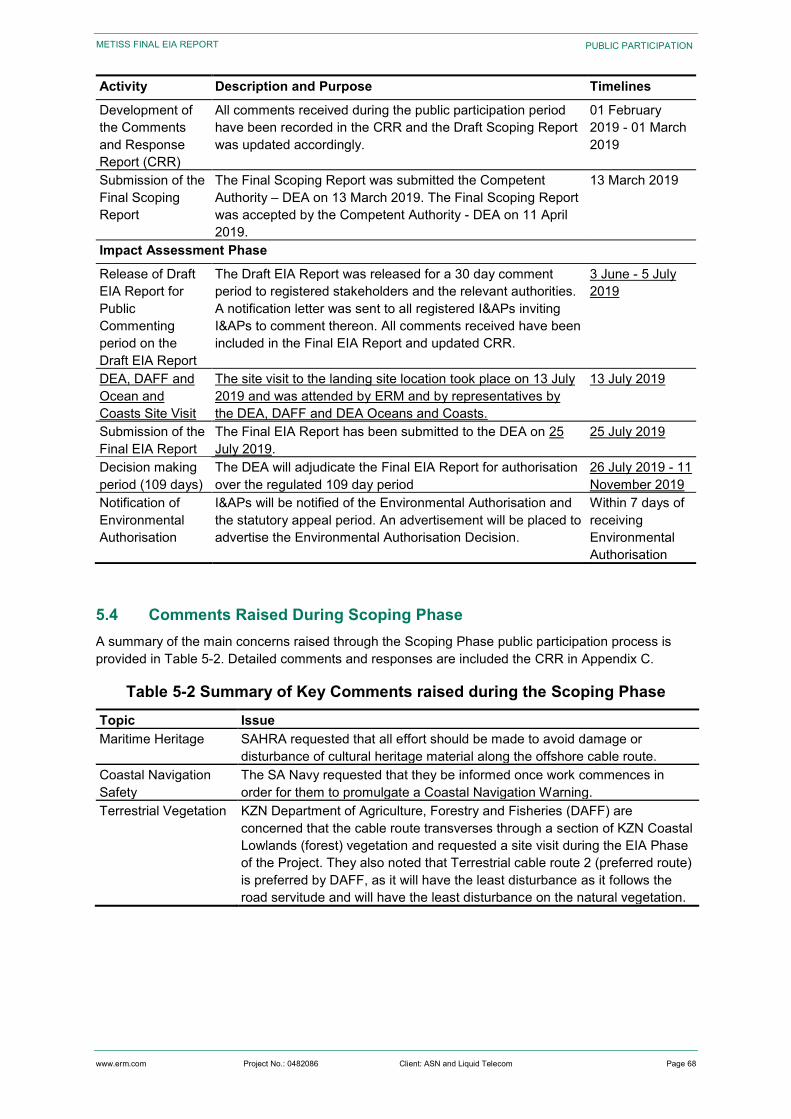
www.erm.com Project No.: 0482086 Client: ASN and Liquid Telecom Page 68
METISS FINAL EIA REPORT PUBLIC PARTICIPATION
Activity Description and Purpose Timelines
Development of the Comments and Response Report (CRR)
All comments received during the public participation period have been recorded in the CRR and the Draft Scoping Report was updated accordingly.
01 February 2019 - 01 March 2019
Submission of the Final Scoping Report
The Final Scoping Report was submitted the Competent Authority – DEA on 13 March 2019. The Final Scoping Report was accepted by the Competent Authority - DEA on 11 April 2019.
13 March 2019
Impact Assessment Phase
Release of Draft EIA Report for Public Commenting period on the Draft EIA Report
The Draft EIA Report was released for a 30 day comment period to registered stakeholders and the relevant authorities. A notification letter was sent to all registered I&APs inviting I&APs to comment thereon. All comments received have been included in the Final EIA Report and updated CRR.
3 June - 5 July 2019
DEA, DAFF and Ocean and Coasts Site Visit
The site visit to the landing site location took place on 13 July 2019 and was attended by ERM and by representatives by the DEA, DAFF and DEA Oceans and Coasts.
13 July 2019
Submission of the Final EIA Report
The Final EIA Report has been submitted to the DEA on 25 July 2019.
25 July 2019
Decision making period (109 days)
The DEA will adjudicate the Final EIA Report for authorisation over the regulated 109 day period
26 July 2019 - 11 November 2019
Notification of Environmental Authorisation
I&APs will be notified of the Environmental Authorisation and the statutory appeal period. An advertisement will be placed to advertise the Environmental Authorisation Decision.
Within 7 days of receiving Environmental Authorisation
5.4 Comments Raised During Scoping Phase A summary of the main concerns raised through the Scoping Phase public participation process is provided in Table 5-2. Detailed comments and responses are included the CRR in Appendix C.
Table 5-2 Summary of Key Comments raised during the Scoping Phase Topic Issue Maritime Heritage SAHRA requested that all effort should be made to avoid damage or
disturbance of cultural heritage material along the offshore cable route. Coastal Navigation Safety
The SA Navy requested that they be informed once work commences in order for them to promulgate a Coastal Navigation Warning.
Terrestrial Vegetation KZN Department of Agriculture, Forestry and Fisheries (DAFF) are concerned that the cable route transverses through a section of KZN Coastal Lowlands (forest) vegetation and requested a site visit during the EIA Phase of the Project. They also noted that Terrestrial cable route 2 (preferred route) is preferred by DAFF, as it will have the least disturbance as it follows the road servitude and will have the least disturbance on the natural vegetation.
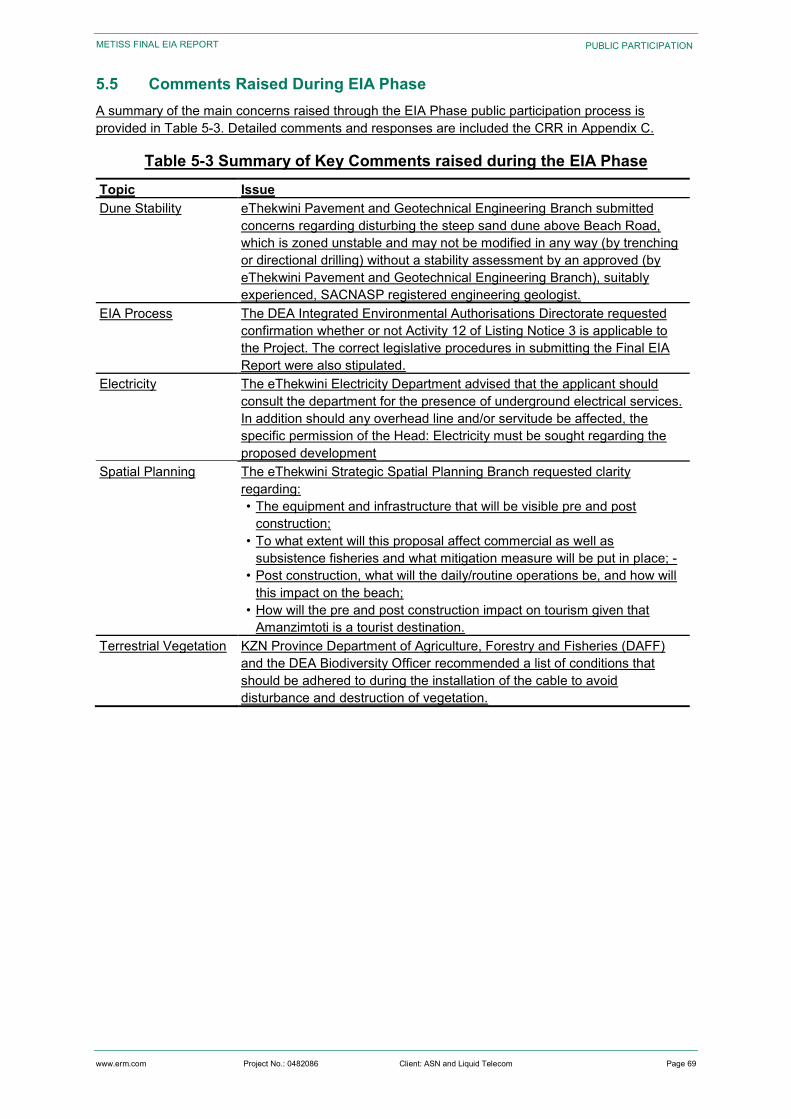
www.erm.com Project No.: 0482086 Client: ASN and Liquid Telecom Page 69
METISS FINAL EIA REPORT PUBLIC PARTICIPATION
5.5 Comments Raised During EIA Phase A summary of the main concerns raised through the EIA Phase public participation process is provided in Table 5-3. Detailed comments and responses are included the CRR in Appendix C.
Table 5-3 Summary of Key Comments raised during the EIA Phase Topic Issue Dune Stability eThekwini Pavement and Geotechnical Engineering Branch submitted
concerns regarding disturbing the steep sand dune above Beach Road, which is zoned unstable and may not be modified in any way (by trenching or directional drilling) without a stability assessment by an approved (by eThekwini Pavement and Geotechnical Engineering Branch), suitably experienced, SACNASP registered engineering geologist.
EIA Process The DEA Integrated Environmental Authorisations Directorate requested confirmation whether or not Activity 12 of Listing Notice 3 is applicable to the Project. The correct legislative procedures in submitting the Final EIA Report were also stipulated.
Electricity The eThekwini Electricity Department advised that the applicant should consult the department for the presence of underground electrical services. In addition should any overhead line and/or servitude be affected, the specific permission of the Head: Electricity must be sought regarding the proposed development
Spatial Planning The eThekwini Strategic Spatial Planning Branch requested clarity regarding: • The equipment and infrastructure that will be visible pre and post
construction; • To what extent will this proposal affect commercial as well as
subsistence fisheries and what mitigation measure will be put in place; - • Post construction, what will the daily/routine operations be, and how will
this impact on the beach; • How will the pre and post construction impact on tourism given that
Amanzimtoti is a tourist destination. Terrestrial Vegetation KZN Province Department of Agriculture, Forestry and Fisheries (DAFF)
and the DEA Biodiversity Officer recommended a list of conditions that should be adhered to during the installation of the cable to avoid disturbance and destruction of vegetation.
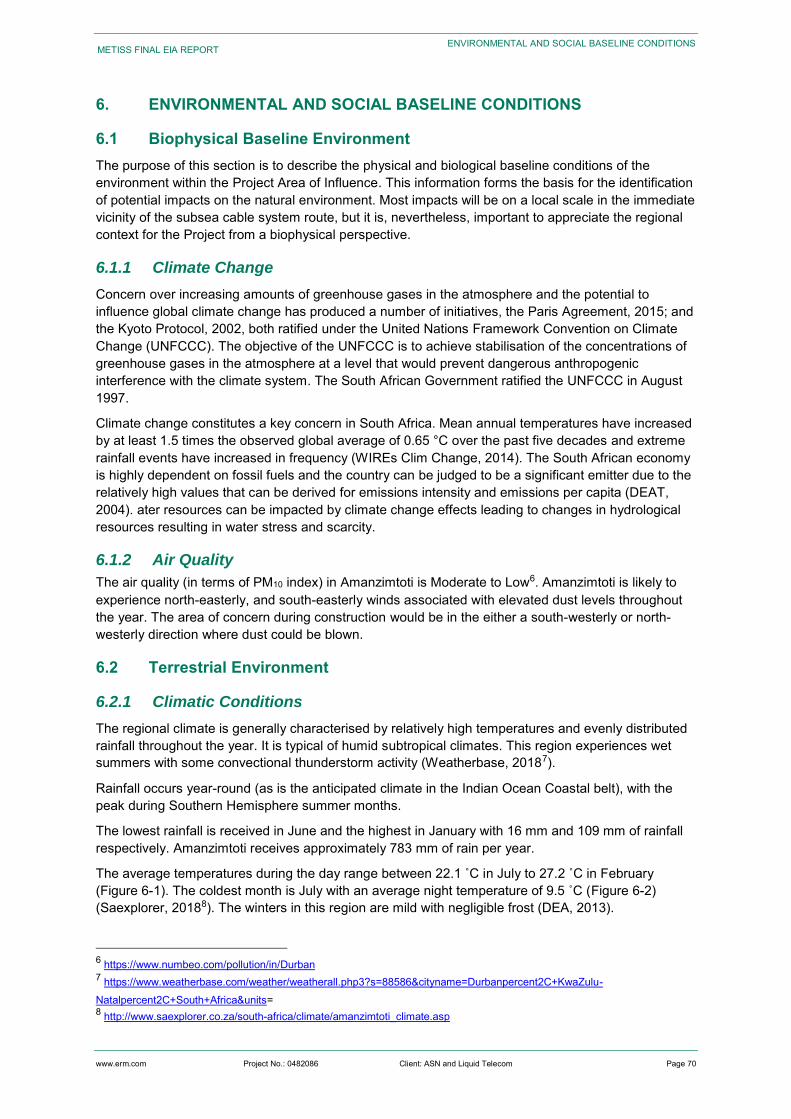
www.erm.com Project No.: 0482086 Client: ASN and Liquid Telecom Page 70
METISS FINAL EIA REPORT ENVIRONMENTAL AND SOCIAL BASELINE CONDITIONS
6. ENVIRONMENTAL AND SOCIAL BASELINE CONDITIONS
6.1 Biophysical Baseline Environment The purpose of this section is to describe the physical and biological baseline conditions of the environment within the Project Area of Influence. This information forms the basis for the identification of potential impacts on the natural environment. Most impacts will be on a local scale in the immediate vicinity of the subsea cable system route, but it is, nevertheless, important to appreciate the regional context for the Project from a biophysical perspective.
6.1.1 Climate Change
Concern over increasing amounts of greenhouse gases in the atmosphere and the potential to influence global climate change has produced a number of initiatives, the Paris Agreement, 2015; and the Kyoto Protocol, 2002, both ratified under the United Nations Framework Convention on Climate Change (UNFCCC). The objective of the UNFCCC is to achieve stabilisation of the concentrations of greenhouse gases in the atmosphere at a level that would prevent dangerous anthropogenic interference with the climate system. The South African Government ratified the UNFCCC in August 1997.
Climate change constitutes a key concern in South Africa. Mean annual temperatures have increased by at least 1.5 times the observed global average of 0.65 °C over the past five decades and extreme rainfall events have increased in frequency (WIREs Clim Change, 2014). The South African economy is highly dependent on fossil fuels and the country can be judged to be a significant emitter due to the relatively high values that can be derived for emissions intensity and emissions per capita (DEAT, 2004). ater resources can be impacted by climate change effects leading to changes in hydrological resources resulting in water stress and scarcity.
6.1.2 Air Quality
The air quality (in terms of PM10 index) in Amanzimtoti is Moderate to Low6. Amanzimtoti is likely to experience north-easterly, and south-easterly winds associated with elevated dust levels throughout the year. The area of concern during construction would be in the either a south-westerly or north-westerly direction where dust could be blown.
6.2 Terrestrial Environment
6.2.1 Climatic Conditions
The regional climate is generally characterised by relatively high temperatures and evenly distributed rainfall throughout the year. It is typical of humid subtropical climates. This region experiences wet summers with some convectional thunderstorm activity (Weatherbase, 20187).
Rainfall occurs year-round (as is the anticipated climate in the Indian Ocean Coastal belt), with the peak during Southern Hemisphere summer months.
The lowest rainfall is received in June and the highest in January with 16 mm and 109 mm of rainfall respectively. Amanzimtoti receives approximately 783 mm of rain per year.
The average temperatures during the day range between 22.1 ˚C in July to 27.2 ˚C in February (Figure 6-1). The coldest month is July with an average night temperature of 9.5 ˚C (Figure 6-2) (Saexplorer, 20188). The winters in this region are mild with negligible frost (DEA, 2013).
6 https://www.numbeo.com/pollution/in/Durban 7 https://www.weatherbase.com/weather/weatherall.php3?s=88586&cityname=Durbanpercent2C+KwaZulu-Natalpercent2C+South+Africa&units= 8 http://www.saexplorer.co.za/south-africa/climate/amanzimtoti_climate.asp
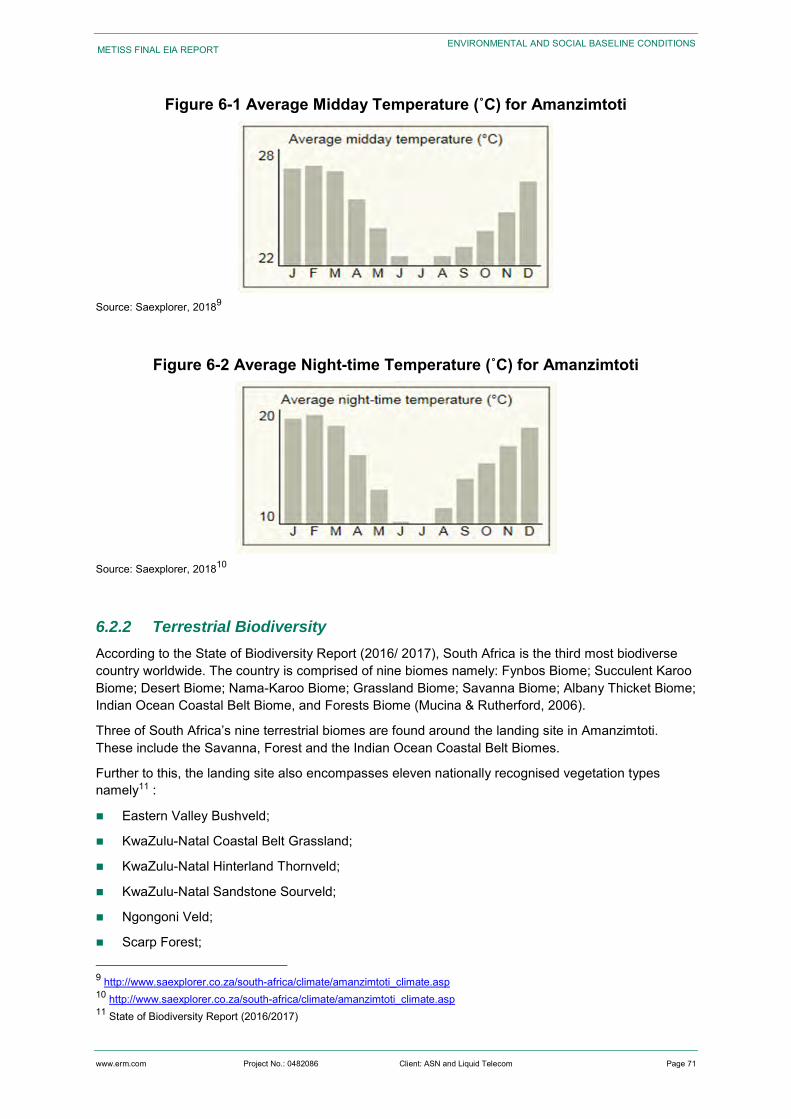
www.erm.com Project No.: 0482086 Client: ASN and Liquid Telecom Page 71
METISS FINAL EIA REPORT ENVIRONMENTAL AND SOCIAL BASELINE CONDITIONS
Figure 6-1 Average Midday Temperature (˚C) for Amanzimtoti
Source: Saexplorer, 20189
Figure 6-2 Average Night-time Temperature (˚C) for Amanzimtoti
Source: Saexplorer, 201810
6.2.2 Terrestrial Biodiversity
According to the State of Biodiversity Report (2016/ 2017), South Africa is the third most biodiverse country worldwide. The country is comprised of nine biomes namely: Fynbos Biome; Succulent Karoo Biome; Desert Biome; Nama-Karoo Biome; Grassland Biome; Savanna Biome; Albany Thicket Biome; Indian Ocean Coastal Belt Biome, and Forests Biome (Mucina & Rutherford, 2006).
Three of South Africa’s nine terrestrial biomes are found around the landing site in Amanzimtoti. These include the Savanna, Forest and the Indian Ocean Coastal Belt Biomes.
Further to this, the landing site also encompasses eleven nationally recognised vegetation types namely11 :
Eastern Valley Bushveld;
KwaZulu-Natal Coastal Belt Grassland;
KwaZulu-Natal Hinterland Thornveld;
KwaZulu-Natal Sandstone Sourveld;
Ngongoni Veld;
Scarp Forest; 9 http://www.saexplorer.co.za/south-africa/climate/amanzimtoti_climate.asp 10 http://www.saexplorer.co.za/south-africa/climate/amanzimtoti_climate.asp 11 State of Biodiversity Report (2016/2017)
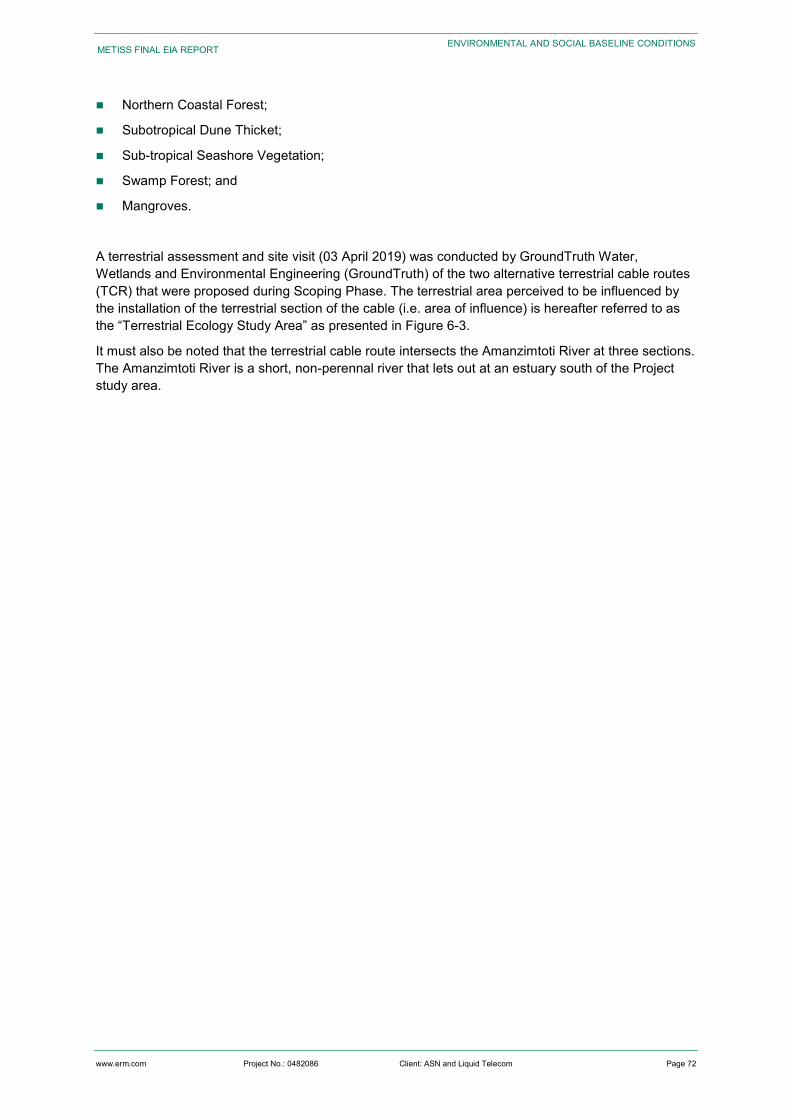
www.erm.com Project No.: 0482086 Client: ASN and Liquid Telecom Page 72
METISS FINAL EIA REPORT ENVIRONMENTAL AND SOCIAL BASELINE CONDITIONS
Northern Coastal Forest;
Subotropical Dune Thicket;
Sub-tropical Seashore Vegetation;
Swamp Forest; and
Mangroves.
A terrestrial assessment and site visit (03 April 2019) was conducted by GroundTruth Water, Wetlands and Environmental Engineering (GroundTruth) of the two alternative terrestrial cable routes (TCR) that were proposed during Scoping Phase. The terrestrial area perceived to be influenced by the installation of the terrestrial section of the cable (i.e. area of influence) is hereafter referred to as the “Terrestrial Ecology Study Area” as presented in Figure 6-3.
It must also be noted that the terrestrial cable route intersects the Amanzimtoti River at three sections. The Amanzimtoti River is a short, non-perennal river that lets out at an estuary south of the Project study area.
www.erm.com Project No.: 0482086 Client: ASN and Liquid Telecom Page 73
METISS FINAL EIA REPORT ENVIRONMENTAL AND SOCIAL BASELINE CONDITIONS
Figure 6-3 Map of the Terrestrial Ecology Study Area Illustrating the Terrestrial Cable Route 1 and the Preferred Terrestrial Cable Route 2
Source: Groundtruth, 2019
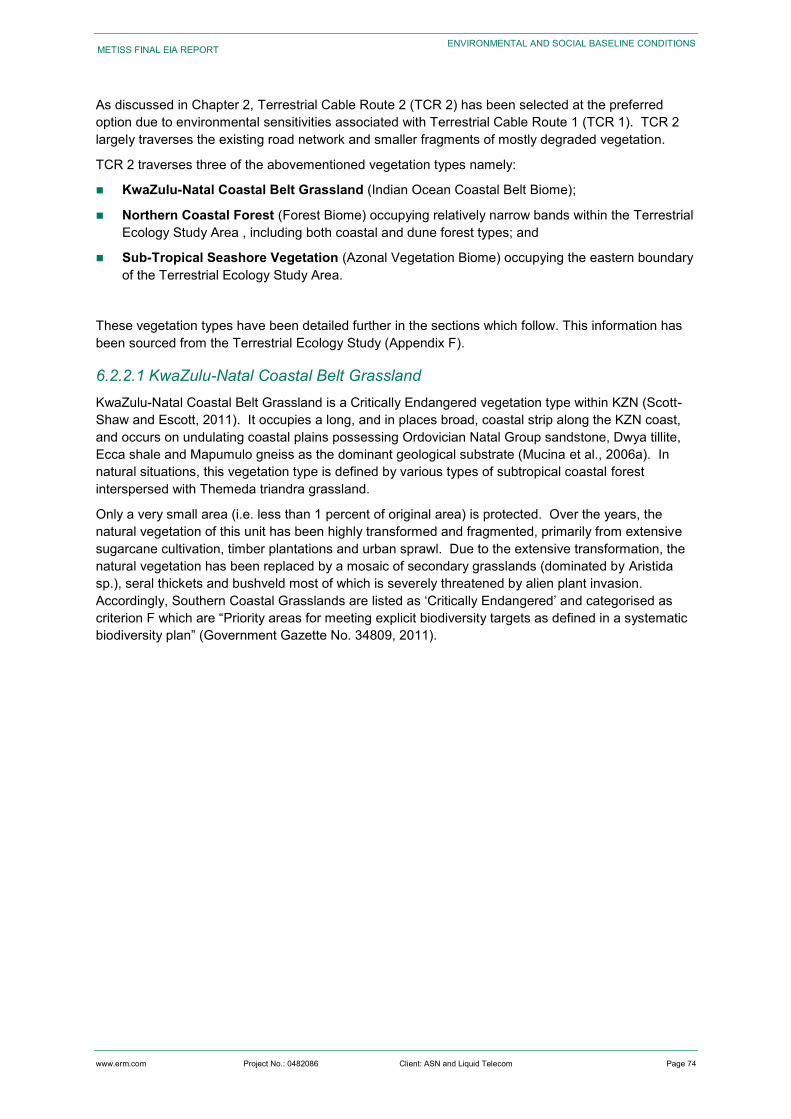
www.erm.com Project No.: 0482086 Client: ASN and Liquid Telecom Page 74
METISS FINAL EIA REPORT ENVIRONMENTAL AND SOCIAL BASELINE CONDITIONS
As discussed in Chapter 2, Terrestrial Cable Route 2 (TCR 2) has been selected at the preferred option due to environmental sensitivities associated with Terrestrial Cable Route 1 (TCR 1). TCR 2 largely traverses the existing road network and smaller fragments of mostly degraded vegetation.
TCR 2 traverses three of the abovementioned vegetation types namely:
KwaZulu-Natal Coastal Belt Grassland (Indian Ocean Coastal Belt Biome);
Northern Coastal Forest (Forest Biome) occupying relatively narrow bands within the Terrestrial Ecology Study Area , including both coastal and dune forest types; and
Sub-Tropical Seashore Vegetation (Azonal Vegetation Biome) occupying the eastern boundary of the Terrestrial Ecology Study Area.
These vegetation types have been detailed further in the sections which follow. This information has been sourced from the Terrestrial Ecology Study (Appendix F).
6.2.2.1 KwaZulu-Natal Coastal Belt Grassland KwaZulu-Natal Coastal Belt Grassland is a Critically Endangered vegetation type within KZN (Scott-Shaw and Escott, 2011). It occupies a long, and in places broad, coastal strip along the KZN coast, and occurs on undulating coastal plains possessing Ordovician Natal Group sandstone, Dwya tillite, Ecca shale and Mapumulo gneiss as the dominant geological substrate (Mucina et al., 2006a). In natural situations, this vegetation type is defined by various types of subtropical coastal forest interspersed with Themeda triandra grassland.
Only a very small area (i.e. less than 1 percent of original area) is protected. Over the years, the natural vegetation of this unit has been highly transformed and fragmented, primarily from extensive sugarcane cultivation, timber plantations and urban sprawl. Due to the extensive transformation, the natural vegetation has been replaced by a mosaic of secondary grasslands (dominated by Aristida sp.), seral thickets and bushveld most of which is severely threatened by alien plant invasion. Accordingly, Southern Coastal Grasslands are listed as ‘Critically Endangered’ and categorised as criterion F which are “Priority areas for meeting explicit biodiversity targets as defined in a systematic biodiversity plan” (Government Gazette No. 34809, 2011).
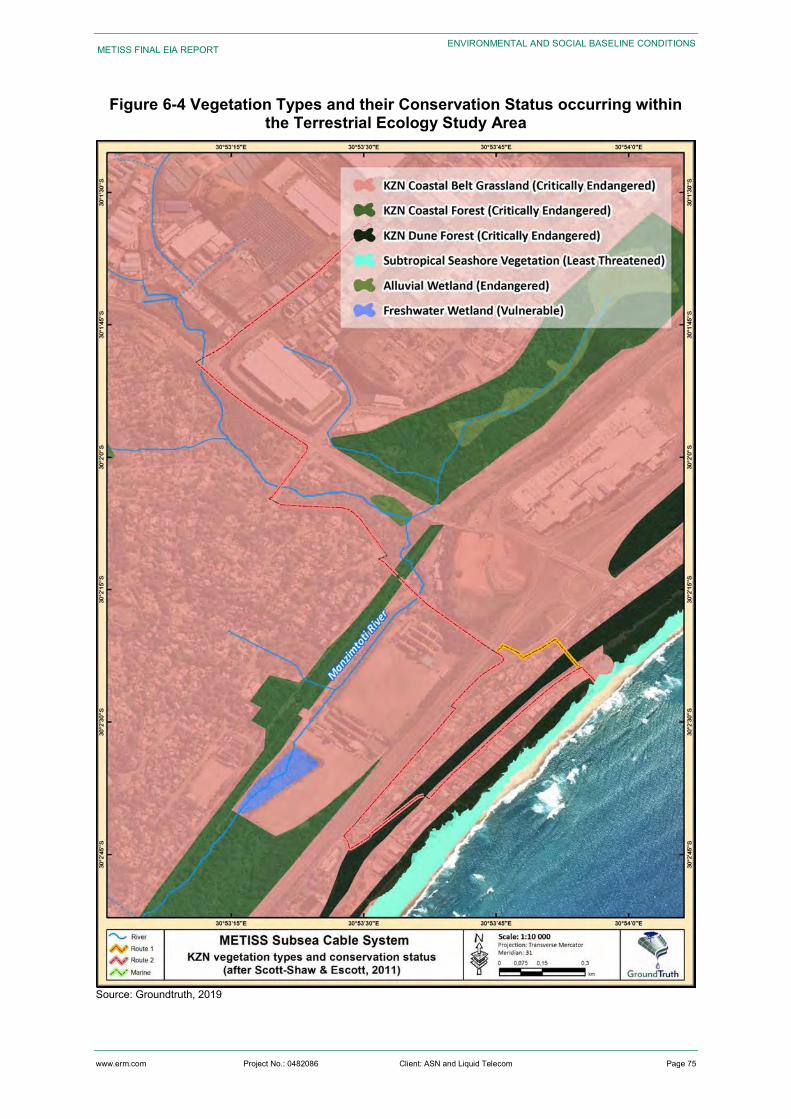
www.erm.com Project No.: 0482086 Client: ASN and Liquid Telecom Page 75
METISS FINAL EIA REPORT ENVIRONMENTAL AND SOCIAL BASELINE CONDITIONS
Figure 6-4 Vegetation Types and their Conservation Status occurring within the Terrestrial Ecology Study Area
Source: Groundtruth, 2019
www.erm.com Project No.: 0482086 Client: ASN and Liquid Telecom Page 76
METISS FINAL EIA REPORT ENVIRONMENTAL AND SOCIAL BASELINE CONDITIONS
6.2.2.2 Northern Coastal Forest The Northern Coastal Forest occurs on coastal plains and stabilised coastal dunes (Mucina and Geldenhuys, 2006). The underlying geology is well-developed, sand-loamy soil types of the Karoo Supergroup and Jurassic intrusive dolerites. The stabilised dune systems are formed from Holocene marine sediments.
Where intact, this biome is generally species-rich, and the dominant vegetation structure is tall/medium in height. The extent of Northern Coastal Forests, however, has been reduced from agriculture, forestry, urbanisation and mining, and further threatened by the presence of Invasive Alien Plants. Scott-Shaw and Escott (2011) have split the national delineation of Northern Coastal Forest into several sub-forms, including KZN Dune Forest and KZN Coastal Forest as associated with the Terrestrial Ecology Study Area, both of which have been assessed within the KZN Province as Critically Endangered.
6.2.2.3 Sub-Tropical Seashore Vegetation The Sub-tropical Seashore Vegetation is characterised by open, grassy, herbaceous and shrubby features (Mucina et al., 2006a). They are formed by deposition of recent coastal sandy sediments that are exposed to storms and consequently, are dynamic environments. Tropical coastal elements increase along the north-south gradient shift. The vegetation type is classified as ‘Least Threatened’ with approximately 30 percent formerly protected. Approximately 10 percent has been transformed.
Dune Habitats Dune habitats are characterised by plant communities which usually consist of four distinct zones as described by Kee and Nichols (2004), and typically transition between seashore vegetation and inland vegetation types (e.g. coastal forest and grassland). These zones are generally defined according to different stages of plant succession – the first dune comprising hardy pioneer plants that respond well to the rapidly shifting sands of the foredune, with zones further inland becoming more stable, and supporting more advanced levels of forest succession (Kee and Nichols, 2004; Tinley, 1985; Weisser, 1980). The communities associated with the foredunes are adapted to tolerate harsh conditions (e.g. salt spray, high temperatures, wind, erosion, low nutrients, etc.), and as a result only pioneer plant species such as Carpobrotus dimidiatus and Scaevolia plumieri inhabit this zone (Kee and Nichols, 2004). Higher up the foredunes, the plant community starts to include bush clumps with shrubs such as Brachylaena discolour, Carissa macrocarpa, Chrysanthemoides monilifera and Strelitzia Nicolai (Kee and Nichols, 2004). Weisser (1980) collectively refers to the seaward-facing foredunes as coastal thicket due to the dense, stunted vegetation that is characterised by salt-spray and onshore winds, and the transition to dune forest tends to be gradual. However, an important feature is the dune crest, which principally separates coastal thicket from the ‘proper’ dune forest located on the landward-facing dunes and in the dune valleys.
6.2.3 National Threatened Ecosystems
The South African National Biodiversity Institute (SANBI) and the Department of Environmental Affairs and Tourism (DEAT) (2009), in accordance with the National Environmental Management: Biodiversity Act (NEMBA) (Act 10 of 2004), provides a listing of threatened or protected ecosystems, categorised by four categories, namely Critically Endangered (CR), Endangered (EN), Vulnerable (VU) or protected. According to the IUCN guidelines:
Critically Endangered species - is one that is facing an extremely high risk of extinction;
Endangered species – is one that is facing a very high risk of extinction; and
Vulnerable species – is one that is facing a high risk of extinction.
www.erm.com Project No.: 0482086 Client: ASN and Liquid Telecom Page 77
METISS FINAL EIA REPORT ENVIRONMENTAL AND SOCIAL BASELINE CONDITIONS
The Terrestrial Ecology Study Area traverses two threatened ecosystems (Figure 6-5), both of which are classified as Critically Endangered, namely:
Interior South Coast Grasslands – originally covered 148,000 hectares (ha). At present only about 9 percent remains, and a small proportion (~2 percent) of the original extent is protected. The remaining areas of Interior South Coast Grasslands support a number of threatened or endemic plants and animals.
Key biodiversity features include: three millipedes (Centrobolus anulatus, Doratogonus infragilis melanocephalum and B. wezae) and seventeen plants (e.g. Begonia rudatisii, Craterostigma nanum var. nanum, Diaphananthe millarii, Eugenia simii, Helichrysum woodii, Huernia hystrix parvula, Kniphofia pauciflora, Kniphofia rooperi, Streptocarpus primulifolius, Watsonia confusa).
Southern Coastal Grasslands – originally covered 23,000 ha. At present only about 6 percent remains, and a very small proportion (<1 percent) of the original extent is protected. The area supports nine species of conservation concern. Key biodiversity features include: two millipedes (Centrobolus anulatus and Doratogonus infragilis), one amphibian (Hyperolius pickersgilli), three reptiles (Bradypodion caeruleogula, B. melanocephalum and B. wezae), two plants (Helichrysum woodii and Kniphofia pauciflora), and three vegetation types (i.e. Scarp Forest, KwaZulu-Natal Sandstone Sourveld and KwaZulu-Natal Coastal Belt).
The aforementioned threatened ecosystems intercept various vegetation types, namely: KwaZulu-Natal Coastal Forest, KwaZulu-Natal Dune Forest, KwaZulu-Natal Sandstone Sourveld, Ngongoni Veld, KwaZulu-Natal Coastal Belt, Pondoland Scarp Forest, Pondoland-Ugu Sandstone Coastal Sourveld.
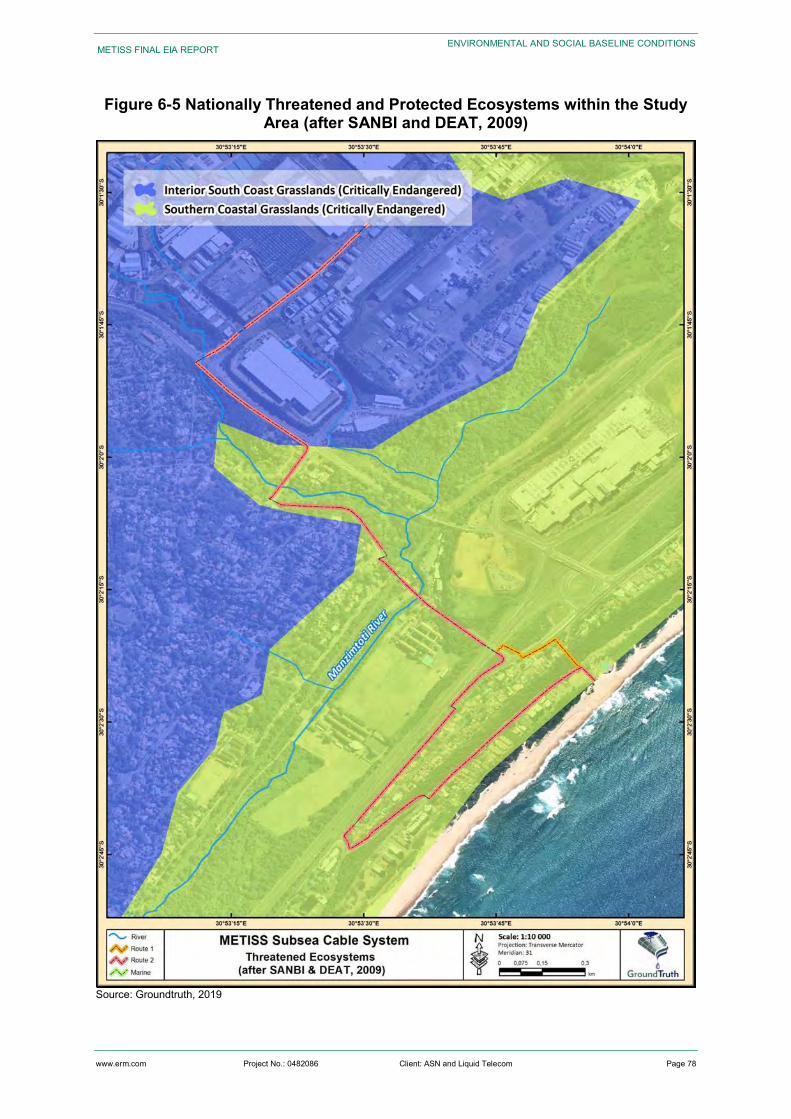
www.erm.com Project No.: 0482086 Client: ASN and Liquid Telecom Page 78
METISS FINAL EIA REPORT ENVIRONMENTAL AND SOCIAL BASELINE CONDITIONS
Figure 6-5 Nationally Threatened and Protected Ecosystems within the Study Area (after SANBI and DEAT, 2009)
Source: Groundtruth, 2019
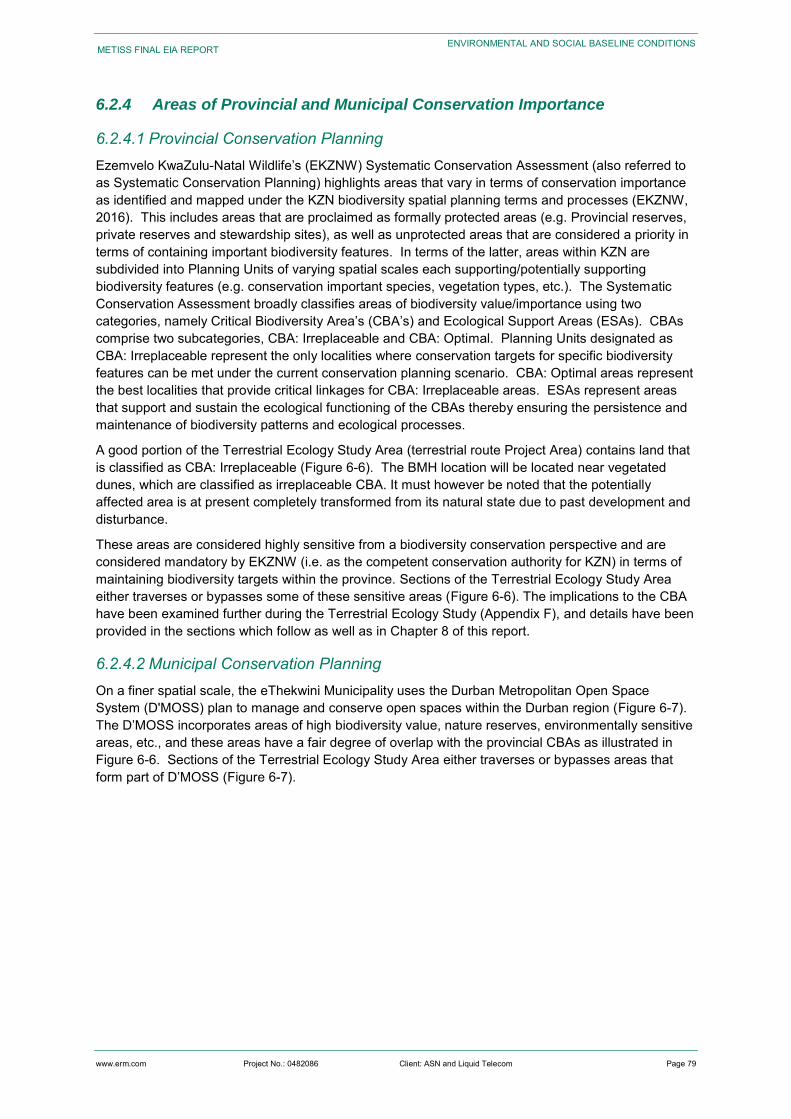
www.erm.com Project No.: 0482086 Client: ASN and Liquid Telecom Page 79
METISS FINAL EIA REPORT ENVIRONMENTAL AND SOCIAL BASELINE CONDITIONS
6.2.4 Areas of Provincial and Municipal Conservation Importance
6.2.4.1 Provincial Conservation Planning Ezemvelo KwaZulu-Natal Wildlife’s (EKZNW) Systematic Conservation Assessment (also referred to as Systematic Conservation Planning) highlights areas that vary in terms of conservation importance as identified and mapped under the KZN biodiversity spatial planning terms and processes (EKZNW, 2016). This includes areas that are proclaimed as formally protected areas (e.g. Provincial reserves, private reserves and stewardship sites), as well as unprotected areas that are considered a priority in terms of containing important biodiversity features. In terms of the latter, areas within KZN are subdivided into Planning Units of varying spatial scales each supporting/potentially supporting biodiversity features (e.g. conservation important species, vegetation types, etc.). The Systematic Conservation Assessment broadly classifies areas of biodiversity value/importance using two categories, namely Critical Biodiversity Area’s (CBA’s) and Ecological Support Areas (ESAs). CBAs comprise two subcategories, CBA: Irreplaceable and CBA: Optimal. Planning Units designated as CBA: Irreplaceable represent the only localities where conservation targets for specific biodiversity features can be met under the current conservation planning scenario. CBA: Optimal areas represent the best localities that provide critical linkages for CBA: Irreplaceable areas. ESAs represent areas that support and sustain the ecological functioning of the CBAs thereby ensuring the persistence and maintenance of biodiversity patterns and ecological processes.
A good portion of the Terrestrial Ecology Study Area (terrestrial route Project Area) contains land that is classified as CBA: Irreplaceable (Figure 6-6). The BMH location will be located near vegetated dunes, which are classified as irreplaceable CBA. It must however be noted that the potentially affected area is at present completely transformed from its natural state due to past development and disturbance.
These areas are considered highly sensitive from a biodiversity conservation perspective and are considered mandatory by EKZNW (i.e. as the competent conservation authority for KZN) in terms of maintaining biodiversity targets within the province. Sections of the Terrestrial Ecology Study Area either traverses or bypasses some of these sensitive areas (Figure 6-6). The implications to the CBA have been examined further during the Terrestrial Ecology Study (Appendix F), and details have been provided in the sections which follow as well as in Chapter 8 of this report.
6.2.4.2 Municipal Conservation Planning On a finer spatial scale, the eThekwini Municipality uses the Durban Metropolitan Open Space System (D'MOSS) plan to manage and conserve open spaces within the Durban region (Figure 6-7). The D’MOSS incorporates areas of high biodiversity value, nature reserves, environmentally sensitive areas, etc., and these areas have a fair degree of overlap with the provincial CBAs as illustrated in Figure 6-6. Sections of the Terrestrial Ecology Study Area either traverses or bypasses areas that form part of D’MOSS (Figure 6-7).
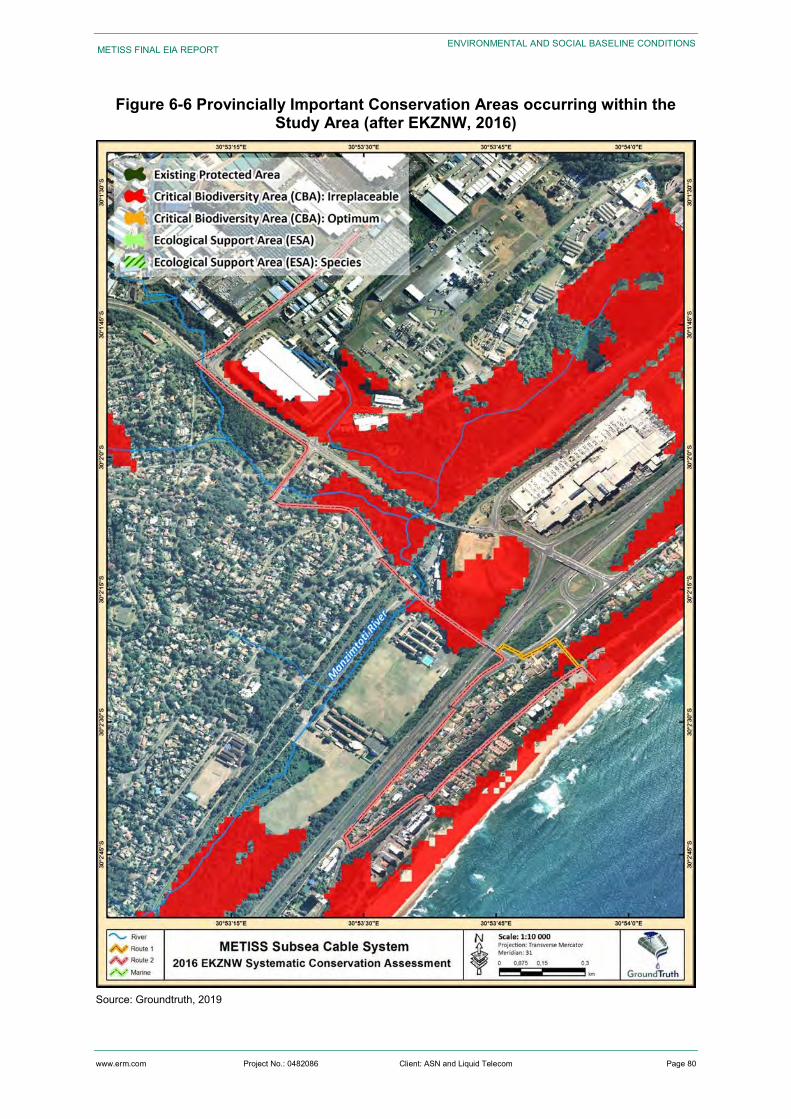
www.erm.com Project No.: 0482086 Client: ASN and Liquid Telecom Page 80
METISS FINAL EIA REPORT ENVIRONMENTAL AND SOCIAL BASELINE CONDITIONS
Figure 6-6 Provincially Important Conservation Areas occurring within the Study Area (after EKZNW, 2016)
Source: Groundtruth, 2019
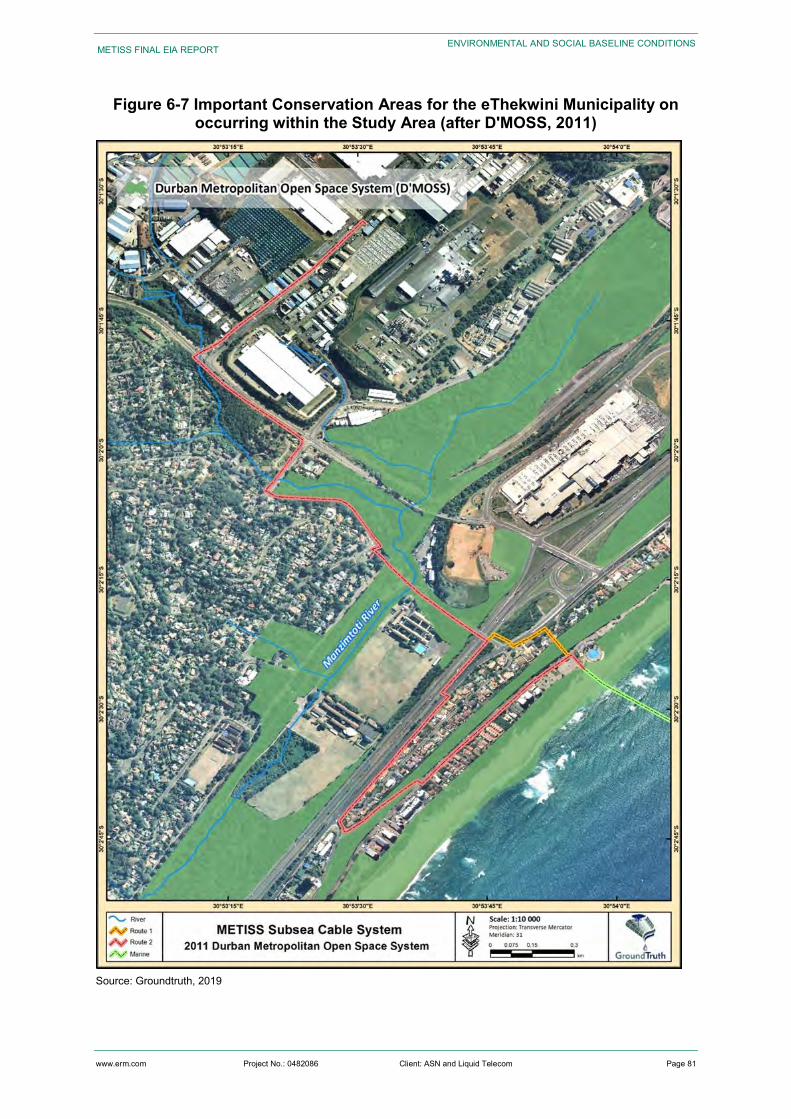
www.erm.com Project No.: 0482086 Client: ASN and Liquid Telecom Page 81
METISS FINAL EIA REPORT ENVIRONMENTAL AND SOCIAL BASELINE CONDITIONS
Figure 6-7 Important Conservation Areas for the eThekwini Municipality on occurring within the Study Area (after D'MOSS, 2011)
Source: Groundtruth, 2019
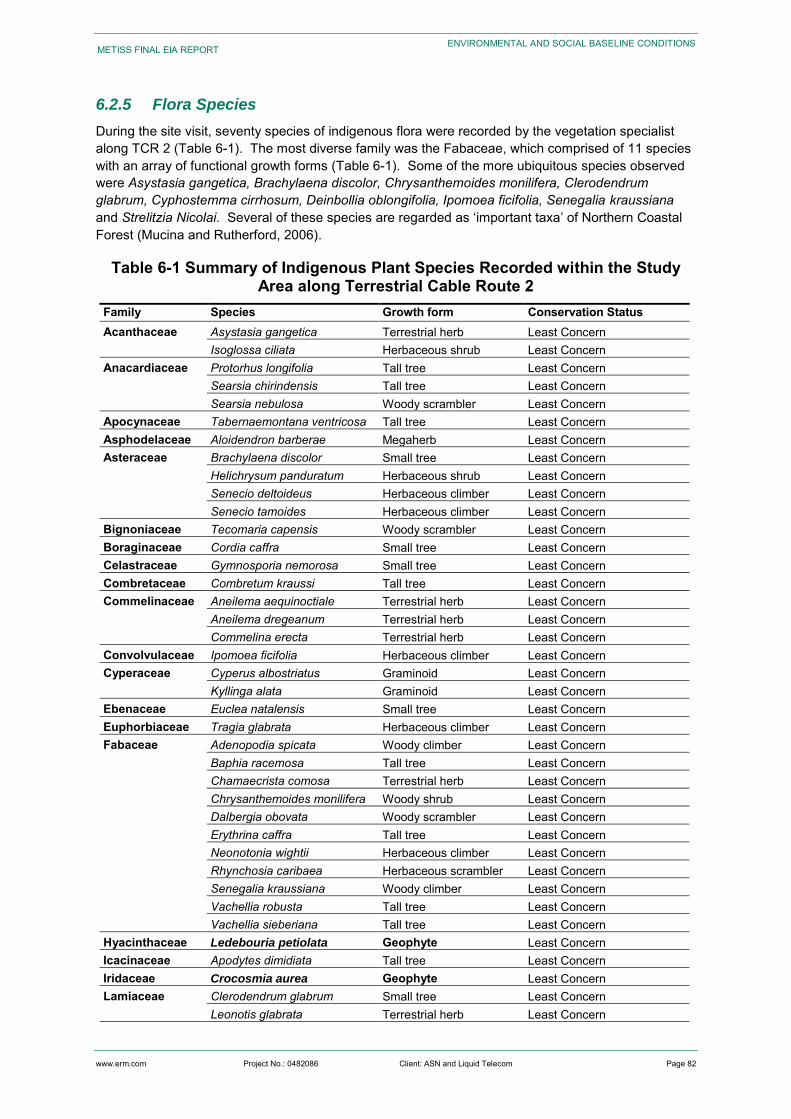
www.erm.com Project No.: 0482086 Client: ASN and Liquid Telecom Page 82
METISS FINAL EIA REPORT ENVIRONMENTAL AND SOCIAL BASELINE CONDITIONS
6.2.5 Flora Species
During the site visit, seventy species of indigenous flora were recorded by the vegetation specialist along TCR 2 (Table 6-1). The most diverse family was the Fabaceae, which comprised of 11 species with an array of functional growth forms (Table 6-1). Some of the more ubiquitous species observed were Asystasia gangetica, Brachylaena discolor, Chrysanthemoides monilifera, Clerodendrum glabrum, Cyphostemma cirrhosum, Deinbollia oblongifolia, Ipomoea ficifolia, Senegalia kraussiana and Strelitzia Nicolai. Several of these species are regarded as ‘important taxa’ of Northern Coastal Forest (Mucina and Rutherford, 2006).
Table 6-1 Summary of Indigenous Plant Species Recorded within the Study Area along Terrestrial Cable Route 2
Family Species Growth form Conservation Status Acanthaceae
Asystasia gangetica Terrestrial herb Least Concern Isoglossa ciliata Herbaceous shrub Least Concern
Anacardiaceae
Protorhus longifolia Tall tree Least Concern Searsia chirindensis Tall tree Least Concern Searsia nebulosa Woody scrambler Least Concern
Apocynaceae Tabernaemontana ventricosa Tall tree Least Concern Asphodelaceae Aloidendron barberae Megaherb Least Concern Asteraceae
Brachylaena discolor Small tree Least Concern Helichrysum panduratum Herbaceous shrub Least Concern Senecio deltoideus Herbaceous climber Least Concern Senecio tamoides Herbaceous climber Least Concern
Bignoniaceae Tecomaria capensis Woody scrambler Least Concern Boraginaceae Cordia caffra Small tree Least Concern Celastraceae Gymnosporia nemorosa Small tree Least Concern Combretaceae Combretum kraussi Tall tree Least Concern Commelinaceae
Aneilema aequinoctiale Terrestrial herb Least Concern Aneilema dregeanum Terrestrial herb Least Concern Commelina erecta Terrestrial herb Least Concern
Convolvulaceae Ipomoea ficifolia Herbaceous climber Least Concern Cyperaceae
Cyperus albostriatus Graminoid Least Concern Kyllinga alata Graminoid Least Concern
Ebenaceae Euclea natalensis Small tree Least Concern Euphorbiaceae Tragia glabrata Herbaceous climber Least Concern Fabaceae
Adenopodia spicata Woody climber Least Concern Baphia racemosa Tall tree Least Concern Chamaecrista comosa Terrestrial herb Least Concern Chrysanthemoides monilifera Woody shrub Least Concern Dalbergia obovata Woody scrambler Least Concern Erythrina caffra Tall tree Least Concern Neonotonia wightii Herbaceous climber Least Concern Rhynchosia caribaea Herbaceous scrambler Least Concern Senegalia kraussiana Woody climber Least Concern Vachellia robusta Tall tree Least Concern Vachellia sieberiana Tall tree Least Concern
Hyacinthaceae Ledebouria petiolata Geophyte Least Concern Icacinaceae Apodytes dimidiata Tall tree Least Concern Iridaceae Crocosmia aurea Geophyte Least Concern Lamiaceae
Clerodendrum glabrum Small tree Least Concern Leonotis glabrata Terrestrial herb Least Concern
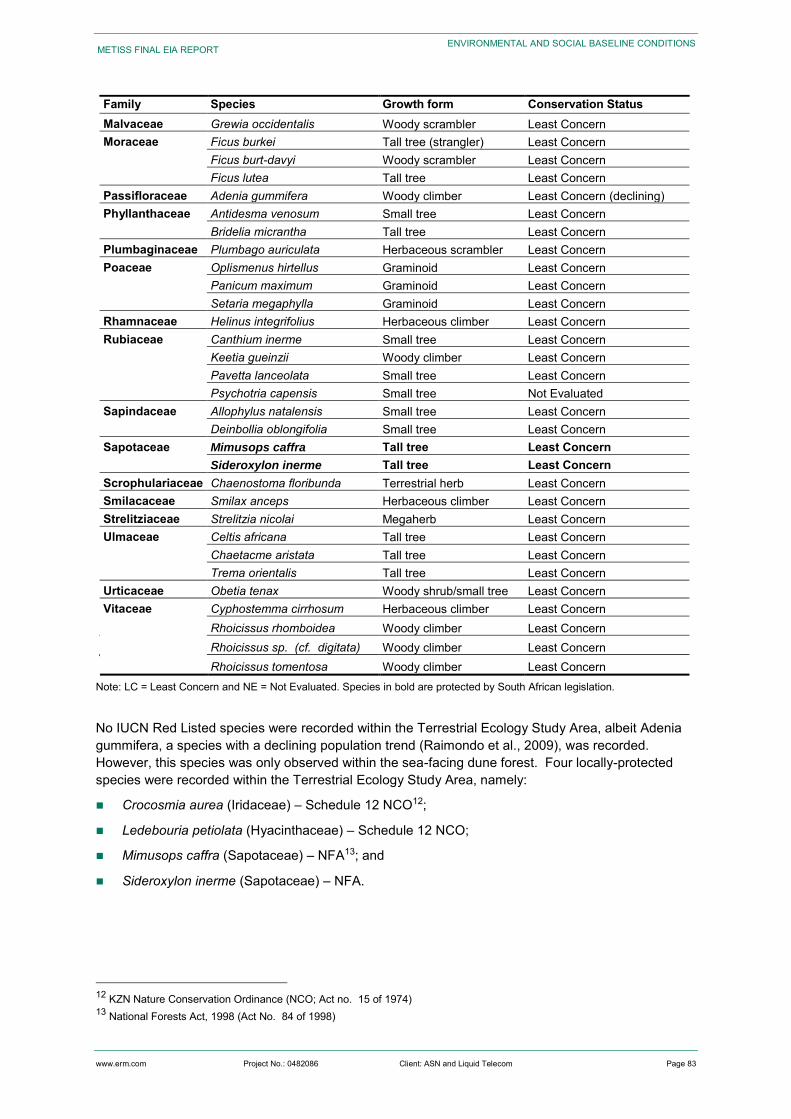
www.erm.com Project No.: 0482086 Client: ASN and Liquid Telecom Page 83
METISS FINAL EIA REPORT ENVIRONMENTAL AND SOCIAL BASELINE CONDITIONS
Family Species Growth form Conservation Status Malvaceae Grewia occidentalis Woody scrambler Least Concern Moraceae
Ficus burkei Tall tree (strangler) Least Concern Ficus burt-davyi Woody scrambler Least Concern Ficus lutea Tall tree Least Concern
Passifloraceae Adenia gummifera Woody climber Least Concern (declining) Phyllanthaceae
Antidesma venosum Small tree Least Concern Bridelia micrantha Tall tree Least Concern
Plumbaginaceae Plumbago auriculata Herbaceous scrambler Least Concern Poaceae
Oplismenus hirtellus Graminoid Least Concern Panicum maximum Graminoid Least Concern Setaria megaphylla Graminoid Least Concern
Rhamnaceae Helinus integrifolius Herbaceous climber Least Concern Rubiaceae
Canthium inerme Small tree Least Concern Keetia gueinzii Woody climber Least Concern Pavetta lanceolata Small tree Least Concern Psychotria capensis Small tree Not Evaluated
Sapindaceae
Allophylus natalensis Small tree Least Concern Deinbollia oblongifolia Small tree Least Concern
Sapotaceae
Mimusops caffra Tall tree Least Concern Sideroxylon inerme Tall tree Least Concern
Scrophulariaceae Chaenostoma floribunda Terrestrial herb Least Concern Smilacaceae Smilax anceps Herbaceous climber Least Concern Strelitziaceae Strelitzia nicolai Megaherb Least Concern Ulmaceae
Celtis africana Tall tree Least Concern Chaetacme aristata Tall tree Least Concern Trema orientalis Tall tree Least Concern
Urticaceae Obetia tenax Woody shrub/small tree Least Concern Vitaceae
Cyphostemma cirrhosum Herbaceous climber Least Concern Rhoicissus rhomboidea Woody climber Least Concern Rhoicissus sp. (cf. digitata) Woody climber Least Concern Rhoicissus tomentosa Woody climber Least Concern
Note: LC = Least Concern and NE = Not Evaluated. Species in bold are protected by South African legislation.
No IUCN Red Listed species were recorded within the Terrestrial Ecology Study Area, albeit Adenia gummifera, a species with a declining population trend (Raimondo et al., 2009), was recorded. However, this species was only observed within the sea-facing dune forest. Four locally-protected species were recorded within the Terrestrial Ecology Study Area, namely:
Crocosmia aurea (Iridaceae) – Schedule 12 NCO12;
Ledebouria petiolata (Hyacinthaceae) – Schedule 12 NCO;
Mimusops caffra (Sapotaceae) – NFA13; and
Sideroxylon inerme (Sapotaceae) – NFA.
12 KZN Nature Conservation Ordinance (NCO; Act no. 15 of 1974) 13 National Forests Act, 1998 (Act No. 84 of 1998)
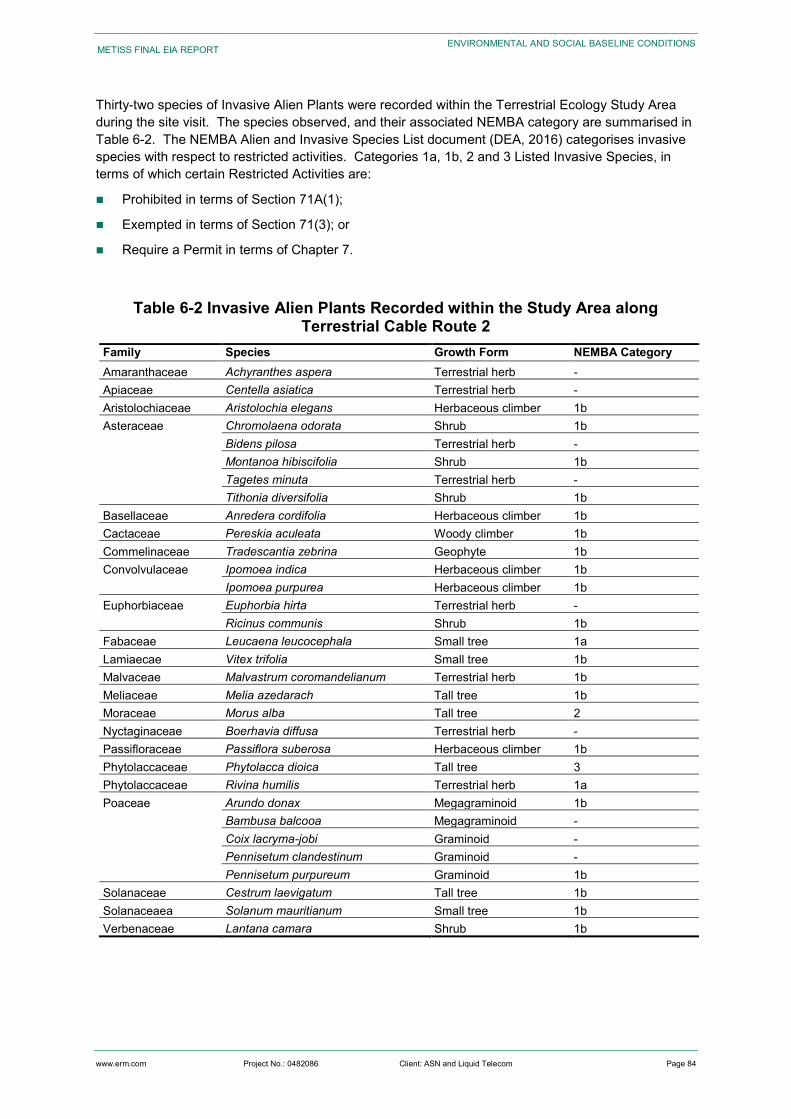
www.erm.com Project No.: 0482086 Client: ASN and Liquid Telecom Page 84
METISS FINAL EIA REPORT ENVIRONMENTAL AND SOCIAL BASELINE CONDITIONS
Thirty-two species of Invasive Alien Plants were recorded within the Terrestrial Ecology Study Area during the site visit. The species observed, and their associated NEMBA category are summarised in Table 6-2. The NEMBA Alien and Invasive Species List document (DEA, 2016) categorises invasive species with respect to restricted activities. Categories 1a, 1b, 2 and 3 Listed Invasive Species, in terms of which certain Restricted Activities are:
Prohibited in terms of Section 71A(1);
Exempted in terms of Section 71(3); or
Require a Permit in terms of Chapter 7.
Table 6-2 Invasive Alien Plants Recorded within the Study Area along Terrestrial Cable Route 2
Family Species Growth Form NEMBA Category Amaranthaceae Achyranthes aspera Terrestrial herb - Apiaceae Centella asiatica Terrestrial herb - Aristolochiaceae Aristolochia elegans Herbaceous climber 1b Asteraceae
Chromolaena odorata Shrub 1b Bidens pilosa Terrestrial herb - Montanoa hibiscifolia Shrub 1b Tagetes minuta Terrestrial herb - Tithonia diversifolia Shrub 1b
Basellaceae Anredera cordifolia Herbaceous climber 1b Cactaceae Pereskia aculeata Woody climber 1b Commelinaceae Tradescantia zebrina Geophyte 1b Convolvulaceae Ipomoea indica Herbaceous climber 1b
Ipomoea purpurea Herbaceous climber 1b Euphorbiaceae Euphorbia hirta Terrestrial herb -
Ricinus communis Shrub 1b Fabaceae Leucaena leucocephala Small tree 1a Lamiaecae Vitex trifolia Small tree 1b Malvaceae Malvastrum coromandelianum Terrestrial herb 1b Meliaceae Melia azedarach Tall tree 1b Moraceae Morus alba Tall tree 2 Nyctaginaceae Boerhavia diffusa Terrestrial herb - Passifloraceae Passiflora suberosa Herbaceous climber 1b Phytolaccaceae Phytolacca dioica Tall tree 3 Phytolaccaceae Rivina humilis Terrestrial herb 1a Poaceae
Arundo donax Megagraminoid 1b Bambusa balcooa Megagraminoid - Coix lacryma-jobi Graminoid - Pennisetum clandestinum Graminoid - Pennisetum purpureum Graminoid 1b
Solanaceae Cestrum laevigatum Tall tree 1b Solanaceaea Solanum mauritianum Small tree 1b Verbenaceae Lantana camara Shrub 1b
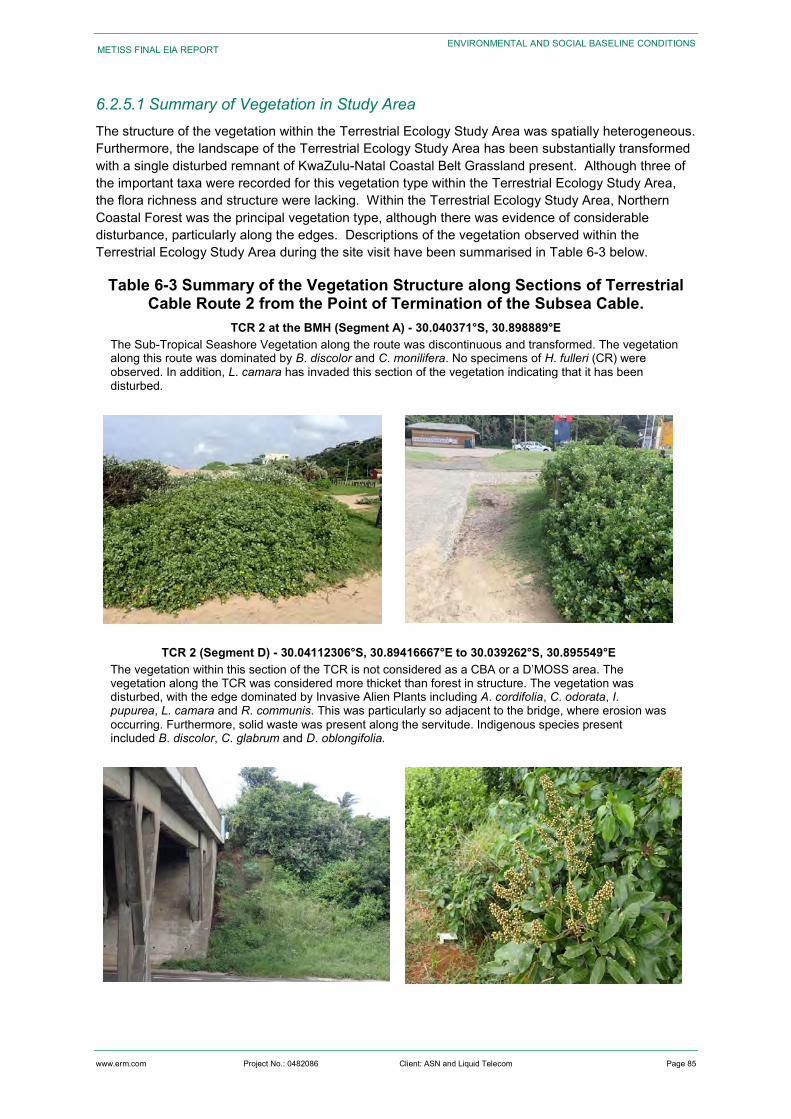
www.erm.com Project No.: 0482086 Client: ASN and Liquid Telecom Page 85
METISS FINAL EIA REPORT ENVIRONMENTAL AND SOCIAL BASELINE CONDITIONS
6.2.5.1 Summary of Vegetation in Study Area The structure of the vegetation within the Terrestrial Ecology Study Area was spatially heterogeneous. Furthermore, the landscape of the Terrestrial Ecology Study Area has been substantially transformed with a single disturbed remnant of KwaZulu-Natal Coastal Belt Grassland present. Although three of the important taxa were recorded for this vegetation type within the Terrestrial Ecology Study Area, the flora richness and structure were lacking. Within the Terrestrial Ecology Study Area, Northern Coastal Forest was the principal vegetation type, although there was evidence of considerable disturbance, particularly along the edges. Descriptions of the vegetation observed within the Terrestrial Ecology Study Area during the site visit have been summarised in Table 6-3 below.
Table 6-3 Summary of the Vegetation Structure along Sections of Terrestrial Cable Route 2 from the Point of Termination of the Subsea Cable.
TCR 2 at the BMH (Segment A) - 30.040371°S, 30.898889°E The Sub-Tropical Seashore Vegetation along the route was discontinuous and transformed. The vegetation along this route was dominated by B. discolor and C. monilifera. No specimens of H. fulleri (CR) were observed. In addition, L. camara has invaded this section of the vegetation indicating that it has been disturbed.
TCR 2 (Segment D) - 30.04112306°S, 30.89416667°E to 30.039262°S, 30.895549°E The vegetation within this section of the TCR is not considered as a CBA or a D’MOSS area. The vegetation along the TCR was considered more thicket than forest in structure. The vegetation was disturbed, with the edge dominated by Invasive Alien Plants including A. cordifolia, C. odorata, I. pupurea, L. camara and R. communis. This was particularly so adjacent to the bridge, where erosion was occurring. Furthermore, solid waste was present along the servitude. Indigenous species present included B. discolor, C. glabrum and D. oblongifolia.
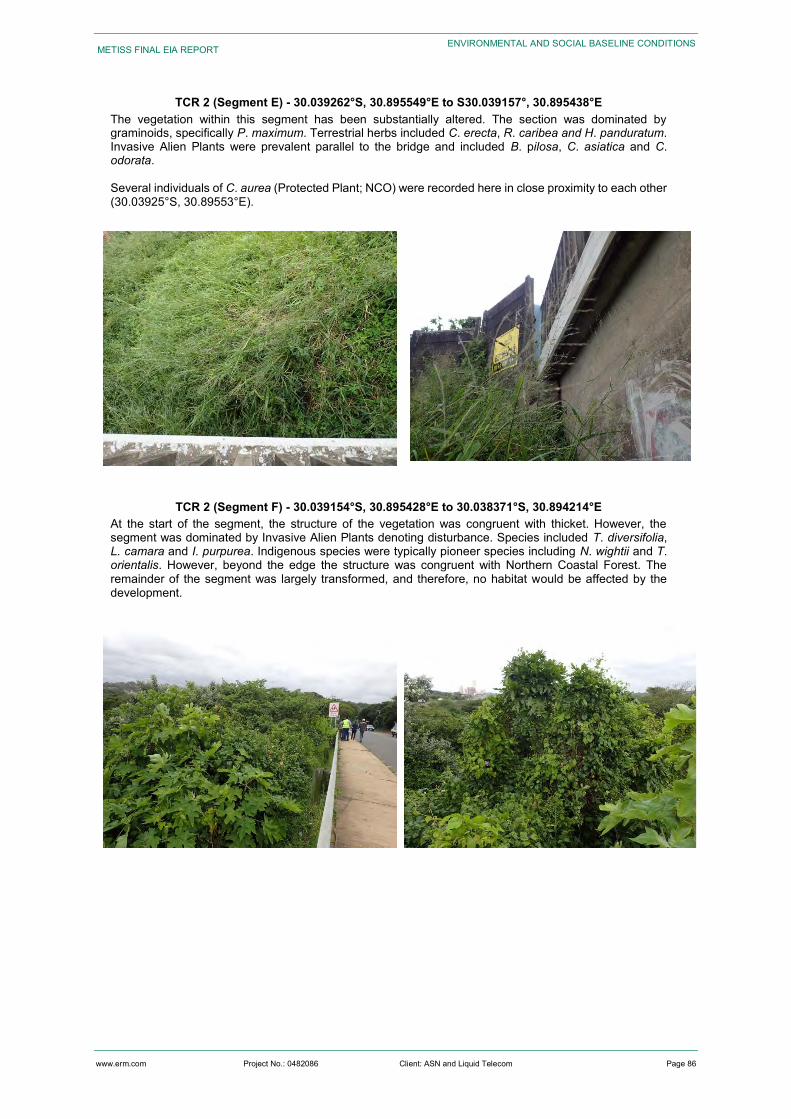
www.erm.com Project No.: 0482086 Client: ASN and Liquid Telecom Page 86
METISS FINAL EIA REPORT ENVIRONMENTAL AND SOCIAL BASELINE CONDITIONS
TCR 2 (Segment E) - 30.039262°S, 30.895549°E to S30.039157°, 30.895438°E The vegetation within this segment has been substantially altered. The section was dominated by graminoids, specifically P. maximum. Terrestrial herbs included C. erecta, R. caribea and H. panduratum. Invasive Alien Plants were prevalent parallel to the bridge and included B. pilosa, C. asiatica and C. odorata. Several individuals of C. aurea (Protected Plant; NCO) were recorded here in close proximity to each other (30.03925°S, 30.89553°E).
TCR 2 (Segment F) - 30.039154°S, 30.895428°E to 30.038371°S, 30.894214°E
At the start of the segment, the structure of the vegetation was congruent with thicket. However, the segment was dominated by Invasive Alien Plants denoting disturbance. Species included T. diversifolia, L. camara and I. purpurea. Indigenous species were typically pioneer species including N. wightii and T. orientalis. However, beyond the edge the structure was congruent with Northern Coastal Forest. The remainder of the segment was largely transformed, and therefore, no habitat would be affected by the development.
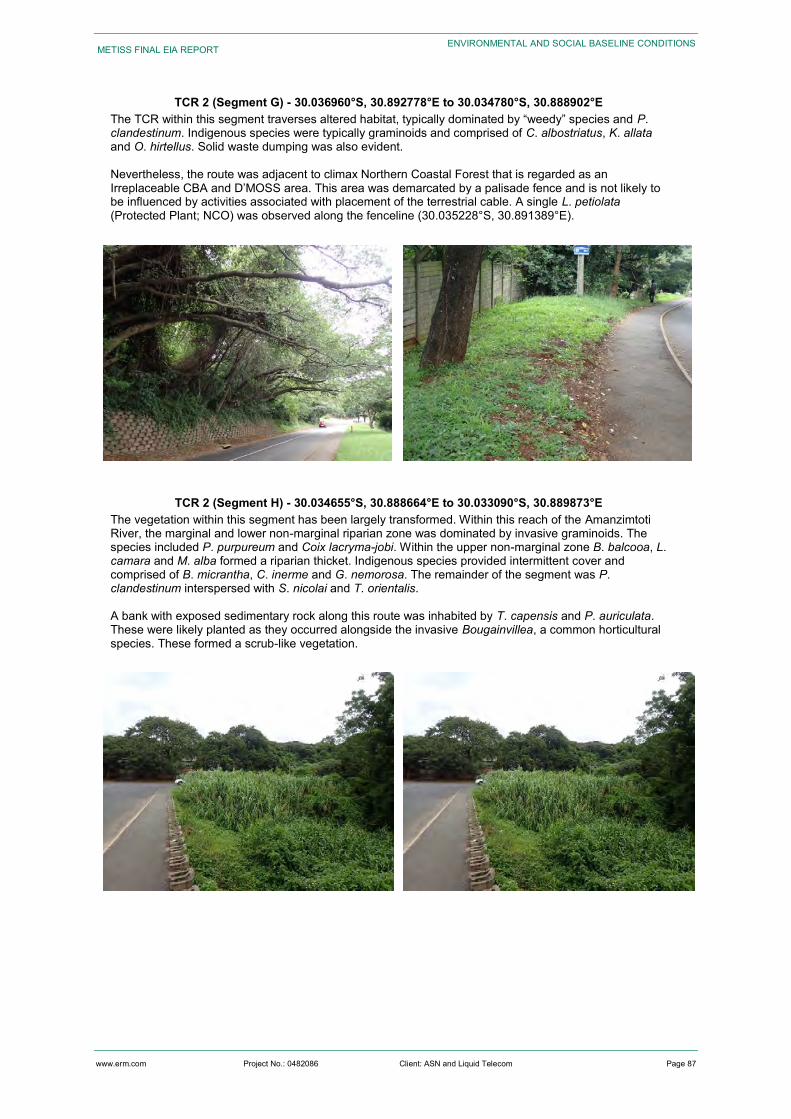
www.erm.com Project No.: 0482086 Client: ASN and Liquid Telecom Page 87
METISS FINAL EIA REPORT ENVIRONMENTAL AND SOCIAL BASELINE CONDITIONS
TCR 2 (Segment G) - 30.036960°S, 30.892778°E to 30.034780°S, 30.888902°E The TCR within this segment traverses altered habitat, typically dominated by “weedy” species and P. clandestinum. Indigenous species were typically graminoids and comprised of C. albostriatus, K. allata and O. hirtellus. Solid waste dumping was also evident. Nevertheless, the route was adjacent to climax Northern Coastal Forest that is regarded as an Irreplaceable CBA and D’MOSS area. This area was demarcated by a palisade fence and is not likely to be influenced by activities associated with placement of the terrestrial cable. A single L. petiolata (Protected Plant; NCO) was observed along the fenceline (30.035228°S, 30.891389°E).
TCR 2 (Segment H) - 30.034655°S, 30.888664°E to 30.033090°S, 30.889873°E
The vegetation within this segment has been largely transformed. Within this reach of the Amanzimtoti River, the marginal and lower non-marginal riparian zone was dominated by invasive graminoids. The species included P. purpureum and Coix lacryma-jobi. Within the upper non-marginal zone B. balcooa, L. camara and M. alba formed a riparian thicket. Indigenous species provided intermittent cover and comprised of B. micrantha, C. inerme and G. nemorosa. The remainder of the segment was P. clandestinum interspersed with S. nicolai and T. orientalis. A bank with exposed sedimentary rock along this route was inhabited by T. capensis and P. auriculata. These were likely planted as they occurred alongside the invasive Bougainvillea, a common horticultural species. These formed a scrub-like vegetation.
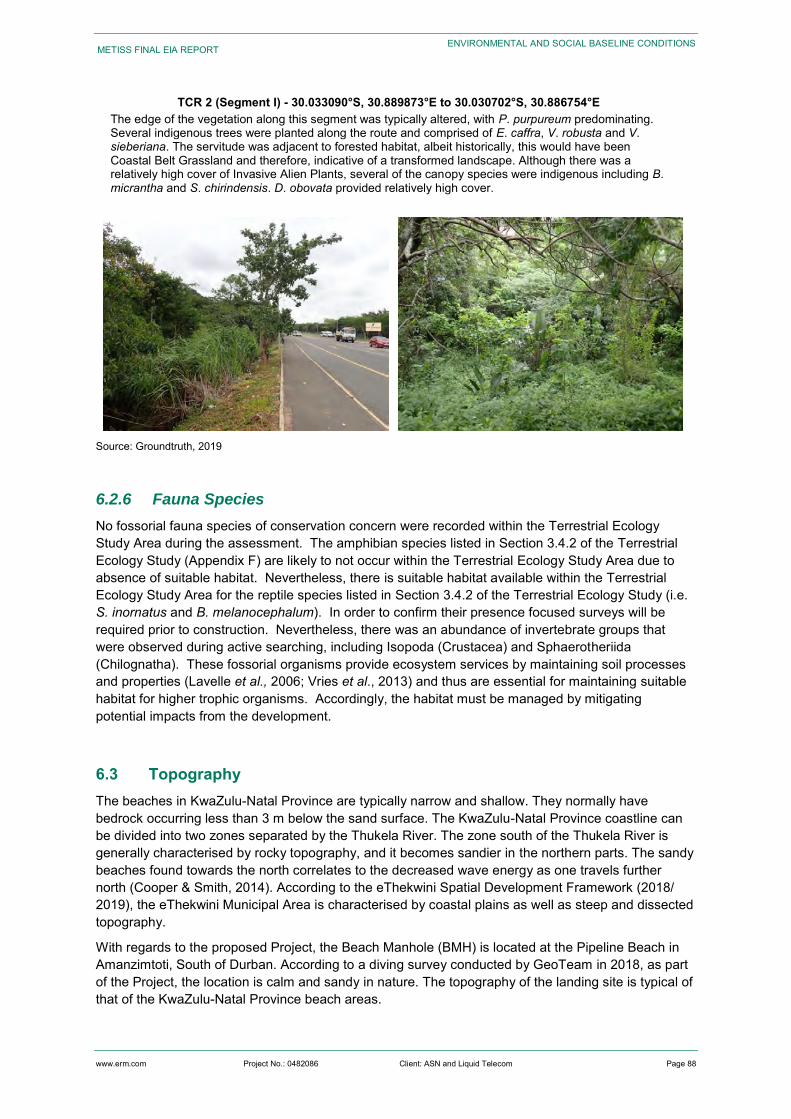
www.erm.com Project No.: 0482086 Client: ASN and Liquid Telecom Page 88
METISS FINAL EIA REPORT ENVIRONMENTAL AND SOCIAL BASELINE CONDITIONS
TCR 2 (Segment I) - 30.033090°S, 30.889873°E to 30.030702°S, 30.886754°E The edge of the vegetation along this segment was typically altered, with P. purpureum predominating. Several indigenous trees were planted along the route and comprised of E. caffra, V. robusta and V. sieberiana. The servitude was adjacent to forested habitat, albeit historically, this would have been Coastal Belt Grassland and therefore, indicative of a transformed landscape. Although there was a relatively high cover of Invasive Alien Plants, several of the canopy species were indigenous including B. micrantha and S. chirindensis. D. obovata provided relatively high cover.
Source: Groundtruth, 2019
6.2.6 Fauna Species
No fossorial fauna species of conservation concern were recorded within the Terrestrial Ecology Study Area during the assessment. The amphibian species listed in Section 3.4.2 of the Terrestrial Ecology Study (Appendix F) are likely to not occur within the Terrestrial Ecology Study Area due to absence of suitable habitat. Nevertheless, there is suitable habitat available within the Terrestrial Ecology Study Area for the reptile species listed in Section 3.4.2 of the Terrestrial Ecology Study (i.e. S. inornatus and B. melanocephalum). In order to confirm their presence focused surveys will be required prior to construction. Nevertheless, there was an abundance of invertebrate groups that were observed during active searching, including Isopoda (Crustacea) and Sphaerotheriida (Chilognatha). These fossorial organisms provide ecosystem services by maintaining soil processes and properties (Lavelle et al., 2006; Vries et al., 2013) and thus are essential for maintaining suitable habitat for higher trophic organisms. Accordingly, the habitat must be managed by mitigating potential impacts from the development.
6.3 Topography The beaches in KwaZulu-Natal Province are typically narrow and shallow. They normally have bedrock occurring less than 3 m below the sand surface. The KwaZulu-Natal Province coastline can be divided into two zones separated by the Thukela River. The zone south of the Thukela River is generally characterised by rocky topography, and it becomes sandier in the northern parts. The sandy beaches found towards the north correlates to the decreased wave energy as one travels further north (Cooper & Smith, 2014). According to the eThekwini Spatial Development Framework (2018/ 2019), the eThekwini Municipal Area is characterised by coastal plains as well as steep and dissected topography.
With regards to the proposed Project, the Beach Manhole (BMH) is located at the Pipeline Beach in Amanzimtoti, South of Durban. According to a diving survey conducted by GeoTeam in 2018, as part of the Project, the location is calm and sandy in nature. The topography of the landing site is typical of that of the KwaZulu-Natal Province beach areas.
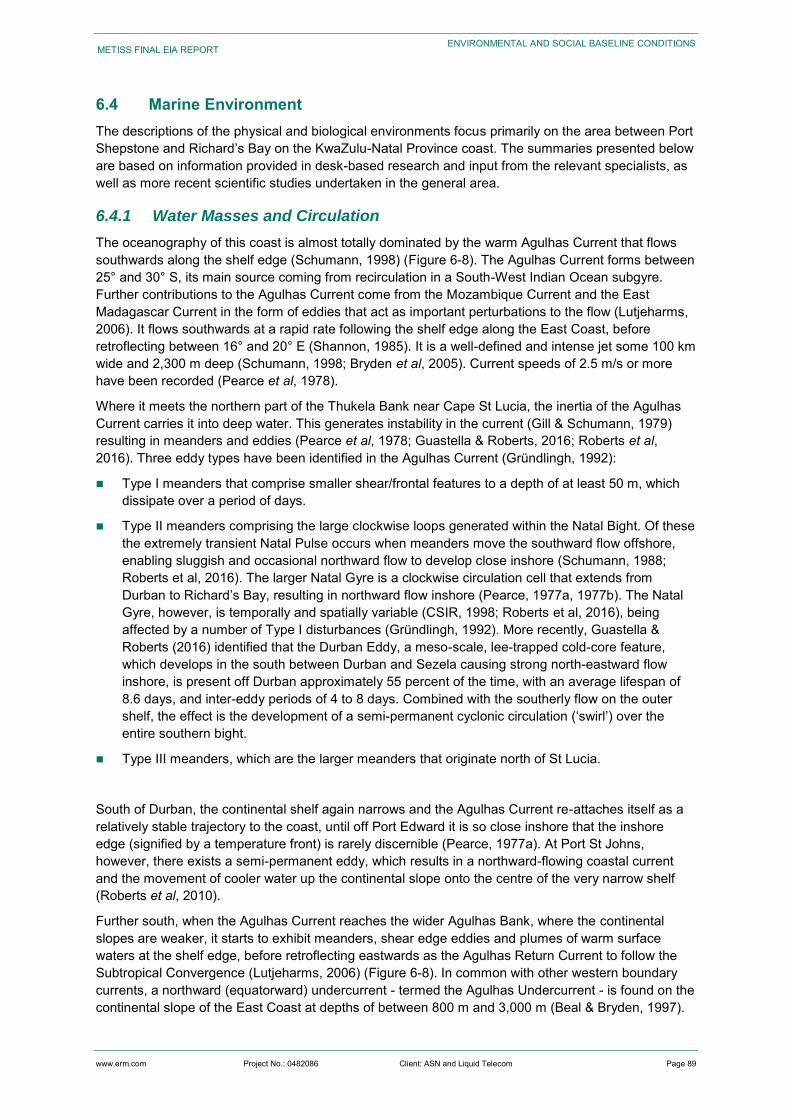
www.erm.com Project No.: 0482086 Client: ASN and Liquid Telecom Page 89
METISS FINAL EIA REPORT ENVIRONMENTAL AND SOCIAL BASELINE CONDITIONS
6.4 Marine Environment The descriptions of the physical and biological environments focus primarily on the area between Port Shepstone and Richard’s Bay on the KwaZulu-Natal Province coast. The summaries presented below are based on information provided in desk-based research and input from the relevant specialists, as well as more recent scientific studies undertaken in the general area.
6.4.1 Water Masses and Circulation
The oceanography of this coast is almost totally dominated by the warm Agulhas Current that flows southwards along the shelf edge (Schumann, 1998) (Figure 6-8). The Agulhas Current forms between 25° and 30° S, its main source coming from recirculation in a South-West Indian Ocean subgyre. Further contributions to the Agulhas Current come from the Mozambique Current and the East Madagascar Current in the form of eddies that act as important perturbations to the flow (Lutjeharms, 2006). It flows southwards at a rapid rate following the shelf edge along the East Coast, before retroflecting between 16° and 20° E (Shannon, 1985). It is a well-defined and intense jet some 100 km wide and 2,300 m deep (Schumann, 1998; Bryden et al, 2005). Current speeds of 2.5 m/s or more have been recorded (Pearce et al, 1978).
Where it meets the northern part of the Thukela Bank near Cape St Lucia, the inertia of the Agulhas Current carries it into deep water. This generates instability in the current (Gill & Schumann, 1979) resulting in meanders and eddies (Pearce et al, 1978; Guastella & Roberts, 2016; Roberts et al, 2016). Three eddy types have been identified in the Agulhas Current (Gründlingh, 1992):
Type I meanders that comprise smaller shear/frontal features to a depth of at least 50 m, which dissipate over a period of days.
Type II meanders comprising the large clockwise loops generated within the Natal Bight. Of these the extremely transient Natal Pulse occurs when meanders move the southward flow offshore, enabling sluggish and occasional northward flow to develop close inshore (Schumann, 1988; Roberts et al, 2016). The larger Natal Gyre is a clockwise circulation cell that extends from Durban to Richard’s Bay, resulting in northward flow inshore (Pearce, 1977a, 1977b). The Natal Gyre, however, is temporally and spatially variable (CSIR, 1998; Roberts et al, 2016), being affected by a number of Type I disturbances (Gründlingh, 1992). More recently, Guastella & Roberts (2016) identified that the Durban Eddy, a meso-scale, lee-trapped cold-core feature, which develops in the south between Durban and Sezela causing strong north-eastward flow inshore, is present off Durban approximately 55 percent of the time, with an average lifespan of 8.6 days, and inter-eddy periods of 4 to 8 days. Combined with the southerly flow on the outer shelf, the effect is the development of a semi-permanent cyclonic circulation (‘swirl’) over the entire southern bight.
Type III meanders, which are the larger meanders that originate north of St Lucia.
South of Durban, the continental shelf again narrows and the Agulhas Current re-attaches itself as a relatively stable trajectory to the coast, until off Port Edward it is so close inshore that the inshore edge (signified by a temperature front) is rarely discernible (Pearce, 1977a). At Port St Johns, however, there exists a semi-permanent eddy, which results in a northward-flowing coastal current and the movement of cooler water up the continental slope onto the centre of the very narrow shelf (Roberts et al, 2010).
Further south, when the Agulhas Current reaches the wider Agulhas Bank, where the continental slopes are weaker, it starts to exhibit meanders, shear edge eddies and plumes of warm surface waters at the shelf edge, before retroflecting eastwards as the Agulhas Return Current to follow the Subtropical Convergence (Lutjeharms, 2006) (Figure 6-8). In common with other western boundary currents, a northward (equatorward) undercurrent - termed the Agulhas Undercurrent - is found on the continental slope of the East Coast at depths of between 800 m and 3,000 m (Beal & Bryden, 1997).
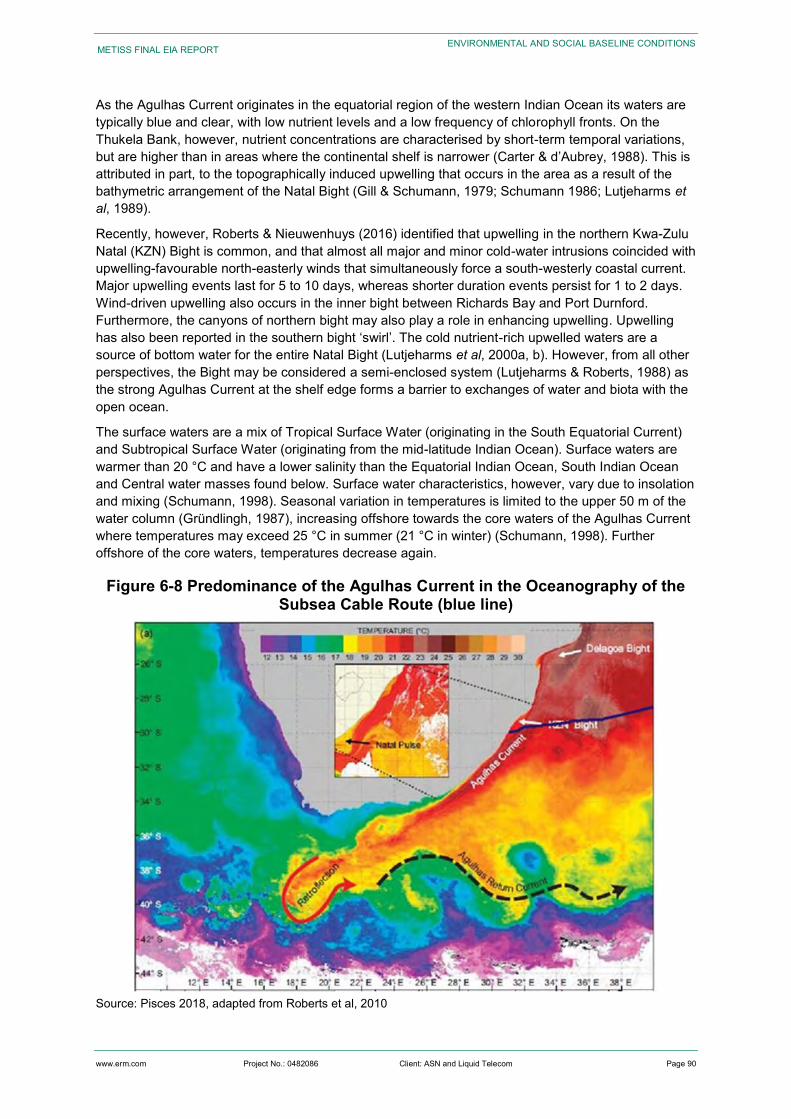
www.erm.com Project No.: 0482086 Client: ASN and Liquid Telecom Page 90
METISS FINAL EIA REPORT ENVIRONMENTAL AND SOCIAL BASELINE CONDITIONS
As the Agulhas Current originates in the equatorial region of the western Indian Ocean its waters are typically blue and clear, with low nutrient levels and a low frequency of chlorophyll fronts. On the Thukela Bank, however, nutrient concentrations are characterised by short-term temporal variations, but are higher than in areas where the continental shelf is narrower (Carter & d’Aubrey, 1988). This is attributed in part, to the topographically induced upwelling that occurs in the area as a result of the bathymetric arrangement of the Natal Bight (Gill & Schumann, 1979; Schumann 1986; Lutjeharms et al, 1989).
Recently, however, Roberts & Nieuwenhuys (2016) identified that upwelling in the northern Kwa-Zulu Natal (KZN) Bight is common, and that almost all major and minor cold-water intrusions coincided with upwelling-favourable north-easterly winds that simultaneously force a south-westerly coastal current. Major upwelling events last for 5 to 10 days, whereas shorter duration events persist for 1 to 2 days. Wind-driven upwelling also occurs in the inner bight between Richards Bay and Port Durnford. Furthermore, the canyons of northern bight may also play a role in enhancing upwelling. Upwelling has also been reported in the southern bight ‘swirl’. The cold nutrient-rich upwelled waters are a source of bottom water for the entire Natal Bight (Lutjeharms et al, 2000a, b). However, from all other perspectives, the Bight may be considered a semi-enclosed system (Lutjeharms & Roberts, 1988) as the strong Agulhas Current at the shelf edge forms a barrier to exchanges of water and biota with the open ocean.
The surface waters are a mix of Tropical Surface Water (originating in the South Equatorial Current) and Subtropical Surface Water (originating from the mid-latitude Indian Ocean). Surface waters are warmer than 20 °C and have a lower salinity than the Equatorial Indian Ocean, South Indian Ocean and Central water masses found below. Surface water characteristics, however, vary due to insolation and mixing (Schumann, 1998). Seasonal variation in temperatures is limited to the upper 50 m of the water column (Gründlingh, 1987), increasing offshore towards the core waters of the Agulhas Current where temperatures may exceed 25 °C in summer (21 °C in winter) (Schumann, 1998). Further offshore of the core waters, temperatures decrease again.
Figure 6-8 Predominance of the Agulhas Current in the Oceanography of the Subsea Cable Route (blue line)
Source: Pisces 2018, adapted from Roberts et al, 2010
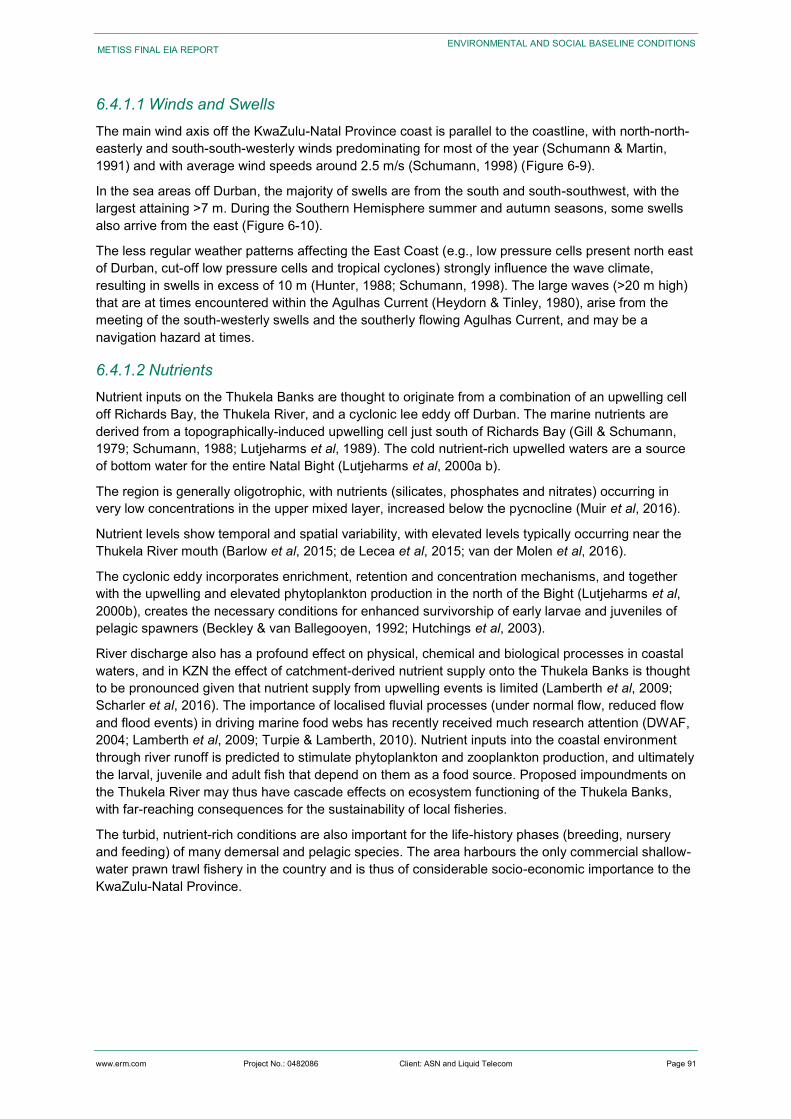
www.erm.com Project No.: 0482086 Client: ASN and Liquid Telecom Page 91
METISS FINAL EIA REPORT ENVIRONMENTAL AND SOCIAL BASELINE CONDITIONS
6.4.1.1 Winds and Swells The main wind axis off the KwaZulu-Natal Province coast is parallel to the coastline, with north-north-easterly and south-south-westerly winds predominating for most of the year (Schumann & Martin, 1991) and with average wind speeds around 2.5 m/s (Schumann, 1998) (Figure 6-9).
In the sea areas off Durban, the majority of swells are from the south and south-southwest, with the largest attaining >7 m. During the Southern Hemisphere summer and autumn seasons, some swells also arrive from the east (Figure 6-10).
The less regular weather patterns affecting the East Coast (e.g., low pressure cells present north east of Durban, cut-off low pressure cells and tropical cyclones) strongly influence the wave climate, resulting in swells in excess of 10 m (Hunter, 1988; Schumann, 1998). The large waves (>20 m high) that are at times encountered within the Agulhas Current (Heydorn & Tinley, 1980), arise from the meeting of the south-westerly swells and the southerly flowing Agulhas Current, and may be a navigation hazard at times.
6.4.1.2 Nutrients Nutrient inputs on the Thukela Banks are thought to originate from a combination of an upwelling cell off Richards Bay, the Thukela River, and a cyclonic lee eddy off Durban. The marine nutrients are derived from a topographically-induced upwelling cell just south of Richards Bay (Gill & Schumann, 1979; Schumann, 1988; Lutjeharms et al, 1989). The cold nutrient-rich upwelled waters are a source of bottom water for the entire Natal Bight (Lutjeharms et al, 2000a b).
The region is generally oligotrophic, with nutrients (silicates, phosphates and nitrates) occurring in very low concentrations in the upper mixed layer, increased below the pycnocline (Muir et al, 2016).
Nutrient levels show temporal and spatial variability, with elevated levels typically occurring near the Thukela River mouth (Barlow et al, 2015; de Lecea et al, 2015; van der Molen et al, 2016).
The cyclonic eddy incorporates enrichment, retention and concentration mechanisms, and together with the upwelling and elevated phytoplankton production in the north of the Bight (Lutjeharms et al, 2000b), creates the necessary conditions for enhanced survivorship of early larvae and juveniles of pelagic spawners (Beckley & van Ballegooyen, 1992; Hutchings et al, 2003).
River discharge also has a profound effect on physical, chemical and biological processes in coastal waters, and in KZN the effect of catchment-derived nutrient supply onto the Thukela Banks is thought to be pronounced given that nutrient supply from upwelling events is limited (Lamberth et al, 2009; Scharler et al, 2016). The importance of localised fluvial processes (under normal flow, reduced flow and flood events) in driving marine food webs has recently received much research attention (DWAF, 2004; Lamberth et al, 2009; Turpie & Lamberth, 2010). Nutrient inputs into the coastal environment through river runoff is predicted to stimulate phytoplankton and zooplankton production, and ultimately the larval, juvenile and adult fish that depend on them as a food source. Proposed impoundments on the Thukela River may thus have cascade effects on ecosystem functioning of the Thukela Banks, with far-reaching consequences for the sustainability of local fisheries.
The turbid, nutrient-rich conditions are also important for the life-history phases (breeding, nursery and feeding) of many demersal and pelagic species. The area harbours the only commercial shallow-water prawn trawl fishery in the country and is thus of considerable socio-economic importance to the KwaZulu-Natal Province.
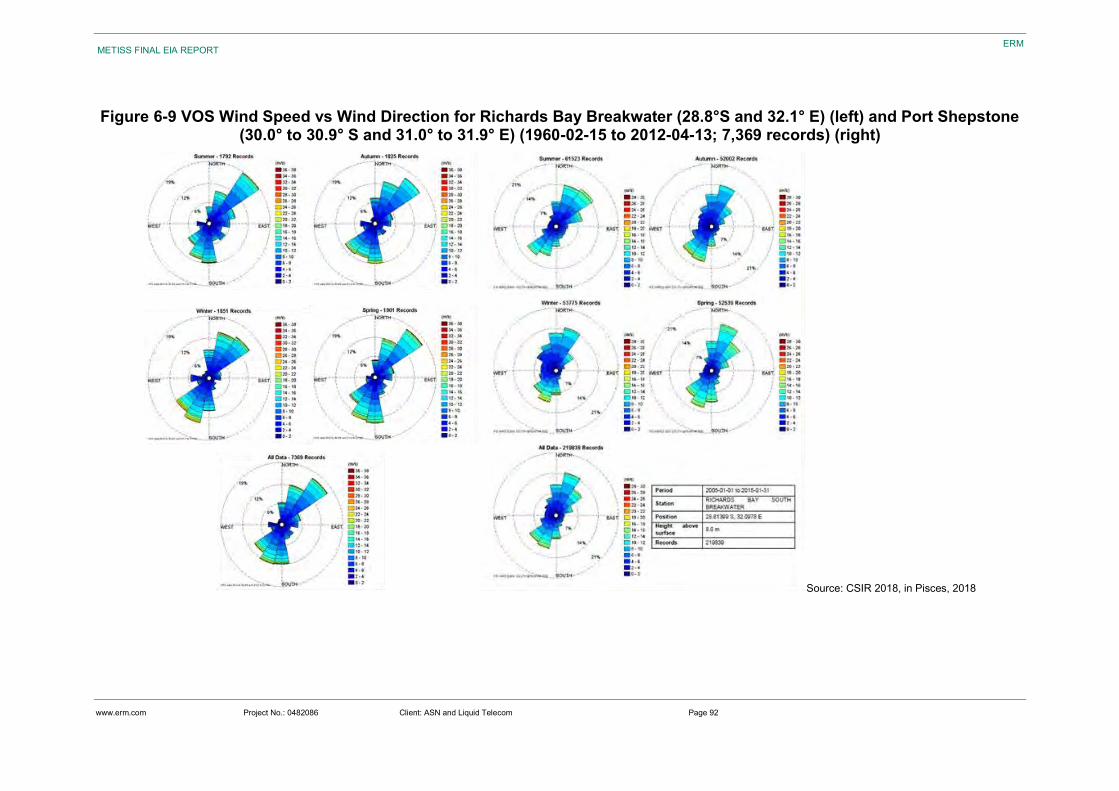
www.erm.com Project No.: 0482086 Client: ASN and Liquid Telecom Page 92
METISS FINAL EIA REPORT
ERM
Figure 6-9 VOS Wind Speed vs Wind Direction for Richards Bay Breakwater (28.8°S and 32.1° E) (left) and Port Shepstone (30.0° to 30.9° S and 31.0° to 31.9° E) (1960-02-15 to 2012-04-13; 7,369 records) (right)
Source: CSIR 2018, in Pisces, 2018
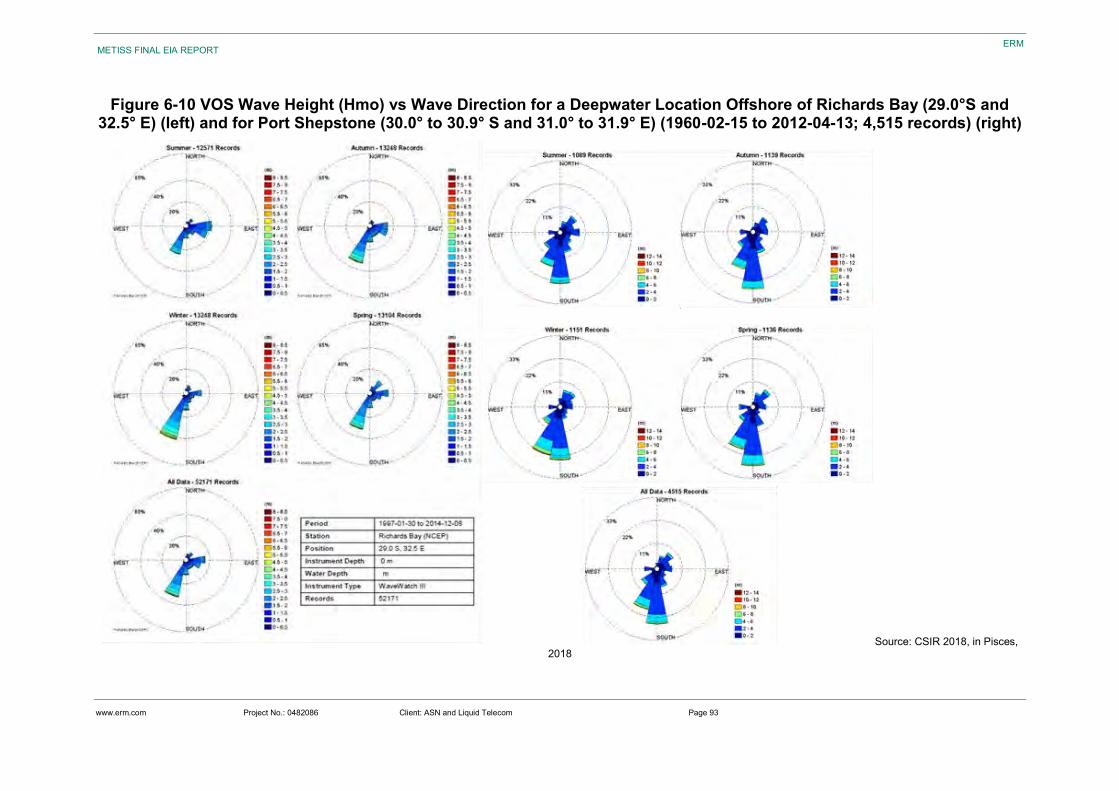
www.erm.com Project No.: 0482086 Client: ASN and Liquid Telecom Page 93
METISS FINAL EIA REPORT
ERM
Figure 6-10 VOS Wave Height (Hmo) vs Wave Direction for a Deepwater Location Offshore of Richards Bay (29.0°S and 32.5° E) (left) and for Port Shepstone (30.0° to 30.9° S and 31.0° to 31.9° E) (1960-02-15 to 2012-04-13; 4,515 records) (right)
Source: CSIR 2018, in Pisces, 2018
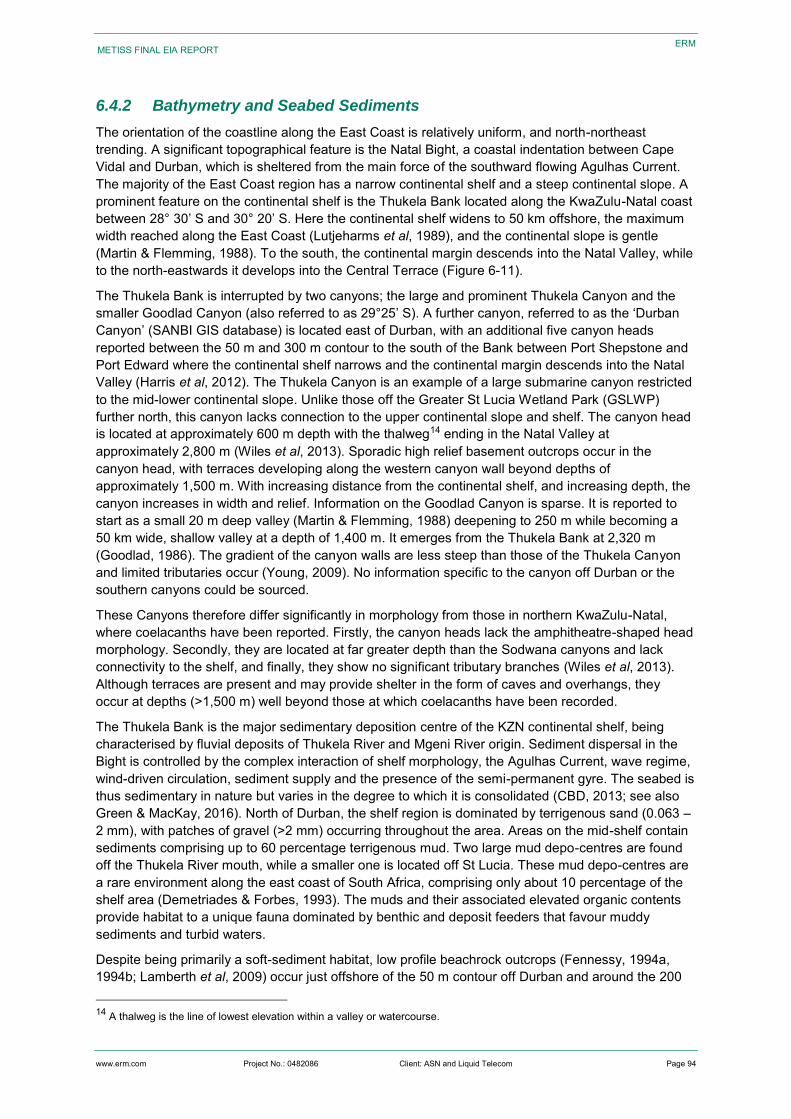
www.erm.com Project No.: 0482086 Client: ASN and Liquid Telecom Page 94
METISS FINAL EIA REPORT
ERM
6.4.2 Bathymetry and Seabed Sediments
The orientation of the coastline along the East Coast is relatively uniform, and north-northeast trending. A significant topographical feature is the Natal Bight, a coastal indentation between Cape Vidal and Durban, which is sheltered from the main force of the southward flowing Agulhas Current. The majority of the East Coast region has a narrow continental shelf and a steep continental slope. A prominent feature on the continental shelf is the Thukela Bank located along the KwaZulu-Natal coast between 28° 30’ S and 30° 20’ S. Here the continental shelf widens to 50 km offshore, the maximum width reached along the East Coast (Lutjeharms et al, 1989), and the continental slope is gentle (Martin & Flemming, 1988). To the south, the continental margin descends into the Natal Valley, while to the north-eastwards it develops into the Central Terrace (Figure 6-11).
The Thukela Bank is interrupted by two canyons; the large and prominent Thukela Canyon and the smaller Goodlad Canyon (also referred to as 29°25’ S). A further canyon, referred to as the ‘Durban Canyon’ (SANBI GIS database) is located east of Durban, with an additional five canyon heads reported between the 50 m and 300 m contour to the south of the Bank between Port Shepstone and Port Edward where the continental shelf narrows and the continental margin descends into the Natal Valley (Harris et al, 2012). The Thukela Canyon is an example of a large submarine canyon restricted to the mid-lower continental slope. Unlike those off the Greater St Lucia Wetland Park (GSLWP) further north, this canyon lacks connection to the upper continental slope and shelf. The canyon head is located at approximately 600 m depth with the thalweg14 ending in the Natal Valley at approximately 2,800 m (Wiles et al, 2013). Sporadic high relief basement outcrops occur in the canyon head, with terraces developing along the western canyon wall beyond depths of approximately 1,500 m. With increasing distance from the continental shelf, and increasing depth, the canyon increases in width and relief. Information on the Goodlad Canyon is sparse. It is reported to start as a small 20 m deep valley (Martin & Flemming, 1988) deepening to 250 m while becoming a 50 km wide, shallow valley at a depth of 1,400 m. It emerges from the Thukela Bank at 2,320 m (Goodlad, 1986). The gradient of the canyon walls are less steep than those of the Thukela Canyon and limited tributaries occur (Young, 2009). No information specific to the canyon off Durban or the southern canyons could be sourced.
These Canyons therefore differ significantly in morphology from those in northern KwaZulu-Natal, where coelacanths have been reported. Firstly, the canyon heads lack the amphitheatre-shaped head morphology. Secondly, they are located at far greater depth than the Sodwana canyons and lack connectivity to the shelf, and finally, they show no significant tributary branches (Wiles et al, 2013). Although terraces are present and may provide shelter in the form of caves and overhangs, they occur at depths (>1,500 m) well beyond those at which coelacanths have been recorded.
The Thukela Bank is the major sedimentary deposition centre of the KZN continental shelf, being characterised by fluvial deposits of Thukela River and Mgeni River origin. Sediment dispersal in the Bight is controlled by the complex interaction of shelf morphology, the Agulhas Current, wave regime, wind-driven circulation, sediment supply and the presence of the semi-permanent gyre. The seabed is thus sedimentary in nature but varies in the degree to which it is consolidated (CBD, 2013; see also Green & MacKay, 2016). North of Durban, the shelf region is dominated by terrigenous sand (0.063 – 2 mm), with patches of gravel (>2 mm) occurring throughout the area. Areas on the mid-shelf contain sediments comprising up to 60 percentage terrigenous mud. Two large mud depo-centres are found off the Thukela River mouth, while a smaller one is located off St Lucia. These mud depo-centres are a rare environment along the east coast of South Africa, comprising only about 10 percentage of the shelf area (Demetriades & Forbes, 1993). The muds and their associated elevated organic contents provide habitat to a unique fauna dominated by benthic and deposit feeders that favour muddy sediments and turbid waters.
Despite being primarily a soft-sediment habitat, low profile beachrock outcrops (Fennessy, 1994a, 1994b; Lamberth et al, 2009) occur just offshore of the 50 m contour off Durban and around the 200 14 A thalweg is the line of lowest elevation within a valley or watercourse.
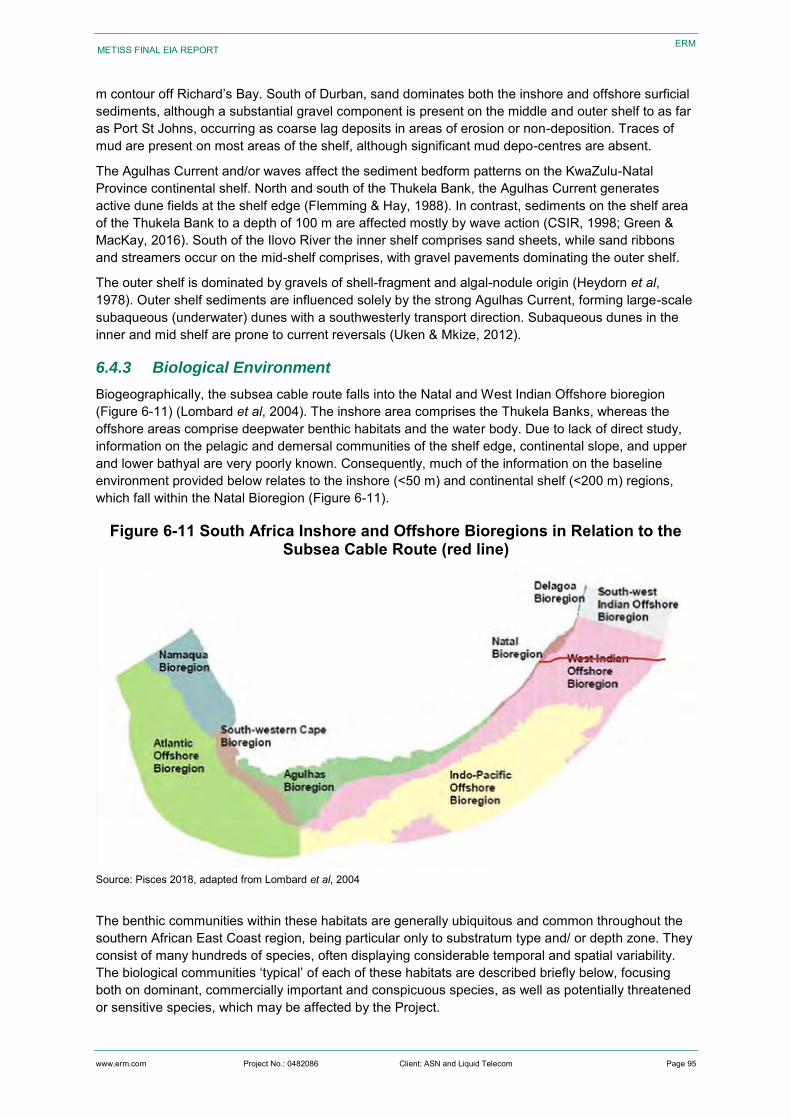
www.erm.com Project No.: 0482086 Client: ASN and Liquid Telecom Page 95
METISS FINAL EIA REPORT
ERM
m contour off Richard’s Bay. South of Durban, sand dominates both the inshore and offshore surficial sediments, although a substantial gravel component is present on the middle and outer shelf to as far as Port St Johns, occurring as coarse lag deposits in areas of erosion or non-deposition. Traces of mud are present on most areas of the shelf, although significant mud depo-centres are absent.
The Agulhas Current and/or waves affect the sediment bedform patterns on the KwaZulu-Natal Province continental shelf. North and south of the Thukela Bank, the Agulhas Current generates active dune fields at the shelf edge (Flemming & Hay, 1988). In contrast, sediments on the shelf area of the Thukela Bank to a depth of 100 m are affected mostly by wave action (CSIR, 1998; Green & MacKay, 2016). South of the Ilovo River the inner shelf comprises sand sheets, while sand ribbons and streamers occur on the mid-shelf comprises, with gravel pavements dominating the outer shelf.
The outer shelf is dominated by gravels of shell-fragment and algal-nodule origin (Heydorn et al, 1978). Outer shelf sediments are influenced solely by the strong Agulhas Current, forming large-scale subaqueous (underwater) dunes with a southwesterly transport direction. Subaqueous dunes in the inner and mid shelf are prone to current reversals (Uken & Mkize, 2012).
6.4.3 Biological Environment
Biogeographically, the subsea cable route falls into the Natal and West Indian Offshore bioregion (Figure 6-11) (Lombard et al, 2004). The inshore area comprises the Thukela Banks, whereas the offshore areas comprise deepwater benthic habitats and the water body. Due to lack of direct study, information on the pelagic and demersal communities of the shelf edge, continental slope, and upper and lower bathyal are very poorly known. Consequently, much of the information on the baseline environment provided below relates to the inshore (<50 m) and continental shelf (<200 m) regions, which fall within the Natal Bioregion (Figure 6-11).
Figure 6-11 South Africa Inshore and Offshore Bioregions in Relation to the Subsea Cable Route (red line)
Source: Pisces 2018, adapted from Lombard et al, 2004
The benthic communities within these habitats are generally ubiquitous and common throughout the southern African East Coast region, being particular only to substratum type and/ or depth zone. They consist of many hundreds of species, often displaying considerable temporal and spatial variability. The biological communities ‘typical’ of each of these habitats are described briefly below, focusing both on dominant, commercially important and conspicuous species, as well as potentially threatened or sensitive species, which may be affected by the Project.
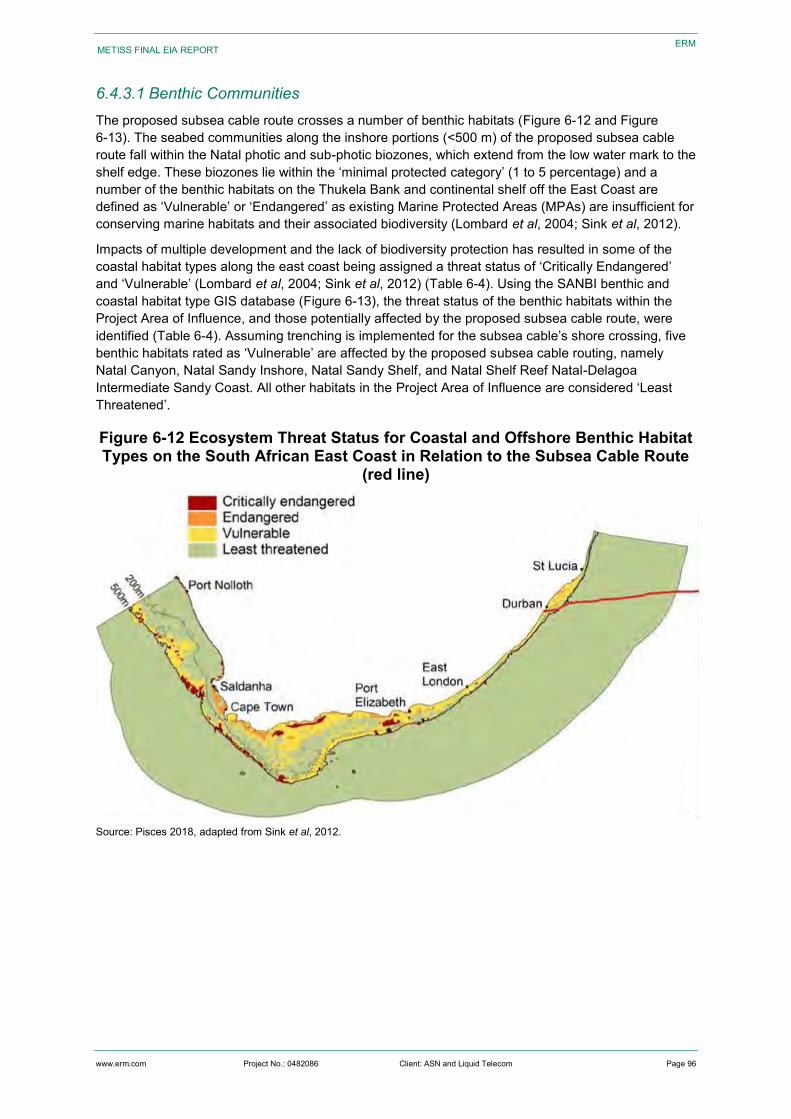
www.erm.com Project No.: 0482086 Client: ASN and Liquid Telecom Page 96
METISS FINAL EIA REPORT
ERM
6.4.3.1 Benthic Communities The proposed subsea cable route crosses a number of benthic habitats (Figure 6-12 and Figure 6-13). The seabed communities along the inshore portions (<500 m) of the proposed subsea cable route fall within the Natal photic and sub-photic biozones, which extend from the low water mark to the shelf edge. These biozones lie within the ‘minimal protected category’ (1 to 5 percentage) and a number of the benthic habitats on the Thukela Bank and continental shelf off the East Coast are defined as ‘Vulnerable’ or ‘Endangered’ as existing Marine Protected Areas (MPAs) are insufficient for conserving marine habitats and their associated biodiversity (Lombard et al, 2004; Sink et al, 2012).
Impacts of multiple development and the lack of biodiversity protection has resulted in some of the coastal habitat types along the east coast being assigned a threat status of ‘Critically Endangered’ and ‘Vulnerable’ (Lombard et al, 2004; Sink et al, 2012) (Table 6-4). Using the SANBI benthic and coastal habitat type GIS database (Figure 6-13), the threat status of the benthic habitats within the Project Area of Influence, and those potentially affected by the proposed subsea cable route, were identified (Table 6-4). Assuming trenching is implemented for the subsea cable’s shore crossing, five benthic habitats rated as ‘Vulnerable’ are affected by the proposed subsea cable routing, namely Natal Canyon, Natal Sandy Inshore, Natal Sandy Shelf, and Natal Shelf Reef Natal-Delagoa Intermediate Sandy Coast. All other habitats in the Project Area of Influence are considered ‘Least Threatened’.
Figure 6-12 Ecosystem Threat Status for Coastal and Offshore Benthic Habitat Types on the South African East Coast in Relation to the Subsea Cable Route
(red line)
Source: Pisces 2018, adapted from Sink et al, 2012.
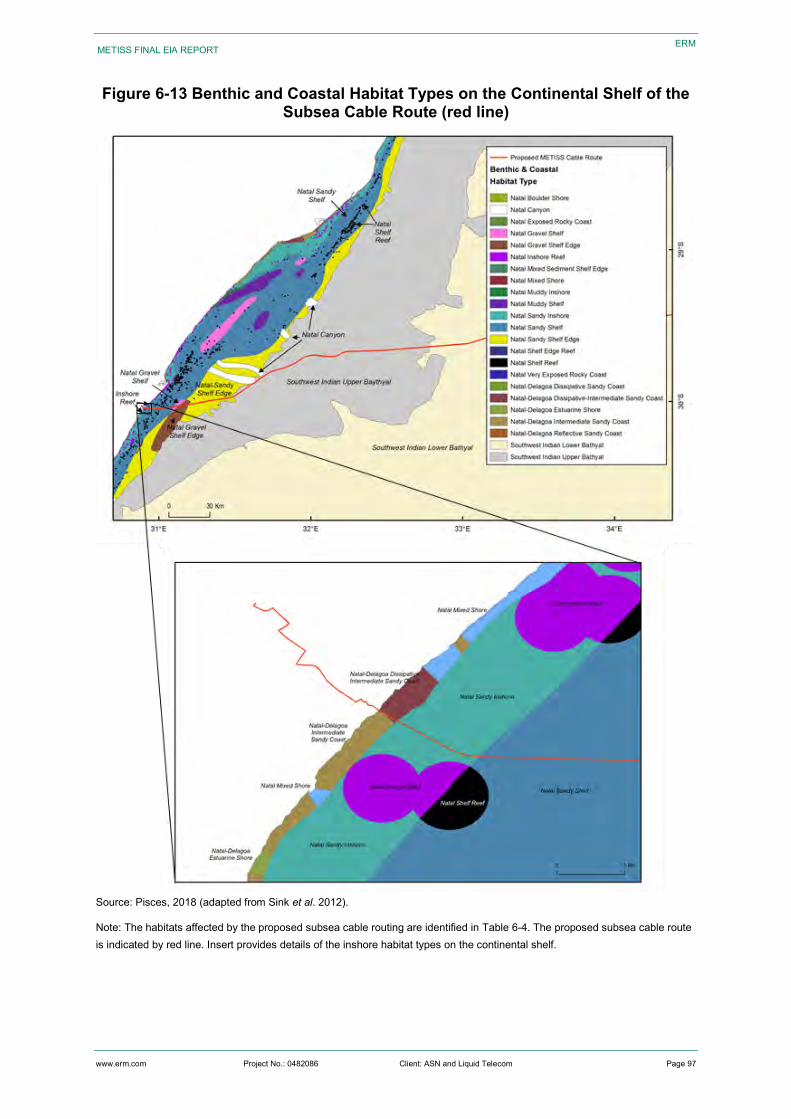
www.erm.com Project No.: 0482086 Client: ASN and Liquid Telecom Page 97
METISS FINAL EIA REPORT
ERM
Figure 6-13 Benthic and Coastal Habitat Types on the Continental Shelf of the Subsea Cable Route (red line)
Source: Pisces, 2018 (adapted from Sink et al. 2012).
Note: The habitats affected by the proposed subsea cable routing are identified in Table 6-4. The proposed subsea cable route is indicated by red line. Insert provides details of the inshore habitat types on the continental shelf.
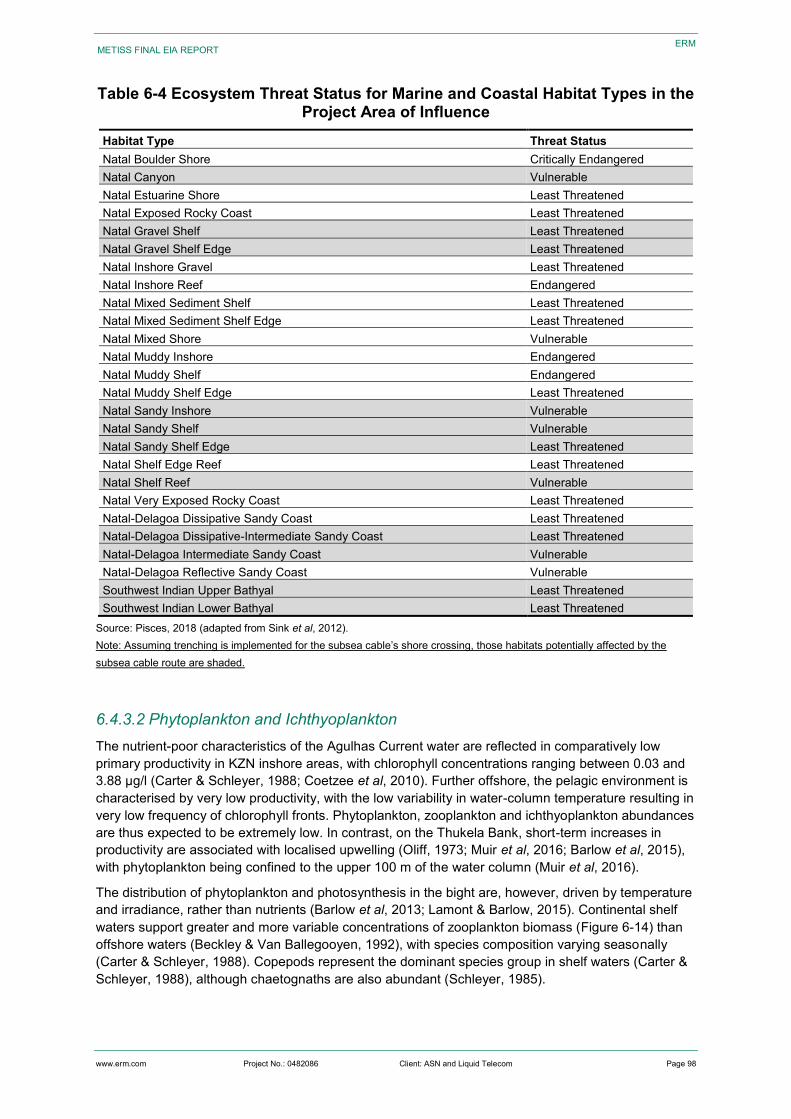
www.erm.com Project No.: 0482086 Client: ASN and Liquid Telecom Page 98
METISS FINAL EIA REPORT
ERM
Table 6-4 Ecosystem Threat Status for Marine and Coastal Habitat Types in the Project Area of Influence
Habitat Type Threat Status Natal Boulder Shore Critically Endangered Natal Canyon Vulnerable Natal Estuarine Shore Least Threatened Natal Exposed Rocky Coast Least Threatened Natal Gravel Shelf Least Threatened Natal Gravel Shelf Edge Least Threatened Natal Inshore Gravel Least Threatened Natal Inshore Reef Endangered Natal Mixed Sediment Shelf Least Threatened Natal Mixed Sediment Shelf Edge Least Threatened Natal Mixed Shore Vulnerable Natal Muddy Inshore Endangered Natal Muddy Shelf Endangered Natal Muddy Shelf Edge Least Threatened Natal Sandy Inshore Vulnerable Natal Sandy Shelf Vulnerable Natal Sandy Shelf Edge Least Threatened Natal Shelf Edge Reef Least Threatened Natal Shelf Reef Vulnerable Natal Very Exposed Rocky Coast Least Threatened Natal-Delagoa Dissipative Sandy Coast Least Threatened Natal-Delagoa Dissipative-Intermediate Sandy Coast Least Threatened Natal-Delagoa Intermediate Sandy Coast Vulnerable Natal-Delagoa Reflective Sandy Coast Vulnerable Southwest Indian Upper Bathyal Least Threatened Southwest Indian Lower Bathyal Least Threatened
Source: Pisces, 2018 (adapted from Sink et al, 2012). Note: Assuming trenching is implemented for the subsea cable’s shore crossing, those habitats potentially affected by the subsea cable route are shaded.
6.4.3.2 Phytoplankton and Ichthyoplankton The nutrient-poor characteristics of the Agulhas Current water are reflected in comparatively low primary productivity in KZN inshore areas, with chlorophyll concentrations ranging between 0.03 and 3.88 µg/l (Carter & Schleyer, 1988; Coetzee et al, 2010). Further offshore, the pelagic environment is characterised by very low productivity, with the low variability in water-column temperature resulting in very low frequency of chlorophyll fronts. Phytoplankton, zooplankton and ichthyoplankton abundances are thus expected to be extremely low. In contrast, on the Thukela Bank, short-term increases in productivity are associated with localised upwelling (Oliff, 1973; Muir et al, 2016; Barlow et al, 2015), with phytoplankton being confined to the upper 100 m of the water column (Muir et al, 2016).
The distribution of phytoplankton and photosynthesis in the bight are, however, driven by temperature and irradiance, rather than nutrients (Barlow et al, 2013; Lamont & Barlow, 2015). Continental shelf waters support greater and more variable concentrations of zooplankton biomass (Figure 6-14) than offshore waters (Beckley & Van Ballegooyen, 1992), with species composition varying seasonally (Carter & Schleyer, 1988). Copepods represent the dominant species group in shelf waters (Carter & Schleyer, 1988), although chaetognaths are also abundant (Schleyer, 1985).
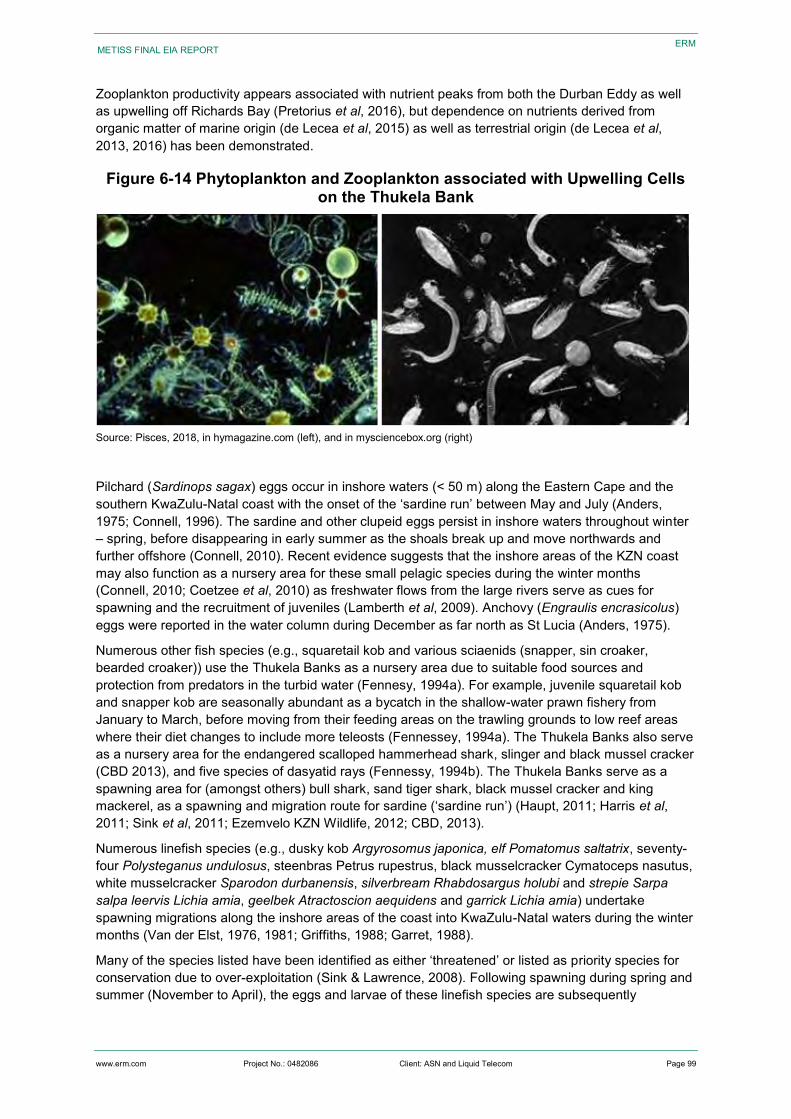
www.erm.com Project No.: 0482086 Client: ASN and Liquid Telecom Page 99
METISS FINAL EIA REPORT
ERM
Zooplankton productivity appears associated with nutrient peaks from both the Durban Eddy as well as upwelling off Richards Bay (Pretorius et al, 2016), but dependence on nutrients derived from organic matter of marine origin (de Lecea et al, 2015) as well as terrestrial origin (de Lecea et al, 2013, 2016) has been demonstrated.
Figure 6-14 Phytoplankton and Zooplankton associated with Upwelling Cells on the Thukela Bank
Source: Pisces, 2018, in hymagazine.com (left), and in mysciencebox.org (right)
Pilchard (Sardinops sagax) eggs occur in inshore waters (< 50 m) along the Eastern Cape and the southern KwaZulu-Natal coast with the onset of the ‘sardine run’ between May and July (Anders, 1975; Connell, 1996). The sardine and other clupeid eggs persist in inshore waters throughout winter – spring, before disappearing in early summer as the shoals break up and move northwards and further offshore (Connell, 2010). Recent evidence suggests that the inshore areas of the KZN coast may also function as a nursery area for these small pelagic species during the winter months (Connell, 2010; Coetzee et al, 2010) as freshwater flows from the large rivers serve as cues for spawning and the recruitment of juveniles (Lamberth et al, 2009). Anchovy (Engraulis encrasicolus) eggs were reported in the water column during December as far north as St Lucia (Anders, 1975).
Numerous other fish species (e.g., squaretail kob and various sciaenids (snapper, sin croaker, bearded croaker)) use the Thukela Banks as a nursery area due to suitable food sources and protection from predators in the turbid water (Fennesy, 1994a). For example, juvenile squaretail kob and snapper kob are seasonally abundant as a bycatch in the shallow-water prawn fishery from January to March, before moving from their feeding areas on the trawling grounds to low reef areas where their diet changes to include more teleosts (Fennessey, 1994a). The Thukela Banks also serve as a nursery area for the endangered scalloped hammerhead shark, slinger and black mussel cracker (CBD 2013), and five species of dasyatid rays (Fennessy, 1994b). The Thukela Banks serve as a spawning area for (amongst others) bull shark, sand tiger shark, black mussel cracker and king mackerel, as a spawning and migration route for sardine (‘sardine run’) (Haupt, 2011; Harris et al, 2011; Sink et al, 2011; Ezemvelo KZN Wildlife, 2012; CBD, 2013).
Numerous linefish species (e.g., dusky kob Argyrosomus japonica, elf Pomatomus saltatrix, seventy-four Polysteganus undulosus, steenbras Petrus rupestrus, black musselcracker Cymatoceps nasutus, white musselcracker Sparodon durbanensis, silverbream Rhabdosargus holubi and strepie Sarpa salpa leervis Lichia amia, geelbek Atractoscion aequidens and garrick Lichia amia) undertake spawning migrations along the inshore areas of the coast into KwaZulu-Natal waters during the winter months (Van der Elst, 1976, 1981; Griffiths, 1988; Garret, 1988).
Many of the species listed have been identified as either ‘threatened’ or listed as priority species for conservation due to over-exploitation (Sink & Lawrence, 2008). Following spawning during spring and summer (November to April), the eggs and larvae of these linefish species are subsequently
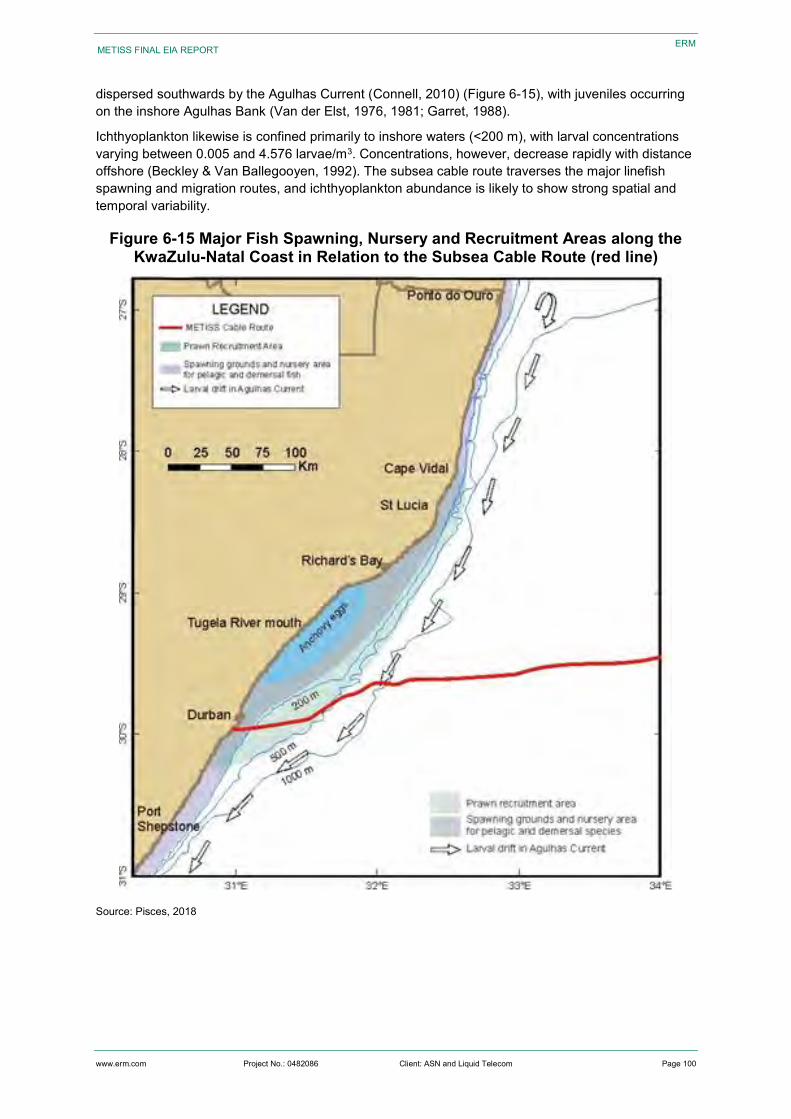
www.erm.com Project No.: 0482086 Client: ASN and Liquid Telecom Page 100
METISS FINAL EIA REPORT
ERM
dispersed southwards by the Agulhas Current (Connell, 2010) (Figure 6-15), with juveniles occurring on the inshore Agulhas Bank (Van der Elst, 1976, 1981; Garret, 1988).
Ichthyoplankton likewise is confined primarily to inshore waters (<200 m), with larval concentrations varying between 0.005 and 4.576 larvae/m3. Concentrations, however, decrease rapidly with distance offshore (Beckley & Van Ballegooyen, 1992). The subsea cable route traverses the major linefish spawning and migration routes, and ichthyoplankton abundance is likely to show strong spatial and temporal variability.
Figure 6-15 Major Fish Spawning, Nursery and Recruitment Areas along the KwaZulu-Natal Coast in Relation to the Subsea Cable Route (red line)
Source: Pisces, 2018
www.erm.com Project No.: 0482086 Client: ASN and Liquid Telecom Page 101
METISS FINAL EIA REPORT
ERM
6.4.3.3 Subtidal Reefs The subtidal shallow reefs of the East Coast range from rich, coral-encrusted sandstone reefs in the north to the more temperate rocky reefs further south (Figure 6-16). The subsea cable route passes through an area of high deep reef density. The Maputaland Coral Reef system, which extends from Kosi Bay to Leven Point (27 °55 ’40” S, 32° 35’ 40” E) and constitute the southernmost coral-dominated reefs of Africa (UNEP-WCMC, 2011) lie well to the north of the subsea cable route.
South of the iSimangaliso Wetland Park (St Lucia) reef habitat is provided by rock outcrops, although both hard and soft corals still occur. Known reefs inshore of the 200 m depth contour on the Thukela Bank were mapped by Turpie & Lamberth (2010) and Harris et al, (2012).
Both reef types (i.e., coral and rock outcrops) are characterised by diverse invertebrate and ichthyofaunal biota of Indo-Pacific origin (Figure 6-17, left). The invertebrate benthic communities associated with hard substrata boast a high diversity of hard and soft corals, sponges, tunicates and bivalve molluscs.
Mobile benthic organisms associated with the reefs include a wide variety of echinoderms (urchins, starfish and sea cucumbers), gastropod molluscs and crustaceans. The coral reef habitat also provides shelter and a food source for the highly diverse Indo-Pacific reef fish community.
Both the coral-dominated reefs off Sodwana Bay and the sandstone reefs off Durban and the KZN South Coast are popular amongst divers for their wealth of invertebrate and fish diversity.
In recent years there has also been increasing interest in deep-water corals and sponges because of their likely sensitivity to disturbance and their long generation times. These benthic filter-feeders generally occur at depths exceeding 150 m. Some coral species form reefs while others are smaller and remain solitary. Corals and sponges add structural complexity to otherwise uniform seabed habitats thereby creating areas of high biological diversity (Breeze et al, 1997; MacIssac et al, 2001). Their frameworks offer refugia for a great variety of invertebrates and fish (including commercially important species) within, or in association with, the living and dead frameworks. The canyons and feeder valleys on the shelf edge host a diversity of sponges, black corals, gorgonians, alcyonarian soft corals and stylasterine lace corals, which support a diverse epifauna including basket- and brittlestars, winged oysters and other molluscs (Sink et al, 2006). These invertebrates establish themselves below the thermocline where there is a continuous and regular supply of concentrated particulate organic matter, caused by the flow of a relatively strong current. The occurrence of such potentially vulnerable marine ecosystems in the Direct AoI is unknown.
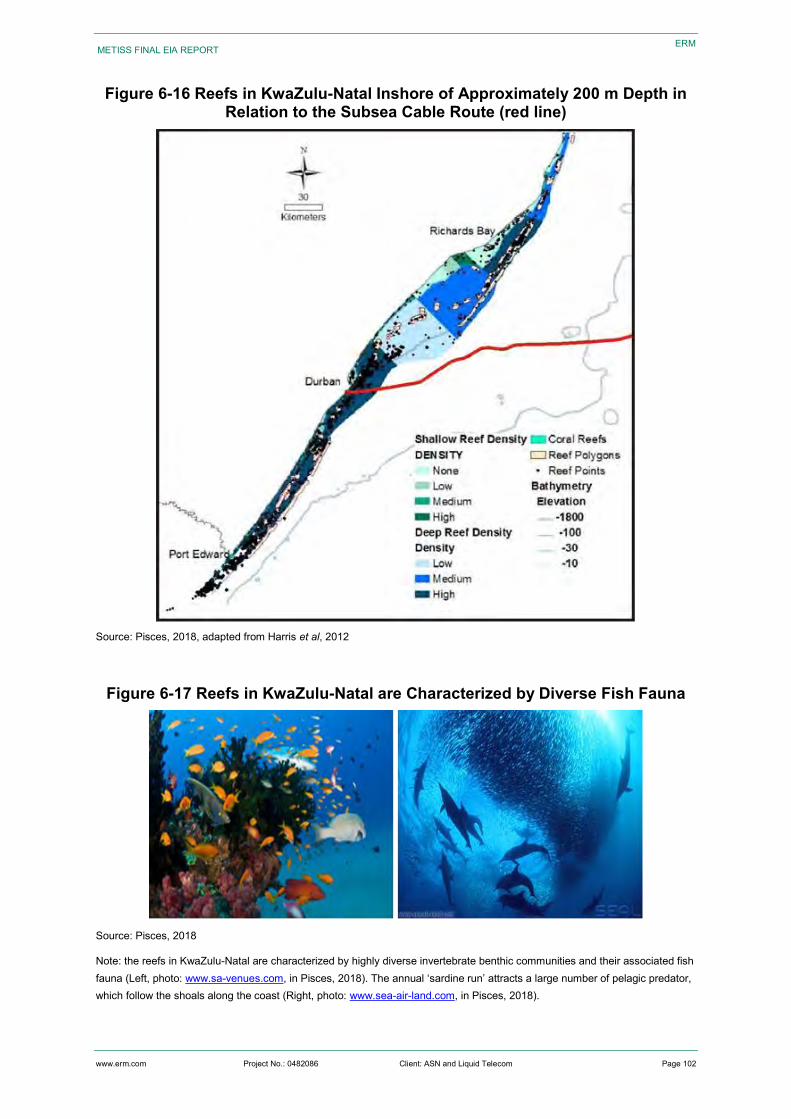
www.erm.com Project No.: 0482086 Client: ASN and Liquid Telecom Page 102
METISS FINAL EIA REPORT
ERM
Figure 6-16 Reefs in KwaZulu-Natal Inshore of Approximately 200 m Depth in Relation to the Subsea Cable Route (red line)
Source: Pisces, 2018, adapted from Harris et al, 2012
Figure 6-17 Reefs in KwaZulu-Natal are Characterized by Diverse Fish Fauna
Source: Pisces, 2018
Note: the reefs in KwaZulu-Natal are characterized by highly diverse invertebrate benthic communities and their associated fish fauna (Left, photo: www.sa-venues.com, in Pisces, 2018). The annual ‘sardine run’ attracts a large number of pelagic predator, which follow the shoals along the coast (Right, photo: www.sea-air-land.com, in Pisces, 2018).
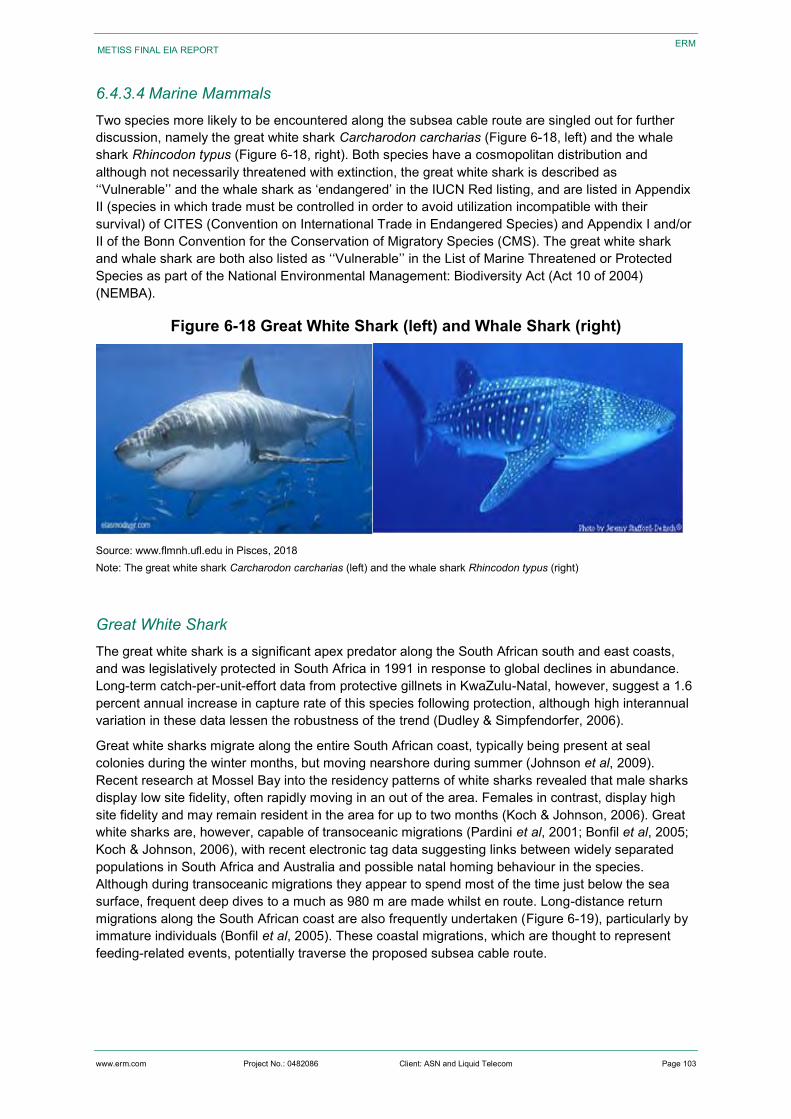
www.erm.com Project No.: 0482086 Client: ASN and Liquid Telecom Page 103
METISS FINAL EIA REPORT
ERM
6.4.3.4 Marine Mammals Two species more likely to be encountered along the subsea cable route are singled out for further discussion, namely the great white shark Carcharodon carcharias (Figure 6-18, left) and the whale shark Rhincodon typus (Figure 6-18, right). Both species have a cosmopolitan distribution and although not necessarily threatened with extinction, the great white shark is described as ‘‘Vulnerable’’ and the whale shark as ‘endangered’ in the IUCN Red listing, and are listed in Appendix II (species in which trade must be controlled in order to avoid utilization incompatible with their survival) of CITES (Convention on International Trade in Endangered Species) and Appendix I and/or II of the Bonn Convention for the Conservation of Migratory Species (CMS). The great white shark and whale shark are both also listed as ‘‘Vulnerable’’ in the List of Marine Threatened or Protected Species as part of the National Environmental Management: Biodiversity Act (Act 10 of 2004) (NEMBA).
Figure 6-18 Great White Shark (left) and Whale Shark (right)
Source: www.flmnh.ufl.edu in Pisces, 2018 Note: The great white shark Carcharodon carcharias (left) and the whale shark Rhincodon typus (right)
Great White Shark The great white shark is a significant apex predator along the South African south and east coasts, and was legislatively protected in South Africa in 1991 in response to global declines in abundance. Long-term catch-per-unit-effort data from protective gillnets in KwaZulu-Natal, however, suggest a 1.6 percent annual increase in capture rate of this species following protection, although high interannual variation in these data lessen the robustness of the trend (Dudley & Simpfendorfer, 2006).
Great white sharks migrate along the entire South African coast, typically being present at seal colonies during the winter months, but moving nearshore during summer (Johnson et al, 2009). Recent research at Mossel Bay into the residency patterns of white sharks revealed that male sharks display low site fidelity, often rapidly moving in an out of the area. Females in contrast, display high site fidelity and may remain resident in the area for up to two months (Koch & Johnson, 2006). Great white sharks are, however, capable of transoceanic migrations (Pardini et al, 2001; Bonfil et al, 2005; Koch & Johnson, 2006), with recent electronic tag data suggesting links between widely separated populations in South Africa and Australia and possible natal homing behaviour in the species. Although during transoceanic migrations they appear to spend most of the time just below the sea surface, frequent deep dives to a much as 980 m are made whilst en route. Long-distance return migrations along the South African coast are also frequently undertaken (Figure 6-19), particularly by immature individuals (Bonfil et al, 2005). These coastal migrations, which are thought to represent feeding-related events, potentially traverse the proposed subsea cable route.
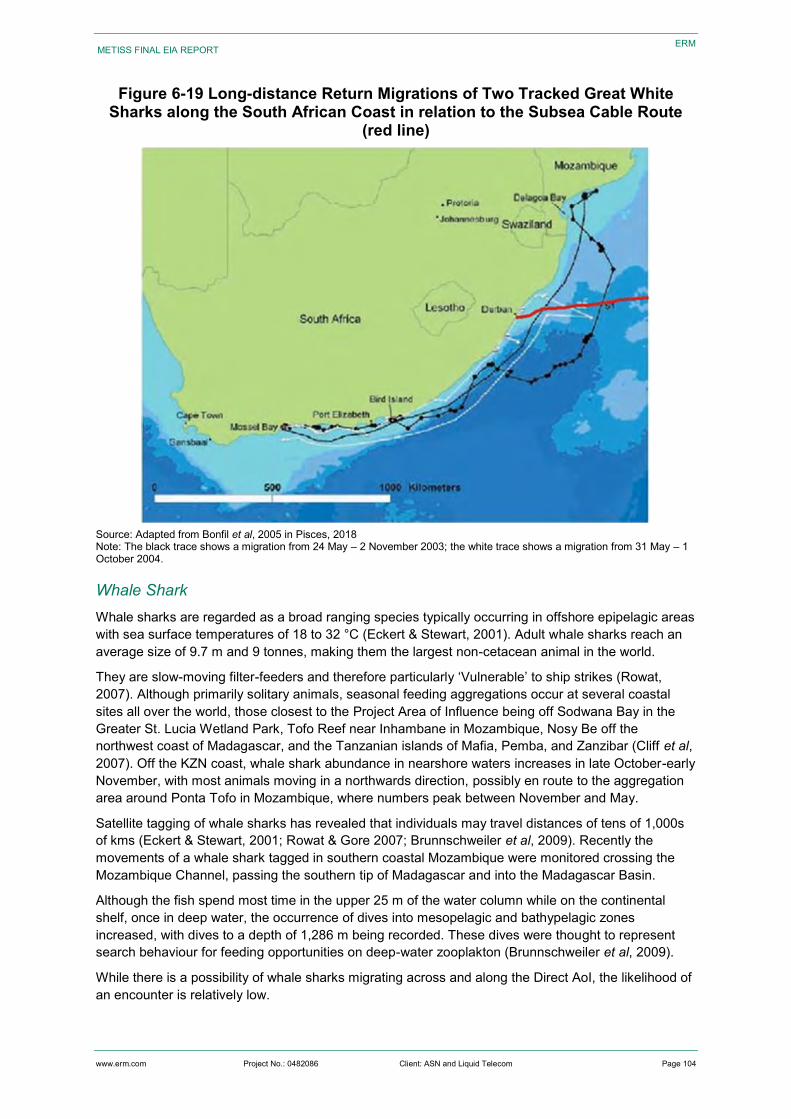
www.erm.com Project No.: 0482086 Client: ASN and Liquid Telecom Page 104
METISS FINAL EIA REPORT
ERM
Figure 6-19 Long-distance Return Migrations of Two Tracked Great White Sharks along the South African Coast in relation to the Subsea Cable Route
(red line)
Source: Adapted from Bonfil et al, 2005 in Pisces, 2018 Note: The black trace shows a migration from 24 May – 2 November 2003; the white trace shows a migration from 31 May – 1 October 2004.
Whale Shark Whale sharks are regarded as a broad ranging species typically occurring in offshore epipelagic areas with sea surface temperatures of 18 to 32 °C (Eckert & Stewart, 2001). Adult whale sharks reach an average size of 9.7 m and 9 tonnes, making them the largest non-cetacean animal in the world.
They are slow-moving filter-feeders and therefore particularly ‘Vulnerable’ to ship strikes (Rowat, 2007). Although primarily solitary animals, seasonal feeding aggregations occur at several coastal sites all over the world, those closest to the Project Area of Influence being off Sodwana Bay in the Greater St. Lucia Wetland Park, Tofo Reef near Inhambane in Mozambique, Nosy Be off the northwest coast of Madagascar, and the Tanzanian islands of Mafia, Pemba, and Zanzibar (Cliff et al, 2007). Off the KZN coast, whale shark abundance in nearshore waters increases in late October-early November, with most animals moving in a northwards direction, possibly en route to the aggregation area around Ponta Tofo in Mozambique, where numbers peak between November and May.
Satellite tagging of whale sharks has revealed that individuals may travel distances of tens of 1,000s of kms (Eckert & Stewart, 2001; Rowat & Gore 2007; Brunnschweiler et al, 2009). Recently the movements of a whale shark tagged in southern coastal Mozambique were monitored crossing the Mozambique Channel, passing the southern tip of Madagascar and into the Madagascar Basin.
Although the fish spend most time in the upper 25 m of the water column while on the continental shelf, once in deep water, the occurrence of dives into mesopelagic and bathypelagic zones increased, with dives to a depth of 1,286 m being recorded. These dives were thought to represent search behaviour for feeding opportunities on deep-water zooplakton (Brunnschweiler et al, 2009).
While there is a possibility of whale sharks migrating across and along the Direct AoI, the likelihood of an encounter is relatively low.
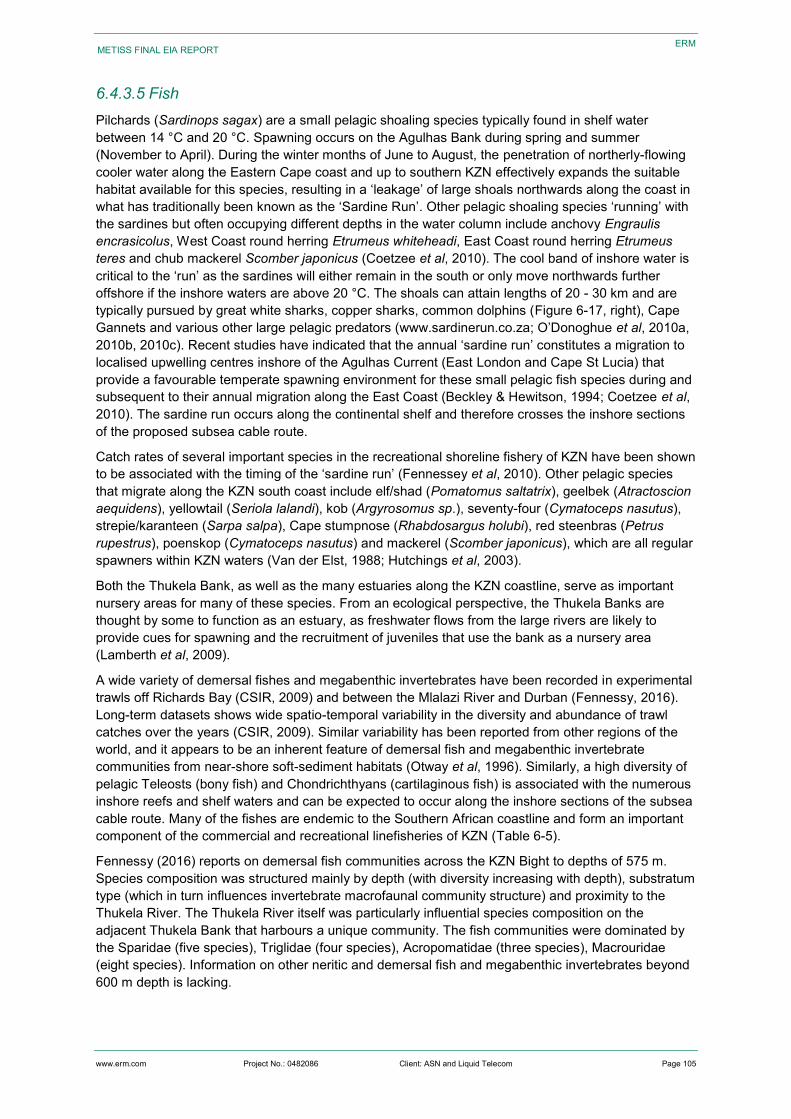
www.erm.com Project No.: 0482086 Client: ASN and Liquid Telecom Page 105
METISS FINAL EIA REPORT
ERM
6.4.3.5 Fish Pilchards (Sardinops sagax) are a small pelagic shoaling species typically found in shelf water between 14 °C and 20 °C. Spawning occurs on the Agulhas Bank during spring and summer (November to April). During the winter months of June to August, the penetration of northerly-flowing cooler water along the Eastern Cape coast and up to southern KZN effectively expands the suitable habitat available for this species, resulting in a ‘leakage’ of large shoals northwards along the coast in what has traditionally been known as the ‘Sardine Run’. Other pelagic shoaling species ‘running’ with the sardines but often occupying different depths in the water column include anchovy Engraulis encrasicolus, West Coast round herring Etrumeus whiteheadi, East Coast round herring Etrumeus teres and chub mackerel Scomber japonicus (Coetzee et al, 2010). The cool band of inshore water is critical to the ‘run’ as the sardines will either remain in the south or only move northwards further offshore if the inshore waters are above 20 °C. The shoals can attain lengths of 20 - 30 km and are typically pursued by great white sharks, copper sharks, common dolphins (Figure 6-17, right), Cape Gannets and various other large pelagic predators (www.sardinerun.co.za; O’Donoghue et al, 2010a, 2010b, 2010c). Recent studies have indicated that the annual ‘sardine run’ constitutes a migration to localised upwelling centres inshore of the Agulhas Current (East London and Cape St Lucia) that provide a favourable temperate spawning environment for these small pelagic fish species during and subsequent to their annual migration along the East Coast (Beckley & Hewitson, 1994; Coetzee et al, 2010). The sardine run occurs along the continental shelf and therefore crosses the inshore sections of the proposed subsea cable route.
Catch rates of several important species in the recreational shoreline fishery of KZN have been shown to be associated with the timing of the ‘sardine run’ (Fennessey et al, 2010). Other pelagic species that migrate along the KZN south coast include elf/shad (Pomatomus saltatrix), geelbek (Atractoscion aequidens), yellowtail (Seriola lalandi), kob (Argyrosomus sp.), seventy-four (Cymatoceps nasutus), strepie/karanteen (Sarpa salpa), Cape stumpnose (Rhabdosargus holubi), red steenbras (Petrus rupestrus), poenskop (Cymatoceps nasutus) and mackerel (Scomber japonicus), which are all regular spawners within KZN waters (Van der Elst, 1988; Hutchings et al, 2003).
Both the Thukela Bank, as well as the many estuaries along the KZN coastline, serve as important nursery areas for many of these species. From an ecological perspective, the Thukela Banks are thought by some to function as an estuary, as freshwater flows from the large rivers are likely to provide cues for spawning and the recruitment of juveniles that use the bank as a nursery area (Lamberth et al, 2009).
A wide variety of demersal fishes and megabenthic invertebrates have been recorded in experimental trawls off Richards Bay (CSIR, 2009) and between the Mlalazi River and Durban (Fennessy, 2016). Long-term datasets shows wide spatio-temporal variability in the diversity and abundance of trawl catches over the years (CSIR, 2009). Similar variability has been reported from other regions of the world, and it appears to be an inherent feature of demersal fish and megabenthic invertebrate communities from near-shore soft-sediment habitats (Otway et al, 1996). Similarly, a high diversity of pelagic Teleosts (bony fish) and Chondrichthyans (cartilaginous fish) is associated with the numerous inshore reefs and shelf waters and can be expected to occur along the inshore sections of the subsea cable route. Many of the fishes are endemic to the Southern African coastline and form an important component of the commercial and recreational linefisheries of KZN (Table 6-5).
Fennessy (2016) reports on demersal fish communities across the KZN Bight to depths of 575 m. Species composition was structured mainly by depth (with diversity increasing with depth), substratum type (which in turn influences invertebrate macrofaunal community structure) and proximity to the Thukela River. The Thukela River itself was particularly influential species composition on the adjacent Thukela Bank that harbours a unique community. The fish communities were dominated by the Sparidae (five species), Triglidae (four species), Acropomatidae (three species), Macrouridae (eight species). Information on other neritic and demersal fish and megabenthic invertebrates beyond 600 m depth is lacking.
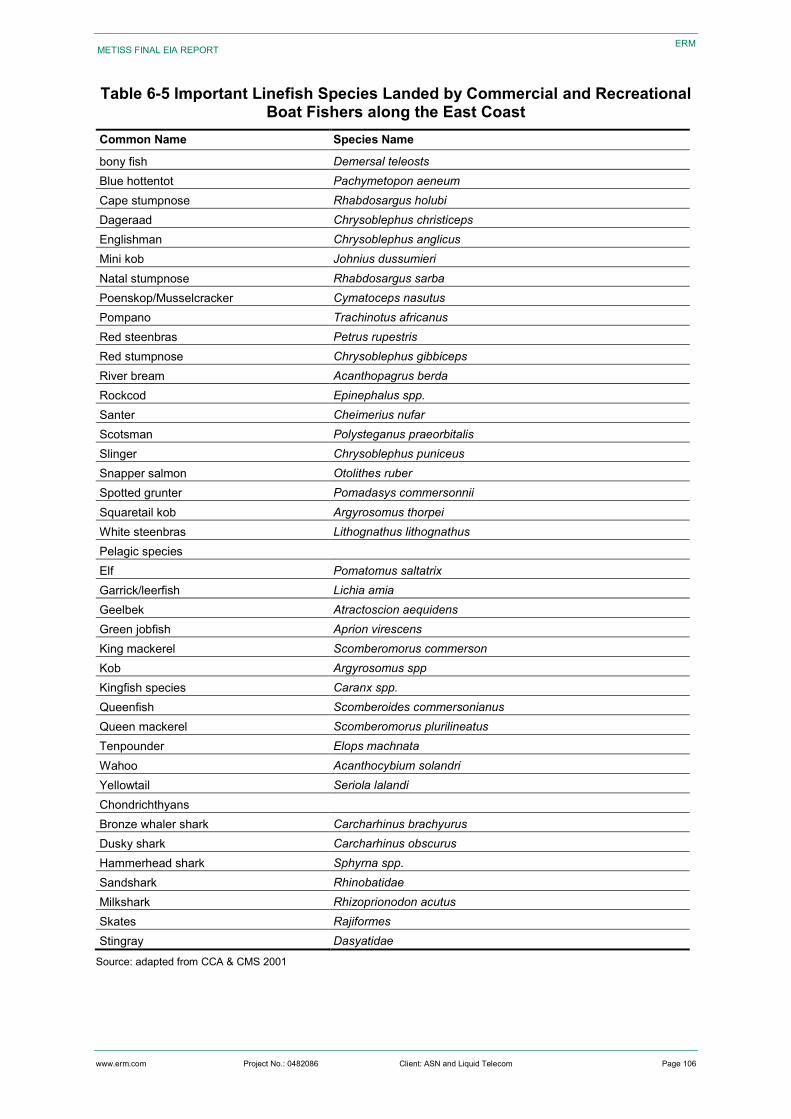
www.erm.com Project No.: 0482086 Client: ASN and Liquid Telecom Page 106
METISS FINAL EIA REPORT
ERM
Table 6-5 Important Linefish Species Landed by Commercial and Recreational Boat Fishers along the East Coast
Common Name Species Name
bony fish Demersal teleosts Blue hottentot Pachymetopon aeneum Cape stumpnose Rhabdosargus holubi Dageraad Chrysoblephus christiceps Englishman Chrysoblephus anglicus Mini kob Johnius dussumieri Natal stumpnose Rhabdosargus sarba Poenskop/Musselcracker Cymatoceps nasutus Pompano Trachinotus africanus Red steenbras Petrus rupestris Red stumpnose Chrysoblephus gibbiceps River bream Acanthopagrus berda Rockcod Epinephalus spp. Santer Cheimerius nufar Scotsman Polysteganus praeorbitalis Slinger Chrysoblephus puniceus Snapper salmon Otolithes ruber Spotted grunter Pomadasys commersonnii Squaretail kob Argyrosomus thorpei White steenbras Lithognathus lithognathus Pelagic species Elf Pomatomus saltatrix Garrick/leerfish Lichia amia Geelbek Atractoscion aequidens Green jobfish Aprion virescens King mackerel Scomberomorus commerson Kob Argyrosomus spp Kingfish species Caranx spp. Queenfish Scomberoides commersonianus Queen mackerel Scomberomorus plurilineatus Tenpounder Elops machnata Wahoo Acanthocybium solandri Yellowtail Seriola lalandi Chondrichthyans Bronze whaler shark Carcharhinus brachyurus Dusky shark Carcharhinus obscurus Hammerhead shark Sphyrna spp. Sandshark Rhinobatidae Milkshark Rhizoprionodon acutus Skates Rajiformes Stingray Dasyatidae
Source: adapted from CCA & CMS 2001
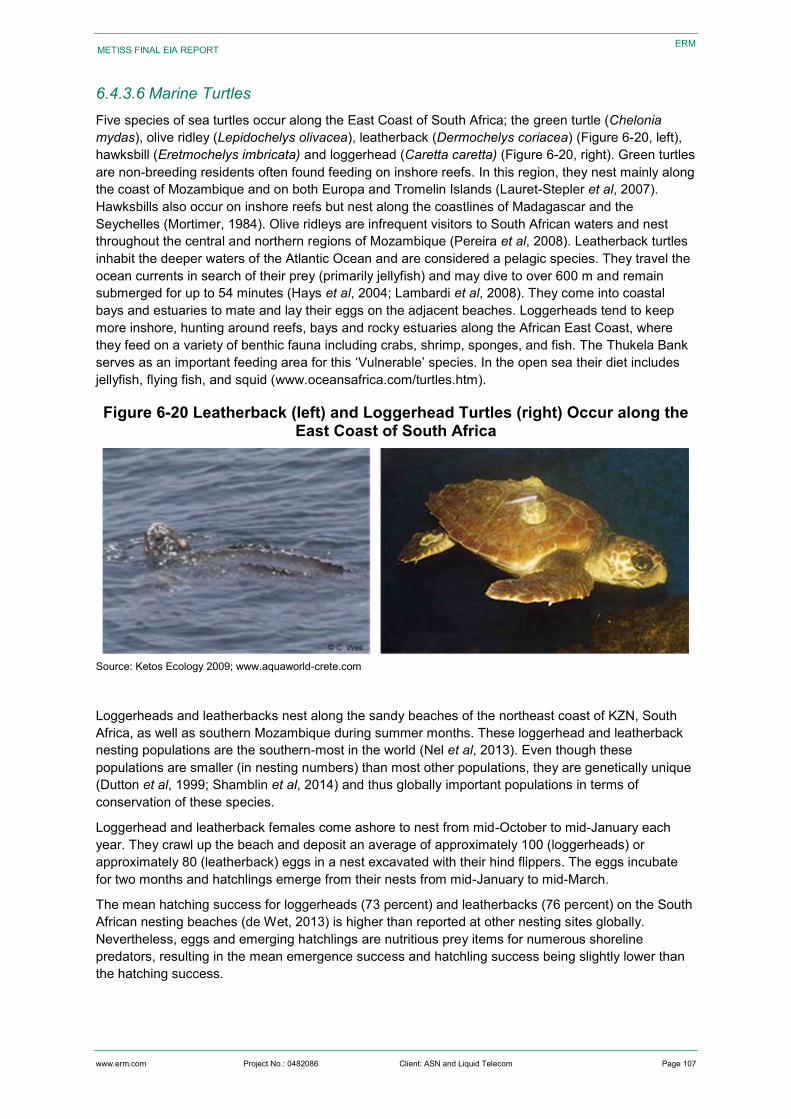
www.erm.com Project No.: 0482086 Client: ASN and Liquid Telecom Page 107
METISS FINAL EIA REPORT
ERM
6.4.3.6 Marine Turtles Five species of sea turtles occur along the East Coast of South Africa; the green turtle (Chelonia mydas), olive ridley (Lepidochelys olivacea), leatherback (Dermochelys coriacea) (Figure 6-20, left), hawksbill (Eretmochelys imbricata) and loggerhead (Caretta caretta) (Figure 6-20, right). Green turtles are non-breeding residents often found feeding on inshore reefs. In this region, they nest mainly along the coast of Mozambique and on both Europa and Tromelin Islands (Lauret-Stepler et al, 2007). Hawksbills also occur on inshore reefs but nest along the coastlines of Madagascar and the Seychelles (Mortimer, 1984). Olive ridleys are infrequent visitors to South African waters and nest throughout the central and northern regions of Mozambique (Pereira et al, 2008). Leatherback turtles inhabit the deeper waters of the Atlantic Ocean and are considered a pelagic species. They travel the ocean currents in search of their prey (primarily jellyfish) and may dive to over 600 m and remain submerged for up to 54 minutes (Hays et al, 2004; Lambardi et al, 2008). They come into coastal bays and estuaries to mate and lay their eggs on the adjacent beaches. Loggerheads tend to keep more inshore, hunting around reefs, bays and rocky estuaries along the African East Coast, where they feed on a variety of benthic fauna including crabs, shrimp, sponges, and fish. The Thukela Bank serves as an important feeding area for this ‘Vulnerable’ species. In the open sea their diet includes jellyfish, flying fish, and squid (www.oceansafrica.com/turtles.htm).
Figure 6-20 Leatherback (left) and Loggerhead Turtles (right) Occur along the East Coast of South Africa
Source: Ketos Ecology 2009; www.aquaworld-crete.com
Loggerheads and leatherbacks nest along the sandy beaches of the northeast coast of KZN, South Africa, as well as southern Mozambique during summer months. These loggerhead and leatherback nesting populations are the southern-most in the world (Nel et al, 2013). Even though these populations are smaller (in nesting numbers) than most other populations, they are genetically unique (Dutton et al, 1999; Shamblin et al, 2014) and thus globally important populations in terms of conservation of these species.
Loggerhead and leatherback females come ashore to nest from mid-October to mid-January each year. They crawl up the beach and deposit an average of approximately 100 (loggerheads) or approximately 80 (leatherback) eggs in a nest excavated with their hind flippers. The eggs incubate for two months and hatchlings emerge from their nests from mid-January to mid-March.
The mean hatching success for loggerheads (73 percent) and leatherbacks (76 percent) on the South African nesting beaches (de Wet, 2013) is higher than reported at other nesting sites globally. Nevertheless, eggs and emerging hatchlings are nutritious prey items for numerous shoreline predators, resulting in the mean emergence success and hatchling success being slightly lower than the hatching success.
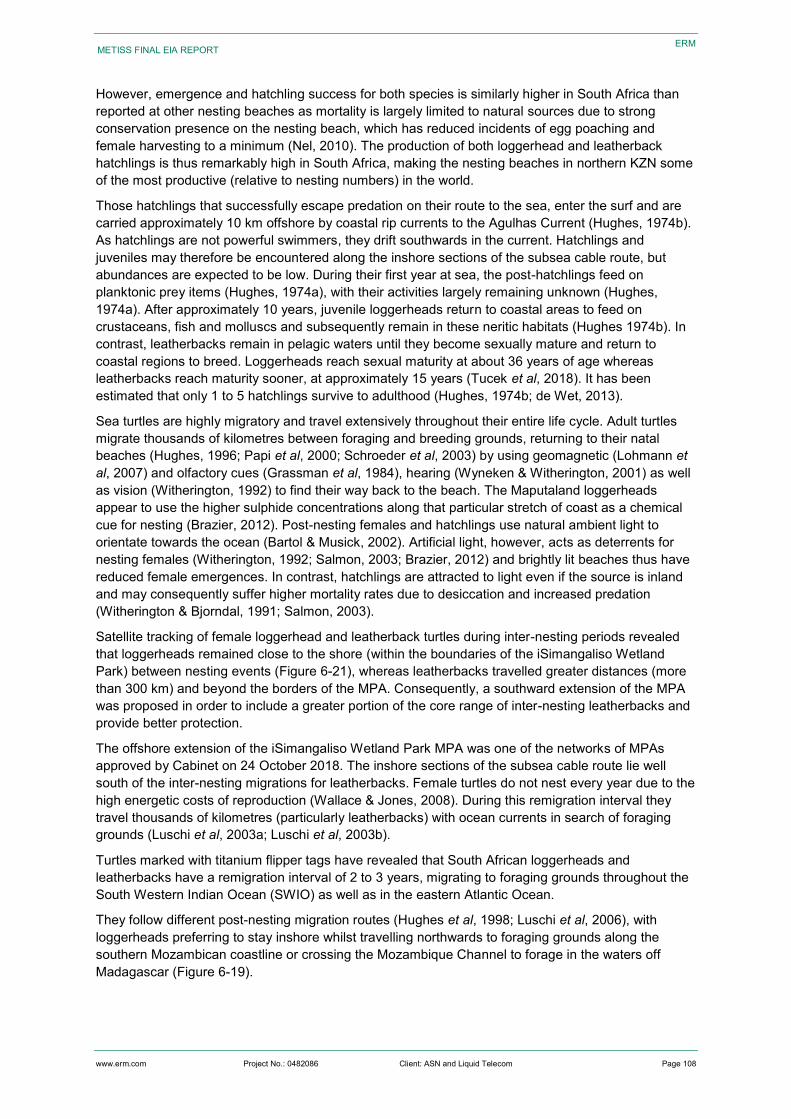
www.erm.com Project No.: 0482086 Client: ASN and Liquid Telecom Page 108
METISS FINAL EIA REPORT
ERM
However, emergence and hatchling success for both species is similarly higher in South Africa than reported at other nesting beaches as mortality is largely limited to natural sources due to strong conservation presence on the nesting beach, which has reduced incidents of egg poaching and female harvesting to a minimum (Nel, 2010). The production of both loggerhead and leatherback hatchlings is thus remarkably high in South Africa, making the nesting beaches in northern KZN some of the most productive (relative to nesting numbers) in the world.
Those hatchlings that successfully escape predation on their route to the sea, enter the surf and are carried approximately 10 km offshore by coastal rip currents to the Agulhas Current (Hughes, 1974b). As hatchlings are not powerful swimmers, they drift southwards in the current. Hatchlings and juveniles may therefore be encountered along the inshore sections of the subsea cable route, but abundances are expected to be low. During their first year at sea, the post-hatchlings feed on planktonic prey items (Hughes, 1974a), with their activities largely remaining unknown (Hughes, 1974a). After approximately 10 years, juvenile loggerheads return to coastal areas to feed on crustaceans, fish and molluscs and subsequently remain in these neritic habitats (Hughes 1974b). In contrast, leatherbacks remain in pelagic waters until they become sexually mature and return to coastal regions to breed. Loggerheads reach sexual maturity at about 36 years of age whereas leatherbacks reach maturity sooner, at approximately 15 years (Tucek et al, 2018). It has been estimated that only 1 to 5 hatchlings survive to adulthood (Hughes, 1974b; de Wet, 2013).
Sea turtles are highly migratory and travel extensively throughout their entire life cycle. Adult turtles migrate thousands of kilometres between foraging and breeding grounds, returning to their natal beaches (Hughes, 1996; Papi et al, 2000; Schroeder et al, 2003) by using geomagnetic (Lohmann et al, 2007) and olfactory cues (Grassman et al, 1984), hearing (Wyneken & Witherington, 2001) as well as vision (Witherington, 1992) to find their way back to the beach. The Maputaland loggerheads appear to use the higher sulphide concentrations along that particular stretch of coast as a chemical cue for nesting (Brazier, 2012). Post-nesting females and hatchlings use natural ambient light to orientate towards the ocean (Bartol & Musick, 2002). Artificial light, however, acts as deterrents for nesting females (Witherington, 1992; Salmon, 2003; Brazier, 2012) and brightly lit beaches thus have reduced female emergences. In contrast, hatchlings are attracted to light even if the source is inland and may consequently suffer higher mortality rates due to desiccation and increased predation (Witherington & Bjorndal, 1991; Salmon, 2003).
Satellite tracking of female loggerhead and leatherback turtles during inter-nesting periods revealed that loggerheads remained close to the shore (within the boundaries of the iSimangaliso Wetland Park) between nesting events (Figure 6-21), whereas leatherbacks travelled greater distances (more than 300 km) and beyond the borders of the MPA. Consequently, a southward extension of the MPA was proposed in order to include a greater portion of the core range of inter-nesting leatherbacks and provide better protection.
The offshore extension of the iSimangaliso Wetland Park MPA was one of the networks of MPAs approved by Cabinet on 24 October 2018. The inshore sections of the subsea cable route lie well south of the inter-nesting migrations for leatherbacks. Female turtles do not nest every year due to the high energetic costs of reproduction (Wallace & Jones, 2008). During this remigration interval they travel thousands of kilometres (particularly leatherbacks) with ocean currents in search of foraging grounds (Luschi et al, 2003a; Luschi et al, 2003b).
Turtles marked with titanium flipper tags have revealed that South African loggerheads and leatherbacks have a remigration interval of 2 to 3 years, migrating to foraging grounds throughout the South Western Indian Ocean (SWIO) as well as in the eastern Atlantic Ocean.
They follow different post-nesting migration routes (Hughes et al, 1998; Luschi et al, 2006), with loggerheads preferring to stay inshore whilst travelling northwards to foraging grounds along the southern Mozambican coastline or crossing the Mozambique Channel to forage in the waters off Madagascar (Figure 6-19).
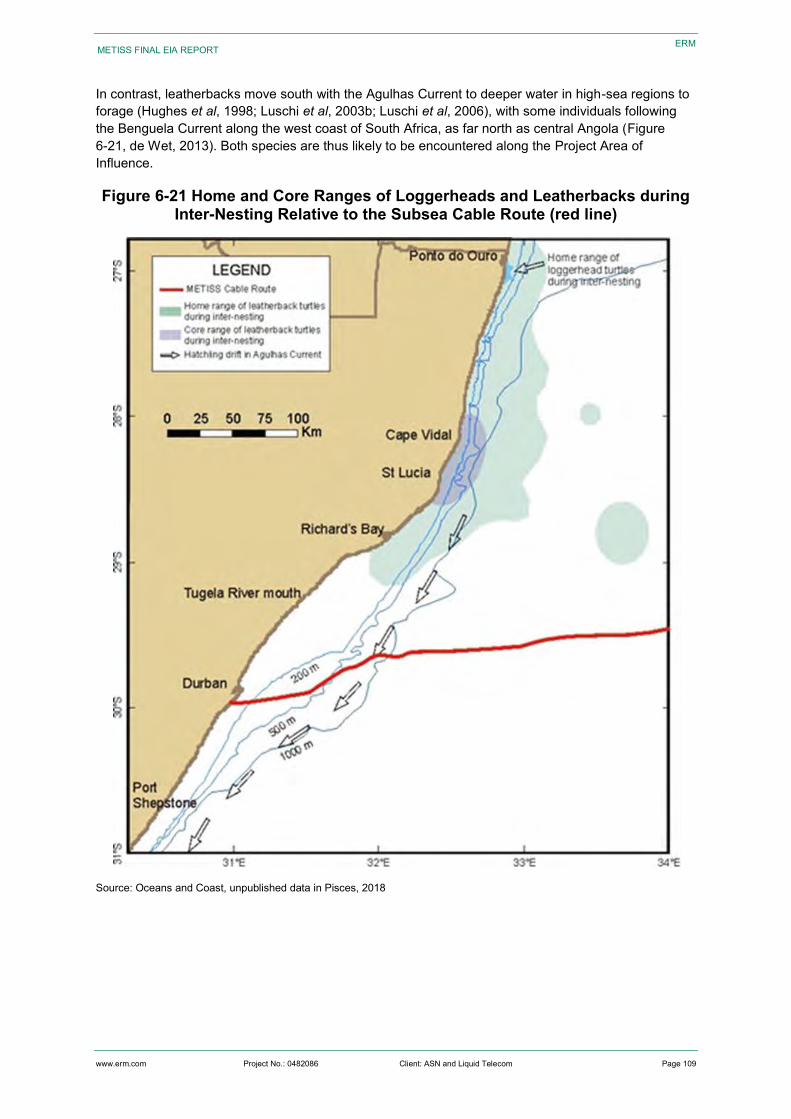
www.erm.com Project No.: 0482086 Client: ASN and Liquid Telecom Page 109
METISS FINAL EIA REPORT
ERM
In contrast, leatherbacks move south with the Agulhas Current to deeper water in high-sea regions to forage (Hughes et al, 1998; Luschi et al, 2003b; Luschi et al, 2006), with some individuals following the Benguela Current along the west coast of South Africa, as far north as central Angola (Figure 6-21, de Wet, 2013). Both species are thus likely to be encountered along the Project Area of Influence.
Figure 6-21 Home and Core Ranges of Loggerheads and Leatherbacks during Inter-Nesting Relative to the Subsea Cable Route (red line)
Source: Oceans and Coast, unpublished data in Pisces, 2018
www.erm.com Project No.: 0482086 Client: ASN and Liquid Telecom Page 110
METISS FINAL EIA REPORT
ERM
6.5 Protected and Conservation Areas
6.5.1 Marine and Protected Areas
KwaZulu-Natal has four Marine Protected Areas (MPA), although none occur along the subsea cable route (Figure 6-22).
6.5.1.1 iSimangaliso Extension MPA The Maputaland and St Lucia MPAs form a continuous protected area stretching 150 km from the Mozambique border southwards to Cape Vidal, and three nautical miles (5.56 km) out to sea. Together with the southward extension of the St Lucia MPA, they are components of the offshore iSimangaliso MPA, as part of the iSimangaliso Wetland Park.
The MPA protects a large number of turtle nesting sites; the migration of whales, dolphins and whale-sharks offshore; coelacanths in the submarine canyons; and a considerable number of waterfowl associated with the iSimangaliso Wetland Park, including large breeding colonies of pelicans, storks, herons and terns.
6.5.1.2 Thukela Banks MPA This recently approved coastal and offshore MPA is located between the Mlalazi and Seteni estuary. The purpose of this MPA is to protect coastal habitats including sandy beaches, rocky shores and estuaries as well as offshore habitats including the soft sediment and reef systems, submarine canyons, the shelf edge and slope ecosystems (Government Gazette 39646, 2016).
6.5.1.3 Aliwal Shoal MPA The Aliwal Shoal MPA is situated on the south coast between Umkomaas and Ocean View. The purpose of this MPA is to specifically protect and conserve the Aliwal Shoal and the fish stocks associated with it; to promote and regulate eco-tourism activities and scientific research in a way that does not adversely affect the marine environment and the biodiversity of the Aliwal Shoal Marine Protected Area and to prescribe penalties for contraventions (Government Gazette 26433, 2004).
6.5.1.4 Protea Banks MPA The Protea Banks MPA is an offshore Area in the 20 m to 3,000 m depth range with the southern portion lying adjacent to the existing Trafalgar Marine Protected Area. The purpose of this MPA is to conserve and protect submarine canyons, deep reefs, cold water coral reefs and other habitats of the shelf edge and slope (Government Gazette 39646, 2016).
Hope Spots are defined by Mission Blue of the Sylvia Earle Alliance as special conservation areas that are critical to the health of the ocean. The first six Hope Spots were launched in South Africa in 2014 and include Aliwal Shoal in KZN, Algoa Bay, Plettenberg Bay, Knysna, the Cape Whale Coast (Hermanus area) and False Bay in the Western Cape. Of these, the Aliwal Shoal Hope Spot is located to the south of the subsea cable route.
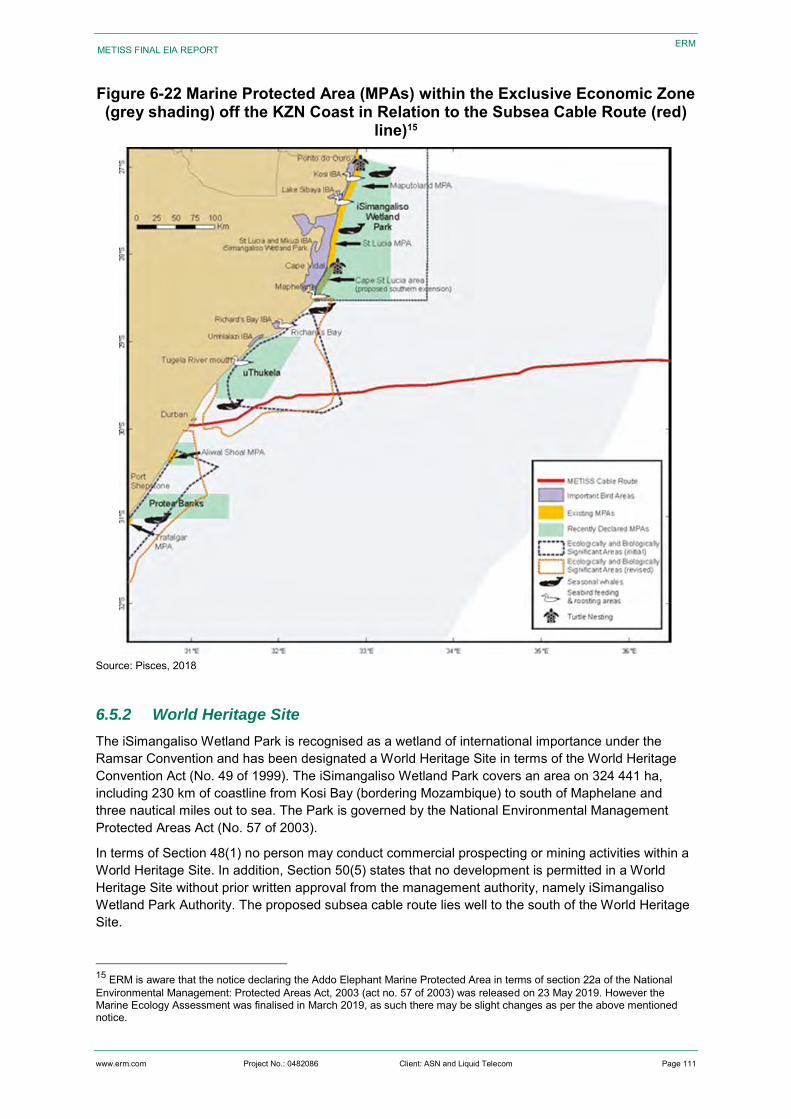
www.erm.com Project No.: 0482086 Client: ASN and Liquid Telecom Page 111
METISS FINAL EIA REPORT
ERM
Figure 6-22 Marine Protected Area (MPAs) within the Exclusive Economic Zone (grey shading) off the KZN Coast in Relation to the Subsea Cable Route (red)
line)15
Source: Pisces, 2018
6.5.2 World Heritage Site
The iSimangaliso Wetland Park is recognised as a wetland of international importance under the Ramsar Convention and has been designated a World Heritage Site in terms of the World Heritage Convention Act (No. 49 of 1999). The iSimangaliso Wetland Park covers an area on 324 441 ha, including 230 km of coastline from Kosi Bay (bordering Mozambique) to south of Maphelane and three nautical miles out to sea. The Park is governed by the National Environmental Management Protected Areas Act (No. 57 of 2003).
In terms of Section 48(1) no person may conduct commercial prospecting or mining activities within a World Heritage Site. In addition, Section 50(5) states that no development is permitted in a World Heritage Site without prior written approval from the management authority, namely iSimangaliso Wetland Park Authority. The proposed subsea cable route lies well to the south of the World Heritage Site.
15 ERM is aware that the notice declaring the Addo Elephant Marine Protected Area in terms of section 22a of the National Environmental Management: Protected Areas Act, 2003 (act no. 57 of 2003) was released on 23 May 2019. However the Marine Ecology Assessment was finalised in March 2019, as such there may be slight changes as per the above mentioned notice.
www.erm.com Project No.: 0482086 Client: ASN and Liquid Telecom Page 112
METISS FINAL EIA REPORT
ERM
6.5.3 Ecologically and Biologically Significant Area (EBSAs)
Following application of the Conservation on Biological Diversity’s (CBD) Ecologically or Biologically Significant Marine Areas (EBSA) criteria, a number of areas around the South African coast were identified as potentially requiring enhanced conservation and management.
These were presented at the CBD regional workshop for the description of marine EBSAs in the Southern Indian Ocean (July/ August 2012) (CBD, 2013).
Three EBSAs have been proposed and inscribed for the East Coast under the Convention of Biological Diversity (CBD) (CBD, 2013), namely Protea Banks and the Sardine Route, the Natal Bight and the Delagoa Shelf Edge. In meeting the EBSA criteria16, various endemic and rare chondrychthian and teleost species were listed for the Natal Bight and Thukela Bank, and IUCN listed species and threatened habitat types identified. The Protea Banks area includes submarine canyons, an area of steep shelf edge and a unique deep-reef system, all of which may support fragile habitat-forming cold-water coral species. This area also includes a major component of the migration path for several species undertaking the ‘sardine run’. The Delagoa Shelf Edge, Canyons and Slope is a transboundary EBSA that includes the iSimangaliso Wetland Park, a Ramsar and World Heritage Site in South Africa, and Ponta do Ouro Partial Marine Reserve in Mozambique.
This EBSA supports a variety of fish, sharks, turtles, whales and other marine mammals by including their migratory routes, nursery areas, spawning/breeding areas, and foraging areas, and notably provides nesting habitat for Loggerhead and Leatherback turtles. Many of the species in the EBSA are threatened, such as coelacanths, seventy-four seabream, marine mammals, turtles, and sharks. Potential VMEs include numerous submarine canyons, paleo-shorelines, deep reefs, and hard shelf edge, with reef-building cold-water corals also recovered at depths of more than 900 m.
Although focussed primarily on the conservation of benthic biodiversity and threatened benthic habitats, the EBSA also considers the pelagic habitat. The pelagic habitat of the Natal Bight is characterized by cool productive water advected onto the shelf in this sheer-zone through Agulhas Current-driven upwelling cells. In the Protea Banks EBSA, the dynamic pelagic environment and the sardine run also contribute to the high diversity in the pelagic ecosystems.
Following new research conducted in the area since the original description of these EBSAs, the boundaries, names, descriptions and criteria ranks have recently been updated. No specific management actions have as yet been formulated for these EBSAs, although the uniqueness of the areas contributed to the development of the recently approved offshore MPAs. The proposed subsea cable route traverses the Thukela Bank EBSA.
16 In 2008, the Conference of the Parties to the Convention on Biological Diversity (COP 9) adopted the following scientific criteria for identifying ecologically or biologically significant marine areas in need of protection in open-ocean waters and deep-sea habitats (further details available at http://www. cbd.int/marine/doc/azores-brochure-en.pdf): 1. Uniqueness or Rarity 2. Special importance for life history stages of species 3. Importance for threatened, endangered or declining species and/or habitats 4. Vulnerability, Fragility, Sensitivity, or Slow recovery 5. Biological Productivity 6. Biological Diversity 7. Naturalness In 2010, COP 10 noted that the application of the EBSA criteria was a scientific and technical exercise, and that areas found to meet the criteria may require enhanced conservation and management measures, and that this could be achieved through means such as marine protected areas and impact assessments. It was emphasised that the identification of EBSAs and the selection of conservation and management measures was a matter for States and competent intergovernmental organisations, in accordance with international law, including the UN Convention on the Law of the Sea.
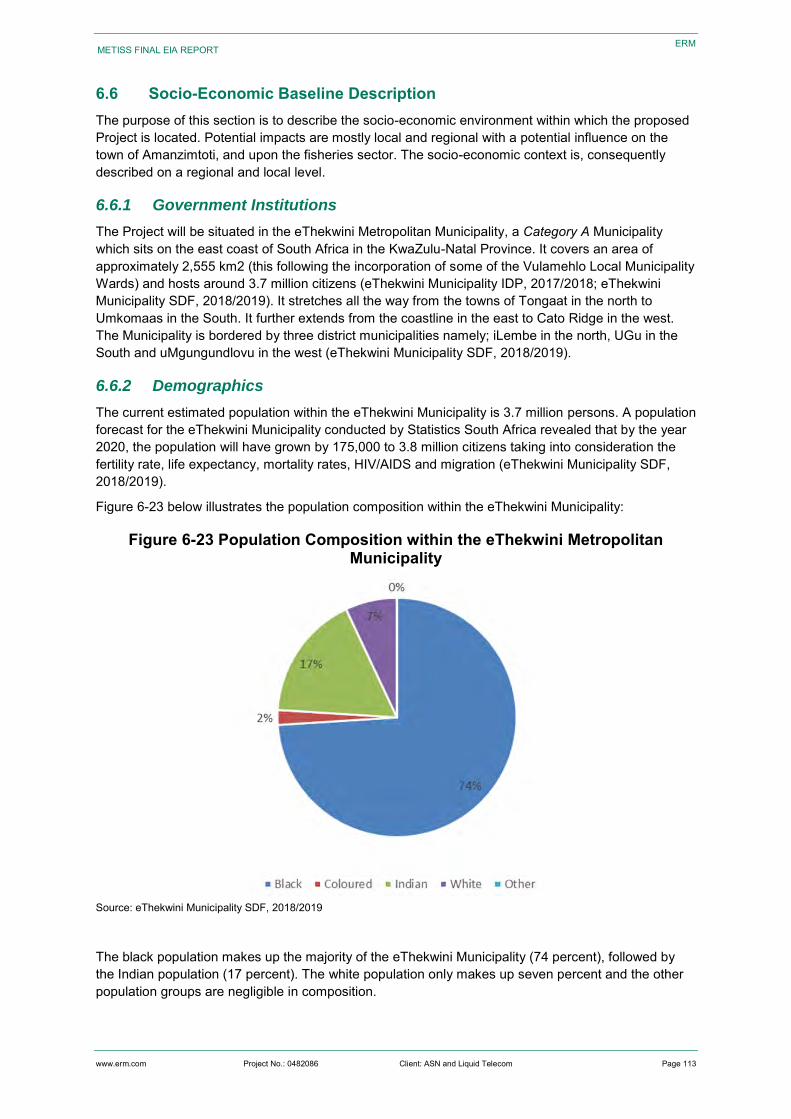
www.erm.com Project No.: 0482086 Client: ASN and Liquid Telecom Page 113
METISS FINAL EIA REPORT
ERM
6.6 Socio-Economic Baseline Description The purpose of this section is to describe the socio-economic environment within which the proposed Project is located. Potential impacts are mostly local and regional with a potential influence on the town of Amanzimtoti, and upon the fisheries sector. The socio-economic context is, consequently described on a regional and local level.
6.6.1 Government Institutions
The Project will be situated in the eThekwini Metropolitan Municipality, a Category A Municipality which sits on the east coast of South Africa in the KwaZulu-Natal Province. It covers an area of approximately 2,555 km2 (this following the incorporation of some of the Vulamehlo Local Municipality Wards) and hosts around 3.7 million citizens (eThekwini Municipality IDP, 2017/2018; eThekwini Municipality SDF, 2018/2019). It stretches all the way from the towns of Tongaat in the north to Umkomaas in the South. It further extends from the coastline in the east to Cato Ridge in the west. The Municipality is bordered by three district municipalities namely; iLembe in the north, UGu in the South and uMgungundlovu in the west (eThekwini Municipality SDF, 2018/2019).
6.6.2 Demographics
The current estimated population within the eThekwini Municipality is 3.7 million persons. A population forecast for the eThekwini Municipality conducted by Statistics South Africa revealed that by the year 2020, the population will have grown by 175,000 to 3.8 million citizens taking into consideration the fertility rate, life expectancy, mortality rates, HIV/AIDS and migration (eThekwini Municipality SDF, 2018/2019).
Figure 6-23 below illustrates the population composition within the eThekwini Municipality:
Figure 6-23 Population Composition within the eThekwini Metropolitan Municipality
Source: eThekwini Municipality SDF, 2018/2019
The black population makes up the majority of the eThekwini Municipality (74 percent), followed by the Indian population (17 percent). The white population only makes up seven percent and the other population groups are negligible in composition.
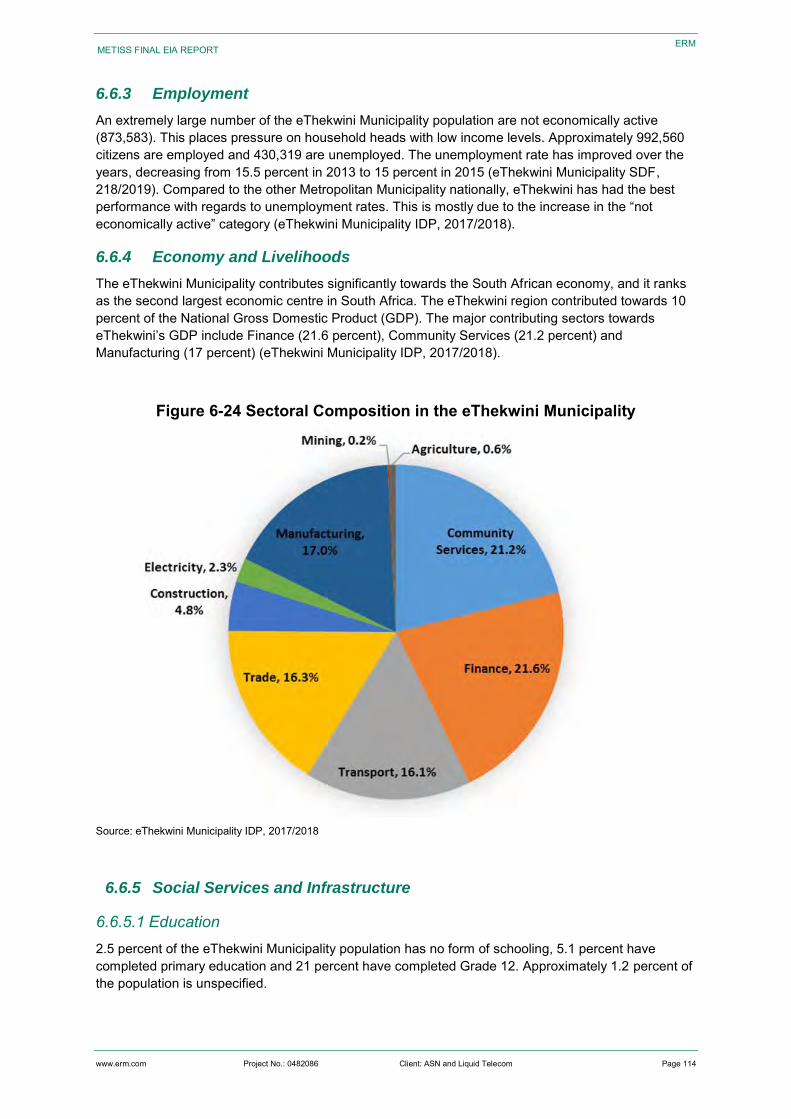
www.erm.com Project No.: 0482086 Client: ASN and Liquid Telecom Page 114
METISS FINAL EIA REPORT
ERM
6.6.3 Employment
An extremely large number of the eThekwini Municipality population are not economically active (873,583). This places pressure on household heads with low income levels. Approximately 992,560 citizens are employed and 430,319 are unemployed. The unemployment rate has improved over the years, decreasing from 15.5 percent in 2013 to 15 percent in 2015 (eThekwini Municipality SDF, 218/2019). Compared to the other Metropolitan Municipality nationally, eThekwini has had the best performance with regards to unemployment rates. This is mostly due to the increase in the “not economically active” category (eThekwini Municipality IDP, 2017/2018).
6.6.4 Economy and Livelihoods
The eThekwini Municipality contributes significantly towards the South African economy, and it ranks as the second largest economic centre in South Africa. The eThekwini region contributed towards 10 percent of the National Gross Domestic Product (GDP). The major contributing sectors towards eThekwini’s GDP include Finance (21.6 percent), Community Services (21.2 percent) and Manufacturing (17 percent) (eThekwini Municipality IDP, 2017/2018).
Figure 6-24 Sectoral Composition in the eThekwini Municipality
Source: eThekwini Municipality IDP, 2017/2018
6.6.5 Social Services and Infrastructure
6.6.5.1 Education 2.5 percent of the eThekwini Municipality population has no form of schooling, 5.1 percent have completed primary education and 21 percent have completed Grade 12. Approximately 1.2 percent of the population is unspecified.
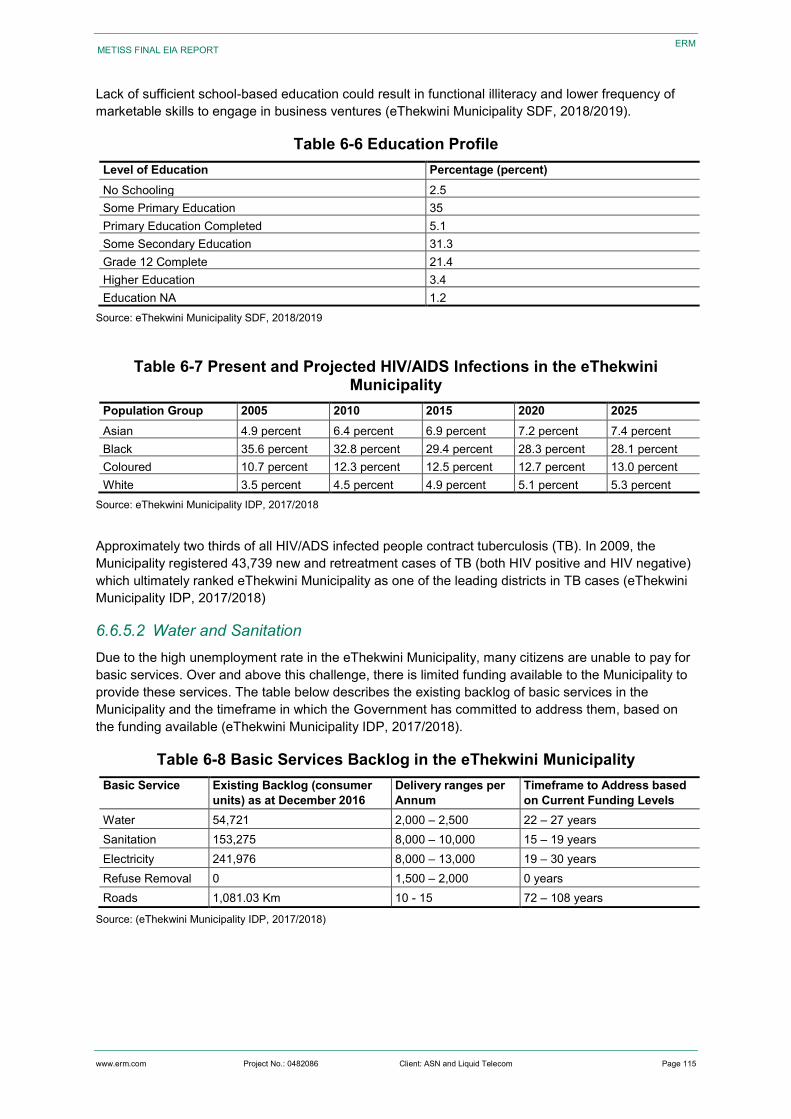
www.erm.com Project No.: 0482086 Client: ASN and Liquid Telecom Page 115
METISS FINAL EIA REPORT
ERM
Lack of sufficient school-based education could result in functional illiteracy and lower frequency of marketable skills to engage in business ventures (eThekwini Municipality SDF, 2018/2019).
Table 6-6 Education Profile Level of Education Percentage (percent) No Schooling 2.5 Some Primary Education 35 Primary Education Completed 5.1 Some Secondary Education 31.3 Grade 12 Complete 21.4 Higher Education 3.4 Education NA 1.2
Source: eThekwini Municipality SDF, 2018/2019
Table 6-7 Present and Projected HIV/AIDS Infections in the eThekwini Municipality
Population Group 2005 2010 2015 2020 2025 Asian 4.9 percent 6.4 percent 6.9 percent 7.2 percent 7.4 percent Black 35.6 percent 32.8 percent 29.4 percent 28.3 percent 28.1 percent Coloured 10.7 percent 12.3 percent 12.5 percent 12.7 percent 13.0 percent White 3.5 percent 4.5 percent 4.9 percent 5.1 percent 5.3 percent
Source: eThekwini Municipality IDP, 2017/2018
Approximately two thirds of all HIV/ADS infected people contract tuberculosis (TB). In 2009, the Municipality registered 43,739 new and retreatment cases of TB (both HIV positive and HIV negative) which ultimately ranked eThekwini Municipality as one of the leading districts in TB cases (eThekwini Municipality IDP, 2017/2018)
6.6.5.2 Water and Sanitation Due to the high unemployment rate in the eThekwini Municipality, many citizens are unable to pay for basic services. Over and above this challenge, there is limited funding available to the Municipality to provide these services. The table below describes the existing backlog of basic services in the Municipality and the timeframe in which the Government has committed to address them, based on the funding available (eThekwini Municipality IDP, 2017/2018).
Table 6-8 Basic Services Backlog in the eThekwini Municipality Basic Service Existing Backlog (consumer
units) as at December 2016 Delivery ranges per Annum
Timeframe to Address based on Current Funding Levels
Water 54,721 2,000 – 2,500 22 – 27 years Sanitation 153,275 8,000 – 10,000 15 – 19 years Electricity 241,976 8,000 – 13,000 19 – 30 years Refuse Removal 0 1,500 – 2,000 0 years Roads 1,081.03 Km 10 - 15 72 – 108 years
Source: (eThekwini Municipality IDP, 2017/2018)
www.erm.com Project No.: 0482086 Client: ASN and Liquid Telecom Page 116
METISS FINAL EIA REPORT
ERM
6.6.6 Dumping Waste
The most common method of waste disposal in the eThekwini Municipal Area is in managed landfill sites. Every year, the four main landfill sites in the Municipality receive over one million tons of waste. Various initiatives have been undertaken by the Municipality to reduce the waste that ends up in landfills has been promoted, including the separation of waste at the source (eThekwini Municipality SDF, 2018/2019).
6.6.7 Mineral and Petroleum and Exploration Rights and Activities
Exploration Rights to specified Oil and Gas License Areas within the subsea cable route, specifically the Tugela Deepwater Block, Durban Offshore Block, Tugela North Block, and the Tugela South Block, have been granted to the following companies:
ExxonMobil;
Sasol and Eni; and
Silver Wave Energy.
The License Areas overlap with the subsea cable route.
6.6.8 Tourism
Tourism contributed 5.9 percent towards eThekwini Municipality’s GDP in 2015. This was a slight decrease from the previous year which was 6.6 percent. A decreasing trend has been noted of the number of trips by purpose made over the past seven years to eThekwini Municipality. Approximately 79 percent of the Municipality’s visitors were domestic, and the other 21 percent were international visitors in the year 2015 (eThekwini Municipality IDP, 2017/2018).
Given its coastal location and the various beaches it has, Amanzimtoti is a popular tourist destination. It has a number of guest houses and is particularly popular with those tourist who enjoy surfing.
6.6.9 Marine Traffic
South Africa’s major export destinations are as follows: the USA (8.2 percent), China (8.1 percent), and Germany (7.6 percent), Japan (4.8 percent and Botswana (4.8 percent) The items generally being exported include precious metals and stones, chemical products, vehicles and transport equipment and mineral products (eThekwini Municipality IDP, 2017/2018).
A large number of vessels in transit navigate along the East Coast on their way around the southern African subcontinent. The majority of this boat traffic, including commercial and fishing vessels, remains relatively close inshore on the East Coast. North- and south-bound cargo vessels usually remain over the mid-shelf (100 m isobath). In contrast, tankers and bulk carriers remain further offshore, unless needing to move inshore to avoid extremely rough conditions that develop in the Agulhas Current.
The Project Area of Influence will overlap with the routes taken by tankers and bulk carriers.
6.6.1 Subsea Cables
There are a number of other submarine telecommunications cable systems in South African waters (Figure 6-25). The SAExpress, SAFE, EASSy and Seacom subsea cables land at Mtunzini, located approximately 100 km north of Durban.
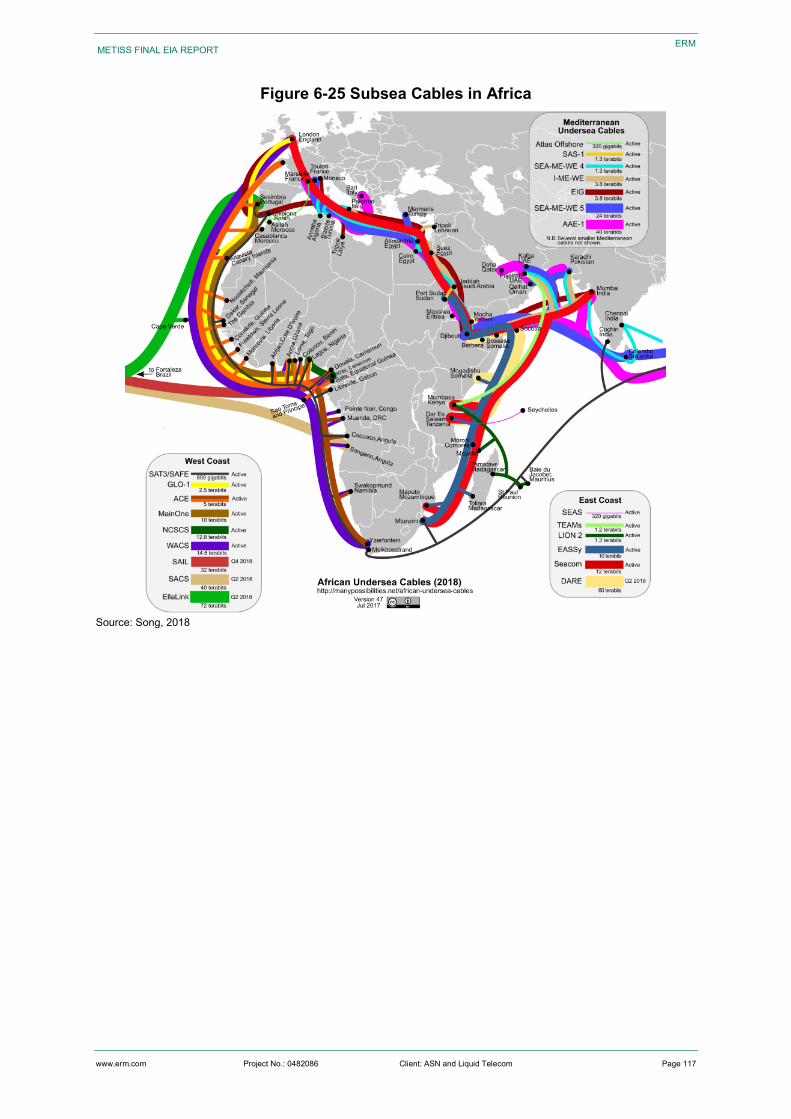
www.erm.com Project No.: 0482086 Client: ASN and Liquid Telecom Page 117
METISS FINAL EIA REPORT
ERM
Figure 6-25 Subsea Cables in Africa
Source: Song, 2018
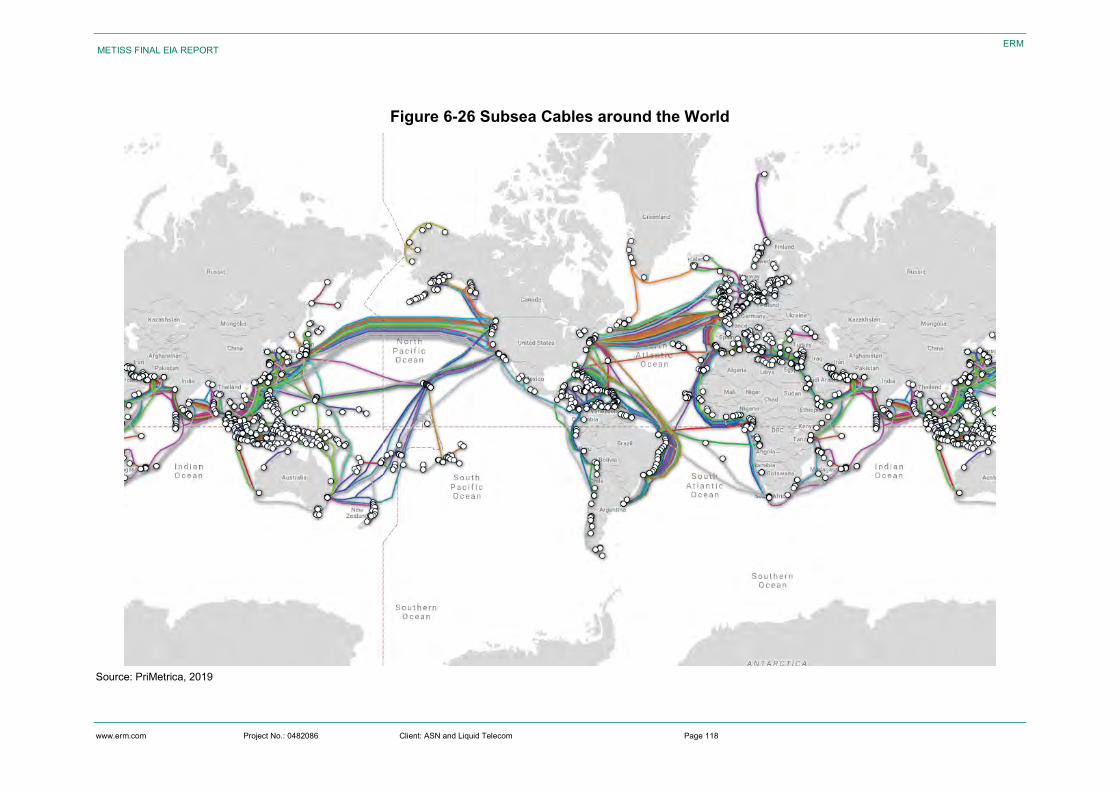
www.erm.com Project No.: 0482086 Client: ASN and Liquid Telecom Page 118
METISS FINAL EIA REPORT
ERM
Figure 6-26 Subsea Cables around the World
Source: PriMetrica, 2019
www.erm.com Project No.: 0482086 Client: ASN and Liquid Telecom Page 119
METISS FINAL EIA REPORT
ENVIRONMENTAL AND SOCIAL BASELINE CONDITIONS
6.6.2 Fisheries
6.6.2.1 Description of Commercial Fishing Sectors and Fisheries Research Surveys South Africa has a coastline that spans two ecosystems over a distance of 3,623 km, extending from the Orange River in the west on the border with Namibia, to Ponta do Ouro in the east on the Mozambique border. The western coastal shelf has highly productive commercial fisheries similar to other upwelling ecosystems around the world, while the East Coast is considerably less productive but has high species diversity, including both endemic and Indo-Pacific species. South Africa’s fisheries are regulated and monitored by the Department of Agriculture, Forestry and Fisheries (DAFF). All fisheries in South Africa, as well as the processing, sale in and trade of almost all marine resources, are regulated under the Marine Living Resources Act, 1998 (No. 18 of 1998) (MLRA).
Approximately 14 different commercial fisheries sectors currently operate within South African waters. Figure 6-27 indicates the proportional volume and value of catch landed by each of these sectors (2016).
Primary fisheries in terms of economic value and overall tonnage of landings are the demersal (bottom) trawl and long-line fisheries targeting the Cape hakes (Merluccius paradoxus and M. capensis) and the pelagic-directed purse-seine fishery targeting pilchard (Sardinops sagax), anchovy (Engraulis encrasicolus) and red-eye round herring (Etrumeus whitheadii).
Highly migratory tuna and tuna-like species are caught on the high seas and seasonally within the South African waters by the pelagic long-line and pole fisheries. Targeted species include albacore (Thunnus alalunga), bigeye tuna (T. obesus), yellowfin tuna (T. albacares) and swordfish (Xiphias gladius). The traditional line fishery targets a large assemblage of species close to shore including snoek (Thyrsites atun), Cape bream (Pachymetopon blochii), geelbek (Atractoscion aequidens), kob (Argyrosomus japonicus), yellowtail (Seriola lalandi) and other reef fish. Crustacean fisheries comprise a trap and hoop net fishery targeting West Coast rock lobster (Jasus lalandii), a line trap fishery targeting the South Coast rock lobster (Palinurus gilchristi) and a trawl fishery based solely on the East Coast targeting penaeid prawns, langoustines (Metanephrops andamanicus and Nephropsis stewarti), deep-water rock lobster (Palinurus delagoae) and red crab (Chaceon macphersoni). Other fisheries include a mid-water trawl fishery targeting horse mackerel (Trachurus trachurus capensis) predominantly on the Agulhas Bank, South Coast and a hand-jig fishery targeting chokka squid (Loligo vulgaris reynaudii) exclusively on the South Coast. In addition to commercial sectors, recreational fishing occurs along the coastline comprising shore angling and small, open boats generally less than 10 m in length.
The commercial and recreational fisheries are reported to catch over 250 marine species, although fewer than five percent of these are actively targeted by commercial fisheries, which comprise 90 percent of the landed catch.
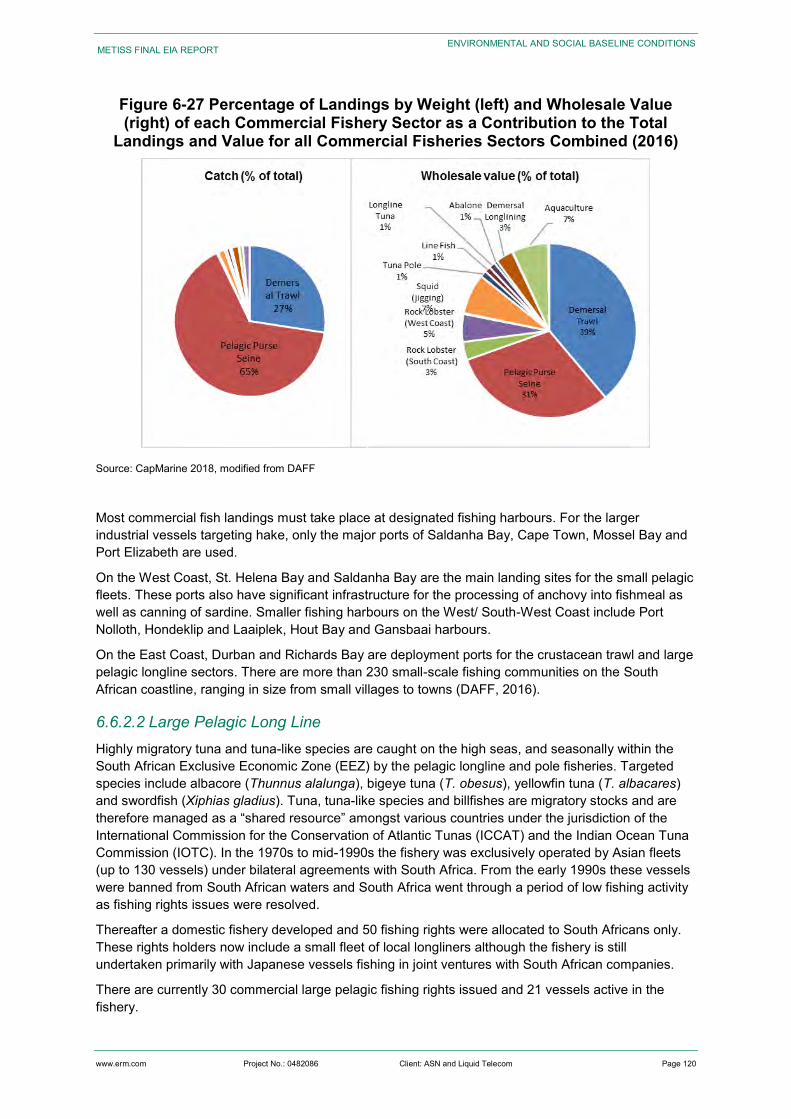
www.erm.com Project No.: 0482086 Client: ASN and Liquid Telecom Page 120
METISS FINAL EIA REPORT
ENVIRONMENTAL AND SOCIAL BASELINE CONDITIONS
Figure 6-27 Percentage of Landings by Weight (left) and Wholesale Value (right) of each Commercial Fishery Sector as a Contribution to the Total
Landings and Value for all Commercial Fisheries Sectors Combined (2016)
Source: CapMarine 2018, modified from DAFF
Most commercial fish landings must take place at designated fishing harbours. For the larger industrial vessels targeting hake, only the major ports of Saldanha Bay, Cape Town, Mossel Bay and Port Elizabeth are used.
On the West Coast, St. Helena Bay and Saldanha Bay are the main landing sites for the small pelagic fleets. These ports also have significant infrastructure for the processing of anchovy into fishmeal as well as canning of sardine. Smaller fishing harbours on the West/ South-West Coast include Port Nolloth, Hondeklip and Laaiplek, Hout Bay and Gansbaai harbours.
On the East Coast, Durban and Richards Bay are deployment ports for the crustacean trawl and large pelagic longline sectors. There are more than 230 small-scale fishing communities on the South African coastline, ranging in size from small villages to towns (DAFF, 2016).
6.6.2.2 Large Pelagic Long Line Highly migratory tuna and tuna-like species are caught on the high seas, and seasonally within the South African Exclusive Economic Zone (EEZ) by the pelagic longline and pole fisheries. Targeted species include albacore (Thunnus alalunga), bigeye tuna (T. obesus), yellowfin tuna (T. albacares) and swordfish (Xiphias gladius). Tuna, tuna-like species and billfishes are migratory stocks and are therefore managed as a “shared resource” amongst various countries under the jurisdiction of the International Commission for the Conservation of Atlantic Tunas (ICCAT) and the Indian Ocean Tuna Commission (IOTC). In the 1970s to mid-1990s the fishery was exclusively operated by Asian fleets (up to 130 vessels) under bilateral agreements with South Africa. From the early 1990s these vessels were banned from South African waters and South Africa went through a period of low fishing activity as fishing rights issues were resolved.
Thereafter a domestic fishery developed and 50 fishing rights were allocated to South Africans only. These rights holders now include a small fleet of local longliners although the fishery is still undertaken primarily with Japanese vessels fishing in joint ventures with South African companies.
There are currently 30 commercial large pelagic fishing rights issued and 21 vessels active in the fishery.
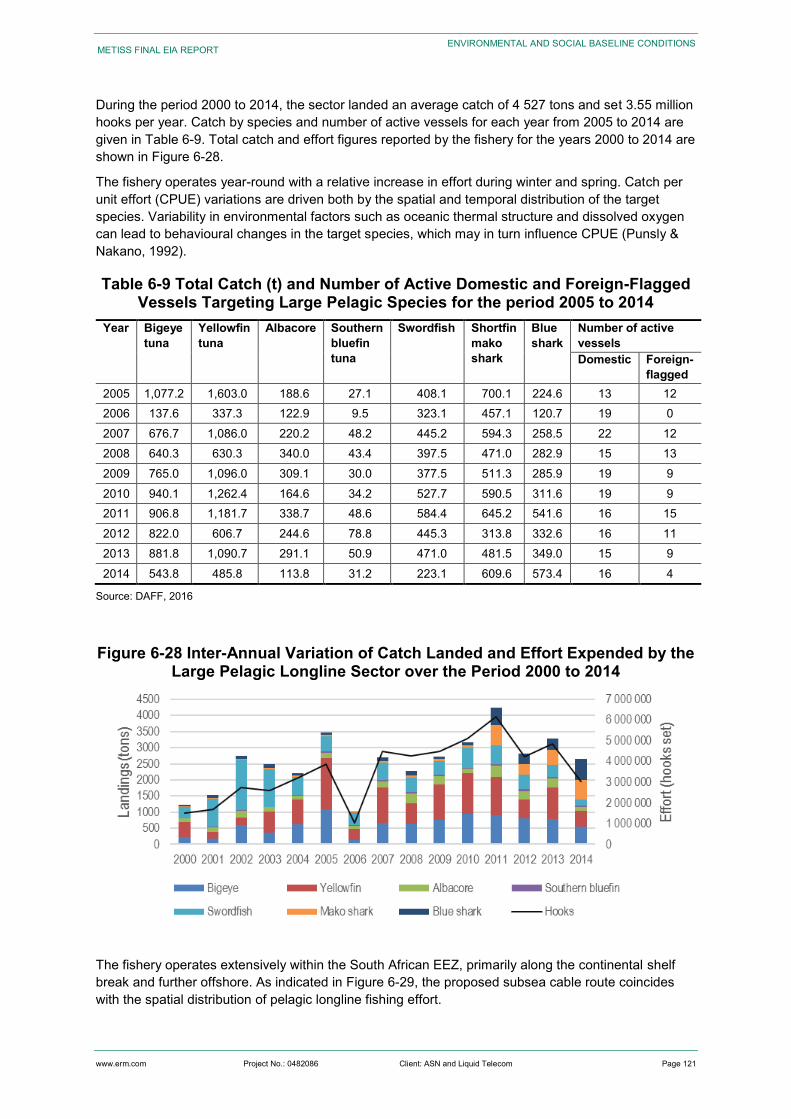
www.erm.com Project No.: 0482086 Client: ASN and Liquid Telecom Page 121
METISS FINAL EIA REPORT
ENVIRONMENTAL AND SOCIAL BASELINE CONDITIONS
During the period 2000 to 2014, the sector landed an average catch of 4 527 tons and set 3.55 million hooks per year. Catch by species and number of active vessels for each year from 2005 to 2014 are given in Table 6-9. Total catch and effort figures reported by the fishery for the years 2000 to 2014 are shown in Figure 6-28.
The fishery operates year-round with a relative increase in effort during winter and spring. Catch per unit effort (CPUE) variations are driven both by the spatial and temporal distribution of the target species. Variability in environmental factors such as oceanic thermal structure and dissolved oxygen can lead to behavioural changes in the target species, which may in turn influence CPUE (Punsly & Nakano, 1992).
Table 6-9 Total Catch (t) and Number of Active Domestic and Foreign-Flagged Vessels Targeting Large Pelagic Species for the period 2005 to 2014
Year Bigeye tuna
Yellowfin tuna
Albacore Southern bluefin tuna
Swordfish Shortfin mako shark
Blue shark
Number of active vessels Domestic Foreign-
flagged 2005 1,077.2 1,603.0 188.6 27.1 408.1 700.1 224.6 13 12 2006 137.6 337.3 122.9 9.5 323.1 457.1 120.7 19 0 2007 676.7 1,086.0 220.2 48.2 445.2 594.3 258.5 22 12 2008 640.3 630.3 340.0 43.4 397.5 471.0 282.9 15 13 2009 765.0 1,096.0 309.1 30.0 377.5 511.3 285.9 19 9 2010 940.1 1,262.4 164.6 34.2 527.7 590.5 311.6 19 9 2011 906.8 1,181.7 338.7 48.6 584.4 645.2 541.6 16 15 2012 822.0 606.7 244.6 78.8 445.3 313.8 332.6 16 11 2013 881.8 1,090.7 291.1 50.9 471.0 481.5 349.0 15 9 2014 543.8 485.8 113.8 31.2 223.1 609.6 573.4 16 4
Source: DAFF, 2016
Figure 6-28 Inter-Annual Variation of Catch Landed and Effort Expended by the Large Pelagic Longline Sector over the Period 2000 to 2014
The fishery operates extensively within the South African EEZ, primarily along the continental shelf break and further offshore. As indicated in Figure 6-29, the proposed subsea cable route coincides with the spatial distribution of pelagic longline fishing effort.
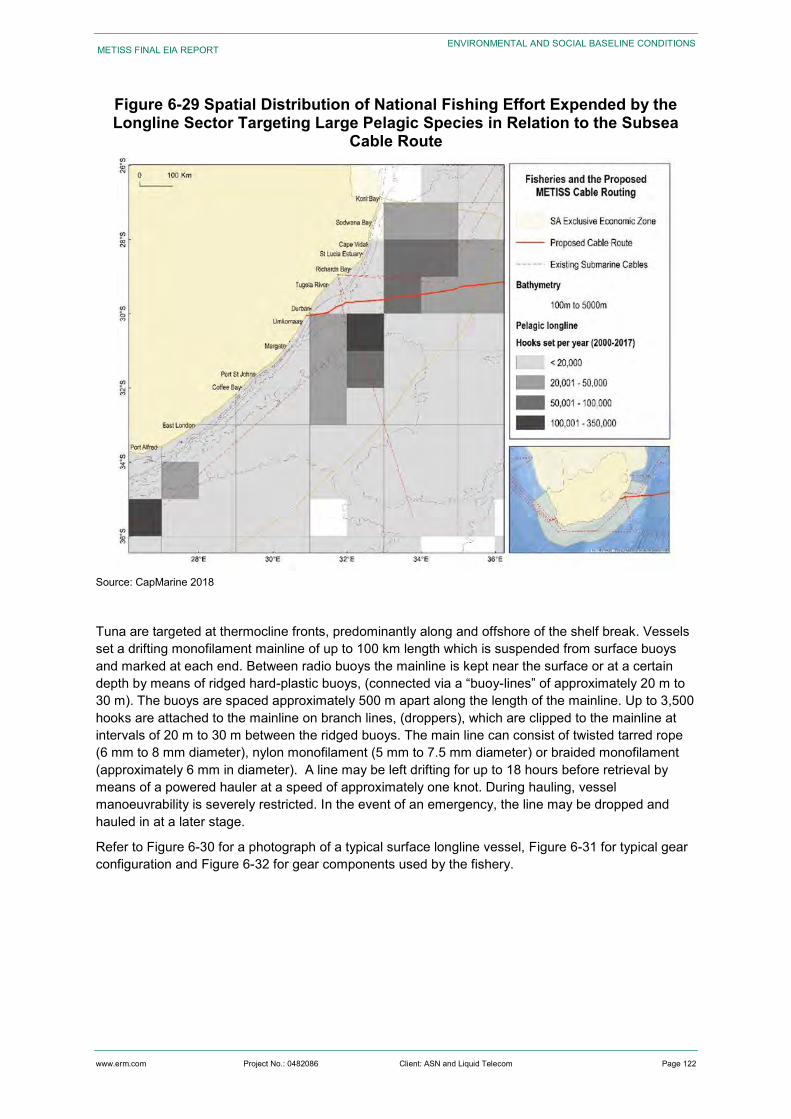
www.erm.com Project No.: 0482086 Client: ASN and Liquid Telecom Page 122
METISS FINAL EIA REPORT
ENVIRONMENTAL AND SOCIAL BASELINE CONDITIONS
Figure 6-29 Spatial Distribution of National Fishing Effort Expended by the Longline Sector Targeting Large Pelagic Species in Relation to the Subsea
Cable Route
Source: CapMarine 2018
Tuna are targeted at thermocline fronts, predominantly along and offshore of the shelf break. Vessels set a drifting monofilament mainline of up to 100 km length which is suspended from surface buoys and marked at each end. Between radio buoys the mainline is kept near the surface or at a certain depth by means of ridged hard-plastic buoys, (connected via a “buoy-lines” of approximately 20 m to 30 m). The buoys are spaced approximately 500 m apart along the length of the mainline. Up to 3,500 hooks are attached to the mainline on branch lines, (droppers), which are clipped to the mainline at intervals of 20 m to 30 m between the ridged buoys. The main line can consist of twisted tarred rope (6 mm to 8 mm diameter), nylon monofilament (5 mm to 7.5 mm diameter) or braided monofilament (approximately 6 mm in diameter). A line may be left drifting for up to 18 hours before retrieval by means of a powered hauler at a speed of approximately one knot. During hauling, vessel manoeuvrability is severely restricted. In the event of an emergency, the line may be dropped and hauled in at a later stage.
Refer to Figure 6-30 for a photograph of a typical surface longline vessel, Figure 6-31 for typical gear configuration and Figure 6-32 for gear components used by the fishery.
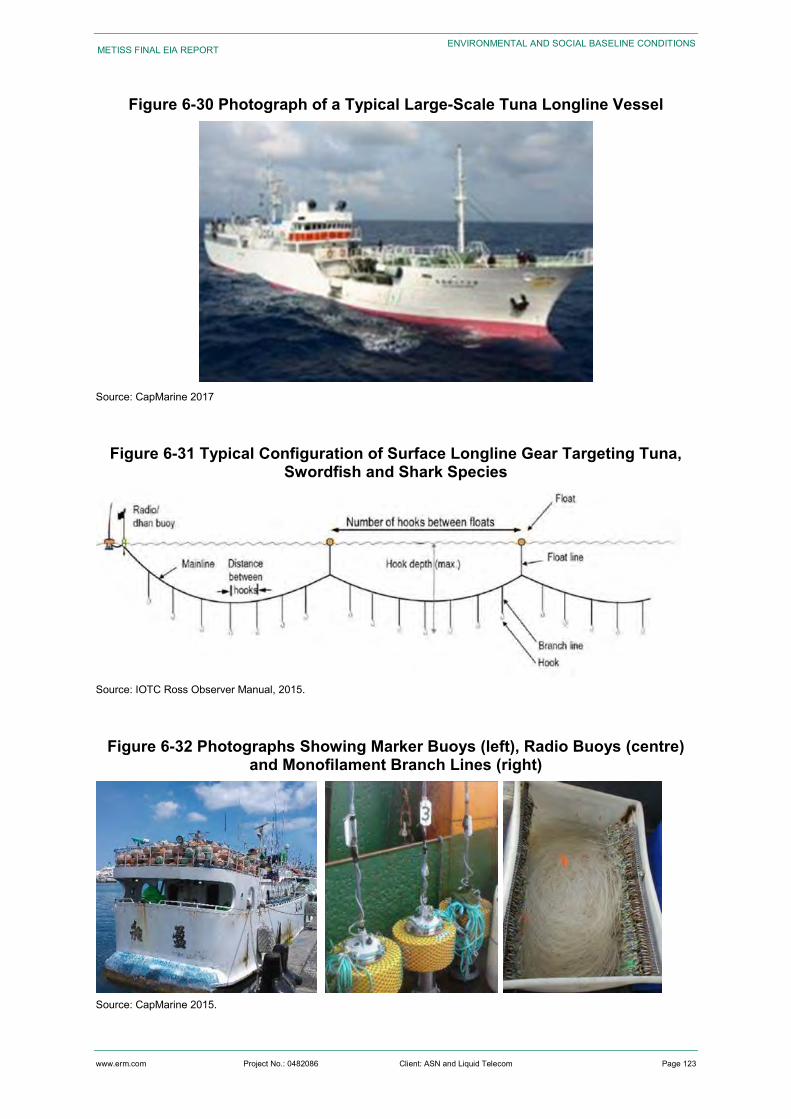
www.erm.com Project No.: 0482086 Client: ASN and Liquid Telecom Page 123
METISS FINAL EIA REPORT
ENVIRONMENTAL AND SOCIAL BASELINE CONDITIONS
Figure 6-30 Photograph of a Typical Large-Scale Tuna Longline Vessel
Source: CapMarine 2017
Figure 6-31 Typical Configuration of Surface Longline Gear Targeting Tuna, Swordfish and Shark Species
Source: IOTC Ross Observer Manual, 2015.
Figure 6-32 Photographs Showing Marker Buoys (left), Radio Buoys (centre) and Monofilament Branch Lines (right)
Source: CapMarine 2015.
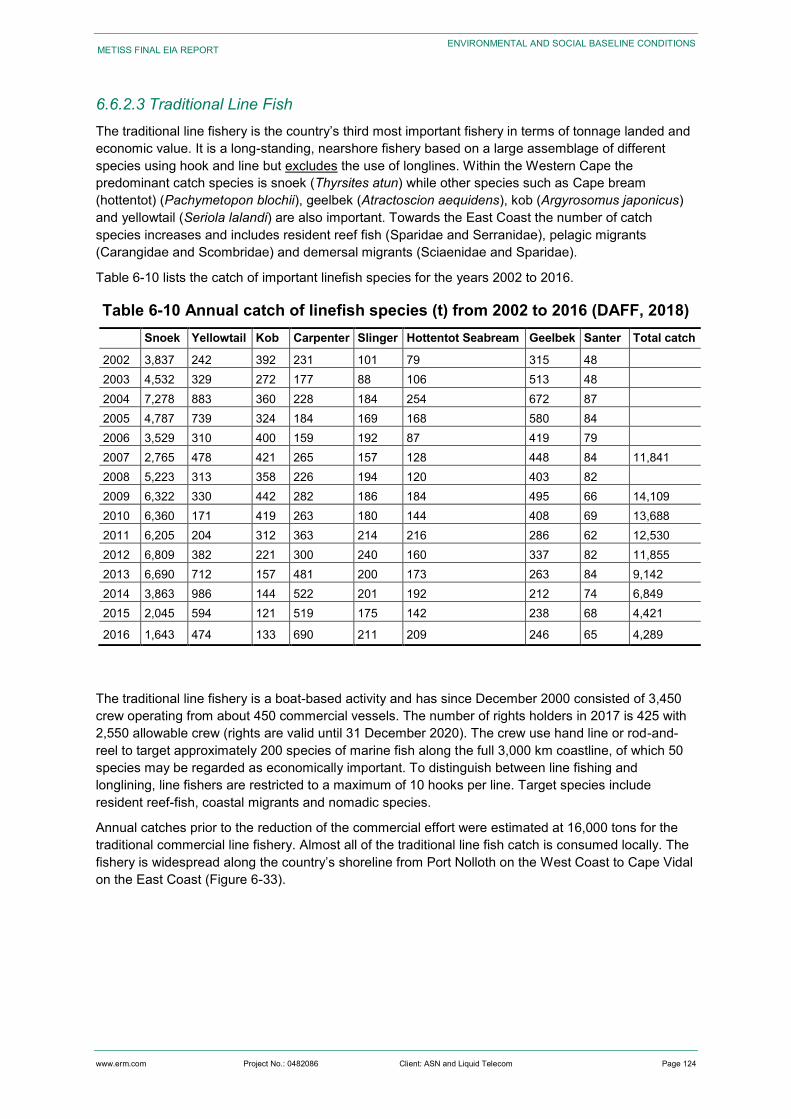
www.erm.com Project No.: 0482086 Client: ASN and Liquid Telecom Page 124
METISS FINAL EIA REPORT
ENVIRONMENTAL AND SOCIAL BASELINE CONDITIONS
6.6.2.3 Traditional Line Fish The traditional line fishery is the country’s third most important fishery in terms of tonnage landed and economic value. It is a long-standing, nearshore fishery based on a large assemblage of different species using hook and line but excludes the use of longlines. Within the Western Cape the predominant catch species is snoek (Thyrsites atun) while other species such as Cape bream (hottentot) (Pachymetopon blochii), geelbek (Atractoscion aequidens), kob (Argyrosomus japonicus) and yellowtail (Seriola lalandi) are also important. Towards the East Coast the number of catch species increases and includes resident reef fish (Sparidae and Serranidae), pelagic migrants (Carangidae and Scombridae) and demersal migrants (Sciaenidae and Sparidae).
Table 6-10 lists the catch of important linefish species for the years 2002 to 2016.
Table 6-10 Annual catch of linefish species (t) from 2002 to 2016 (DAFF, 2018) Snoek Yellowtail Kob Carpenter Slinger Hottentot Seabream Geelbek Santer Total catch
2002 3,837 242 392 231 101 79 315 48 2003 4,532 329 272 177 88 106 513 48 2004 7,278 883 360 228 184 254 672 87 2005 4,787 739 324 184 169 168 580 84 2006 3,529 310 400 159 192 87 419 79 2007 2,765 478 421 265 157 128 448 84 11,841 2008 5,223 313 358 226 194 120 403 82 2009 6,322 330 442 282 186 184 495 66 14,109 2010 6,360 171 419 263 180 144 408 69 13,688 2011 6,205 204 312 363 214 216 286 62 12,530 2012 6,809 382 221 300 240 160 337 82 11,855 2013 6,690 712 157 481 200 173 263 84 9,142 2014 3,863 986 144 522 201 192 212 74 6,849 2015 2,045 594 121 519 175 142 238 68 4,421
2016 1,643 474 133 690 211 209 246 65 4,289
The traditional line fishery is a boat-based activity and has since December 2000 consisted of 3,450 crew operating from about 450 commercial vessels. The number of rights holders in 2017 is 425 with 2,550 allowable crew (rights are valid until 31 December 2020). The crew use hand line or rod-and-reel to target approximately 200 species of marine fish along the full 3,000 km coastline, of which 50 species may be regarded as economically important. To distinguish between line fishing and longlining, line fishers are restricted to a maximum of 10 hooks per line. Target species include resident reef-fish, coastal migrants and nomadic species.
Annual catches prior to the reduction of the commercial effort were estimated at 16,000 tons for the traditional commercial line fishery. Almost all of the traditional line fish catch is consumed locally. The fishery is widespread along the country’s shoreline from Port Nolloth on the West Coast to Cape Vidal on the East Coast (Figure 6-33).
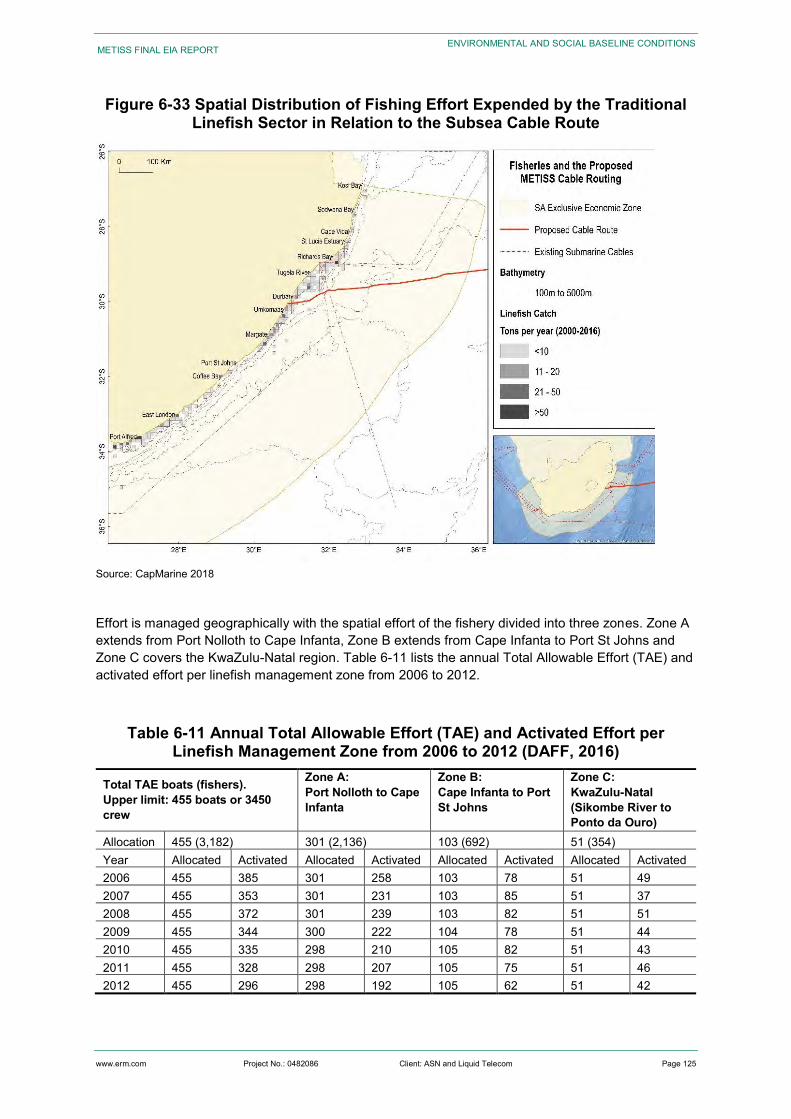
www.erm.com Project No.: 0482086 Client: ASN and Liquid Telecom Page 125
METISS FINAL EIA REPORT
ENVIRONMENTAL AND SOCIAL BASELINE CONDITIONS
Figure 6-33 Spatial Distribution of Fishing Effort Expended by the Traditional Linefish Sector in Relation to the Subsea Cable Route
Source: CapMarine 2018
Effort is managed geographically with the spatial effort of the fishery divided into three zones. Zone A extends from Port Nolloth to Cape Infanta, Zone B extends from Cape Infanta to Port St Johns and Zone C covers the KwaZulu-Natal region. Table 6-11 lists the annual Total Allowable Effort (TAE) and activated effort per linefish management zone from 2006 to 2012.
Table 6-11 Annual Total Allowable Effort (TAE) and Activated Effort per Linefish Management Zone from 2006 to 2012 (DAFF, 2016)
Total TAE boats (fishers). Upper limit: 455 boats or 3450 crew
Zone A: Port Nolloth to Cape Infanta
Zone B: Cape Infanta to Port St Johns
Zone C: KwaZulu-Natal (Sikombe River to Ponto da Ouro)
Allocation 455 (3,182) 301 (2,136) 103 (692) 51 (354) Year Allocated Activated Allocated Activated Allocated Activated Allocated Activated 2006 455 385 301 258 103 78 51 49 2007 455 353 301 231 103 85 51 37 2008 455 372 301 239 103 82 51 51 2009 455 344 300 222 104 78 51 44 2010 455 335 298 210 105 82 51 43 2011 455 328 298 207 105 75 51 46 2012 455 296 298 192 105 62 51 42
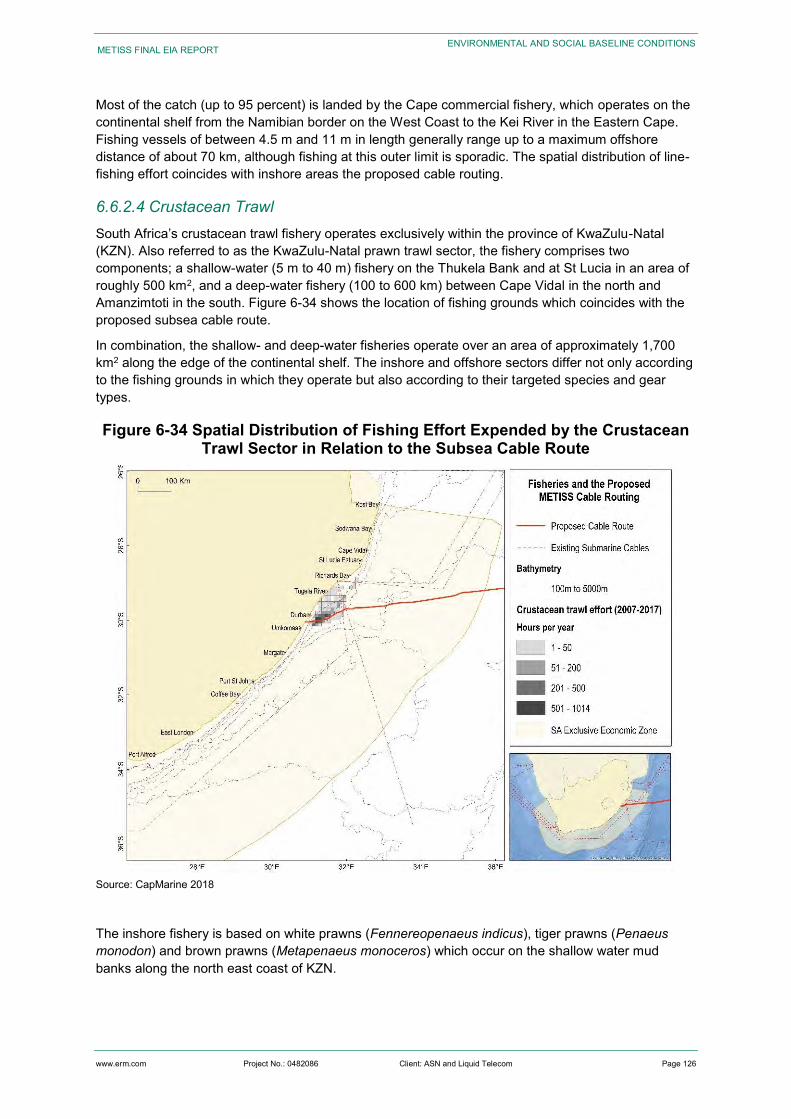
www.erm.com Project No.: 0482086 Client: ASN and Liquid Telecom Page 126
METISS FINAL EIA REPORT
ENVIRONMENTAL AND SOCIAL BASELINE CONDITIONS
Most of the catch (up to 95 percent) is landed by the Cape commercial fishery, which operates on the continental shelf from the Namibian border on the West Coast to the Kei River in the Eastern Cape. Fishing vessels of between 4.5 m and 11 m in length generally range up to a maximum offshore distance of about 70 km, although fishing at this outer limit is sporadic. The spatial distribution of line-fishing effort coincides with inshore areas the proposed cable routing.
6.6.2.4 Crustacean Trawl South Africa’s crustacean trawl fishery operates exclusively within the province of KwaZulu-Natal (KZN). Also referred to as the KwaZulu-Natal prawn trawl sector, the fishery comprises two components; a shallow-water (5 m to 40 m) fishery on the Thukela Bank and at St Lucia in an area of roughly 500 km2, and a deep-water fishery (100 to 600 km) between Cape Vidal in the north and Amanzimtoti in the south. Figure 6-34 shows the location of fishing grounds which coincides with the proposed subsea cable route.
In combination, the shallow- and deep-water fisheries operate over an area of approximately 1,700 km2 along the edge of the continental shelf. The inshore and offshore sectors differ not only according to the fishing grounds in which they operate but also according to their targeted species and gear types.
Figure 6-34 Spatial Distribution of Fishing Effort Expended by the Crustacean Trawl Sector in Relation to the Subsea Cable Route
Source: CapMarine 2018
The inshore fishery is based on white prawns (Fennereopenaeus indicus), tiger prawns (Penaeus monodon) and brown prawns (Metapenaeus monoceros) which occur on the shallow water mud banks along the north east coast of KZN.
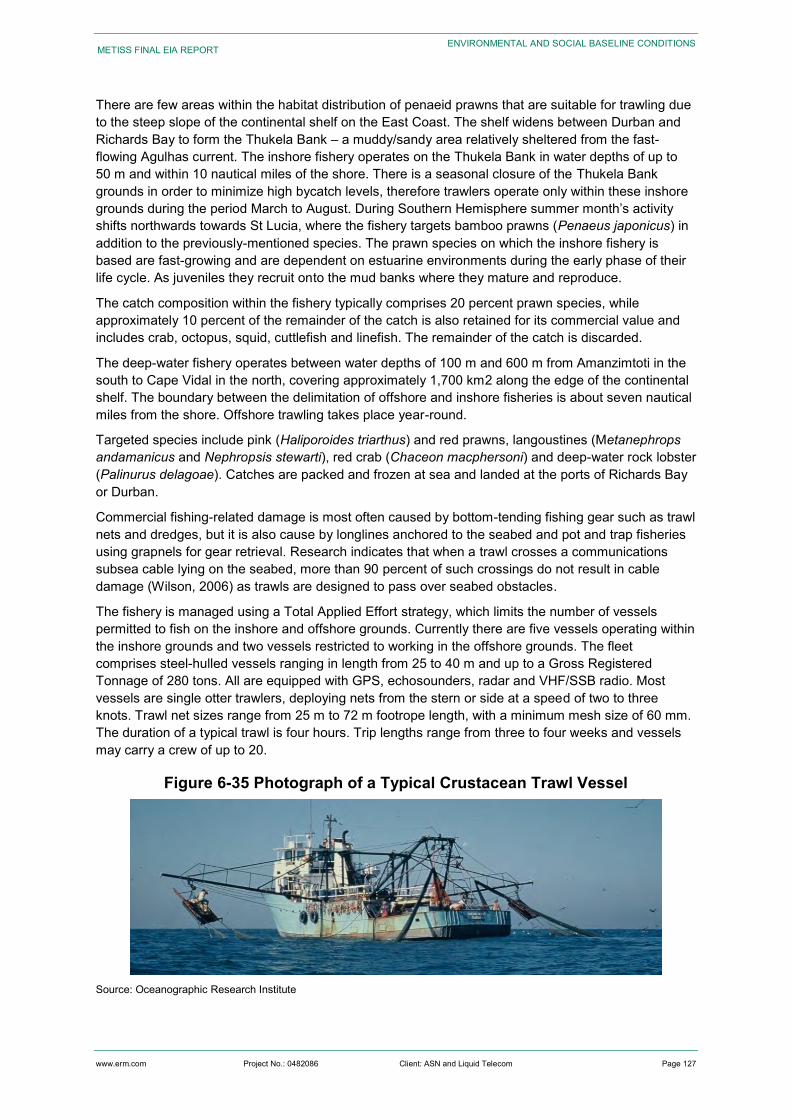
www.erm.com Project No.: 0482086 Client: ASN and Liquid Telecom Page 127
METISS FINAL EIA REPORT
ENVIRONMENTAL AND SOCIAL BASELINE CONDITIONS
There are few areas within the habitat distribution of penaeid prawns that are suitable for trawling due to the steep slope of the continental shelf on the East Coast. The shelf widens between Durban and Richards Bay to form the Thukela Bank – a muddy/sandy area relatively sheltered from the fast-flowing Agulhas current. The inshore fishery operates on the Thukela Bank in water depths of up to 50 m and within 10 nautical miles of the shore. There is a seasonal closure of the Thukela Bank grounds in order to minimize high bycatch levels, therefore trawlers operate only within these inshore grounds during the period March to August. During Southern Hemisphere summer month’s activity shifts northwards towards St Lucia, where the fishery targets bamboo prawns (Penaeus japonicus) in addition to the previously-mentioned species. The prawn species on which the inshore fishery is based are fast-growing and are dependent on estuarine environments during the early phase of their life cycle. As juveniles they recruit onto the mud banks where they mature and reproduce.
The catch composition within the fishery typically comprises 20 percent prawn species, while approximately 10 percent of the remainder of the catch is also retained for its commercial value and includes crab, octopus, squid, cuttlefish and linefish. The remainder of the catch is discarded.
The deep-water fishery operates between water depths of 100 m and 600 m from Amanzimtoti in the south to Cape Vidal in the north, covering approximately 1,700 km2 along the edge of the continental shelf. The boundary between the delimitation of offshore and inshore fisheries is about seven nautical miles from the shore. Offshore trawling takes place year-round.
Targeted species include pink (Haliporoides triarthus) and red prawns, langoustines (Metanephrops andamanicus and Nephropsis stewarti), red crab (Chaceon macphersoni) and deep-water rock lobster (Palinurus delagoae). Catches are packed and frozen at sea and landed at the ports of Richards Bay or Durban.
Commercial fishing-related damage is most often caused by bottom-tending fishing gear such as trawl nets and dredges, but it is also cause by longlines anchored to the seabed and pot and trap fisheries using grapnels for gear retrieval. Research indicates that when a trawl crosses a communications subsea cable lying on the seabed, more than 90 percent of such crossings do not result in cable damage (Wilson, 2006) as trawls are designed to pass over seabed obstacles.
The fishery is managed using a Total Applied Effort strategy, which limits the number of vessels permitted to fish on the inshore and offshore grounds. Currently there are five vessels operating within the inshore grounds and two vessels restricted to working in the offshore grounds. The fleet comprises steel-hulled vessels ranging in length from 25 to 40 m and up to a Gross Registered Tonnage of 280 tons. All are equipped with GPS, echosounders, radar and VHF/SSB radio. Most vessels are single otter trawlers, deploying nets from the stern or side at a speed of two to three knots. Trawl net sizes range from 25 m to 72 m footrope length, with a minimum mesh size of 60 mm. The duration of a typical trawl is four hours. Trip lengths range from three to four weeks and vessels may carry a crew of up to 20.
Figure 6-35 Photograph of a Typical Crustacean Trawl Vessel
Source: Oceanographic Research Institute
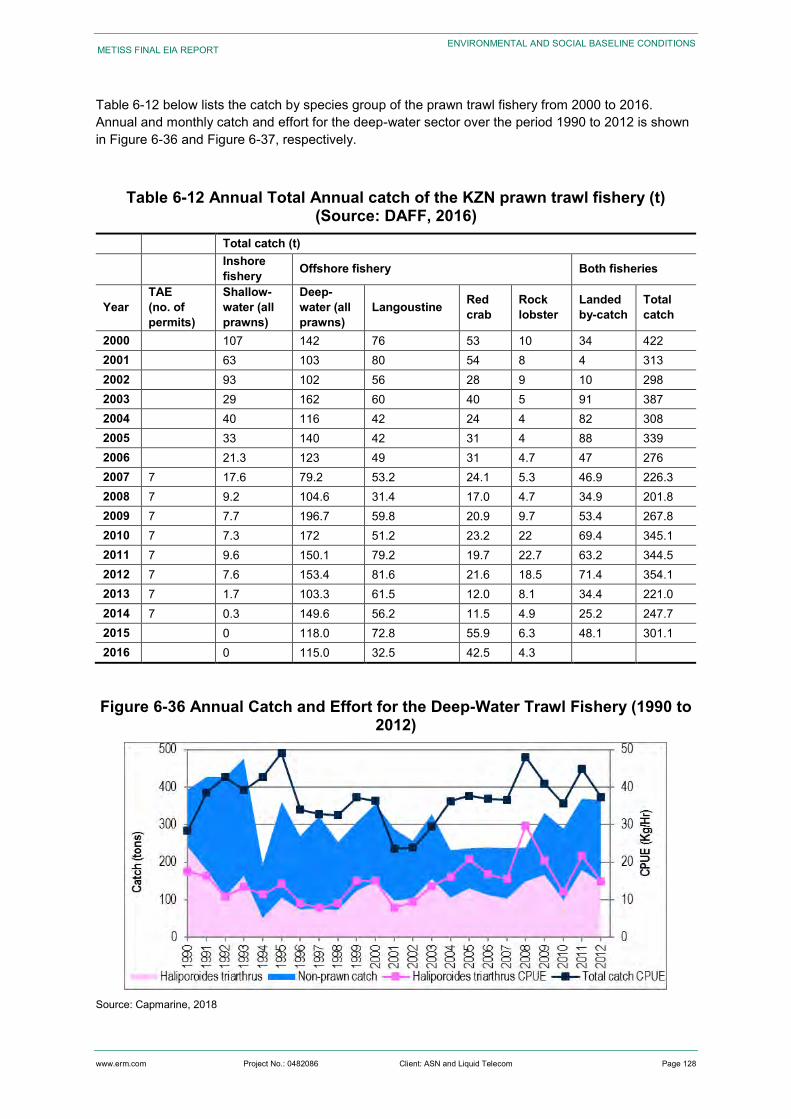
www.erm.com Project No.: 0482086 Client: ASN and Liquid Telecom Page 128
METISS FINAL EIA REPORT
ENVIRONMENTAL AND SOCIAL BASELINE CONDITIONS
Table 6-12 below lists the catch by species group of the prawn trawl fishery from 2000 to 2016. Annual and monthly catch and effort for the deep-water sector over the period 1990 to 2012 is shown in Figure 6-36 and Figure 6-37, respectively.
Table 6-12 Annual Total Annual catch of the KZN prawn trawl fishery (t) (Source: DAFF, 2016)
Total catch (t)
Inshore fishery Offshore fishery Both fisheries
Year TAE (no. of permits)
Shallow-water (all prawns)
Deep-water (all prawns)
Langoustine Red crab
Rock lobster
Landed by-catch
Total catch
2000 107 142 76 53 10 34 422 2001 63 103 80 54 8 4 313 2002 93 102 56 28 9 10 298 2003 29 162 60 40 5 91 387 2004 40 116 42 24 4 82 308 2005 33 140 42 31 4 88 339 2006 21.3 123 49 31 4.7 47 276 2007 7 17.6 79.2 53.2 24.1 5.3 46.9 226.3 2008 7 9.2 104.6 31.4 17.0 4.7 34.9 201.8 2009 7 7.7 196.7 59.8 20.9 9.7 53.4 267.8 2010 7 7.3 172 51.2 23.2 22 69.4 345.1 2011 7 9.6 150.1 79.2 19.7 22.7 63.2 344.5 2012 7 7.6 153.4 81.6 21.6 18.5 71.4 354.1 2013 7 1.7 103.3 61.5 12.0 8.1 34.4 221.0 2014 7 0.3 149.6 56.2 11.5 4.9 25.2 247.7 2015 0 118.0 72.8 55.9 6.3 48.1 301.1 2016 0 115.0 32.5 42.5 4.3
Figure 6-36 Annual Catch and Effort for the Deep-Water Trawl Fishery (1990 to 2012)
Source: Capmarine, 2018
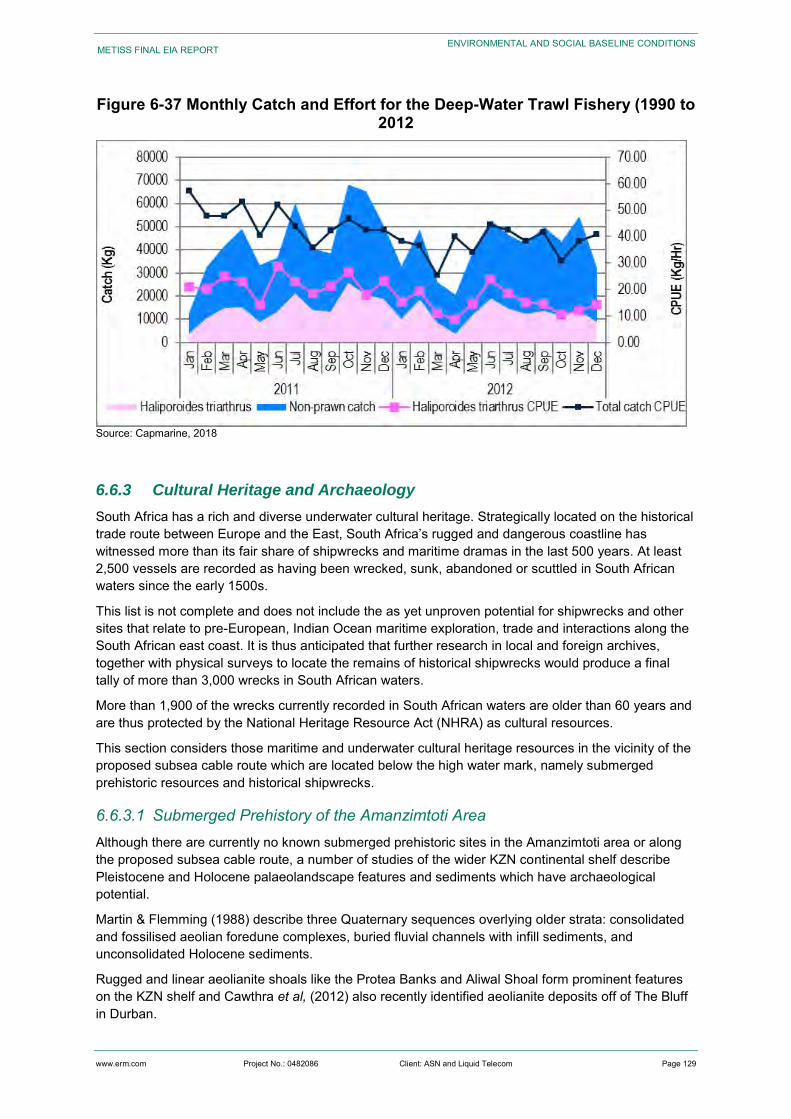
www.erm.com Project No.: 0482086 Client: ASN and Liquid Telecom Page 129
METISS FINAL EIA REPORT
ENVIRONMENTAL AND SOCIAL BASELINE CONDITIONS
Figure 6-37 Monthly Catch and Effort for the Deep-Water Trawl Fishery (1990 to 2012
Source: Capmarine, 2018
6.6.3 Cultural Heritage and Archaeology
South Africa has a rich and diverse underwater cultural heritage. Strategically located on the historical trade route between Europe and the East, South Africa’s rugged and dangerous coastline has witnessed more than its fair share of shipwrecks and maritime dramas in the last 500 years. At least 2,500 vessels are recorded as having been wrecked, sunk, abandoned or scuttled in South African waters since the early 1500s.
This list is not complete and does not include the as yet unproven potential for shipwrecks and other sites that relate to pre-European, Indian Ocean maritime exploration, trade and interactions along the South African east coast. It is thus anticipated that further research in local and foreign archives, together with physical surveys to locate the remains of historical shipwrecks would produce a final tally of more than 3,000 wrecks in South African waters.
More than 1,900 of the wrecks currently recorded in South African waters are older than 60 years and are thus protected by the National Heritage Resource Act (NHRA) as cultural resources.
This section considers those maritime and underwater cultural heritage resources in the vicinity of the proposed subsea cable route which are located below the high water mark, namely submerged prehistoric resources and historical shipwrecks.
6.6.3.1 Submerged Prehistory of the Amanzimtoti Area Although there are currently no known submerged prehistoric sites in the Amanzimtoti area or along the proposed subsea cable route, a number of studies of the wider KZN continental shelf describe Pleistocene and Holocene palaeolandscape features and sediments which have archaeological potential.
Martin & Flemming (1988) describe three Quaternary sequences overlying older strata: consolidated and fossilised aeolian foredune complexes, buried fluvial channels with infill sediments, and unconsolidated Holocene sediments.
Rugged and linear aeolianite shoals like the Protea Banks and Aliwal Shoal form prominent features on the KZN shelf and Cawthra et al, (2012) also recently identified aeolianite deposits off of The Bluff in Durban.
www.erm.com Project No.: 0482086 Client: ASN and Liquid Telecom Page 130
METISS FINAL EIA REPORT
ENVIRONMENTAL AND SOCIAL BASELINE CONDITIONS
These aeolianite deposits form a succession of shore-parallel reef systems extending to depths in excess of 100 m below mean sea level. They are linked to global Quaternary sea level fluctuations and are thought to represent Late Pleistocene palaeocoastlines. They formed as coastal dunes associated with barrier beaches and are interpreted as submerged coastal dune cordons (Martin and Flemming, 1988; Bosman et al, 2005; Cawthra et al, 2012). Martin and Flemming (1988) suggest that they were formed during the last glacial, between 120,000 and 30,000 years ago. An Infrared Stimulated Luminescence age of 60 ka obtained by Cawthra et al, (2012) supports this dune building during the Marine Isotope Stage 4, last glacial period. Coastal dunes are a known focus of pre-colonial human activity, and sites are often found in dune slacks which provide shelter from the prevailing wind. It is possible, therefore, that there will be archaeological sites and material associated with the aeolianite deposits off the KZN coast, although such material has not yet been identified.
A number of studies (e.g., Green & Garlick, 2011; Dladla, 2013) have also described incised valleys on the continental shelf which were cut during sea-level low-stands when river courses extended onto the shelf. This downcutting would have occurred during glacial periods and the resultant channels are filled by fluvial sediment and are overlain by Holocene sediments deposited when sea-level regained levels near to those of present day (Martin & Flemming, 1988). Such palaeo-rivers would have been attractive resources to our human ancestors on the now submerged continental shelf and just as on land, archaeological sites and material can be expected to be associated with these river valleys. Where fluvial deposits within the palaeochannels have survived subsequent marine transgression these have the potential to preserve palaeoenvironmental information useful in the reconstructing the environment and thus contributing to the study of our early ancestors in South Africa.
Across much of the continental shelf modern seabed sediments, laid down during the Holocene as the sea level rose to the level it is today, are draped over and infill the incised palaeochannels. Although this unconsolidated surface sediment is likely to have some archaeological potential, it is likely to be low.
6.6.3.2 Shipwrecks In 1498 the Portuguese explorer Vasco da Gama finally pioneered the elusive sea route around Africa from Europe to the East. Since then, the southern tip of the African continent has played a vital role in global economic and maritime affairs, and until the opening of the Suez Canal in 1869, represented the most viable route between Europe and the markets of the East (Axelson, 1973; Turner, 1988; Gribble, 2002; Gribble & Sharfman, 2013).
The South African coast is rugged and the long fetch and deep offshore waters mean that the force and size of seas around the South African coast are considerable, a situation exacerbated by prevailing seasonal winds.
The geographical position of the South African coast on the historical route to the East and the physical conditions mariners could expect to encounter in these waters have, in the last five centuries, been responsible for the large number of maritime casualties which today form the bulk of South Africa’s maritime and underwater cultural heritage (Gribble, 2002).
There is shipwreck evidence on the East African coast for the pre-European Indian Ocean trade (e.g., Pollard et al, 2016) and clear archaeological and documentary evidence that this trade network extended at least as far south as Maputo in Mozambique. This suggests that there is the potential for shipwrecks and other sites that relate to pre-European, Indian Ocean maritime exploration, trade and interactions to exist along the South African east coast and offshore waters.
The more than 2,500 historical shipwrecks that make up the bulk of South Africa’s underwater cultural heritage are a thus huge, cosmopolitan, repository of information about mainly global maritime trade during the last five centuries and potentially much further back into the past.
These sites contain a wealth of cultural material associated with that trade and clues to the political, economic, social and cultural changes that accompanied this trade and which contributed to the creation of the modern world.
www.erm.com Project No.: 0482086 Client: ASN and Liquid Telecom Page 131
METISS FINAL EIA REPORT
ENVIRONMENTAL AND SOCIAL BASELINE CONDITIONS
There are at least 170 recorded wrecks in the immediate vicinity of Durban. In addition, the remains of nearly a dozen whalers and other vessels that were scuttled during the 20th century are charted by the SANHO to the east and south-east of Durban (Figure 6-38). These positions for these charted wrecks are relatively accurate, but those available for most of the historical shipwrecks are less so.
Figure 6-38 below illustrates the 20 km Maritime Archaeological Study Area for the Maritime Specialist Study (Appendix F) where the subsea cable will be running (yellow polygon). The green points indicate unnamed SANHO charted wrecks. The green point on the subsea cable route is the SANHO “Position Approximate” of one of the wrecks described in the text above. It must be noted that the number of wrecks shown around Durban is not a true reflection of the total number known.
Sidescan Sonar Data was used to identify any wrecks within the vicinity of the proposed cable prior to installation. The subsea cable route has been designed to avoid any known or identified wrecks.
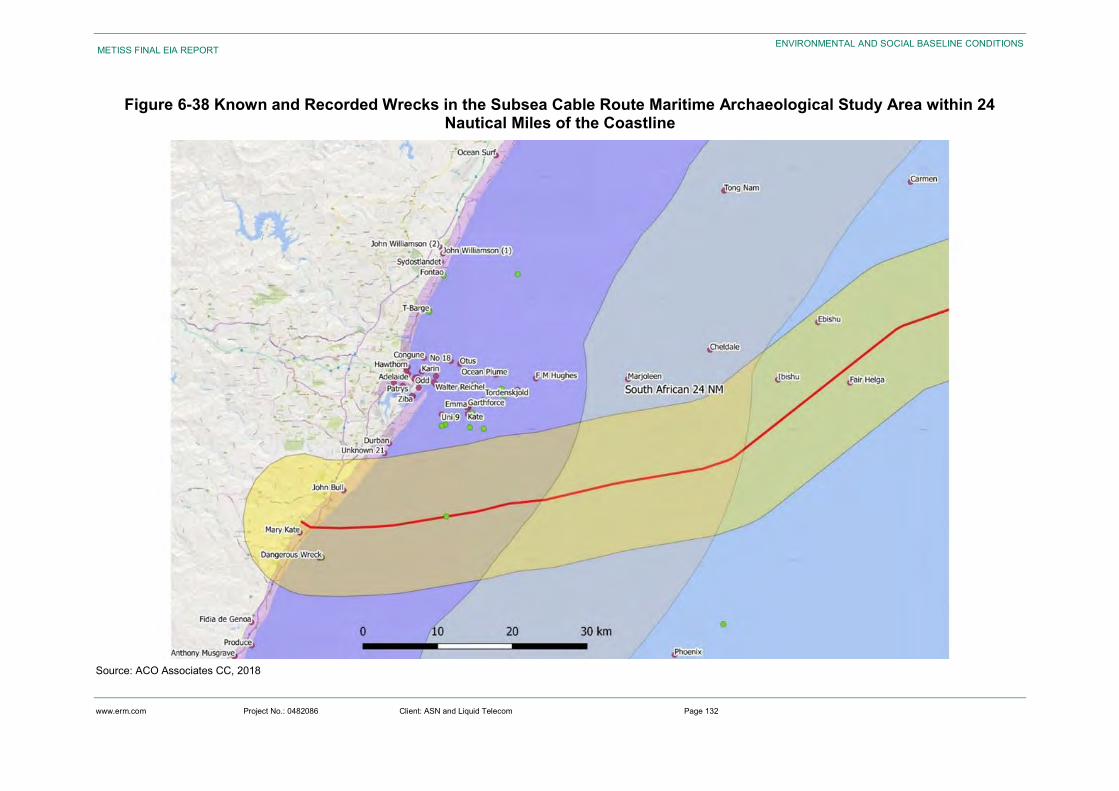
www.erm.com Project No.: 0482086 Client: ASN and Liquid Telecom Page 132
METISS FINAL EIA REPORT
ENVIRONMENTAL AND SOCIAL BASELINE CONDITIONS
Figure 6-38 Known and Recorded Wrecks in the Subsea Cable Route Maritime Archaeological Study Area within 24 Nautical Miles of the Coastline
Source: ACO Associates CC, 2018
www.erm.com Project No.: 0482086 Client: ASN and Liquid Telecom Page 133
METISS FINAL EIA REPORT
ENVIRONMENTAL AND SOCIAL BASELINE CONDITIONS
6.7 Planning Context for the Future Development in the Project Area of Influence
6.7.1 The Spatial Development Framework
The Spatial Development Plan guides the location of future developments in a municipal area in a way that addresses past imbalances. As part of the National Spatial Development Plan, Strategic Integrated Projects are to be implemented across the country which can provide fast track growth, address unemployment and reduce poverty in the process. Some of the eThekwini Municipality delivery plans include:
Developing a prosperous, diverse economy and employment creation;
Creating a platform for growth, empowerment and skills development;
Financially accountable and sustainable municipality.
These delivery plans are specifically related to Strategic Priority Three of the eThekwini municipality SDF (SDF, 2014): A financially sustainable city. Through the proposed Project activities, these plans may be met, as Jobs will be created during the construction phase (short term), with faster connectivity, companies are bound to experience higher productivity and thus generate a better revenue.
6.7.1.1 Planned Development
Terrestrial Development The eThekwini Municipality owns and operates 27 Wastewater Treatment Works (WWTWs) which treat approximately 500 ML (Megalitres) of waste water per day. A decision was made by the Municipality however, that the WWTW’s would be regionalised by decommissioning all the other smaller plants and regionalising the treatment at uMkhomazi, Amanzimtoti, Southern, Central, Northern KwaMashu, Phoenix, Umdloti, Tongaat, Umbilo, Umhlathuzana and Hammersdale (SDF, 2017).
In line with the upgrades associated with regionalising WWTWs, eThekwini Municipality Water and Sanitation (EWS) plans to install an outfall sewer to service township developments around the Amanzimtoti River which will convey the generated waste water to the new Amanzimtoti WWTW. It is expected that this outfall will eliminate the six Waste Water Pump Stations currently present at the Amanzimtoti River area. This means that, the outfall will now drain to the one (new) Waste Water Pump Station, which is to pump the water to the new Amanzimtoti WWTW (SDF, 2017).
Marine Development Indian Ocean Xchange SA (Pty) Ltd (IOX) is currently proposing to build an open access subsea cable system from India to South Africa with branching units in Mauritius and Rodrigues Island. The Project will involve installation and operation of a subsea fibre optic cable system inside South Africa’s Exclusive Economic Zone (EEZ) (approximately 372 km) and territorial waters (approximately 22 km) to a coastal landing site in East London next to the East London Industrial Development Zone. This application has currently lapsed.
Further to this, offshore exploration drilling activities are proposed by Eni South Africa approximately 60 km off the coast of Durban and Richards Bay in South Africa. This application has been submitted to the Petroleum Agency of South Africa (PASA) as the Competent Authority and is currently awaiting the Appeal phase of the EIA process.
www.erm.com Project No.: 0482086 Client: ASN and Liquid Telecom Page 134
METISS FINAL EIA REPORT
ENVIRONMENTAL AND SOCIAL BASELINE CONDITIONS
Petroleum Geo-Services (PGS) has proposed to undertake speculative two-dimensional (2D) and three-dimensional (3D) seismic surveys in a number of licenced petroleum licenced blocks off the South and West Coast of South Africa in 2019. The permit area is approximately 227,584 km2 in extent and is situated between 15 km and 250 km offshore (roughly between Mossel Bay and Port Edward, SLR, 2017).
Sungu Sungu proposes to acquire, undertake a 3D seismic survey in a 2,500 km2 area within the Pletmos Basin to explore for possible oil and gas reserves. The Basin is located off the South Coast of South Africa, roughly between Knysna in the west and Jeffrey’s Bay in the east. The target area is located at least 12 km offshore and reaches up to 60 km out to sea (SRK, 2017).
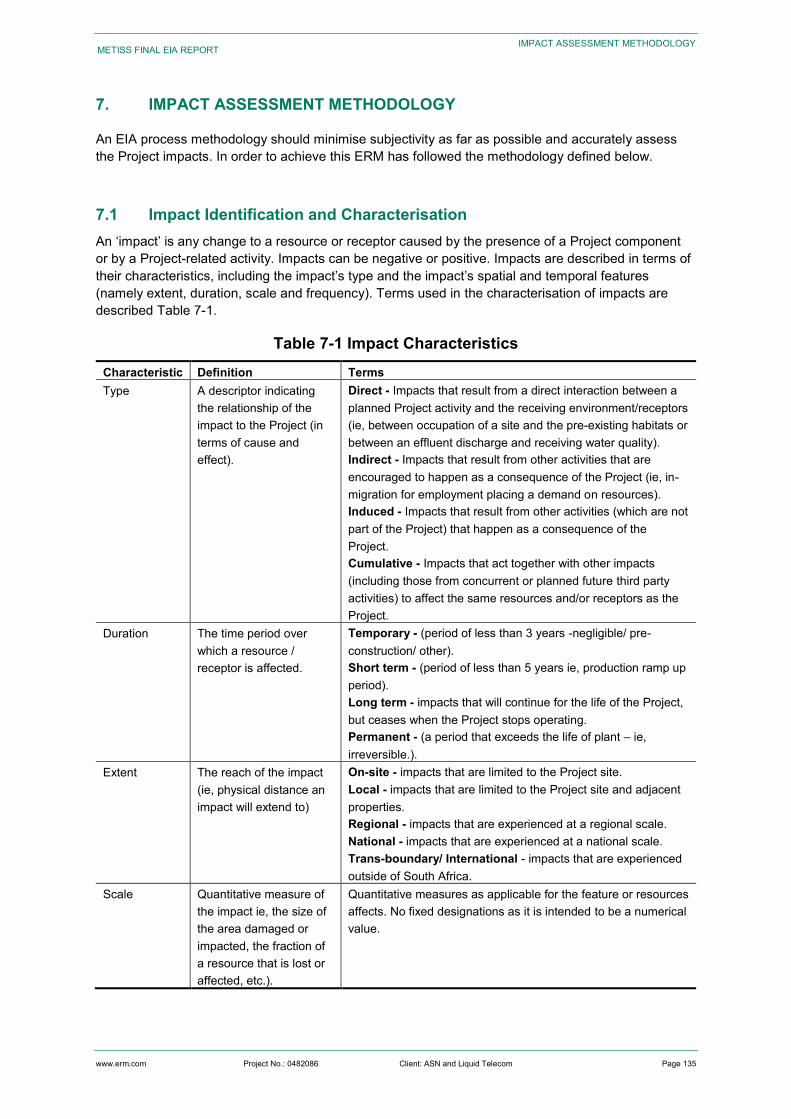
www.erm.com Project No.: 0482086 Client: ASN and Liquid Telecom Page 135
METISS FINAL EIA REPORT
IMPACT ASSESSMENT METHODOLOGY
7. IMPACT ASSESSMENT METHODOLOGY
An EIA process methodology should minimise subjectivity as far as possible and accurately assess the Project impacts. In order to achieve this ERM has followed the methodology defined below.
7.1 Impact Identification and Characterisation An ‘impact’ is any change to a resource or receptor caused by the presence of a Project component or by a Project-related activity. Impacts can be negative or positive. Impacts are described in terms of their characteristics, including the impact’s type and the impact’s spatial and temporal features (namely extent, duration, scale and frequency). Terms used in the characterisation of impacts are described Table 7-1.
Table 7-1 Impact Characteristics Characteristic Definition Terms Type A descriptor indicating
the relationship of the impact to the Project (in terms of cause and effect).
Direct - Impacts that result from a direct interaction between a planned Project activity and the receiving environment/receptors (ie, between occupation of a site and the pre-existing habitats or between an effluent discharge and receiving water quality). Indirect - Impacts that result from other activities that are encouraged to happen as a consequence of the Project (ie, in-migration for employment placing a demand on resources). Induced - Impacts that result from other activities (which are not part of the Project) that happen as a consequence of the Project. Cumulative - Impacts that act together with other impacts (including those from concurrent or planned future third party activities) to affect the same resources and/or receptors as the Project.
Duration The time period over which a resource / receptor is affected.
Temporary - (period of less than 3 years -negligible/ pre-construction/ other). Short term - (period of less than 5 years ie, production ramp up period). Long term - impacts that will continue for the life of the Project, but ceases when the Project stops operating. Permanent - (a period that exceeds the life of plant – ie, irreversible.).
Extent The reach of the impact (ie, physical distance an impact will extend to)
On-site - impacts that are limited to the Project site. Local - impacts that are limited to the Project site and adjacent properties. Regional - impacts that are experienced at a regional scale. National - impacts that are experienced at a national scale. Trans-boundary/ International - impacts that are experienced outside of South Africa.
Scale Quantitative measure of the impact ie, the size of the area damaged or impacted, the fraction of a resource that is lost or affected, etc.).
Quantitative measures as applicable for the feature or resources affects. No fixed designations as it is intended to be a numerical value.
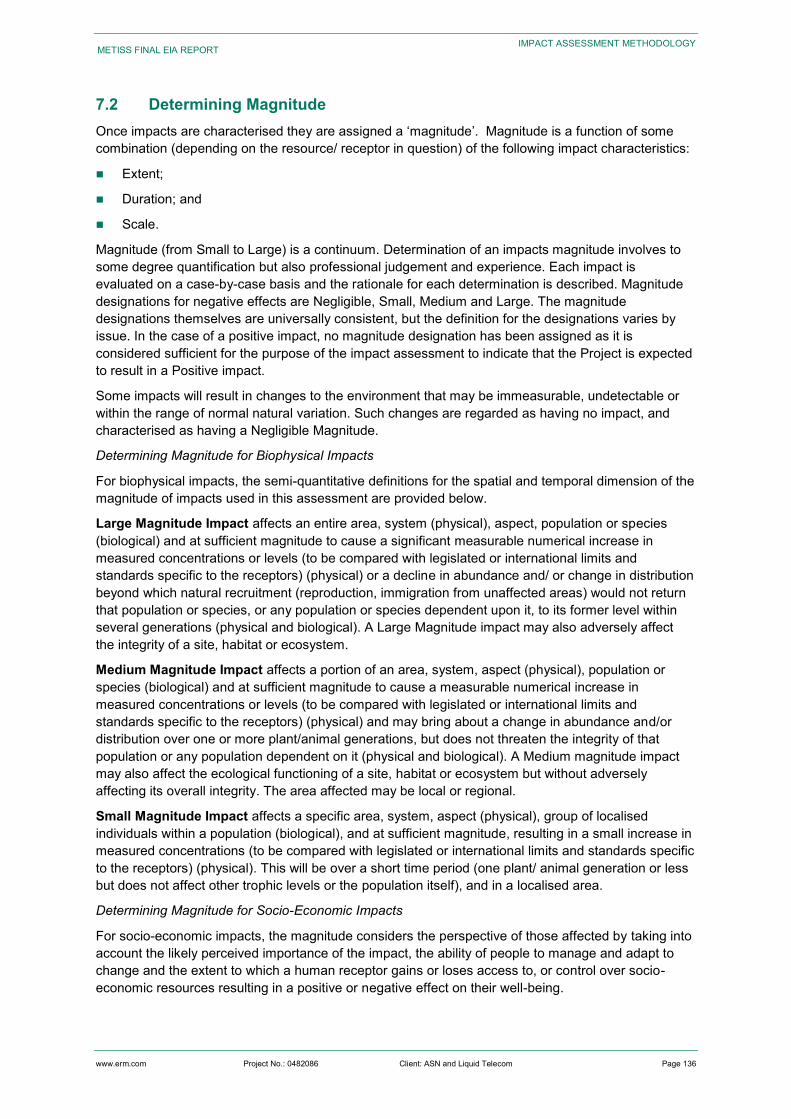
www.erm.com Project No.: 0482086 Client: ASN and Liquid Telecom Page 136
METISS FINAL EIA REPORT
IMPACT ASSESSMENT METHODOLOGY
7.2 Determining Magnitude Once impacts are characterised they are assigned a ‘magnitude’. Magnitude is a function of some combination (depending on the resource/ receptor in question) of the following impact characteristics:
Extent;
Duration; and
Scale.
Magnitude (from Small to Large) is a continuum. Determination of an impacts magnitude involves to some degree quantification but also professional judgement and experience. Each impact is evaluated on a case-by-case basis and the rationale for each determination is described. Magnitude designations for negative effects are Negligible, Small, Medium and Large. The magnitude designations themselves are universally consistent, but the definition for the designations varies by issue. In the case of a positive impact, no magnitude designation has been assigned as it is considered sufficient for the purpose of the impact assessment to indicate that the Project is expected to result in a Positive impact.
Some impacts will result in changes to the environment that may be immeasurable, undetectable or within the range of normal natural variation. Such changes are regarded as having no impact, and characterised as having a Negligible Magnitude.
Determining Magnitude for Biophysical Impacts
For biophysical impacts, the semi-quantitative definitions for the spatial and temporal dimension of the magnitude of impacts used in this assessment are provided below.
Large Magnitude Impact affects an entire area, system (physical), aspect, population or species (biological) and at sufficient magnitude to cause a significant measurable numerical increase in measured concentrations or levels (to be compared with legislated or international limits and standards specific to the receptors) (physical) or a decline in abundance and/ or change in distribution beyond which natural recruitment (reproduction, immigration from unaffected areas) would not return that population or species, or any population or species dependent upon it, to its former level within several generations (physical and biological). A Large Magnitude impact may also adversely affect the integrity of a site, habitat or ecosystem.
Medium Magnitude Impact affects a portion of an area, system, aspect (physical), population or species (biological) and at sufficient magnitude to cause a measurable numerical increase in measured concentrations or levels (to be compared with legislated or international limits and standards specific to the receptors) (physical) and may bring about a change in abundance and/or distribution over one or more plant/animal generations, but does not threaten the integrity of that population or any population dependent on it (physical and biological). A Medium magnitude impact may also affect the ecological functioning of a site, habitat or ecosystem but without adversely affecting its overall integrity. The area affected may be local or regional.
Small Magnitude Impact affects a specific area, system, aspect (physical), group of localised individuals within a population (biological), and at sufficient magnitude, resulting in a small increase in measured concentrations (to be compared with legislated or international limits and standards specific to the receptors) (physical). This will be over a short time period (one plant/ animal generation or less but does not affect other trophic levels or the population itself), and in a localised area.
Determining Magnitude for Socio-Economic Impacts
For socio-economic impacts, the magnitude considers the perspective of those affected by taking into account the likely perceived importance of the impact, the ability of people to manage and adapt to change and the extent to which a human receptor gains or loses access to, or control over socio-economic resources resulting in a positive or negative effect on their well-being.
www.erm.com Project No.: 0482086 Client: ASN and Liquid Telecom Page 137
METISS FINAL EIA REPORT
IMPACT ASSESSMENT METHODOLOGY
The quantitative elements are included into the assessment through the designation and consideration of scale and extent of the impact.
7.2.1 Determining Receptor Sensitivity
In addition to characterising the magnitude of impact, the other principal step necessary to assign significance for a given impact is to define the sensitivity of the receptor. There are a range of factors to be taken into account when defining the sensitivity of the receptor, which may be physical, biological, cultural or human. Where the receptor is physical (for example, a water body) its current quality, sensitivity to change, and importance (on a local, national and international scale) are considered.
Where the receptor is biological or cultural (ie, the marine environment or a coral reef), its importance (local, regional, national or international) and sensitivity to the specific type of impact are considered. Where the receptor is human, the vulnerability of the individual, community or wider societal group is considered. As in the case of magnitude, the sensitivity designations themselves are universally consistent, but the definitions for these designations will vary on a resource/receptor basis. The universal sensitivity of receptor is Low, Medium and High.
For ecological impacts, sensitivity is assigned as Low, Medium or High based on the conservation importance of habitats and species. For the sensitivity of individual species, Table 7-2 presents the criteria for deciding on the value or sensitivity of individual species.
For socio-economic impacts, the degree of sensitivity of a receptor is defined as the level of resilience (or capacity to cope) with sudden social and economic changes. Table 7-2 and Table 7-3 present the criteria for deciding on the value or sensitivity of biological and socioeconomic receptors.
Table 7-2 Biological and Species Value / Sensitivity Criteria
Note: The criteria are applied with a degree of caution. Seasonal variations and species lifecycle stage will be taken into account when considering species sensitivity. For example, a population might be deemed as more sensitive during the breeding/spawning and nursery periods. This table uses listing of species ie, IUCN) or protection as an indication of the level of threat that this species experiences within the broader ecosystem (global, regional, local). This is used to provide a judgement of the importance of affecting this species in the context of Project-level changes.
Table 7-3 Socio-Economic Sensitivity Criteria Sensitivity Low Medium High
Criteria Those affected are able to adapt with relative ease and maintain pre-impact status.
Able to adapt with some difficulty and maintain pre-impact status but only with a degree of support.
Those affected will not be able to adapt to changes and continue to maintain-pre impact status.
Sensitivity Low Medium High
Criteria Not protected or listed as common/ abundant; or not critical to other ecosystem functions ie, key prey species to other species).
Not protected or listed but may be a species common globally but rare in South Africa with little resilience to ecosystem changes, important to ecosystem functions, or one under threat or population decline.
Specifically protected under South African legislation and/or international conventions e.g. CITIES Listed as rare, threatened or endangered e.g. IUCN
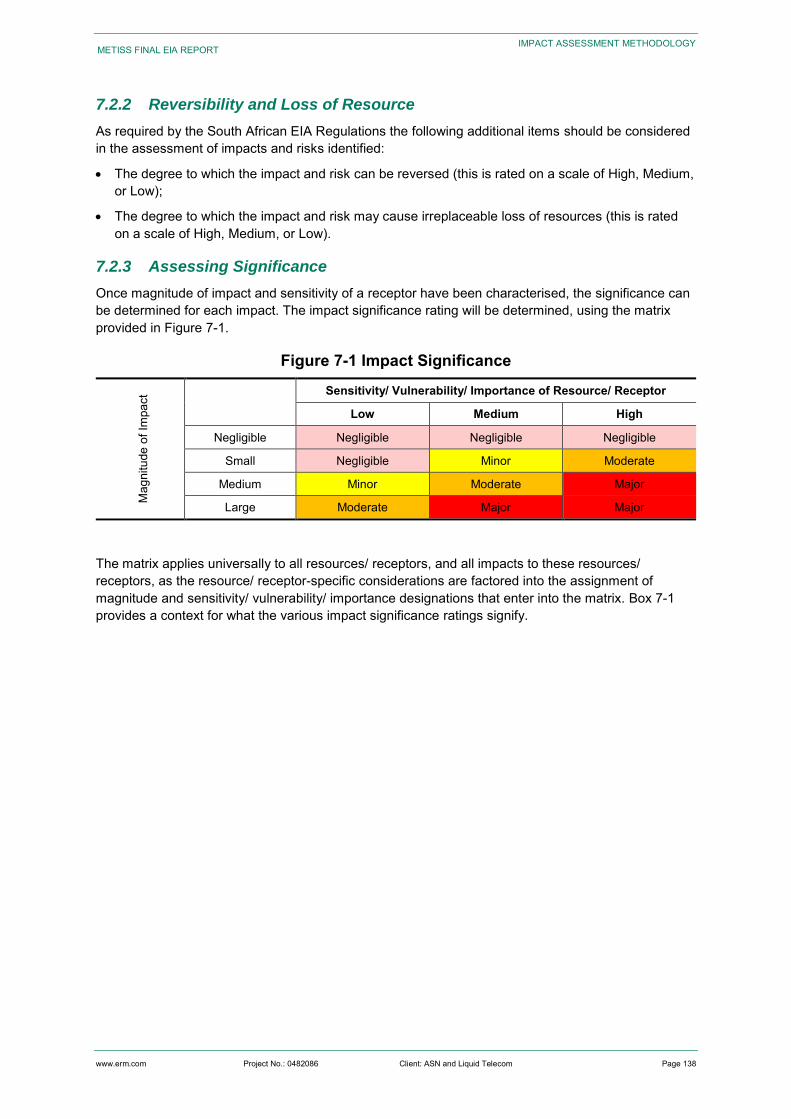
www.erm.com Project No.: 0482086 Client: ASN and Liquid Telecom Page 138
METISS FINAL EIA REPORT
IMPACT ASSESSMENT METHODOLOGY
7.2.2 Reversibility and Loss of Resource
As required by the South African EIA Regulations the following additional items should be considered in the assessment of impacts and risks identified:
The degree to which the impact and risk can be reversed (this is rated on a scale of High, Medium, or Low);
The degree to which the impact and risk may cause irreplaceable loss of resources (this is rated on a scale of High, Medium, or Low).
7.2.3 Assessing Significance
Once magnitude of impact and sensitivity of a receptor have been characterised, the significance can be determined for each impact. The impact significance rating will be determined, using the matrix provided in Figure 7-1.
Figure 7-1 Impact Significance
Mag
nitu
de o
f Im
pact
Sensitivity/ Vulnerability/ Importance of Resource/ Receptor
Low Medium High
Negligible Negligible Negligible Negligible
Small Negligible Minor Moderate
Medium Minor Moderate Major
Large Moderate Major Major
The matrix applies universally to all resources/ receptors, and all impacts to these resources/ receptors, as the resource/ receptor-specific considerations are factored into the assignment of magnitude and sensitivity/ vulnerability/ importance designations that enter into the matrix. Box 7-1 provides a context for what the various impact significance ratings signify.
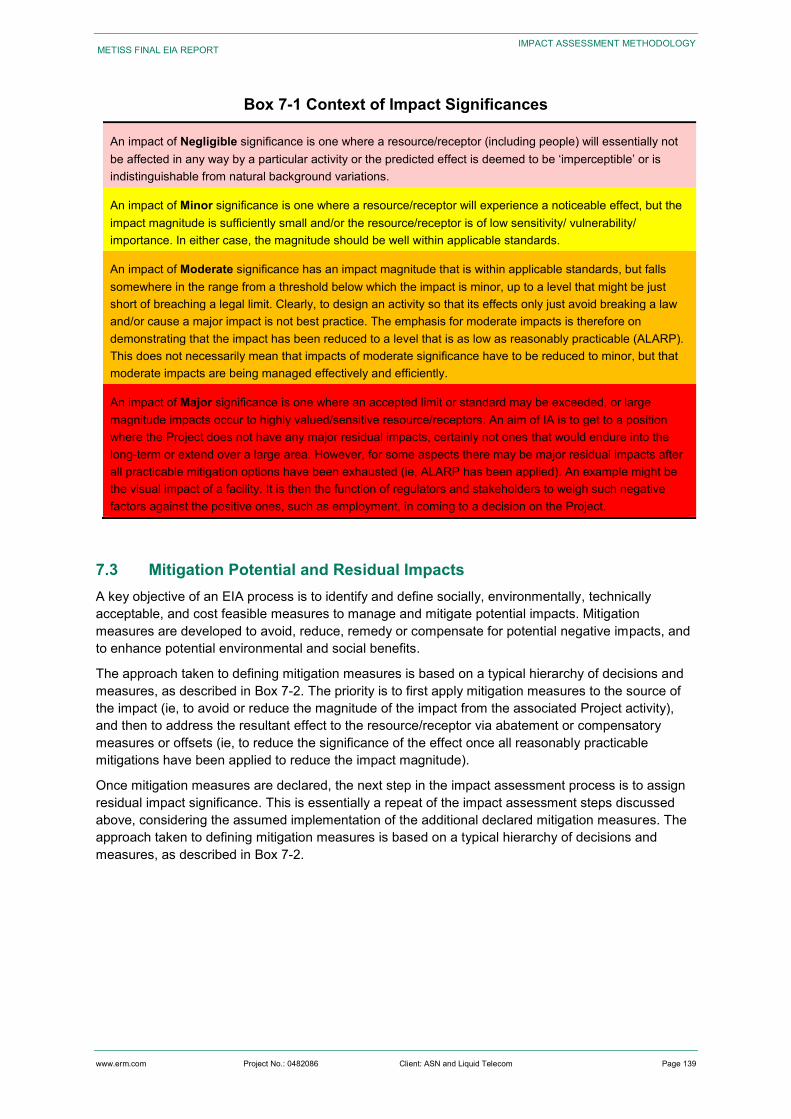
www.erm.com Project No.: 0482086 Client: ASN and Liquid Telecom Page 139
METISS FINAL EIA REPORT
IMPACT ASSESSMENT METHODOLOGY
Box 7-1 Context of Impact Significances
An impact of Negligible significance is one where a resource/receptor (including people) will essentially not be affected in any way by a particular activity or the predicted effect is deemed to be ‘imperceptible’ or is indistinguishable from natural background variations.
An impact of Minor significance is one where a resource/receptor will experience a noticeable effect, but the impact magnitude is sufficiently small and/or the resource/receptor is of low sensitivity/ vulnerability/ importance. In either case, the magnitude should be well within applicable standards.
An impact of Moderate significance has an impact magnitude that is within applicable standards, but falls somewhere in the range from a threshold below which the impact is minor, up to a level that might be just short of breaching a legal limit. Clearly, to design an activity so that its effects only just avoid breaking a law and/or cause a major impact is not best practice. The emphasis for moderate impacts is therefore on demonstrating that the impact has been reduced to a level that is as low as reasonably practicable (ALARP). This does not necessarily mean that impacts of moderate significance have to be reduced to minor, but that moderate impacts are being managed effectively and efficiently.
An impact of Major significance is one where an accepted limit or standard may be exceeded, or large magnitude impacts occur to highly valued/sensitive resource/receptors. An aim of IA is to get to a position where the Project does not have any major residual impacts, certainly not ones that would endure into the long-term or extend over a large area. However, for some aspects there may be major residual impacts after all practicable mitigation options have been exhausted (ie, ALARP has been applied). An example might be the visual impact of a facility. It is then the function of regulators and stakeholders to weigh such negative factors against the positive ones, such as employment, in coming to a decision on the Project.
7.3 Mitigation Potential and Residual Impacts A key objective of an EIA process is to identify and define socially, environmentally, technically acceptable, and cost feasible measures to manage and mitigate potential impacts. Mitigation measures are developed to avoid, reduce, remedy or compensate for potential negative impacts, and to enhance potential environmental and social benefits.
The approach taken to defining mitigation measures is based on a typical hierarchy of decisions and measures, as described in Box 7-2. The priority is to first apply mitigation measures to the source of the impact (ie, to avoid or reduce the magnitude of the impact from the associated Project activity), and then to address the resultant effect to the resource/receptor via abatement or compensatory measures or offsets (ie, to reduce the significance of the effect once all reasonably practicable mitigations have been applied to reduce the impact magnitude).
Once mitigation measures are declared, the next step in the impact assessment process is to assign residual impact significance. This is essentially a repeat of the impact assessment steps discussed above, considering the assumed implementation of the additional declared mitigation measures. The approach taken to defining mitigation measures is based on a typical hierarchy of decisions and measures, as described in Box 7-2.
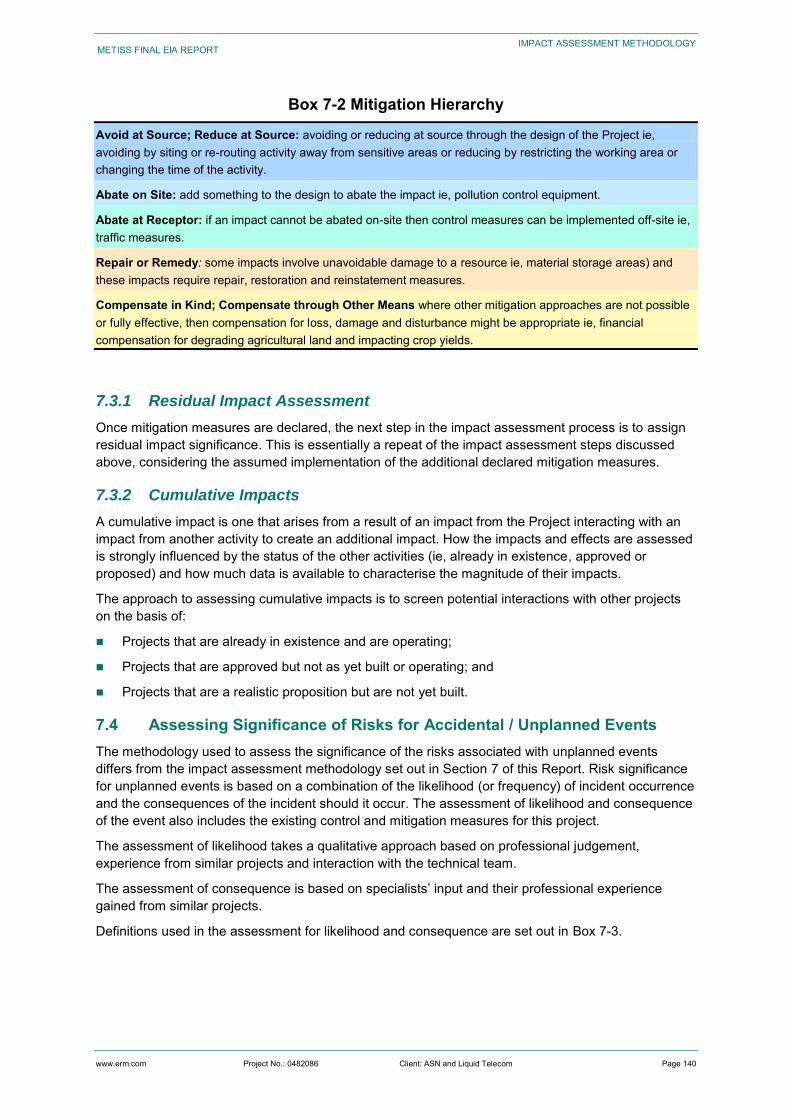
www.erm.com Project No.: 0482086 Client: ASN and Liquid Telecom Page 140
METISS FINAL EIA REPORT
IMPACT ASSESSMENT METHODOLOGY
Box 7-2 Mitigation Hierarchy
Avoid at Source; Reduce at Source: avoiding or reducing at source through the design of the Project ie, avoiding by siting or re-routing activity away from sensitive areas or reducing by restricting the working area or changing the time of the activity.
Abate on Site: add something to the design to abate the impact ie, pollution control equipment.
Abate at Receptor: if an impact cannot be abated on-site then control measures can be implemented off-site ie, traffic measures.
Repair or Remedy: some impacts involve unavoidable damage to a resource ie, material storage areas) and these impacts require repair, restoration and reinstatement measures.
Compensate in Kind; Compensate through Other Means where other mitigation approaches are not possible or fully effective, then compensation for loss, damage and disturbance might be appropriate ie, financial compensation for degrading agricultural land and impacting crop yields.
7.3.1 Residual Impact Assessment
Once mitigation measures are declared, the next step in the impact assessment process is to assign residual impact significance. This is essentially a repeat of the impact assessment steps discussed above, considering the assumed implementation of the additional declared mitigation measures.
7.3.2 Cumulative Impacts
A cumulative impact is one that arises from a result of an impact from the Project interacting with an impact from another activity to create an additional impact. How the impacts and effects are assessed is strongly influenced by the status of the other activities (ie, already in existence, approved or proposed) and how much data is available to characterise the magnitude of their impacts.
The approach to assessing cumulative impacts is to screen potential interactions with other projects on the basis of:
Projects that are already in existence and are operating;
Projects that are approved but not as yet built or operating; and
Projects that are a realistic proposition but are not yet built.
7.4 Assessing Significance of Risks for Accidental / Unplanned Events The methodology used to assess the significance of the risks associated with unplanned events differs from the impact assessment methodology set out in Section 7 of this Report. Risk significance for unplanned events is based on a combination of the likelihood (or frequency) of incident occurrence and the consequences of the incident should it occur. The assessment of likelihood and consequence of the event also includes the existing control and mitigation measures for this project.
The assessment of likelihood takes a qualitative approach based on professional judgement, experience from similar projects and interaction with the technical team.
The assessment of consequence is based on specialists’ input and their professional experience gained from similar projects.
Definitions used in the assessment for likelihood and consequence are set out in Box 7-3.
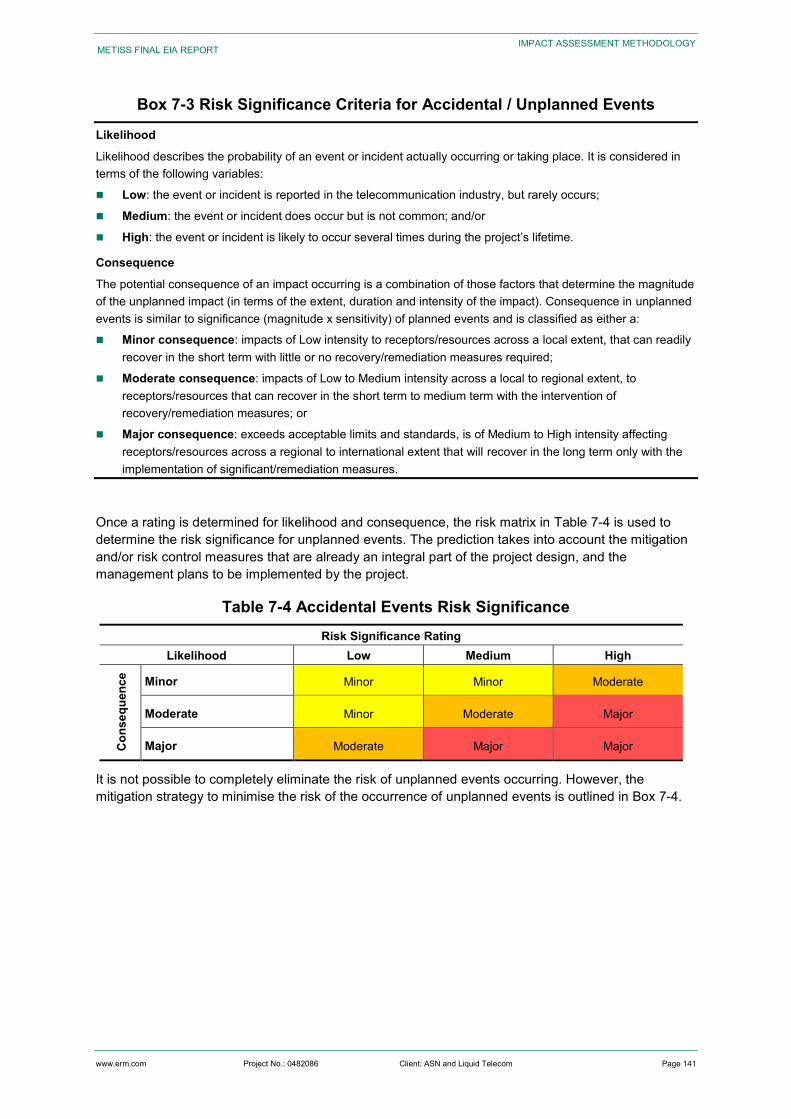
www.erm.com Project No.: 0482086 Client: ASN and Liquid Telecom Page 141
METISS FINAL EIA REPORT
IMPACT ASSESSMENT METHODOLOGY
Box 7-3 Risk Significance Criteria for Accidental / Unplanned Events
Likelihood
Likelihood describes the probability of an event or incident actually occurring or taking place. It is considered in terms of the following variables:
Low: the event or incident is reported in the telecommunication industry, but rarely occurs;
Medium: the event or incident does occur but is not common; and/or
High: the event or incident is likely to occur several times during the project’s lifetime.
Consequence
The potential consequence of an impact occurring is a combination of those factors that determine the magnitude of the unplanned impact (in terms of the extent, duration and intensity of the impact). Consequence in unplanned events is similar to significance (magnitude x sensitivity) of planned events and is classified as either a:
Minor consequence: impacts of Low intensity to receptors/resources across a local extent, that can readily recover in the short term with little or no recovery/remediation measures required;
Moderate consequence: impacts of Low to Medium intensity across a local to regional extent, to receptors/resources that can recover in the short term to medium term with the intervention of recovery/remediation measures; or
Major consequence: exceeds acceptable limits and standards, is of Medium to High intensity affecting receptors/resources across a regional to international extent that will recover in the long term only with the implementation of significant/remediation measures.
Once a rating is determined for likelihood and consequence, the risk matrix in Table 7-4 is used to determine the risk significance for unplanned events. The prediction takes into account the mitigation and/or risk control measures that are already an integral part of the project design, and the management plans to be implemented by the project.
Table 7-4 Accidental Events Risk Significance Risk Significance Rating
Likelihood Low Medium High
Con
sequ
ence
Minor Minor Minor Moderate
Moderate Minor Moderate Major
Major Moderate Major Major
It is not possible to completely eliminate the risk of unplanned events occurring. However, the mitigation strategy to minimise the risk of the occurrence of unplanned events is outlined in Box 7-4.
www.erm.com Project No.: 0482086 Client: ASN and Liquid Telecom Page 142
METISS FINAL EIA REPORT
IMPACT ASSESSMENT METHODOLOGY
Box 7-4 Mitigation Strategy for Accidental Events
Control: aims to prevent or reduce the risk of an incident happening or reduce the magnitude of the potential consequence to As Low as Reasonably Possible (ALARP) through:
Reducing the likelihood of the event ie, preventative maintenance measures, emergency response procedures and training);
Reducing the consequence ; and
A combination of both of these.
Recovery/ remediation: includes contingency plans and response
Emergency Response Plans and
Tactical Response Plans
7.5 Assumptions and Limitations Impact Assessment is a process that aims to identify and anticipate possible impacts based on past and present baseline information. As the EIA deals with the future there is, inevitably, some uncertainty about what will actually happen in reality. Impact predictions have been made based on field surveys and with the best data, methods and scientific knowledge available at this time. However, some uncertainties could not be entirely resolved. Where significant uncertainty remains in the impact assessment, this is acknowledged and the level of uncertainty is provided.
In line with best practice, this EIA process has adopted a precautionary approach to the identification and assessment of impacts. Where it has not been possible to make direct predictions of the likely level of impact, limits on the maximum likely impact have been reported and the design and implementation of the Project (including the use of appropriate mitigation measures) will ensure that these are not exceeded. Where the magnitude of impacts cannot be predicted with certainty, the team of specialists has used professional experience to judge whether a significant impact is likely to occur or not. Throughout the assessment, this conservative approach has been adopted to the allocation of significance.
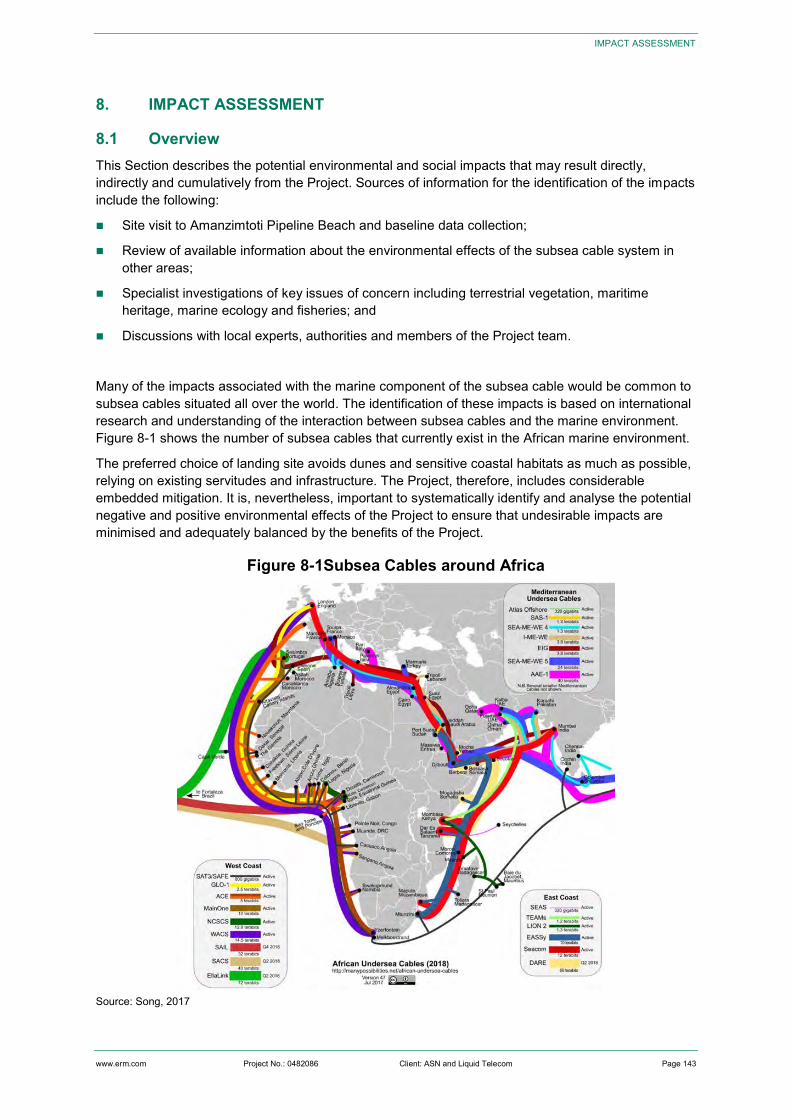
www.erm.com Project No.: 0482086 Client: ASN and Liquid Telecom Page 143
IMPACT ASSESSMENT
8. IMPACT ASSESSMENT
8.1 Overview This Section describes the potential environmental and social impacts that may result directly, indirectly and cumulatively from the Project. Sources of information for the identification of the impacts include the following:
Site visit to Amanzimtoti Pipeline Beach and baseline data collection;
Review of available information about the environmental effects of the subsea cable system in other areas;
Specialist investigations of key issues of concern including terrestrial vegetation, maritime heritage, marine ecology and fisheries; and
Discussions with local experts, authorities and members of the Project team.
Many of the impacts associated with the marine component of the subsea cable would be common to subsea cables situated all over the world. The identification of these impacts is based on international research and understanding of the interaction between subsea cables and the marine environment. Figure 8-1 shows the number of subsea cables that currently exist in the African marine environment.
The preferred choice of landing site avoids dunes and sensitive coastal habitats as much as possible, relying on existing servitudes and infrastructure. The Project, therefore, includes considerable embedded mitigation. It is, nevertheless, important to systematically identify and analyse the potential negative and positive environmental effects of the Project to ensure that undesirable impacts are minimised and adequately balanced by the benefits of the Project.
Figure 8-1Subsea Cables around Africa
Source: Song, 2017
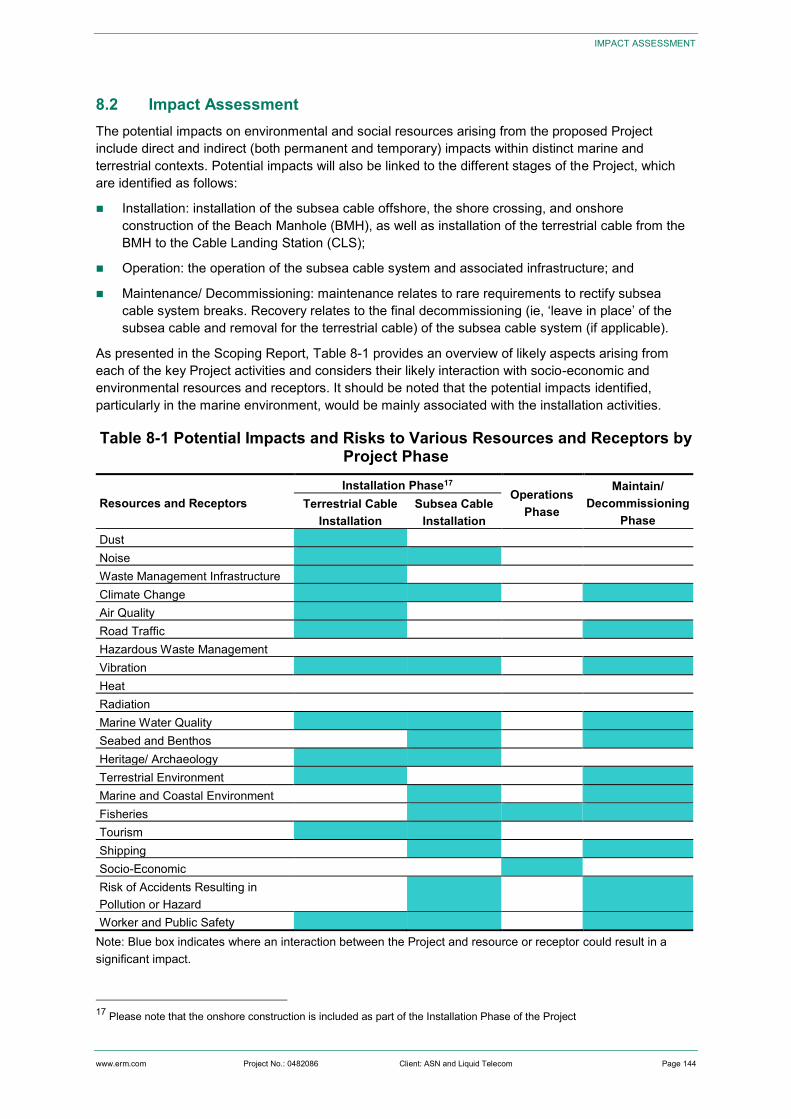
www.erm.com Project No.: 0482086 Client: ASN and Liquid Telecom Page 144
IMPACT ASSESSMENT
8.2 Impact Assessment The potential impacts on environmental and social resources arising from the proposed Project include direct and indirect (both permanent and temporary) impacts within distinct marine and terrestrial contexts. Potential impacts will also be linked to the different stages of the Project, which are identified as follows:
Installation: installation of the subsea cable offshore, the shore crossing, and onshore construction of the Beach Manhole (BMH), as well as installation of the terrestrial cable from the BMH to the Cable Landing Station (CLS);
Operation: the operation of the subsea cable system and associated infrastructure; and
Maintenance/ Decommissioning: maintenance relates to rare requirements to rectify subsea cable system breaks. Recovery relates to the final decommissioning (ie, ‘leave in place’ of the subsea cable and removal for the terrestrial cable) of the subsea cable system (if applicable).
As presented in the Scoping Report, Table 8-1 provides an overview of likely aspects arising from each of the key Project activities and considers their likely interaction with socio-economic and environmental resources and receptors. It should be noted that the potential impacts identified, particularly in the marine environment, would be mainly associated with the installation activities.
Table 8-1 Potential Impacts and Risks to Various Resources and Receptors by Project Phase
Resources and Receptors Installation Phase17
Operations Phase
Maintain/ Decommissioning
Phase Terrestrial Cable
Installation Subsea Cable
Installation Dust Noise Waste Management Infrastructure Climate Change Air Quality Road Traffic Hazardous Waste Management Vibration Heat Radiation Marine Water Quality Seabed and Benthos Heritage/ Archaeology Terrestrial Environment Marine and Coastal Environment Fisheries Tourism Shipping Socio-Economic Risk of Accidents Resulting in Pollution or Hazard
Worker and Public Safety Note: Blue box indicates where an interaction between the Project and resource or receptor could result in a significant impact.
17 Please note that the onshore construction is included as part of the Installation Phase of the Project
www.erm.com Project No.: 0482086 Client: ASN and Liquid Telecom Page 145
IMPACT ASSESSMENT
The following potentially significant impacts on environmental and social resources and receptors were identified through the scoping process:
Increased dust generation onshore;
Increased greenhouse gas emissions both onshore and offshore;
Change in noise levels both onshore and offshore;
Contamination of soil and water onshore from waste generated;
Creation of employment and procurement of goods and services;
Change to the seabed characteristics;
Reduction of seawater quality;
Disturbance of the coastal zone;
Disturbance to fishing and fisheries;
Reduced terrestrial flora and fauna; and
Disturbance to heritage/ archaeology.
Potential interactions between the Project and environmental and social receptors identified during the scoping process were categorised into significant and non-significant interactions. Only the impacts considered potentially significant are evaluated further in the assessment.
The impacts considered non-significant are discussed briefly and have been scoped out of the detailed assessment. Non-significant issues are presented in Table 8-2.
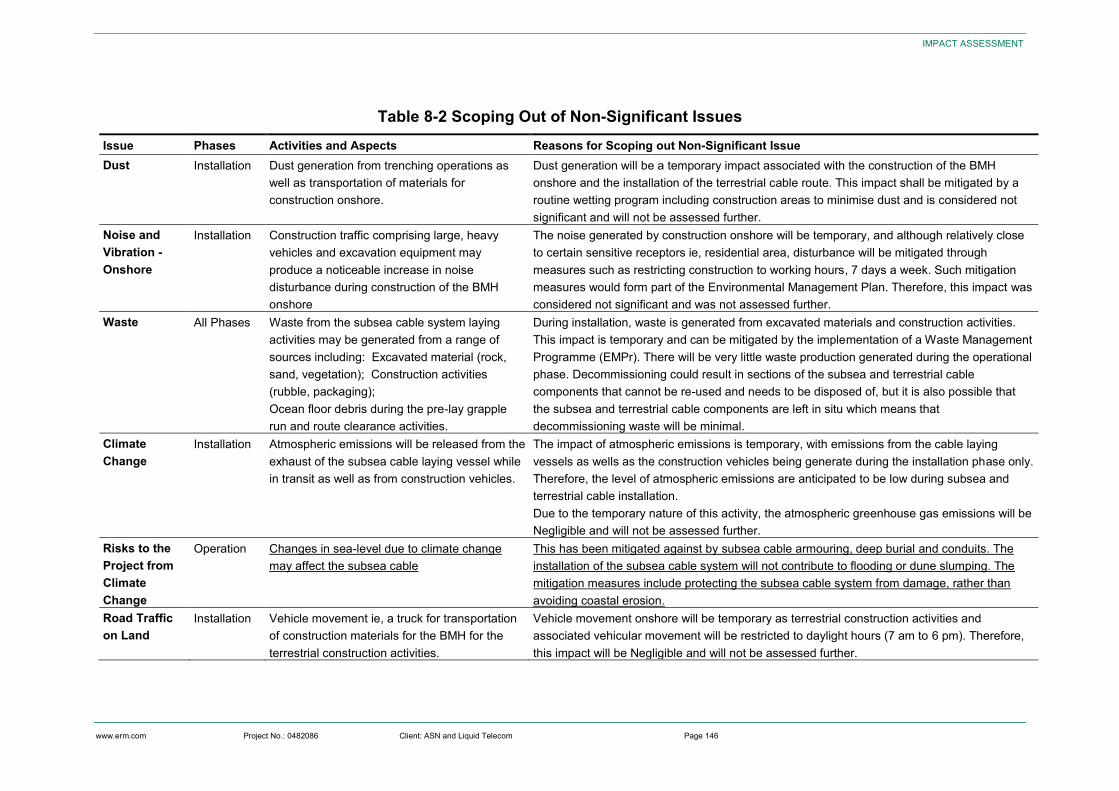
www.erm.com Project No.: 0482086 Client: ASN and Liquid Telecom Page 146
IMPACT ASSESSMENT
Table 8-2 Scoping Out of Non-Significant Issues Issue Phases Activities and Aspects Reasons for Scoping out Non-Significant Issue Dust Installation Dust generation from trenching operations as
well as transportation of materials for construction onshore.
Dust generation will be a temporary impact associated with the construction of the BMH onshore and the installation of the terrestrial cable route. This impact shall be mitigated by a routine wetting program including construction areas to minimise dust and is considered not significant and will not be assessed further.
Noise and Vibration -Onshore
Installation Construction traffic comprising large, heavy vehicles and excavation equipment may produce a noticeable increase in noise disturbance during construction of the BMH onshore
The noise generated by construction onshore will be temporary, and although relatively close to certain sensitive receptors ie, residential area, disturbance will be mitigated through measures such as restricting construction to working hours, 7 days a week. Such mitigation measures would form part of the Environmental Management Plan. Therefore, this impact was considered not significant and was not assessed further.
Waste All Phases Waste from the subsea cable system laying activities may be generated from a range of sources including: Excavated material (rock, sand, vegetation); Construction activities (rubble, packaging); Ocean floor debris during the pre-lay grapple run and route clearance activities.
During installation, waste is generated from excavated materials and construction activities. This impact is temporary and can be mitigated by the implementation of a Waste Management Programme (EMPr). There will be very little waste production generated during the operational phase. Decommissioning could result in sections of the subsea and terrestrial cable components that cannot be re-used and needs to be disposed of, but it is also possible that the subsea and terrestrial cable components are left in situ which means that decommissioning waste will be minimal.
Climate Change
Installation Atmospheric emissions will be released from the exhaust of the subsea cable laying vessel while in transit as well as from construction vehicles.
The impact of atmospheric emissions is temporary, with emissions from the cable laying vessels as wells as the construction vehicles being generate during the installation phase only. Therefore, the level of atmospheric emissions are anticipated to be low during subsea and terrestrial cable installation. Due to the temporary nature of this activity, the atmospheric greenhouse gas emissions will be Negligible and will not be assessed further.
Risks to the Project from Climate Change
Operation Changes in sea-level due to climate change may affect the subsea cable
This has been mitigated against by subsea cable armouring, deep burial and conduits. The installation of the subsea cable system will not contribute to flooding or dune slumping. The mitigation measures include protecting the subsea cable system from damage, rather than avoiding coastal erosion.
Road Traffic on Land
Installation Vehicle movement ie, a truck for transportation of construction materials for the BMH for the terrestrial construction activities.
Vehicle movement onshore will be temporary as terrestrial construction activities and associated vehicular movement will be restricted to daylight hours (7 am to 6 pm). Therefore, this impact will be Negligible and will not be assessed further.
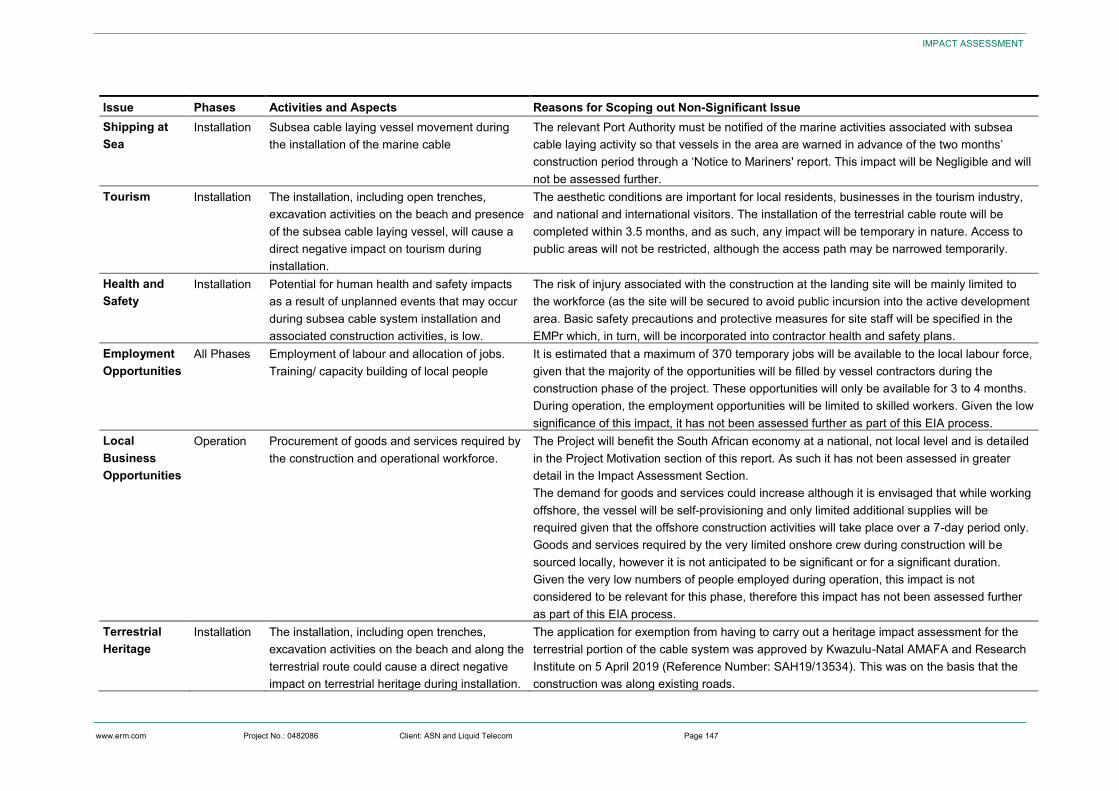
www.erm.com Project No.: 0482086 Client: ASN and Liquid Telecom Page 147
IMPACT ASSESSMENT
Issue Phases Activities and Aspects Reasons for Scoping out Non-Significant Issue Shipping at Sea
Installation Subsea cable laying vessel movement during the installation of the marine cable
The relevant Port Authority must be notified of the marine activities associated with subsea cable laying activity so that vessels in the area are warned in advance of the two months’ construction period through a ‘Notice to Mariners' report. This impact will be Negligible and will not be assessed further.
Tourism Installation The installation, including open trenches, excavation activities on the beach and presence of the subsea cable laying vessel, will cause a direct negative impact on tourism during installation.
The aesthetic conditions are important for local residents, businesses in the tourism industry, and national and international visitors. The installation of the terrestrial cable route will be completed within 3.5 months, and as such, any impact will be temporary in nature. Access to public areas will not be restricted, although the access path may be narrowed temporarily.
Health and Safety
Installation Potential for human health and safety impacts as a result of unplanned events that may occur during subsea cable system installation and associated construction activities, is low.
The risk of injury associated with the construction at the landing site will be mainly limited to the workforce (as the site will be secured to avoid public incursion into the active development area. Basic safety precautions and protective measures for site staff will be specified in the EMPr which, in turn, will be incorporated into contractor health and safety plans.
Employment Opportunities
All Phases Employment of labour and allocation of jobs. Training/ capacity building of local people
It is estimated that a maximum of 370 temporary jobs will be available to the local labour force, given that the majority of the opportunities will be filled by vessel contractors during the construction phase of the project. These opportunities will only be available for 3 to 4 months. During operation, the employment opportunities will be limited to skilled workers. Given the low significance of this impact, it has not been assessed further as part of this EIA process.
Local Business Opportunities
Operation Procurement of goods and services required by the construction and operational workforce.
The Project will benefit the South African economy at a national, not local level and is detailed in the Project Motivation section of this report. As such it has not been assessed in greater detail in the Impact Assessment Section. The demand for goods and services could increase although it is envisaged that while working offshore, the vessel will be self-provisioning and only limited additional supplies will be required given that the offshore construction activities will take place over a 7-day period only. Goods and services required by the very limited onshore crew during construction will be sourced locally, however it is not anticipated to be significant or for a significant duration. Given the very low numbers of people employed during operation, this impact is not considered to be relevant for this phase, therefore this impact has not been assessed further as part of this EIA process.
Terrestrial Heritage
Installation The installation, including open trenches, excavation activities on the beach and along the terrestrial route could cause a direct negative impact on terrestrial heritage during installation.
The application for exemption from having to carry out a heritage impact assessment for the terrestrial portion of the cable system was approved by Kwazulu-Natal AMAFA and Research Institute on 5 April 2019 (Reference Number: SAH19/13534). This was on the basis that the construction was along existing roads.
www.erm.com Project No.: 0482086 Client: ASN and Liquid Telecom Page 148
METISS DRAFT EIA REPORT
IMPACT ASSESSMENT
The following potential impacts from planned activities and unplanned events have been further assessed based on the specialist input, as well as additional desktop research:
8.2.1 Areas of Potential Impacts from Planned Activities:
Disturbance to the coastal zone;
Disturbance to the seabed;
Changes to seawater quality;
Disturbance to marine and coastal fauna;
Disturbance to fishing and fisheries;
Disturbance to terrestrial ecology; and
Disturbance to cultural resources.
8.2.2 Areas of Potential Impacts from Unplanned Events:
Potential contamination of marine waters and sediments from inappropriate disposal of spoil from trenching;
Reduction of seawater quality from an accidental spill of hydrocarbons from the project vessels; and
Accidental collisions with vessel and entanglement with equipment by marine fauna.
8.3 Planned Activities: Key Environmental and Social Impacts
8.3.1 Disturbance of the Coastal Zone
8.3.1.1 Disturbance to Biota in Nearshore Sandy Beach
Impact Description Installation of the subsea cable through the surf-zone and across the beach would require the subsea cable to be buried at sufficient depth to ensure it is not exposed during seasonal variation of the beach levels. Excavated material would be disposed of onto the beach and into the surf-zone down current of the construction site. Subtidal trenching would result in the mobilisation and redistribution of sediments in tidal currents and the littoral drift. This would result in localised increased suspended sediment concentrations in the water column. Where burial cannot be achieved and additional subsea cable protection is required, an articulated split-pipe may be used to maximise cable security. The trenching and subsea cable burial process would result in disturbance of high shore, intertidal and shallow subtidal sandy beach habitats and their associated macrobenthic communities through displacement, injury or crushing.
Excavation of the beach manhole would similarly result in the deposition of excavated material onto the beach. Construction activities would require a sufficiently large and relatively flat onshore area for the stockpiling of equipment and machinery. Potential impacts associated with this construction area will not be further assessed here, as it will be located well above the high water mark. Mobile organisms such as fish and marine mammals, would be capable of avoiding the construction area. Any shorebirds feeding and/ or roosting in the area would also be disturbed and displaced for the duration of construction activities (3 to 4 months).
www.erm.com Project No.: 0482086 Client: ASN and Liquid Telecom Page 149
METISS DRAFT EIA REPORT
IMPACT ASSESSMENT
Although the activities on the shore and in the shallow subtidal regions would be localised and confined to within a few tens of metres of the construction site and the shore-crossing, the benthic biota would be damaged or destroyed through the moving of equipment, as well as the general activities of contractors around the construction site. The invertebrate macrofauna inhabiting these beaches are important components of the detritus/ beach-cast seaweed-based food chains, being mostly scavengers, particulate organic matter and filter feeders (Brown & McLachlan, 1994). As such, they assimilate food sources available from the detritus accumulations typical of this coast and, in turn, become prey for surf-zone fishes and migratory shorebirds that feed on the beach slope and in the swash zone. By providing energy input to higher trophic levels, they are all important in nearshore nutrient cycling, and significant reduction or loss of these macrofaunal assemblages may therefore have cascade effects through the coastal ecosystem (Dugan et al, 2003).
Once the subsea cable has been buried, the affected seabed areas would, with time, be recolonised by benthic macrofauna. The ecological recovery of the disturbed sea floor is generally defined as the establishment of a successional community of species, which progresses towards a community that is similar in species composition, population density and biomass to that previously present (Ellis, 1996). In general, communities of short-lived species and/or species with a high reproduction rate (opportunists) may recover more rapidly than communities of slow growing, long-lived species. Opportunists are usually small, mobile, highly reproductive and fast-growing species and are the early colonisers. Sediments in the nearshore wave-base regime, which are subjected to frequent disturbances, are typically inhabited by these opportunistic species (Newell et al, 1998).
Recolonisation will start rapidly after cessation of trenching, and species diversity and abundance may recover within short periods (weeks) whereas biomass often remains reduced for several years (Kenny & Rees, 1994, 1996). Provided the installation activities are all conducted concurrently, the duration of the construction impacts should be limited to a few weeks. Disturbed subtidal communities within the wave base (<40 m water depth) might recover even faster (Newell et al, 1998). However, while recovery of the intertidal and subtidal communities is rapid, physical alteration of the shoreline in ways that cannot be remediated by swell action, such as deposition of large piles of pebbles and boulders, can be more or less permanent. Whilst the construction activities associated specifically with the subsea cable installation are unlikely to have a significant effect at the ecosystem level, the cumulative effects of increasing development along this stretch of coast must be kept in mind.
Impact Assessment The impacts on benthic communities as a result of subsea cable installation through the littoral zone would be of Medium Magnitude. Impacts would, however, be once-off and highly localised, being restricted to a 10 m wide strip through the intertidal and surf-zone. Impacts would be expected to endure over the short-term only as communities within the wave-influenced zone are adapted to frequent natural disturbances and recover relatively rapidly. As the subsea cable routing passes through coastal and inshore benthic habitats identified as ‘‘Vulnerable’’ the impact can be considered of Medium Sensitivity. Impacts to vulnerable habitats are, however only temporary.
The potential impacts on benthic organisms of installation of the shoreline crossing is of Moderate Significance without mitigation (Table 8-3).
Mitigation Measures The following mitigation measures are recommended:
Using the results of the seabed survey undertaken to design the subsea cable routing, plan the routing to as far as practicably possible avoid sensitive benthic habitats in the coastal and nearshore zone.
Ensure that construction activities required for subsea cable installation occur concurrently, and timeously thereby minimizing the disturbance duration in the coastal and nearshore zone.
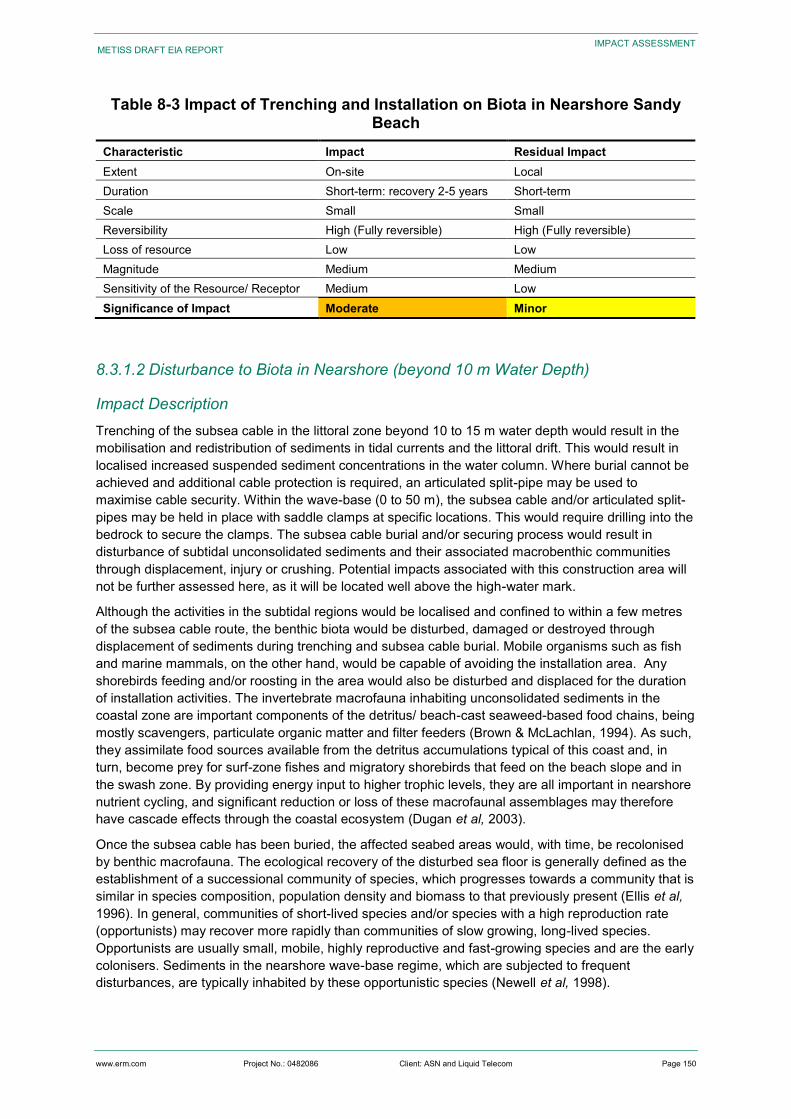
www.erm.com Project No.: 0482086 Client: ASN and Liquid Telecom Page 150
METISS DRAFT EIA REPORT
IMPACT ASSESSMENT
Table 8-3 Impact of Trenching and Installation on Biota in Nearshore Sandy Beach
Characteristic Impact Residual Impact Extent On-site Local Duration Short-term: recovery 2-5 years Short-term
Scale Small Small Reversibility High (Fully reversible) High (Fully reversible) Loss of resource Low Low
Magnitude Medium Medium Sensitivity of the Resource/ Receptor Medium Low
Significance of Impact Moderate Minor
8.3.1.2 Disturbance to Biota in Nearshore (beyond 10 m Water Depth)
Impact Description Trenching of the subsea cable in the littoral zone beyond 10 to 15 m water depth would result in the mobilisation and redistribution of sediments in tidal currents and the littoral drift. This would result in localised increased suspended sediment concentrations in the water column. Where burial cannot be achieved and additional cable protection is required, an articulated split-pipe may be used to maximise cable security. Within the wave-base (0 to 50 m), the subsea cable and/or articulated split-pipes may be held in place with saddle clamps at specific locations. This would require drilling into the bedrock to secure the clamps. The subsea cable burial and/or securing process would result in disturbance of subtidal unconsolidated sediments and their associated macrobenthic communities through displacement, injury or crushing. Potential impacts associated with this construction area will not be further assessed here, as it will be located well above the high-water mark.
Although the activities in the subtidal regions would be localised and confined to within a few metres of the subsea cable route, the benthic biota would be disturbed, damaged or destroyed through displacement of sediments during trenching and subsea cable burial. Mobile organisms such as fish and marine mammals, on the other hand, would be capable of avoiding the installation area. Any shorebirds feeding and/or roosting in the area would also be disturbed and displaced for the duration of installation activities. The invertebrate macrofauna inhabiting unconsolidated sediments in the coastal zone are important components of the detritus/ beach-cast seaweed-based food chains, being mostly scavengers, particulate organic matter and filter feeders (Brown & McLachlan, 1994). As such, they assimilate food sources available from the detritus accumulations typical of this coast and, in turn, become prey for surf-zone fishes and migratory shorebirds that feed on the beach slope and in the swash zone. By providing energy input to higher trophic levels, they are all important in nearshore nutrient cycling, and significant reduction or loss of these macrofaunal assemblages may therefore have cascade effects through the coastal ecosystem (Dugan et al, 2003).
Once the subsea cable has been buried, the affected seabed areas would, with time, be recolonised by benthic macrofauna. The ecological recovery of the disturbed sea floor is generally defined as the establishment of a successional community of species, which progresses towards a community that is similar in species composition, population density and biomass to that previously present (Ellis et al, 1996). In general, communities of short-lived species and/or species with a high reproduction rate (opportunists) may recover more rapidly than communities of slow growing, long-lived species. Opportunists are usually small, mobile, highly reproductive and fast-growing species and are the early colonisers. Sediments in the nearshore wave-base regime, which are subjected to frequent disturbances, are typically inhabited by these opportunistic species (Newell et al, 1998).
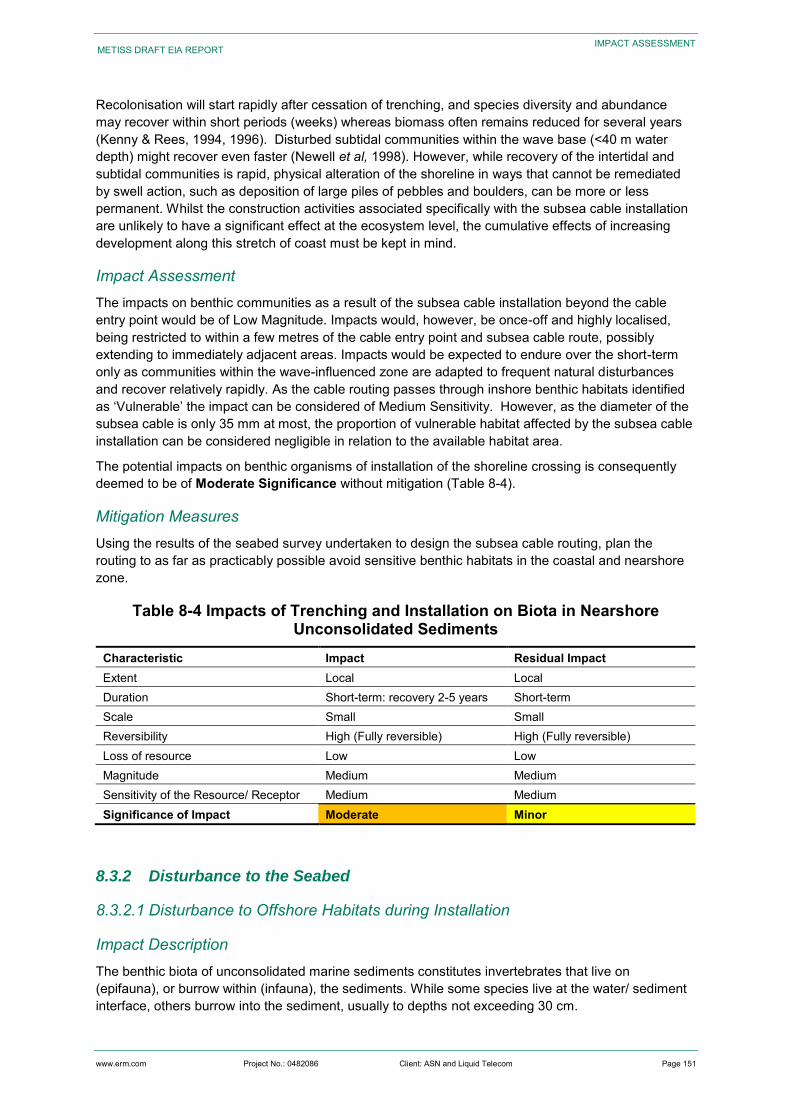
www.erm.com Project No.: 0482086 Client: ASN and Liquid Telecom Page 151
METISS DRAFT EIA REPORT
IMPACT ASSESSMENT
Recolonisation will start rapidly after cessation of trenching, and species diversity and abundance may recover within short periods (weeks) whereas biomass often remains reduced for several years (Kenny & Rees, 1994, 1996). Disturbed subtidal communities within the wave base (<40 m water depth) might recover even faster (Newell et al, 1998). However, while recovery of the intertidal and subtidal communities is rapid, physical alteration of the shoreline in ways that cannot be remediated by swell action, such as deposition of large piles of pebbles and boulders, can be more or less permanent. Whilst the construction activities associated specifically with the subsea cable installation are unlikely to have a significant effect at the ecosystem level, the cumulative effects of increasing development along this stretch of coast must be kept in mind.
Impact Assessment The impacts on benthic communities as a result of the subsea cable installation beyond the cable entry point would be of Low Magnitude. Impacts would, however, be once-off and highly localised, being restricted to within a few metres of the cable entry point and subsea cable route, possibly extending to immediately adjacent areas. Impacts would be expected to endure over the short-term only as communities within the wave-influenced zone are adapted to frequent natural disturbances and recover relatively rapidly. As the cable routing passes through inshore benthic habitats identified as ‘Vulnerable’ the impact can be considered of Medium Sensitivity. However, as the diameter of the subsea cable is only 35 mm at most, the proportion of vulnerable habitat affected by the subsea cable installation can be considered negligible in relation to the available habitat area.
The potential impacts on benthic organisms of installation of the shoreline crossing is consequently deemed to be of Moderate Significance without mitigation (Table 8-4).
Mitigation Measures Using the results of the seabed survey undertaken to design the subsea cable routing, plan the routing to as far as practicably possible avoid sensitive benthic habitats in the coastal and nearshore zone.
Table 8-4 Impacts of Trenching and Installation on Biota in Nearshore Unconsolidated Sediments
Characteristic Impact Residual Impact Extent Local Local Duration Short-term: recovery 2-5 years Short-term
Scale Small Small Reversibility High (Fully reversible) High (Fully reversible) Loss of resource Low Low Magnitude Medium Medium Sensitivity of the Resource/ Receptor Medium Medium
Significance of Impact Moderate Minor
8.3.2 Disturbance to the Seabed
8.3.2.1 Disturbance to Offshore Habitats during Installation
Impact Description The benthic biota of unconsolidated marine sediments constitutes invertebrates that live on (epifauna), or burrow within (infauna), the sediments. While some species live at the water/ sediment interface, others burrow into the sediment, usually to depths not exceeding 30 cm.
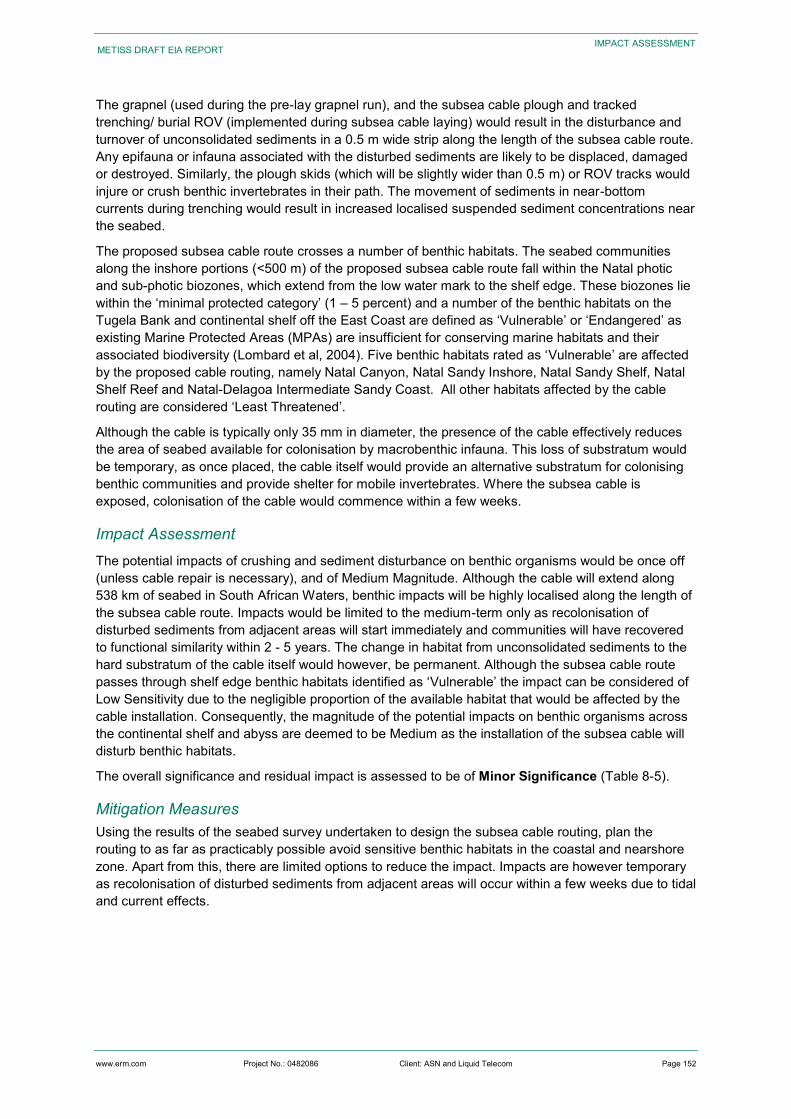
www.erm.com Project No.: 0482086 Client: ASN and Liquid Telecom Page 152
METISS DRAFT EIA REPORT
IMPACT ASSESSMENT
The grapnel (used during the pre-lay grapnel run), and the subsea cable plough and tracked trenching/ burial ROV (implemented during subsea cable laying) would result in the disturbance and turnover of unconsolidated sediments in a 0.5 m wide strip along the length of the subsea cable route. Any epifauna or infauna associated with the disturbed sediments are likely to be displaced, damaged or destroyed. Similarly, the plough skids (which will be slightly wider than 0.5 m) or ROV tracks would injure or crush benthic invertebrates in their path. The movement of sediments in near-bottom currents during trenching would result in increased localised suspended sediment concentrations near the seabed.
The proposed subsea cable route crosses a number of benthic habitats. The seabed communities along the inshore portions (<500 m) of the proposed subsea cable route fall within the Natal photic and sub-photic biozones, which extend from the low water mark to the shelf edge. These biozones lie within the ‘minimal protected category’ (1 – 5 percent) and a number of the benthic habitats on the Tugela Bank and continental shelf off the East Coast are defined as ‘Vulnerable’ or ‘Endangered’ as existing Marine Protected Areas (MPAs) are insufficient for conserving marine habitats and their associated biodiversity (Lombard et al, 2004). Five benthic habitats rated as ‘Vulnerable’ are affected by the proposed cable routing, namely Natal Canyon, Natal Sandy Inshore, Natal Sandy Shelf, Natal Shelf Reef and Natal-Delagoa Intermediate Sandy Coast. All other habitats affected by the cable routing are considered ‘Least Threatened’.
Although the cable is typically only 35 mm in diameter, the presence of the cable effectively reduces the area of seabed available for colonisation by macrobenthic infauna. This loss of substratum would be temporary, as once placed, the cable itself would provide an alternative substratum for colonising benthic communities and provide shelter for mobile invertebrates. Where the subsea cable is exposed, colonisation of the cable would commence within a few weeks.
Impact Assessment The potential impacts of crushing and sediment disturbance on benthic organisms would be once off (unless cable repair is necessary), and of Medium Magnitude. Although the cable will extend along 538 km of seabed in South African Waters, benthic impacts will be highly localised along the length of the subsea cable route. Impacts would be limited to the medium-term only as recolonisation of disturbed sediments from adjacent areas will start immediately and communities will have recovered to functional similarity within 2 - 5 years. The change in habitat from unconsolidated sediments to the hard substratum of the cable itself would however, be permanent. Although the subsea cable route passes through shelf edge benthic habitats identified as ‘Vulnerable’ the impact can be considered of Low Sensitivity due to the negligible proportion of the available habitat that would be affected by the cable installation. Consequently, the magnitude of the potential impacts on benthic organisms across the continental shelf and abyss are deemed to be Medium as the installation of the subsea cable will disturb benthic habitats.
The overall significance and residual impact is assessed to be of Minor Significance (Table 8-5).
Mitigation Measures Using the results of the seabed survey undertaken to design the subsea cable routing, plan the routing to as far as practicably possible avoid sensitive benthic habitats in the coastal and nearshore zone. Apart from this, there are limited options to reduce the impact. Impacts are however temporary as recolonisation of disturbed sediments from adjacent areas will occur within a few weeks due to tidal and current effects.
www.erm.com Project No.: 0482086 Client: ASN and Liquid Telecom Page 153
METISS DRAFT EIA REPORT
IMPACT ASSESSMENT
Table 8-5 Impacts of Subsea Cable Laying on Biota in the Offshore Seabed Characteristic Impact Residual Impact Extent On-site On-site Duration Short-term: recovery 2-5 years Short-term Scale Small Small Reversibility Medium (Partially reversible) Medium (Partially reversible) Loss of resource Low Low Magnitude Medium Medium Sensitivity of the Resource/ Receptor Low Low Significance of Impact Minor Minor
8.3.2.2 Disturbance to the Seabed Characteristics from Physical Presence of Subsea Cable during Operations
Impact Description Although the subsea cable is typically only 35 mm in diameter, the presence of the subsea cable effectively reduces the area of seabed available for colonisation by macrobenthic infauna in seabed sediments. The subsea cable itself, however, would serve as an alternative substratum for colonising benthic communities or provide shelter for mobile invertebrates and demersal fish. Assuming that the hydrographical conditions around the subsea cable and repeaters would not be significantly different to those on the seabed, a similar community to that typically found on hard substrata in the area can be expected to develop over time. As offshore portions of the subsea cable will be located on unconsolidated sediments, biota developing on the structures would be significantly different from the original soft sediment macrobenthic communities.
The community structure of benthic biota is shaped by the prevailing physical (abiotic) conditions such as sediment grain size, temperature, salinity, turbidity and currents. Further shaping is derived from biotic factors such as predation, food availability, larval recruitment and reproductive success. The naturally high spatial and temporal variability for these factors in subtidal regions results in seabed communities being both patchy and variable. The offshore soft-sediment habitat characterising the Tugela Banks is home to a unique fauna dominated by benthic and deposit feeders that favour muddy sediments and turbid waters. In particular, the seabed in the nearshore areas off the KwaZulu-Natal coast tends to be patchy in terms of sediment composition, with significant sediment movement being frequently induced by the typically dynamic wave and current regimes (Fleming & Hay, 1988). Consequently, the benthic macrofauna of inshore regions will be adapted to typically harsh conditions and frequent disturbance. Further offshore where near-bottom conditions are more stable, the macrofaunal communities will primarily be determined by sediment characteristics and depth. Further offshore where sediments tend to be muddier, diversity and abundance typically increases.
The presence of subsea infrastructure (the cable and repeaters) can alter the community structure in an area, and effectively increase the availability of hard substrate for colonisation by sessile benthic organisms, thereby locally altering and increasing biodiversity and biomass.
Impact Assessment The impacts on marine biodiversity through the physical presence of the subsea cable would be of Medium Magnitude and highly localised. As the subsea cable is likely be left in place on the seabed after the decommissioning phase, identified impacts would be permanent and the Sensitivity is Low. The magnitude of the potential impacts on marine biota is Medium as it alters the community structure. The significance and residual impact is assessed to be of Minor Significance (Table 8-6).
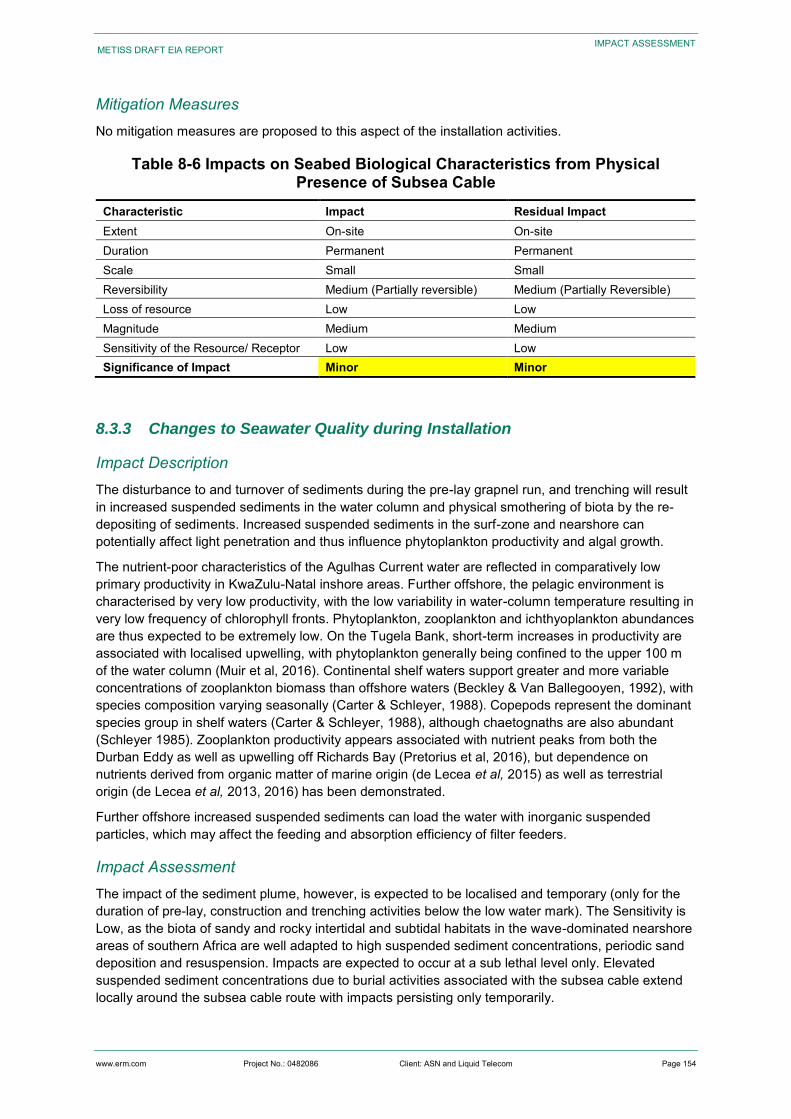
www.erm.com Project No.: 0482086 Client: ASN and Liquid Telecom Page 154
METISS DRAFT EIA REPORT
IMPACT ASSESSMENT
Mitigation Measures No mitigation measures are proposed to this aspect of the installation activities.
Table 8-6 Impacts on Seabed Biological Characteristics from Physical Presence of Subsea Cable
Characteristic Impact Residual Impact Extent On-site On-site Duration Permanent Permanent Scale Small Small Reversibility Medium (Partially reversible) Medium (Partially Reversible) Loss of resource Low Low Magnitude Medium Medium Sensitivity of the Resource/ Receptor Low Low Significance of Impact Minor Minor
8.3.3 Changes to Seawater Quality during Installation
Impact Description The disturbance to and turnover of sediments during the pre-lay grapnel run, and trenching will result in increased suspended sediments in the water column and physical smothering of biota by the re-depositing of sediments. Increased suspended sediments in the surf-zone and nearshore can potentially affect light penetration and thus influence phytoplankton productivity and algal growth.
The nutrient-poor characteristics of the Agulhas Current water are reflected in comparatively low primary productivity in KwaZulu-Natal inshore areas. Further offshore, the pelagic environment is characterised by very low productivity, with the low variability in water-column temperature resulting in very low frequency of chlorophyll fronts. Phytoplankton, zooplankton and ichthyoplankton abundances are thus expected to be extremely low. On the Tugela Bank, short-term increases in productivity are associated with localised upwelling, with phytoplankton generally being confined to the upper 100 m of the water column (Muir et al, 2016). Continental shelf waters support greater and more variable concentrations of zooplankton biomass than offshore waters (Beckley & Van Ballegooyen, 1992), with species composition varying seasonally (Carter & Schleyer, 1988). Copepods represent the dominant species group in shelf waters (Carter & Schleyer, 1988), although chaetognaths are also abundant (Schleyer 1985). Zooplankton productivity appears associated with nutrient peaks from both the Durban Eddy as well as upwelling off Richards Bay (Pretorius et al, 2016), but dependence on nutrients derived from organic matter of marine origin (de Lecea et al, 2015) as well as terrestrial origin (de Lecea et al, 2013, 2016) has been demonstrated.
Further offshore increased suspended sediments can load the water with inorganic suspended particles, which may affect the feeding and absorption efficiency of filter feeders.
Impact Assessment The impact of the sediment plume, however, is expected to be localised and temporary (only for the duration of pre-lay, construction and trenching activities below the low water mark). The Sensitivity is Low, as the biota of sandy and rocky intertidal and subtidal habitats in the wave-dominated nearshore areas of southern Africa are well adapted to high suspended sediment concentrations, periodic sand deposition and resuspension. Impacts are expected to occur at a sub lethal level only. Elevated suspended sediment concentrations due to burial activities associated with the subsea cable extend locally around the subsea cable route with impacts persisting only temporarily.
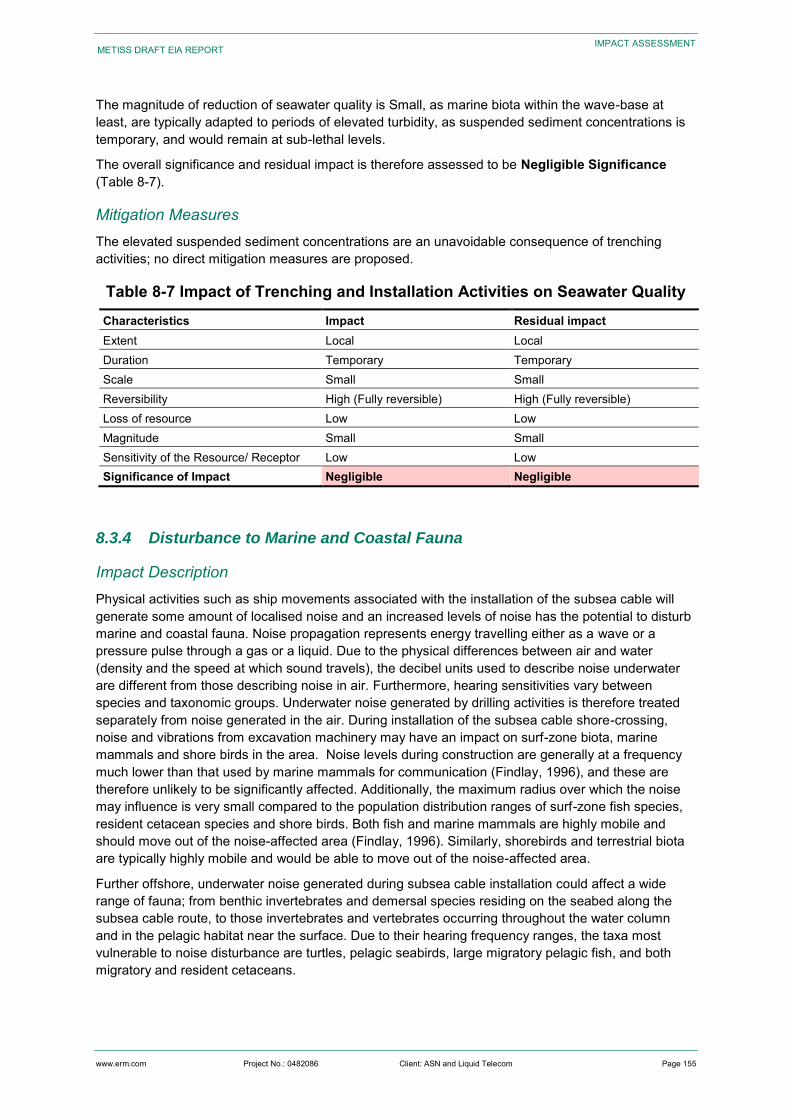
www.erm.com Project No.: 0482086 Client: ASN and Liquid Telecom Page 155
METISS DRAFT EIA REPORT
IMPACT ASSESSMENT
The magnitude of reduction of seawater quality is Small, as marine biota within the wave-base at least, are typically adapted to periods of elevated turbidity, as suspended sediment concentrations is temporary, and would remain at sub-lethal levels.
The overall significance and residual impact is therefore assessed to be Negligible Significance (Table 8-7).
Mitigation Measures The elevated suspended sediment concentrations are an unavoidable consequence of trenching activities; no direct mitigation measures are proposed.
Table 8-7 Impact of Trenching and Installation Activities on Seawater Quality Characteristics Impact Residual impact Extent Local Local Duration Temporary Temporary Scale Small Small Reversibility High (Fully reversible) High (Fully reversible) Loss of resource Low Low Magnitude Small Small Sensitivity of the Resource/ Receptor Low Low Significance of Impact Negligible Negligible
8.3.4 Disturbance to Marine and Coastal Fauna
Impact Description Physical activities such as ship movements associated with the installation of the subsea cable will generate some amount of localised noise and an increased levels of noise has the potential to disturb marine and coastal fauna. Noise propagation represents energy travelling either as a wave or a pressure pulse through a gas or a liquid. Due to the physical differences between air and water (density and the speed at which sound travels), the decibel units used to describe noise underwater are different from those describing noise in air. Furthermore, hearing sensitivities vary between species and taxonomic groups. Underwater noise generated by drilling activities is therefore treated separately from noise generated in the air. During installation of the subsea cable shore-crossing, noise and vibrations from excavation machinery may have an impact on surf-zone biota, marine mammals and shore birds in the area. Noise levels during construction are generally at a frequency much lower than that used by marine mammals for communication (Findlay, 1996), and these are therefore unlikely to be significantly affected. Additionally, the maximum radius over which the noise may influence is very small compared to the population distribution ranges of surf-zone fish species, resident cetacean species and shore birds. Both fish and marine mammals are highly mobile and should move out of the noise-affected area (Findlay, 1996). Similarly, shorebirds and terrestrial biota are typically highly mobile and would be able to move out of the noise-affected area.
Further offshore, underwater noise generated during subsea cable installation could affect a wide range of fauna; from benthic invertebrates and demersal species residing on the seabed along the subsea cable route, to those invertebrates and vertebrates occurring throughout the water column and in the pelagic habitat near the surface. Due to their hearing frequency ranges, the taxa most vulnerable to noise disturbance are turtles, pelagic seabirds, large migratory pelagic fish, and both migratory and resident cetaceans.
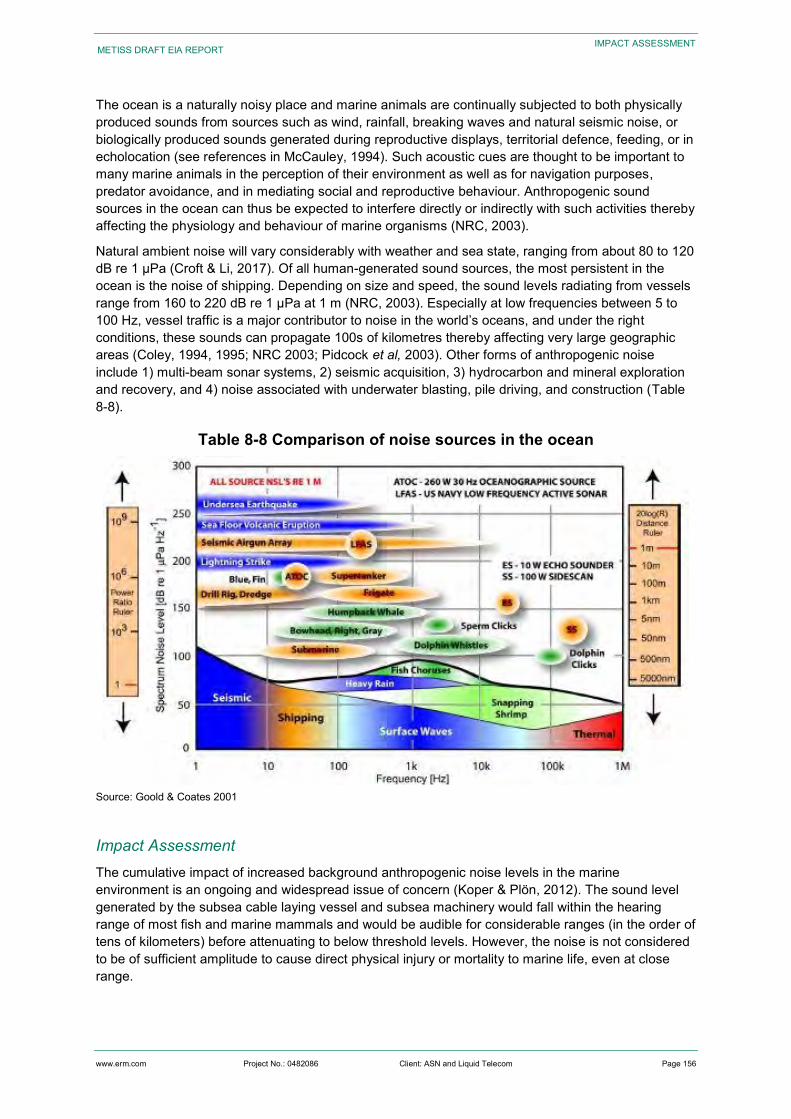
www.erm.com Project No.: 0482086 Client: ASN and Liquid Telecom Page 156
METISS DRAFT EIA REPORT
IMPACT ASSESSMENT
The ocean is a naturally noisy place and marine animals are continually subjected to both physically produced sounds from sources such as wind, rainfall, breaking waves and natural seismic noise, or biologically produced sounds generated during reproductive displays, territorial defence, feeding, or in echolocation (see references in McCauley, 1994). Such acoustic cues are thought to be important to many marine animals in the perception of their environment as well as for navigation purposes, predator avoidance, and in mediating social and reproductive behaviour. Anthropogenic sound sources in the ocean can thus be expected to interfere directly or indirectly with such activities thereby affecting the physiology and behaviour of marine organisms (NRC, 2003).
Natural ambient noise will vary considerably with weather and sea state, ranging from about 80 to 120 dB re 1 µPa (Croft & Li, 2017). Of all human-generated sound sources, the most persistent in the ocean is the noise of shipping. Depending on size and speed, the sound levels radiating from vessels range from 160 to 220 dB re 1 µPa at 1 m (NRC, 2003). Especially at low frequencies between 5 to 100 Hz, vessel traffic is a major contributor to noise in the world’s oceans, and under the right conditions, these sounds can propagate 100s of kilometres thereby affecting very large geographic areas (Coley, 1994, 1995; NRC 2003; Pidcock et al, 2003). Other forms of anthropogenic noise include 1) multi-beam sonar systems, 2) seismic acquisition, 3) hydrocarbon and mineral exploration and recovery, and 4) noise associated with underwater blasting, pile driving, and construction (Table 8-8).
Table 8-8 Comparison of noise sources in the ocean
Source: Goold & Coates 2001
Impact Assessment The cumulative impact of increased background anthropogenic noise levels in the marine environment is an ongoing and widespread issue of concern (Koper & Plön, 2012). The sound level generated by the subsea cable laying vessel and subsea machinery would fall within the hearing range of most fish and marine mammals and would be audible for considerable ranges (in the order of tens of kilometers) before attenuating to below threshold levels. However, the noise is not considered to be of sufficient amplitude to cause direct physical injury or mortality to marine life, even at close range.
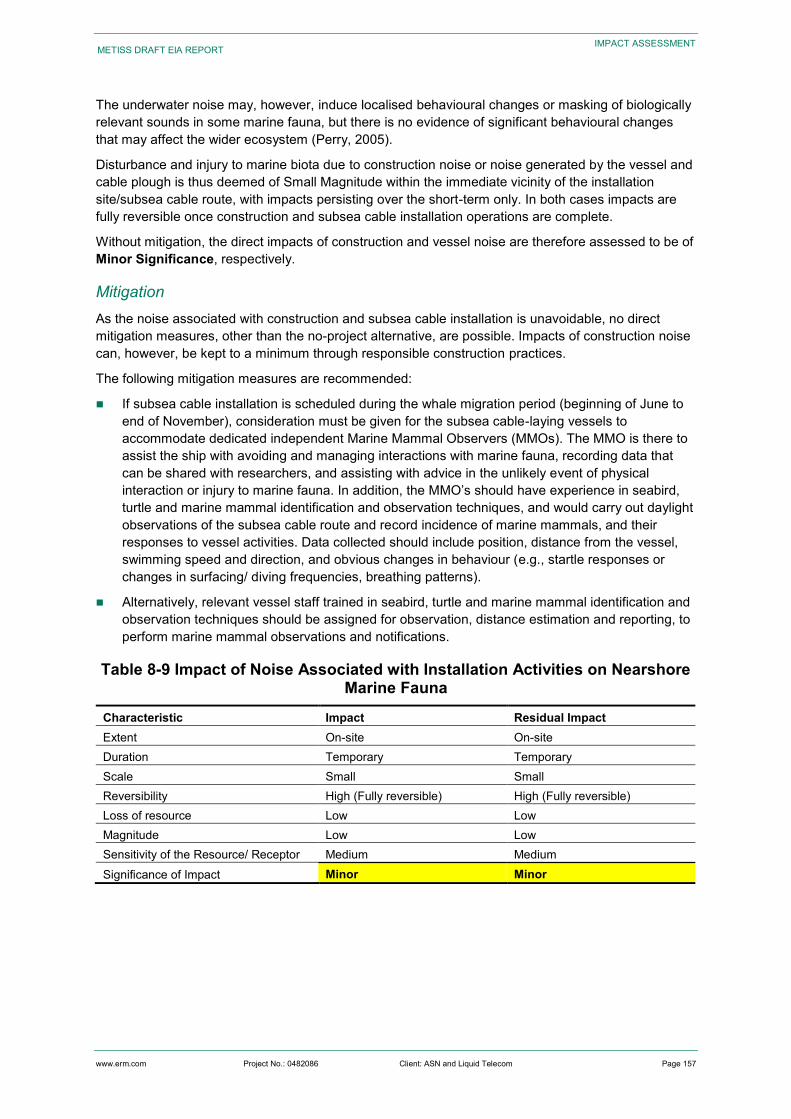
www.erm.com Project No.: 0482086 Client: ASN and Liquid Telecom Page 157
METISS DRAFT EIA REPORT
IMPACT ASSESSMENT
The underwater noise may, however, induce localised behavioural changes or masking of biologically relevant sounds in some marine fauna, but there is no evidence of significant behavioural changes that may affect the wider ecosystem (Perry, 2005).
Disturbance and injury to marine biota due to construction noise or noise generated by the vessel and cable plough is thus deemed of Small Magnitude within the immediate vicinity of the installation site/subsea cable route, with impacts persisting over the short-term only. In both cases impacts are fully reversible once construction and subsea cable installation operations are complete.
Without mitigation, the direct impacts of construction and vessel noise are therefore assessed to be of Minor Significance, respectively.
Mitigation As the noise associated with construction and subsea cable installation is unavoidable, no direct mitigation measures, other than the no-project alternative, are possible. Impacts of construction noise can, however, be kept to a minimum through responsible construction practices.
The following mitigation measures are recommended:
If subsea cable installation is scheduled during the whale migration period (beginning of June to end of November), consideration must be given for the subsea cable-laying vessels to accommodate dedicated independent Marine Mammal Observers (MMOs). The MMO is there to assist the ship with avoiding and managing interactions with marine fauna, recording data that can be shared with researchers, and assisting with advice in the unlikely event of physical interaction or injury to marine fauna. In addition, the MMO’s should have experience in seabird, turtle and marine mammal identification and observation techniques, and would carry out daylight observations of the subsea cable route and record incidence of marine mammals, and their responses to vessel activities. Data collected should include position, distance from the vessel, swimming speed and direction, and obvious changes in behaviour (e.g., startle responses or changes in surfacing/ diving frequencies, breathing patterns).
Alternatively, relevant vessel staff trained in seabird, turtle and marine mammal identification and observation techniques should be assigned for observation, distance estimation and reporting, to perform marine mammal observations and notifications.
Table 8-9 Impact of Noise Associated with Installation Activities on Nearshore Marine Fauna
Characteristic Impact Residual Impact Extent On-site On-site Duration Temporary Temporary Scale Small Small Reversibility High (Fully reversible) High (Fully reversible) Loss of resource Low Low Magnitude Low Low Sensitivity of the Resource/ Receptor Medium Medium Significance of Impact Minor Minor
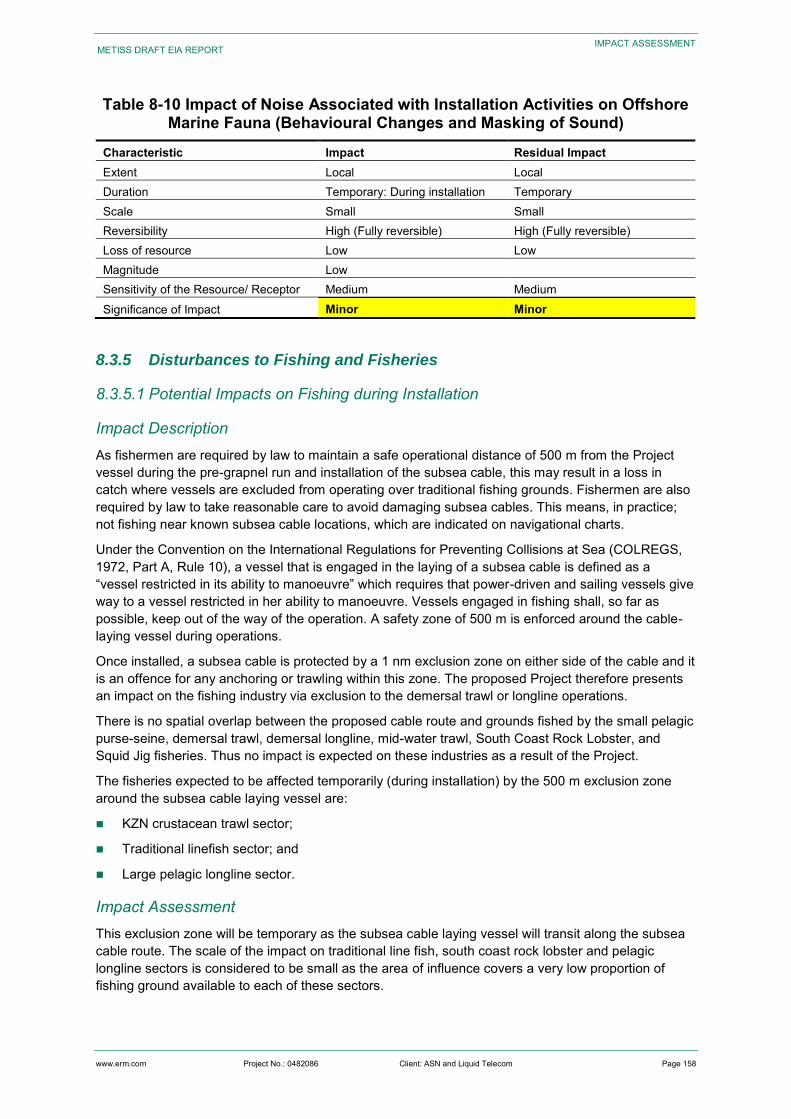
www.erm.com Project No.: 0482086 Client: ASN and Liquid Telecom Page 158
METISS DRAFT EIA REPORT
IMPACT ASSESSMENT
Table 8-10 Impact of Noise Associated with Installation Activities on Offshore Marine Fauna (Behavioural Changes and Masking of Sound)
Characteristic Impact Residual Impact Extent Local Local Duration Temporary: During installation Temporary Scale Small Small Reversibility High (Fully reversible) High (Fully reversible) Loss of resource Low Low Magnitude Low Sensitivity of the Resource/ Receptor Medium Medium Significance of Impact Minor Minor
8.3.5 Disturbances to Fishing and Fisheries
8.3.5.1 Potential Impacts on Fishing during Installation
Impact Description As fishermen are required by law to maintain a safe operational distance of 500 m from the Project vessel during the pre-grapnel run and installation of the subsea cable, this may result in a loss in catch where vessels are excluded from operating over traditional fishing grounds. Fishermen are also required by law to take reasonable care to avoid damaging subsea cables. This means, in practice; not fishing near known subsea cable locations, which are indicated on navigational charts.
Under the Convention on the International Regulations for Preventing Collisions at Sea (COLREGS, 1972, Part A, Rule 10), a vessel that is engaged in the laying of a subsea cable is defined as a “vessel restricted in its ability to manoeuvre” which requires that power-driven and sailing vessels give way to a vessel restricted in her ability to manoeuvre. Vessels engaged in fishing shall, so far as possible, keep out of the way of the operation. A safety zone of 500 m is enforced around the cable-laying vessel during operations.
Once installed, a subsea cable is protected by a 1 nm exclusion zone on either side of the cable and it is an offence for any anchoring or trawling within this zone. The proposed Project therefore presents an impact on the fishing industry via exclusion to the demersal trawl or longline operations.
There is no spatial overlap between the proposed cable route and grounds fished by the small pelagic purse-seine, demersal trawl, demersal longline, mid-water trawl, South Coast Rock Lobster, and Squid Jig fisheries. Thus no impact is expected on these industries as a result of the Project.
The fisheries expected to be affected temporarily (during installation) by the 500 m exclusion zone around the subsea cable laying vessel are:
KZN crustacean trawl sector;
Traditional linefish sector; and
Large pelagic longline sector.
Impact Assessment This exclusion zone will be temporary as the subsea cable laying vessel will transit along the subsea cable route. The scale of the impact on traditional line fish, south coast rock lobster and pelagic longline sectors is considered to be small as the area of influence covers a very low proportion of fishing ground available to each of these sectors.
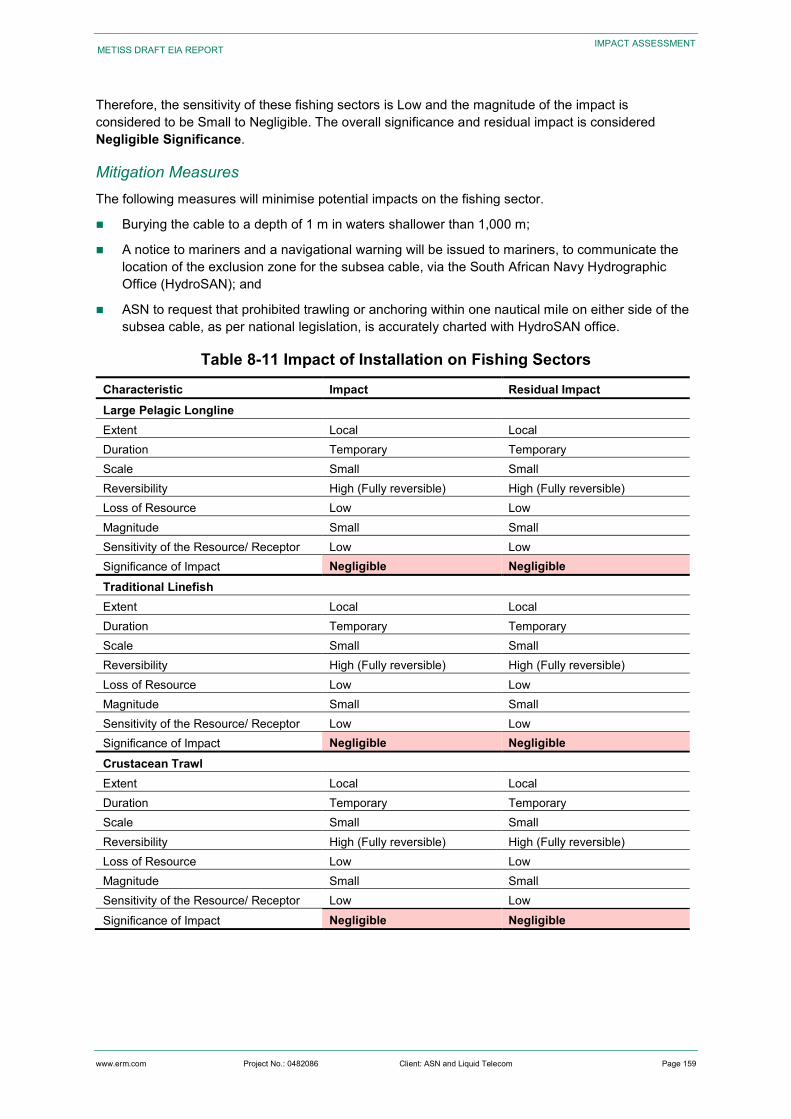
www.erm.com Project No.: 0482086 Client: ASN and Liquid Telecom Page 159
METISS DRAFT EIA REPORT
IMPACT ASSESSMENT
Therefore, the sensitivity of these fishing sectors is Low and the magnitude of the impact is considered to be Small to Negligible. The overall significance and residual impact is considered Negligible Significance.
Mitigation Measures The following measures will minimise potential impacts on the fishing sector.
Burying the cable to a depth of 1 m in waters shallower than 1,000 m;
A notice to mariners and a navigational warning will be issued to mariners, to communicate the location of the exclusion zone for the subsea cable, via the South African Navy Hydrographic Office (HydroSAN); and
ASN to request that prohibited trawling or anchoring within one nautical mile on either side of the subsea cable, as per national legislation, is accurately charted with HydroSAN office.
Table 8-11 Impact of Installation on Fishing Sectors
Characteristic Impact Residual Impact Large Pelagic Longline Extent Local Local Duration Temporary Temporary Scale Small Small Reversibility High (Fully reversible) High (Fully reversible) Loss of Resource Low Low Magnitude Small Small Sensitivity of the Resource/ Receptor Low Low Significance of Impact Negligible Negligible Traditional Linefish Extent Local Local Duration Temporary Temporary Scale Small Small Reversibility High (Fully reversible) High (Fully reversible) Loss of Resource Low Low Magnitude Small Small Sensitivity of the Resource/ Receptor Low Low Significance of Impact Negligible Negligible Crustacean Trawl Extent Local Local Duration Temporary Temporary Scale Small Small Reversibility High (Fully reversible) High (Fully reversible) Loss of Resource Low Low Magnitude Small Small Sensitivity of the Resource/ Receptor Low Low Significance of Impact Negligible Negligible
www.erm.com Project No.: 0482086 Client: ASN and Liquid Telecom Page 160
METISS DRAFT EIA REPORT
IMPACT ASSESSMENT
8.3.5.2 Potential Impacts on Fishing during Operation
Impact Description Fishermen are required by the United Nations Convention on the Law of the Sea (UNCLOS), as well as in South African legislation to take reasonable care to avoid damaging subsea cables. This means in practice not fishing near known subsea cable locations, which are indicated on navigational charts. This exclusion zone includes one nautical mile on either side of the cable routing within which trawling and anchoring is prohibited.
A trawler would be required to “fly” its gear so as to avoid contact with the subsea cable – this refers to shortening the trawl warps and hauling the gear up off the seabed until clear of the obstruction. These days precision placement of the gear is possible even at depth due to the sensors attached to the gear. Therefore, the impact to fisheries would equate to exclusion from fishing ground and an associated loss in catch over the time that gear is lifted off the seabed. In the event that several cables are present in close proximity, there is the potential of a cumulative impact where the ground between the exclusion zones may become unfishable due to the distance required to raise and lower fishing gear.
In the event that trawling gear snags a subsea cable, lifting the cable can be much more dangerous than pulling free from other seabed obstructions. When the winch is engaged the tension in the trawl warp increases as more cable is lifted from the seabed. The tension in the warps could build up rapidly to a point which would capsize the vessel. Most capsizes of this type are due to human error, and a well-designed vessel should have adequate resistance against capsizing. The combined winch and engine power of a modern trawler are capable of exerting considerable tension in the warp which in turn acts as a downward force on the towing block. This is frequently positioned above the vessel centre of gravity. If the load is also applied to one side then the vessel has the means of creating enough force to capsize itself (Drew & Hopper, 1996).
In areas where the subsea cable is not buried (any areas of rocky ground, and at depths greater than 1,000 m) the cable would be exposed and vulnerable to snagging by demersal longline and trawling gear. If this were to occur, besides the potential for damage to the cable, snagging could result in the loss of fishing gear.
Impact Assessment The demersal fisheries (ie, those that direct fishing effort at the seabed) that could be affected by exclusion to fishing during the Operational Phase include the KZN crustacean trawl, hake-directed trawl and longline and longline trap fisheries for rock lobster. However the proposed cable route does not coincide with fishing grounds for the demersal trawl and longline sectors or the rock lobster trap fishery and therefore no impact is expected on these sectors at any stage of the project.
The proposed subsea cable route does coincide with grounds fished by deep-water prawn trawlers. Over the period 2007 to 2017, a total of 828 trawls crossed the proposed subsea cable route. This is equivalent to 5.2 percent of the total number of trawls conducted by the sector. Apart from the 1 nautical mile exclusion zone around the cable, normal trawling operations would be unaffected during the operational phase of the Project. The magnitude of the impact on the sector is considered to be Small, the sensitivity of the receptor is assessed to be High and the overall significance of the impact is assessed to be Moderate.
Mitigation measures could include allowing overtrawling of the subsea cable inshore of the 600 m depth contour. The resultant impact would be of Negligible Significance.
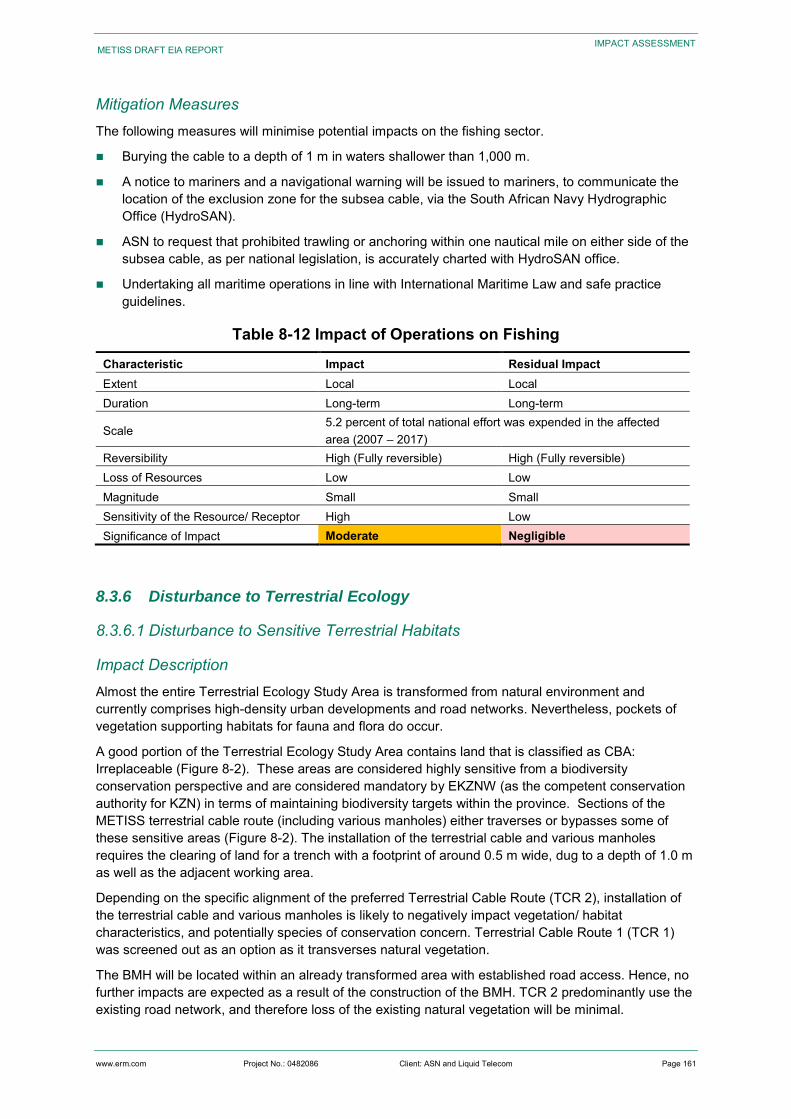
www.erm.com Project No.: 0482086 Client: ASN and Liquid Telecom Page 161
METISS DRAFT EIA REPORT
IMPACT ASSESSMENT
Mitigation Measures The following measures will minimise potential impacts on the fishing sector.
Burying the cable to a depth of 1 m in waters shallower than 1,000 m.
A notice to mariners and a navigational warning will be issued to mariners, to communicate the location of the exclusion zone for the subsea cable, via the South African Navy Hydrographic Office (HydroSAN).
ASN to request that prohibited trawling or anchoring within one nautical mile on either side of the subsea cable, as per national legislation, is accurately charted with HydroSAN office.
Undertaking all maritime operations in line with International Maritime Law and safe practice guidelines.
Table 8-12 Impact of Operations on Fishing
Characteristic Impact Residual Impact Extent Local Local Duration Long-term Long-term
Scale 5.2 percent of total national effort was expended in the affected area (2007 – 2017)
Reversibility High (Fully reversible) High (Fully reversible) Loss of Resources Low Low Magnitude Small Small Sensitivity of the Resource/ Receptor High Low Significance of Impact Moderate Negligible
8.3.6 Disturbance to Terrestrial Ecology
8.3.6.1 Disturbance to Sensitive Terrestrial Habitats
Impact Description Almost the entire Terrestrial Ecology Study Area is transformed from natural environment and currently comprises high-density urban developments and road networks. Nevertheless, pockets of vegetation supporting habitats for fauna and flora do occur.
A good portion of the Terrestrial Ecology Study Area contains land that is classified as CBA: Irreplaceable (Figure 8-2). These areas are considered highly sensitive from a biodiversity conservation perspective and are considered mandatory by EKZNW (as the competent conservation authority for KZN) in terms of maintaining biodiversity targets within the province. Sections of the METISS terrestrial cable route (including various manholes) either traverses or bypasses some of these sensitive areas (Figure 8-2). The installation of the terrestrial cable and various manholes requires the clearing of land for a trench with a footprint of around 0.5 m wide, dug to a depth of 1.0 m as well as the adjacent working area.
Depending on the specific alignment of the preferred Terrestrial Cable Route (TCR 2), installation of the terrestrial cable and various manholes is likely to negatively impact vegetation/ habitat characteristics, and potentially species of conservation concern. Terrestrial Cable Route 1 (TCR 1) was screened out as an option as it transverses natural vegetation.
The BMH will be located within an already transformed area with established road access. Hence, no further impacts are expected as a result of the construction of the BMH. TCR 2 predominantly use the existing road network, and therefore loss of the existing natural vegetation will be minimal.
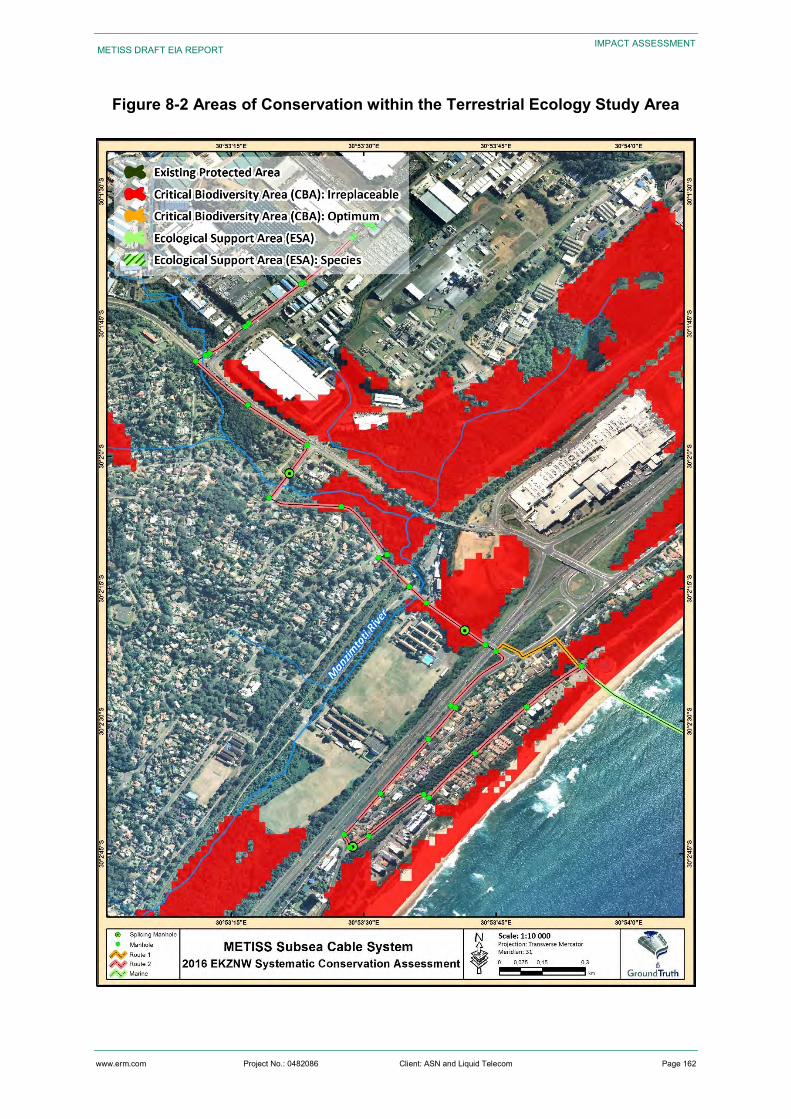
www.erm.com Project No.: 0482086 Client: ASN and Liquid Telecom Page 162
METISS DRAFT EIA REPORT
IMPACT ASSESSMENT
Figure 8-2 Areas of Conservation within the Terrestrial Ecology Study Area
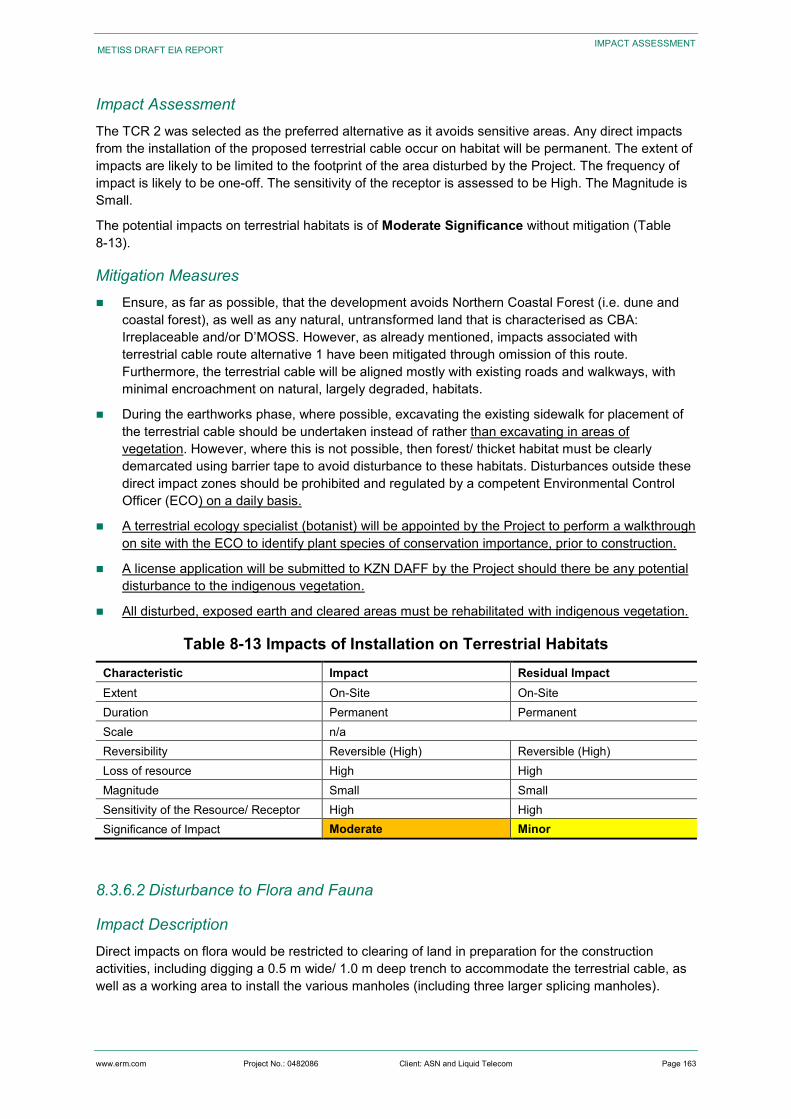
www.erm.com Project No.: 0482086 Client: ASN and Liquid Telecom Page 163
METISS DRAFT EIA REPORT
IMPACT ASSESSMENT
Impact Assessment The TCR 2 was selected as the preferred alternative as it avoids sensitive areas. Any direct impacts from the installation of the proposed terrestrial cable occur on habitat will be permanent. The extent of impacts are likely to be limited to the footprint of the area disturbed by the Project. The frequency of impact is likely to be one-off. The sensitivity of the receptor is assessed to be High. The Magnitude is Small.
The potential impacts on terrestrial habitats is of Moderate Significance without mitigation (Table 8-13).
Mitigation Measures Ensure, as far as possible, that the development avoids Northern Coastal Forest (i.e. dune and
coastal forest), as well as any natural, untransformed land that is characterised as CBA: Irreplaceable and/or D’MOSS. However, as already mentioned, impacts associated with terrestrial cable route alternative 1 have been mitigated through omission of this route. Furthermore, the terrestrial cable will be aligned mostly with existing roads and walkways, with minimal encroachment on natural, largely degraded, habitats.
During the earthworks phase, where possible, excavating the existing sidewalk for placement of the terrestrial cable should be undertaken instead of rather than excavating in areas of vegetation. However, where this is not possible, then forest/ thicket habitat must be clearly demarcated using barrier tape to avoid disturbance to these habitats. Disturbances outside these direct impact zones should be prohibited and regulated by a competent Environmental Control Officer (ECO) on a daily basis.
A terrestrial ecology specialist (botanist) will be appointed by the Project to perform a walkthrough on site with the ECO to identify plant species of conservation importance, prior to construction.
A license application will be submitted to KZN DAFF by the Project should there be any potential disturbance to the indigenous vegetation.
All disturbed, exposed earth and cleared areas must be rehabilitated with indigenous vegetation.
Table 8-13 Impacts of Installation on Terrestrial Habitats Characteristic Impact Residual Impact Extent On-Site On-Site Duration Permanent Permanent Scale n/a Reversibility Reversible (High) Reversible (High) Loss of resource High High Magnitude Small Small Sensitivity of the Resource/ Receptor High High Significance of Impact Moderate Minor
8.3.6.2 Disturbance to Flora and Fauna
Impact Description Direct impacts on flora would be restricted to clearing of land in preparation for the construction activities, including digging a 0.5 m wide/ 1.0 m deep trench to accommodate the terrestrial cable, as well as a working area to install the various manholes (including three larger splicing manholes).
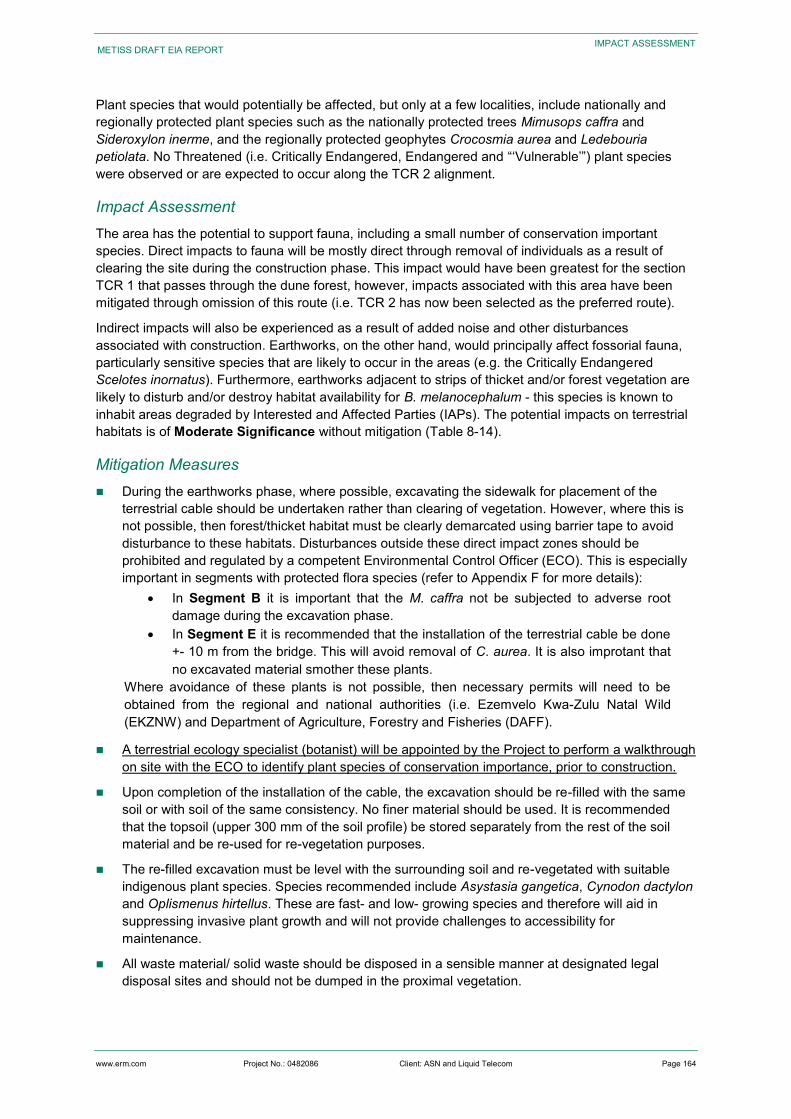
www.erm.com Project No.: 0482086 Client: ASN and Liquid Telecom Page 164
METISS DRAFT EIA REPORT
IMPACT ASSESSMENT
Plant species that would potentially be affected, but only at a few localities, include nationally and regionally protected plant species such as the nationally protected trees Mimusops caffra and Sideroxylon inerme, and the regionally protected geophytes Crocosmia aurea and Ledebouria petiolata. No Threatened (i.e. Critically Endangered, Endangered and “‘Vulnerable’”) plant species were observed or are expected to occur along the TCR 2 alignment.
Impact Assessment The area has the potential to support fauna, including a small number of conservation important species. Direct impacts to fauna will be mostly direct through removal of individuals as a result of clearing the site during the construction phase. This impact would have been greatest for the section TCR 1 that passes through the dune forest, however, impacts associated with this area have been mitigated through omission of this route (i.e. TCR 2 has now been selected as the preferred route).
Indirect impacts will also be experienced as a result of added noise and other disturbances associated with construction. Earthworks, on the other hand, would principally affect fossorial fauna, particularly sensitive species that are likely to occur in the areas (e.g. the Critically Endangered Scelotes inornatus). Furthermore, earthworks adjacent to strips of thicket and/or forest vegetation are likely to disturb and/or destroy habitat availability for B. melanocephalum - this species is known to inhabit areas degraded by Interested and Affected Parties (IAPs). The potential impacts on terrestrial habitats is of Moderate Significance without mitigation (Table 8-14).
Mitigation Measures During the earthworks phase, where possible, excavating the sidewalk for placement of the
terrestrial cable should be undertaken rather than clearing of vegetation. However, where this is not possible, then forest/thicket habitat must be clearly demarcated using barrier tape to avoid disturbance to these habitats. Disturbances outside these direct impact zones should be prohibited and regulated by a competent Environmental Control Officer (ECO). This is especially important in segments with protected flora species (refer to Appendix F for more details):
In Segment B it is important that the M. caffra not be subjected to adverse root damage during the excavation phase.
In Segment E it is recommended that the installation of the terrestrial cable be done +- 10 m from the bridge. This will avoid removal of C. aurea. It is also improtant that no excavated material smother these plants.
Where avoidance of these plants is not possible, then necessary permits will need to be obtained from the regional and national authorities (i.e. Ezemvelo Kwa-Zulu Natal Wild (EKZNW) and Department of Agriculture, Forestry and Fisheries (DAFF).
A terrestrial ecology specialist (botanist) will be appointed by the Project to perform a walkthrough on site with the ECO to identify plant species of conservation importance, prior to construction.
Upon completion of the installation of the cable, the excavation should be re-filled with the same soil or with soil of the same consistency. No finer material should be used. It is recommended that the topsoil (upper 300 mm of the soil profile) be stored separately from the rest of the soil material and be re-used for re-vegetation purposes.
The re-filled excavation must be level with the surrounding soil and re-vegetated with suitable indigenous plant species. Species recommended include Asystasia gangetica, Cynodon dactylon and Oplismenus hirtellus. These are fast- and low- growing species and therefore will aid in suppressing invasive plant growth and will not provide challenges to accessibility for maintenance.
All waste material/ solid waste should be disposed in a sensible manner at designated legal disposal sites and should not be dumped in the proximal vegetation.
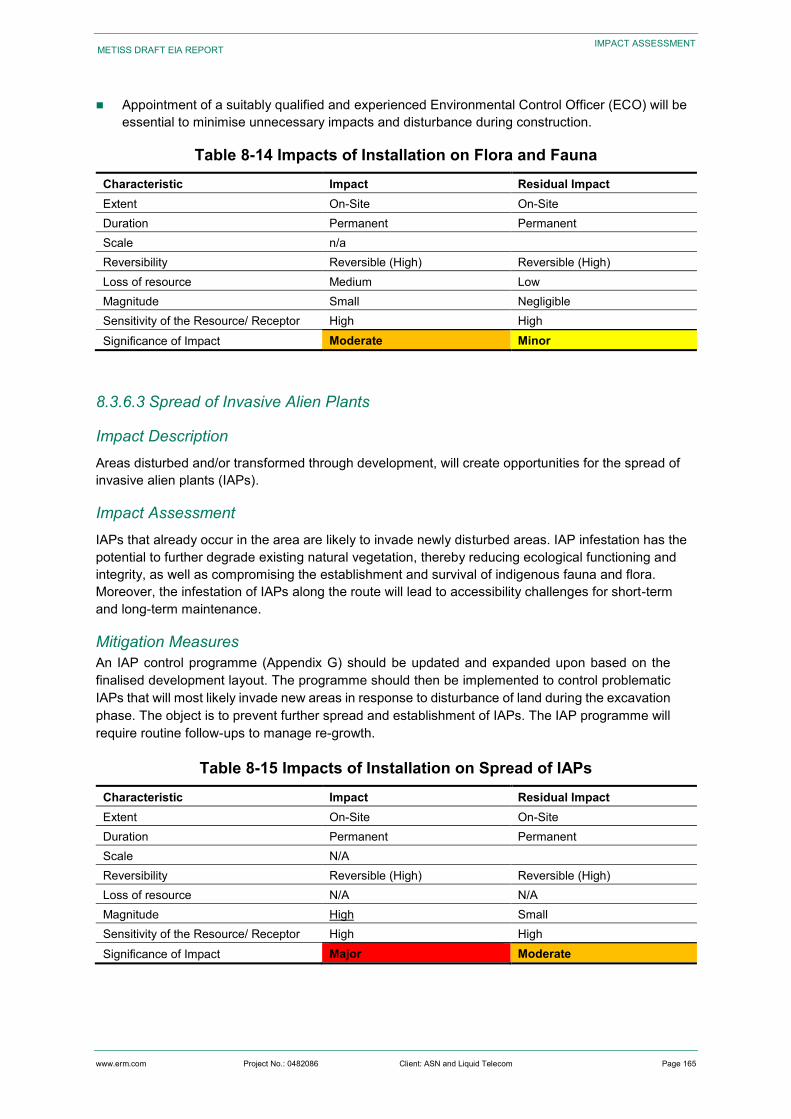
www.erm.com Project No.: 0482086 Client: ASN and Liquid Telecom Page 165
METISS DRAFT EIA REPORT
IMPACT ASSESSMENT
Appointment of a suitably qualified and experienced Environmental Control Officer (ECO) will be essential to minimise unnecessary impacts and disturbance during construction.
Table 8-14 Impacts of Installation on Flora and Fauna Characteristic Impact Residual Impact Extent On-Site On-Site Duration Permanent Permanent Scale n/a Reversibility Reversible (High) Reversible (High) Loss of resource Medium Low Magnitude Small Negligible Sensitivity of the Resource/ Receptor High High Significance of Impact Moderate Minor
8.3.6.3 Spread of Invasive Alien Plants
Impact Description Areas disturbed and/or transformed through development, will create opportunities for the spread of invasive alien plants (IAPs).
Impact Assessment IAPs that already occur in the area are likely to invade newly disturbed areas. IAP infestation has the potential to further degrade existing natural vegetation, thereby reducing ecological functioning and integrity, as well as compromising the establishment and survival of indigenous fauna and flora. Moreover, the infestation of IAPs along the route will lead to accessibility challenges for short-term and long-term maintenance.
Mitigation Measures An IAP control programme (Appendix G) should be updated and expanded upon based on the finalised development layout. The programme should then be implemented to control problematic IAPs that will most likely invade new areas in response to disturbance of land during the excavation phase. The object is to prevent further spread and establishment of IAPs. The IAP programme will require routine follow-ups to manage re-growth.
Table 8-15 Impacts of Installation on Spread of IAPs Characteristic Impact Residual Impact Extent On-Site On-Site Duration Permanent Permanent Scale N/A Reversibility Reversible (High) Reversible (High) Loss of resource N/A N/A Magnitude High Small Sensitivity of the Resource/ Receptor High High Significance of Impact Major Moderate
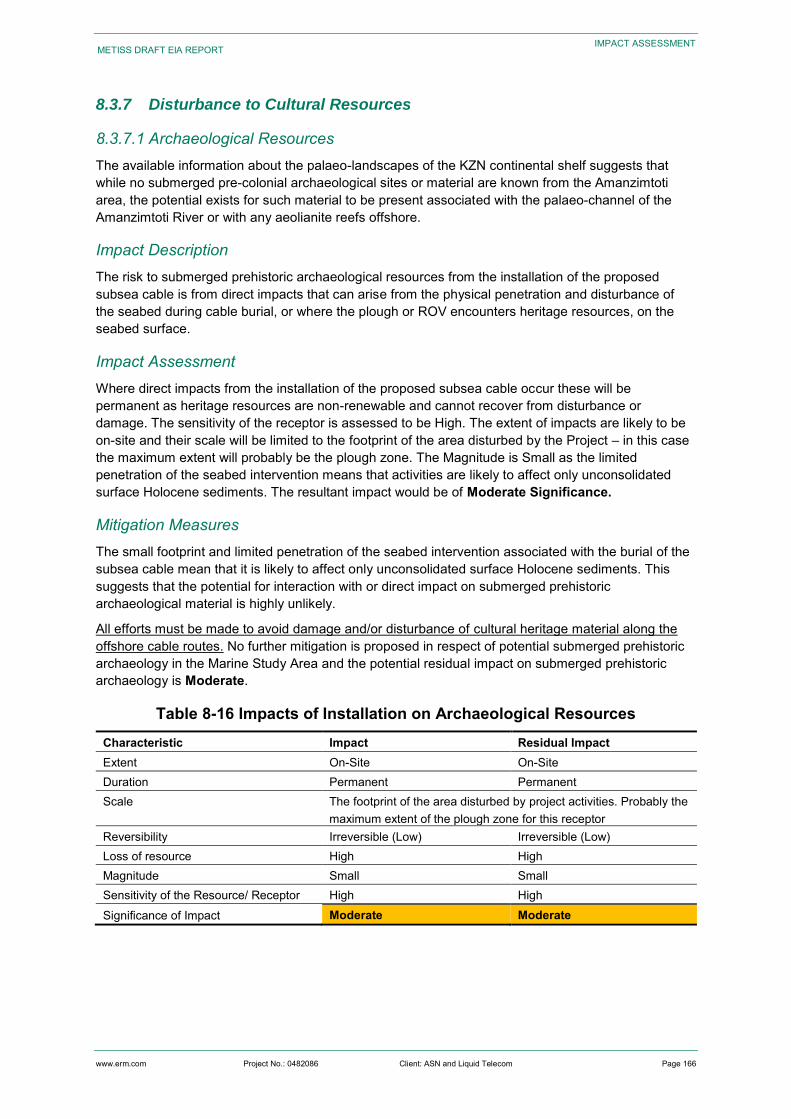
www.erm.com Project No.: 0482086 Client: ASN and Liquid Telecom Page 166
METISS DRAFT EIA REPORT
IMPACT ASSESSMENT
8.3.7 Disturbance to Cultural Resources
8.3.7.1 Archaeological Resources The available information about the palaeo-landscapes of the KZN continental shelf suggests that while no submerged pre-colonial archaeological sites or material are known from the Amanzimtoti area, the potential exists for such material to be present associated with the palaeo-channel of the Amanzimtoti River or with any aeolianite reefs offshore.
Impact Description The risk to submerged prehistoric archaeological resources from the installation of the proposed subsea cable is from direct impacts that can arise from the physical penetration and disturbance of the seabed during cable burial, or where the plough or ROV encounters heritage resources, on the seabed surface.
Impact Assessment Where direct impacts from the installation of the proposed subsea cable occur these will be permanent as heritage resources are non-renewable and cannot recover from disturbance or damage. The sensitivity of the receptor is assessed to be High. The extent of impacts are likely to be on-site and their scale will be limited to the footprint of the area disturbed by the Project – in this case the maximum extent will probably be the plough zone. The Magnitude is Small as the limited penetration of the seabed intervention means that activities are likely to affect only unconsolidated surface Holocene sediments. The resultant impact would be of Moderate Significance.
Mitigation Measures The small footprint and limited penetration of the seabed intervention associated with the burial of the subsea cable mean that it is likely to affect only unconsolidated surface Holocene sediments. This suggests that the potential for interaction with or direct impact on submerged prehistoric archaeological material is highly unlikely.
All efforts must be made to avoid damage and/or disturbance of cultural heritage material along the offshore cable routes. No further mitigation is proposed in respect of potential submerged prehistoric archaeology in the Marine Study Area and the potential residual impact on submerged prehistoric archaeology is Moderate.
Table 8-16 Impacts of Installation on Archaeological Resources Characteristic Impact Residual Impact Extent On-Site On-Site Duration Permanent Permanent Scale The footprint of the area disturbed by project activities. Probably the
maximum extent of the plough zone for this receptor Reversibility Irreversible (Low) Irreversible (Low) Loss of resource High High Magnitude Small Small Sensitivity of the Resource/ Receptor High High Significance of Impact Moderate Moderate
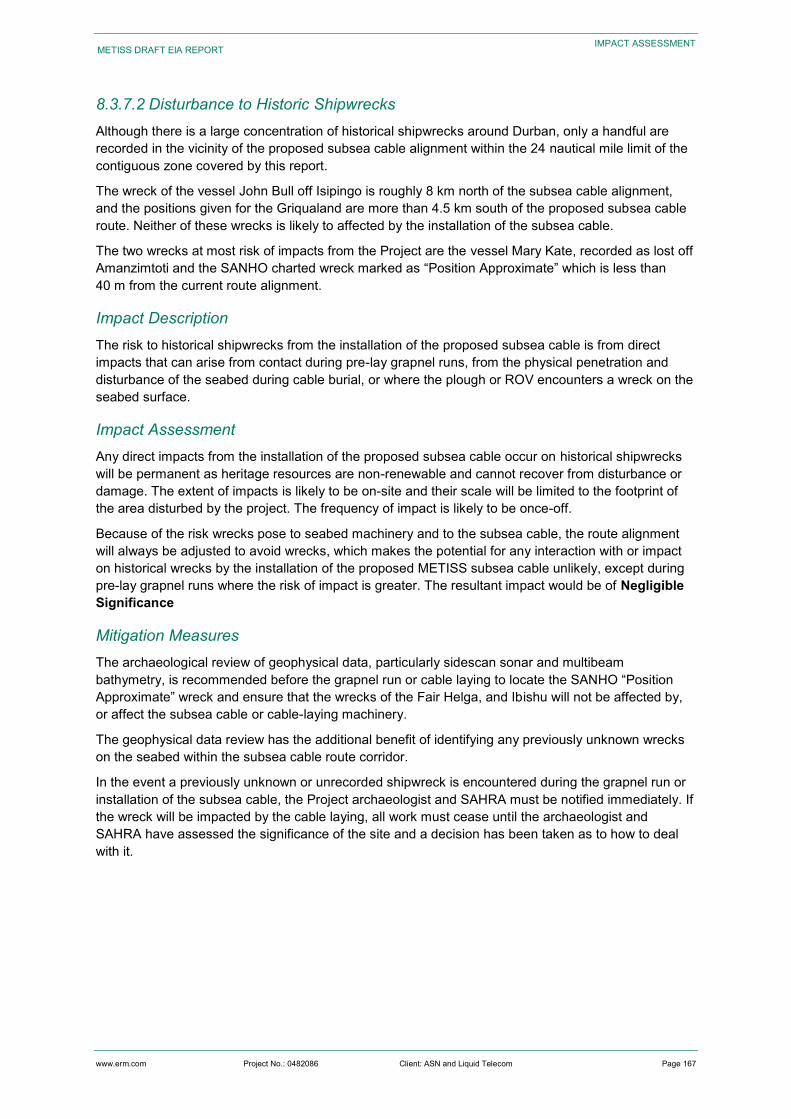
www.erm.com Project No.: 0482086 Client: ASN and Liquid Telecom Page 167
METISS DRAFT EIA REPORT
IMPACT ASSESSMENT
8.3.7.2 Disturbance to Historic Shipwrecks Although there is a large concentration of historical shipwrecks around Durban, only a handful are recorded in the vicinity of the proposed subsea cable alignment within the 24 nautical mile limit of the contiguous zone covered by this report.
The wreck of the vessel John Bull off Isipingo is roughly 8 km north of the subsea cable alignment, and the positions given for the Griqualand are more than 4.5 km south of the proposed subsea cable route. Neither of these wrecks is likely to affected by the installation of the subsea cable.
The two wrecks at most risk of impacts from the Project are the vessel Mary Kate, recorded as lost off Amanzimtoti and the SANHO charted wreck marked as “Position Approximate” which is less than 40 m from the current route alignment.
Impact Description The risk to historical shipwrecks from the installation of the proposed subsea cable is from direct impacts that can arise from contact during pre-lay grapnel runs, from the physical penetration and disturbance of the seabed during cable burial, or where the plough or ROV encounters a wreck on the seabed surface.
Impact Assessment Any direct impacts from the installation of the proposed subsea cable occur on historical shipwrecks will be permanent as heritage resources are non-renewable and cannot recover from disturbance or damage. The extent of impacts is likely to be on-site and their scale will be limited to the footprint of the area disturbed by the project. The frequency of impact is likely to be once-off.
Because of the risk wrecks pose to seabed machinery and to the subsea cable, the route alignment will always be adjusted to avoid wrecks, which makes the potential for any interaction with or impact on historical wrecks by the installation of the proposed METISS subsea cable unlikely, except during pre-lay grapnel runs where the risk of impact is greater. The resultant impact would be of Negligible Significance
Mitigation Measures The archaeological review of geophysical data, particularly sidescan sonar and multibeam bathymetry, is recommended before the grapnel run or cable laying to locate the SANHO “Position Approximate” wreck and ensure that the wrecks of the Fair Helga, and Ibishu will not be affected by, or affect the subsea cable or cable-laying machinery.
The geophysical data review has the additional benefit of identifying any previously unknown wrecks on the seabed within the subsea cable route corridor.
In the event a previously unknown or unrecorded shipwreck is encountered during the grapnel run or installation of the subsea cable, the Project archaeologist and SAHRA must be notified immediately. If the wreck will be impacted by the cable laying, all work must cease until the archaeologist and SAHRA have assessed the significance of the site and a decision has been taken as to how to deal with it.
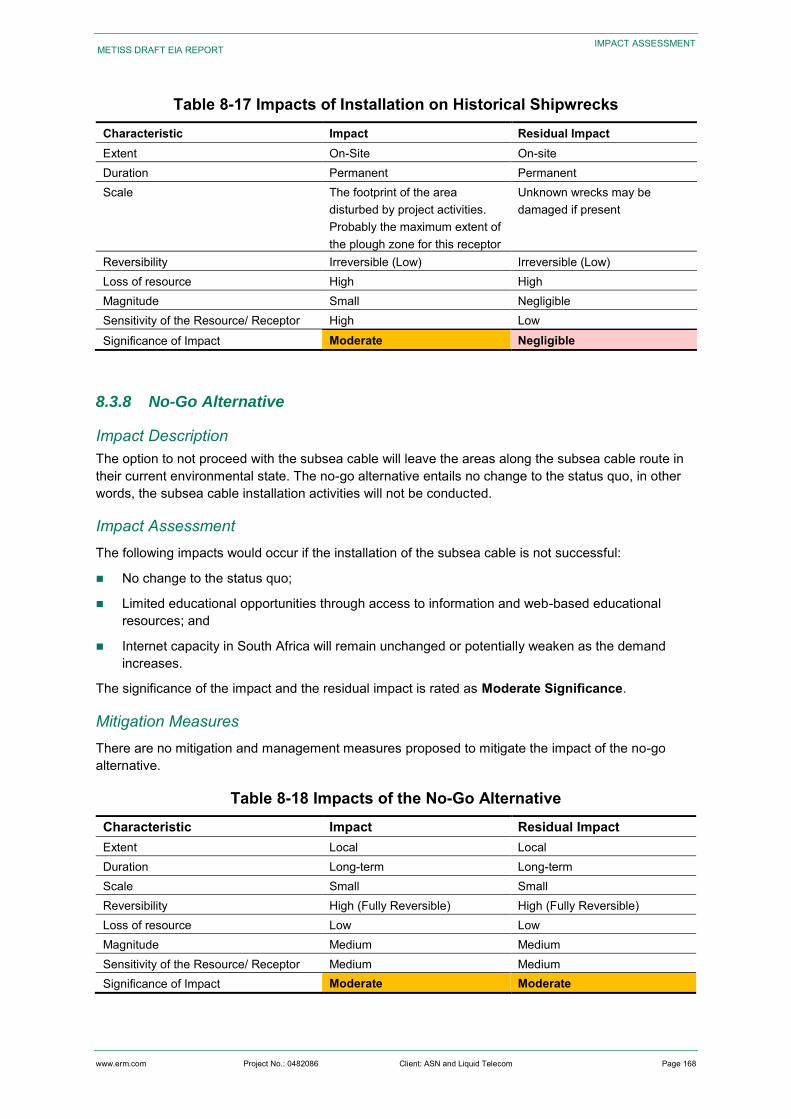
www.erm.com Project No.: 0482086 Client: ASN and Liquid Telecom Page 168
METISS DRAFT EIA REPORT
IMPACT ASSESSMENT
Table 8-17 Impacts of Installation on Historical Shipwrecks Characteristic Impact Residual Impact Extent On-Site On-site Duration Permanent Permanent Scale The footprint of the area
disturbed by project activities. Probably the maximum extent of the plough zone for this receptor
Unknown wrecks may be damaged if present
Reversibility Irreversible (Low) Irreversible (Low) Loss of resource High High Magnitude Small Negligible Sensitivity of the Resource/ Receptor High Low Significance of Impact Moderate Negligible
8.3.8 No-Go Alternative
Impact Description The option to not proceed with the subsea cable will leave the areas along the subsea cable route in their current environmental state. The no-go alternative entails no change to the status quo, in other words, the subsea cable installation activities will not be conducted.
Impact Assessment The following impacts would occur if the installation of the subsea cable is not successful:
No change to the status quo;
Limited educational opportunities through access to information and web-based educational resources; and
Internet capacity in South Africa will remain unchanged or potentially weaken as the demand increases.
The significance of the impact and the residual impact is rated as Moderate Significance.
Mitigation Measures There are no mitigation and management measures proposed to mitigate the impact of the no-go alternative.
Table 8-18 Impacts of the No-Go Alternative Characteristic Impact Residual Impact Extent Local Local Duration Long-term Long-term Scale Small Small Reversibility High (Fully Reversible) High (Fully Reversible) Loss of resource Low Low Magnitude Medium Medium Sensitivity of the Resource/ Receptor Medium Medium Significance of Impact Moderate Moderate
www.erm.com Project No.: 0482086 Client: ASN and Liquid Telecom Page 169
METISS DRAFT EIA REPORT
IMPACT ASSESSMENT
8.3.9 Decommissioning Phase
No decommissioning procedures have been developed at this stage. In the case of decommissioning the subsea cable components will most likely be left in place and the terrestrial cable will mostly be removed. The potential impacts during the decommissioning phase are thus expected to be minimal in comparison to those occurring during the installation phase.
8.4 Unplanned / Accidental Events: Key Environmental and Social Impacts
8.4.1 Pollution and Accidental Events - Hydrocarbon Spills
Trenching during installation of the shore crossing of the subsea cable will involve excavation and construction activities. There would thus be potential for or accidental spillage or leakage of fuel, chemicals or lubricants, litter, inappropriate disposal of human wastes and general degradation of ecosystem health on the shoreline. Any release of liquid hydrocarbons has the potential for direct, indirect and cumulative effects on the marine environment through contamination of the water and/or sediments. These effects include physical oiling and toxicity impacts to marine fauna and flora, localised mortality of plankton, pelagic eggs and fish larvae, and habitat loss or contamination (CSIR, 1998; Perry, 2005). Many of the compounds in petroleum products have been known to smother organisms, lower fertility and cause disease in aquatic organisms. Hydrocarbons are incorporated into sediments through attachment to fine-grained particles, sinking and deposition in low turbulence areas. Due to differential uptake and elimination rates, filter-feeders, particularly mussels, can bio-accumulate organic (hydrocarbons) contaminants (Birkeland et al, 1976).
During construction, litter can enter the marine environment. Inputs can be either direct by discarding garbage into the sea, or indirectly from the land when litter is blown into the water by wind. Marine litter is a cosmopolitan problem, with significant implications for the environment and human activity all over the world. Marine litter travels over long distances with ocean currents and winds. It originates from many sources and has a wide spectrum of environmental, economic, safety, health and cultural impacts. It is not only unsightly, but can cause serious harm to marine organisms, such as turtles, birds, fish and marine mammals. Considering the very slow rate of decomposition of most marine litter, a continuous input of large quantities will result in a gradual increase in litter in coastal and marine environment. Suitable waste management practices should thus be in place to ensure that littering is avoided.
Impact Assessment Potential hydrocarbon spills and pollution in the intertidal and shallow subtidal zone during installation of the subsea cable are deemed of Medium Consequence within the immediate vicinity of the construction site, with impacts persisting over the short- to long-term. Impacts of pollution and accidental spills would be direct, indirect and cumulative. As the coastal habitats at the shore-crossing have been identified as ‘“‘Vulnerable’”’, the impact can be considered of Medium Sensitivity.
The risk significance of pollution and accidental spills on the shoreline during the construction phase is therefore assessed to be of Moderate Significance.
Mitigation Measures The recommended mitigation measures for the construction phase of the proposed METISS cable installation are:
Keep heavy vehicle traffic associated with construction in the coastal zone to a minimum.
Restrict vehicles to clearly demarcated access routes and construction areas only. These should be selected under guidance of the local municipality.
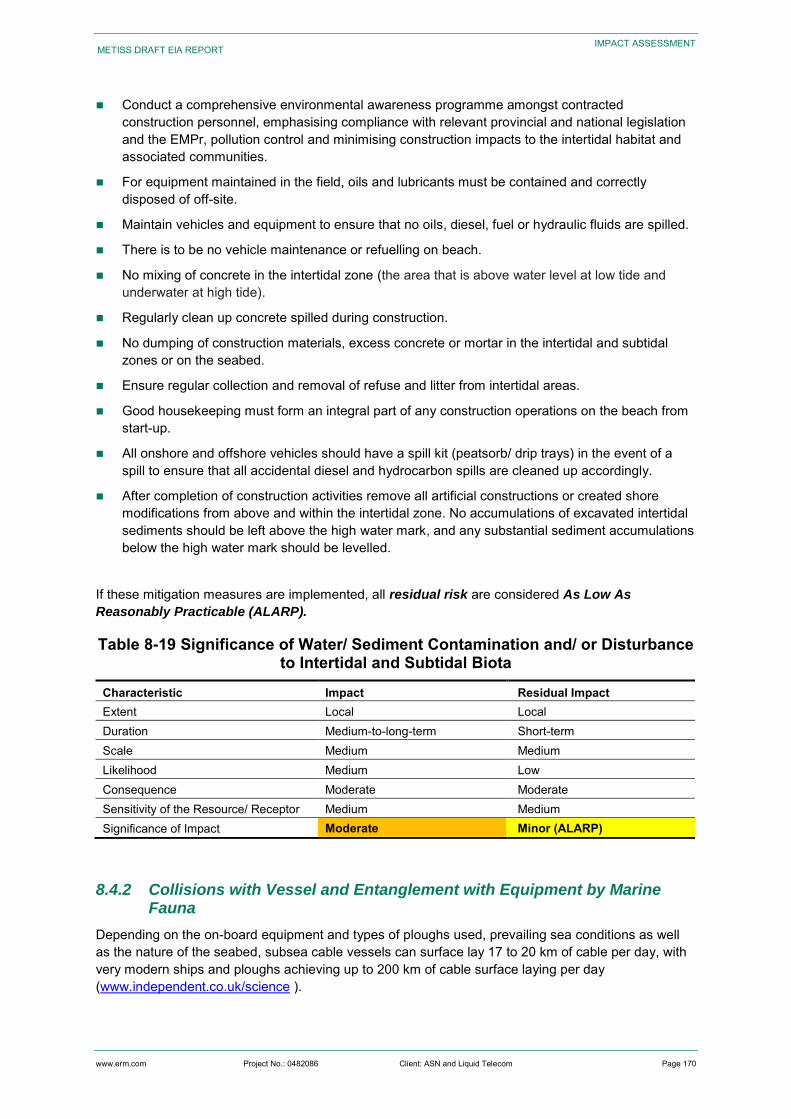
www.erm.com Project No.: 0482086 Client: ASN and Liquid Telecom Page 170
METISS DRAFT EIA REPORT
IMPACT ASSESSMENT
Conduct a comprehensive environmental awareness programme amongst contracted construction personnel, emphasising compliance with relevant provincial and national legislation and the EMPr, pollution control and minimising construction impacts to the intertidal habitat and associated communities.
For equipment maintained in the field, oils and lubricants must be contained and correctly disposed of off-site.
Maintain vehicles and equipment to ensure that no oils, diesel, fuel or hydraulic fluids are spilled.
There is to be no vehicle maintenance or refuelling on beach.
No mixing of concrete in the intertidal zone (the area that is above water level at low tide and underwater at high tide).
Regularly clean up concrete spilled during construction.
No dumping of construction materials, excess concrete or mortar in the intertidal and subtidal zones or on the seabed.
Ensure regular collection and removal of refuse and litter from intertidal areas.
Good housekeeping must form an integral part of any construction operations on the beach from start-up.
All onshore and offshore vehicles should have a spill kit (peatsorb/ drip trays) in the event of a spill to ensure that all accidental diesel and hydrocarbon spills are cleaned up accordingly.
After completion of construction activities remove all artificial constructions or created shore modifications from above and within the intertidal zone. No accumulations of excavated intertidal sediments should be left above the high water mark, and any substantial sediment accumulations below the high water mark should be levelled.
If these mitigation measures are implemented, all residual risk are considered As Low As
Reasonably Practicable (ALARP).
Table 8-19 Significance of Water/ Sediment Contamination and/ or Disturbance to Intertidal and Subtidal Biota
Characteristic Impact Residual Impact Extent Local Local Duration Medium-to-long-term Short-term Scale Medium Medium Likelihood Medium Low Consequence Moderate Moderate Sensitivity of the Resource/ Receptor Medium Medium Significance of Impact Moderate Minor (ALARP)
8.4.2 Collisions with Vessel and Entanglement with Equipment by Marine Fauna
Depending on the on-board equipment and types of ploughs used, prevailing sea conditions as well as the nature of the seabed, subsea cable vessels can surface lay 17 to 20 km of cable per day, with very modern ships and ploughs achieving up to 200 km of cable surface laying per day (www.independent.co.uk/science ).
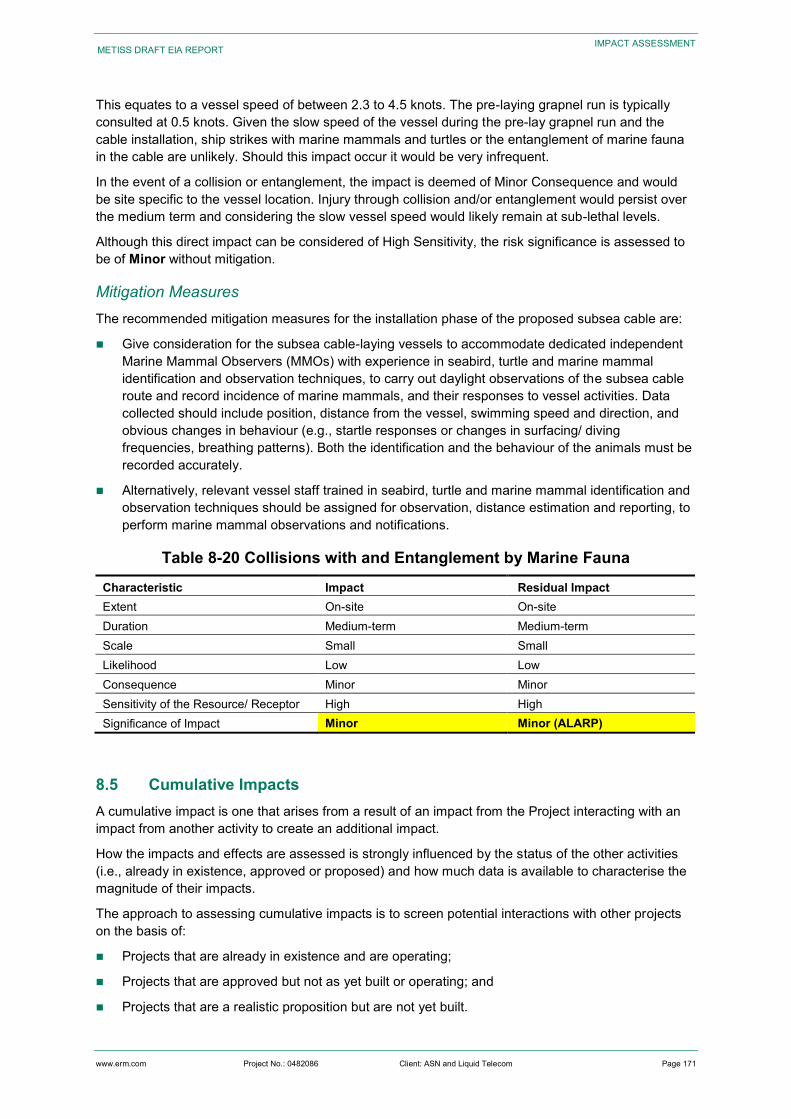
www.erm.com Project No.: 0482086 Client: ASN and Liquid Telecom Page 171
METISS DRAFT EIA REPORT
IMPACT ASSESSMENT
This equates to a vessel speed of between 2.3 to 4.5 knots. The pre-laying grapnel run is typically consulted at 0.5 knots. Given the slow speed of the vessel during the pre-lay grapnel run and the cable installation, ship strikes with marine mammals and turtles or the entanglement of marine fauna in the cable are unlikely. Should this impact occur it would be very infrequent.
In the event of a collision or entanglement, the impact is deemed of Minor Consequence and would be site specific to the vessel location. Injury through collision and/or entanglement would persist over the medium term and considering the slow vessel speed would likely remain at sub-lethal levels.
Although this direct impact can be considered of High Sensitivity, the risk significance is assessed to be of Minor without mitigation.
Mitigation Measures The recommended mitigation measures for the installation phase of the proposed subsea cable are:
Give consideration for the subsea cable-laying vessels to accommodate dedicated independent Marine Mammal Observers (MMOs) with experience in seabird, turtle and marine mammal identification and observation techniques, to carry out daylight observations of the subsea cable route and record incidence of marine mammals, and their responses to vessel activities. Data collected should include position, distance from the vessel, swimming speed and direction, and obvious changes in behaviour (e.g., startle responses or changes in surfacing/ diving frequencies, breathing patterns). Both the identification and the behaviour of the animals must be recorded accurately.
Alternatively, relevant vessel staff trained in seabird, turtle and marine mammal identification and observation techniques should be assigned for observation, distance estimation and reporting, to perform marine mammal observations and notifications.
Table 8-20 Collisions with and Entanglement by Marine Fauna
Characteristic Impact Residual Impact Extent On-site On-site Duration Medium-term Medium-term Scale Small Small Likelihood Low Low Consequence Minor Minor Sensitivity of the Resource/ Receptor High High Significance of Impact Minor Minor (ALARP)
8.5 Cumulative Impacts A cumulative impact is one that arises from a result of an impact from the Project interacting with an impact from another activity to create an additional impact.
How the impacts and effects are assessed is strongly influenced by the status of the other activities (i.e., already in existence, approved or proposed) and how much data is available to characterise the magnitude of their impacts.
The approach to assessing cumulative impacts is to screen potential interactions with other projects on the basis of:
Projects that are already in existence and are operating;
Projects that are approved but not as yet built or operating; and
Projects that are a realistic proposition but are not yet built.
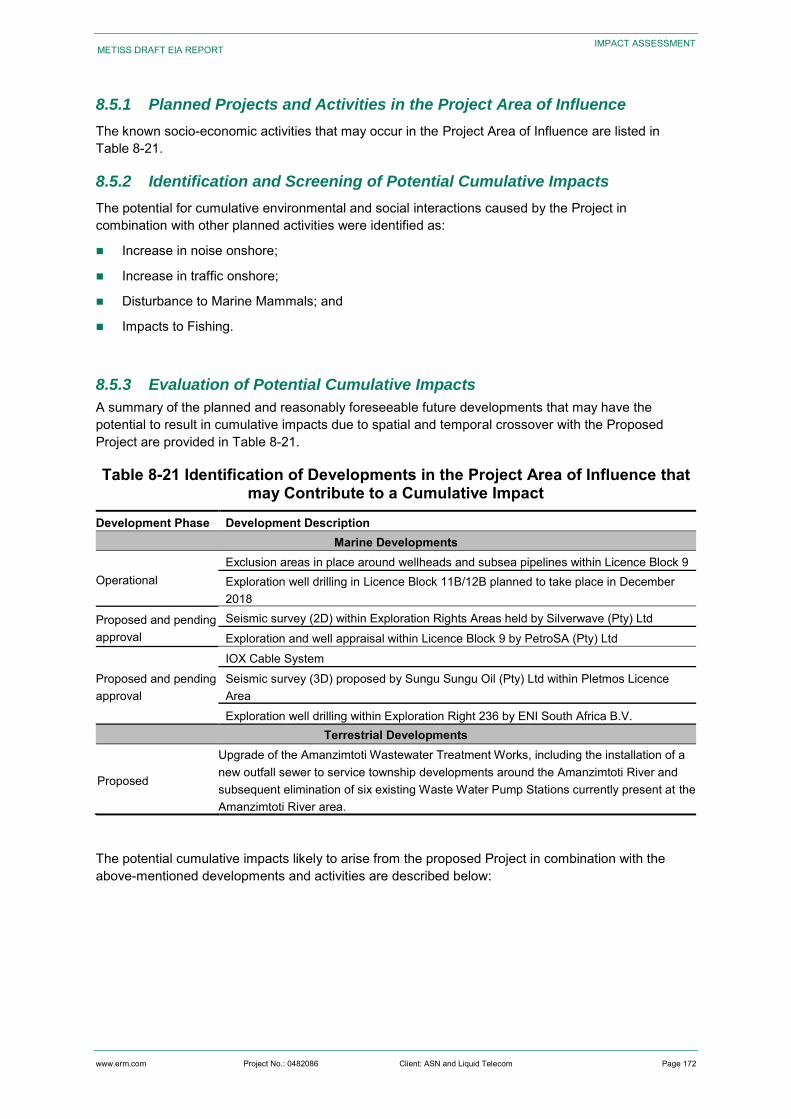
www.erm.com Project No.: 0482086 Client: ASN and Liquid Telecom Page 172
METISS DRAFT EIA REPORT
IMPACT ASSESSMENT
8.5.1 Planned Projects and Activities in the Project Area of Influence
The known socio-economic activities that may occur in the Project Area of Influence are listed in Table 8-21.
8.5.2 Identification and Screening of Potential Cumulative Impacts
The potential for cumulative environmental and social interactions caused by the Project in combination with other planned activities were identified as:
Increase in noise onshore;
Increase in traffic onshore;
Disturbance to Marine Mammals; and
Impacts to Fishing.
8.5.3 Evaluation of Potential Cumulative Impacts
A summary of the planned and reasonably foreseeable future developments that may have the potential to result in cumulative impacts due to spatial and temporal crossover with the Proposed Project are provided in Table 8-21.
Table 8-21 Identification of Developments in the Project Area of Influence that may Contribute to a Cumulative Impact
Development Phase Development Description Marine Developments
Operational Exclusion areas in place around wellheads and subsea pipelines within Licence Block 9 Exploration well drilling in Licence Block 11B/12B planned to take place in December 2018
Proposed and pending approval
Seismic survey (2D) within Exploration Rights Areas held by Silverwave (Pty) Ltd Exploration and well appraisal within Licence Block 9 by PetroSA (Pty) Ltd
Proposed and pending approval
IOX Cable System Seismic survey (3D) proposed by Sungu Sungu Oil (Pty) Ltd within Pletmos Licence Area Exploration well drilling within Exploration Right 236 by ENI South Africa B.V.
Terrestrial Developments
Proposed
Upgrade of the Amanzimtoti Wastewater Treatment Works, including the installation of a new outfall sewer to service township developments around the Amanzimtoti River and subsequent elimination of six existing Waste Water Pump Stations currently present at the Amanzimtoti River area.
The potential cumulative impacts likely to arise from the proposed Project in combination with the above-mentioned developments and activities are described below:
www.erm.com Project No.: 0482086 Client: ASN and Liquid Telecom Page 173
METISS DRAFT EIA REPORT
IMPACT ASSESSMENT
8.5.3.1 Increase in Noise Onshore The Direct Area of Influence is located in a residential area, which is relatively quiet at night. Noise impacts caused during the installation of the terrestrial cable and BMH will arise from construction vehicles and terrestrial cable laying machinery. These noise impacts will be temporary, as noise will only be generated during the construction period onshore (3.5 months). The machinery and vehicles will be well maintained and only operate during the day, Therefore, the addition of the Project activities’ to the cumulative levels of noise in the Direct Area of Influence will be of Minor Significance.
8.5.3.2 Increase in Traffic Onshore The Direct Area of Influence is located in a residential area with peak traffic in the morning and the evening commuting times. The traffic in the area also increases during the peak tourist season.
The increase in traffic volumes, as well as traffic disruptions from Project activities during terrestrial cable and BMH installation, in combination with traffic caused by other proposed developments will contribute to an increase in traffic within the Direct Area of Influence. These traffic impacts will be temporary, as traffic will only be generated during the construction period onshore (3.5 months). The vehicles will access the area during mon-peak traffic times and will adhere to the Traffic Management Plan (Appendix G). Therefore, the addition of the Project activities’ to the cumulative levels of traffic in the terrestrial Direct Area of Influence will be of Minor Significance.
8.5.3.3 Disturbance to Marine Mammals The sound level generated by the subsea cable laying vessel and subsea apparatus would fall within the hearing range of most fish and marine mammals and would be audible for considerable ranges before attenuating to below threshold levels. The underwater noise may, however, induce localised behavioural changes or masking of biologically relevant sounds in some marine fauna, but there is no evidence of significant behavioural changes that may impact on the wider ecosystem. Therefore, the addition of the Project activities’ to the cumulative levels of underwater noise in the marine Direct Area of Influence will be of Minor Significance.
8.5.3.4 Impact on Fishing The cumulative impact associated specifically with the preferred site affects the fishing industry that would be affected by the potential for an additional exclusion zone. This could be inconvenient for the fishermen and may have negative commercial consequences. From a purely environmental perspective, an additional exclusion zone does contribute to protection of marine resources, although the relatively narrow corridor to which the exclusion would apply would not make this positive impact particularly significant. The impact on the fishing industry needs to be weighed against the risks associated with the concentration of subsea cables at a single gateway (i.e. lack of redundancy in the event of subsea cable damage).
The cumulative impact of the current Project on affected fisheries sectors is not expected to increase the overall significance of cumulative impacts on any fisheries sectors and can be considered of Negligible Significance.
8.5.4 Mitigation Options for Cumulative Impacts
Proposed mitigation measures for the subsea installation activities as identified in the impact assessment above are adequate to mitigate any potential cumulative impacts from adjacent activities.
A Traffic Management Plan has been compiled and attached as Appendix G. This plan is intended to avoid and/ or minimise traffic risks and impacts on the health and safety of the local community and any personnel on site during the Project. No further mitigation measures are proposed.
000000 FL0
www.erm.com Project No.: 0482086 Client: ASN and Liquid Telecom Page 174
ENVIRONMENTAL MANAGEMENT PROGRAMME
9. ENVIRONMENTAL MANAGEMENT PROGRAMME
9.1 Introduction The aim of the Environmental Management Programme (EMPr) is to provide a set of guidelines and actions aimed at addressing potential environmental risks and impacts associated with the installation of the subsea cable and will be included in contract documentation between the METISS and their contractors (ASN, Elettra and Liquid Telecom). The EMPr also provides assurance to regulators that their requirements with respect to environmental and socio-economic performance will be met and provides a framework for compliance auditing and inspection programs. The requirements of the EMPr become legally binding upon the environmental authorisation of the Project.
9.2 Objectives The objectives of the EMPr are to:
Fulfil the requirements of South African EIA legislation;
Outline the appropriate avoidance and/or mitigation options to potential impacts, to ensure that impacts are minimised, after first establishing whether impacts cannot be avoided;
Provide an implementation mechanism for mitigation measures and commitments identified in the EIA Report;
Establish a monitoring programme and record-keeping protocol against which METISS and their contractor’s/sub-contractor’s performance can be measured and to allow for corrective actions or improvements to be implemented when needed; and
Provide protocols for dealing with unforeseen circumstances such as unplanned events or ineffective mitigation measures.
9.3 Contents of the Environmental Management Programme An EMPr needs to fulfil the requirements listed in section 24N of the Act of Environmental Impact Assessment (EIA) Regulations of 2017 (as amended).
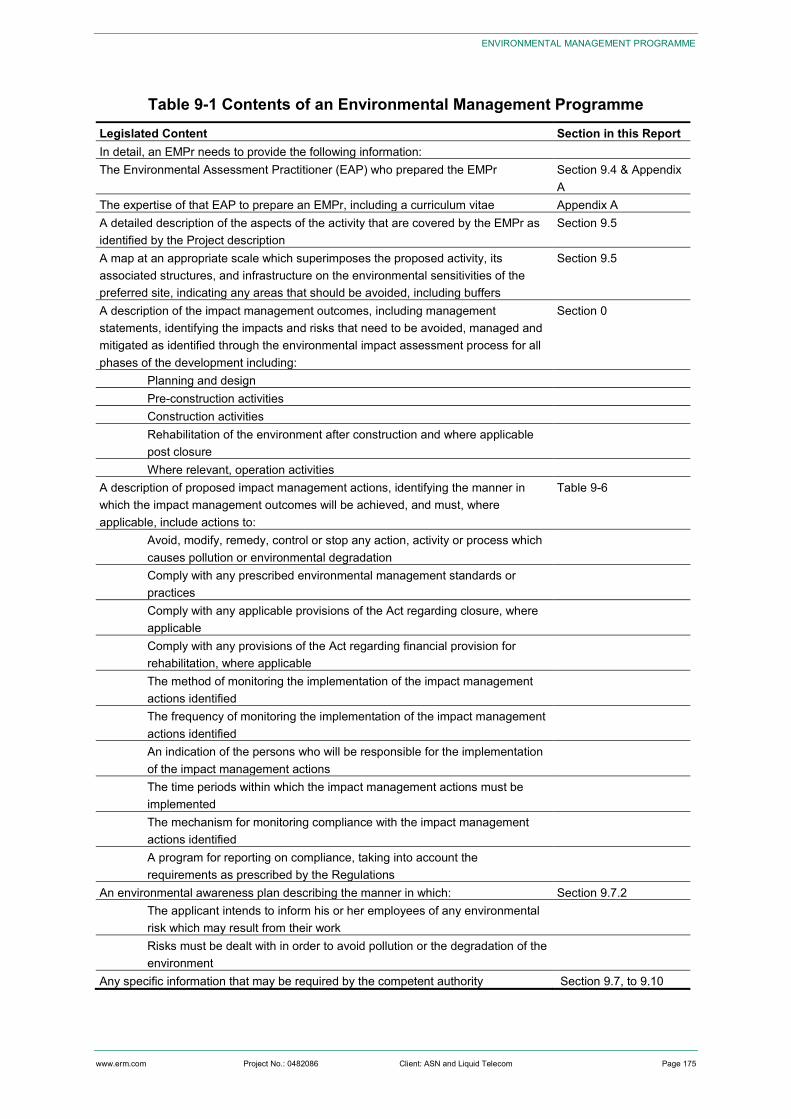
000000 FL0
www.erm.com Project No.: 0482086 Client: ASN and Liquid Telecom Page 175
ENVIRONMENTAL MANAGEMENT PROGRAMME
Table 9-1 Contents of an Environmental Management Programme
Legislated Content Section in this Report In detail, an EMPr needs to provide the following information: The Environmental Assessment Practitioner (EAP) who prepared the EMPr Section 9.4 & Appendix
A The expertise of that EAP to prepare an EMPr, including a curriculum vitae Appendix A A detailed description of the aspects of the activity that are covered by the EMPr as identified by the Project description
Section 9.5
A map at an appropriate scale which superimposes the proposed activity, its associated structures, and infrastructure on the environmental sensitivities of the preferred site, indicating any areas that should be avoided, including buffers
Section 9.5
A description of the impact management outcomes, including management statements, identifying the impacts and risks that need to be avoided, managed and mitigated as identified through the environmental impact assessment process for all phases of the development including:
Section 0
Planning and design Pre-construction activities Construction activities Rehabilitation of the environment after construction and where applicable post closure
Where relevant, operation activities A description of proposed impact management actions, identifying the manner in which the impact management outcomes will be achieved, and must, where applicable, include actions to:
Table 9-6
Avoid, modify, remedy, control or stop any action, activity or process which causes pollution or environmental degradation
Comply with any prescribed environmental management standards or practices
Comply with any applicable provisions of the Act regarding closure, where applicable
Comply with any provisions of the Act regarding financial provision for rehabilitation, where applicable
The method of monitoring the implementation of the impact management actions identified
The frequency of monitoring the implementation of the impact management actions identified
An indication of the persons who will be responsible for the implementation of the impact management actions
The time periods within which the impact management actions must be implemented
The mechanism for monitoring compliance with the impact management actions identified
A program for reporting on compliance, taking into account the requirements as prescribed by the Regulations
An environmental awareness plan describing the manner in which: Section 9.7.2 The applicant intends to inform his or her employees of any environmental risk which may result from their work
Risks must be dealt with in order to avoid pollution or the degradation of the environment
Any specific information that may be required by the competent authority Section 9.7, to 9.10
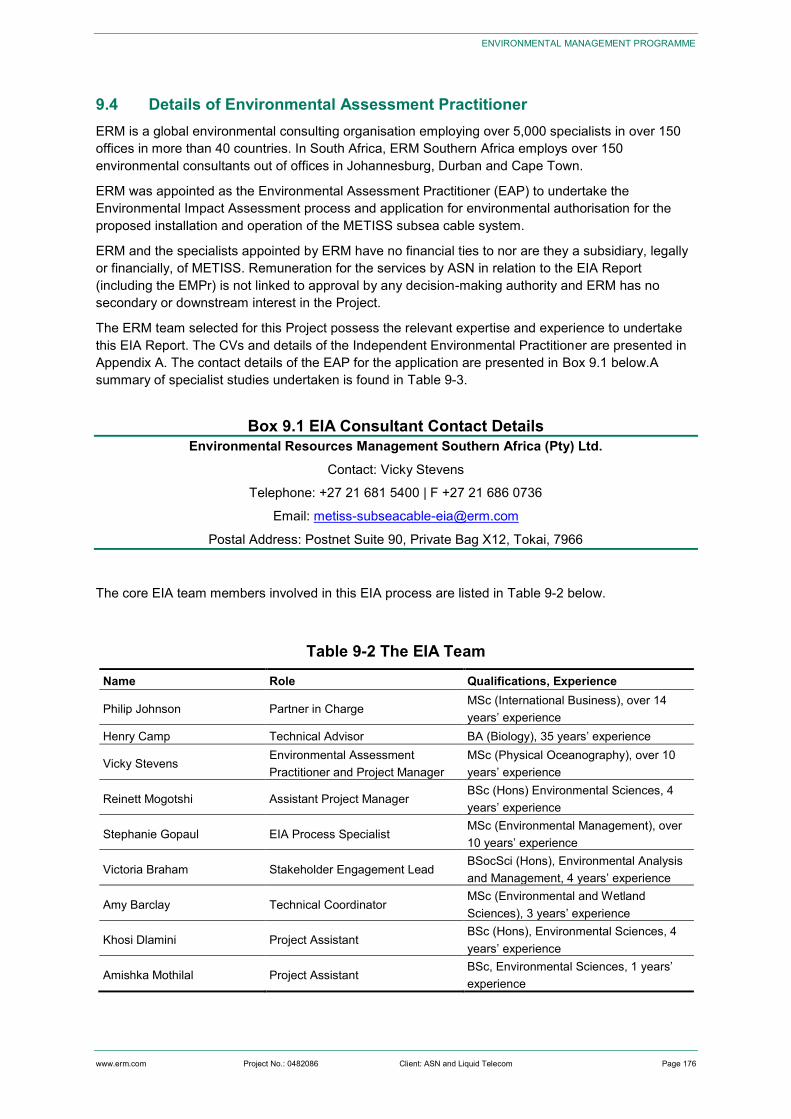
000000 FL0
www.erm.com Project No.: 0482086 Client: ASN and Liquid Telecom Page 176
ENVIRONMENTAL MANAGEMENT PROGRAMME
9.4 Details of Environmental Assessment Practitioner ERM is a global environmental consulting organisation employing over 5,000 specialists in over 150 offices in more than 40 countries. In South Africa, ERM Southern Africa employs over 150 environmental consultants out of offices in Johannesburg, Durban and Cape Town.
ERM was appointed as the Environmental Assessment Practitioner (EAP) to undertake the Environmental Impact Assessment process and application for environmental authorisation for the proposed installation and operation of the METISS subsea cable system.
ERM and the specialists appointed by ERM have no financial ties to nor are they a subsidiary, legally or financially, of METISS. Remuneration for the services by ASN in relation to the EIA Report (including the EMPr) is not linked to approval by any decision-making authority and ERM has no secondary or downstream interest in the Project.
The ERM team selected for this Project possess the relevant expertise and experience to undertake this EIA Report. The CVs and details of the Independent Environmental Practitioner are presented in Appendix A. The contact details of the EAP for the application are presented in Box 9.1 below.A summary of specialist studies undertaken is found in Table 9-3.
Box 9.1 EIA Consultant Contact Details
Environmental Resources Management Southern Africa (Pty) Ltd. Contact: Vicky Stevens
Telephone: +27 21 681 5400 | F +27 21 686 0736
Email: [email protected]
Postal Address: Postnet Suite 90, Private Bag X12, Tokai, 7966
The core EIA team members involved in this EIA process are listed in Table 9-2 below.
Table 9-2 The EIA Team Name Role Qualifications, Experience
Philip Johnson Partner in Charge MSc (International Business), over 14 years’ experience
Henry Camp Technical Advisor BA (Biology), 35 years’ experience
Vicky Stevens Environmental Assessment Practitioner and Project Manager
MSc (Physical Oceanography), over 10 years’ experience
Reinett Mogotshi Assistant Project Manager BSc (Hons) Environmental Sciences, 4 years’ experience
Stephanie Gopaul EIA Process Specialist MSc (Environmental Management), over 10 years’ experience
Victoria Braham Stakeholder Engagement Lead BSocSci (Hons), Environmental Analysis and Management, 4 years’ experience
Amy Barclay Technical Coordinator MSc (Environmental and Wetland Sciences), 3 years’ experience
Khosi Dlamini Project Assistant BSc (Hons), Environmental Sciences, 4 years’ experience
Amishka Mothilal Project Assistant BSc, Environmental Sciences, 1 years’ experience
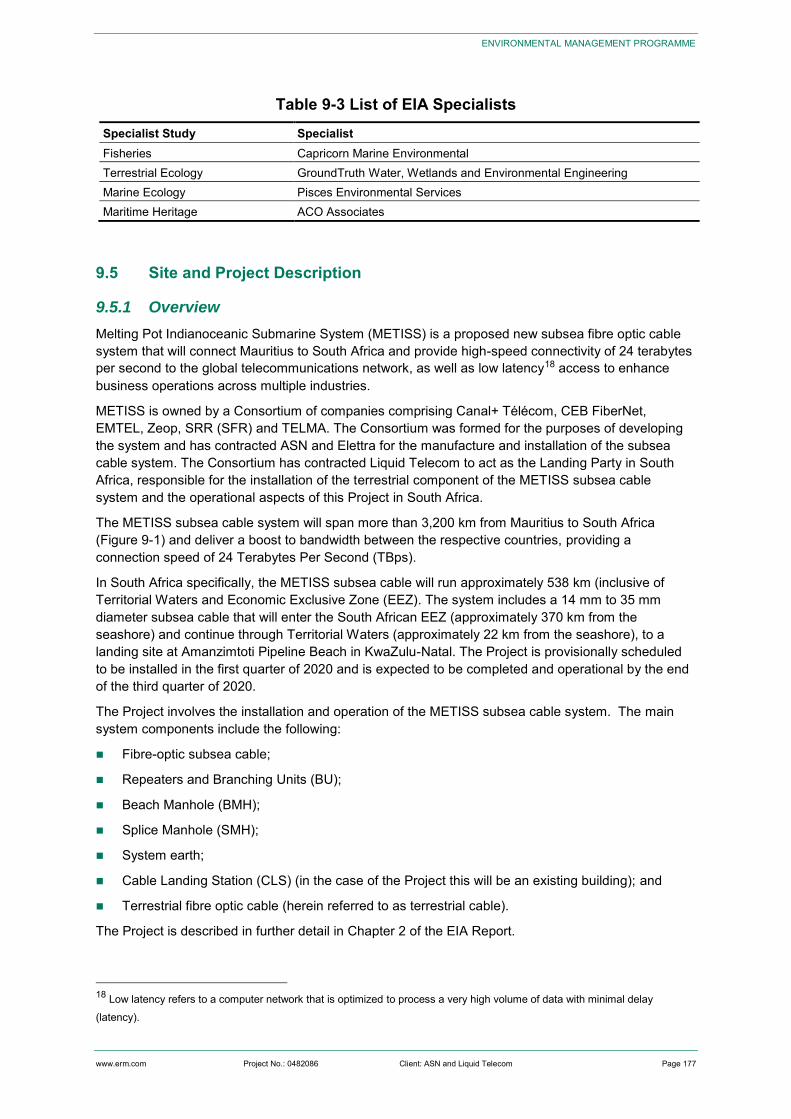
000000 FL0
www.erm.com Project No.: 0482086 Client: ASN and Liquid Telecom Page 177
ENVIRONMENTAL MANAGEMENT PROGRAMME
Table 9-3 List of EIA Specialists Specialist Study Specialist Fisheries Capricorn Marine Environmental Terrestrial Ecology GroundTruth Water, Wetlands and Environmental Engineering Marine Ecology Pisces Environmental Services Maritime Heritage ACO Associates
9.5 Site and Project Description
9.5.1 Overview
Melting Pot Indianoceanic Submarine System (METISS) is a proposed new subsea fibre optic cable system that will connect Mauritius to South Africa and provide high-speed connectivity of 24 terabytes per second to the global telecommunications network, as well as low latency18 access to enhance business operations across multiple industries.
METISS is owned by a Consortium of companies comprising Canal+ Télécom, CEB FiberNet, EMTEL, Zeop, SRR (SFR) and TELMA. The Consortium was formed for the purposes of developing the system and has contracted ASN and Elettra for the manufacture and installation of the subsea cable system. The Consortium has contracted Liquid Telecom to act as the Landing Party in South Africa, responsible for the installation of the terrestrial component of the METISS subsea cable system and the operational aspects of this Project in South Africa.
The METISS subsea cable system will span more than 3,200 km from Mauritius to South Africa (Figure 9-1) and deliver a boost to bandwidth between the respective countries, providing a connection speed of 24 Terabytes Per Second (TBps).
In South Africa specifically, the METISS subsea cable will run approximately 538 km (inclusive of Territorial Waters and Economic Exclusive Zone (EEZ). The system includes a 14 mm to 35 mm diameter subsea cable that will enter the South African EEZ (approximately 370 km from the seashore) and continue through Territorial Waters (approximately 22 km from the seashore), to a landing site at Amanzimtoti Pipeline Beach in KwaZulu-Natal. The Project is provisionally scheduled to be installed in the first quarter of 2020 and is expected to be completed and operational by the end of the third quarter of 2020.
The Project involves the installation and operation of the METISS subsea cable system. The main system components include the following:
Fibre-optic subsea cable;
Repeaters and Branching Units (BU);
Beach Manhole (BMH);
Splice Manhole (SMH);
System earth;
Cable Landing Station (CLS) (in the case of the Project this will be an existing building); and
Terrestrial fibre optic cable (herein referred to as terrestrial cable).
The Project is described in further detail in Chapter 2 of the EIA Report.
18 Low latency refers to a computer network that is optimized to process a very high volume of data with minimal delay (latency).
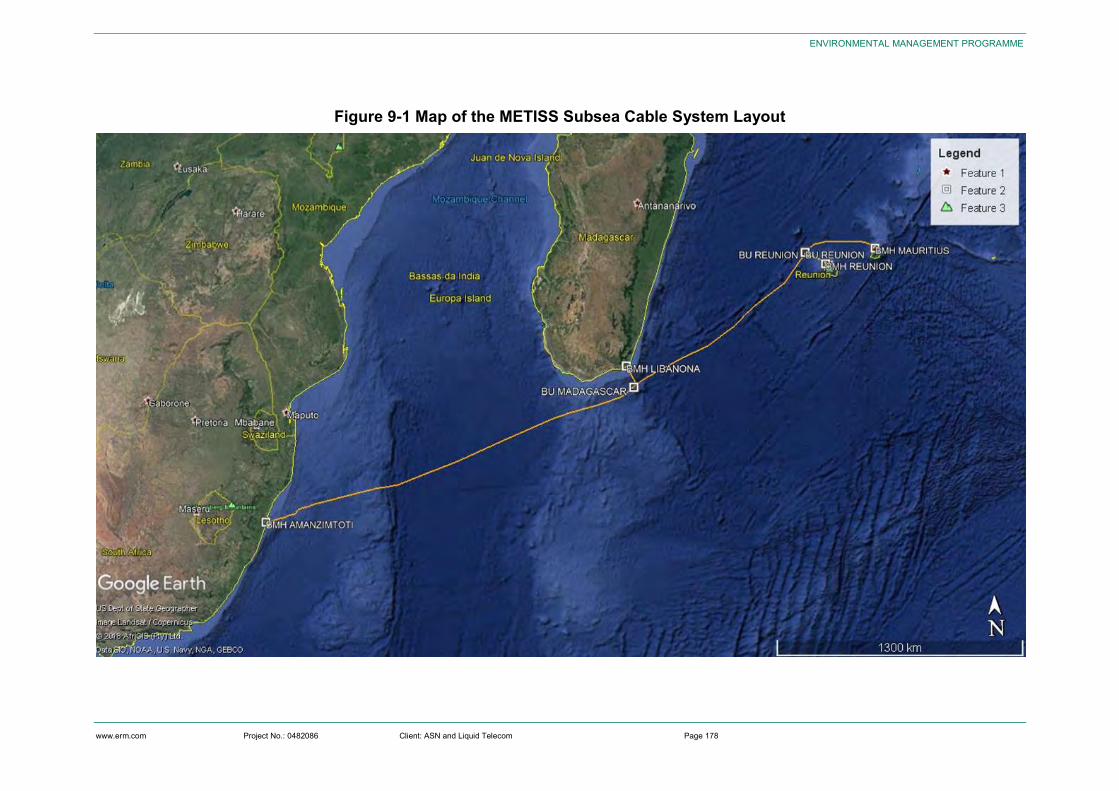
000000 FL0
www.erm.com Project No.: 0482086 Client: ASN and Liquid Telecom Page 178
ENVIRONMENTAL MANAGEMENT PROGRAMME
Figure 9-1 Map of the METISS Subsea Cable System Layout
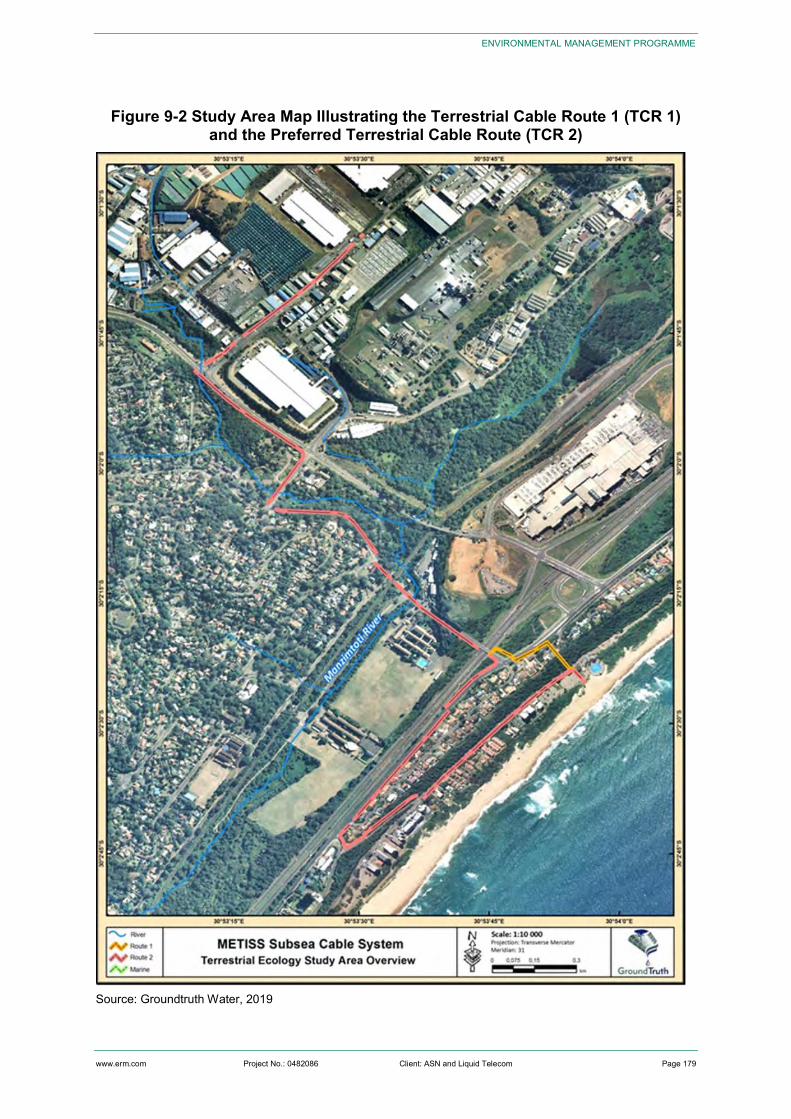
000000 FL0
www.erm.com Project No.: 0482086 Client: ASN and Liquid Telecom Page 179
ENVIRONMENTAL MANAGEMENT PROGRAMME
Figure 9-2 Study Area Map Illustrating the Terrestrial Cable Route 1 (TCR 1) and the Preferred Terrestrial Cable Route (TCR 2)
Source: Groundtruth Water, 2019
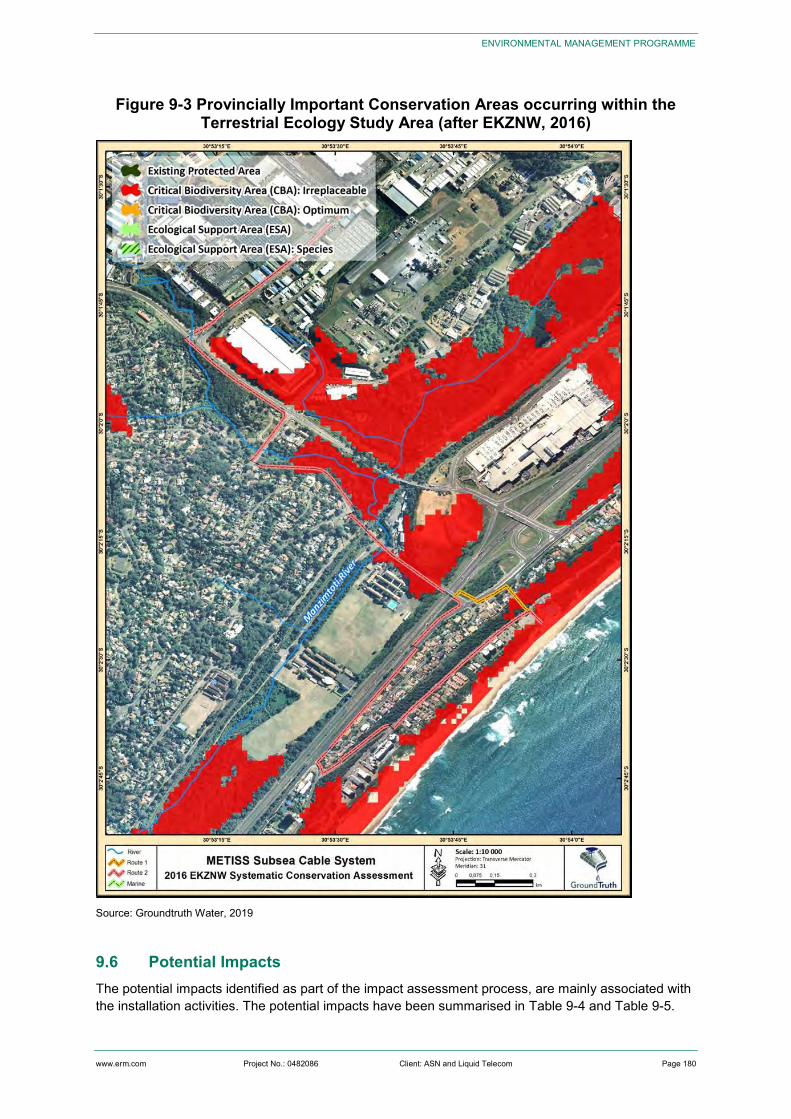
000000 FL0
www.erm.com Project No.: 0482086 Client: ASN and Liquid Telecom Page 180
ENVIRONMENTAL MANAGEMENT PROGRAMME
Figure 9-3 Provincially Important Conservation Areas occurring within the Terrestrial Ecology Study Area (after EKZNW, 2016)
Source: Groundtruth Water, 2019
9.6 Potential Impacts The potential impacts identified as part of the impact assessment process, are mainly associated with the installation activities. The potential impacts have been summarised in Table 9-4 and Table 9-5.
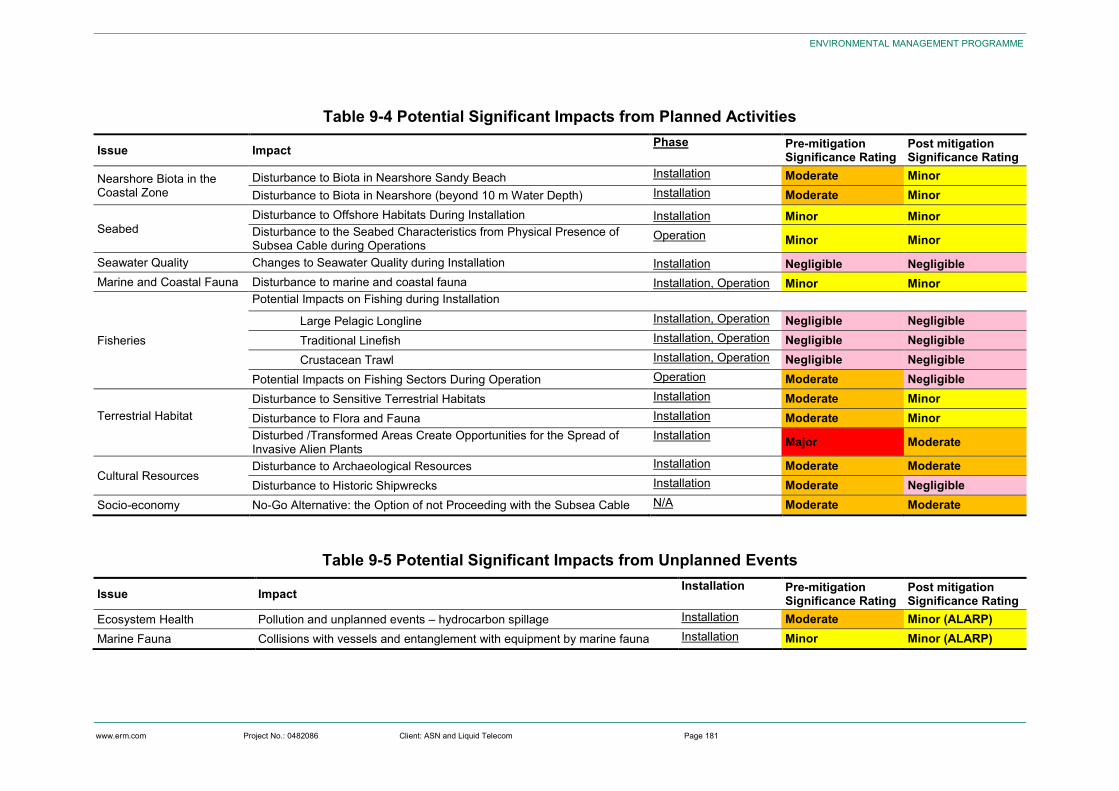
000000 FL0
www.erm.com Project No.: 0482086 Client: ASN and Liquid Telecom Page 181
ENVIRONMENTAL MANAGEMENT PROGRAMME
Table 9-4 Potential Significant Impacts from Planned Activities
Issue Impact Phase Pre-mitigation Significance Rating
Post mitigation Significance Rating
Nearshore Biota in the Coastal Zone
Disturbance to Biota in Nearshore Sandy Beach Installation Moderate Minor Disturbance to Biota in Nearshore (beyond 10 m Water Depth) Installation Moderate Minor
Seabed Disturbance to Offshore Habitats During Installation Installation Minor Minor Disturbance to the Seabed Characteristics from Physical Presence of Subsea Cable during Operations
Operation Minor Minor
Seawater Quality Changes to Seawater Quality during Installation Installation Negligible Negligible Marine and Coastal Fauna Disturbance to marine and coastal fauna Installation, Operation Minor Minor
Fisheries
Potential Impacts on Fishing during Installation
Large Pelagic Longline Installation, Operation Negligible Negligible Traditional Linefish Installation, Operation Negligible Negligible Crustacean Trawl Installation, Operation Negligible Negligible
Potential Impacts on Fishing Sectors During Operation Operation Moderate Negligible
Terrestrial Habitat
Disturbance to Sensitive Terrestrial Habitats Installation Moderate Minor Disturbance to Flora and Fauna Installation Moderate Minor Disturbed /Transformed Areas Create Opportunities for the Spread of Invasive Alien Plants
Installation Major Moderate
Cultural Resources Disturbance to Archaeological Resources Installation Moderate Moderate Disturbance to Historic Shipwrecks Installation Moderate Negligible
Socio-economy No-Go Alternative: the Option of not Proceeding with the Subsea Cable N/A Moderate Moderate
Table 9-5 Potential Significant Impacts from Unplanned Events
Issue Impact Installation Pre-mitigation Significance Rating
Post mitigation Significance Rating
Ecosystem Health Pollution and unplanned events – hydrocarbon spillage Installation Moderate Minor (ALARP) Marine Fauna Collisions with vessels and entanglement with equipment by marine fauna Installation Minor Minor (ALARP)
000000 FL0
www.erm.com Project No.: 0482086 Client: ASN and Liquid Telecom Page 182
ENVIRONMENTAL MANAGEMENT PROGRAMME
9.7 Implementation of Environmental Management Programme The EMPr details the mitigation measures, which must be implemented during the development of the proposed Project and assigns responsibilities for specific tasks. METISS shall ensure that a copy of the approved EMPr and associated approvals are supplied to the cable laying sub-contractors.
The EMPr is applicable to all work activities during the installation, operations and decommissioning phases of the proposed activities and is prepared in accordance with the requirements of Section 24(N) of the National Environmental Management Act, as amended (Act No. 107 of 1998).
9.7.1 Roles and Responsibilities
The following describes the parties that will carry out the requirements of the EMPr during the installation (including pre-installation) and operational phases.
METISS, ASN, Elettra and Liquid Telecom METISS is owned by a consortium of companies which were specifically formed for the purpose of developing the subsea cable system. This Consortium has contracted various companies to aid in developing the system from the manufacturing all through to operations.
ASN and Elettra were appointed to both manufacture and install the METISS subsea cable from Mauritius to South Africa. They will be responsible for the manufacturing and installation of the main trunk, including the Branching Units off the main trunk to the landing points at Reunion Island and Madagascar. Once the subsea cable reaches terrestrial land in South Africa, it becomes the responsibility of Liquid Telecom. As such, Liquid Telecom was contracted for the installation activities on terrestrial land including the BMH, SMH and the CLS. Further to this, Liquid Telecom is the operator of the cable and has been named the Project Proponent for this Project.
Once the Subsea Cable system has been installed, the operation and subsequent maintenance of the subsea cable system is the responsibility of METISS. It is important to note that both Liquid Telecom and ASN are sub contracted to METISS, and as such, either one may be contracted for the maintenance of the subsea cable system depending on their contract with METISS
The roles and responsibilities associated with the proposed Project Activities that fall within South African waters are elaborated on below.
CEO and Director The ultimate responsibility for the Project’s environmental performance lies with the CEO and Director of ASN and Elettra (during the installation phase within South African waters only) and Liquid Telecom (during installation, operation and decommissioning phases). This will involve ensuring that the Health, Safety and Environmental requirements are applied and that all requirements are met by terrestrial and vessel contractors engaged in installation activities; including monitoring the performance of these contractors as well as the overall Project. Environmental commitments will be incorporated into operational procedures, working practices and overall management procedures.
Environmental Control Officer An independent Environmental Control Officer (ECO) shall be appointed by Liquid Telecom to oversee the implementation of the EMPr, on a daily basis, where it is relevant to land-based activities during the installation (including pre-installation) phase. The ECO will form part of the Project team and attend Project meetings. The following points are to be implemented for the installation on terrestrial land:
000000 FL0
www.erm.com Project No.: 0482086 Client: ASN and Liquid Telecom Page 183
ENVIRONMENTAL MANAGEMENT PROGRAMME
The ECO shall accompany the terrestrial contractor on an initial site inspection of the onshore cable route and various manholes and inform the terrestrial contractor about sensitive areas and boundaries of the terrestrial cable route.
The ECO shall demarcate the linear development area for the terrestrial cable route and various manholes in conjunction with the terrestrial contractor. The boundaries will be designated by danger tape or temporary fencing.
The ECO will liaise with all other parties who have roles and responsibilities in relation to the implementation of the EMPr.
The ECO shall keep a record of communications with the terrestrial contractor, authorities, and any other external interested and affected parties.
The ECO will arrange an environmental briefing and training session with the terrestrial installation crew prior to the initiation of activities on site.
The ECO shall establish a communications protocol with the terrestrial contractor to ensure that ad hoc mitigation actions are effectively communicated to labourers and subcontractors.
The ECO will be present on the site daily during the initial clearing activities to ensure that plant species identified by the botanist are not damaged.
Following the initial clearing activities, the ECO will undertake regular site inspections during installation phase to ensure that the overall objectives of the mitigation actions are met. This shall be done by monitoring the implementation of these actions and by monitoring their success.
The ECO will produce site inspection reports following each site visit, and a closure audit report following the final site inspection on completion of the land-based installation activities.
The ECO will facilitate site inspections undertaken by the archaeologist and botanist.
Whilst the Project activities are taking place, the ECO shall have the power to stop the work at any time should the actions contained and agreed to in the EMPr not be followed.
Terrestrial Contractor During installation (including pre-installation), terrestrial contractors will be engaged to provide technical services and installation works associated with terrestrial burial of the cable and establishment of the various manholes (including the Beach Manhole). The responsibility is with the contractors to comply with all relevant legislation and adhere to all mitigation measures specified in the EMPr. The measures should be enforced by contractual obligation.
Vessel Contractor During pre-installation and installation, vessel contractors will be engaged to provide technical services and installation works associated with subsea cable installation. The responsibility is with the contractors to comply with all relevant legislation and adhere to all mitigation measures specified in the EMPr. The measures should be enforced by contractual obligation.
Marine Mammal Observer A Marine Mammal Observer/ trained vessel staff (with experience in seabird, turtle and marine mammal identification) will be appointed by ASN and Elettra to monitor marine fauna during subsea cable laying activities. The Marine Mammal Observer will be on-board the ship during the cable installation.
The Marine Mammal Observer will carry out daylight observations of the cable route and record incidence of marine mammals, and their responses to vessel activities.
000000 FL0
www.erm.com Project No.: 0482086 Client: ASN and Liquid Telecom Page 184
ENVIRONMENTAL MANAGEMENT PROGRAMME
Data collected should include position, distance from the vessel, swimming speed and direction, and obvious changes in behaviour (e.g. startle responses or changes in surfacing/diving frequencies, breathing patterns). Both the identification and the behaviour of the animals must be recorded accurately.
9.7.2 Environmental Awareness Training
Adequate training of employees and contractors with direct responsibility for activities relevant to the Project’s social and environmental performance is required so that they have the knowledge and skills necessary to perform their work, including implementation of the actions in the EMPr. The following awareness raising and training activities will be undertaken prior to and during the installation phase:
The ECO will undertake an onshore site walkover with the contractual team installing the terrestrial cable to identify and discuss sensitive areas, confirm demarcation boundaries and identify areas suitable for parking, offloading and temporary ablution facilities.
The ECO will hold a briefing session with the contractual team on environmental awareness, accommodation rules and worker code of conduct.
The ECO will have ad hoc conversations and reminders in response to observations made on site.
The ECO will hold mini-briefing sessions and as when required, i.e. if a new subcontractor is appointed or at key handover stages during the installation period.
Environmental awareness training for the marine contractors will be undertaken as part of the standard briefing prior to embarking. The areas covered in the briefing will be similar to those for the terrestrial works and will probably form part of the Pre-Lay Meeting which is an integral part of the pre-installation activity for any subsea cable landing. Such a meeting aims to coordinate the inputs of the shore-based and ship-based personnel.
The environmental briefing component of the meeting, led by the ECO, will focus on the following:
Familiarisation of all personnel with the key characteristics of the marine and shoreline environment.
Identification of ecological sensitivities in the shallow water zone and beach zone crossed by the shore crossing, and the measures to be taken to safeguard these resources during the cable landing operation. Measures to be taken by divers during cable inspection and post-lay burial operations will be particularly important.
Familiarisation of all personnel with the measures in place to manage relations with relevant stakeholders, including fishermen, owners of pleasure craft and recreational users of the beach.
9.7.3 Environmental Monitoring
Monitoring of the land based activities shall be undertaken during the Project pre-installation and installation activities to achieve the following:
Ensure that the EMPr is implemented;
Assess the efficiency of mitigation actions;
Provide information to permitting authorities; and
Provide information on environmental and social performance to affected stakeholders if and when required.
000000 FL0
www.erm.com Project No.: 0482086 Client: ASN and Liquid Telecom Page 185
ENVIRONMENTAL MANAGEMENT PROGRAMME
Monitoring of onshore activities will be undertaken by the ECO on a daily basis during site clearance activities and in accordance with a schedule agreed with the contractor thereafter. Ad hoc or unannounced inspections will also be undertaken. Where corrective actions are deemed necessary, specific instructions, specifying the designated responsibility and timing, shall be issued.
Monitoring of activities offshore will be undertaken by the Marine Mammal Observer on board. Such monitoring will be done on a daily basis and the Marine Mammal Observer will liaise directly with the ship captain regarding his observations and any necessary actions.
9.8 Specific Management Plans
9.8.1 Waste Management Plan
Offshore and onshore Waste Management Plan (WMP) will be developed before the Project commences. The WMP establishes the procedures adopted for the management of waste to be generated during the course of conducting offshore and onshore. It covers collection, storage, transport, disposal, discharge, reporting and data management.
The WMP will comply with applicable International Conventions for the Prevention of Pollution at Sea from Ships (MARPOL 73/78)19.
The following are key recommended measures for the Waste Management Plan Development:
Waste will be dealt by the installation contractors on either aquatic or terrestrial land in accordance with the waste hierarchy presented in Figure 2-26 below;
Suitably approved and fully licensed companies providing waste disposal services will be selected by review and evaluation in line with international good practice;
Waste tracking procedures will be defined in the WMP to provide traceability from source of generation to end point; and
Non-hazardous waste will be segregated and recycled where possible.
19 It is the understanding of ERM that a Waste Management Licence is not required.
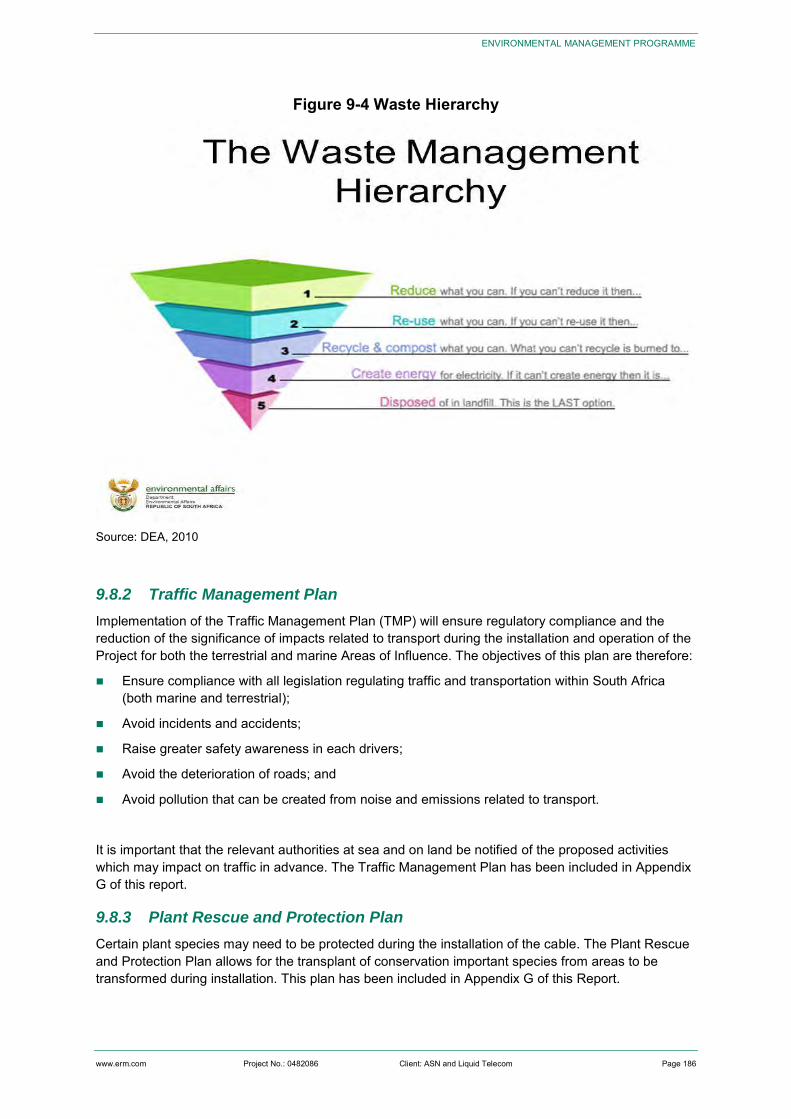
000000 FL0
www.erm.com Project No.: 0482086 Client: ASN and Liquid Telecom Page 186
ENVIRONMENTAL MANAGEMENT PROGRAMME
Figure 9-4 Waste Hierarchy
Source: DEA, 2010
9.8.2 Traffic Management Plan
Implementation of the Traffic Management Plan (TMP) will ensure regulatory compliance and the reduction of the significance of impacts related to transport during the installation and operation of the Project for both the terrestrial and marine Areas of Influence. The objectives of this plan are therefore:
Ensure compliance with all legislation regulating traffic and transportation within South Africa (both marine and terrestrial);
Avoid incidents and accidents;
Raise greater safety awareness in each drivers;
Avoid the deterioration of roads; and
Avoid pollution that can be created from noise and emissions related to transport.
It is important that the relevant authorities at sea and on land be notified of the proposed activities which may impact on traffic in advance. The Traffic Management Plan has been included in Appendix G of this report.
9.8.3 Plant Rescue and Protection Plan
Certain plant species may need to be protected during the installation of the cable. The Plant Rescue and Protection Plan allows for the transplant of conservation important species from areas to be transformed during installation. This plan has been included in Appendix G of this Report.
000000 FL0
www.erm.com Project No.: 0482086 Client: ASN and Liquid Telecom Page 187
ENVIRONMENTAL MANAGEMENT PROGRAMME
9.8.4 Re-vegetation and Habitat Rehabilitation Plan
Disturbance of terrestrial vegetation outside the actual development footprint is likely to be inevitable and will likely require rehabilitation post-installation where the vegetation and/ or soil surfaces have been damaged or disturbed. The purpose of this plan is to ensure that areas cleared or impacted during installation activities of the proposed activity are rehabilitated with a plant cover that reduces the risk of erosion from these areas as well as restores ecosystem function. The purpose of the rehabilitation at the site can be summarised as follows:
Achieve long-term stabilisation of all disturbed areas to minimise erosion potential;
Re-vegetate all disturbed areas with suitable local plant species;
Minimise visual impact of disturbed areas;
Ensure that disturbed areas are safe for future uses; and
The movement of people and vehicles within rehabilitated areas must be restricted and controlled.
The Re-vegetation and Habitat Rehabilitation plan also provides a framework for the management of alien and invasive plant species during the installation and operation of the Project using the finalised development layout. The broad objectives of the plan include the following:
Ensure alien plants do not become dominant in parts or the whole site through the control and management of alien and invasive species presence, dispersal and encroachment.
Initiate and implement a monitoring and eradication programme for alien and invasive species.
Promote the natural re-establishment and planting of indigenous species in order to retard erosion and alien plant invasion.
The Re-vegetation and Habitat Rehabilitation Plan has been included in Appendix G of this Report.
9.9 Environmental Management Programme Commitments Register This section details the specific management commitments to be implemented to prevent, minimise or manage significant negative impacts and optimise and maximise any potential benefits of the Project. These commitments are presented for the three Project phases; pre-installation, installation, operations and decommissioning phases.
This EMPr Commitments Register (Table 9-6) is structured in the following manner so that the mitigation measures have a clear and logical context within which they are designed, implemented, monitored and evaluated:
Aspects, potential impact or issue;
Objective;
Mitigation/ Management and Enhancement Commitments;
Responsibility;
Timing/ Frequency; and
Monitoring and Indicators.
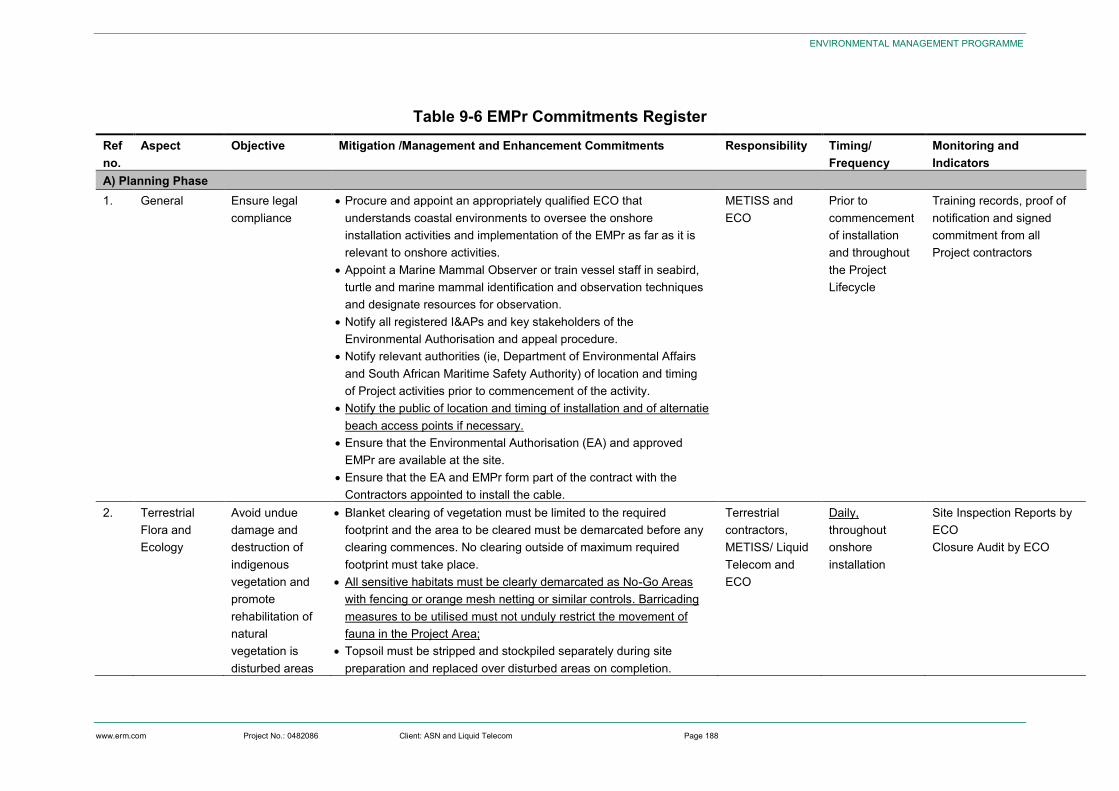
000000 FL0
www.erm.com Project No.: 0482086 Client: ASN and Liquid Telecom Page 188
ENVIRONMENTAL MANAGEMENT PROGRAMME
Table 9-6 EMPr Commitments Register Ref no.
Aspect Objective Mitigation /Management and Enhancement Commitments Responsibility Timing/ Frequency
Monitoring and Indicators
A) Planning Phase 1. General Ensure legal
compliance Procure and appoint an appropriately qualified ECO that
understands coastal environments to oversee the onshore installation activities and implementation of the EMPr as far as it is relevant to onshore activities.
Appoint a Marine Mammal Observer or train vessel staff in seabird, turtle and marine mammal identification and observation techniques and designate resources for observation.
Notify all registered I&APs and key stakeholders of the Environmental Authorisation and appeal procedure.
Notify relevant authorities (ie, Department of Environmental Affairs and South African Maritime Safety Authority) of location and timing of Project activities prior to commencement of the activity.
Notify the public of location and timing of installation and of alternatie beach access points if necessary.
Ensure that the Environmental Authorisation (EA) and approved EMPr are available at the site.
Ensure that the EA and EMPr form part of the contract with the Contractors appointed to install the cable.
METISS and ECO
Prior to commencement of installation and throughout the Project Lifecycle
Training records, proof of notification and signed commitment from all Project contractors
2. 2 Terrestrial Flora and Ecology
Avoid undue damage and destruction of indigenous vegetation and promote rehabilitation of natural vegetation is disturbed areas
Blanket clearing of vegetation must be limited to the required footprint and the area to be cleared must be demarcated before any clearing commences. No clearing outside of maximum required footprint must take place.
All sensitive habitats must be clearly demarcated as No-Go Areas with fencing or orange mesh netting or similar controls. Barricading measures to be utilised must not unduly restrict the movement of fauna in the Project Area;
Topsoil must be stripped and stockpiled separately during site preparation and replaced over disturbed areas on completion.
Terrestrial contractors, METISS/ Liquid Telecom and ECO
Daily, throughout onshore installation
Site Inspection Reports by ECO Closure Audit by ECO
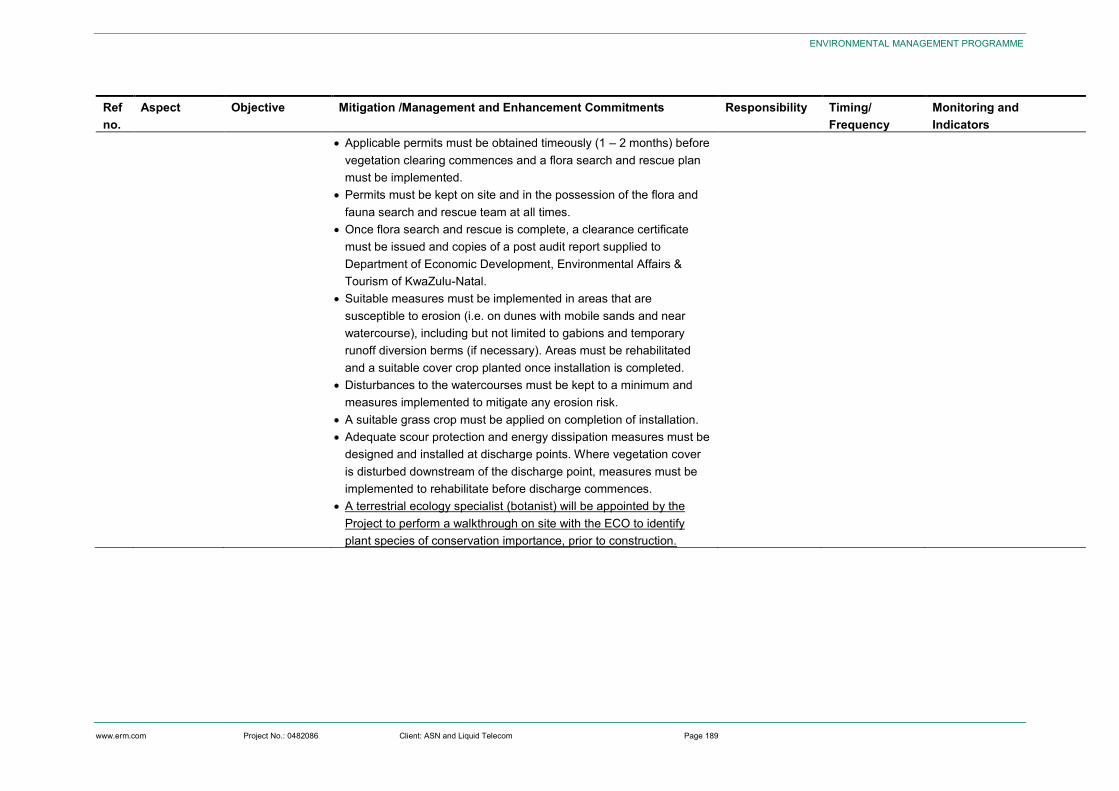
000000 FL0
www.erm.com Project No.: 0482086 Client: ASN and Liquid Telecom Page 189
ENVIRONMENTAL MANAGEMENT PROGRAMME
Ref no.
Aspect Objective Mitigation /Management and Enhancement Commitments Responsibility Timing/ Frequency
Monitoring and Indicators
Applicable permits must be obtained timeously (1 – 2 months) before vegetation clearing commences and a flora search and rescue plan must be implemented.
Permits must be kept on site and in the possession of the flora and fauna search and rescue team at all times.
Once flora search and rescue is complete, a clearance certificate must be issued and copies of a post audit report supplied to Department of Economic Development, Environmental Affairs & Tourism of KwaZulu-Natal.
Suitable measures must be implemented in areas that are susceptible to erosion (i.e. on dunes with mobile sands and near watercourse), including but not limited to gabions and temporary runoff diversion berms (if necessary). Areas must be rehabilitated and a suitable cover crop planted once installation is completed.
Disturbances to the watercourses must be kept to a minimum and measures implemented to mitigate any erosion risk.
A suitable grass crop must be applied on completion of installation. Adequate scour protection and energy dissipation measures must be
designed and installed at discharge points. Where vegetation cover is disturbed downstream of the discharge point, measures must be implemented to rehabilitate before discharge commences.
A terrestrial ecology specialist (botanist) will be appointed by the Project to perform a walkthrough on site with the ECO to identify plant species of conservation importance, prior to construction.
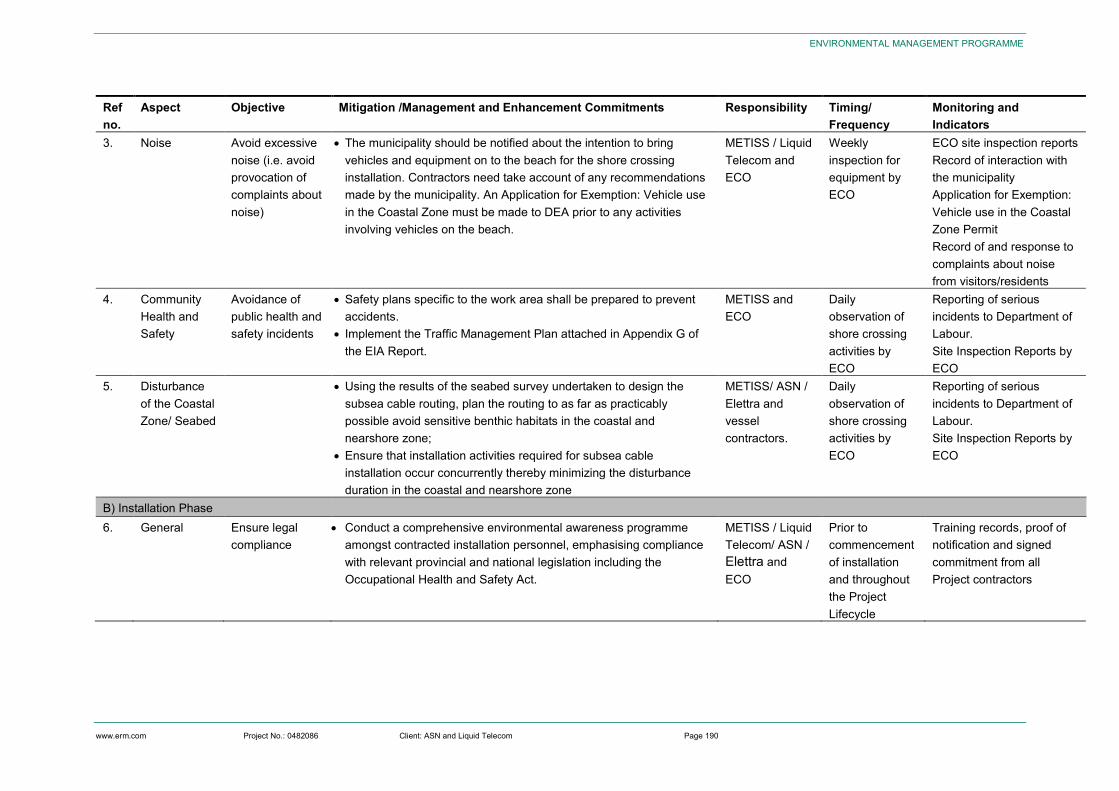
000000 FL0
www.erm.com Project No.: 0482086 Client: ASN and Liquid Telecom Page 190
ENVIRONMENTAL MANAGEMENT PROGRAMME
Ref no.
Aspect Objective Mitigation /Management and Enhancement Commitments Responsibility Timing/ Frequency
Monitoring and Indicators
3. Noise Avoid excessive noise (i.e. avoid provocation of complaints about noise)
The municipality should be notified about the intention to bring vehicles and equipment on to the beach for the shore crossing installation. Contractors need take account of any recommendations made by the municipality. An Application for Exemption: Vehicle use in the Coastal Zone must be made to DEA prior to any activities involving vehicles on the beach.
METISS / Liquid Telecom and ECO
Weekly inspection for equipment by ECO
ECO site inspection reports Record of interaction with the municipality Application for Exemption: Vehicle use in the Coastal Zone Permit Record of and response to complaints about noise from visitors/residents
4. Community Health and Safety
Avoidance of public health and safety incidents
Safety plans specific to the work area shall be prepared to prevent accidents.
Implement the Traffic Management Plan attached in Appendix G of the EIA Report.
METISS and ECO
Daily observation of shore crossing activities by ECO
Reporting of serious incidents to Department of Labour. Site Inspection Reports by ECO
5. Disturbance of the Coastal Zone/ Seabed
Using the results of the seabed survey undertaken to design the subsea cable routing, plan the routing to as far as practicably possible avoid sensitive benthic habitats in the coastal and nearshore zone;
Ensure that installation activities required for subsea cable installation occur concurrently thereby minimizing the disturbance duration in the coastal and nearshore zone
METISS/ ASN / Elettra and vessel contractors.
Daily observation of shore crossing activities by ECO
Reporting of serious incidents to Department of Labour. Site Inspection Reports by ECO
B) Installation Phase 6. General Ensure legal
compliance Conduct a comprehensive environmental awareness programme
amongst contracted installation personnel, emphasising compliance with relevant provincial and national legislation including the Occupational Health and Safety Act.
METISS / Liquid Telecom/ ASN / Elettra and ECO
Prior to commencement of installation and throughout the Project Lifecycle
Training records, proof of notification and signed commitment from all Project contractors
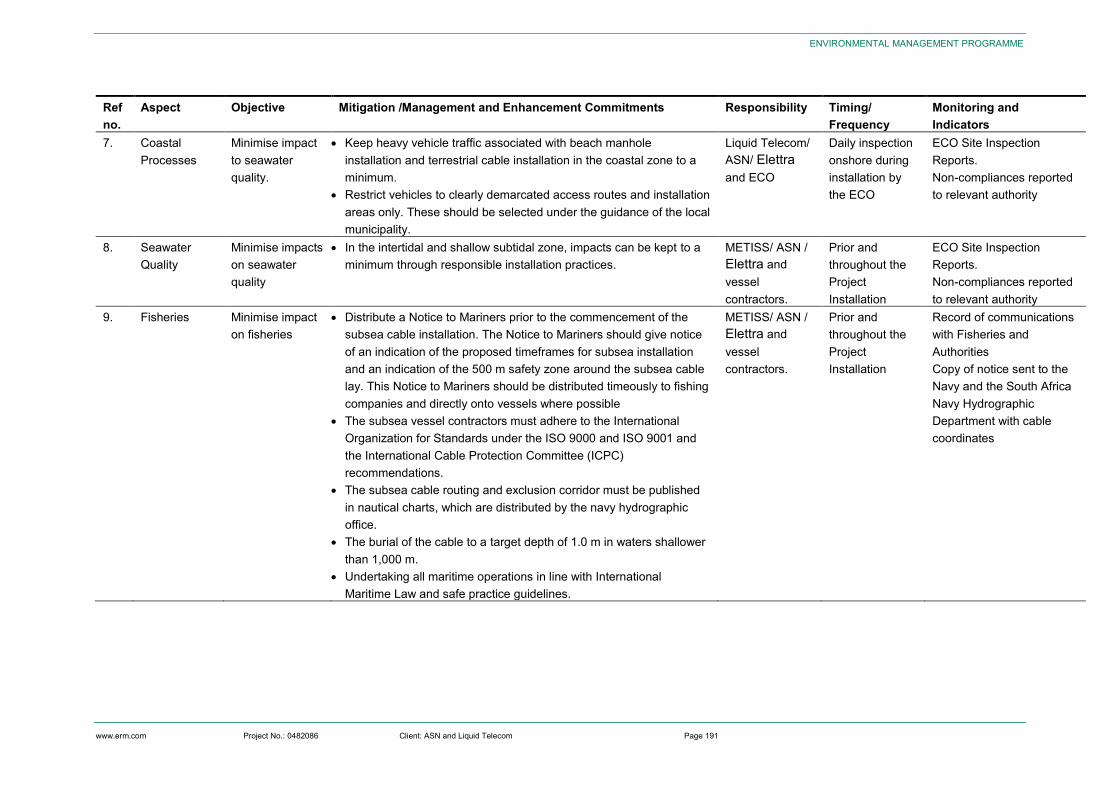
000000 FL0
www.erm.com Project No.: 0482086 Client: ASN and Liquid Telecom Page 191
ENVIRONMENTAL MANAGEMENT PROGRAMME
Ref no.
Aspect Objective Mitigation /Management and Enhancement Commitments Responsibility Timing/ Frequency
Monitoring and Indicators
7. Coastal Processes
Minimise impact to seawater quality.
Keep heavy vehicle traffic associated with beach manhole installation and terrestrial cable installation in the coastal zone to a minimum.
Restrict vehicles to clearly demarcated access routes and installation areas only. These should be selected under the guidance of the local municipality.
Liquid Telecom/ ASN/ Elettra and ECO
Daily inspection onshore during installation by the ECO
ECO Site Inspection Reports. Non-compliances reported to relevant authority
8. Seawater Quality
Minimise impacts on seawater quality
In the intertidal and shallow subtidal zone, impacts can be kept to a minimum through responsible installation practices.
METISS/ ASN / Elettra and vessel contractors.
Prior and throughout the Project Installation
ECO Site Inspection Reports. Non-compliances reported to relevant authority
9. Fisheries Minimise impact on fisheries
Distribute a Notice to Mariners prior to the commencement of the subsea cable installation. The Notice to Mariners should give notice of an indication of the proposed timeframes for subsea installation and an indication of the 500 m safety zone around the subsea cable lay. This Notice to Mariners should be distributed timeously to fishing companies and directly onto vessels where possible
The subsea vessel contractors must adhere to the International Organization for Standards under the ISO 9000 and ISO 9001 and the International Cable Protection Committee (ICPC) recommendations.
The subsea cable routing and exclusion corridor must be published in nautical charts, which are distributed by the navy hydrographic office.
The burial of the cable to a target depth of 1.0 m in waters shallower than 1,000 m.
Undertaking all maritime operations in line with International Maritime Law and safe practice guidelines.
METISS/ ASN / Elettra and vessel contractors.
Prior and throughout the Project Installation
Record of communications with Fisheries and Authorities Copy of notice sent to the Navy and the South Africa Navy Hydrographic Department with cable coordinates
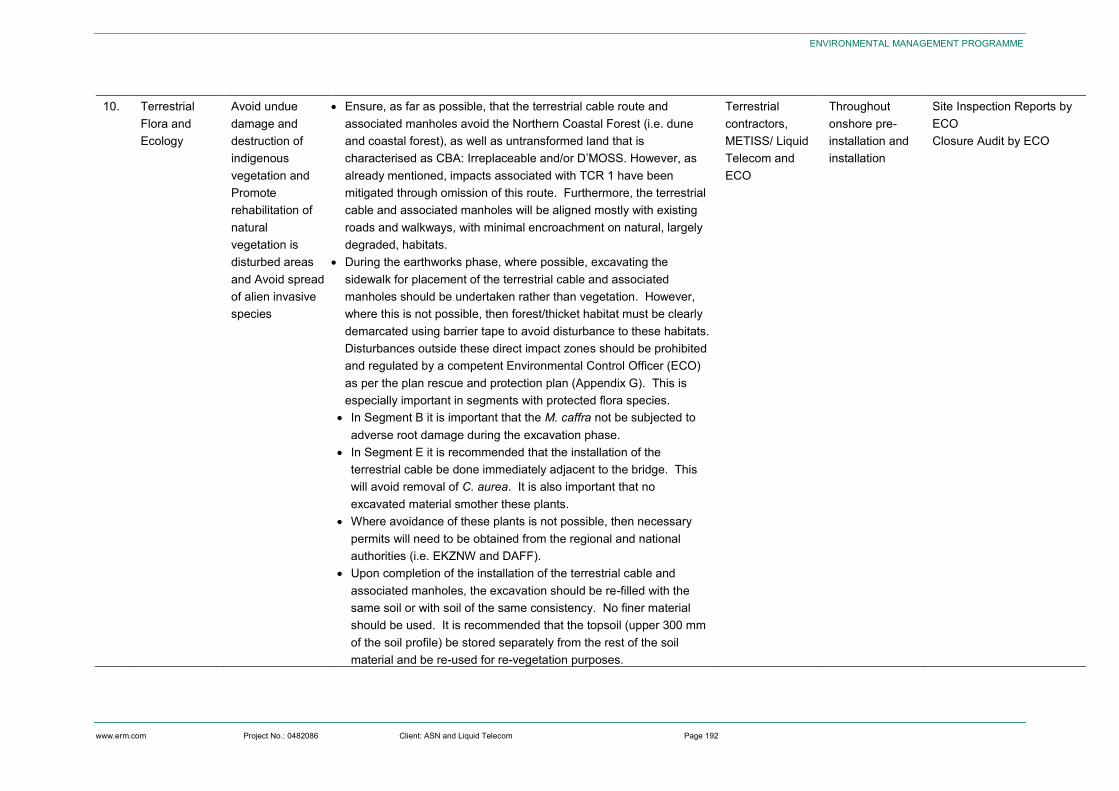
000000 FL0
www.erm.com Project No.: 0482086 Client: ASN and Liquid Telecom Page 192
ENVIRONMENTAL MANAGEMENT PROGRAMME
10. Terrestrial Flora and Ecology
Avoid undue damage and destruction of indigenous vegetation and Promote rehabilitation of natural vegetation is disturbed areas and Avoid spread of alien invasive species
Ensure, as far as possible, that the terrestrial cable route and associated manholes avoid the Northern Coastal Forest (i.e. dune and coastal forest), as well as untransformed land that is characterised as CBA: Irreplaceable and/or D’MOSS. However, as already mentioned, impacts associated with TCR 1 have been mitigated through omission of this route. Furthermore, the terrestrial cable and associated manholes will be aligned mostly with existing roads and walkways, with minimal encroachment on natural, largely degraded, habitats.
During the earthworks phase, where possible, excavating the sidewalk for placement of the terrestrial cable and associated manholes should be undertaken rather than vegetation. However, where this is not possible, then forest/thicket habitat must be clearly demarcated using barrier tape to avoid disturbance to these habitats. Disturbances outside these direct impact zones should be prohibited and regulated by a competent Environmental Control Officer (ECO) as per the plan rescue and protection plan (Appendix G). This is especially important in segments with protected flora species.
In Segment B it is important that the M. caffra not be subjected to adverse root damage during the excavation phase.
In Segment E it is recommended that the installation of the terrestrial cable be done immediately adjacent to the bridge. This will avoid removal of C. aurea. It is also important that no excavated material smother these plants.
Where avoidance of these plants is not possible, then necessary permits will need to be obtained from the regional and national authorities (i.e. EKZNW and DAFF).
Upon completion of the installation of the terrestrial cable and associated manholes, the excavation should be re-filled with the same soil or with soil of the same consistency. No finer material should be used. It is recommended that the topsoil (upper 300 mm of the soil profile) be stored separately from the rest of the soil material and be re-used for re-vegetation purposes.
Terrestrial contractors, METISS/ Liquid Telecom and ECO
Throughout onshore pre-installation and installation
Site Inspection Reports by ECO Closure Audit by ECO
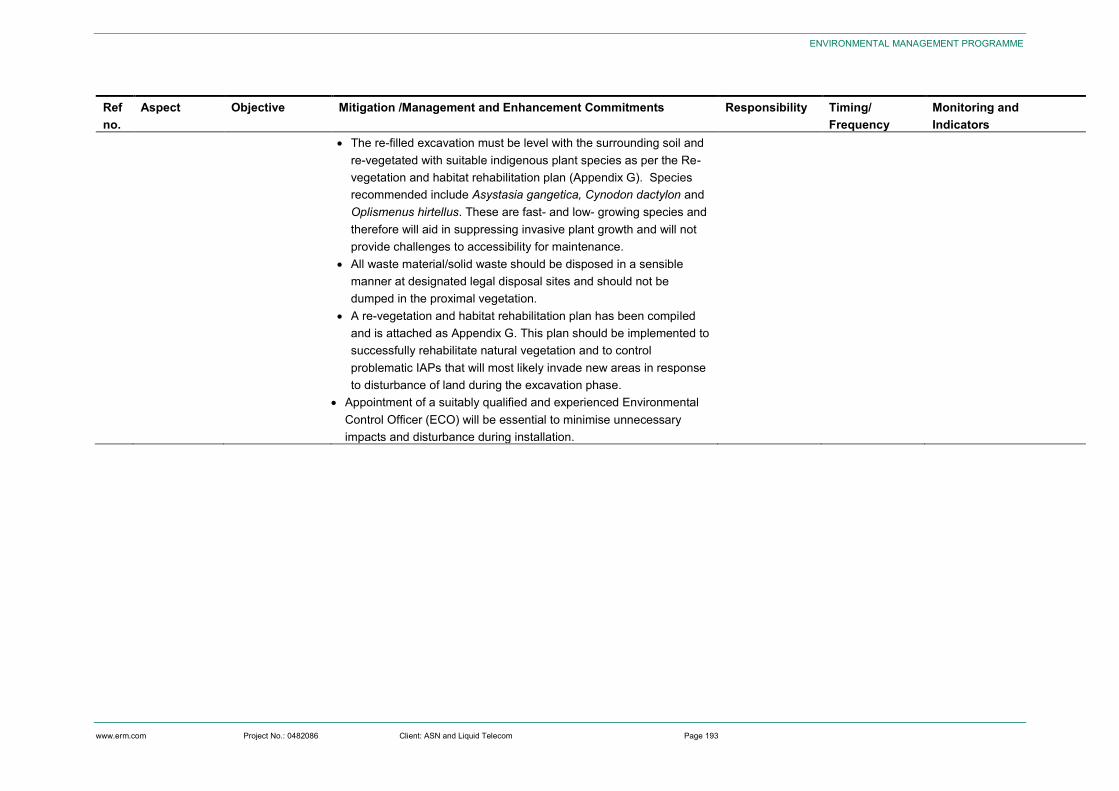
000000 FL0
www.erm.com Project No.: 0482086 Client: ASN and Liquid Telecom Page 193
ENVIRONMENTAL MANAGEMENT PROGRAMME
Ref no.
Aspect Objective Mitigation /Management and Enhancement Commitments Responsibility Timing/ Frequency
Monitoring and Indicators
The re-filled excavation must be level with the surrounding soil and re-vegetated with suitable indigenous plant species as per the Re-vegetation and habitat rehabilitation plan (Appendix G). Species recommended include Asystasia gangetica, Cynodon dactylon and Oplismenus hirtellus. These are fast- and low- growing species and therefore will aid in suppressing invasive plant growth and will not provide challenges to accessibility for maintenance.
All waste material/solid waste should be disposed in a sensible manner at designated legal disposal sites and should not be dumped in the proximal vegetation.
A re-vegetation and habitat rehabilitation plan has been compiled and is attached as Appendix G. This plan should be implemented to successfully rehabilitate natural vegetation and to control problematic IAPs that will most likely invade new areas in response to disturbance of land during the excavation phase.
Appointment of a suitably qualified and experienced Environmental Control Officer (ECO) will be essential to minimise unnecessary impacts and disturbance during installation.
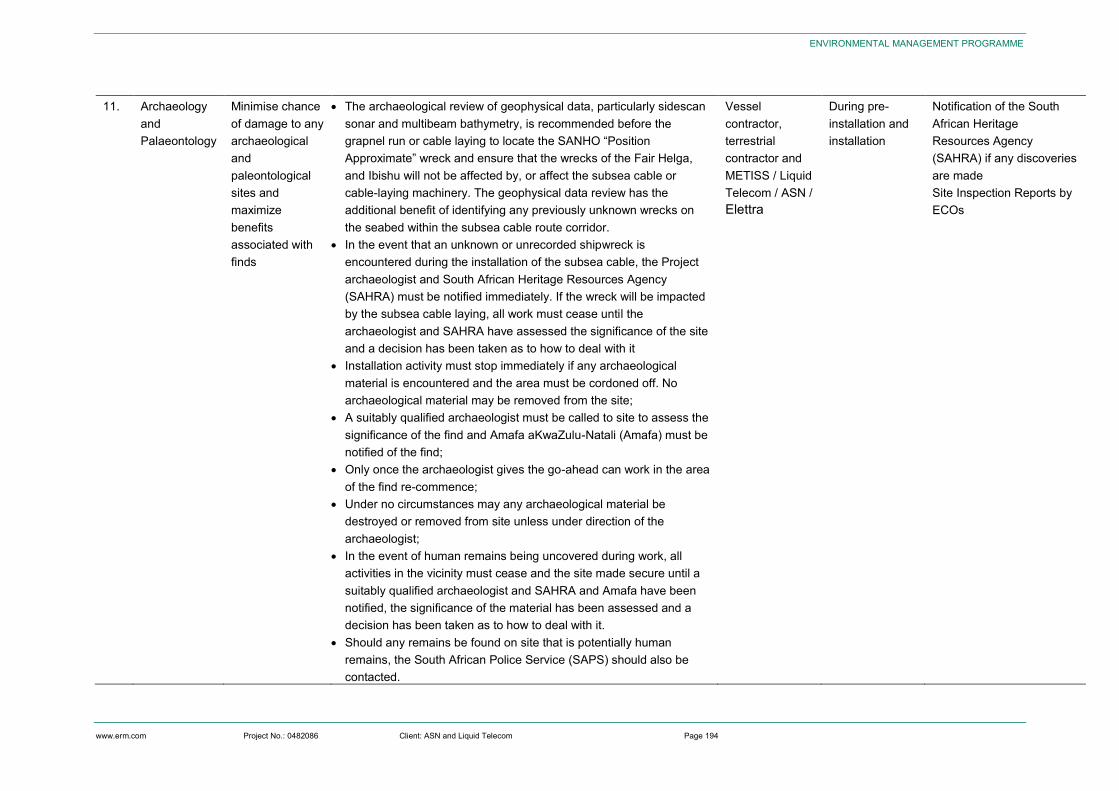
000000 FL0
www.erm.com Project No.: 0482086 Client: ASN and Liquid Telecom Page 194
ENVIRONMENTAL MANAGEMENT PROGRAMME
11. Archaeology and Palaeontology
Minimise chance of damage to any archaeological and paleontological sites and maximize benefits associated with finds
The archaeological review of geophysical data, particularly sidescan sonar and multibeam bathymetry, is recommended before the grapnel run or cable laying to locate the SANHO “Position Approximate” wreck and ensure that the wrecks of the Fair Helga, and Ibishu will not be affected by, or affect the subsea cable or cable-laying machinery. The geophysical data review has the additional benefit of identifying any previously unknown wrecks on the seabed within the subsea cable route corridor.
In the event that an unknown or unrecorded shipwreck is encountered during the installation of the subsea cable, the Project archaeologist and South African Heritage Resources Agency (SAHRA) must be notified immediately. If the wreck will be impacted by the subsea cable laying, all work must cease until the archaeologist and SAHRA have assessed the significance of the site and a decision has been taken as to how to deal with it
Installation activity must stop immediately if any archaeological material is encountered and the area must be cordoned off. No archaeological material may be removed from the site;
A suitably qualified archaeologist must be called to site to assess the significance of the find and Amafa aKwaZulu-Natali (Amafa) must be notified of the find;
Only once the archaeologist gives the go-ahead can work in the area of the find re-commence;
Under no circumstances may any archaeological material be destroyed or removed from site unless under direction of the archaeologist;
In the event of human remains being uncovered during work, all activities in the vicinity must cease and the site made secure until a suitably qualified archaeologist and SAHRA and Amafa have been notified, the significance of the material has been assessed and a decision has been taken as to how to deal with it.
Should any remains be found on site that is potentially human remains, the South African Police Service (SAPS) should also be contacted.
Vessel contractor, terrestrial contractor and METISS / Liquid Telecom / ASN / Elettra
During pre-installation and installation
Notification of the South African Heritage Resources Agency (SAHRA) if any discoveries are made Site Inspection Reports by ECOs
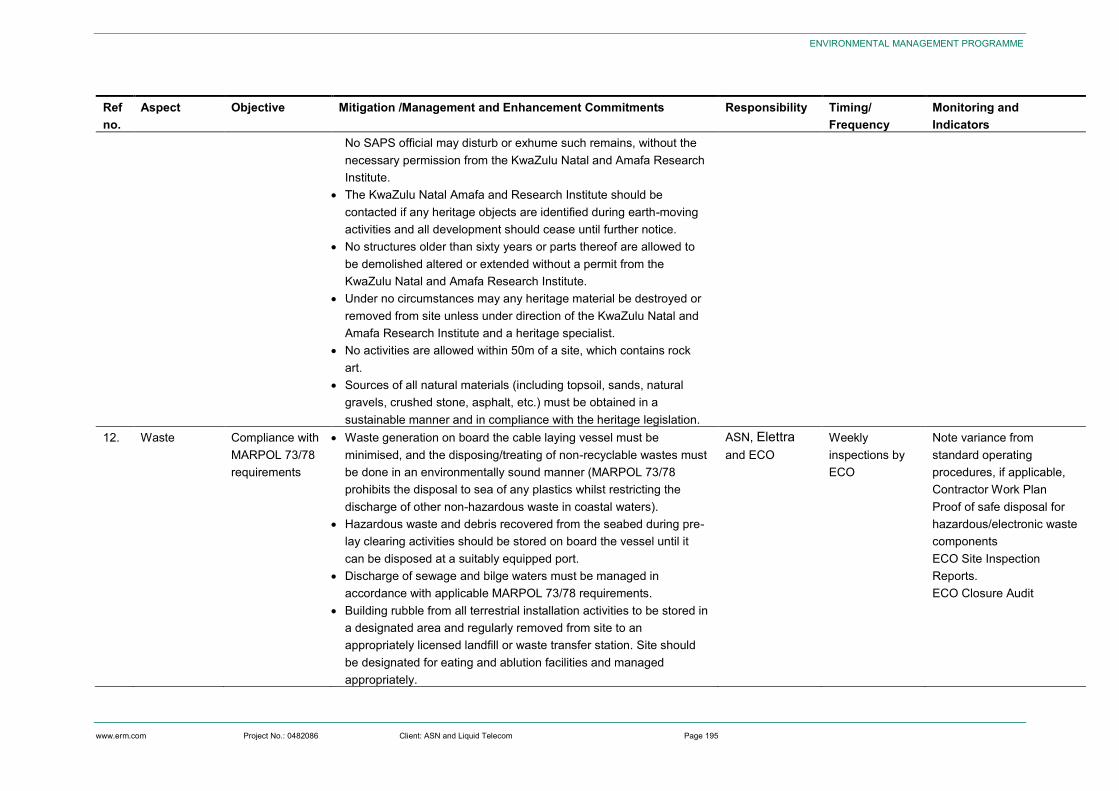
000000 FL0
www.erm.com Project No.: 0482086 Client: ASN and Liquid Telecom Page 195
ENVIRONMENTAL MANAGEMENT PROGRAMME
Ref no.
Aspect Objective Mitigation /Management and Enhancement Commitments Responsibility Timing/ Frequency
Monitoring and Indicators
No SAPS official may disturb or exhume such remains, without the necessary permission from the KwaZulu Natal and Amafa Research Institute.
The KwaZulu Natal Amafa and Research Institute should be contacted if any heritage objects are identified during earth-moving activities and all development should cease until further notice.
No structures older than sixty years or parts thereof are allowed to be demolished altered or extended without a permit from the KwaZulu Natal and Amafa Research Institute.
Under no circumstances may any heritage material be destroyed or removed from site unless under direction of the KwaZulu Natal and Amafa Research Institute and a heritage specialist.
No activities are allowed within 50m of a site, which contains rock art.
Sources of all natural materials (including topsoil, sands, natural gravels, crushed stone, asphalt, etc.) must be obtained in a sustainable manner and in compliance with the heritage legislation.
12. Waste Compliance with MARPOL 73/78 requirements
Waste generation on board the cable laying vessel must be minimised, and the disposing/treating of non-recyclable wastes must be done in an environmentally sound manner (MARPOL 73/78 prohibits the disposal to sea of any plastics whilst restricting the discharge of other non-hazardous waste in coastal waters).
Hazardous waste and debris recovered from the seabed during pre-lay clearing activities should be stored on board the vessel until it can be disposed at a suitably equipped port.
Discharge of sewage and bilge waters must be managed in accordance with applicable MARPOL 73/78 requirements.
Building rubble from all terrestrial installation activities to be stored in a designated area and regularly removed from site to an appropriately licensed landfill or waste transfer station. Site should be designated for eating and ablution facilities and managed appropriately.
ASN, Elettra and ECO
Weekly inspections by ECO
Note variance from standard operating procedures, if applicable, Contractor Work Plan Proof of safe disposal for hazardous/electronic waste components ECO Site Inspection Reports. ECO Closure Audit
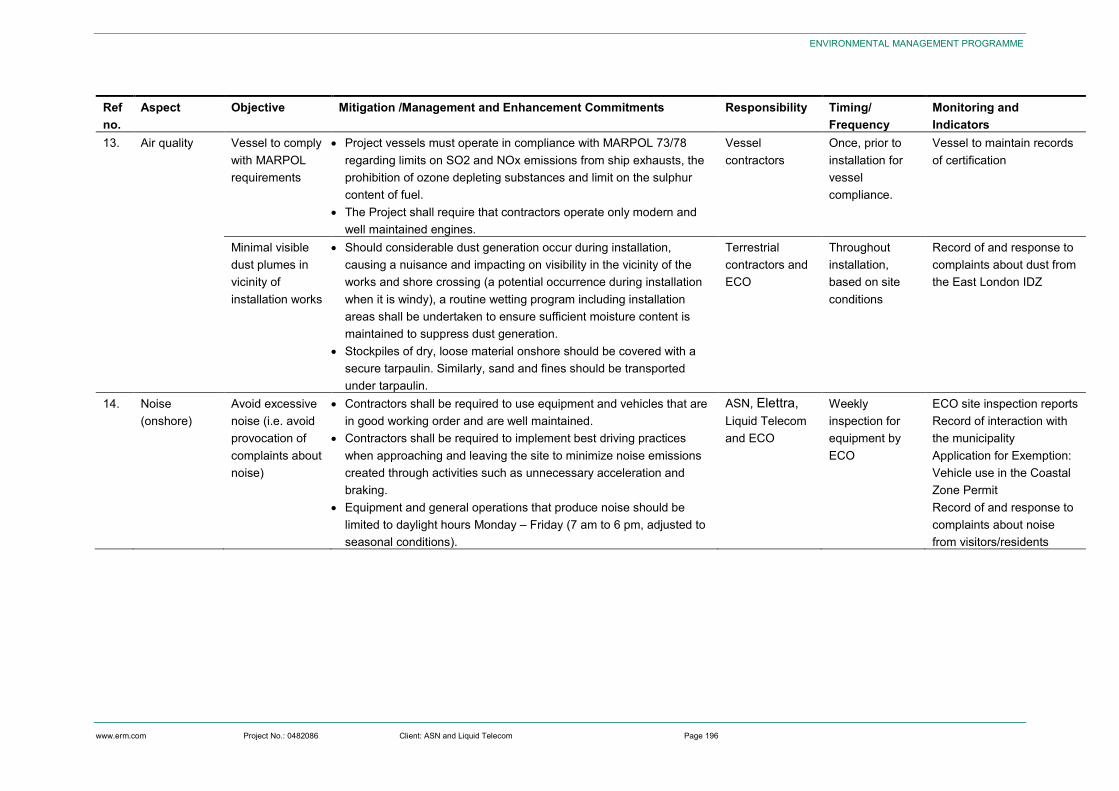
000000 FL0
www.erm.com Project No.: 0482086 Client: ASN and Liquid Telecom Page 196
ENVIRONMENTAL MANAGEMENT PROGRAMME
Ref no.
Aspect Objective Mitigation /Management and Enhancement Commitments Responsibility Timing/ Frequency
Monitoring and Indicators
13. Air quality Vessel to comply with MARPOL requirements
Project vessels must operate in compliance with MARPOL 73/78 regarding limits on SO2 and NOx emissions from ship exhausts, the prohibition of ozone depleting substances and limit on the sulphur content of fuel.
The Project shall require that contractors operate only modern and well maintained engines.
Vessel contractors
Once, prior to installation for vessel compliance.
Vessel to maintain records of certification
Minimal visible dust plumes in vicinity of installation works
Should considerable dust generation occur during installation, causing a nuisance and impacting on visibility in the vicinity of the works and shore crossing (a potential occurrence during installation when it is windy), a routine wetting program including installation areas shall be undertaken to ensure sufficient moisture content is maintained to suppress dust generation.
Stockpiles of dry, loose material onshore should be covered with a secure tarpaulin. Similarly, sand and fines should be transported under tarpaulin.
Terrestrial contractors and ECO
Throughout installation, based on site conditions
Record of and response to complaints about dust from the East London IDZ
14. Noise (onshore)
Avoid excessive noise (i.e. avoid provocation of complaints about noise)
Contractors shall be required to use equipment and vehicles that are in good working order and are well maintained.
Contractors shall be required to implement best driving practices when approaching and leaving the site to minimize noise emissions created through activities such as unnecessary acceleration and braking.
Equipment and general operations that produce noise should be limited to daylight hours Monday – Friday (7 am to 6 pm, adjusted to seasonal conditions).
ASN, Elettra, Liquid Telecom and ECO
Weekly inspection for equipment by ECO
ECO site inspection reports Record of interaction with the municipality Application for Exemption: Vehicle use in the Coastal Zone Permit Record of and response to complaints about noise from visitors/residents
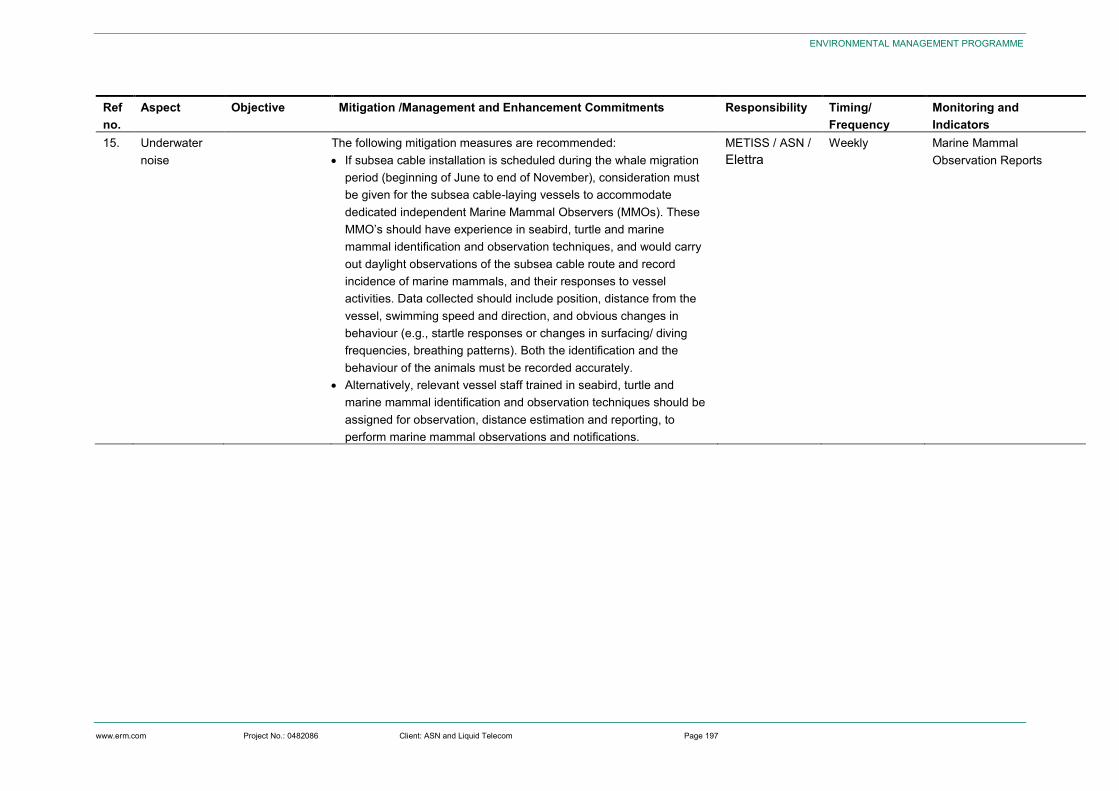
000000 FL0
www.erm.com Project No.: 0482086 Client: ASN and Liquid Telecom Page 197
ENVIRONMENTAL MANAGEMENT PROGRAMME
Ref no.
Aspect Objective Mitigation /Management and Enhancement Commitments Responsibility Timing/ Frequency
Monitoring and Indicators
15. Underwater noise
The following mitigation measures are recommended: If subsea cable installation is scheduled during the whale migration
period (beginning of June to end of November), consideration must be given for the subsea cable-laying vessels to accommodate dedicated independent Marine Mammal Observers (MMOs). These MMO’s should have experience in seabird, turtle and marine mammal identification and observation techniques, and would carry out daylight observations of the subsea cable route and record incidence of marine mammals, and their responses to vessel activities. Data collected should include position, distance from the vessel, swimming speed and direction, and obvious changes in behaviour (e.g., startle responses or changes in surfacing/ diving frequencies, breathing patterns). Both the identification and the behaviour of the animals must be recorded accurately.
Alternatively, relevant vessel staff trained in seabird, turtle and marine mammal identification and observation techniques should be assigned for observation, distance estimation and reporting, to perform marine mammal observations and notifications.
METISS / ASN / Elettra
Weekly Marine Mammal Observation Reports
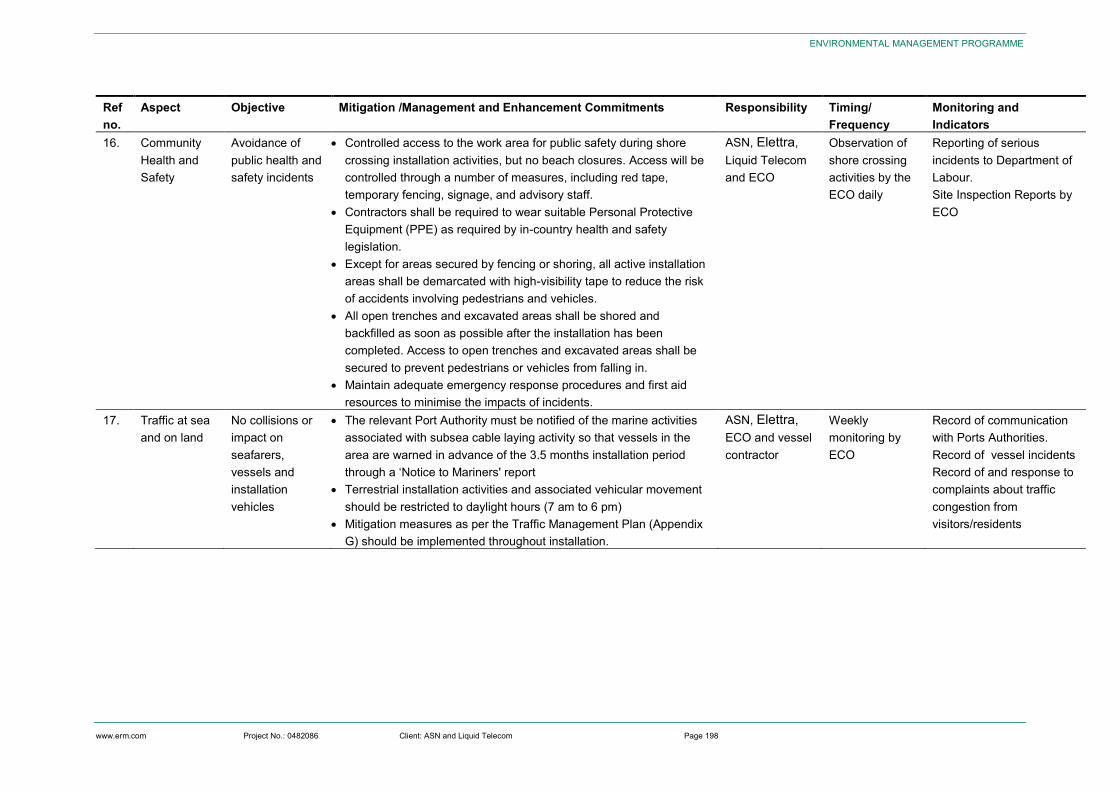
000000 FL0
www.erm.com Project No.: 0482086 Client: ASN and Liquid Telecom Page 198
ENVIRONMENTAL MANAGEMENT PROGRAMME
Ref no.
Aspect Objective Mitigation /Management and Enhancement Commitments Responsibility Timing/ Frequency
Monitoring and Indicators
16. Community Health and Safety
Avoidance of public health and safety incidents
Controlled access to the work area for public safety during shore crossing installation activities, but no beach closures. Access will be controlled through a number of measures, including red tape, temporary fencing, signage, and advisory staff.
Contractors shall be required to wear suitable Personal Protective Equipment (PPE) as required by in-country health and safety legislation.
Except for areas secured by fencing or shoring, all active installation areas shall be demarcated with high-visibility tape to reduce the risk of accidents involving pedestrians and vehicles.
All open trenches and excavated areas shall be shored and backfilled as soon as possible after the installation has been completed. Access to open trenches and excavated areas shall be secured to prevent pedestrians or vehicles from falling in.
Maintain adequate emergency response procedures and first aid resources to minimise the impacts of incidents.
ASN, Elettra, Liquid Telecom and ECO
Observation of shore crossing activities by the ECO daily
Reporting of serious incidents to Department of Labour. Site Inspection Reports by ECO
17. Traffic at sea and on land
No collisions or impact on seafarers, vessels and installation vehicles
The relevant Port Authority must be notified of the marine activities associated with subsea cable laying activity so that vessels in the area are warned in advance of the 3.5 months installation period through a ‘Notice to Mariners' report
Terrestrial installation activities and associated vehicular movement should be restricted to daylight hours (7 am to 6 pm)
Mitigation measures as per the Traffic Management Plan (Appendix G) should be implemented throughout installation.
ASN, Elettra, ECO and vessel contractor
Weekly monitoring by ECO
Record of communication with Ports Authorities. Record of vessel incidents Record of and response to complaints about traffic congestion from visitors/residents
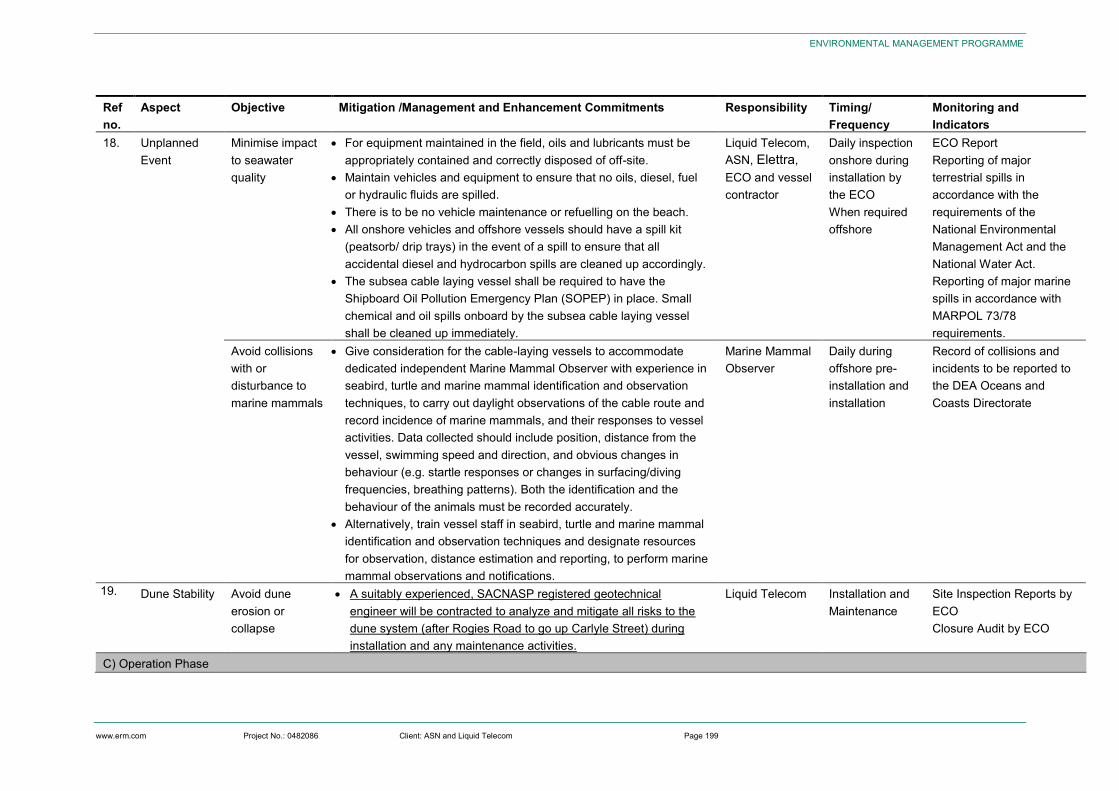
000000 FL0
www.erm.com Project No.: 0482086 Client: ASN and Liquid Telecom Page 199
ENVIRONMENTAL MANAGEMENT PROGRAMME
Ref no.
Aspect Objective Mitigation /Management and Enhancement Commitments Responsibility Timing/ Frequency
Monitoring and Indicators
18. Unplanned Event
Minimise impact to seawater quality
For equipment maintained in the field, oils and lubricants must be appropriately contained and correctly disposed of off-site.
Maintain vehicles and equipment to ensure that no oils, diesel, fuel or hydraulic fluids are spilled.
There is to be no vehicle maintenance or refuelling on the beach. All onshore vehicles and offshore vessels should have a spill kit
(peatsorb/ drip trays) in the event of a spill to ensure that all accidental diesel and hydrocarbon spills are cleaned up accordingly.
The subsea cable laying vessel shall be required to have the Shipboard Oil Pollution Emergency Plan (SOPEP) in place. Small chemical and oil spills onboard by the subsea cable laying vessel shall be cleaned up immediately.
Liquid Telecom, ASN, Elettra, ECO and vessel contractor
Daily inspection onshore during installation by the ECO When required offshore
ECO Report Reporting of major terrestrial spills in accordance with the requirements of the National Environmental Management Act and the National Water Act. Reporting of major marine spills in accordance with MARPOL 73/78 requirements.
Avoid collisions with or disturbance to marine mammals
Give consideration for the cable-laying vessels to accommodate dedicated independent Marine Mammal Observer with experience in seabird, turtle and marine mammal identification and observation techniques, to carry out daylight observations of the cable route and record incidence of marine mammals, and their responses to vessel activities. Data collected should include position, distance from the vessel, swimming speed and direction, and obvious changes in behaviour (e.g. startle responses or changes in surfacing/diving frequencies, breathing patterns). Both the identification and the behaviour of the animals must be recorded accurately.
Alternatively, train vessel staff in seabird, turtle and marine mammal identification and observation techniques and designate resources for observation, distance estimation and reporting, to perform marine mammal observations and notifications.
Marine Mammal Observer
Daily during offshore pre-installation and installation
Record of collisions and incidents to be reported to the DEA Oceans and Coasts Directorate
19. Dune Stability Avoid dune erosion or collapse
A suitably experienced, SACNASP registered geotechnical engineer will be contracted to analyze and mitigate all risks to the dune system (after Rogies Road to go up Carlyle Street) during installation and any maintenance activities.
Liquid Telecom Installation and Maintenance
Site Inspection Reports by ECO Closure Audit by ECO
C) Operation Phase
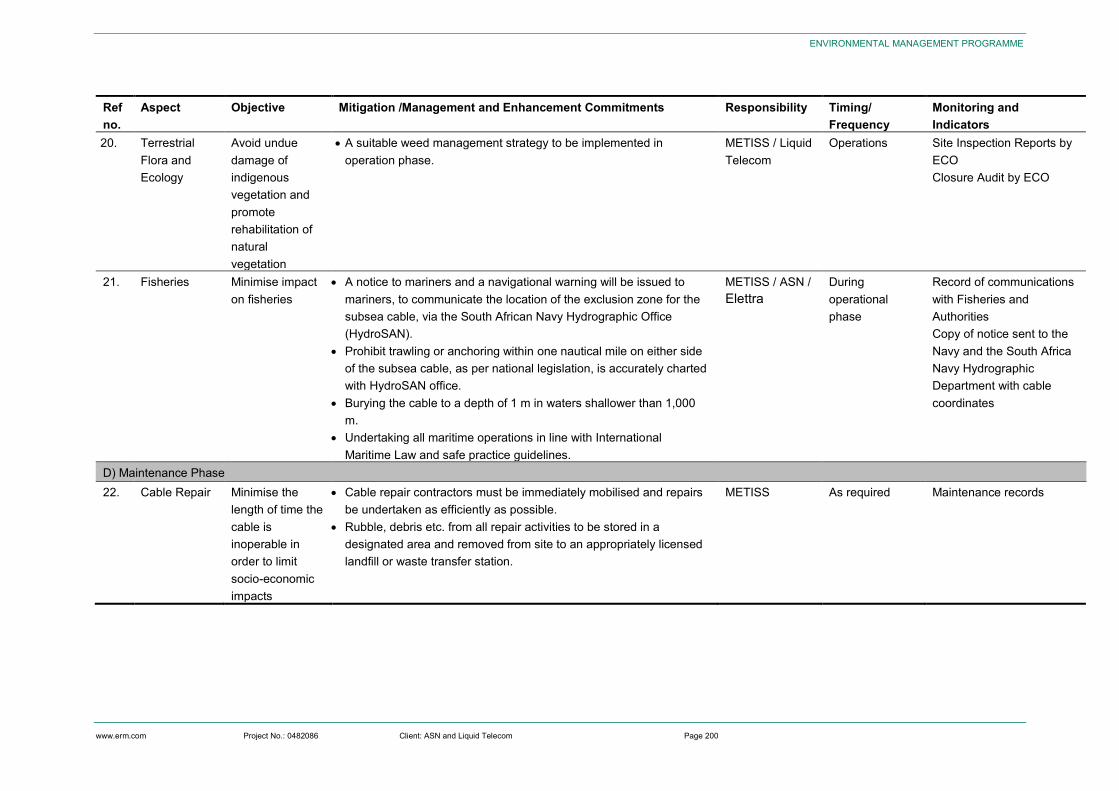
000000 FL0
www.erm.com Project No.: 0482086 Client: ASN and Liquid Telecom Page 200
ENVIRONMENTAL MANAGEMENT PROGRAMME
Ref no.
Aspect Objective Mitigation /Management and Enhancement Commitments Responsibility Timing/ Frequency
Monitoring and Indicators
20. Terrestrial Flora and Ecology
Avoid undue damage of indigenous vegetation and promote rehabilitation of natural vegetation
A suitable weed management strategy to be implemented in operation phase.
METISS / Liquid Telecom
Operations Site Inspection Reports by ECO Closure Audit by ECO
21. Fisheries Minimise impact on fisheries
A notice to mariners and a navigational warning will be issued to mariners, to communicate the location of the exclusion zone for the subsea cable, via the South African Navy Hydrographic Office (HydroSAN).
Prohibit trawling or anchoring within one nautical mile on either side of the subsea cable, as per national legislation, is accurately charted with HydroSAN office.
Burying the cable to a depth of 1 m in waters shallower than 1,000 m.
Undertaking all maritime operations in line with International Maritime Law and safe practice guidelines.
METISS / ASN / Elettra
During operational phase
Record of communications with Fisheries and Authorities Copy of notice sent to the Navy and the South Africa Navy Hydrographic Department with cable coordinates
D) Maintenance Phase 22. Cable Repair Minimise the
length of time the cable is inoperable in order to limit socio-economic impacts
Cable repair contractors must be immediately mobilised and repairs be undertaken as efficiently as possible.
Rubble, debris etc. from all repair activities to be stored in a designated area and removed from site to an appropriately licensed landfill or waste transfer station.
METISS As required Maintenance records
000000 FL0
www.erm.com Project No.: 0482086 Client: ASN and Liquid Telecom Page 201
ENVIRONMENTAL MANAGEMENT PROGRAMME
9.10 Auditing Section 34 of the EIA Regulations stipulate that a holder of an environmental authorisation must, for the period during which the environmental authorisation and EMPr, remain valid:
Audit the compliance with the conditions of the environmental authorisation and EMPr; and
Submit an environmental audit report to the relevant competent authority, ie, Department of Environmental Affairs.
Section 34 of the regulations also stipulates that the environmental audit report must be prepared by an independent person with the relevant environmental auditing expertise and must be conducted and submitted to the relevant competent authority at intervals as indicated in the environmental authorisation. These intervals may not exceed 5 years. It is recommended that the Project undergo an external compliance audit once during construction, and once at the completion of construction.
An environmental audit report must contain all information set out in Appendix 7 of the Environmental Impact Assessment Regulations.
000000 FL0
www.erm.com Project No.: 0482086 Client: ASN and Liquid Telecom Page 202
CONCLUSION
10. CONCLUSION
10.1 Introduction The purpose of this report is to provide information and an independent assessment of the Project, thus, enabling the Department of Environmental Affairs (DEA) to make an accountable and properly informed decision regarding whether or not to grant an environmental authorisation for the proposed development in terms of 2014 National Environmental Management Act (NEMA) (Act No. 107 of 1998) Regulations. This report will also assist the DEA to define under what conditions the Project should go ahead if authorisation is granted.
Throughout the EIA process, which has included stakeholder and specialist input, ERM has identified and assessed a number of potential impacts relating to the proposed activities. A brief overview of the findings of the EIA process, specifically those with a residual significance rating greater than Negligible and key mitigation measures are presented below. In considering the nature of the proposed Project, it is inevitable that there will be certain negative environmental impacts. Mitigation measures have been developed to avoid or reduce impacts and can be found in the Environmental Management Programme (Chapter 9 and Appendix G).
Locations and technology alternatives were considered, and the preferred alternative was selected based on a combination of factors including environment factors. With regards to various alternatives considered for the proposed Project, the no-go alternative entails no change to the status quo. This means that the subsea system installation activities would not occur in the Amanzimtoti. The option not to proceed with the subsea cable system will leave the areas along the cable route in their current environmental state.
10.2 Summary of Impacts Identified and Assessed The impacts assessed as part of this EIA Report were only those, which were considered as potentially significant. Non-significant impacts were scoped through the process.
10.2.1 Planned Activities
Project activities identified that would have a significant impact rated Minor and above (Moderate and Major) include:
Disturbance to Biota in Nearshore Sandy Beach;
Disturbance to Biota in Nearshore (beyond 10 m Water Depth);
Disturbance to Offshore Habitats during Installation;
Disturbance to the Seabed Characteristics from Physical Presence of Subsea Cable During Operations;
Disturbance to Marine and Coastal Fauna;
Disturbance to Sensitive Terrestrial Habitats;
Disturbance to Flora and Fauna;
Disturbed/ Transformed Areas Create Opportunities for the Spread of Invasive Alien Plants;
Disturbance to Archaeological Resources; and
No-Go Alternative.
These impacts are described in detail below.
000000 FL0
www.erm.com Project No.: 0482086 Client: ASN and Liquid Telecom Page 203
CONCLUSION
Disturbance and turnover of unconsolidated sediments along the length of the subsea cable route would be caused by the pre-lay grapnel run, and the subsea cable ploughing and tracked trenching/ burial Remotely Operated Vehicle (ROV) during the laying of the subsea cable. Any epifauna or infauna associated with the disturbed sediments are likely to be displaced, damaged or destroyed. The plough skids or ROV tracks could injure or crush benthic invertebrates in their path. While the area of disturbance is limited, the elimination of marine benthic communities in the structural footprint of the subsea cable is an unavoidable consequence of the installation of subsea cables, and no direct mitigation measures, other than the no-go option, and routing the cable to avoid sensitive benthic habitats, are possible. The significance of the residual impact is Minor.
The presence of the subsea cable reduces the area of seabed available for colonisation by macrobenthic infauna in seabed sediments. The subsea cable itself, however, would serve as an alternative substratum for colonising benthic communities or provide shelter for mobile invertebrates and demersal fish. This disturbance is considered short-term and highly localised, as the seabed sediments will naturally backfill and an alternative substrate for colonisation of benthic organisms will be provided. No mitigation measures have been proposed, and as such the significance of the impact will be Minor.
The subsea cable shore-crossing, noise and vibrations from excavation machinery during installation may have a temporary impact on surf-zone biota, marine mammals and shore birds in the area. The noise is not considered to be of sufficient amplitude to cause direct physical injury or mortality to marine life, even at close range. The underwater noise may induce localised behavioural changes or masking of biologically relevant sounds in some marine fauna. Without mitigation, the direct impacts of construction and vessel noise are assessed to be of Minor Significance, respectively. After mitigation the significance of the impact remains Minor.
Almost the entire terrestrial ecological study area is transformed from natural environment and currently comprises high-density urban developments and road networks, nevertheless, the clearing of vegetation from the site will result in the localised permanent loss of vegetation cover. The impacts will be confined to the construction footprint for the terrestrial cable, which includes certain areas of high sensitivity. A range of mitigation measures have been proposed, which reduced the impact from Moderate to Minor.
The clearing of land would also affect certain plant species including some nationally and regionally protected plant species. No threatened plant species were observed or are expected to occur along the terrestrial cable route alignment. Proposed mitigation measures reduce the impact significance from Moderate to Minor.
Invasive species that already occur in the area are likely to invade newly disturbed areas. Mitigation measures proposed reduce the impact significance from Major to Moderate.
Sub-surface cultural heritage remains may be impacted on during construction if not identified beforehand. The potential for interaction with or direct impact on submerged prehistoric archaeological material is highly unlikely. No mitigation is therefore proposed and the potential residual impact on submerged prehistoric archaeology is Moderate.
The option not to proceed with the subsea cable would result in limited education opportunities throughout South Africa, as the cable would result in access to information and web-based educational resources. Additionally, the SAFE subsea cable will reach the end of its design lifespan, furthermore its capacity, which is limited for current growth requirements, resulting in high costs and limited data transmission, particularly when maintenance activities are required will remain the same.
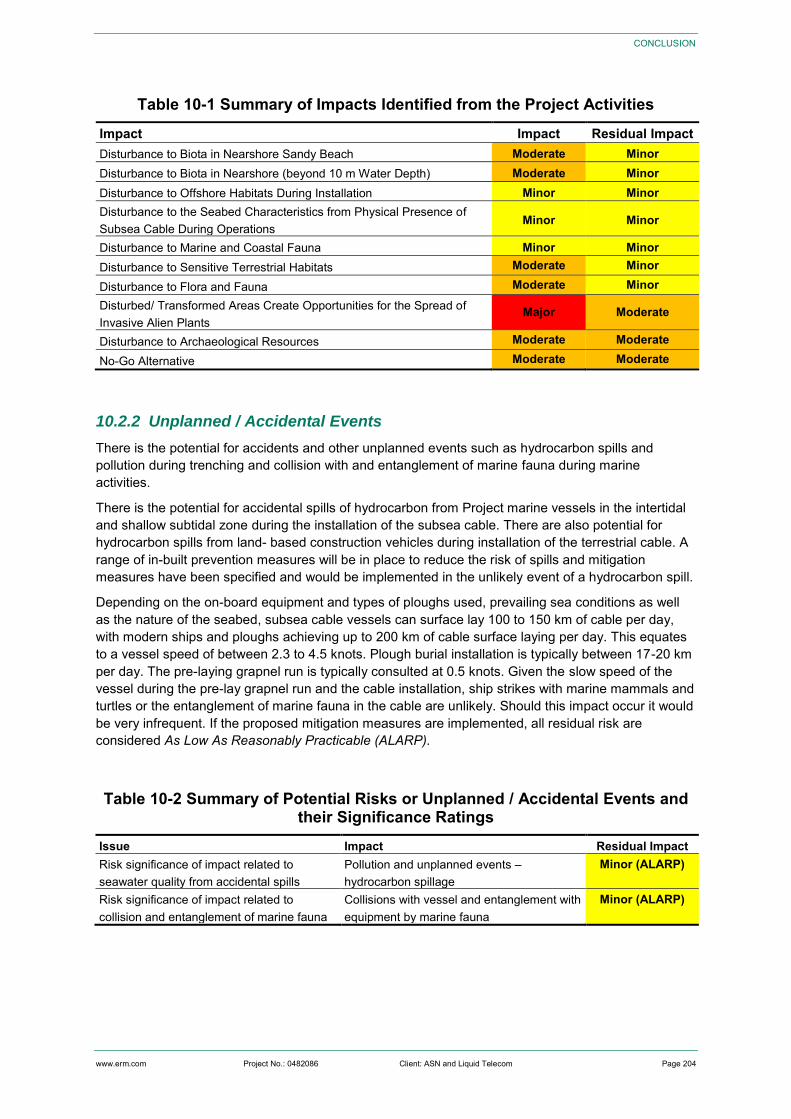
000000 FL0
www.erm.com Project No.: 0482086 Client: ASN and Liquid Telecom Page 204
CONCLUSION
Table 10-1 Summary of Impacts Identified from the Project Activities Impact Impact Residual Impact Disturbance to Biota in Nearshore Sandy Beach Moderate Minor Disturbance to Biota in Nearshore (beyond 10 m Water Depth) Moderate Minor Disturbance to Offshore Habitats During Installation Minor Minor Disturbance to the Seabed Characteristics from Physical Presence of Subsea Cable During Operations
Minor Minor
Disturbance to Marine and Coastal Fauna Minor Minor Disturbance to Sensitive Terrestrial Habitats Moderate Minor
Disturbance to Flora and Fauna Moderate Minor Disturbed/ Transformed Areas Create Opportunities for the Spread of Invasive Alien Plants
Major Moderate
Disturbance to Archaeological Resources Moderate Moderate
No-Go Alternative Moderate Moderate
10.2.2 Unplanned / Accidental Events
There is the potential for accidents and other unplanned events such as hydrocarbon spills and pollution during trenching and collision with and entanglement of marine fauna during marine activities.
There is the potential for accidental spills of hydrocarbon from Project marine vessels in the intertidal and shallow subtidal zone during the installation of the subsea cable. There are also potential for hydrocarbon spills from land- based construction vehicles during installation of the terrestrial cable. A range of in-built prevention measures will be in place to reduce the risk of spills and mitigation measures have been specified and would be implemented in the unlikely event of a hydrocarbon spill.
Depending on the on-board equipment and types of ploughs used, prevailing sea conditions as well as the nature of the seabed, subsea cable vessels can surface lay 100 to 150 km of cable per day, with modern ships and ploughs achieving up to 200 km of cable surface laying per day. This equates to a vessel speed of between 2.3 to 4.5 knots. Plough burial installation is typically between 17-20 km per day. The pre-laying grapnel run is typically consulted at 0.5 knots. Given the slow speed of the vessel during the pre-lay grapnel run and the cable installation, ship strikes with marine mammals and turtles or the entanglement of marine fauna in the cable are unlikely. Should this impact occur it would be very infrequent. If the proposed mitigation measures are implemented, all residual risk are considered As Low As Reasonably Practicable (ALARP).
Table 10-2 Summary of Potential Risks or Unplanned / Accidental Events and their Significance Ratings
Issue Impact Residual Impact Risk significance of impact related to seawater quality from accidental spills
Pollution and unplanned events – hydrocarbon spillage
Minor (ALARP)
Risk significance of impact related to collision and entanglement of marine fauna
Collisions with vessel and entanglement with equipment by marine fauna
Minor (ALARP)
000000 FL0
www.erm.com Project No.: 0482086 Client: ASN and Liquid Telecom Page 205
CONCLUSION
10.3 Recommendations During this EIA process, certain control measures have been recommended as part of the Project to manage the anticipated impacts. These control measures have been recommended, to an extent that is practically possible for ASN, Elettra and LT without compromising the economic viability of the Project. These control measures also ensure that the Project is compliant with South African Regulations as well as international policies, frameworks and industry good practise during its operations.
Over and above the recommended controls, mitigation and management measures have been specified and form part of the EMPr developed with this EIA Report.
All mitigations listed in the EMPr are recommended to be implemented during the course of the Project (throughout construction and operation where applicable) to ensure compliance and to ensure that the potential negative impacts associated with the establishment of the Project are respectively mitigated to a level that is deemed adequate for the Project to proceed.
In summary, based on the findings of this assessment and taking into account the benefits of the Project to the South African economy, ERM is of the opinion that the proposed installation of the METISS Subsea Cable System, should be authorised. This is, however, contingent on the implementation of the mitigation measures and monitoring for potential environmental and socio-economic impacts as outlined in the EIA Report and EMPr being implemented by ASN, Elettra, LT and contractors.
000000 FL0
www.erm.com Project No.: 0482086 Client: ASN and Liquid Telecom Page 206
REFERENCES
11. REFERENCES
Alexander, G.J., Tolley, K., Weeber, J., Conradie, W., Marais, J. & Bauer, A.M. 2018. Scelotes inornatus. The IUCN Red List of Threatened Species 2018: e.T178207A115659621.
http://dx.doi.org/10.2305/IUCN.UK.2018-2.RLTS.T178207A115659621.en.
Amanzimtoti Climate, 2019. Accessed from: http://www.saexplorer.co.za/south-africa/climate/amanzimtoti_climate.asp, February 2019.
Anders, A.S., 1975. Pilchard and Anchovy Spawning Along the Cape East Coast. South Africa Ship. News Fish. Ind., 30 (9): 53-57.
Axelson, E., 1973. The Portuguese in South-East Africa, 1488-1600. Wits University Press. Johannesburg.
Bates MF, Branch WR, Bauer AM, Burger M, Marais J, Alexander GJ and de Villiers M (eds.). 2014. Atlas and Red List of the Reptiles of South Africa, Lesotho and Swaziland. South African National Biodiversity Institute, Pretoria.
Barlow, R., Lamont, T., Britz, K. and H. Sessions, 2013. Mechanisms of Phytoplankton Adaptation to Environmental Variability in a Shelf Ecosystem. Estuarine Coastal and Shelf Science, 133: 45–57.
Barlow, R.G., Lamont, T., Gibberd, M.J., Van Den Berg, M. and K. Britz, 2015. Chemotaxonomic Investigation of Phytoplankton in the Shelf Ecosystem of the Kwazulu-Natal Bight, South Africa. African Journal of Marine Science, 37: 467–484.
Bartol, S.M. and J.A. Musick, 2002. 3 Sensory Biology of Sea Turtles. The Biology of Sea Turtles, 79.
Beal, L. M. and H. L. Bryden, 1997. Observations of an Agulhas Undercurrent. Deep-Sea Research. 44: 1715–1724.
Beckley, L.E. and J.D. Hewitson, 1994. Distribution and Abundance of Clupeoid Larvae along the East Coast of South Africa in 1990/1991. South African Journal of Marine Science, 14: 205 – 212.
Beckley, L.E. and Van Ballegooyen, R.C. 1992. Oceanographic Conditions during Three Ichthyoplankton Surveys of the Agulhas Current in 1990/91. South African Journal of Marine Science, 12: 83 - 93.
Benno, B., Verheij, E., Stapley, J., Rumisha, C., Ngatunga, B., Abdallah, A. and H. Kalombo, 2006. Coelacanth (Latimeria Chalumnae Smith, 1939) Discoveries and Conservation in Tanzania. South African Journal of Science, 102, 486 – 490.
Best P.B., Meÿer, M.A. and C. Lockyer, 2010. Killer Whales in South African Waters – A Review of Their Biology. African Journal of Marine Science, 32: 171 –186.
Best, P.B. and C.H. Lockyer, 2002. Reproduction, Growth and Migrations of Sei Whales Balaenoptera Borealis Off The West Coast of South Africa In The 1960s. South African Journal of Marine Science, 24: 111 - 133.
Best, P.B., 1977. Two Allopatric Forms of Bryde's Whale off South Africa. Report of the International Whaling Commission (Special Issue 1), 10 – 38.
Best, P.B., 1990. Trends in the Inshore Right Whale Population off South Africa, 1969 1987. Marine Mammal Science, 6: 93 108.
Best, P.B., 2001. Distribution and Population Separation of Bryde’s Whale Balaenoptera Edeni off Southern Africa. Mar. Ecol. Prog. Ser., 220: 277 – 289.
Best, P.B., 2007. Whales and Dolphins of the Southern African Subregion. Cambridge University Press, Cape Town, South Africa.
000000 FL0
www.erm.com Project No.: 0482086 Client: ASN and Liquid Telecom Page 207
REFERENCES
Best, P.B., Butterworth, D.S. and L.H. Rickett, 1984. An Assessment Cruise for The South African Inshore Stock of Bryde’s Whale (Balaenoptera Edeni). Report of the International Whaling Commission, 34: 403 - 423.
Best, P.B., Findlay, K.P., Sekiguchi, K., Peddemors, V.M., Rakotonirina, B., Rossouw, A. and D. Gove, 1998. Winter Distribution and Possible Migration Routes of Humpback Whales Megaptera Novaeangliae in the Southwest Indian Ocean. Mar. Ecol. Prog. Ser., 162: 287 - 299.
BirdLife International. 2016. Falco biarmicus. The IUCN Red List of Threatened Species 2016: e.T22696487A93567240. http://dx.doi.org/10.2305/IUCN.UK.2016-3.RLTS.T22696487A93567240.en.
BirdLife International. 2018. Stephanoaetus coronatus. The IUCN Red List of Threatened Species 2018: e.T22696201A129914678. http://dx.doi.org/10.2305/IUCN.UK.2018-2.RLTS.T22696201A129914678.en
Birkeland, C., Reimer, A.A. and J.R. Young, 1976. Survey of Marine Communities in Panama and Experiments with Oil. Us Epa Research Series, 600(3): 76 - 028.
Bombace, G., Fabi, G., Fiorentini, L. and S. Speranza, 1994. Analysis of The Efficacy of Artificial Reefs Located In Five Different Areas of The Adriatic Sea. Bulletin of Marine Science, 55: 559 - 580.
Bonfil, R., Meyer, M., Scholl, M.C., Johnson, R., O’brien, S., Oosthuizen, H., Swanson, S., Kotze, D. and M. Paterson, 2005. Transoceanic Migration, Spatial Dynamics, and Population Linkages of White Sharks. Science, 310: 100-103.
Bosman, C., Uken, R., and A.M. Smith, 2005. The bathymetry of the Aliwal Shoal, Scottburgh, South Africa. South African Journal of Science, 101: 1-3.
Branch, G.M. and M. Branch, 1981. The Living Shores of Southern Africa. Cape Town, Struik, 272.
Branch, G.M., Griffiths, C.L., Branch, M.L., and L.E. Beckley, 2010. Two Oceans. Struik Nature, Cape Town, South Africa, Revised Edition, 456.
Branch, T.A., Stafford, K.M., Palacios, D.M., Allison, C., Bannister, J.L., Burton, C.L.K., Cabrera, E., Carlson, C.A., Galletti Vernazzani, B., Gill, P.C., Hucke-Gaete, R., Jenner, K.C.S., Jenner, M.-N.M., Matsuoka, K., Mikhalev, Y.A., Miyashita, T., Morrice, M.G., Nishiwaki, S., Sturrock, V.J., Tormosov, D., Anderson, R.C., Baker, A.N., Best, P.B., Borsa, P., Brownell Jr, R.L., Childerhouse, S., Findlay, K.P., Gerrodette, T., Ilangakoon, A.D., Joergensen, M., Kahn, B., Ljungblad, D.K., Maughan, B., Mccauley, R.D., Mckay, S., Norris, T.F., Oman Whale and Dolphin Research Group, Rankin, S., Samaran, F., Thiele, D., Van Waerebeek, K. and R.M. Warneke, 2007. Past and Present Distribution, Densities and Movements of Blue Whales in the Southern Hemisphere and Northern Indian Ocean.
Mammal Review, 37 (2): 116-175.
Brandão, A., Vermeulen, E., Ross-Gillespie, A., Findlay, K. and D.S. Butterworth, 2018. Updated Application of A Photo-Identification Based Assessment Model To Southern Right Whales In South African Waters, Focussing On Inferences To Be Drawn From A Series of Appreciably Lower Counts of Calving Females Over 2015 To 2017. Paper Sc/67b/Sh/22 Submitted to the Scientific Committee of the International Whaling Commission, Bled, Slovenia.
Brazier, W., 2012. Environmental Cues and Sensory Preferences Directing The Nesting Process In Loggerhead Turtles, Caretta Caretta, Nesting In Maputaland, South Africa. Msc, Nelson Mandela Metropolitan University.
Breeze, H., Davis, D.S. Butler, M. and Kostylev, V. 1997. Distribution and Status of Deep Sea Corals off Nova Scotia. Marine Issues Special Committee Special Publication No. 1. Halifax, Ns: Ecology Action Centre. 58 P.
Brown, A.C. and A. McLachlan, 1994. Ecology of Sandy Shores, Amsterdam, Elsevier, 1 - 328.
Brunnschweiler, J.M., Baensch, H., Pierce, S.J. and D.W. Sims, 2009. Deep-Diving Behaviour of a Whale Shark Rhincodon Typus during Long-Distance Movement in the Western Indian Ocean.
000000 FL0
www.erm.com Project No.: 0482086 Client: ASN and Liquid Telecom Page 208
REFERENCES
Journal of Fish Biology, 74: 706–714.
Bruton, M.N. and Armstrong, M.J., 1991. The Demography of the Coelacanth Latimeria Chalumnae. Environ. Biol. Fishes, 32, 301–311.
Bruton, M.N., Cabral, A.J.P. and H.W. Fricke, 1992. First Capture of A Coelacanth, Latimeria Chalumnae (Pisces, Latimeriidae), Off Mozambique. South African Journal of Science, 88, 225-227.
Bryden, H.L., Beal, L.M. and L.M. Duncan, 2005. Structure and Transport of the Agulhas Current and Its Temporal Variability. Journal of Oceanography, 61: 479–492.
Bull, A.S. and J.J. Kendall Jr, 1994. An Indication of the Process: Offshore Platforms as Artificial Reefs in the Gulf of Mexico. Bull. Mar. Sci., 55: 1086-1098.
Carter, R.A. and J. D’Aubrey, 1988. Inorganic Nutrients in Natal Continental Shelf Waters. In: Coastal Ocean Sciences of Natal, South Africa (Ed. E.H. Schumann). Springer-Verlag, Berlin, 131-151.
Carter, R.A. and M.H. Schleyer, 1988. Plankton Distributions in Natal Coastal Waters. In: Coastal Ocean Sciences of Natal, South Africa (Ed. E.H. Schumann). Springer-Verlag, Berlin, 152-177.
Cawthra, H.C., Uken, R. and M.N. Ovechkina, 2012. New Insights into the Geological Evolution of the Durban Bluff and Adjacent Blood Reef, South Africa. South African Journal of Geology, 115 (3): 291- 308.
Child, M.F., Roxburgh, L., Do Linh San, E., Raimondo, D. and H.T. Davies-Mostert (Editors), 2016. The Red List of Mammals of South Africa, Swaziland and Lesotho. South African National Biodiversity Institute and Endangered Wildlife Trust, South Africa. (Https://www.Ewt.Org.Za/Reddata/Order%20cetacea.Html).
Cliff, G., Anderson-Reade, M.D., Aitken, A.P., Charter, G.E. and V.M. Peddemors, 2007. Aerial Census of Whale Sharks (Rhincodon Typus) on the Northern Kwazulu-Natal Coast, South Africa. Fisheries Research 84: 41–46.
Cockcroft, V., Natoli, A., Reisinger, R., Elwen, S., Hoelzel, R., Atkins, S. and S. Plön, 2016. A Conservation Assessment of Tursiops Aduncus. In Child, M.F., Roxburgh, L., Do Linh San, E., Raimondo, D., Davies-Mostert, H.T., Editors. The Red List of Mammals of South Africa, Swaziland and Lesotho. South African National Biodiversity Institute and Endangered Wildlife Trust, South Africa.
Cockcroft, V.G. and V.M. Peddemors, 1990. Seasonal Distribution and Density of Common Dolphins Delphinus Delphis off The South-East Coast of Southern Africa. S. Afr. J. Mar. Sci., 9: 371-377.
Cockcroft, V.G., Ross G.J.B. and V.M. Peddemors, 1990. Bottlenose Dolphin Tursiops Truncatus Distribution in Natal's Coastal Waters. South African Journal of Marine Science, 9: 1-10.
Cockcroft, V.G., Ross G.J.B. and V.M. Peddemors, 1991. Distribution and Status of Bottlenose Dolphin Tursiops Truncatus on the South Coast of Natal, South Africa. S. Afr. J. Mar. Sci., 11: 203- 209.
Coetzee, J.C., Merckle, D., Hutchings, L., Van Der Lingen, C.D., Van Den Berg, M. and M.D.Durholtz, 2010. The 2005 Kwazulu-Natal Sardine Run Survey Sheds New Light on the Ecology of Small Fish off The East Coast of South Africa. African Journal of Marine Science, 32: 337–360.
Coley, N.P., 1994. Environmental Impact Study: Underwater Radiated Noise. Institute for Maritime Technology, Simon's Town, South Africa, 30.
Coley, N.P., 1995. Environmental Impact Study: Underwater Radiated Noise Ii. Institute for Maritime Technology, Simon's Town, South Africa, 31.
Connell, A.D, Mcclurg, T.P. and D.J. Livingstone, 1985. Environmental Studies at Richards Bay Prior To the Discharge of Submarine Outfalls. Marine Research Group, National Institute for Water Research of the CSIR, Durban Branch Laboratory.
000000 FL0
www.erm.com Project No.: 0482086 Client: ASN and Liquid Telecom Page 209
REFERENCES
Connell, A.D, Mcclurg, T.P. and D.J. Livingstone, 1989. Environmental Studies in the Richards Bay Offshore Outfalls Region. Part 2. Surveys Made Between 1985 and 1988. CSIR Division of Earth, Marine and Atmospheric Science and Technology, Marine Pollution Research Group, Durban Branch Laboratory.
Connell, A.D., 1996. Seasonal Trends in Sardine Spawning At Park Rynie, Kwazulu-Natal South Coast. Workshop on South African Sardine: Proceedings and Recommendations. Barange, M. and Van Der Lingen (Ed.). Bep Rep. 29, 29-33.
Connell, A.D., 2010. A 21-Year Ichthyoplankton Collection Confirms Sardine Spawning In Kwazulu- Natal Waters. African Journal of Marine Science, 32: 331–336.
Connell, S.D. and R.O. Slayter, 1977. Mechanisms of Succession in Natural Communities and Their Role on Community Stability and Organisation. American Naturalist, 111: 1119 - 1144.
Connell, S.D. and T.M. Glasby, 1999. Do Urban Structures Influence Local Abundance and Diversity of Subtidal Epibiota? A Case Study from Sydney Harbour. Marine Environmental Research, 47: 373 - 387.
Connell, S.D., 2001. Urban Structures as Marine Habitats: An Experimental Comparison of the Composition and Abundance of Subtidal Epibiota among Pilings, Pontoons and Rocky Reefs. Marine Environmental Research, 52: 115 - 125.
Convention on Biological Diversity (Cbd), 2013. Report of the Southern Indian Ocean Regional Workshop to Facilitate the Description of Ecologically or Biologically Significant Marine Areas.
Unep/Cbd/Rw/Ebsa/Sio/1/4. Www.Cbd.Int/Doc/?Meeting=Ebsa-Sio-01
Croft, B. and B. Li, 2017. Shell Namibia Deepwater Exploration Drilling: Underwater Noise Impact Assessment. Prepared By Slr Consulting Australia Pty Ltd. for Slr Consulting (Cape \Town) Pty Ltd., 19.
Crowther Campbell & Associates and CSIR, 1998. Environmental Impact Assessment for the Proposed Extension of the Oribi Oil Production Facility and Hydrocarbon Exploration off The Southern Cape Coast. Report No. Soe01oe/2.
Crowther Campbell & Associates Cc and Centre for Marine Studies (Cca & Cms), 2001. Generic Environmental Management Programme Reports for Oil and Gas Prospecting off the Coast of South Africa. Prepared for Petroleum Agency SA.
CSIR, 1998. Environmental Impact Assessment for the Proposed Exploration Drilling In Petroleum Exploration Lease 17/18 on the Continental Shelf of Kwazulu-Natal, South Africa. CSIR Report Env/S- C 98045.
CSIR, 2007. Environmental Studies in the Richards Bay Outfalls Region. Report No. 20. Surveys Made During 2006/2007. CSIR Report CSIR/Nre/Pw/Er /2006/0068/C.
CSIR, 2009. Environmental Studies in the Richards Bay Offshore Outfalls Region. Report No. 22. Surveys Made In 2008/2009. CSIR Report CSIR/Nre/Co/Er/2010/0010/B.
De Lecea, A.M., Cooper, R. and A.J. Smit, 2015. Identifying The Drivers of The Pelagic Ecosystem of An Oligotrophic Bight (Kwazulu–Natal, South Africa) Using Stable Isotopes (Δ13c, Δ15n) and C:N Ratio Analysis. Marine and Freshwater Research. Doi:Org/10.1071/Mf15256.
De Lecea, A.M., Fennessy, S.T. and A.J. Smit, 2013. Processes Controlling The Benthic Food-Web of A Mesotrophic Bight (Kwazulu-Natal, South Africa) Revealed By Stable Isotope Analysis. Marine Ecology Progress Series, 484: 97–114.
De Lecea, A.M., Smit, A.J. and S.J. Fennessy, 2016. Riverine Dominance of A Nearshore Marine Demersal Food Web: Evidence From Stable Isotope and C/N Ratio Analysis. African Journal of Marine Science 38(Supplement): S181–S192.
000000 FL0
www.erm.com Project No.: 0482086 Client: ASN and Liquid Telecom Page 210
REFERENCES
De Wet, A., 2013. Factors Affecting Survivorship of Loggerhead (Caretta Caretta) and Leatherback (Dermochelys Coriacea) Sea Turtles of South Africa. Msc, Nelson Mandela Metropolitan University.
DEA (Department of Environmental Affairs), 2017. Guideline on Need and Desirability, Department of Environmental Affairs (DEA), Pretoria, South Africa
DEA (Department of Environmental Affairs), 2017. Public Participation guideline in terms of NEMA EIA Regulations, Department of Environmental Affairs, Pretoria, South Africa.
DEA (Department of Environmental Affairs), 2013. Long-Term Adaptation Scenarios Flagship Research Programme (LTAS) for South Africa. Climate Change Implications for the Biodiversity Sector in South Africa. Pretoria, South Africa.
Demetriades N.T. and A.T. Forbes, 1993. Seasonal Changes In The Species Composition of The Penaeid Prawn Catch On The Thukela Bank, Natal, South Africa. South African Journal of Marine Science, 13: 317-322.
Department of Environmental Affairs and Tourism, Greater St Lucia Wetland Park Authority and Marine and Coastal Management, 2004. Management Plan for the Conservation of Coelacanths In The Greater St Lucia Wetland Park. Coelacanth Management Plan Gslwp, 2, 13.
Department of Water Affairs and Forestry., South Africa, 2004. DWAF Report No. Pbv000-00-10310. Thukela Bank: Impacts of Flow Scenarios on Prawn and Fish Catch. Report - Reserve Determination Study – Thukela River System. Prepared By Iwr Source-To-Sea As Part of The Thukela Water Project Decision Support Phase, 76.
Devos L. and D. Oyugi., 2002. First Capture of A Coelacanth, Latimeria Chalumnae Smith, 1939 (Pisces: Latimeriidae), Off Kenya. S. Afr. J. Sci., 98, 345–347.
Dingle, R.V., Birch, G.F., Bremner, J.M., De Decker, R.H., Du Plessis, A., Engelbrecht, J.C., Fincham, M.J., Fitton, T., Flemming, B.W., Gentle, R.I., Goodlad, S.W., Martin, A.K., Mills, E.G., Moir, G J.,
Parker, R.J., Robson, S.H., Rogers, J., Salmon, D.A., Siesser, W.G., Simpson, E.S.W., Summerhayes, C.P., Westall, F., Winter, A. and M.W. Woodborne, 1987. Deep-Sea Sedimentary Environments around Southern Africa (South-East Atlantic and Southwest Indian Oceans). Annals of the South African Museum, 98: 1-27.
Dladla, N.N., 2013. Seismic-Stratigraphic Models for Late Pleistocene/Holocene Incised Valley Systems on the Durban Continental Shelf, Unpublished MSC Thesis, University of KwaZulu-Natal.
Dudley, S.F.J. and C.A. Simpfendorfer, 2006. Population Status of 14 Shark Species Caught In The Protective Gillnets Off Kwazulu-Natal Beaches, South Africa, 1978 – 2003. Marine and Freshwater Research, 57: 225 – 240.
Dugan J.E., Hubbard, D.M., Mccrary, M.D. and M.O. Pierson, 2003. The Response of Macrofauna Communities and Shorebirds to Macrophyte Wrack Subsidies on Exposed Sandy Beaches of Southern California. Estuarine, Coastal and Shelf Science, 58s: 133-148.
Durham, B., 1994. The Distribution and Abundance of the Humpback Dolphin (Sousa Chinensis) Along the Natal Coast, South Africa. University of Natal.
Dutton, P. H., Bowen, B. W., Owens, D. W., Barragan, A. and S.K. Davis, 1999. Global Phylogeography of the Leatherback Turtle (Dermochelys Coriacea). Journal of Zoology, 248, 397- 409.
Dye, A.D., Mclachlan, A. and T. Wooldridge, 1981. The Ecology of Sandy Beaches In Natal. S. Afr. J. Zool., 16: 200-209.
Eckert, S.A. and B.S. Stewart, 2001. Telemetry and Satellite Tracking of Whale Sharks, Rhincodon Typus, In The Sea of Cortez, Mexico, and The North Pacific Ocean. Environmental Biology of Fishes, 60: 299–308.
000000 FL0
www.erm.com Project No.: 0482086 Client: ASN and Liquid Telecom Page 211
REFERENCES
EKZNW. 2016. KZN Biodiversity Spatial Planning Terms and Processes, Version 3.3 Unpublished Report, Biodiversity Spatial Planning and Information Division, Ezemvelo KZN Wildlife, P. O. Box 13053, Cascades, Pietermaritzburg, 3202.
Ellis, M.S., Wilson-Ormond, E.A. and E.N. Powell, 1996. Effects of Gas-Producing Platforms on Continental Shelf Macroepifauna in the Northwestern Gulf of Mexico: Abundance and Size Structure. Can. J. Fish. Aquat. Sci., 53: 2589-2605.
Ellis, D.V., 2000. Effect of Mine Tailings On The Biodiversity of The Seabed: Example of The Island Copper Mine, Canada. In: Sheppard, C.R.C. (Ed), Seas at the Millennium: An Environmental Evaluation. Pergamon, Elsevier Science, Amsterdam, 235-246.
Elwen, S. and P.B. Best, 2004. Environmental Factors Influencing the Distribution of Southern Right Whales (Eubalaena Australis) on the South Coast of South Africa I: Broad Scale Patterns. Mar.
Mammal Sci., 20 (3): 567-582.
Elwen, S.H., Gridley, T., Roux, J.-P., Best, P.B. and M.J. Smale, 2013. Records of Kogiid Whales in Namibia, Including the First Record of the Dwarf Sperm Whale (K. Sima). Marine Biodiversity Records. 6, E45 Doi:10.1017/S1755267213000213.
Engledow, H.R. and J.J. Bolton, 1994. Seaweed Alpha-Diversity within the Lower Eulittoral Zone in Namibia: The Effects of Wave Action, Sand Inundation, Mussels and Limpets. Botanica Marina 37: 267-276.
Erdmann, M.V., 2006. Lessons Learned From The Conservation Campaign for The Indonesian Coelacanth, Latimeria Menadoensis. S. Afr. J. Sci., 102, 501-5-4.
eThekwini municipality, 2017. Durban: State of Biodiversity Report: 2016/2017.
eThekwini Municipality, 2017/2018. eThekwini municipality Integrated Development plan (IDP) 5 year Plan: 2017/18 to 2021/22.
eThekwini Municipality, 2018/2019, Municipal Spatial Development Framework (SDF) 2018 – 2019.
Ezemvelo KZN Wildlife, 2012. Focus Areas for Additional Marine Biodiversity Protection In Kwazulu- Natal, South Africa. Unpublished Report - Jan 2012. Scientific Services, Ezemvelo KZN Wildlife: Durban. 62.
Fechhelm, R.G., Gallaway, B.J., Hubbard, G.F., Maclean, S. and L.R. Martin, 2001. Opportunistic Sampling at a Deep-Water Synthetic Drilling Fluid Discharge Site in the Gulf of Mexico. Gulf of Mexico Science, 2: 97-106.
Fennessy, S.T, Pradervand, P. and P.A. De Bruyn, 2010. Influence of The Sardine Run On Selected Nearshore Predatory Teleosts In Kwazulu-Natal. African Journal of Marine Science, 32(2): 375–382.
Fennessy, S.T., 1994a. The Impact of Commercial Prawn Trawlers on Linefish off The North Coast of Natal, South Africa. South African Journal of Marine Science 14: 263-279.
Fennessy, S.T., 1994b. Incidental Capture of Elasmobranchs by Commercial Prawn Trawlers on the Thukela Bank, Natal, South Africa. South African Journal of Marine Science 14: 287-296.
Fennessy, S.T., 2016. Subtropical Demersal Fish Communities on Soft Sediments in the Kwazulu- Natal Bight, South Africa, African Journal of Marine Science, 38:Sup1, S169-S180, Doi: 10.2989/1814232x.2016.1140677
Fernandez, A., Edwards, J.F., Rodriguez, F., Espinosa De Los Moneros, A., Herraez, P., Castro, P., Jaber, J., Et Al., 2005. “‘Gas and Fat Embolic Syndrome’” Involving A Mass Stranding of Beaked Whales (Family Ziphiidae) Exposed To Anthropogenic Sonar Signals. Veterinary Pathology, 457: 446–457.
Findlay, K.P. and P.B. Best, 1996a. Estimates of The Numbers of Humpback Whales Observed Migrating Past Cape Vidal, South Africa, 1988-1991. Mar Mammal Sci., 12(3): 354-370.
000000 FL0
www.erm.com Project No.: 0482086 Client: ASN and Liquid Telecom Page 212
REFERENCES
Findlay, K.P. and P.B. Best, 1996b. The Migrations of Humpback Whales past Cape Vidal, South Africa, and A Preliminary Estimate of the Population Increase Rate. Rep Int Whal Commn.
Sc/A06/Hw16.
Findlay, K.P., 1989. The Distribution of Cetaceans off the Coast of South Africa and South West Africa/Namibia. Unpublished Msc. Thesis, University of Pretoria Town, 110.
Findlay, K.P., 1996. The Impact of Diamond Mining Noise on Marine Mammal Fauna off Southern Namibia. Specialist Study #10. In: Environmental Impact Report. Environmental Evaluation Unit (Ed.) Impacts of Deep Sea Diamond Mining, In The Atlantic 1 Mining Licence Area In Namibia, On The Natural Systems of The Marine Environment. University of Cape Town. Report to De Beers Marine (Pty) Ltd., 11-96-158, 370.
Findlay, K.P., Best, P.B., Peddemors, V.M. and D. Gove, 1994. The Distribution and Abundance of Humpback Whales on the Southern and Central Mozambique Winter Grounds. Rep Int Whal Commn, 44: 311-320.
Findlay, K.P., Best, P.B., Ross, G.J.B. and V.G. Cockcroft, 1992. The Distribution of Small Odontocete Cetaceans off the Coasts of South Africa and Namibia. S. Afr. J. Mar. Sci., 12: 237-270.
Flemming, B. and R. Hay, 1988. Sediment Distribution and Dynamics on the Natal Continental Shelf. In: Coastal Ocean Sciences of Natal, South Africa (Ed. E.H. Schumann). Springer-Verlag, Berlin, 47- 80.
Fricke, H. and K. Hissmann, 2000. Feeding Ecology and Survival of the Living Coelacanth. Mar. Biol., 136, 379–386.
Fricke, H. and R. Plante, 1988. Habitat Requirements of the Living Coelacanth Latimeria Chalumnae at Grande Comore, Indian Ocean. Naturwissenschaften, 15, 149–151.
Fricke, H., Hissmann, K., Schauer, J., Erdmann, M., Moosa, M.K. and R. Plante, 2000. Biogeography of the Indonesian Coelacanths. Nature, 403, 38.
Fricke, H., Hissmann, K., Schauer, J., Reinicke, O., Kasang, L. and R. Plante, 1991. Habitat and Population Size of the Coelacanth Latimeria Chalumnae at Grande Comoro. Environ. Biol. Fishes, 32, 287–300.
Froese, R. and M.L.D. Palomares, 2000. Growth, Natural Mortality, Length-Weight Relationship, Maximum Length and Length-At-First-Maturity of the Coelacanth Latimeria Chalumnae. Environ. Biol. Fish, 58(1):45-52.
Garratt, P.A., 1988. Notes On Seasonal Abundance and Spawning of Some Important Offshore Linefish In In Natal and Transkei Waters, Southern Africa South African Journal of Marine Science, 7: 1-8.
Gill, A.E. and E.H. Schumann, 1979. Topographically Induced Changes in the Structure of an Inertial Jet: Application to the Agulhas Current. Journal of Physical Oceanography, 9: 975-991.
Goodlad, S.W., 1986. Tectonic and Sedimentary History of the Mid-Natal Valley (South West Indian Ocean). Joint Gso/Uct Marine Geoscience Unit Bulletin, 15: 414.
Goold, J. and R. Coates, 2001. Acoustic Monitoring of Marine Wildlife. Seiche.Com Ltd, 182.
Grassman, M.A., Owens, D.W. and J.P. McVey, 1984. Olfactory-Based Orientation in Artificially Imprinted Sea Turtles. Science, 224: 83-84.
Green, A., Uken, R., Ramsay, P., Leuci, R., and S. Perritt, 2006. Potential Sites for Suitable Coelacanth Habitat Using Bathymetric Sata from the Western Indian Ocean. S. Afr. J. Sci., 102: 151– 154.
Green, A.N. and C.F. Mackay, 2016. Unconsolidated Sediment Distribution Patterns In the Kwazulu- Natal Bight, South Africa: The Role of Wave Ravinement in Separating Relict Versus Active Sediment
000000 FL0
www.erm.com Project No.: 0482086 Client: ASN and Liquid Telecom Page 213
REFERENCES
Populations, African Journal of Marine Science, 38:Sup1, S65-S74, Doi: 10.2989/1814232x.2016.1145138
Green, A.N. and G.L. Garlick, 2011. A sequence stratigraphic framework for a narrow, current-swept continental shelf: the Durban Bight, central KwaZulu-Natal, South Africa. Journal of African Earth Sciences, 60, 303-314.
Greenwood, G., 2013. Population Changes and Spatial Distribution of Indo-Pacific Humpback Dolphins (Sousa Plumbea) Within the Plettenberg Bay Area. BSc Honours, Department of Zoology, Faculty of Science, Nelson Mandela Metropolitan University.
Gribble, J., 2002. The Past, Present and Future of Maritime Archaeology in South Africa, International Handbook of Underwater Archaeology (eds Ruppe and Barstad), New York, Plenum Press.
Gribble, J. and J. Sharfman, 2013. Maritime Legal Management in South Africa. Online Encyclopaedia of Global Archaeology, 6802-6810.
Griffiths, M.H., 1988. Aspects of the Biology and Population Dynamics of the Geelbek Atractoscion Aequidens (Curvier) (Pisces: Sciaenidae) Off the South African Coast. M.Sc. Thesis, Rhodes University, Grahamstown, 149.
Groeneveld, J.C. and R. Melville-Smith, 1995. Spatial and Temporal Availability in the Multispecies Crustacean Trawl Fishery along the East Coast of South Africa and Southern Mozambique, 1988–93. South African Journal of Marine Science, 15: 123-136.
Gründlingh, M.L., 1992. Agulhas Current Meanders: Review and Case Study. S. Afr. Geogr. J., 74 (1): 19-29.
Gründlingh, M.L., 1987. On The Seasonal Temperature Variation in the Southwestern Indian Ocean. S. Afr. Geogr. J., 69 (2): 129-139.
Guastella, L.A. and M.J. Roberts, 2016. Dynamics and Role of the Durban Cyclonic Eddy in the Kwazulu-Natal Bight Ecosystem, African Journal of Marine Science, 38:Sup1, S23-S42, Doi: 10.2989/1814232x.2016.1159982
Harris, J.M., Livingstone, T., Lombard, A.T., Lagabrielle, E., Haupt, P., Sink, K., Mann, B. and M. Schleyer, 2011. Marine Systematic Conservation Assessment and Plan for Kwazulu-Natal - Spatial Priorities for Conservation of Marine and Coastal Biodiversity in Kwazulu-Natal. Ezemvelo KZN Wildlife.
Harris, J.M., Livingstone, T., Lombard, A.T., Lagabrielle, E., Haupt, P., Sink, K., Schleyer, M. and B.Q. Mann, 2012. Coastal and Marine Biodiversity Plan for Kwazulu-Natal. Spatial Priorities for the Conservation of Coastal and Marine Biodiversity in Kwazulu-Natal. Ezemvelo Kzn Wildlife Scientific Services Technical Report.
Harris, L., Campbell, E.E., Nel, R. and D. Schoeman, 2014. Rich Diversity, Strong Endemism, but Poor Protection: Addressing the Neglect of Sandy Beach Ecosystems in Coastal Conservation Planning. Diversity Distrib., 20, 1120–1135.
Harris, L.R., 2008. The Ecological Implications of Sea-Level Rise and Storms for Sandy Beaches in Kwazulu-Natal. MSc Dissertation. University of Kwazulu-Natal, South Africa.
Harris, L.R., 2012. An Ecosystem-Based Patial Conservation Plan for the South African Sandy Beaches. Published PHd Thesis, Nelson Mandela University, Port Elizabeth
Haupt, P., 2011. The Use of Fish Species in a Marine Conservation Plan for Kwazulu-Natal. MSc Thesis, Nelson Mandela Metropolitan University, South Africa.
Hawkins, S.J. & R.G. Hartnoll, 1983. Grazing of Intertidal Algae by Marine Invertebrates. Oceanography & Marine Biology: An Annual Review, 21: 195-282.
000000 FL0
www.erm.com Project No.: 0482086 Client: ASN and Liquid Telecom Page 214
REFERENCES
Hays, G.C. Houghton, J.D.R., Isaacs, C. King, R.S. Lloyd, C. and P. Lovell, 2004. First Records of Oceanic Dive Profiles for Leatherback Turtles, Dermochelys Coriacea, Indicate Behavioural Plasticity Associated With Long-Distance Migration. Animal Behaviour, 67: 733-743.
Heemstra P.C., Fricke H., Hissmann, K., Schauer J. and K. Sink, 2006a. Interactions of Fishes with Particular Reference to Coelacanths In The Canyons At Sodwana Bay and The St Lucia Marine Protected Area of South Africa. S. Afr. J. Sci. 102: 461–465.
Heemstra P.C., Hissmann, K., Fricke H., Smale M. and J. Schauer, 2006b. Fishes of the Deep Demersal Habitat at Ngazidja (Grand Comoro) Island, Western Indian Ocean. S. Afr. J. Sci. 102: 444– 460.
Heemstra, P.C., Freeman, A.L.J., Wong, H.Y., Hensley, D.A. and H.D. Rabesandratana, 1996. First Authentic Capture of A Coelacanth, Latimeria Chalumnae (Pisces: Latimeriidae), Off Madagascar. South African Journal of Science, 92: 150-151.
Heydorn, A.E.F. and K.L. Tinley, 1980. Estuaries of the Cape, Part I. Synopsis of the Cape Coast. Natural Features, Dynamics and Utilization. Stellenbosch, CSIR Research Report, 380, 97.
Heydorn, A.E.F., Bang, N.D., Pearce, A.F., Flemming, B.W., Carter, R.A., Schleyer, M.H., Berry, P.F., Hughes, G.R., Bass, A.J., Wallace, J.H. Van Der Elst, R.P., Crawford, R.J.M. and P.A. Shelton, 1978. Ecology of the Agulhas Current Region: An Assessmnet of Biological Responses to Environmental Parameters in the South- West Indian Ocean. Trans. Roy. Soc. S. Afr., 43(2): 151-190.
Hissmann K., Fricke H., Schauer J., Ribbink A.J., Roberts M., Sink K. and P. Heemstra, 2006. The South African Coelacanths – An Account of What Is Known After Three Submersible Expeditions. South African Journal of Science, 102: 491–501.
Hissmann, K., Fricke, H. and J. Schauer, 2000. Patterns of Time and Space Utilisation in Coelacanths (Latimeria Chalumnae) Determined By Ultrasonic Telemetry. Marine Biolgy, 136, 943– 952.
Hueckel, G.J., Buckley, R.M. and B.L. Benson, 1989. Mitigating Rocky Habitat Loss Using Artificial Reefs. Bulletin of Marine Science, 44: 913 - 922.
Hughes, G. and R. Nel, 2014a. Family Cheloniidae. In: Bates, M.F., Branch, W.R., Bauer, A.M., Burger, M., Marais, J., Alexander, G.J., De Villiers, M.S. (Eds) Atlas and Red List of the Reptiles of South Africa, Lesotho and Swaziland. Suricata 1, Sanbi, Pretoria.
Hughes, G. and R. Nel, 2014b. Family Dermochelyidae. In: Bates, M.F., Branch, W.R., Bauer, A.M., Burger, M., Marais, J., Alexander, G.J., De Villiers, M.S. (Eds) Atlas and Red List of the Reptiles of South Africa, Lesotho and Swaziland. Suricata 1, Sanbi, Pretoria.
Hughes, G.R., 1974b. The Sea Turtles of South East Africa. Phd, University of Natal.
Hughes, G.M. and Y. Itazawa, 1972. The Effect of Temperature on the Respiratory Function of Coelacanth Blood. Experientia, 18, 1247.
Hughes, G.R., 1974a. The Sea Turtles of South East Africa I. Status, Morphology and Distributions. Investl. Rep. Oceanogr. Res. Inst. 35.
Hughes, G.R., 1996. Nesting of the Leatherback Turtle (Dermochelys Coriacea) In Tongaland, Kwazulu-Natal, South Africa 1963-1995. Chelonian Conservation and Biology, 2, 153 - 158.
Hughes, G.R., 2012. Between The Tides: In Search of Sea Turtles, Jacana.
Hughes, G.R., Luschi, P., Mencacci, R. and F. Papi, 1998. The 7000 Km Journey of a Leatherback Turtle Tracked By Satellite. Journal of Experimental Marine Biology and Ecology, 229: 209 - 217.
Hunter, I.T., 1988. Climate and Weather off Natal. In: Coastal Ocean Sciences of Natal, South Africa (Ed. E.H. Schumann). Springer-Verlag, Berlin, 81-100.
000000 FL0
www.erm.com Project No.: 0482086 Client: ASN and Liquid Telecom Page 215
REFERENCES
Hutchings, L., Beckley, L.E., Griffiths, M.H., Roberts, M.J., Sundby, S. and C. Van Der Lingen, 2003. Spawning on the Edge: Spawning Grounds and Nursery Areas around the Southern African Coastline. Marine and Freshwater Research, 53: 307-318.
Iglesias, J.I.P., Urrutia, M.B., Navarro, E., Alvarez-Jorna, P., Larretxea, X., Bougrier, S. and M. Heral, 1996. Variability of Feeding Processes in the Cockle Cerastoderma Edule (L.) In Response to Changes in Seston Concentration and Composition. Journal of Experimental Marine Biology & Ecology, 197: 121-143.
International Whaling Commission (IWC), 1998. Report of the Scientific Committee of the International Whaling Commission.
International Whaling Commission (IWC), 2010. Report of the Sub-Committee on Other Southern Hemisphere Whale Stocks. Journal of Ceatacean Research and Management, 11: 218-251.
IUCN SSC Amphibian Specialist Group & South African Frog Re-assessment Group (SAFRoG). 2016a. Hyperolius pickersgilli. The IUCN Red List of Threatened Species 2016: e.T10644A77165927. http://dx.doi.org/10.2305/IUCN.UK.2016-3.RLTS.T10644A77165927.en.
IUCN SSC Amphibian Specialist Group & South African Frog Re-assessment Group (SA-FRoG) 2016b. Natalobatrachus bonebergi. The IUCN Red List of Threatened Species 2016: e.T58076A77159820. http://dx.doi.org/10.2305/IUCN.UK.2016-3.RLTS.T58076A77159820.en.
Jackson, L.F. and S. Lipschitz, 1984. Coastal Sensitivity Atlas of Southern Africa. Pretoria, Department of Transport: 34.
Johnson, R., Bester M.N., Dudley, S.F.J., Oosthuizen, W.H., Meÿer, M., Hancke, L. & E. Gennari, 2009. Coastal Swimming Patterns of White Sharks (Carcharodon Carcharias) At Mossel Bay, South Africa. Environ Biol Fish, 85: 189–200.
Karczmarski, L., 1996. Ecological Studies of Humpback Dolphins Sousa Chinensis in the Algoa Bay Region, Eastern Cape, South Africa. University of Port Elizabeth.
Karczmarski, L., Cockcroft, V.G. and A. Mclachlan, 2000. Habitat Use and Preferences of Indo- Pacific Humpback Dolphins Sousa Chinensis in Algoa Bay, South Africa. Marine Mammal Science, 16(1): 65–79.
Kee B and Nichols G. 2004. Hands-on: East Coast Dune Plants (7th Edition). WESSA Share-Net. February 2004.
Keith, M., 1999. Population Biology of Humpback Dolphins in Richards Bay, South Africa. Population (English Edition). University of Pretoria.
Kenny, A.J. and H.L. Rees, 1994. The Effects of Marine Gravel Extraction on the Macrobenthos: Early Post-Dredging Recolonisation. Mar. Poll. Bull., 28: 442-447.
Kenny, A.J. and H.L. Rees, 1996. The Effects of Marine Gravel Extraction on the Macrobenthos: Results 2 Years Post-Dredging. Mar. Poll. Bull., 32: 615-622.
Koch, A. and R. Johnson, 2006. White Shark Abundance: Not a Causative Factor in Numbers of Shark Bite Incidents. In Nel, D.C. & T.P. Peschak (Eds) Finding A Balance: White Shark Conservation and Recreational Safety in the Inshore Waters of Cape Town, South Africa; Proceedings of a Specialist Workshop. Wwf South Africa Report Series - 2006/Marine/001.
Koper, R.P and S. Plön, 2012. The Potential Impacts of Anthropogenic Noise on Marine Animals and Recommendations for Research in South Africa. Ewt Research & Technical Paper No. 1. Endangered Wildlife Trust, South Africa.
Koper, R.P., Karczmarski, L., Du Prees, D. and S. Plön, 2016. Sixteen Years Later: Occurrence, Group Sizes, and Habitat Use of Humpback Dolphins (Sousa Plumbea) In Algoa Bay, South Africa.
000000 FL0
www.erm.com Project No.: 0482086 Client: ASN and Liquid Telecom Page 216
REFERENCES
Lambardi, P., Lutjeharms, J.R.E., Menacci, R., Hays, G.C. and P. Luschi, 2008. Influence of Ocean Currents on Long-Distance Movement of Leatherback Sea Turtles in the Southwest Indian Ocean. Marine Ecology Progress Series, 353: 289–301.
Lamberth, S.J., Drapeau, L and G.M. Branch, 2009. The Effects of Altered Freshwater Inflows on Catch Rates of Non-Estuarine-Dependent Fish in a Multispecies Nearshore Linefishery. Estuarine, Coastal and Shelf Science, 84: 527–538.
Lamont, T. and R.G. Barlow, 2015. Environmental Influence on Phytoplankton Production during Summer on the Kwazulu-Natal Shelf of the Agulhas Ecosystem. African Journal of Marine Science, 37: 485–501.
Lampert, K.P., Blassmann, K., Hissmann, K., Schauer, J., Shunula, P., Kharousy, Z., Ngatunga, B.P., Fricke, H. and M. Schartl, 2013. Single Male Paternity in Coelacanths. Nature Communications, Published Online 18.09.2013, Doi: 10.1038/Ncomms3488
Lauret-Stepler, M., Bourjea, J., Roos, D., Pelletier, D., Ryan, P., Ciccione, S. and H. Grizel, 2007. Reproductive Seasonality and Trend of Chelonia Mydas In The Sw Indian Ocean: A 20 Yr Study Based On Track Counts. Endangered Species Research, 3: 217-227.
Lavelle P, Decaëns T, Aubert M, Barot S, Blouin M, Bureau F and Margerie P. 2006. Soil invertebrates and ecosystem services. European Journal of Soil Biology, 42, S3–S15.
Littler, M.M., Martz, D.R. and D.S. Littler, 1983. Effects of Recurrent Sand Deposition on Rocky Intertidal Organisms: Importance of Substrate Heterogeneity in a Fluctuating Environment. Marine Ecology Progress Series, 11: 129-139.
Lohmann, K. J., Lohmann, C. M. and N.F. Putman, 2007. Magnetic Maps in Animals: Nature's Gps. Journal of Experimental Biology, 210, 3697-3705.
Lombard, A.T., Strauss, T., Harris, J., Sink, K., Attwood, C. and L. Hutchings, 2004. National Spatial Biodiversity Assessment 2004: South African Technical Report Volume 4: Marine Component.
Luschi, P., Hays, G.C. and F. Papi, 2003a. A Review of Long-Distance Movements by Marine Turtles, and the Possible Role of Ocean Currents. Oikos, 103, 293 – 302.
Luschi, P., Lutjeharms, J.R.E., Lambardi, P., Mencacci, R., Hughes, G.R. and G.C. Hays, 2006. A Review of Migratory Behaviour of Sea Turtles off Southeastern Africa. South African Journal of Science, 102, 51 - 57.
Luschi, P., Sale, A., Mencacci, R., Hughes, G.R., Lutjeharms, J.R.E. and F. Papi, 2003b. Current Transport of Leatherback Sea Turtles (Dermochelys Coriacea) In the Ocean. Proceedings of the Royal Society: Biolgical Sciences, 270, 129 - 132.
Lutjeharms J.R.E., Cooper, J. and M. Roberts, 2000b. Dynamic Upwelling at the Inshore Edge of the Agulhas Current. Continental Shelf Research, 20: 737761.
Lutjeharms, J.R.E, Valentine, H.R. and R.C. Van Ballegooyen, 2000a. The Hydrography and Water Masses of the Natal Bight, South Africa. Continental Shelf Research, 20: 1907-39.
Lutjeharms, J.R.E. and H.R. Roberts, 1988. The Agulhas Pulse: An Extreme Transient on the Agulhas Current. Journal of Geophysical Research, 93: 631-45.
Lutjeharms, J.R.E., (Ed.), 2006. The Agulhas Current. Heidelberg, Berlin: Springer-Verlag.
Lutjeharms, J.R.E., Gründlingh, M.L. and R.A. Carter, 1989. Topographically Induced Upwelling in the Natal Bight. S. Afr. J. Sci., 85 (5): 310-316.
Macissac, K., Bourbonnais, C., Kenchington, E.D., Gordon Jr. and S. Gass, 2001. Observations on the Occurrence and Habitat Preference of Corals in Atlantic Canada. In: (Eds.) J.H.M. Willison, J. Hall, S.E. Gass, E.L.R. Kenchington, M. Butler, and P. Doherty. Proceedings of the First International
000000 FL0
www.erm.com Project No.: 0482086 Client: ASN and Liquid Telecom Page 217
REFERENCES
Symposium on Deep-Sea Corals. Ecology Action Centre and Nova Scotia Museum, Halifax, Nova Scotia.
Mackay, C.F., Untiedt, C.B. and L. Hein, 2016. Local Habitat Drivers of Macrobenthosin The Northern, Central and Southern Kwazulu-Natal Bight, South Africa, African Journal of Marine Science, 38:Sup1, S105-S121, Doi: 10.2989/1814232x.2016.1146631
Macleod, C.D. and A. D’Amico, 2006. A Review of Beaked Whale Behaviour and Ecology In Relation To Assessing and Mitigating Impacts of Anthropogenic Noise. Journal of Cetacean Research and Management, 7(3): 211–221.
Marine & Coastal Management (M&Cm), 2007. Recommendations for the Sustainable Management of the Kwazulu-Natal Trawl Fishery in 2007. Unpublished Memorandum for Ministerial Approval.
Marshall, D.J. and C.D. Mcquaid, 1993. Differential Physiological and Behavioural Responses of the Intertidal Mussels, Choromytilus Meridionalis (Kr.) and Perna Perna L., To Exposure to Hypoxia and Air: A Basis for Spatial Separation. Journal of Experimental Marine Biology and Ecology, 171: 225- 237.
Martin A.K. and B.W. Flemming, 1988. Physiography, Structure and Geological Evolution of the Natal Continental Shelf. In Coastal Ocean Studies off Natal, South Africa. Lecture Notes on Coastal and Estuarine Studies, vol. 26, ed. E.H.Schumann, Springer-Verlag, New York, 11–46.
Maurer, D.L., Leathem, W., Kinner, P. and J. Tinsman, 1979. Seasonal Fluctuations in Coastal Benthic Invertebrate Assemblages. Estuarine and Coastal Shelf Science, 8: 181-193.
Mccauley, R.D., 1994. Seismic Surveys. In: Swan, J.M., Neff, J.M., Young, P.C. (Eds.). Environmental Implications of Offshore Oil and Gas Development in Australia - The Findings of an Independent Scientific Review. Apea, Sydney, Australia, 695.
Mcclurg, T.P. and A. Blair, 2007. Benthic Fauna. In: Environmental Studies in the Richards Bay Offshore Outfalls Region. Report No. 20. Surveys Made During 2006/2007. CSIR Report CSIR/Nre/Eco/Er/2008//0027/C.
Mcclurg, T.P., 1998. Benthic Macrofauna. In: Environmental Studies in the Richards Bay Offshore Outfalls Region. Report No. 11. Surveys Made During 1997. East Coast Program; Division of Water, Environment and Forestry Technology; CSIR, Durban. CSIR Report Env/Ecp/Ext: 97-Jec17.
Mcclurg, T.P. and A. Blair, 2005. Benthic Fauna. In: Environmental Studies in the Richards Bay Offshore Outfalls Region. Report No. 18. Surveys Made During 2004. East Coast Programme;
Division of Water, Environment and Forestry Technology; CSIR, Durban. CSIR Report Env-D-C-2005- 031.
Mcclurg, T.P. and A. Blair, 2006. Benthic Fauna. In: Environmental Studies in the Richards Bay Offshore Outfalls Region. Report No. 19. Surveys Made During 2005. CSIR Report CSIR/Nre/Pw/Er/2006/0068/C.
Mcclurg, T.P. and A. Blair, 2008. Environmental Studies in the Richards Bay Offshore Outfalls Region. Report No. 21. Surveys Made In 2007/2008. CSIR Report CSIR/Nre/Eco/Er/2008/ 0145/C.
Mcclurg, T.P., Blair, A. and S.V. Gumede, 1999. Benthic Fauna. In: Environmental Studies in the Richards Bay Offshore Outfalls Region. Report No. 12. Surveys Made During 1998. East Coast Program; Division of Water, Environment and Forestry Technology; CSIR, Durban. CSIR Report Env/Ecp/Ext: 98-Jeoof.
Mcclurg, T.P., Blair, A. and S.V. Gumede, 2000. Benthic Fauna. In: Environmental Studies in the Richards Bay Offshore Outfalls Region. Report No. 13. Surveys Made During 1999. East Coast Program; Division of Water, Environment and Forestry Technology; CSIR, Durban. CSIR Report Env- D-C-2000-011.
000000 FL0
www.erm.com Project No.: 0482086 Client: ASN and Liquid Telecom Page 218
REFERENCES
Mcclurg, T.P., Blair, A. and S.V. Gumede, 2001. Benthic Fauna. In: Environmental Studies in the Richards Bay Offshore Outfalls Region. Report No. 14. Surveys Made During 2000. East Coast Program; Division of Water, Environment and Forestry Technology; CSIR, Durban. CSIR Report Env- D-C-2001-015.
Mcclurg, T.P., Blair, A. and S.V. Gumede, 2002. Benthic Fauna. In: Environmental Studies in the Richards Bay Offshore Outfalls Region. Report No. 15. Surveys Made During 2001. East Coast Programme; Division of Water, Environment and Forestry Technology; CSIR, Durban. CSIR Report Env-D-C-2002-003
Mcclurg, T.P., Blair, A. and T. Mapukata, 2004. Benthic Fauna. In: Environmental Studies in the Richards Bay Offshore Outfalls Region. Report No. 17. Surveys Made During 2003. East Coast Programme; Division of Water, Environment and Forestry Technology; CSIR, Durban. CSIR Report Env-D-C-2004-013.
Mcclurg, T.P., Blair, A. and T. Mapukata, 2003. Benthic Fauna. In: Environmental Studies in the Richards Bay Offshore Outfalls Region. Report No. 16. Surveys Made During 2002. East Coast Programme; Division of Water, Environment and Forestry Technology; CSIR, Durban. CSIR Report Env-D-C-2003-003.
Mcquaid, C.D. and K.M. Dower, 1990. Enhancement of Habitat Heterogeneity and Species Richness on Rocky Shores Inundated By Sand. Oecologia, 84: 142-144.
Melly, B., 2011. The Zoogeography of the Cetaceans in Algoa Bay. Rhodes University. Retrieved From Http://Eprints.Ru.Ac.Za/2489/1/Melly-Msc-Tr11-.Pdf
Mortimer, J., 1984. Marine Turtles in the Republic of the Seychelles: Status and Management Report On Project 1809 (1981-1984). International Union for Conservation of Nature and Natural Resources World Wildlife Fund.
Mucina, L, Adams, J.B., Knevel, I.C., Rutherford, M.C., Powrie, L.W., Bolton, J.J., van der Merwe, J.H., Anderson, R.J., Bornman, T.G., le Roux, A and Janssen, A.M. 2006a. CoastaL Vegetaion of South Africa. In: Mucina L and Rutherford MC (eds). The Vegetation of South Africa, Lesotho and Swaziland. Strelitzia 19: 659-696. South African National Biodiversity Institute, Pretoria.
Mucina, L and Geldenhys, C.J. 2006. Afrotemperate, Subtropical and Azonal Forests. In: Mucina L and Rutherford MC (eds). The Vegetation of South Africa, Lesotho and Swaziland. Strelitzia. 19: 585-614. South African National Biodiversity Institute, Pretoria.
Mucina, L and Rutherford, M.C (eds). The Vegetation of South Africa, Lesotho and Swaziland. Strelitzia 19. South African National Biodiversity Institute, Pretoria. 807.
Muir, D., Kunnen, T. and U.M. Scharler, 2016. A Seasonal Comparison of Prokaryote Numbers, Biomass and Heterotrophic Productivity in Waters of the Kwazulu-Natal Bight, South Africa. In: Roberts Mj, Fennessy St, Barlow Rg (Eds), Ecosystem Processes in the Kwazulu-Natal Bight. African Journal of Marine Science 38(Supplement), S123–S138.
Natoli, A., Peddemors, V.M. and A.R. Hoelzel, 2008. Population Structure of Bottlenose Dolphins (Tursiops Aduncus) Impacted By Bycatch along the East Coast of South Africa. Conservation Genetics, 9: 627–636.
Nel, R., 2010. Sea Turtles of Kwazulu-Natal: Data Report for the 2009/10 Season. In: Hughes, G. R.
& Bachoo, S. (Eds.). Ezemvelo.
Nel, R., Punt, A.E. and G.R. Hughes, 2013. Are Coastal Protected Areas Always Effective in Achieving Population Recovery for Nesting Sea Turtles? Plos One, 8, E63525.
NEMBA. 2004. National Environmental Management: Biodiversity Act. RSA Government Gazette No. 10 of 2004: 7 June 2004, No. 26436. Cape Town, RSA.
000000 FL0
www.erm.com Project No.: 0482086 Client: ASN and Liquid Telecom Page 219
REFERENCES
Newell, R.C., Seiderer, L.J. and D.R. Hitchcock, 1998. The Impact of Dredging Work in Coastal Waters: A Review of the Sensitivity to Disturbance and Subsequent Recovery of Biological Resources on the Sea Bed. Oceanogr. Mar. Biol. Ann. Rev., 36: 127–178.
Nikaido M., Sasakia T., Emersonb J.J., Aibaraa M., Mzighania S.I., Budebac Y.L., Ngatungac B.P, Iwatad M., Abed Y., Lie W-H. and N. Okadaa, 2011. Genetically Distinct Coelacanth Population off The Northern Tanzanian Coast. Www.Pnas.Org/Cgi/Doi/10.1073/ Pnas.1115675108.
Nrc., 2003. Ocean Noise and Marine Mammals. National Academy Press, Washington, Dc.
Nyandwi, N., 2006. Coastal Tanzania, a New Home to the Living Coelacanth: An Oceanographic Analysis, Tanzania Journal of Science, 32(2), 33-38.
Nyandwi, N., 2010. Geomorphological Potential of Coelacanth Habitat across Mozambique-Tanzania Border. Tanzania Journal of Science, Short Communication, 36, 113-118.
O’donoghue, S.H., Drapeau, L. and V.M. Peddemors, 2010b. Broad-Scale Distribution Patterns of Sardine and Their Predators In Relation To Remotely Sensed Environmental Conditions During The Kwazulu-Natal Sardine Run. African Journal of Marine Science, 32: 279–291.
O’donoghue, S.H., Drapeau, L., Dudley, S.F.J. and V.M. Peddemors, 2010a. The Kwazulu-Natal Sardine Run: Shoal Distribution In Relation To Nearshore Environmental Conditions, 1997 To 2007. African Journal of Marine Science, 32: 293–307.
O’donoghue, S.H., Whittington, P.A., Dyer, B.M. and V.M. Peddemors, 2010c Abundance and Distribution of Avian and Marine Mammal Predators of Sardine Observed During The 2005 Kwazulu- Natal Sardine Run Survey. African Journal of Marine Science, 32: 361–374.
Oliff, W.D., 1973. Chemistry and Productivity at Richards Bay. CSIR/Nprc Oceanography Division Contract Report Cfis 37b. Durban, South Africa.
Olsen, O., 1913. On The External Characters and Biology of Bryde’s Whale (Balaenoptera Brydei*) A New Rorqual from the Coast of South Africa. Proceedings of the Zoological Society of London, 1073- 1090.
Otway, N.M., Gray, C.A., Craig, J.R., Mcvea, T.A. and J.E. Ling, 1996. Assessing the Impacts of Deepwater Sewage Outfalls on Spatially- and Temporally-Variable Marine Communities. Marine Environmental Research, 41: 45-71.
Papi, F., Luschi, P., Akesson, S., Capogrossi, S. and G. Hays, 2000. Open-Sea Migration of Magnetically Disturbed Sea Turtles. Journal of Experimental Biology, 203: 3435-3443.
Pardini, A.T., Jones, C.S., Noble, L.R., Kreiser, B., Malcolm, H., Bruce, B.D., Stevens, J.D., Cliff, G., Scholl, M.C., Francis, M., Duffy, C.A.J. and A.P. Martin, 2001. Sex-Biased Dispersal of Great White Sharks. Nature 412: 139 – 140.
Pearce, A.F., 1977a. The Shelf Circulation off The East Coast of South Africa. CSIR Professional Research Series, 1, 220.
Pearce, A.F., 1977b. Some Features of the Upper 500 M of the Agulhas Current. Journal of Marine Research, 35: 731-753.
Pearce, A.F., Schumann, E.H. and G.S.H. Lundie, 1978. Features of the Shelf Circulation off The Natal Coast. S. Afr. J. Sci., 74: 328-331.
Peddemors, V.M., 1999. Delphinids of Southern Africa. A Review of Their Distribution, Status and Life History. J. Cetacean Res. Manage., 1(2): 157-166.
Peeters, H., Murphy, P. and N. Flemming,(eds), 2009, North Sea Prehistory Research and Management Framework, Amersfoort.
Penry, G., Findlay, K. and P. Best, 2016. A Conservation Assessment of Balaenoptera Edeni. In:
000000 FL0
www.erm.com Project No.: 0482086 Client: ASN and Liquid Telecom Page 220
REFERENCES
M.F. Child, L. Roxburgh, D. Raimondo, E. Do Linh San, J. Selier and H. Davies-Mostert (Eds), The Red List of Mammals of South Africa, Swaziland and Lesotho. South African National Biodiversity Institute and Endangered Wildlife Trust, South Africa.
Penry, G.S., 2010. Biology of South African Bryde’s Whales. Phd Thesis. University of St Andrews, Scotland, Uk.
Penry, G.S., Cockcroft, V.G. and P.S. Hammond, 2011. Seasonal Fluctuations In Occurrence of Inshore Bryde's Whales In Plettenberg Bay, South Africa, With Notes On Feeding and Multispecies Associations, African Journal of Marine Science, 33/3: 403-414.
Pereira, M.A.M., Videira, E.J.S. and C.M.M. Louro, 2008. Sea Turtles of Mozambique: Report. In: Cabo Delgado Biodiversity and Tourism.
Perry, J., 2005. Environmental Impact Assessment for Offshore Drilling The Falkland Islands To Desire Petroleum Plc., 186.
Pidcock, S., Burton, C. and M. Lunney, 2003. The Potential Sensitivity of Marine Mammals To Mining and Exploration In The Great Australian Bight Marine Park Marine Mammal Protection Zone. An Independent Review and Risk Assessment Report To Environment Australia. Marine Conservation Branch. Environment Australia, Cranberra, Australia, 85.
Plön, S., 2004. The Status and Natural History of Pygmy (Kogia Breviceps) and Dwarf (K. Sima) Sperm Whales off Southern Africa. Phd Thesis. Department of Zoology & Entomology (Rhodes University), 551.
Pollard, E., Bates, R., Ichumbaki, E.B. and Bita, C, 2016. Shipwreck Evidence from Kilwa, Tanzania. The International Journal of Nautical Archaeology, 45:2, 352–369.
Pretorius, M., Huggett, J.A. and M.J. Gibbons, 2016. Summer and Winter Differences In Zooplankton Biomass, Distribution and Size Composition In The Kwazulu-Natal Bight, South Africa. In: Roberts Mj, Fennessy St, Barlow Rg (Eds), Ecosystem Processes in the Kwazulu-Natal Bight. African Journal of Marine Science 38(Supplement), S155–S168.
Pulfrich, A. and G.M. Branch, 2014. Effects of Sediment Deposition From Namibian Diamond Mines On Intertidal and Subtidal Rocky-Reef Communities and The Rock Lobster Jasus Lalandii. Estuarine, Coastal and Shelf Science, 150: 179-191.
Pulfrich, A., Parkins, C.A. and G.M. Branch, 2003a. The Effects of Shore-Based Diamond-Diving On Intertidal and Subtidal Biological Communities and Rock Lobsters in Southern Namibia. Aquatic Conservation: Marine & Freshwater Ecosystems, 13: 257-278.
Pulfrich, A., Parkins, C.A., Branch, G.M., Bustamante, R.H. and C.R. Velásquez, 2003b. The Effects of Sediment Deposits from Namibian Diamond Mines on Intertidal and Subtidal Reefs and Rock- Lobster Populations. Aquatic Conservation: Marine & Freshwater Ecosystems, 13: 233-255.
Raimondo, D., von Staden, L., Foden, W., Victor, J.E., Helme, N.A., Turner, R.C., Kamundi, D.A and Manyama, P.A. 2009. Red list of South African plants. Strelitzia 25. South African National Biodiversity Institute (SANBI), Pretoria.
Ramsay, P.J. and W.R. Miller, 2006. Marine Geophysical Technology Used To Define Coelacanth Habitats On The Kwazulu-Natal Shelf, South Africa. S. Afr. J. Sci., 102, 427–435.
Relini, G., Zamboni, N., Tixi, F. and G. Torchia, 1994. Patterns of Sessile Macrobenthos Community Development on an Artificial Reef in the Gulf of Genoa (Northwestern Mediterranean). Bulletin of Marine Science, 55: 745 - 771.
Ribbink, A.J. and M. Roberts, 2006. African Coelacanth Ecosystem Programme: An Overview of the Conference Contributions. S. Afr. J. Sci., 102, 409-415.
000000 FL0
www.erm.com Project No.: 0482086 Client: ASN and Liquid Telecom Page 221
REFERENCES
Roberts, M.J. and C. Nieuwenhuys, 2016. Observations and Mechanisms of Upwelling in the Northern Kwazulu-Natal Bight, South Africa, African Journal of Marine Science, 38:Sup1, S43-S63, Doi: 10.2989/1814232x.2016.1194319
Roberts, M.J., Nieuwenhuys, C. and L.A. Guastella, 2016. Circulation of Shelf Waters in the Kwazulu- Natal Bight, South Africa, African Journal of Marine Science, 38:Sup1, S7-S21, Doi: 10.2989/1814232x.2016.1175383
Roberts, M.J., Ribbink, A.J., Morris, T., Van Den Berg, M.A., Engelbrecht, D.C. and R.T. Harding, 2006. Oceanographic Environment of the Sodwana Bay Coelacanths (Latimeria Chalumnae), South Africa. S. Afr. J. Sci., 102, 435-443.
Roberts, M.J., Van Der Lingen, C.D. and M. Van Den Berg, 2010. Shelf Currents, Lee-Trapped and Transient Eddies On the Inshore Boundary of The Agulhas Current, South Africa: Their Relevance To The Kwazulu-Natal Sardine Run. African Journal of Marine Science, 32: 423–447.
Ross, G.J.B., 1979. Records of Pygmy and Dwarf Sperm Whales, Genus Kogia, From Southern Africa, With Biological Notes and Some Comparisons. Annals of the Cape Province Museum (Natural History), 11: 259-327.
Ross, G.J.B., 1984. The Smaller Cetaceans of the East Coast of Southern Africa. Ann. Cape. Prov. Mus. (Nat. Hist.), 15 (2).
Ross, G.J.B., Cockcroft V.G. and D.S. Butterworth, 1987. Offshore Distribution of Bottlenosed Dolphins in Natal Coastal Waters and Algoa Bay, Eastern Cape. S. Afr. J. Zool., 22: 50-56.
Ross, G.J.B., Cockcroft, V.G., Melton D.A. and D.S. Butterworth, 1989. Population Estimates for Bottlenose Dolphins Tursiops Truncatus in Natal and Transkei Waters. S. Afr. J. Mar. Sci., 8: 119-129.
Roux, J.-P., Braby, R.J. and Best, P.B., 2015. Does Disappearance Mean Extirpation? The Case of Right Whales off Namibia. Marine Mammal Science, 31(3): 1132–1152.
Rowat, D. and M. Gore, 2007. Regional Scale Horizontal and Local Scale Vertical Movements of Whale Sharks in the Indian Ocean off Seychelles. Fisheries Research, 84: 32–40.
Rowat, D., 2007. Occurrence of the Whale Shark (Rhincodon Typus) in the Indian Ocean: A Case for Regional Conservation. Fisheries Research, 84: 96-101.
Rutherford M.C., Mucina L. and L.W. Powrie, 2006. Biomes and Bioregions of Southern Africa. In: The Vegetation of South Africa, Lesotho and Swaziland. Mucina L. and Rutherford M.C. (Eds.).
Saayman, G.S., Bower, D., and C.K. Tayler, 1972. Observations on Inshore and Pelagic Dolphins on the South-Eastern Cape Coast of South Africa. Koedoe, 15: 1-24.
Salmon, M., 2003. Artificial Night Lighting and Sea Turtles. Biologist, 50: 163 - 168.
SANBI. 2017. Red List of South African Plants: An online checklist. Version 2015.1. South African National Biodiversity Institute (SANBI), Pretoria. Accessed from redlist.sanbi.org, October 2017.
SANBI and DEAT. 2009. Threatened Ecosystems in South Africa: Descriptions and Maps. DRAFT for Comment. South African National Biodiversity Institute, Pretoria, South Africa.
Santos, C., 1993. A Multivariate Study of Biotic and Abiotic Relationships in a Subtidal Algal Stand. Marine Ecology Progress Series, 94: 181-190.
Scharler, U.M., Ayers, M.J., De Lecea, A.M., Pretorius, M., Fennessy, S.T., Huggett, J.A., Mackay,
C.F. and D. Muir, 2016. Riverine Influence Determines Nearshore Heterogeneity of Nutrient (C, N, P) Content and Stoichiometry In The Kwazulu-Natal Bight, South Africa, African Journal of Marine Science, 38:Sup1, S193-S203, Doi: 10.2989/1814232x.2016.1150347
Schartl, M., Hornung, U., Hissmann, K., Schauer, J. and H. Fricke, 2005. Relatedness among East African Coelacanths. Nature, 435, 901.
000000 FL0
www.erm.com Project No.: 0482086 Client: ASN and Liquid Telecom Page 222
REFERENCES
Schiel, D.R. and M.S. Foster, 1986. The Structure of Subtidal Algal Stands In Temperate Waters. Oceanography & Marine Biology: An Annual Review, 24: 265-307.
Schleyer, M.H., 1985. Chaetognaths as Indicators of Water Masses in the Agulhas Current System. Investl. Rep. Oceanogr. Res. Inst., Durban, 61, 20.
Schratzberger, M., Rees, H.L. and S.E. Boyd, 2000a. Effects of Simulated Deposition of Dredged Material on Structure of Nematode Assemblages - The Role of Burial. Mar. Biol., 136: 519-530.
Schratzberger, M., Rees, H.L. and S.E. Boyd, 2000b. Effects of Simulated Deposition of Dredged Material on Structure of Nematode Assemblages - The Role of Contamination. Mar. Biol., 137: 613- 622.
Schroeder, B.A., Foley, A.M. and D.A. Bagley, 2003. Nesting Patterns, Reproductive Migrations, and Adult Foraging Areas of Loggerhead Turtles. Loggerhead Sea Turtles, 114-124.
Schumann, E.H., 1988. Physical Oceanography off Natal. In: Coastal Ocean Sciences of Natal. South Africa (Ed. E.H. Schumann). Springer Verlag, Berlin, 101-130.
Schumann, E.H., 1998. The Coastal Ocean off Southeast Africa, Including Madagascar Coastal Segment (15, W). In: The Sea, Vol.11. Robinson, A.R. and Brink, K. (Eds). John Wiley & Sons, Inc.
Schumann, E.H. and J.A. Martin, 1991. Climatological Aspects of the Coastal Wind Field at Cape Town, Port Elizabeth and Durban. South African Geography Journal, 73: 48-51.
Schumann, E.H., 1986. Bottom Boundary Layer Observations Inshore of the Agulhas Current. S. Afr. J. Mar. Sci., 4: 93-102.
Scott-Shaw, C.R. 1999. Rare and threatened plants of KwaZulu-Natal and neighbouring regions. KwaZulu-Natal Nature Conservation Service, Cascades.
Scott-Shaw, C.R and Escott, B.J (Eds). 2011. KwaZulu-Natal Provincial Pre-Transformation Vegetation Type Map – 2011. Unpublished GIS Coverage [kznveg05v2_1_11_wll.zip]. Biodiversity Conservation Planning Division, Ezemvelo KZN Wildlife, P. O. Box 13053, Cascades, Pietermaritzburg, 3202.
Seapy, R.R. and M.M. Littler, 1982. Population and Species Diversity Fluctuations in A Rocky Intertidal Community Relative To Severe Aerial Exposure and Sediment Burial. Mar. Biol., 71: 87-96.
Shamblin, B. M., Bolten, A. B., Abreu-Grobois, F. A., Bjorndal, K. A., Cardona, L., Carreras, C. C., Clusa, M., Monzón-Argüello, C., Nairn, C. J., Nielsen, J. T., Nel, R., Soares, L. S., Stewart, K. R., Türkozan, O. and P.H. Dutton, 2014. Loggerhead Turtle Phylogeography and Stock Structure Revisited With Expanded Mitochondrial Control Region Sequences. Plos One.
Shannon, L.V., 1985. The Benguela Ecosystem. Part 1. Evolution of the Benguela, Physical Features and Processes. Oceanogr. Mar. Biol. Ann. Rev., 23: 105-182.
Sink, K. and C. Lawrence, 2008. Threatened Marine and Coastal Species In Southern Africa. Sanbi Report, 16.
Sink, K., Boshoff, W., Samaai, T., Timm, P.G. and S.E. Kerwath, 2006. Observations of the Habitats and Biodiversity of the Submarine Canyons at Sodwana Bay. S. Afr. J. Sci., 102: 466–474.
Sink, K., Holness, S., Harris, L., Majiedt, P., Atkinson, L., Robinson, T., Kirkman, S., Hutchings, L., Leslie, R., Lamberth, S., Kerwath, S., Von Der Heyden, S., Lombard, A., Attwood, C., Branch, G., Fairweather, T., Taljaard, S., Weerts, S., Cowley, P., Awad, A., Halpern, B., Grantham, H. and T. Wolf, 2012. National Biodiversity Assessment 2011: Technical Report. Volume 4: Marine and Coastal Component. South African National Biodiversity Institute, Pretoria.
Sink, K.J., Attwood, C.G., Lombard, A.T., Grantham, H., Leslie, R., Samaai, T., Kerwath, S., Majiedt, P., Fairweather, T., Hutchings, L., Van Der Lingen, C., Atkinson, L.J., Wilkinson, S., Holness, S. and
000000 FL0
www.erm.com Project No.: 0482086 Client: ASN and Liquid Telecom Page 223
REFERENCES
T. Wolf, 2011. Spatial Planning To Identify Focus Areas for Offshore Biodiversity Protection in South Africa. Unpublished Report. Cape Town: South African National Biodiversity Institute.
Slattery, M. and D. Bockus, 1997. Sedimentation in Mcmurdo Sound, Antarctica: A Disturbance Mechanism for Benthic Invertebrates. Polar Biology, 18(3): 172-179.
Smith, C.L., Rand, R.S., Schaeffer, B. and J.W. Atz, 1975. Latimeria, The Living Coelacanth, Is Ovoviviparous. Science, 190:1105-1106.
Tinley, K.L. 1985. Coastal Dunes of South Africa. Report produced by the Committee for Nature Conservation Research National Programme for Ecosystem Research. South African National Scientifc Programmes Report No. 109.
Tucek, J., Nel, R., Girandot, M. and G. Hughes, 2018. Estimating Reproductive Age and Size of Loggerhead Sea Turtles. Endangered Species Research.
Turner, M., 1988. Shipwrecks and Salvage in South Africa: 1505 to the Present. C Struik. Cape Town.
Turpie, J.K. and S.J. Lamberth, 2010. Characteristics and Value of the Thukela Banks Crustacean and Linefish Fisheries, and the Potential Impacts of Changes in River Flow. African Journal of Marine Science, 32: 613-624.
Turpie, J.K., 1995. Prioritizing South African Estuaries for Conservation: A Practical Example Using Waterbirds. Biol. Cons., 74: 175-185.
Turpie, J.K., Beckley, L.E. and S.M. Katua, 2000. Biogeography and Selection of Priority Areas for Conservation of South African Coastal Fishes. Biological Conservation, 92: 59–72.
Tyack, P.L., Zimmer, W.M.X., Moretti, D., Southall, B.L., Claridge, D.E., Durban, J.W., Clark, C.W., D'Amico, A., DiMarzio, N., Jarvis, S., McCarthy, E., Morrissey, R., Ward, J. and I.L. Boyd, 2011.
Beaked Whales Respond To Simulated and Actual Navy Sonar, 6(3). Doi:10.1371/Journal.Pone.0017009
Uken, R and N. Mkize, 2012. Unconsolidated Sediment Distribution within the Kwazulu-Natal Bight. Extended Abstract, Acep., 4.
Underhill, L.G. and J. Cooper, 1982. Counts of Waterbirds at Coastal Wetlands in Southern Africa. 1978 To 1981. Unpublished Ms. Pfiao.
Unep-Wcmc, 2011. Isimangaliso Wetland Park Kwazulu-Natal, South Africa. Http://Www.Unep- Wcmc.Org/Medialibrary/2011/06/29/0efed969/Isimangaliso.Pdf.
Untiedt, C.B. and C.F. Mackay, 2016. Distribution and Feeding Modes of Macrobenthos Within Three Oceanographic Feature Areas of The Kwazulu-Natal Bight, South Africa, African Journal of Marine Science, 38:Sup1, S91-S104, Doi: 10.2989/1814232x.2016.1144651
Van Der Elst, R., 1976. Game Fish of the East Coast of Southern Africa. I: The Biology of the Elf Pomatomus Saltatrix (Linneaus) In the Coastal Waters of Natal. Ori Investl. Rep., 44, 59.
Van Der Elst, R., 1981. A Guide to the Common Sea Fishes of Southern Africa. Struik, Cape Town, 367.
Van Der Elst, R., 1988. Shelf Ichthyofauna of Natal. In: Coastal Ocean Sciences of Natal, South Africa (Ed. E.H. Schumann). Springer-Verlag, Berlin, 209-225.
Van Der Molen, J.S., Scharler, U.M. and D. Muir, 2016. Species Composition, Abundance and Biomass of Microphytoplankton in the Kwazulu-Natal Bight on the East Coast of South Africa. In: Roberts, M.J., Fennessy, S.T., Barlow, R.G. (Eds), Ecosystem Processes in the Kwazulu-Natal Bight. African Journal of Marine Science 38(Supplement), S139–S153.
000000 FL0
www.erm.com Project No.: 0482086 Client: ASN and Liquid Telecom Page 224
REFERENCES
Venter P., Timm P.,Gunn G., Le Roux E., Serfontein C., Smith P., Smith E., Bensch M., Harding D. and P. Heemstra, 2000. Discovery of a Viable Population of Coelacanths (Latimeria Chalumnae Smith, 1939) At Sodwana Bay, South Africa. S. Afr. J. Sci,. 96: 567–568.
Vinding, K. Bester, M., Kirkman, S.P., Chivell, W. and S.H. Elwen, 2015. The Use of Data from a Platform of Opportunity (Whale Watching) To Study Coastal Cetaceans on the Southwest Coast of South Africa. Tourism in Marine Environments, 11(1): 33-54.
Vries, F.T, De Thébault, E., Liiri, M., Birkhofer, K., Tsiafouli, M.A., and Bjørnlund, L. 2013. Soil food web properties explain ecosystem services across European land use systems. PNAS, 110(35), 14296–14301.
Wallace, B.P. and T.T. Jones, 2008. What Makes Marine Turtles Go: A Review of Metabolic Rates and Their Consequences. Journal of Experimental Marine Biology and Ecology, 356: 8-24.
Weisser, P.J. 1980. The Dune Forest of Maputaland. In: Bruton MN and Cooper KH. Studies on the Ecology of Maputaland. Cape and Transvaal Printers (Pty) Ltd, Cape Town.
Whitehead, H., 2002. Estimates of the Current Global Population Size and Historical Trajectory for Sperm Whales. Marine Ecology Progress Series, 242: 295-304.
Wiles, E., Green, A., Watkeys, M., Jokat, W. and R. Krocker, 2013. The Evolution of the Thukela Canyon and Submarine Fan: A Complex Interaction between Margin Erosion and Bottom Current Sweeping, Southwest Indian Ocean, South Africa. Marine and Petroleum Geology, 44: 60-70.
Wilkinson, S., Japp, D.W., 2010. Proposed 2d Seismic Survey within Blocks 2931c, 2931d, 2932a and 2932c (East Coast, South Africa). Specialist Study on the Impact on the Fishing Industry, 19.
WIREs Clim Change, 2014. Climate Change Impacts and Adaptation in South Africa. Article 5: 605 – 620. doi: 10.1002/wcc.295. John Wiley & Sons, Ltd.
Witherington, B.E. and K.A. Bjorndal, 1991. Influences of Wavelength and Intensity on Hatchling Sea Turtle Phototaxis: Implications for Sea-Finding Behavior. Copeia, 1060-1069.
Witherington, B.E., 1992. Behavioral Responses of Nesting Sea Turtles to Artificial Lighting. Herpetologica, 31-39.
Wooldridge, T., Dye, A.H. and A. McLachlan, 1981. The Ecology of Sandy Beaches in Transkei. S. Afr. J. Zool., 16: 210-218.
Wyneken, J. and D. Witherington, 2001. The Anatomy of Sea Turtles, Southeast Fisheries Science Center, National Marine Fisheries Service, National Oceanic and Atmospheric Administration, Us Department of Commerce.
Young, P.M., 2009. An Integrated Marine Gis Bathymetric Dataset for Kwazulu-Natal. M.Sc. Thesis University of Kwazulu-Natal, 212.
Zoutendyk, P. and I.R. Duvenage, 1989. Composition and Biological Implications of a Nepheloid Layer over the Inner Agulhas Bank near Mossel Bay, South Africa. Transactions of the Royal Society of South Africa, 47, 187-197.
The business of sustainability
ERM has over 160 offices across the following countries and territories worldwide
Argentina Australia Belgium Brazil Canada Chile China Colombia France Germany Guyana Hong Kong India Indonesia Ireland Italy Japan Kazakhstan Kenya Malaysia Mexico Mozambique Myanmar
The Netherlands New Zealand Norway Panama Peru Poland Portugal Puerto Rico Romania Russia Singapore South Africa South Korea Spain Sweden Switzerland Taiwan Tanzania Thailand UK US Vietnam
ERM’s Cape Town Office 1st Floor, Great Westerford 240 Main Road, Rondebosch 7700, Cape Town, South Africa T: +27 21 681 5400 F: +27 21 686 0736 www.erm.com


![Ropes for Subsea Cable Laying - brunton-shaw.com · [ BUOY & GRAPNEL ] Cable Laid combined (wire and natural fibre) ropes specially designed for Subsea Cable Laying duties Ropes for](https://img.pdfslide.us/doc/110x75/5e126c3ed43a5b3e643fb493/ropes-for-subsea-cable-laying-brunton-shawcom-buoy-grapnel-cable-laid.jpg)