Embed Size (px)
Citation preview

DI
SC
US
SI
ON
P
AP
ER
S
ER
IE
S
Forschungsinstitut zur Zukunft der ArbeitInstitute for the Study of Labor
Information and Communication Technologies and Skill Upgrading:The Role of Internal vs. External Labour Markets
IZA DP No. 5494
February 2011
Luc BehaghelEve CaroliEmmanuelle Walkowiak
Information and Communication Technologies and Skill Upgrading:
The Role of Internal vs. External Labour Markets
Luc Behaghel Paris School of Economics, INRA and CREST
Eve Caroli
University of Paris Ouest Nanterre, EconomiX, Paris School of Economics and IZA
Emmanuelle Walkowiak
Paris XII University, ERUDITE and CEE
Discussion Paper No. 5494 February 2011
IZA
P.O. Box 7240 53072 Bonn
Germany
Phone: +49-228-3894-0 Fax: +49-228-3894-180
E-mail: [email protected]
Any opinions expressed here are those of the author(s) and not those of IZA. Research published in this series may include views on policy, but the institute itself takes no institutional policy positions. The Institute for the Study of Labor (IZA) in Bonn is a local and virtual international research center and a place of communication between science, politics and business. IZA is an independent nonprofit organization supported by Deutsche Post Foundation. The center is associated with the University of Bonn and offers a stimulating research environment through its international network, workshops and conferences, data service, project support, research visits and doctoral program. IZA engages in (i) original and internationally competitive research in all fields of labor economics, (ii) development of policy concepts, and (iii) dissemination of research results and concepts to the interested public. IZA Discussion Papers often represent preliminary work and are circulated to encourage discussion. Citation of such a paper should account for its provisional character. A revised version may be available directly from the author.
IZA Discussion Paper No. 5494 February 2011
ABSTRACT
Information and Communication Technologies and Skill Upgrading: The Role of Internal vs. External Labour Markets*
Following the adoption of information and communication technologies (ICT), firms are likely to face increasing skill requirements. They may react either by training or hiring the new skills, or by a combination of both. We first show that ICT are indeed skill biased and we then assess the relative importance of external and internal labour market strategies. We show that skill upgrading following ICT adoption takes place mostly through internal labour markets adjustments. The introduction of ICT is associated with an upward shift in firms’ occupational structure, of which one third is due to hiring and firing workers from and to the external labour market, whereas two-thirds are due to promotions. Moreover, we find no compelling evidence of external labour market strategies based on “excess turnover”. In contrast, French firms heavily rely on training in order to upgrade the skill level of their workforce, even if this varies across industries. JEL Classification: J23, J24, J41 Keywords: technical change, labour turnover, skill bias, training, internal labour markets Corresponding author: Eve Caroli PSE 48 Boulevard Jourdan 75014 Paris France E-mail: [email protected]
* We are grateful to Andrea Bassanini, Marc Gurgand, Kevin Lang, Thomas Lemieux, Thomas Piketty, Muriel Roger and two anonymous referees for very helpful comments and suggestions on an earlier version of the paper. We also thank participants to the EEA-2007 and AFSE-2007 conferences, to the ERMES-2007 workshop on “Organisation de l’entreprise, connaissance et innovation” and to seminars at Harvard University, Paris School of Economics and Laboratoire d’Economie d’Orleans (LEO) for useful remarks. We are grateful to Juliette Caminade for outstanding research assistance. This work was supported by the French Agence Nationale de la Recherche [grant number ANR-08-JCJC-0067-01 to LB and EC].
3/36
Introduction
Changes in employment relationships have attracted a lot of attention in recent years, both in
the popular press and in academic research. Following several downsizing episodes in the
USA and in Europe, a widely shared view has developed according to which employment
relationships have become more instable than they used to do be. According to Doeringer and
Piore (1971) internal labour markets are characterised by the fact that wages and career paths
are, to a large extent, determined by a set of administrative rules rather than by pressure
arising from the external labour market. In contrast, in recent years, long-term employer-
employee relationships have seemed to decline (Cappelli, 1999) and the labour market seems
to have been increasingly working like a “spot market” (Atkinson, 1999). Correspondingly,
the perception of job insecurity has increased in most OECD countries in the 1990s (OECD,
2003).
However, existing empirical evidence on rising job instability and the decline of internal
labour markets is actually quite mixed. Regarding job instability, the US literature does not
provide compelling evidence of any decrease in retention rates nor in job tenure (see Neumark
et al, 1999, Jacoby, 1999, and Stevens, 2008). Regarding France, the review of the literature
by Germe (2001) suggests that the evidence of a contraction of internal labour markets is not
clear-cut. However, job insecurity seems to have increased in the USA over the past decades,
whether measured in terms of involuntary job loss (Farber, 2007) or in terms of probability of
dismissal (Valletta, 2000). Similar results are found on French data. Givord and Maurin
(2004) and Behaghel (2003) indeed find evidence of an upward trend in annual transition
rates from employment to unemployment between the mid-1970s and the early 2000s.
So, evidence on the potential decline of internal labour markets is far from being clear-cut.
One reason for this may be that internal labour markets are efficient organisations in the
presence of match-specific investments, transaction costs and workers' risk aversion (see
Wachter et al, 1990) which are unlikely to have disappeared altogether. Another reason may
have to do with the rapid development of information and communication technologies (ICT)
over the past 20 years. Although these changes have often been seen as potential causes of a
decline in internal labour markets, this actually depends on how they impact human resource
management, in particular through new and increasing skill requirements. The recent
literature on the skill content of technological change suggests that information and
communication technologies substitute workers in routine tasks, whereas they complement
them in interactive and analytical activities (see Autor et al., 2003, and Spitz-Oener, 2006).
4/36
The impact of such changes on the skill level of the workforce may however vary across jobs
or sectors. Ben-Ner and Urtasun (2010) suggest that ICT could generate some "skill
bifurcation": it would eventually raise the skill level of workers in complex jobs whereas it
would have a deskilling effect on workers in low-skilled jobs. Nonetheless, available evidence
suggests that, on average, ICT adoption generates an increase in the demand for
communication and analytical skills (see Autor et al, 2003).
Firms may cope with it in various ways. They may either hire the new skills on the external
labour market or train their own workers, thus relying on the working of the internal labour
market. Hiring the new skills from outside the firm may actually take two forms. Firms may
hire more highly skilled workers and get rid of less skilled ones, which generates an upward
shift in the occupational structure. Alternatively, they may hire new workers within a constant
occupational structure in order to bring "fresh blood", and presumably new skills, into their
workforce. A number of recent papers have investigated the impact of new technologies on
changes in the occupational structure within firms, worker flows or training. They find a
positive impact of technical (and organisational) change on the employment or wage-bill
share of the more highly skilled occupations (see Chennells and Van Reenen, 2002 and
Caroli and Van Reenen, 2001). On U.S. data, Neumark and Reed (2004) display a
significantly greater use of contingent employment relationships in new-economy jobs.
Regarding worker flows, Givord and Maurin (2004) find that the use of new technologies
increases the annual transition rate from employment to unemployment, and that this is
enough to explain the global trend toward greater job insecurity observed in France. Looking
at worker flows by skill levels in France, Askenazy and Moreno-Galbis (2007) find that firms
that most intensely use new technologies and innovative work practices experience a higher
turnover among most of the occupational categories. For Germany, Bauer and Bender (2003)
find that new technologies increase churning rates for skilled and highly skilled workers and
that most of the employment adjustment patterns associated with technological change are
due to hiring and firing rather than to promotions or demotions. These results suggest that, if
anything, firms meet the new skill requirements following the introduction of ICT through
adjustments on the external rather than internal labour market.
However, another strand of literature suggests that the adoption of information technologies
and innovative workplace practices also raises firms' investment in training. On US data,
Lynch and Black (1998) find that the proportion of workers receiving formal training is
higher in firms that use high performance work practices. Behaghel and Greenan (2010) use
5/36
matched employer-employee data for France and also find that a more innovative organisation
increases the probability that workers receive training, even once controlling for selection and
potential endogeneity biases.
As underlined by this review of the literature, most articles consider only one type of labour
market response to technological change. They either study internal or external labour market
strategies, but rarely both at the same time. However, as suggested by Mincer (1989), these
strategies are likely to be correlated with each other. Firms may react to increasing skill
requirements either by combining in some way training with the hiring of new skills or they
may, on the contrary, rely on one strategy at the expense of the other. The characteristics of
this choice and its determinants are the focus of the present paper.
Investigating this issue on France at the end of the 1990s is of particular interest because ICT
were still spreading quite quickly across firms, while in other countries, like the USA, a
majority of firms had already transited to ICT-intensive production processes. To the extent
that we are interested in how firms cope with the new skill requirements arising from the
implementation of ICT, France in the late 90s provides an interesting case to research.
Moreover, together with Japan, France used to be one of the Western countries in which
internal labour markets were the most widespread (Marsden, 1999). It is therefore one of the
countries in which the development of ICT is likely to have had the most devastating effect on
long-term employment relations if new technologies call for an ongoing reshuffling of the
workforce. At the same time, internal labour markets may have been protected by the strength
of employment protection legislation. According to the OECD indicator (Venn, 2009), France
is one of the countries with the highest level of employment protection. This is particularly
the case for temporary contracts which can be used only under very strict conditions and for a
limited amount of time. This may have made internal labour markets more sustainable in a
period of rapid technical change.
In order to assess the resilience of internal labour markets in a context of technological
changes, we consider three ways through which firms may increase the skill level of their
workforce, whenever necessary:
1) They may shift their occupational structure upward, which can be done either by
promoting incumbent workers from lower to higher skilled occupations (internal
labour market strategy) or alternatively, by hiring workers in more highly skilled
occupations and/or firing them in less skilled ones (external labour market strategy).
6/36
2) External labour market adjustments may also take the form of "excess turnover" (or
churning) – i.e. turnover in excess to what is necessary to upgrade the occupational
structure – if firms try to acquire new skills by the adjunction of "fresh" workers.
3) Eventually, firms may train their own workers, thus relying on the internal labour
market.
According to the relative importance of these channels, we will be able to assess how
important internal labour market strategies remain in a period of rapid expansion of new ICT
or, alternatively, to what extent external labour market strategies have taken over.1
The paper is organised as follows. Section 1 outlines the econometric model. Section 2
introduces the data. The results are presented in Section 3. Some discussion and concluding
remarks are offered in Section 4.
1. The Econometric model
New technologies and skill upgrading
The existing literature on skill-biased technical change suggests that in order to fully exploit
the potential of ICT, firms have to upgrade the skill level of their workforce when adopting
them. The corresponding prediction is that there should be a positive correlation (all other
things kept equal) between the adoption of more advanced technologies and an increase in the
skill level of the workforce.
A very simple test is based on the following regression:
iiii ICTzSKILL εδ∆β∆ ++= (1)
where ∆ICT is an indicator of adoption of new information and communication technologies,
SKILL is a measure of the workforce’s skills, and z are control variables.
ICT adoption is likely to be endogenous. In the absence of any good instrument for
technological adoption, we interpret positive estimates δ as evidence of partial correlations
between the adoption of new technologies and upward changes in the skill structure of the
workforce – see Section 4 for further discussion of endogeneity issues.
1 Note that these three channels may overlap; for instance, firms may promote workers they train. However, as shown in the next section, shifts in the occupational structure can be decomposed in shifts through internal movements and shifts through external movements, thus providing a natural metric to assess the relative importance of internal and external movements.
7/36
Skills, however, can be acquired through a variety of channels. In what follows, we consider
three possible channels: firms may upgrade the occupational structure of their workforce
(which can be achieved though entries and exits or, alternatively through promotions); they
may rely on excess turnover in order to acquire fresh skills; and/or, they may train their own
workers. We interpret upward changes in the occupational structure through entries and exits
as well as excess turnover as indicators of external labour market adjustments. Conversely,
skill upgrading through promotions and training are seen as indicators of internal labour
market strategies.
Decomposing changes in the occupational structure
Changes in firms' occupational structure in relation with ICT adoption are usually estimated
using standard labour share equations:
ipipiip ICTxS εδ∆β∆ ++= (2)
where xi is a vector of control variables and Sip is the share of occupational group p in the
workforce of firm i:
it
ipt
it
ipt
ip L
L
L
LS
1
1
−
−−=∆
Such changes are the outcome of two different movements: (i) entries and exits of workers at
various levels of the occupational structure and (ii) promotions of workers from lower to
higher occupations. In order to distinguish both effects, we construct counterfactual changes
in labour shares ( ipS~∆ ) describing what would have happened to the occupational structure if
there had only been entries and exits at the different occupational levels, but no internal
movement (promotion or demotion):
it
ipt
it
it
it
ipt
ipt
ipt
ipL
L
EHL
EHLS~
1
1
1
1
−
−
−
− −−+−+
=∆ (3)
where iptL 1− is the number of workers in occupation p in firm i at time t-1, ip
tH is the number
of entries in occupation p in firm i between time t-1 and t and iptE is the number of workers
formerly employed in occupation p leaving firm i between time t-1 and t. Similarly, itL , i
tH ,
and itE respectively denote the total number of workers, entries and exits in firm i at time t.

8/36
Given that we do not have any direct information on promotions, changes in the occupational
structure through promotions only ( ipS∆ ) are defined as the changes in the occupational
structure that would have occurred if there had been none of the entries or exits that we
observe in the data:
it
ipt
it
it
it
ipt
ipt
ipt
ipL
L
EHL
EHLS
1
1
−
−−+−+−
=∆ (4)
where iptL is the number of workers in occupation p in firm i at time t. The number of workers
in occupation p at t is computed as a counterfactual including only promotions, i.e. the
number of workers observed at t in occupation p minus entries plus exits into that group
between t-1 and t. The corresponding labour share is computed by dividing this number of
workers by what employment would have been in the firm at year t if no entry nor exit had
taken place over the period.
In the case where the total level of employment is constant2, the observed changes are the sum
of the two counterfactual changes. Indeed, we then have it
it EH = and i
tit LL 1−= . Therefore,
.~ˆ
11
1
1
1ipipi
t
ipt
ipt
it
ipt
ipt
ipt
ipt
it
ipt
ipt
ip SSL
EH
L
LEHL
L
LLS ∆+∆=
−+
−+−=
−=∆
−−
−
−
−
Let us underline that our counterfactual measures of changes in the occupational structure
( ipS∆ and ipS~∆ ) closely relate to standard worker flow rates (see Davis and Haltiwanger,
1999 for a survey). The main difference between both is that in the former, flows are defined
with respect to the total size of the workforce, whereas in the latter, they are defined with
respect to the size of occupation p. Consider equation (3). When firm size is constant,
it
ipt
ipt
ip L
EHS
1
~
−
−=∆ .
This differs from the standard external worker flow rate EWFR:
2 When total employment is not constant, the coefficients we obtain for ipS∆ and ipS
~∆ do not add up to those
obtained when using ipS∆ as a dependent variable. This is due to the fact that a complete decomposition of
ipS∆ should include a third term, namely the interaction between changes due to internal and external
movements. We choose to neglect this term which has no clear interpretation with respect to the internal vs
external labour market issue. It turns out to be very small in practice: the coefficients on ipS∆ and ipS~∆ almost
add up in our regressions. Robustness checks showing that alternative additive decompositions yield almost identical results are available upon request.

9/36
ipt
ipt
ipt
ip L
EHEWFR
1−
−=
by a factor equal to it
ipt LL 11 / −− . In other words, the key difference lies in the fact that we
reweigh the usual worker flow rates by the initial occupational structure of the firm, it
ipt LL 11 / −− .
This serves our purpose by providing a direct measure of the impact of worker flows on the
firm’s occupational structure.
We estimate equation (2) separately for ipS~∆ and ipS∆ by OLS, equation by equation, for
each occupation.3,
Upgrading skills through excess turnover and training
Another way to upgrade the skill structure of a firm when adopting ICT is through the
addition of "fresh" workers by means of labour turnover. Turnover is, to some extent, a
mechanical consequence of the upgrading of the occupational structure through entries/exits:
there cannot be any upgrading of the occupational structure through entries/exits if there are
no worker flows. However, as is well known from the literature on job and worker flows (for
French firms, see Abowd, Corbel and Kramarz, 2003), worker flows (turnover) usually
largely exceed what is needed for a given level of job flows.
We therefore use a measure of ‘excess turnover’ – or churning -, i.e. turnover in excess to
what is needed for a given change in the size of a group of workers. Specifically, following
Davis and Haltiwanger (1999, section 6) excess turnover et in plant i and for group p is
defined as:
ip
ipip
ip
ipipip L
EH
L
EHet
−−
+≡ (5)
We then estimate:
ippipiip vICTxet ++= γ∆ξ (6)
by OLS separately for each occupation, where xi is a vector of control variables. pγ is the
estimate of interest; positive values indicate that ICT adoption is associated with an increased
3 Although we are estimating a system of Seemingly Unrelated Regressions (SUR), feasible Generalized Least Squares (FGLS) are not warranted here, as the same regressors show up in each equation (see, e.g., Theorem 7.6 in Wooldridge, 2002).
10/36
turnover of group p, beyond what is mechanically implied by the upgrading of occupational
groups.
Similarly, skill upgrading through training needs to be analysed within each occupational
group. Indeed, training rates are higher in high-skill groups, hence upgrading of the
occupational structure through entries/exits mechanically generates an increase in training
rates. Our data allows us to estimate training equations for a given occupational group:
ippipiip ICTxT υη∆ψ ++= (7)
which we estimate by OLS. xi is a vector of control variables and pη is the estimate of
interest; positive values indicate that ICT adoption is associated with an increase in training,
once controlled for composition effects.
2. The Data
Measuring technology adoption and skill upgrading through our 3 channels at the firm level
requires combining several databases.
Our main information on ICT comes from the REPONSE survey (RElations PrOfessionnelles
et NégocationS d’Entreprise). In 1998, 2978 establishments were surveyed with senior
managers being asked questions about industrial relations, implementation of new
technologies and reorganisations. Regarding ICT, we have information on the proportion of
workers using the Intranet4 and the Internet in 1998 (no use, less than 5%, 5 to 19%, 20 to
49%, 50% and more). Given that these technologies were at the very beginning of their life
cycle in France in the mid-1990s, we assume that the proportion of workers using them in
1998 provides a good approximation of technological adoption over 1996-1998. More
specifically, we define a dummy variable equal to 1 if at least 5% of the workers use the
Internet or at least 20% of the workers use the Intranet5. One advantage of this simple
measure of ITC use is that it is relevant for the different sectors in the economy: as shown by
4 The exact phrasing is "Intranet and computer networks". 5 Using a binary variable discards part of the information available in the 5x5 levels of adoption that are obtained by combining the original Internet and Intranet variables. However, our sample is too small for estimating the effects of all these combinations separately. We choose to focus on the 5% and 20% thresholds as a way to contrast reasonably balanced groups of ITC early adopters (1/3 of the sample) and late (or non) adopting firms (2/3 of the sample), thus giving us good statistical power. Computing a more continuous index may lead to misspecifications as we would have to make linearity assumptions (with little statistical power to test them). We checked that our results are robust to the thresholds we use to generate the ICT adoption indicator.
11/36
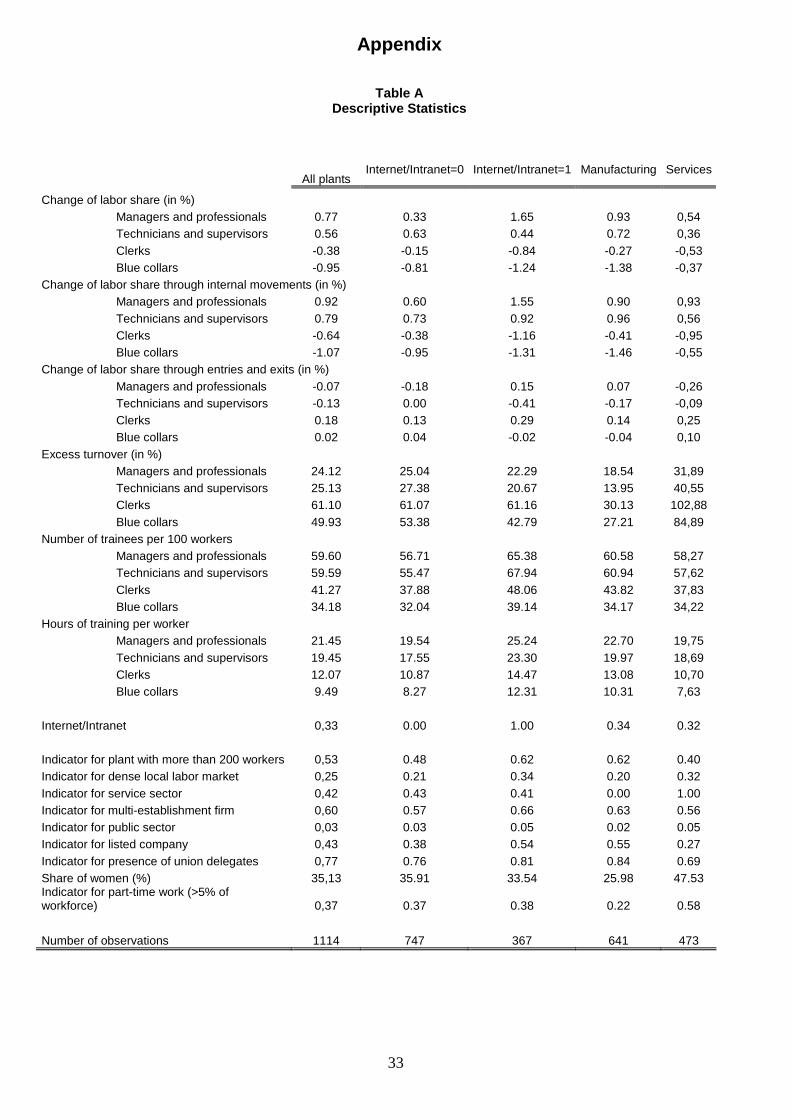
table A, in our sample, very similar proportions of firms in the manufacturing and service
sectors are classified as “ICT-intensive” by this measure (about one third).
In addition to ICT, the REPONSE survey also provides detailed information on firms and
establishments which we use as control variables in the regressions: firm characteristics
(public/private, firm with one or several plants, listed on stock markets/non-listed), plant
characteristics (share of women, share of part-time workers, presence of union delegates,
employment growth, local labour market density), as well as a set of industry and plant size
dummies.
In order to capture worker flows, we rely on two different sources. The DMMO (Données sur
les Mouvements de Main-d’Oeuvre) has exhaustive data on entries and exits of workers in
and out of establishments with 50 employees or more. The data is broken down into four
occupational categories: managers and professionals6, technicians and supervisors, clerks and
blue-collars. The EMMO (Enquête sur les Mouvements de Main-d’Oeuvre) has identical
information on a representative sample of firms with less than 50 employees. We use this data
to compute counterfactual changes in labour shares over 1996-1998, i.e. changes that are due
only to entries and exits (resp. promotions) in the various occupations over the period. In
order to do so – see equations (3) and (4) – we also use information on the level of
employment in each occupational cell at the beginning and at the end of the period. This
information is provided by the French survey of employment structure: the ESE (Enquête
Structure des Emplois), as of December 31st 1995 and 1998.
The last channel we consider for skill upgrading is training. The so-called “24-83” fiscal
records provide firm-level data on the number of workers receiving training and the volume
of training hours7. This information is obviously quite limited since it only refers to
continuous and formal training. In particular, apprenticeship is excluded whereas it may be an
important skill source (see Bellman and Janik, 2007 and Ryan et al, 2007) which may be, in
some cases, complementary to internal labour markets (see Soskice, 1994, on Germany).
Similarly, informal on-the-job training is not included in our data although it may represent an
important part of training, in particular in small firms (see Barron et al, 1997)8. This is a clear
limitation of the 24-83 records. Unfortunately, we are not aware of any data source that would
provide more exhaustive information on training in France. Using the information available in
6 This category also includes engineers. 7 The "24-83" records provide firm rather than plant-level data on training. Matching them with establishment-level data generates some measurement error that is likely to raise the standard errors in our estimates. 8 In order to prevent this from biasing our results, we systematically control for plant size in our regressions.

12/36
the 24-83, we compute both the proportion of workers receiving some training and the
average number of training hours per worker for four occupational categories - identical to
those in the DMMO-EMMO database. These are averaged over 1996-1998 in order to
account for the fact that training may take some time to be implemented after firms decide to
invest in it.
Matching the four datasets and cleaning out establishments with implausible values for skill
upgrading reduces our sample to 1,114 establishments. The low matching rate is primarily
due to the fact that the EMMO and 24-83 sources are not exhaustive (respectively, not
systematically coded) – see the Data Appendix for details.
Table A in the Appendix summarizes all the variables used in our models. Our sample
consists mainly of large plants (53% have more than 200 workers) belonging to multi-
establishment firms of the private sector. 77% have a union delegate and less than half of
them are listed. The manufacturing sector is over-represented in our sample: it accounts for
80% of total employment, compared to only 20% in the whole French economy. As a
consequence, women account for only 35% of the labour force. 37% of the plants employ
more than 5% of part-time workers.
3. Results
3.1 ICT adoption and skill upgrading strategies
We first investigate the correlation between ICT adoption and the strategies used by firms to
upgrade the skills of their workforce. In order to do so, we estimate equations (2)-(4), (6) and
(7) of our model.
Table 1 presents the results for the various forms of skill upgrading: respectively, upward
shift in the occupational structure through entries/exits versus promotions, excess turnover
and training. Panel A of Table 1 provides evidence of skill-biased technical change. The use
of the Internet or the Intranet is positively correlated with an upward shift in the occupational
structure and, more specifically with an increase in the proportion of managers, engineers and
professionals and a decrease in the proportion of clerks in the workforce. This occupational
upgrading is essentially achieved through internal movements (promotions). These account
for more than 70% of the increase in the proportion of managers – as compared to only 30%
13/36
for external movements - and for almost all of the reduction in the share of clerks9 – see
Panels B and C. This first set of results suggests that internal labour markets still play an
important role when firms have to cope with increasing skill requirements. Most of the
adjustment in the occupational structure takes place through promotions, whereas the relative
importance of entries and exits to and from the external labour market remains limited. To
gauge the economic significance of the effects, it is useful to compare them to the average
changes in the occupational structure in our sample during the 1996-1998 period (Table A).
For instance, the .80 percentage point increase in the share of managers and professionals
occurring through internal movements and associated with intensive ICT-use (Table 1) is very
close to the overall increase in the share of managers and professionals in the economy (+.77
percentage points). If we were to give a causal interpretation to the estimates, a back-of-the-
envelop calculation would imply that about 35% of the overall increase in the demand for
managers and professionals is due to the adoption of ICT that occurred in about 1/3 of the
firms over the period and which was satisfied through internal movements
(0.33*.80/0.77=0.34); about 15% is due to the adoption of ICT but was satisfied by the
external labour market (.33*.3/0.77=.13); and the remaining 50% is due to other causes. Of
course, our estimates cannot necessarily be interpreted causally; but this suggests that the role
of internal labour markets is far from negligible in the overall upgrading of the occupational
structure.
Firms may also try to upgrade the skill level of their workforce by bringing in "fresh workers"
with new skills, beyond what would be necessary to upgrade the occupational structure
through entries and exits. Panel D of Table 1 investigates the partial correlations between ICT
adoption and excess turnover. We find no compelling evidence of such a correlation: the use
of the Internet or the Intranet is not associated with excess turnover, whatever the category of
workers we consider. Overall, the external labour market does not appear as a key provider of
new skills when firms introduce new information and communication technologies.
In contrast, firms heavily rely on training in order to upgrade the skill level of their workforce.
Panels E and F of Table 1 have the partial correlations between ICT adoption on the one hand
and two different measures of training on the other hand. As evidenced by Panel E, the
introduction of new technologies is correlated with a greater access to training for all
categories of workers except for managers and professionals - where the coefficient is positive
9 Note that, given that our occupational categories are quite broad, we do not take into account all promotions. Those occurring from one level to the next one within a given occupational category are not recorded, so that our results on the scope of promotion should be seen as a lower bound.

14/36
but not statistically significant. In contrast, when considering the number of hours of training
per worker, the correlation is positive and significant for all occupational groups, including
managers. Again, it is useful to compare the effects to the average level of training in the
sample displayed in Table A. Depending on the occupation, ICT adoption is associated with
an increase in the incidence of training by 5 to 15%, and an increase in training hours by 10 to
15%.
This first set of results suggests that the internal labour market still plays a key role in the
adjustment of the skill level of the workforce in firms that intensely use new information and
communication technologies. This is confirmed if using alternative indicators of internal and
external labour market strategies. If estimating the correlation between ICT adoption and
entry and exit rates in the various occupations (see Table 2 – Panel 2.1), we do not find any
significant association except for the hiring of technicians and supervisors and, to a lower
extent, for managers and professionals. This is consistent with the reduced role of external
labour market strategies which play a role only through upgrading firms' occupational
structure at the higher end – see Table 1 panel C. In contrast, when estimating the correlation
between ICT adoption and promotion rates to managerial positions, we do find a significant
association, in particular if considering promotions from the three lowest skilled groups (blue-
collars, clerks, technicians and supervisors) to managers and professionals – see Table 2 –
Panel 2.2. Promotions from technicians and supervisors to managers are also more frequent in
ICT intensive firms. This is also the case for promotions from the two lowest skilled groups
(blue-collars and clerks) to the highest two (technicians and supervisors; managers and
professionals) although the correlation is not significant at conventional levels.
In order to check the robustness of our findings, we try several alternative specifications10.
We first show that the importance of promotions as compared to external movements is not
sensitive to the decomposition method that we use. We also show that our results are robust to
controlling for employment growth at the plant level, to using alternative measures of ICT
(different thresholds for ICT adoption or, alternatively, the share of ICT investment in value-
added) and to controlling for investment in physical capital. We are also concerned that our
findings could be driven by potentially confounding factors such as the use of innovative
workplace practices (proxied by quality circles, stimulation of workers' participation) or to the
quality of industrial relations (proxied by the number of strikes). We show that this is not the
case and that our results remain unchanged if controlling for such factors.
10 Detailed results are available from the authors upon request.

15/36
The important role of the internal labour market in upgrading the skill level of the workforce
therefore seems to be quite resilient in France, even in the context of development of new
ICT. One can wonder however whether this form of human resource management is to be
found in all firms or whether there is some heterogeneity in firms' strategies and along which
dimensions.
3.2 Heterogeneity in firms' skill upgrading strategies
A first potential dimension of heterogeneity in our data has to do with industry. Skill
upgrading practices are likely to be different across sectors, if anything because the needs and
the relative cost of each strategy are likely to be different. Given the fact that our sample over-
represents the manufacturing sector, our results may not be representative of the average trend
in the French economy. A disaggregated analysis is therefore needed.
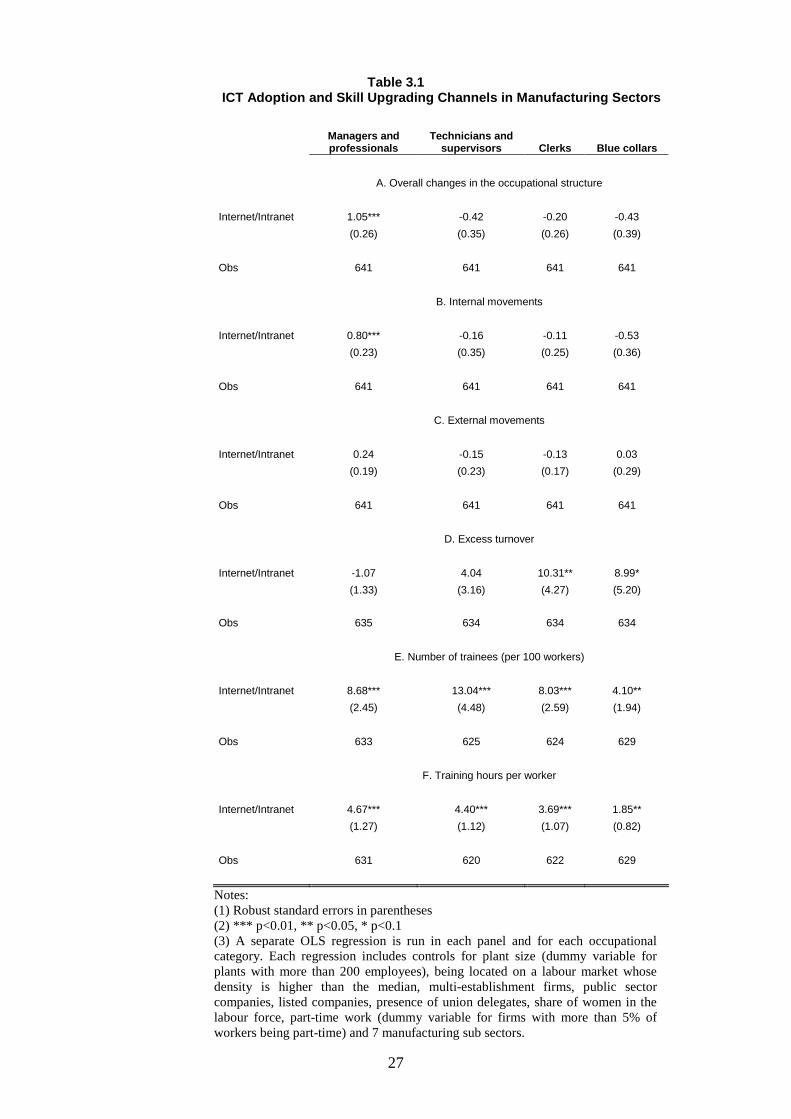
When splitting our sample across manufacturing and services, our results suggest that there
are indeed some differences, in particular with respect to the use of training. Table 3.1
suggests that ICT-intensive firms in the manufacturing sector heavily rely on promotions in
order to upgrade the skill level of their workforce. Excess turnover is used to a limited extent
for clerks and blue-collars. But the dominant strategy is based on training with ICT-intensive
firms providing significantly more training than others to all categories of workers. Regarding
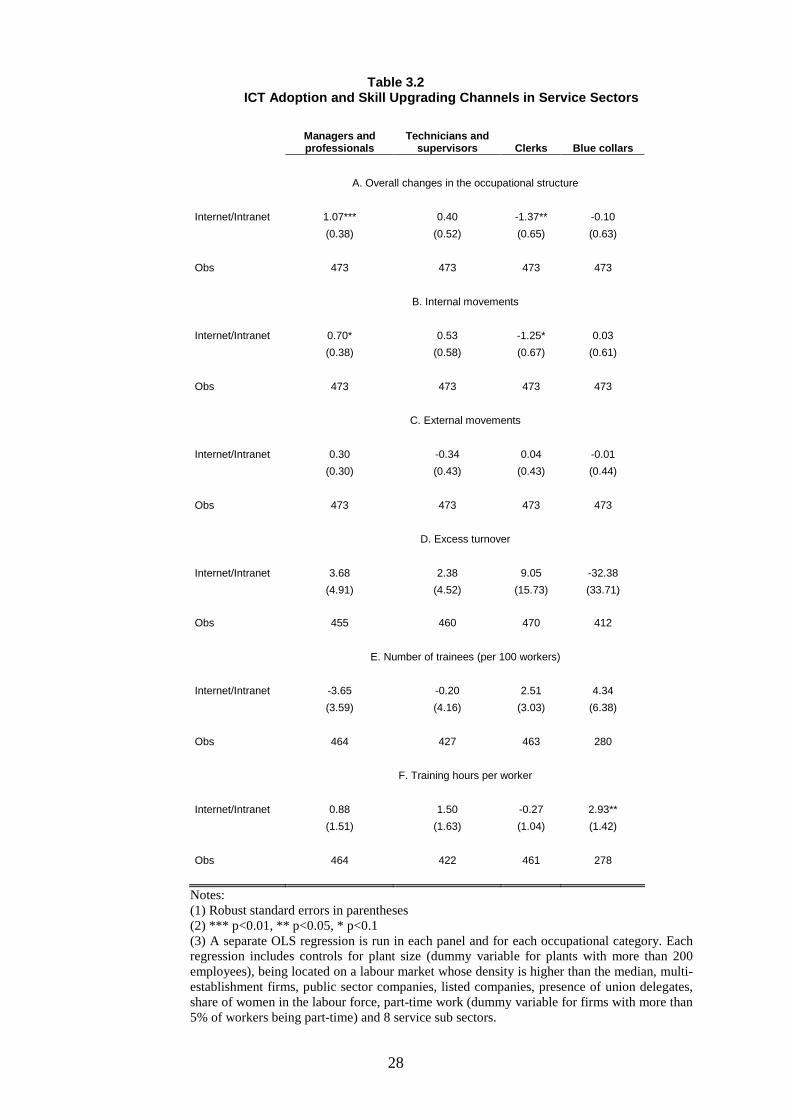
services (see Table 3.2), the same pattern is observed for changes in the occupational structure
with promotions accounting for most of the skill upgrading. In contrast, firms in the service
sectors appear to rely rather little on training when using ICT, the only significant correlation
being for blue-collars.
This heterogeneity in skill upgrading strategies across sectors is, to a large extent, robust to
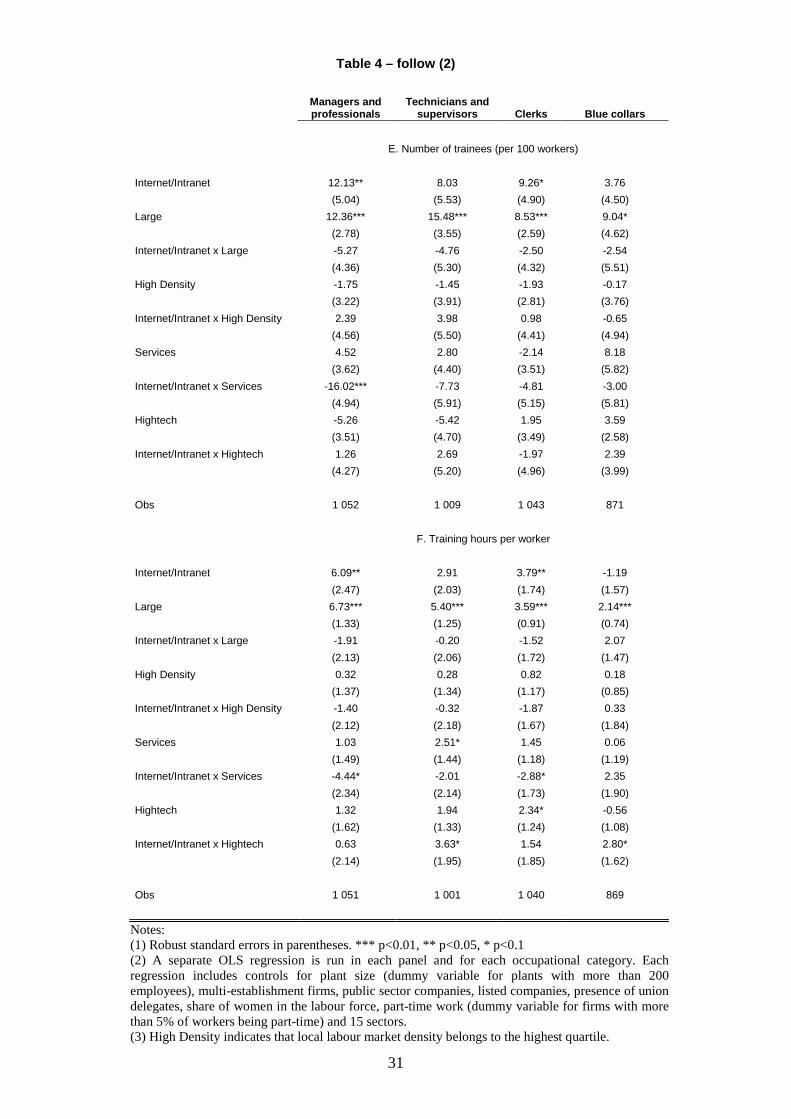
taking into account other potential sources of heterogeneity (see Table 4). The skill upgrading
strategies chosen by firms are likely to vary across a variety of dimensions. In particular, one
would expect internal labour markets to be larger and better organised in large firms than in
smaller ones. In contrast, the external labour market is potentially more attractive in high-
density local labour markets because it is likely to offer a greater variety of skills. Eventually,
skill upgrading strategies may be different between high and low-tech sectors11 because the
use of the Internet/Intranet is likely to be different in both types of industries.
11 Sectors are classified as being low or high-tech on the basis of the latest OECD 4-digit classification for manufacturing sectors (see Hatzichronoglou, 1997) and on the basis of the 4-digit classification proposed by the

16/36
Our results suggest that there is indeed some heterogeneity across several of these
dimensions. The direct effects of the size and local labour market density variables suggest
that these affect to a certain extent firm's skill upgrading strategies. Large firms essentially
rely on promotions to upgrade the occupational structure of their workforce (in favour of
technicians and supervisors and, to a lesser extent at the expense of clerks) and they rely less
on excess turnover for both categories. More importantly, training is strongly correlated with
size with large firms providing greater access and more training hours to all categories of
workers. Interestingly, being located on a high-density local labour market is correlated with a
lower turnover for technicians and clerks, which is not in line with the idea that high density
on the local labour market should make external skill upgrading strategies more attractive to
firms. Eventually, belonging to a high-tech sector does not seem to be strongly associated
with firms' skill strategies. The only exception is that the high-tech variable is negatively
correlated with excess turnover for blue-collars and positively correlated with the number of
training hours for clerks (at the 10% level).
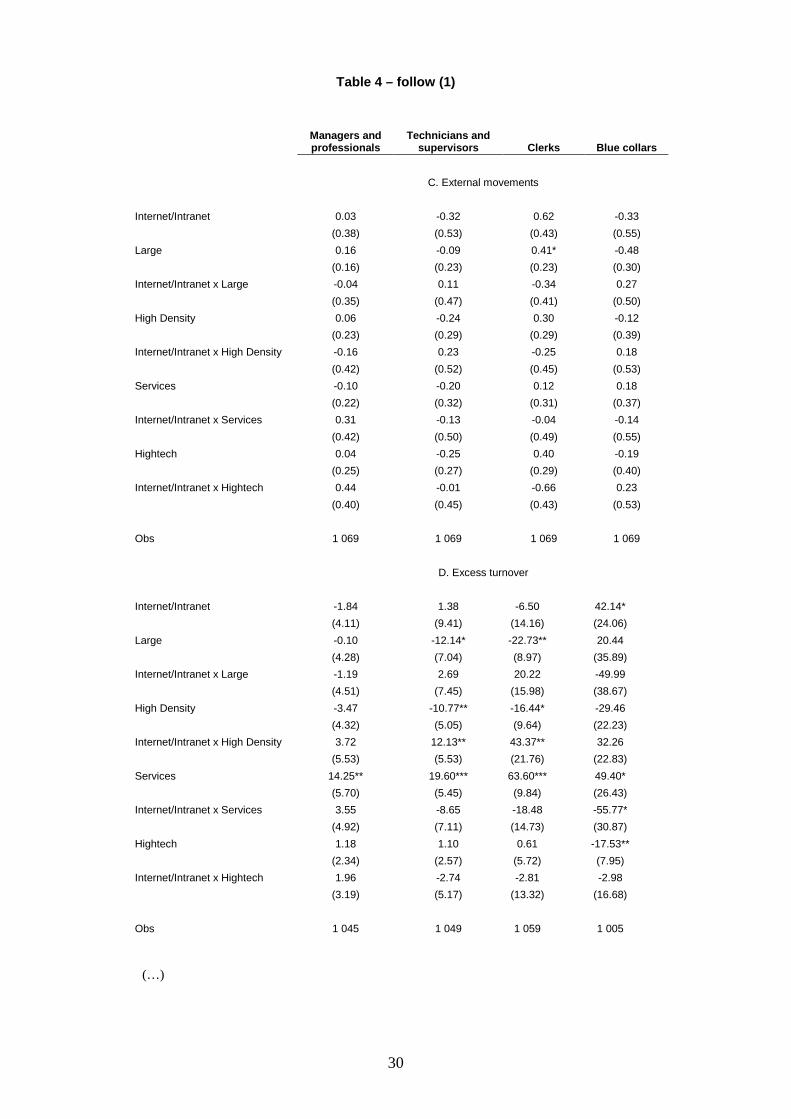
Moreover, the correlation between ICT adoption and skill upgrading strategies is sometimes
quite different across firm size, type of local labour market and technological level of the
sector. This is the message conveyed by the coefficients we get on the interaction terms
between Internet/Intranet and our control variables. The density of the local labour market
tends to increase the reliance of ICT-intensive firms upon promotion, in particular for
managers and blue-collars (at the 10% significance level), contrary to what could be
expected.12 However, it also increases firms' reliance on excess turnover for technicians and
clerks when adopting ICT, which is consistent with the idea that denser labour markets offer a
wider choice of skills and are thus likely to better fit firms' needs. In contrast, skill upgrading
strategies associated with the use of ICT do not seem to be very heterogeneous across firm
size, except for promotions which tend to be relatively more important for clerks and less so
for technicians (at the 10% level). Similarly, being in high rather than low-tech sectors does
not massively affect the skill upgrading strategies of ICT-intensive firms. One exception,
however, is that the latter provide more training hours (at the 10% level) to technicians and
blue-collars in high-tech sectors.
European Foundation for the Improvement of Living and Working Conditions for service sectors (see European Monitoring Center on Change, 2006). 12 A tentative explanation could be that, if in dense local labour markets, firms are able to hire workers that match their needs more closely; these successful “matches” are then more likely to lead to promotions.

17/36
The differences between manufacturing and services are essentially robust to the introduction
of these additional controls. The increase in the share of managers and technicians is smaller
in ICT-intensive service firms than in ICT-intensive manufacturing firms, but there is no
difference in the respective roles of promotions versus external movements in achieving these
changes. One important difference which was not striking when splitting the sample across
sectors is that labour turnover is much higher in services than in manufacturing for all
categories of workers. The specificity of services with respect to training is confirmed: ICT-
intensive firms rely less on training for all categories of workers, with the coefficients being
significant for managers and, to a lesser extent, for blue-collars (when considering training
hours). One reason for this may be the high level of turnover. If the type of training required
when firms adopt ICT is more costly than usual, it may well be the case that service firms are
more reluctant to train their workers given their higher probability to leave than in the
manufacturing sector. The causation may also go the other way round in some services.
Wherever jobs are low-quality and low-paid, training is scarce. In such cases, it may well be
poor job quality that leads to high labour turnover, rather than the other way round.
Overall, our results highlight some heterogeneity in the skill upgrading strategies of firms that
have adopted ICT. Nonetheless, the message conveyed by our results is that the reliance on
internal labour markets remains quite widespread in France even in firms that have adopted
new information and communication technologies.
4. Discussion and concluding remarks
In this paper, we have taken a fresh look at the fate of internal labour markets in a period of
rapid technological change. Our results suggest that they vividly resist in France even in firms
that have introduced information and communication technologies.
As already evidenced by many papers in the literature, ICT adoption is associated with an
upward shift in firm's occupational structure. But we show that in our sample, this is largely
achieved through promotions rather than entries and exits from and to the external labour
market. Moreover, when introducing new technologies, firms massively rely on training in
order to upgrade the skill level of their workforce, whereas the use of excess turnover as a
provider of new skills remains very limited. This resistance of internal labour markets even
where ICT are intensely used is widespread across firms, whatever their size or technological

18/36
level. It is slightly stronger in low-density labour markets and in manufacturing where
training is more frequently used than in services to increase the skill level of workers.
Let us underline that, as all the literature on skill-biased technical change, our results only
capture the short-term relationship between ICT adoption and skill upgrading strategies. If
there are lags in the way ICT affect firms' skill structure, our results will capture at most what
happens in the first two years following the shock (given that we are working on the 1996-
1998 period).
We also need to insist upon the fact that our estimates do not prove a causal relationship:
although we introduce a rich set of controls to rule out some of the most likely sources of
spurious correlations, the ICT variable remains potentially endogenous and we are not able to
exhibit plausible instruments to solve that problem. Nonetheless, our results suggest that the
intensive use of ICT does not preclude human resource management strategies based on
internal labour markets: internal labour markets and ICT can coexist. Moreover, our findings
make a large negative impact of ICT on internal labour markets rather unlikely. Indeed,
reconciling a large negative causal impact with our finding of a robust, positive correlation
would require that some unobserved variables create a large upward bias in our estimates. Let
us consider two types of mechanisms that could generate such a bias, and examine whether
they are consistent with the evidence we provide.
The first mechanism is one of spurious correlations due to unobserved shocks at the firm
level. A first possibility would be that firms that are hit by unfavourable shocks (say, a falling
demand for their product) have to cut costs. To that end, they adopt cost saving technologies;
they also downsize, and the burden of the adjustment is disproportionately born by the
unskilled. This sequence of events would generate a spurious correlation between ICT and
upgrading of the occupational structure through entries and exits. Therefore, wrongly ignoring
the potential role of unobserved shocks would make us overestimate the external labour
market response to ICT adoption. This rather reinforces our result on the predominance of
internal adjustments. However, unobserved shocks may also work the other way round. Firms
that are hit by a positive shock may introduce new technologies (because they have more cash
available for investment). They may also mechanically increase their training investment: The
French regulation on the financing of continuous training is such that over the 1996-1998
period, all firms had to spend at least 1.5% of their wage bill on training. For the firms for
which this constraint is binding, any positive shock that raises the wage bill will mechanically
generate an increase in training expenditure. In this case, the positive correlation we find
19/36
between new technologies and training may be spurious. In order to check whether this is the
case, we re-ran our training regressions on the sub-sample of firms spending more than 2% of
their wage bill on training. For these firms, the legal minimum is not binding so there is no
reason that an increase in their wage bill should lead them to invest more in training. When
doing this, our results are virtually unchanged13. Of course, one can imagine other sources of
unobserved heterogeneity that would drive the results spuriously. Bloom et al. (2008) suggest
that the origin of capital could be one of them. They show that US multinationals operating in
Europe are more IT-intensive than non-US multinationals (and get a higher productivity from
IT) and that their IT advantage is primarily due to more efficient human resource management
practices. In order to make sure that our correlation between IT and internal labour market
strategies is not driven by US-owned firms, we controlled for the origin of capital (US versus
non-US) in our baseline regression. The results are left unchanged. Of course, this does not
rule out other possible sources of unobserved heterogeneity. This is why we remain cautious
in interpreting our results.
The second mechanism is related to a policy change that took place in France in the mid
1990s. Starting in 1993, successive governments have introduced fiscal measures to reduce
the labour cost of low-wage workers. These payroll tax cuts have had the largest impact on
firms employing a high proportion of low-skill workers. As a result, these firms were less
induced to adopt new technologies (as long as they are substitutes to unskilled labour) while
they had incentives to hire even more low-skill workers. Again, this would lead us to
overestimate the impact of ICT adoption on external adjustments: the share of low-skill
workers would increase through entries and exits in firms less prone to adopt ICT. The impact
of the payroll taxes on internal adjustments is unclear. Low-wage firms might refrain from
promoting and training their workers, by fear of increasing wages above the level eligible for
the tax exemption. This, however, does not concern high-wage workers whose training
appears to be highly correlated with new technologies in our data. Moreover, the additional
contingents of low-wage workers paid at the minimum wage would probably not get much
wage increase following training, given that their productivity would, most probably, remain
below the minimum wage. Overall, it is unclear whether the payroll tax cuts should have
induced lower training and fewer promotions in firms less likely to adopt ICT. Therefore, it is
13 The coefficients (standard errors) of the Internet/Intranet variable in the regression for the proportion of trainees are: 4.15 (2.18) for managers and professionals, 8.61 (3.83) for technicians and supervisors, 4.87 (2.39) for clerks and 3.72 (2.97) and for blue-collars. The coefficients (standard errors) of the Internet/Intranet variable in the regression for the intensity of training are: 2.38 (1.13) for managers and professionals, 3.09 (1.11) for technicians and supervisors, 1.77 (0.95) for clerks and 2.45 (0.92) for blue-collars.
20/36
unclear why our finding of a positive correlation between ICT and internal labour market
strategies should be driven by this policy change.
Overall, we view our results as providing evidence that internal labour markets have remained
a viable human resource management strategy for French firms even when adopting new
information and communication technologies. A question raised by these results is to what
extent they may be generalised. France is indeed characterised by strict employment
protection legislation (Venn, 2009) and this may be the very reason why internal labour
markets have survived: firms would rely on internal adjustments because going on the
external labour market would simply be too costly. In that case, the resilience of internal
labour markets in a context of rapid ICT expansion would be largely idiosyncratic or, at least,
specific to high-EPL countries. The evidence we provide does not quite go in that direction.
We indeed find strong differences in internal labour market adjustments across manufacturing
and services – with more training being used in the former and more labour turnover in the
latter - whereas both sectors face the same employment protection legislation. Similarly, the
reliance on external adjustments varies according to the density of the local labour market
whereas EPL is equally strict all over the French territory. As a consequence, EPL cannot
entirely account for the resilience of internal labour markets in France. Moeover, recent
evidence by Bassanini et al. (2007) suggests that the amount of training provided by firms
would actually be negatively correlated to employment protection legislation. In order to get a
better understanding of these relations, a direct comparison of France with other countries
would be potentially very fruitful. This appears to be a promising avenue for future research.
21/36
References
Abowd J., P. Corbel, F. Kramarz (1999), « The Entry and Exit of Workers and the Growth of Employment, » Review of Economics and Statistics 81, 2, 170-187.
Askenazy P. and Moreno-Galbis E., 2007, "The Impact of Technological and Organizational Changes on Labor Flows. Evidence on French Establishments", Labour, 21(2), pp. 265-301.
Atkinson T., 1999, "Is Rising Inequality Inevitable? A Critique of the Transatlantic Consensus", WIDER Annual Lectures 3.
Autor D., Levy F. and Murnane R., 2003, "The skill content of recent technological change: an empirical investigation", The Quarterly Journal of Economics, 118(4), pp. 1279-1333.
Barron J., M. Berger and D. Black, 1997, On-the-Job Training, W.E. Upjohn Institute for Employment Research, Kalamazoo, Mich.
Bassanini A., Booth A., Brunello G. De Paola M. and Leuwen E., 2007, "Workplace Training in Europe", in Brunello G., Garibaldi P. and Wasmer E. eds, Education and Training in Europe, New-York: Oxford University Press, pp. 143-342.
Bauer T. and Bender S., 2004, "Technological Change, Organizational Change and Job Turnover", Labour Economics, 11(3), pp. 265-91.
Behaghel L., 2003 « Insécurité de l’emploi : le rôle protecteur de l’ancienneté a-t-il baissé en France ? », Economie et statistique, n°366, pp. 1-27.
Behaghel L. and Greenan N., 2010, "Training and Age-Biased Technical Change: Evidence from French Micro Data", Annales d’économie et de statistique, forthcoming.
Bellmann L. and F. Janik, 2007, "To recruit skilled workers or to train one’s own? Vocational training in the face of uncertainty as to the rate of retention of trainees on completion of training", Zeitschrift für ArbeitsmarktForschung, 2-3, pp. 205-220.
Ben Ner A. and A. Urtasun, 2010, "Computerization and Skill Bifurcation: The Role of Task Complexity in Creating Skill Gains and Losses", mimeo Carlson School of Manangement, University of Minnesota.
Bloom N., Sadun R. and Van Reenen J., 2008, "Americans do IT Better: US Multinationals and the Productivity Miracle, Revised version of NBER Working Paper 13085, http://www.stanford.edu/~nbloom/ADIB.pdf
Cappelli P., 1999, "Career Jobs are Dead", California Management Review, 42(1), pp. 146-67.
Caroli E. and Van Reenen J, 2001, ''Skill biased organizational change? Evidence from a panel of British and French establishments'', The Quarterly Journal of Economics, 116(4), pp. 1449-92.
Chennells L. and Van Reenen J., 2002, "Has Technology hurt the less skilled workers? An econometric survey of the effects of technical change on the structure of pay and jobs", in L'Horty Y., Greenan N. and Mairesse J. eds, Productivty, Inequality and the Digital Economy, MIT Press, pp. 175-225.
Davis, S.J., Haltiwanger, J., 1999. “Gross job flows”. In: Ashenfelter, O., Card, D. (Eds.), Handbook of Labor Economics, vol. 3b. North-Holland, Amsterdam, pp. 2711– 2805.
Doeringer P. and Piore M., 1971, Internal Labour Markets and Manpower Analysis, Lexington MA, Heath.
22/36
European Monitoring Centre on Change, 2006, "Trends and drivers of change in the European knowledge-intensive business services sector: Mapping report", European Foundation for the Improvement of Living and Working Conditions.
Farber H., 2007, "Job Loss and the Decline in Job Security in the United States", Working Paper #520, Princeton University, Industrial Relations Section.
Germe J.F., 2001, "Au-delà des marchés internes : quelles mobilités, quelles trajectoires ?", Formation Emploi, n°76, pp. 129-45.
Givord, P. and Maurin E., 2004, “Changes in Job Insecurity and their Causes: An Empirical Analysis for France, 1982-2002”, European Economic Review, 48, pp. 595-615.
Hatzichronoglou, T. (1997), "Revision of the High-Technology Sector and Product Classification", OECD Science, Technology and Industry Working Papers, 1997/2, OECD Publishing
Jacoby S., 1999, "Are Career Jobs Headed for Extinction?", Management Review, 42(1), pp. 123-45.
Lynch L. and Black S., 1998, "Beyond the Incidence of Employer Provided Training", Industrial and Labor Relations Review, 52(1), pp. 6481.
Marsden D., 1999, A Theory of Employment Systems: Micro-foundations of social diversity, Oxford University Press.
Mincer J., 1989, "Human Capital Responses to Technological Change in the Labour Market", NBER Working Paper, n°3207.
Neumark, D., Polsky, D. and Hansen D., 1999, “Has Job Stability declined yet? New Evidence for the 1990s”, Journal of Labour Economics, 17(4), pp. 29-64.
Neumark D. and Reed D., 2004, "Employment Relationships in the New Economy", Labour Economics, 11(1), pp. 1-31.
OECD, 2003, "More and Better Jobs? Aggregate Performance during the Past Decade", Chapter 1, Employment Outlook, OECD, Paris, pp. 17-66.
P. Ryan, H. Gospel and P. Lewis, 2007, "Large Employers and Apprenticeship Training in Britain", British Journal of Industrial Relations, 45(1), pp. 127–153.
Soskice D, 1994, "Reconciling Markets and Institutions: The German Apprenticeship System", in L. Lynch ed, Training and the Private Sector. International Comparisons, NBER Comparative Labor Market Series, Boston, Mass, pp. 25-60.
Spitz-Oener A., 2006, "Technical Change, Job Tasks and Rising Educational Demands: Looking outside the Wage Structure, Journal of Labour Economics, 24(2), pp. 235-70.
Stevens A.H., 2008, "Not So Fast: Long-Term Employment in the U.S. 1969-2004." In Laid Off, Laid Low: The Social and Political Impact of Job Instability, Katherine S. Newman, Editor. New York: Columbia University Press.
Valletta R., 2000, "Declining Job Security", in Neumark D. ed: On the Job: is Long-Term Employment a Thing of the Past?, New-York : Russell Sage Foundation, pp. 227-56.
Venn D., 2009, "Legislation, collective bargaining and enforcement: updating the OECD employment protection indicators", OECD-ELSA Working Paper.
Wachter M. and R. Wright, 1990, "The Economics of Internal Labor Markets", Industrial Relations, 29(2), pp.240-62.

23/36
Wooldridge J., 2002, Econometric Analysis of Cross Section and Panel Data, MIT Press, Cambrige.
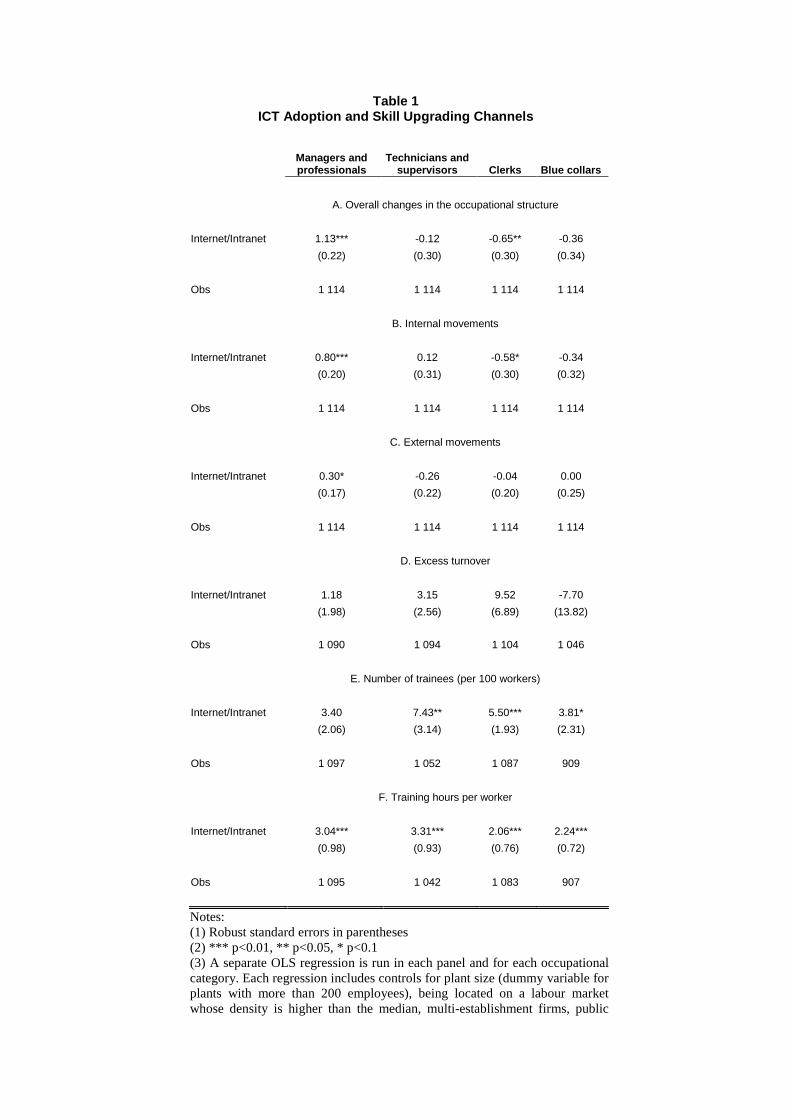
Table 1 ICT Adoption and Skill Upgrading Channels
Managers and professionals
Technicians and supervisors Clerks Blue collars
A. Overall changes in the occupational structure
Internet/Intranet 1.13*** -0.12 -0.65** -0.36
(0.22) (0.30) (0.30) (0.34)
Obs 1 114 1 114 1 114 1 114
B. Internal movements
Internet/Intranet 0.80*** 0.12 -0.58* -0.34
(0.20) (0.31) (0.30) (0.32)
Obs 1 114 1 114 1 114 1 114
C. External movements
Internet/Intranet 0.30* -0.26 -0.04 0.00
(0.17) (0.22) (0.20) (0.25)
Obs 1 114 1 114 1 114 1 114
D. Excess turnover
Internet/Intranet 1.18 3.15 9.52 -7.70
(1.98) (2.56) (6.89) (13.82)
Obs 1 090 1 094 1 104 1 046
E. Number of trainees (per 100 workers)
Internet/Intranet 3.40 7.43** 5.50*** 3.81*
(2.06) (3.14) (1.93) (2.31)
Obs 1 097 1 052 1 087 909
F. Training hours per worker
Internet/Intranet 3.04*** 3.31*** 2.06*** 2.24***
(0.98) (0.93) (0.76) (0.72)
Obs 1 095 1 042 1 083 907
Notes: (1) Robust standard errors in parentheses (2) *** p<0.01, ** p<0.05, * p<0.1 (3) A separate OLS regression is run in each panel and for each occupational category. Each regression includes controls for plant size (dummy variable for plants with more than 200 employees), being located on a labour market whose density is higher than the median, multi-establishment firms, public

25
sector companies, listed companies, presence of union delegates, share of women in the labour force, part-time work (dummy variable for firms with more than 5% of workers being part-time) and 15 sectors.
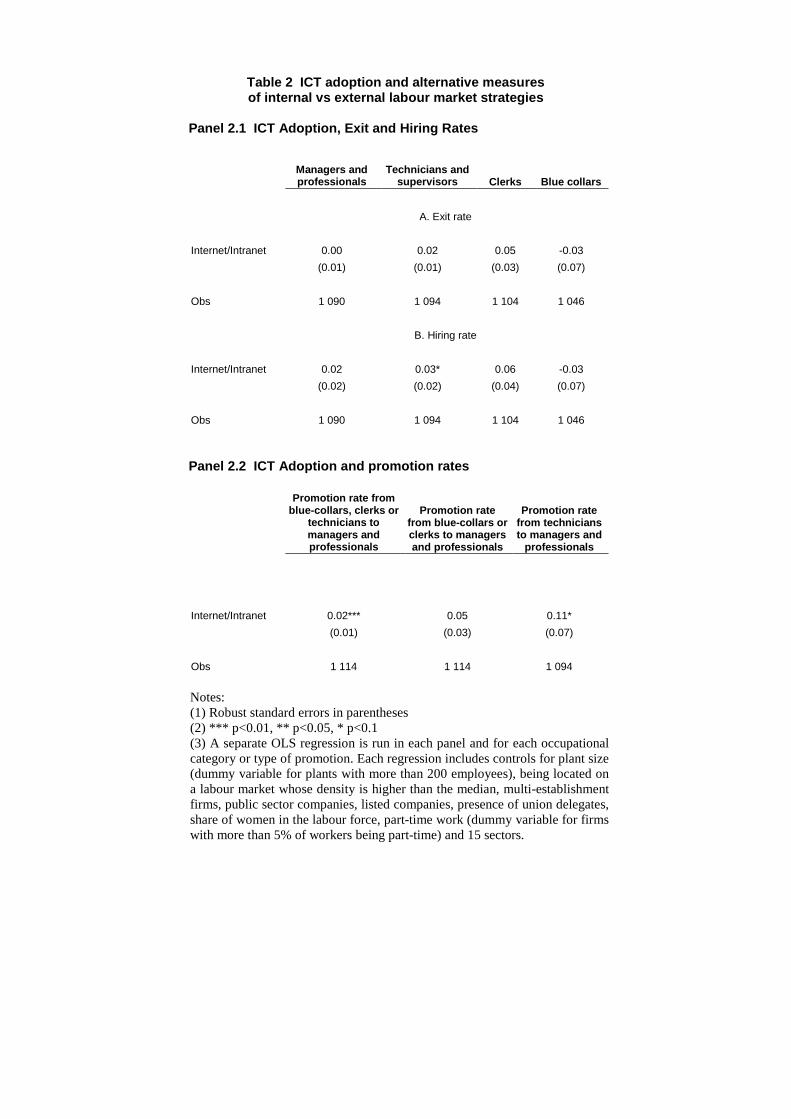
Table 2 ICT adoption and alternative measures of internal vs external labour market strategies
Panel 2.1 ICT Adoption, Exit and Hiring Rates
Managers and professionals
Technicians and supervisors Clerks Blue collars
A. Exit rate
Internet/Intranet 0.00 0.02 0.05 -0.03
(0.01) (0.01) (0.03) (0.07)
Obs 1 090 1 094 1 104 1 046
B. Hiring rate
Internet/Intranet 0.02 0.03* 0.06 -0.03
(0.02) (0.02) (0.04) (0.07)
Obs 1 090 1 094 1 104 1 046
Panel 2.2 ICT Adoption and promotion rates
Promotion rate from blue-collars, clerks or
technicians to managers and professionals
Promotion rate from blue-collars or clerks to managers and professionals
Promotion rate from technicians to managers and
professionals
Internet/Intranet 0.02*** 0.05 0.11*
(0.01) (0.03) (0.07)
Obs 1 114 1 114 1 094
Notes: (1) Robust standard errors in parentheses (2) *** p<0.01, ** p<0.05, * p<0.1 (3) A separate OLS regression is run in each panel and for each occupational category or type of promotion. Each regression includes controls for plant size (dummy variable for plants with more than 200 employees), being located on a labour market whose density is higher than the median, multi-establishment firms, public sector companies, listed companies, presence of union delegates, share of women in the labour force, part-time work (dummy variable for firms with more than 5% of workers being part-time) and 15 sectors.
27
Table 3.1 ICT Adoption and Skill Upgrading Channels in Manufa cturing Sectors
Managers and professionals
Technicians and supervisors Clerks Blue collars
A. Overall changes in the occupational structure
Internet/Intranet 1.05*** -0.42 -0.20 -0.43
(0.26) (0.35) (0.26) (0.39)
Obs 641 641 641 641
B. Internal movements
Internet/Intranet 0.80*** -0.16 -0.11 -0.53
(0.23) (0.35) (0.25) (0.36)
Obs 641 641 641 641
C. External movements
Internet/Intranet 0.24 -0.15 -0.13 0.03
(0.19) (0.23) (0.17) (0.29)
Obs 641 641 641 641
D. Excess turnover
Internet/Intranet -1.07 4.04 10.31** 8.99*
(1.33) (3.16) (4.27) (5.20)
Obs 635 634 634 634
E. Number of trainees (per 100 workers)
Internet/Intranet 8.68*** 13.04*** 8.03*** 4.10**
(2.45) (4.48) (2.59) (1.94)
Obs 633 625 624 629
F. Training hours per worker
Internet/Intranet 4.67*** 4.40*** 3.69*** 1.85**
(1.27) (1.12) (1.07) (0.82)
Obs 631 620 622 629
Notes: (1) Robust standard errors in parentheses (2) *** p<0.01, ** p<0.05, * p<0.1 (3) A separate OLS regression is run in each panel and for each occupational category. Each regression includes controls for plant size (dummy variable for plants with more than 200 employees), being located on a labour market whose density is higher than the median, multi-establishment firms, public sector companies, listed companies, presence of union delegates, share of women in the labour force, part-time work (dummy variable for firms with more than 5% of workers being part-time) and 7 manufacturing sub sectors.
28
Table 3.2 ICT Adoption and Skill Upgrading Channels in Servic e Sectors
Managers and professionals
Technicians and supervisors Clerks Blue collars
A. Overall changes in the occupational structure
Internet/Intranet 1.07*** 0.40 -1.37** -0.10
(0.38) (0.52) (0.65) (0.63)
Obs 473 473 473 473
B. Internal movements
Internet/Intranet 0.70* 0.53 -1.25* 0.03
(0.38) (0.58) (0.67) (0.61)
Obs 473 473 473 473
C. External movements
Internet/Intranet 0.30 -0.34 0.04 -0.01
(0.30) (0.43) (0.43) (0.44)
Obs 473 473 473 473
D. Excess turnover
Internet/Intranet 3.68 2.38 9.05 -32.38
(4.91) (4.52) (15.73) (33.71)
Obs 455 460 470 412
E. Number of trainees (per 100 workers)
Internet/Intranet -3.65 -0.20 2.51 4.34
(3.59) (4.16) (3.03) (6.38)
Obs 464 427 463 280
F. Training hours per worker
Internet/Intranet 0.88 1.50 -0.27 2.93**
(1.51) (1.63) (1.04) (1.42)
Obs 464 422 461 278
Notes: (1) Robust standard errors in parentheses (2) *** p<0.01, ** p<0.05, * p<0.1 (3) A separate OLS regression is run in each panel and for each occupational category. Each regression includes controls for plant size (dummy variable for plants with more than 200 employees), being located on a labour market whose density is higher than the median, multi-establishment firms, public sector companies, listed companies, presence of union delegates, share of women in the labour force, part-time work (dummy variable for firms with more than 5% of workers being part-time) and 8 service sub sectors.
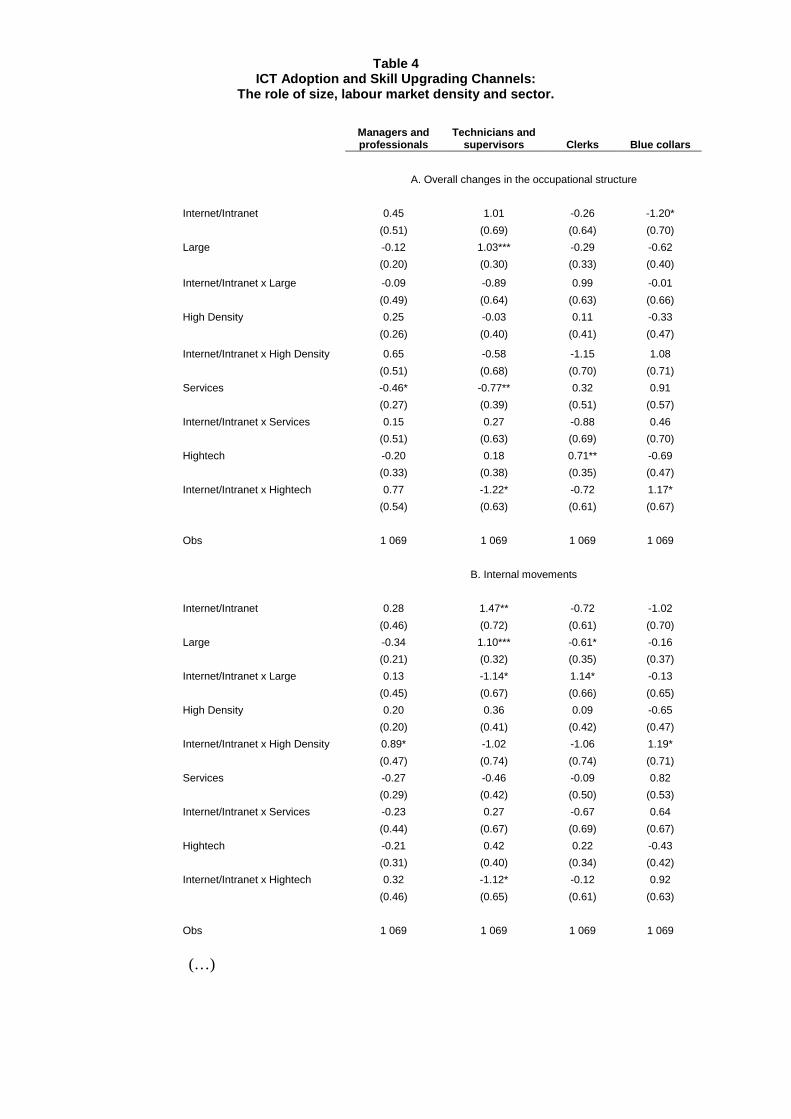
Table 4 ICT Adoption and Skill Upgrading Channels:
The role of size, labour market density and sector.
Managers and professionals
Technicians and supervisors Clerks Blue collars
A. Overall changes in the occupational structure
Internet/Intranet 0.45 1.01 -0.26 -1.20*
(0.51) (0.69) (0.64) (0.70)
Large -0.12 1.03*** -0.29 -0.62
(0.20) (0.30) (0.33) (0.40)
Internet/Intranet x Large -0.09 -0.89 0.99 -0.01
(0.49) (0.64) (0.63) (0.66)
High Density 0.25 -0.03 0.11 -0.33
(0.26) (0.40) (0.41) (0.47)
Internet/Intranet x High Density 0.65 -0.58 -1.15 1.08
(0.51) (0.68) (0.70) (0.71)
Services -0.46* -0.77** 0.32 0.91
(0.27) (0.39) (0.51) (0.57)
Internet/Intranet x Services 0.15 0.27 -0.88 0.46
(0.51) (0.63) (0.69) (0.70)
Hightech -0.20 0.18 0.71** -0.69
(0.33) (0.38) (0.35) (0.47)
Internet/Intranet x Hightech 0.77 -1.22* -0.72 1.17*
(0.54) (0.63) (0.61) (0.67)
Obs 1 069 1 069 1 069 1 069
B. Internal movements
Internet/Intranet 0.28 1.47** -0.72 -1.02
(0.46) (0.72) (0.61) (0.70)
Large -0.34 1.10*** -0.61* -0.16
(0.21) (0.32) (0.35) (0.37)
Internet/Intranet x Large 0.13 -1.14* 1.14* -0.13
(0.45) (0.67) (0.66) (0.65)
High Density 0.20 0.36 0.09 -0.65
(0.20) (0.41) (0.42) (0.47)
Internet/Intranet x High Density 0.89* -1.02 -1.06 1.19*
(0.47) (0.74) (0.74) (0.71)
Services -0.27 -0.46 -0.09 0.82
(0.29) (0.42) (0.50) (0.53)
Internet/Intranet x Services -0.23 0.27 -0.67 0.64
(0.44) (0.67) (0.69) (0.67)
Hightech -0.21 0.42 0.22 -0.43
(0.31) (0.40) (0.34) (0.42)
Internet/Intranet x Hightech 0.32 -1.12* -0.12 0.92
(0.46) (0.65) (0.61) (0.63)
Obs 1 069 1 069 1 069 1 069
(…)
30
Table 4 – follow (1)
Managers and professionals
Technicians and supervisors Clerks Blue collars
C. External movements
Internet/Intranet 0.03 -0.32 0.62 -0.33
(0.38) (0.53) (0.43) (0.55)
Large 0.16 -0.09 0.41* -0.48
(0.16) (0.23) (0.23) (0.30)
Internet/Intranet x Large -0.04 0.11 -0.34 0.27
(0.35) (0.47) (0.41) (0.50)
High Density 0.06 -0.24 0.30 -0.12
(0.23) (0.29) (0.29) (0.39)
Internet/Intranet x High Density -0.16 0.23 -0.25 0.18
(0.42) (0.52) (0.45) (0.53)
Services -0.10 -0.20 0.12 0.18
(0.22) (0.32) (0.31) (0.37)
Internet/Intranet x Services 0.31 -0.13 -0.04 -0.14
(0.42) (0.50) (0.49) (0.55)
Hightech 0.04 -0.25 0.40 -0.19
(0.25) (0.27) (0.29) (0.40)
Internet/Intranet x Hightech 0.44 -0.01 -0.66 0.23
(0.40) (0.45) (0.43) (0.53)
Obs 1 069 1 069 1 069 1 069
D. Excess turnover
Internet/Intranet -1.84 1.38 -6.50 42.14*
(4.11) (9.41) (14.16) (24.06)
Large -0.10 -12.14* -22.73** 20.44
(4.28) (7.04) (8.97) (35.89)
Internet/Intranet x Large -1.19 2.69 20.22 -49.99
(4.51) (7.45) (15.98) (38.67)
High Density -3.47 -10.77** -16.44* -29.46
(4.32) (5.05) (9.64) (22.23)
Internet/Intranet x High Density 3.72 12.13** 43.37** 32.26
(5.53) (5.53) (21.76) (22.83)
Services 14.25** 19.60*** 63.60*** 49.40*
(5.70) (5.45) (9.84) (26.43)
Internet/Intranet x Services 3.55 -8.65 -18.48 -55.77*
(4.92) (7.11) (14.73) (30.87)
Hightech 1.18 1.10 0.61 -17.53**
(2.34) (2.57) (5.72) (7.95)
Internet/Intranet x Hightech 1.96 -2.74 -2.81 -2.98
(3.19) (5.17) (13.32) (16.68)
Obs 1 045 1 049 1 059 1 005
(…)
31
Table 4 – follow (2)
Managers and professionals
Technicians and supervisors Clerks Blue collars
E. Number of trainees (per 100 workers)
Internet/Intranet 12.13** 8.03 9.26* 3.76
(5.04) (5.53) (4.90) (4.50)
Large 12.36*** 15.48*** 8.53*** 9.04*
(2.78) (3.55) (2.59) (4.62)
Internet/Intranet x Large -5.27 -4.76 -2.50 -2.54
(4.36) (5.30) (4.32) (5.51)
High Density -1.75 -1.45 -1.93 -0.17
(3.22) (3.91) (2.81) (3.76)
Internet/Intranet x High Density 2.39 3.98 0.98 -0.65
(4.56) (5.50) (4.41) (4.94)
Services 4.52 2.80 -2.14 8.18
(3.62) (4.40) (3.51) (5.82)
Internet/Intranet x Services -16.02*** -7.73 -4.81 -3.00
(4.94) (5.91) (5.15) (5.81)
Hightech -5.26 -5.42 1.95 3.59
(3.51) (4.70) (3.49) (2.58)
Internet/Intranet x Hightech 1.26 2.69 -1.97 2.39
(4.27) (5.20) (4.96) (3.99)
Obs 1 052 1 009 1 043 871
F. Training hours per worker
Internet/Intranet 6.09** 2.91 3.79** -1.19
(2.47) (2.03) (1.74) (1.57)
Large 6.73*** 5.40*** 3.59*** 2.14***
(1.33) (1.25) (0.91) (0.74)
Internet/Intranet x Large -1.91 -0.20 -1.52 2.07
(2.13) (2.06) (1.72) (1.47)
High Density 0.32 0.28 0.82 0.18
(1.37) (1.34) (1.17) (0.85)
Internet/Intranet x High Density -1.40 -0.32 -1.87 0.33
(2.12) (2.18) (1.67) (1.84)
Services 1.03 2.51* 1.45 0.06
(1.49) (1.44) (1.18) (1.19)
Internet/Intranet x Services -4.44* -2.01 -2.88* 2.35
(2.34) (2.14) (1.73) (1.90)
Hightech 1.32 1.94 2.34* -0.56
(1.62) (1.33) (1.24) (1.08)
Internet/Intranet x Hightech 0.63 3.63* 1.54 2.80*
(2.14) (1.95) (1.85) (1.62)
Obs 1 051 1 001 1 040 869
Notes: (1) Robust standard errors in parentheses. *** p<0.01, ** p<0.05, * p<0.1 (2) A separate OLS regression is run in each panel and for each occupational category. Each regression includes controls for plant size (dummy variable for plants with more than 200 employees), multi-establishment firms, public sector companies, listed companies, presence of union delegates, share of women in the labour force, part-time work (dummy variable for firms with more than 5% of workers being part-time) and 15 sectors. (3) High Density indicates that local labour market density belongs to the highest quartile.

32
(3) The coefficient for "Services" is computed as the difference between the coefficients for the eight 2-digit service sub sectors and the seven 2-digit manufacturing sub sectors, weighted by the shares of each sub sector. (4) The "Hightech" indicator uses the OECD definition, applied to 712 4-digit sub sectors.
33
Appendix
Table A Descriptive Statistics
All plants Internet/Intranet=0 Internet/Intranet=1 Manufacturing Services
Change of labor share (in %) Managers and professionals 0.77 0.33 1.65 0.93 0,54 Technicians and supervisors 0.56 0.63 0.44 0.72 0,36 Clerks -0.38 -0.15 -0.84 -0.27 -0,53 Blue collars -0.95 -0.81 -1.24 -1.38 -0,37 Change of labor share through internal movements (in %) Managers and professionals 0.92 0.60 1.55 0.90 0,93 Technicians and supervisors 0.79 0.73 0.92 0.96 0,56 Clerks -0.64 -0.38 -1.16 -0.41 -0,95 Blue collars -1.07 -0.95 -1.31 -1.46 -0,55 Change of labor share through entries and exits (in %) Managers and professionals -0.07 -0.18 0.15 0.07 -0,26 Technicians and supervisors -0.13 0.00 -0.41 -0.17 -0,09 Clerks 0.18 0.13 0.29 0.14 0,25 Blue collars 0.02 0.04 -0.02 -0.04 0,10 Excess turnover (in %) Managers and professionals 24.12 25.04 22.29 18.54 31,89 Technicians and supervisors 25.13 27.38 20.67 13.95 40,55 Clerks 61.10 61.07 61.16 30.13 102,88 Blue collars 49.93 53.38 42.79 27.21 84,89 Number of trainees per 100 workers Managers and professionals 59.60 56.71 65.38 60.58 58,27 Technicians and supervisors 59.59 55.47 67.94 60.94 57,62 Clerks 41.27 37.88 48.06 43.82 37,83 Blue collars 34.18 32.04 39.14 34.17 34,22 Hours of training per worker Managers and professionals 21.45 19.54 25.24 22.70 19,75 Technicians and supervisors 19.45 17.55 23.30 19.97 18,69 Clerks 12.07 10.87 14.47 13.08 10,70 Blue collars 9.49 8.27 12.31 10.31 7,63 Internet/Intranet 0,33 0.00 1.00 0.34 0.32 Indicator for plant with more than 200 workers 0,53 0.48 0.62 0.62 0.40 Indicator for dense local labor market 0,25 0.21 0.34 0.20 0.32 Indicator for service sector 0,42 0.43 0.41 0.00 1.00 Indicator for multi-establishment firm 0,60 0.57 0.66 0.63 0.56 Indicator for public sector 0,03 0.03 0.05 0.02 0.05 Indicator for listed company 0,43 0.38 0.54 0.55 0.27 Indicator for presence of union delegates 0,77 0.76 0.81 0.84 0.69 Share of women (%) 35,13 35.91 33.54 25.98 47.53 Indicator for part-time work (>5% of workforce) 0,37 0.37 0.38 0.22 0.58
Number of observations 1114 747 367 641 473
34
Data appendix In this appendix, we detail the key steps taken in preparing the data. The data sources are described in the data section in the text. In addition, the data on local labour market density (the number of employed and unemployed workers per square kilometres, computed over 348 local labour markets) comes from the 1990 population census.
Merging the different datasets
We start from a sample of 2,975 plants from the REPONSE (1998) survey, with information on ICT adoption as well as key firm and plant characteristics. Matching the RESPONSE sample with the DMMO-EMMO, ESE and 24-83 sources yields a sample of 1,537 plants.
The relatively low matching rate (53%) is due, in particular, to the fact that the EMMO is not an exhaustive data source (plants are sampled at a rate that depends on their size) and that the 24-83 fiscal forms are not systematically coded.
In order to achieve this matching rate, we extrapolate some of the missing data, using the following procedures:
- when a plant is only present for 1 (resp. 2) of the 3 years in the 24-83 database, we compute the training variables as averages over 1 (resp. 2) years instead of 3;
- when a plant is missing for some quarters in a given year in the EMMO-DMMO data, we extrapolate the entries and exits in each occupation from the entries and exits observed during the rest of the year; if a plant is missing during one (or two) of the three years, we extrapolate entries and exits from the other years.
Though these extrapolations introduce measurement error in the movement and training variables, this does not bias the estimates as these are dependent variables in the regressions (it might, however, make them less precise). Moreover, we checked that restricting the sample to those plants that have complete DMMO-EMMO information does not significantly alter the results. Our results are indeed a little less precise when using extrapolated information. The point estimates are generally a bit smaller, but not significantly.
In order to get information on investment rates and on ICT expenditure, we match our main dataset with the EAE. Given that the EAE is not exhaustive, we end up with 874 firms in this subsample. So, we only use it to conduct robustness checks.
Outliers and consistency checks
It appeared that for some of the plants, the training information had been misreported (possibly inverted) for skilled and unskilled blue collars in 1997 and 1998, leading to implausible training rates. As we lacked information to correct the errors, we decided to aggregate the two categories in a single blue-collar occupation. In addition to this, a few observations had outlying values for the number of trainees for some years. We corrected these observations when possible, or set them to missing.
35
We then performed several consistency checks on this 1537 plant sample. First, we checked that the total plant size declared in the ESE does not differ too much from the one declared in the DMMO-EMMO sources, at the beginning and at the end of our period (Dec 31, 1995 and Dec 31, 1998). We drop all plants for which the difference is more than 20% or represents at least 10 workers. We tested the robustness of our results to other thresholds; the main findings are not affected.
Second, we checked for outliers in the changes in the occupational structure. We dropped plants for which the sum of the absolute changes in the share of the different occupations is more than 60% and represents more than 10 workers. The results are not sensitive to using a stricter threshold.
With these filters, the benchmark sample has 1,114 plants. Dropping any kind of filter and using the 1537 observations does not significantly impact our results on training, but does affect those concerning internal and external movements. However, once a minimum level of consistency across data sources is required, the tightness of the filters we use does not matter.
Last, we also considered a sample where we restricted upward internal mobility for managers and professionals and downward internal mobility for unskilled blue collars. The idea is that managers cannot be downgraded and that no one can be promoted to an unskilled blue collar position. We first consider a strict limit, but as it appears that the median of internal promotion for unskilled workers was 0 (though obviously not symmetrically distributed), we eventually settle to a less strict limit (+/-2) allowing for measurement errors (in the first case the sample contains about 550 observations, and about 950 in the second case). When using the strict rule, results do shift a bit, but the sample size is also divided by 2. However, when using the less strict rule of +/-2, results are in line with our benchmark.
Sample selection
Our main sample being constructed by matching 5 different sources, sample selectivity may be an issue.
First, a few observations may be lost due to the matching procedure. Firms are matched on a national firm identifier (SIREN), managed by the French statistical institute (INSEE). A few identifier changes may occur over the 3-year period, in particular due to mergers; it is however reasonable to put these firms aside, as the merger may disrupt the link between HR management practices and technology adoption.
More importantly, the main reason for the relatively low matching rate (53%) is that 2 of the 5 main datasets (EMMO and 24-83) are not exhaustive. In these two datasets, however, we have random sampling of the total population, with sampling probabilities varying by firm size. Sample selectivity bias is therefore not an issue, even though the analysis sample is not representative of the initial population anymore. Instead of using sampling weights in the analysis, we prefer to check the robustness of our estimates by stratifying the sample (or adding interaction terms) in two key dimensions: firms’ size and firms’ industry (services vs. manufacturing).
36
A second concern is that, by construction, only firms surviving over the 1996-98 periods can be used in the analysis. We cannot rule out sample selectivity issues here. As we do not observe ICT adoption at the beginning of the period, it is not possible to analyse the selective survival of firms, or to implement sample selectivity corrections. The discussion of the possible bias is somewhat speculative. However, we believe that, if anything, our key finding should be reinforced. What we are particularly missing are the external movements that would appear if some firms were shrinking instead of closing. A likely hypothesis is that firms that do not adopt ICT are less likely to survive, so that we are disproportionately missing external movements among non-adopters. We therefore probably overestimate the correlation between external movements and ICT adoption. Consequently, it seems that correcting for sample selectivity would reinforce our finding that internal labour markets play a larger role than the external labour market in a context of ICT adoption.