Embed Size (px)
Citation preview
Industrials Conference August 2016

2
Forward-Looking Statements Certain statements made in this presentation are forward-looking statements that involve risks and uncertainties. The words “believe,” “expect,” “project,” “will,” “should,” “could” and similar expressions are intended to identify those forward-looking statements. These forward-looking statements reflect the Company’s best judgment based on current information, and although we base these statements on circumstances that we believe to be reasonable when made, there can be no assurance that future events will not affect the accuracy of such forward-looking information. As such, the forward-looking statements are not guarantees of future performance, and actual results may vary materially from the projected results and expectations discussed in this report. Factors that might cause the Company’s actual results to differ materially from those anticipated in forward-looking statements include, but are not limited to: (1) competitive pressure on sales and pricing, including pressure from imports and substitute materials; (2) U.S. and foreign trade policies affecting steel imports or exports; (3) the sensitivity of the results of our operations to prevailing steel prices and changes in the supply and cost of raw materials, including pig iron, iron ore and scrap steel; (4) availability and cost of electricity and natural gas which could negatively affect our cost of steel production or could result in a delay or cancellation of existing or future drilling within our natural gas working interest drilling programs; (5) critical equipment failures and business interruptions; (6) market demand for steel products, which, in the case of many of our products, is driven by the level of nonresidential construction activity in the U.S.; (7) impairment in the recorded value of inventory, equity investments, fixed assets, goodwill or other long-lived assets; (8) uncertainties surrounding the global economy, including the severe economic downturn in construction markets and excess world capacity for steel production; (9) fluctuations in currency conversion rates; (10) significant changes in laws or government regulations affecting environmental compliance, including legislation and regulations that result in greater regulation of greenhouse gas emissions that could increase our energy costs and our capital expenditures and operating costs or cause one or more of our permits to be revoked or make it more difficult to obtain permit modifications; (11) the cyclical nature of the steel industry; (12) capital investments and their impact on our performance; and (13) our safety performance.

Optimize Existing Operations
Pursue Strategic Acquisitions
Raw Materials Strategy
International Growth via Joint Ventures
Greenfield Growth (Technology & Market niches)
Nucor’s Multi-Pronged Growth Strategy Simple and Highly Flexible
3

4
Nucor’s Position of Strength
Nucor’s People and Our Culture Financial Strength Flexible Production Capacity
FIVE DRIVERS TO PROFITABLE GROWTH 1. Low Cost Producer 2. Market Leadership 3. Move Up The Value Chain 4. Expand Channels To Market 5. Commercial Excellence

5
$-
$0.5
$1.0
$1.5
$2.0
$2.5
$3.0
2000 2001 2002 2003 2004 2005 2006 2007 2008 2009 2010 2011 2012 2013 2014 2015
(in b
illion
s of
dol
lars
) Strength of Nucor’s Business Model Demonstrated By Cash From Operations 2000-2015
2015 $2.2
Billion
Cyclical Trough to Cyclical Trough – More than Twice as Strong
$495 million Average ‘01-’03
$1.265 billion Average ‘09-’15
Source: Company filings

6
Strength of Nucor’s Business Model Demonstrated By Industry Leading Returns
Average ROIC 2004 to 2015
Source: Company filings. Note: ROIC = EBIT x (1-.35) / (Net PP&E + WC)
3.0% 4.1%
11.5%
14.2%
0%
2%
4%
6%
8%
10%
12%
14%
16%
ArcelorMittal U.S. Steel Steel Dynamics Nucor
RO
IC
Leveraging Our Position of Strength FOR PROFITABLE GROWTH
7 Source: Nucor’s Annual Report

8
1) LOW COST PRODUCER
Raw Materials Platform – Unrivaled Breadth and Integration
Flexible and Highly Efficient Steelmaking and Downstream Production Capacity
Direct Reduced Iron (DRI) Production Capacity to address long-term trends of tightening and degrading prime scrap supplies

9
2) MARKET LEADERSHIP
Source: Company filings, SEC Filings, Industry Data, First River Consulting, and Capital IQ as of 22nd February 2016
Structural Steel
Rebar Steel
Merchant Bar & Light Shapes Steel
Cold Finished Bar Steel
Sheet Steel (hot + cold + galvanized)
Plate Steel SBQ Bar Steel
#1 North American Market Leader
Steel Joist Steel Deck Rebar Fabrication, Distribution, & Placement Steel Piling Distribution Metal Buildings
#2 North American Market Leader
#3 North American Market Leader
Nucor is the Market Leader in North America

10
3) MOVE UP THE VALUE CHAIN
Heat Treat & Normalized Plate (2011-2013; $152 million; 245,000 tons)
SBQ & Wire Rod Product Expansion (2012-2015; $290 million; 1 million tons)
Wide-Light Sheet Steel Products (2014; $98 million; 300,000+ tons)
Structural Sheet Piling Product Expansion (2014; $115 million; 100,000 tons)
More Projects Underway
10

Nucor-Yamato Quench & Self-Temper: High-Strength, Low-Alloy Beams
Q4-2016 startup; $75 million; 50,000 tons
11

12
NUCOR & JFE STEEL JOINT VENTURE: Supply Mexican Automotive Market
400,000 tons of galvanized sheet steel annual capacity at $270 million capital cost
50/50 joint venture Strategically located in central Mexico in heart of
automotive production Second Half 2019 startup Nucor & JFE each supply equal amount of substrate
12
13
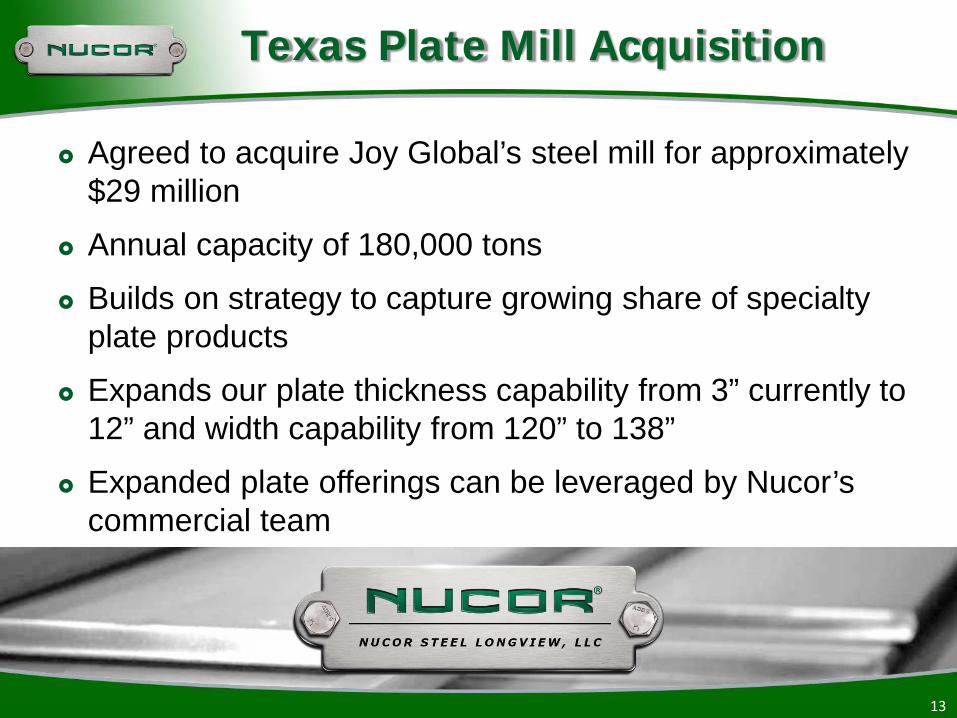
Texas Plate Mill Acquisition
Agreed to acquire Joy Global’s steel mill for approximately $29 million
Annual capacity of 180,000 tons Builds on strategy to capture growing share of specialty
plate products Expands our plate thickness capability from 3” currently to
12” and width capability from 120” to 138” Expanded plate offerings can be leveraged by Nucor’s
commercial team
13
14
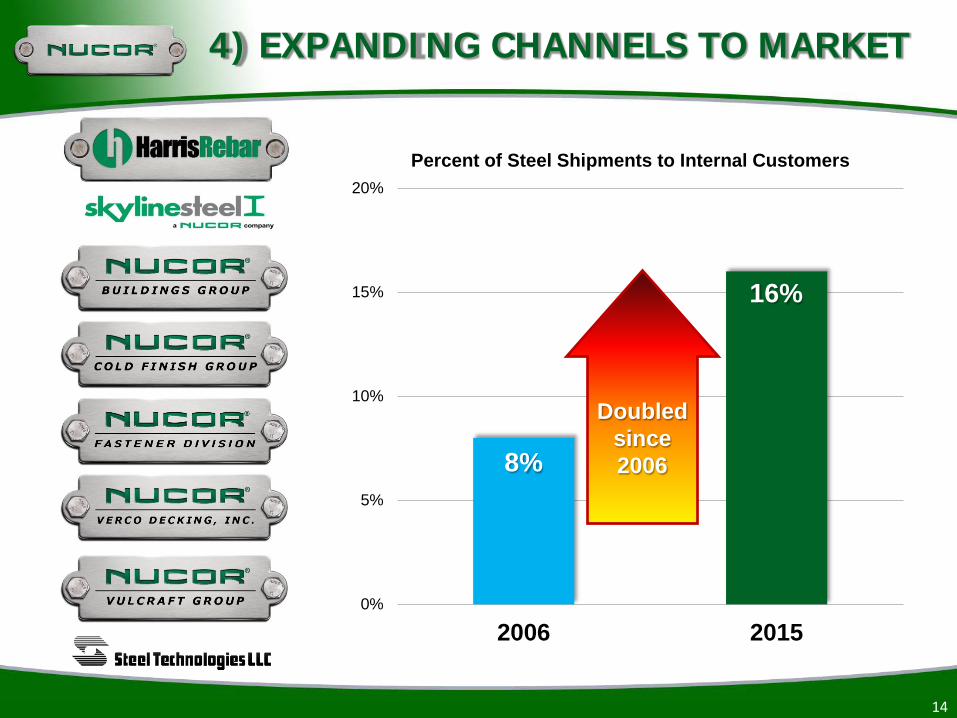
8%
16%
0%
5%
10%
15%
20%
2006 2015
Percent of Steel Shipments to Internal Customers
Doubled since 2006
4) EXPANDING CHANNELS TO MARKET

5) COMMERCIAL EXCELLENCE
Become the supplier of choice for steel buyers
15

16
Stewards of Our Shareholders’ Valuable Capital
Capital Allocation Priorities
1. Investing In Profitable Growth Opportunities
2. Dividend Growth Commensurate With Earnings
3. Opportunistic Share Repurchases

17
Cash From Operations, Capital Invested, & Capital Returned Ten Year History (2006-2015)
Balanced Capital Allocation
[VALUE]B [VALUE]B [VALUE]B $-
$2
$4
$6
$8
$10
$12
$14
$16
$18
Cash Generated byOperations
Capital Invested Capital Returned
(in b
illion
s of
dol
lars
)

18
$-
$1
$2
$3
$4
$5
$6
$7
Capital Invested Depreciation
(in b
illion
s of
dol
lars
) Investing for Profitable Growth
Capital Invested Versus Depreciation During Current Steel Industry Downturn of 2009-2015
$3.9 Billion
$6.3 Billion
Capital Spending
$4.4 Billion
Acquisitions $1.9 Billion
Note: Capital Invested = Capital Spending + Acquisitions

19
Steel Industry Down-Cycle
Up-Cycle
$4 Billion Returned to Shareholders During 2004-2008 Up-Cycle
Base Dividend Increased 43 Consecutive Years!
Capital Returned to Shareholders 2004-2015 Base & Supplemental Dividends + Share Repurchases
Source: Company filings
$-
$200
$400
$600
$800
$1,000
$1,200
$1,400
$1,600
2004 2005 2006 2007 2008 2009 2010 2011 2012 2013 2014 2015
(in m
illion
s of
dol
lars
)
Base Dividends Supplemental Dividends Share Repurchases

20
$(300)
$200
$700
$1,200
$1,700
$2,200
2000 2001 2002 2003 2004 2005 2006 2007 2008 2009 2010 2011 2012 2013 2014 2015
(in m
illion
s of
dol
lars
)
2008 Record EPS $5.98
Building Earnings Power for the Next Cyclical Peak & Beyond
Source: Company filings

21
NUCOR’S BEST YEARS ARE STILL AHEAD OF US
Approx. 175,000 tons of Nucor steel in One World Trade Center in New York