Embed Size (px)
Citation preview

Index of Wetland Condition 2009/10Statewide assessment of Victoria’s high value wetlands

ContentsVictoria’s wetlands 4
Photographs illustrating the range of wetlands in Victoria 4
Threats to wetland condition 6
The Index of Wetland Condition 7
Wetlands assessed 9
Overall results 10
Subindex results 11
Condition of Ramsar sites 12
How will the information on condition be used 13
Results for individual wetlands 14
Appendix 1: The condition of wetlands assessed using the IWC in Ramsar sites 16
Published by the Victorian Government Department of Sustainability and Environment Melbourne, February 2012
© The State of Victoria Department of Sustainability and Environment 2011 This publication is copyright. No part may be reproduced by any process except in accordance with the provisions of the Copyright Act 1968.
Authorised by the Victorian Government, 8 Nicholson Street, East Melbourne
Print managed by Finsbury Green. Printed on recycled paper.
ISBN 978-1-74242-977-9 (print)
For more information contact the DSE Customer Service Centre 136 186
Photography: Allison Pouliot, Yvette Baker, IWC database
DisclaimerThis publication may be of assistance to you but the State of Victoria and its employees do not guarantee that the publication is without flaw of any kind or is wholly appropriate for your particular purposes and therefore disclaims all liability for any error, loss or other consequence which may arise from you relying on any information in this publication.
Accessibility
If you would like to receive this publication in an accessible format, such as large print or audio, please telephone 136 186, or email [email protected]
Deaf, hearing impaired or speech impaired? Call us via the National Relay Service on 133 677 or visit www.relayservice.com.au
This document is also available in PDF format on the internet at www.dse.vic.gov.au

3
Victoria has adopted an integrated approach to the management of rivers, streams, estuaries and wetlands. Condition assessment is an essential part of that approach. Information on condition is used to inform policy, assess risks to the values of rivers, estuaries and wetlands, determine management priorities, set targets and monitor the longer term trends in condition. Condition data helps DSE and Catchment Management Authorities (CMAs) identify the processes that threaten rivers, estuaries and wetlands and understand how these systems respond to management actions to address those threats.
Condition assessment began in 1999 with the Index of Stream Condition (ISC) which has provided a comprehensive review of the condition of Victoria’s rivers and streams that has proved extremely useful for setting priorities for
management. Statewide stream condition assessments were undertaken in 1999, 2004 and are planned for 2012.
Victoria has around 13,000 natural wetlands greater than one hectare in area. This first systematic statewide assessment of wetlands in Victoria, undertaken in 2009/10, focused on high value wetlands with almost 600 being assessed. An assessment of a sample of the remaining 12,400 wetlands in Victoria was undertaken in 2011. The results will be used to provide a benchmark for monitoring long-term trends in wetland condition. The first assessment of the condition of Victoria’s estuaries is also underway and the results will be available in late 2012. Condition assessments are scheduled to be undertaken at eight yearly intervals.
This report summarises the results of the first assessment of the condition of Victoria’s high value wetlands. The 2009/10 assessment was led by the Department of Sustainability and Environment (DSE). The assessment focused on high value wetlands which are recognised for the important environmental, social and economic values to the community and have the highest priority for management.

4
The results of the wetland assessments showed that 56% of high value wetlands were in excellent or good condition, 30% were in moderate condition, 13% were in poor condition and 1% were in very poor condition. The assessments were undertaken at the end of a period of thirteen years of below average rainfall (1996 to 2009). Wetlands in Victoria have evolved under a variable climate. The percentage of high value wetlands in excellent or good condition after such a long dry period indicates both the effectiveness of management and the degree of wetland resilience. However, the fact that 44% of high value wetlands are in moderate to very poor condition, despite the fact that high value wetlands have a high profile for protection and management, indicates that many of these wetlands are still subject to threatening processes which are likely to have been exacerbated by drought. The results also indicated that high value wetlands on public land are generally in better condition than those on private land, although there are still many examples of high value wetlands in good or excellent condition on private land.
Victoria’s wetlandsVictoria’s wetlands are special places that are valued by the community for their distinctive plants and animals, for the recreational opportunities they provide, for their scenic values and cultural heritage. These wetlands, which vary greatly in character, range from lakes, floodplain billabongs, alpine peatlands, to shallow freshwater and saline wetlands. Wetlands mainly occur in the lowland areas of Victoria either on floodplains where they are inundated during floods, or in depressions on plains, or in drainage lines where they are fed from local runoff. Groundwater is also an important source of water for many wetlands. Apart from alpine peatlands, there are few wetlands in the mountainous and hilly parts of Victoria.
Photographs illustrating the range of wetlands in Victoria
Lake
Floodplain billabong

5
Approximately 600 of Victoria’s wetlands are considered high value. They include wetlands of international importance, listed under the Ramsar Convention (Ramsar sites), wetlands of national importance, listed in A Directory of Important Wetlands in Australia (www.environment.gov.au/water/topics/wetlands), and other wetlands identified as significant at the state level.
Alpine peatland Saline wetland
Shallow freshwater wetland

6
Threats to wetland conditionWetlands are resilient and adaptive but are threatened by many factors.
• Changed land use in the catchment. Clearing the catchment of native vegetation and intensifying land use can change the natural flow pattern of water into the wetland and increase the amount of sediment and nutrients entering the wetland. A fringing zone of native vegetation around the wetland can filter out sediments and nutrients from water flowing into the wetland, provide habitat for wetland wildlife and reduce exposure of the water to the sun and wind. If the fringing zone is cleared or degraded these benefits are lost.
• Drainage or infilling can lead to permanent loss of wetland habitat.
• Physical works. Excavation or landforming (such as the construction of a dam in the bed of the wetland) will change the depth of the wetland. This changes the water regime and habitat within the wetland.
• Altered hydrology. River regulation, water extraction for consumptive uses, wetland drainage or reduced inflows from local catchments or groundwater can have a major impact on wetlands. The natural productivity that comes from regular wetting and drying can decline. When there is less water, wetlands dry out more often resulting in less habitat for wetland plants and animals. When there is excess water, trees such as Red Gums can die from prolonged flooding.
• Salinity in excess of the natural amounts can be caused by raised saline water tables. Native plants and animals in the wetland may not be able to survive in the more saline conditions. Under the drought conditions from 2006 to 2009, the depth of saline water tables increased, reducing the level of this threat to wetlands.
• Nutrients levels can become elevated when nutrient rich runoff from agricultural and urban landscapes enters the wetland or when livestock access the wetland for grazing. Raised nutrient levels can cause excessive plant growth and algal blooms.
• Livestock, vehicles, carp and certain other activities can muddy the water, disturb wetland soils and affect plant growth.
• Invasive species. Invasive species can degrade the condition of the native wetland vegetation and adversely affect wetland fauna.

7
The Index of Wetland ConditionThe Index of Wetland Condition (IWC) is the method used to assess the condition of Victoria’s high value wetlands. It assesses the impact of the threats outlined above by systematically assessing the state of six components that are critical to the function of wetlands as outlined in the table on page 8. These components form the subindices of the IWC. Each subindex is scored using particular measures also shown on page 8. The overall score is calculated from the weighted subindex scores. The biota, hydrology and water properties subindices are given the highest weight.
The IWC is a rapid assessment technique to measure wetland condition. It scores the condition of a wetland by comparing each of the measures that make up the subindex to a ‘reference condition’. The reference condition is the estimated condition of the wetland at the time of European settlement, based on scientific knowledge and expert opinion. This provides a consistent baseline for monitoring change but does not mean the aim of management is to
return all wetlands in Victoria to their original condition. The approach in Victoria is to identify the values of the wetland and determine the level of condition of the particular components that are necessary to continue to support or improve those values. Work is being undertaken to increase knowledge on the association between recognised values and condition.
The method is designed for use at all natural wetlands, except those with a marine water source, such as mangroves and coastal salt marshes.
Many wetlands dry naturally from time to time. Their overall condition can remain healthy through a period of drying, where it occurs as part of a natural wetting and drying cycle. The wetland measures selected for the IWC were designed to detect longer term changes in condition, regardless of whether the wetland was wet or dry at the time of assessment.

8
Wetland subindex What was measured?Wetland in excellent or good condition had the following characteristics
Wetland catchment 1. The intensity of the land use within 250 metres of the wetland
Land use intensity around the wetland is low (e.g. conservation or native forestry)
2.The width of the native vegetation surrounding the wetland and whether it was a continuous zone or fragmented
There is a zone of wide and continuous native vegetation surrounding the wetland
Physical form 3. Whether the size of the wetland was reduced from its estimated size at the time of pre-European settlement
The original wetland area and form is unmodified
4. The percentage of the wetland bed which was excavated or filled
Hydrology 5. Whether the wetland’s water regime (i.e. the timing, frequency of filling and duration of flooding) were changed by human activities
There is little or no change in the wetland’s water regime from its natural state
Water properties 6. Whether activities and impacts such as grazing and fertilizer run-off that would lead to an input of nutrients to the wetland were present
There is an absence of activities such as grazing or fertilizer runoff that could result in an increase nutrient concentration in the wetland
7. Whether the wetland had become more saline or in the case of a naturally salty wetland, whether it had become more fresh
There is no change in the wetland’s salinity from that estimated at the time of pre-European settlement
Soils 8. The amount and severity of wetland soil disturbance from human, feral animals or stock activities
The wetland soils have no or very little disturbance
Biota (vegetation)
9. The diversity, health and weediness of the native wetland vegetation
The wetland vegetation is healthy with all the expected life forms present and a lack of weeds
The six sub-indicies used in the Index of Wetland Condition

9
Wetlands assessedThe 2009/10 statewide assessment of the condition of Victoria’s wetlands covered 587 high value wetlands, of which 71% were on public land and 29% on private land (Figure below). Most of the wetlands on public land are in small Crown land reserves surrounded by private land. High value wetlands in the marine or estuarine environment were not assessed, as the IWC is not designed for wetlands with a marine water source. For high value wetland systems that include many individual wetlands, assessments were undertaken at a representative set of wetlands within the system, rather than at every wetland.
Assessments involved an on-site visit to score wetland condition. These assessments were undertaken in spring and summer of 2009/10. There was much interest in the effect of 13 years of drought on the condition of Victoria’s high value wetlands. Fortunately, there had been sufficient rainfall in many parts of Victoria in the winter of 2009 for many wetlands to hold water for the first time in several years. However, those that were dry were still able to be assessed, as the IWC is designed to assess wetlands whether they are wet or dry.
The statewide assessment was undertaken as a partnership between DSE and CMAs, across Victoria with support provided by a range of consultants. Assessments also relied upon the cooperation and support of public land managers and private landholders.
IWC assessment sites for high value wetlands

10
Overall resultsThe assessment found that 24% of the high value wetlands assessed were in excellent condition, 32% in good condition, 30% in moderate condition, 13% were in poor condition and 1% in very poor condition. Overall, a higher proportion (65%) of wetlands on public land were in good or excellent condition than on private land (39%) (Figure below). The overall condition results can be used to identify wetlands where threatening processes are impacting on condition.
High value wetlands on floodplains ranged from poor to excellent condition. There were proportionally more floodplain wetlands in excellent condition than non floodplain wetlands
Although it might be expected that the condition of river reaches and the associated wetlands would be similar, this was not necessarily the case. There is not a consistent relationship between the 2004 ISC results and the IWC results for floodplain wetlands associated with ISC reaches. The condition of wetlands on floodplains may be affected by factors other than stream condition. For example, where the hydrology of the river or stream is in poor condition, due perhaps to regulation, this will generally impact on the
0
20
40
60
80
100
120
140
160
Very poor Poor Moderate Good Excel lent
Condition category
Nu
mb
er o
f w
etla
nd
s
0
20
40
60
80
100
120
140
160
Very poor Poor Moderate Good Excellent
Condition category
Nu
mb
er o
f w
etla
nd
s
Floodplain
Non floodplain
Private land
Public land
0
20
40
60
80
100
120
140
160
Very poor Poor Moderate Good Excel lent
Condition category
Nu
mb
er o
f w
etla
nd
s
0
20
40
60
80
100
120
140
160
Very poor Poor Moderate Good Excellent
Condition category
Nu
mb
er o
f w
etla
nd
s
Floodplain
Non floodplain
Private land
Public land
Condition of wetlands on public and private land. Condition of floodplain and non-floodplain wetlands

11
Condition of high value wetlands for each sub-index of the IWC (% of wetlands in each category).
Very poor Poor Moderate Good Excellent
Wetland catchment 27 15 9 10 39
Physical Form 1 1 4 8 86
Hydrology* 33 - 13 - 53
Water Properties 1 2 12 47 38
Soils 5 5 9 14 67
Biota 24 23 23 16 14
IWC overall 1 13 30 32 24
* Hydrology is only rated in three categories
0
20
40
60
80
100
120
140
160
Very poor Poor Moderate Good Excel lent
Condition category
Nu
mb
er o
f w
etla
nd
s
0
20
40
60
80
100
120
140
160
Very poor Poor Moderate Good Excellent
Condition category
Nu
mb
er o
f w
etla
nd
s
Floodplain
Non floodplain
Private land
Public land
hydrology of the associated wetland which derives its water from overbank flooding. However, the water regime of a stream may be in good condition, but the hydrological connectivity to the wetland may be impaired, meaning that the wetland will score poorly for hydrology. A stream may score well for water quality, but the floodplain wetland which receives high quality water from the stream may be heavily grazed by livestock, contributing to poor water quality in the wetland.
Subindex results The results for the different subindices of the IWC (Table below) give an idea of the condition of each of the key wetland components and indicate where there is a threat to a particular aspect of wetland function. They show how different wetland components contribute to the overall condition score. For example, the hydrology of a wetland may be in poor condition, but the physical form and soils
can still be in good condition. Half the wetlands assessed had good or excellent scores for wetland catchment. However, for almost a third (27%), the wetland catchment was in very poor condition reflecting the fact that many wetlands in rural landscapes are surrounded by cleared land with little or no protective buffer of native vegetation. The vast majority of wetlands (86%) had largely unaltered physical form. Two thirds of wetlands had moderate to excellent hydrology, but one third received a very poor score. The principal reason for wetlands scoring poorly for hydrology was the regulation of their water source, largely river regulation.
The water properties sub-index measures changes in salinity and activities that contribute to an input of nutrients. Water properties scores for most wetlands (85%) were good or excellent. A change to the original salinity of the wetland was found in relatively few wetlands (10%).

12
However, 50% of wetlands were considered at low to moderate risk of nutrient enrichment from activities such as discharge of nutrient rich water to the wetland, runoff of nutrients from nearby land, grazing of livestock or feral animals in the wetland or presence of aquaculture. Nine percent were considered at high risk. Of these, 81% were on private land or part private and public land. The remaining 19% of wetlands on public land were all subject to grazing.
Soils in about 80% of wetlands were relatively undisturbed. Thirty per cent of the wetlands assessed had excellent or good results for native vegetation but 70% had vegetation in a moderate to very poor condition. Vegetation quality can be affected by several factors such as changes to the water regime, grazing by livestock, cropping and invasion by weeds. The drought is likely to have contributed to poor vegetation condition.
While many wetlands scored poorly in one sub-index, very few wetlands had poor scores across all the sub-indices. The combination and weighting of wetland sub-index scores resulted in only 14% of wetlands falling into the very poor or poor categories for overall condition.
Condition of Ramsar sitesThe statewide assessment covered wetlands in eight of Victoria’s 11 Ramsar sites. For the Ramsar sites of Gunbower Forest and Barmah Forest, assessments were made at several representative plots within the wetland. Marine or tidal wetlands were not assessed, therefore there is no data for Corner Inlet, Port Phillip (Western Shoreline) and Bellarine Peninsula and Western Port Ramsar Sites and part of the Gippsland Lakes Ramsar Site.
Wetlands in Ramsar sites were generally in good to moderate condition. The results for individual Ramsar sites are summarised in Appendix 1.
Victoria is working with the Australian Government to prepare ecological character descriptions (ECDs) for Ramsar sites. The ECDs are designed to provide detailed descriptions of the critical values, ecological components and processes that characterised the Ramsar site at the time it was listed as a wetland of international importance for its environmental values. It should be noted that wetlands in Ramsar sites were not necessarily in excellent condition at the time of listing. The sites were listed on the basis of the values that existed at the time. In some cases the condition of wetland components that supported these values had already changed from the reference (natural) state. For example, the Kerang Wetlands Ramsar site supported high waterbird values when it was listed in 1982, despite the fact that the hydrology of some of the wetlands had been artificially altered long before listing. This is reflected in very poor IWC scores for the hydrology subindex for several of the wetlands in the Ramsar site.
The IWC assessment provides results about the overall condition of the main components of wetland function to support risk assessment and prioritisation of management actions. The ECDs will provide much more detailed quantitative information which assists in monitoring the ecological character of Ramsar sites and identifying if it has changed since listing. More information about Ramsar sites and ecological character descriptions can be found on the DSE and Australian Government Department of Sustainability, Environment, Water, Population and Communities websites (http://www.environment.gov.au/water/topics/wetlands/ramsar-convention/implementation-of-framework.html).

13
How will the information on condition be used?The information from the assessment of Victoria’s high value wetlands will be used for several purposes. It provides the first systematic overview of the condition of Victoria’s high value wetlands which assists DSE in identifying issues of concern and formulating policy responses. It will also be used in a risk assessment of high value wetlands that will form the basis for prioritisation of wetlands for action in regional Strategies for Healthy Rivers and Wetlands, to be prepared by CMAs in 2013.
The community can use the data for public wetlands to increase their understanding of the condition of wetlands on public land. Data on private wetlands is not published for privacy reasons, but is used by the DSE and CMAs to prioritise wetlands to work with interested landholders to protect or improve condition. The CMA will notify private wetland owners of the IWC results for their wetland.
14
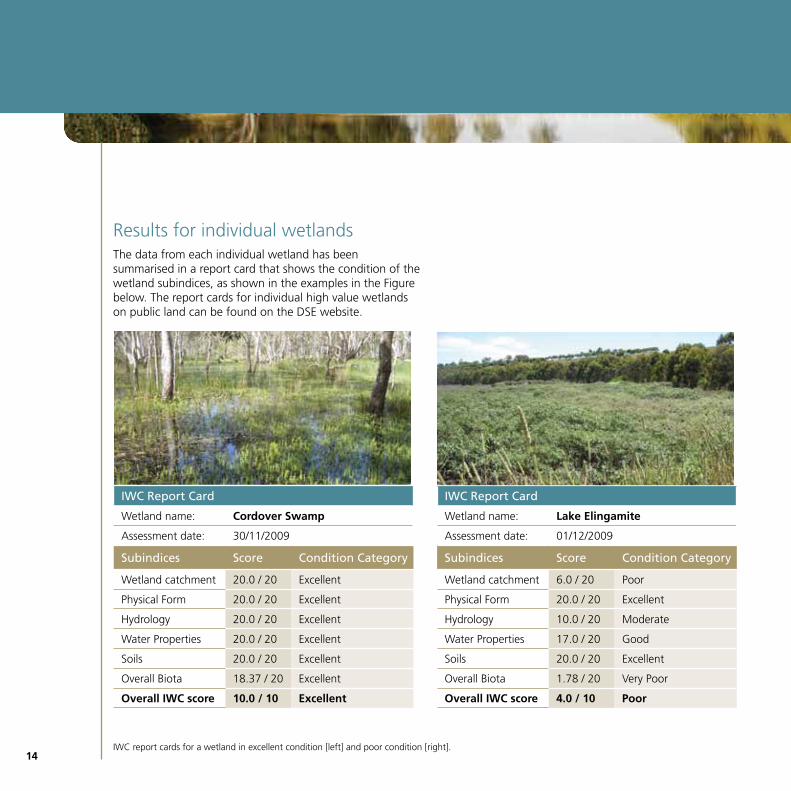
Results for individual wetlandsThe data from each individual wetland has been summarised in a report card that shows the condition of the wetland subindices, as shown in the examples in the Figure below. The report cards for individual high value wetlands on public land can be found on the DSE website.
IWC Report Card
Wetland name: Cordover Swamp
Assessment date: 30/11/2009
Subindices Score Condition Category
Wetland catchment 20.0 / 20 Excellent
Physical Form 20.0 / 20 Excellent
Hydrology 20.0 / 20 Excellent
Water Properties 20.0 / 20 Excellent
Soils 20.0 / 20 Excellent
Overall Biota 18.37 / 20 Excellent
Overall IWC score 10.0 / 10 Excellent
IWC Report Card
Wetland name: Lake Elingamite
Assessment date: 01/12/2009
Subindices Score Condition Category
Wetland catchment 6.0 / 20 Poor
Physical Form 20.0 / 20 Excellent
Hydrology 10.0 / 20 Moderate
Water Properties 17.0 / 20 Good
Soils 20.0 / 20 Excellent
Overall Biota 1.78 / 20 Very Poor
Overall IWC score 4.0 / 10 Poor
IWC report cards for a wetland in excellent condition [left] and poor condition [right].

15
What about Victoria’s other wetlands?It is not possible to undertake IWC assessments for all 13,000 wetlands in Victoria. In 2011/12, the IWC method was used to assess a representative set of the other 12,400 wetlands which were not assessed in 2009/10. The data will be used to provide a benchmark for monitoring long-term trends in wetland condition through regular assessments at eight year intervals.
Further informationThe results for individual high value wetlands can be found on the DSE website.

16
Ramsar siteNumber of assessments Condition report Comments
Barmah Forest 30 representative plots
The overall condition of the Ramsar site was good. Eighty percent of the plots assessed within the site were in good condition and the remainder were in moderate condition. Hydrology was in moderate condition for 80% of plots and very poor condition for the remainder. The vegetation was in moderate condition in two thirds of plots. The remainder of plots included examples of both excellent and very poor vegetation condition. The wetland catchment was in good condition and the physical form, water properties, the soil were in excellent condition.
The scores for these wetlands on the Murray River reflect the long term changes in hydrology as a result of river regulation, which means wetlands generally flood less often than would have been the case under natural conditions. This factor, compounded by the long dry period from 1996 to 2009, has impacted on much of the wetland vegetation in these sites.
Management for these Ramsar sites focuses on improving the water regime through a combination of environmental watering and works to deliver this water efficiently. Other threats such as invasive species are also addressed.
The other wetland components were generally in excellent condition due to the reservation of these wetlands and their local catchments in public parks and forests.
Gunbower Forest
24 representative plots
The overall condition of the Ramsar site was good. Over half the plots assessed within the site were in good condition, 30% were in moderate condition and just over 10% were in excellent condition. Hydrology was generally in moderate condition. The vegetation was in poor or very poor condition in two thirds of plots. In the remainder it was in moderate to excellent condition. The wetland catchment, physical form, water properties, the soil were in excellent condition.
Hattah-Kulkyne Lakes
All 12 wetlands assessed
Two thirds of the wetlands were in good condition and the remainder were in moderate condition. The physical form, water properties and soils were in excellent condition, while the wetland catchment was in good condition for most of the wetlands. Hydrology was in very poor condition for all but one of the wetlands. Vegetation condition was highly variable and ranged from excellent to poor. Nine of the 12 wetlands had moderate or poor vegetation condition.
Appendix 1: The condition of wetlands assessed using the IWC in Ramsar sites

17
Ramsar siteNumber of assessments Condition report Comments
Lake Albacutya A single assessment covered the whole wetland.
The Ramsar site was in moderate condition overall. The wetland catchment was in moderate condition. While the vegetation and hydrology were in very poor condition, the soils, water properties and physical form were in excellent condition.
As with Ramsar sites along the Murray, the very poor hydrology and vegetation scores reflect reduced flooding frequency due to river regulation, extraction for consumptive purposes and the long period of drought. The other components are in excellent condition as they are unaltered from their natural state and protected in the regional park from disturbance.
The focus in managing Lake Albacutya is improving the water regime. The Wimmera-Mallee Pipeline has resulted in a larger environmental water entitlement for the Wimmera River system. However, the predictions for reduced inflows under climate change mean that it may not be possible to improve the hydrological condition of Lake Albacutya if predicted conditions are realised.

18
Ramsar siteNumber of assessments Condition report Comments
Kerang Wetlands Eighteen of the 23 wetlands in the site were assessed
Sixteen wetlands were in moderate condition and two were in poor condition. The physical form and soils were in excellent condition for nearly all the wetlands, while water properties were in good condition for most wetlands. Hydrology was in moderate condition for five wetlands and very poor for the remainder. The condition of the wetland catchment was in good condition for only three wetlands and in moderate to very poor condition for the rest. Vegetation ranged from medium condition in three wetlands to poor in nine wetlands and very poor in six wetlands.
The moderate to poor condition of some of the wetlands in the Ramsar site reflect the changes to the natural water regime as many are now part of the Torrumbarry Irrigation System with artificially managed water regimes. For those wetlands in the Ramsar site where hydrology is not managed, the drought has had a significant impact on the wetland vegetation. The poor condition of the immediate catchment is due to clearing and agricultural use, and in some cases, urban development adjacent to the wetlands.
Management in the Kerang Wetlands Ramsar site focuses on optimising the water regime to continue to support the Ramsar values, using environmental flows where necessary. There is also a focus on pest plant and animal control.
Western District Lakes
All nine wetlands were assessed
One wetland was in excellent condition, five were in good condition and three were in moderate condition. Physical form, water properties and soils were generally in good condition. The wetland catchment was in poor condition for most of the wetlands. Hydrology was in excellent condition for most of the wetlands, but was in moderate condition for two wetlands and in very poor condition for one wetland. The condition of the vegetation was in excellent or good condition in three wetlands, in moderate condition in four wetlands and in very poor condition in two wetlands.
As with the Kerang Wetlands, the lakes in the Ramsar site are reserved on public land but surrounded by private land used for agriculture which is reflected in the poor condition for the wetland catchment. A long-running project has focused on revegetating the wetland fringing zone and key areas in the catchment.

19
Ramsar siteNumber of assessments Condition report Comments
Gippsland Lakes Eight of the fringing wetlands in the Ramsar site were assessed.
Five wetlands were in good condition and three were in moderate condition. The physical form was excellent for all wetlands and the soils were in good condition for most wetlands. There was a range in condition in the other subindices across the wetlands.
As the fringing wetlands of the Gippsland Lakes Ramsar site are in conservation reserves, there is no disturbance to the soil from livestock grazing. The original wetland form has not been altered. There have been some changes in hydrology in wetlands fed by the Thomson and Latrobe rivers as the Thomson is regulated and water extracted for Melbourne’s water supply. With regulation and reduced flows during the drought, salinity levels are higher in the wetlands fringing Lake Wellington and there have been changes to the vegetation. The management focus for the fringing wetlands is on improving the water regime by enhancing freshwater flows through environmental water allocations, minimising the risk of saline intrusion and controlling pest plants and animals.
Edithvale-Seaford Wetlands
Only one of the wetland basins in the Ramsar site was assessed: the Edithvale North Wetland Basin EN3a.
The Edithvale North Wetland Basin EN3a was in moderate condition overall. The wetland catchment and physical form were in very poor condition. The hydrology was also in very poor condition. The vegetation was in good condition and the water properties were in moderate condition.
The poor condition of the hydrology reflects the significant long term water regime changes associated with urbanisation. However the vegetation has adapted to these changes and was in good condition. The management focuses on restoring and maintaining the wetland values through active management.

www.dse.vic.gov.au