Embed Size (px)
Citation preview
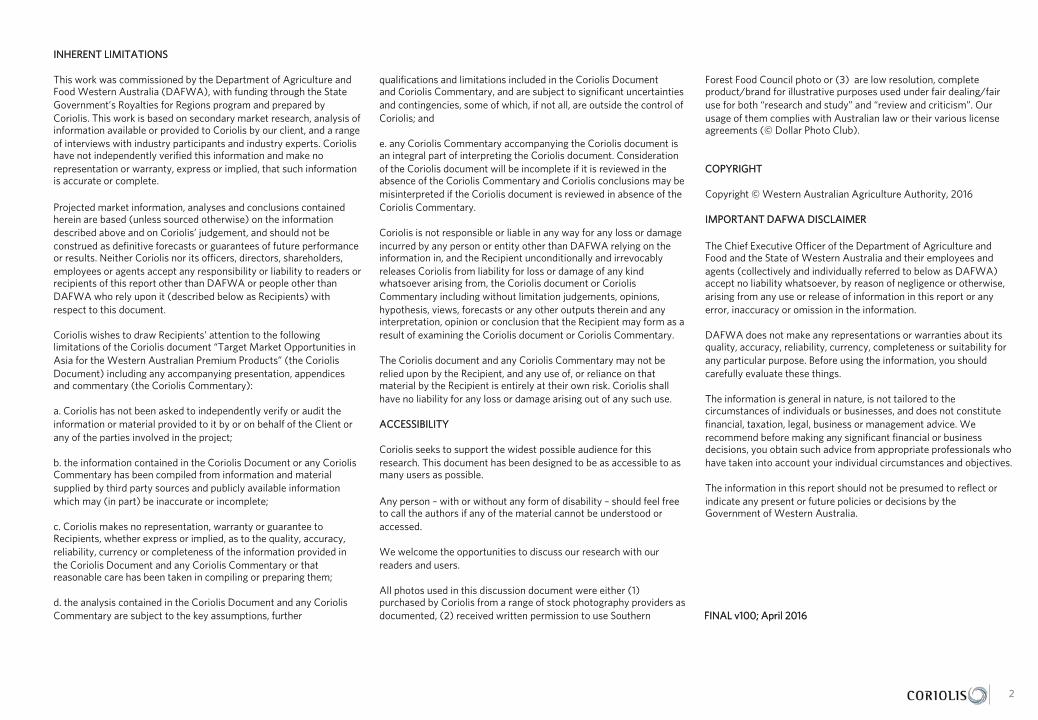
TARGET MARKET OPPORTUNITIES IN ASIA FOR ANIMAL PELLETS Part of Asia Market Success, April 2016
IN-PROGRESS REVIEW DRAFT Pre-release copy of significant commercial value to industry Document contains incomplete & in-progress research for comment For named reviewer/firm only; do not duplicate or distribute
RECIPIENT
FIRM
IINNHHEERREENNTT LLIIMMIITTAATTIIOONNSS This work was commissioned by the Department of Agriculture and Food Western Australia (DAFWA), with funding through the State Government’s Royalties for Regions program and prepared by Coriolis. This work is based on secondary market research, analysis of information available or provided to Coriolis by our client, and a range of interviews with industry participants and industry experts. Coriolis have not independently verified this information and make no representation or warranty, express or implied, that such information is accurate or complete. Projected market information, analyses and conclusions contained herein are based (unless sourced otherwise) on the information described above and on Coriolis’ judgement, and should not be construed as definitive forecasts or guarantees of future performance or results. Neither Coriolis nor its officers, directors, shareholders, employees or agents accept any responsibility or liability to readers or recipients of this report other than DAFWA or people other than DAFWA who rely upon it (described below as Recipients) with respect to this document. Coriolis wishes to draw Recipients’ attention to the following limitations of the Coriolis document “Target Market Opportunities in Asia for the Western Australian Premium Products” (the Coriolis Document) including any accompanying presentation, appendices and commentary (the Coriolis Commentary): a. Coriolis has not been asked to independently verify or audit the information or material provided to it by or on behalf of the Client or any of the parties involved in the project; b. the information contained in the Coriolis Document or any Coriolis Commentary has been compiled from information and material supplied by third party sources and publicly available information which may (in part) be inaccurate or incomplete; c. Coriolis makes no representation, warranty or guarantee to Recipients, whether express or implied, as to the quality, accuracy, reliability, currency or completeness of the information provided in the Coriolis Document and any Coriolis Commentary or that reasonable care has been taken in compiling or preparing them; d. the analysis contained in the Coriolis Document and any Coriolis Commentary are subject to the key assumptions, further
qualifications and limitations included in the Coriolis Document and Coriolis Commentary, and are subject to significant uncertainties and contingencies, some of which, if not all, are outside the control of Coriolis; and e. any Coriolis Commentary accompanying the Coriolis document is an integral part of interpreting the Coriolis document. Consideration of the Coriolis document will be incomplete if it is reviewed in the absence of the Coriolis Commentary and Coriolis conclusions may be misinterpreted if the Coriolis document is reviewed in absence of the Coriolis Commentary. Coriolis is not responsible or liable in any way for any loss or damage incurred by any person or entity other than DAFWA relying on the information in, and the Recipient unconditionally and irrevocably releases Coriolis from liability for loss or damage of any kind whatsoever arising from, the Coriolis document or Coriolis Commentary including without limitation judgements, opinions, hypothesis, views, forecasts or any other outputs therein and any interpretation, opinion or conclusion that the Recipient may form as a result of examining the Coriolis document or Coriolis Commentary. The Coriolis document and any Coriolis Commentary may not be relied upon by the Recipient, and any use of, or reliance on that material by the Recipient is entirely at their own risk. Coriolis shall have no liability for any loss or damage arising out of any such use. AACCCCEESSSSIIBBIILLIITTYY Coriolis seeks to support the widest possible audience for this research. This document has been designed to be as accessible to as many users as possible. Any person – with or without any form of disability – should feel free to call the authors if any of the material cannot be understood or accessed. We welcome the opportunities to discuss our research with our readers and users. All photos used in this discussion document were either (1) purchased by Coriolis from a range of stock photography providers as documented, (2) received written permission to use Southern
Forest Food Council photo or (3) are low resolution, complete product/brand for illustrative purposes used under fair dealing/fair use for both “research and study” and “review and criticism”. Our usage of them complies with Australian law or their various license agreements (© Dollar Photo Club). CCOOPPYYRRIIGGHHTT Copyright © Western Australian Agriculture Authority, 2016 IIMMPPOORRTTAANNTT DDAAFFWWAA DDIISSCCLLAAIIMMEERR The Chief Executive Officer of the Department of Agriculture and Food and the State of Western Australia and their employees and agents (collectively and individually referred to below as DAFWA) accept no liability whatsoever, by reason of negligence or otherwise, arising from any use or release of information in this report or any error, inaccuracy or omission in the information. DAFWA does not make any representations or warranties about its quality, accuracy, reliability, currency, completeness or suitability for any particular purpose. Before using the information, you should carefully evaluate these things. The information is general in nature, is not tailored to the circumstances of individuals or businesses, and does not constitute financial, taxation, legal, business or management advice. We recommend before making any significant financial or business decisions, you obtain such advice from appropriate professionals who have taken into account your individual circumstances and objectives. The information in this report should not be presumed to reflect or indicate any present or future policies or decisions by the Government of Western Australia.
2
FFIINNAALL vv110000;; AApprriill 22001166
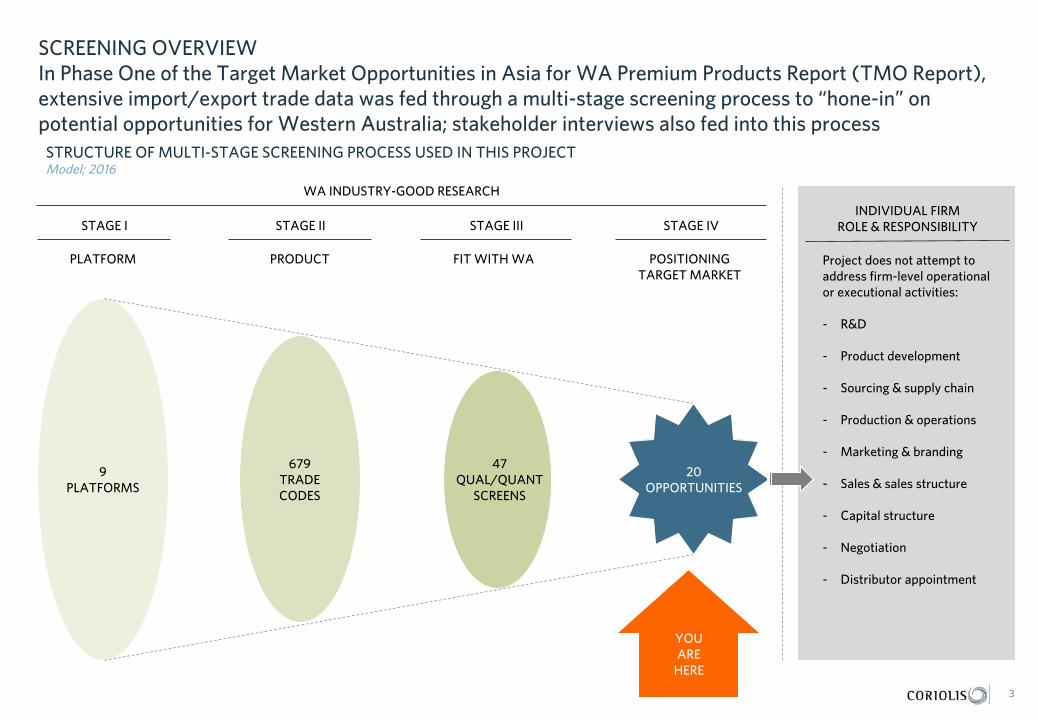
SCREENING OVERVIEW In Phase One of the Target Market Opportunities in Asia for WA Premium Products Report (TMO Report), extensive import/export trade data was fed through a multi-stage screening process to “hone-in” on potential opportunities for Western Australia; stakeholder interviews also fed into this process
3
STRUCTURE OF MULTI-STAGE SCREENING PROCESS USED IN THIS PROJECT Model; 2016
INDIVIDUAL FIRM ROLE & RESPONSIBILITY STAGE I STAGE II STAGE III STAGE IV
PLATFORM PRODUCT POSITIONING TARGET MARKET
FIT WITH WA
WA INDUSTRY-GOOD RESEARCH
9 PLATFORMS
679 TRADE CODES
47 QUAL/QUANT
SCREENS
Project does not attempt to address firm-level operational or executional activities: - R&D
- Product development
- Sourcing & supply chain
- Production & operations
- Marketing & branding
- Sales & sales structure
- Capital structure
- Negotiation
- Distributor appointment
20 OPPORTUNITIES
YOU ARE
HERE
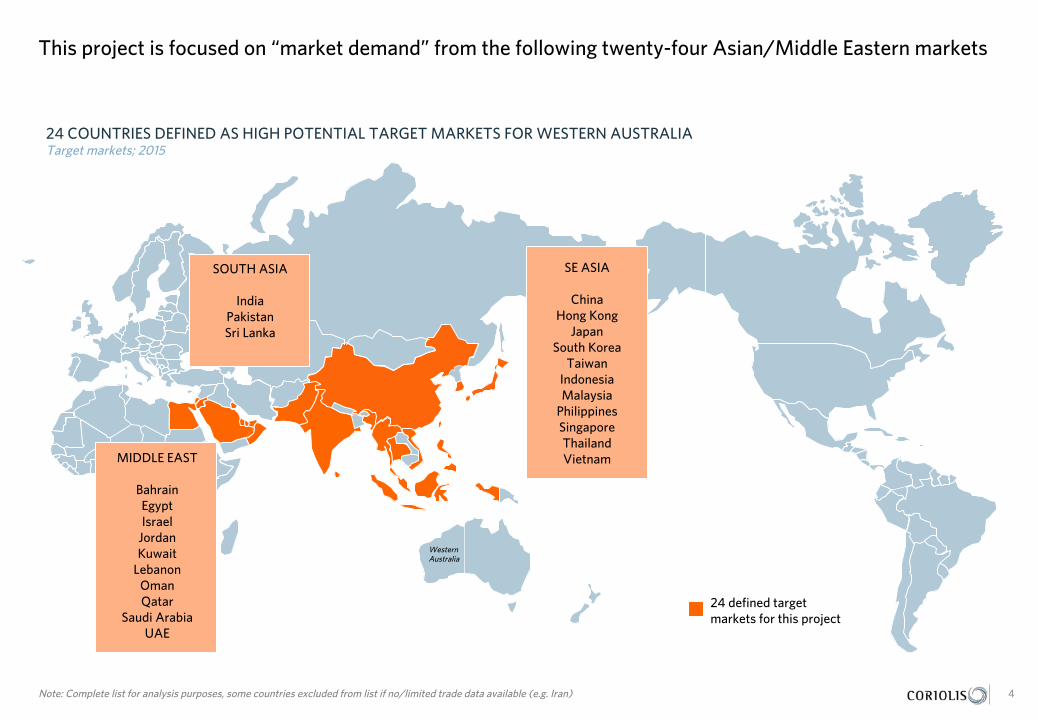
4 This project is focused on “market demand” from the following twenty-four Asian/Middle Eastern markets
Note: Complete list for analysis purposes, some countries excluded from list if no/limited trade data available (e.g. Iran)
24 COUNTRIES DEFINED AS HIGH POTENTIAL TARGET MARKETS FOR WESTERN AUSTRALIA Target markets; 2015
MIDDLE EAST
Bahrain Egypt Israel
Jordan Kuwait
Lebanon Oman Qatar
Saudi Arabia UAE
24 defined target markets for this project
4
SOUTH ASIA
India Pakistan Sri Lanka
Western Australia
SE ASIA
China Hong Kong
Japan South Korea
Taiwan Indonesia Malaysia
Philippines Singapore Thailand Vietnam

PRODUCT PROFILE
HS Codes 230110
Product Flour or meal, pellet of meat or offal for animal feed; for use in home (pet), recreational (horse), and intensive agriculture/aquaculture; product is defined a processed mixture of ingredients
Out-of-scope Raw material/ingredient grains and meats, compressed hay, other single ingredient feeds
Origin Emerged in early 20th century with growth of domestic animals and intensive agriculture; spread to intensive aquaculture in 1950’s+
Example ingredients
Processed grain by-products, grain products, plaint protein products, animal protein products, roughage products, animal fat (preserved with BHA), calcium carbonate, natural chicken flavouring, ascorbic acid, vitamin A supplement, vitamin D supplement, vitamin E supplement, vitamin B12 supplement, riboflavin supplement, niacin supplement, d-Calcium pantothenate, pyridoxine hydrochloride, folic acid, menadione dimethylpyrimidinol bisulfite (source of vitamin K activity), thiamine mononitrate, biotin, choline chloride, salt, manganous oxide, manganese sulfate, ferrous sulfate, copper chloride, copper sulfacte, zinc oxide, zinc sulfate, potassium chloride, iron oxide, ethylenediamine dihydroiodide, sodium selenite, zinc, amino acid complex, manganese amino acid complex, iron amino acid complex, mineral oil, and propionic acid (a preservative).
Forms/usage - Pellets
Drivers of consumer/market success
- Growing demand for protein in Asia driving growing demand for land and water animals produced under intensive production systems
- Growth of pet ownership in urban Asia
WHAT IS THE PRODUCT? Animal pellets emerged in Phase I as one of twenty “high growth, high potential” opportunities for Western Australia; animal pellets are pre-prepared, nutritionally complete food for animals (including aquaculture)
5 Source: photo credit (Dollar Photo); Coriolis analysis
PRODUCT OVERVIEW Example; 2016

DOCUMENT STRUCTURE
What is the global situation?
What is the strategic situation in the market?
In this environment, what is the opportunity for Western Australia?
Who are the potential in-market partners?
Who are the key firms in Western Australia capable of delivering?
6
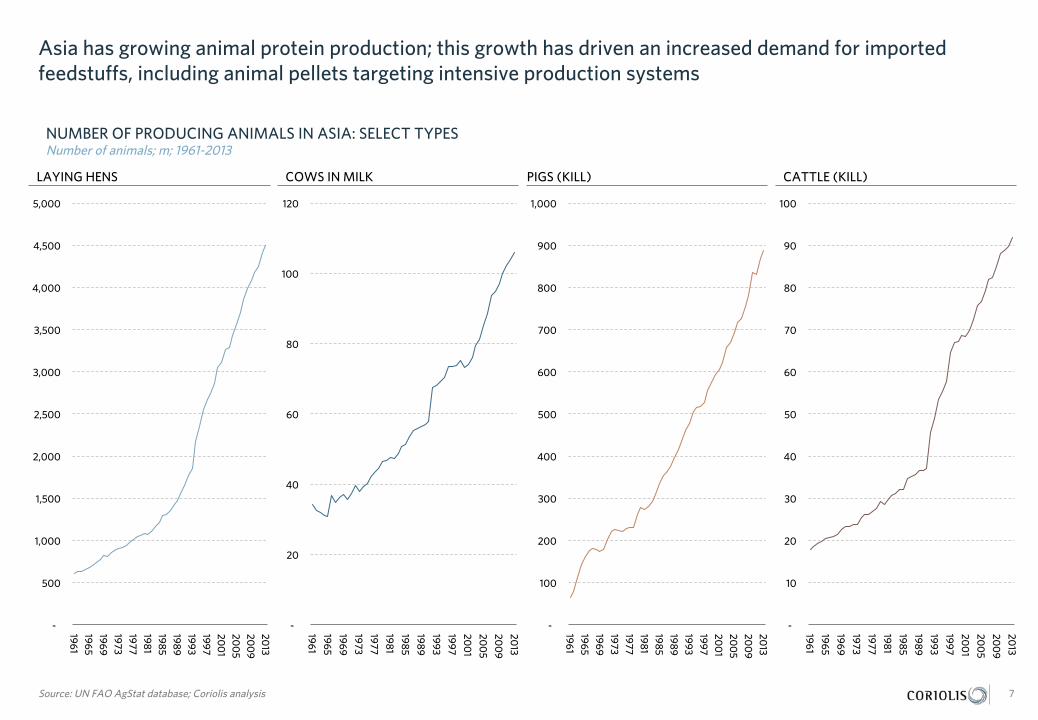
Asia has growing animal protein production; this growth has driven an increased demand for imported feedstuffs, including animal pellets targeting intensive production systems
7 Source: UN FAO AgStat database; Coriolis analysis
NUMBER OF PRODUCING ANIMALS IN ASIA: SELECT TYPES Number of animals; m; 1961-2013
-
500
1,000
1,500
2,000
2,500
3,000
3,500
4,000
4,500
5,000
1961 1965 1969 1973 1977 1981 1985 1989 1993 1997 20
01
200
5 20
09
2013
LAYING HENS
-
20
40
60
80
100
120
1961
1965
1969
1973
1977
1981
1985
1989
1993
1997
200
1
200
5
200
9
2013
COWS IN MILK
-
100
200
300
400
500
600
700
800
900
1,000
1961 1965 1969 1973 1977 1981 1985 1989 1993 1997 20
01
200
5 20
09
2013
PIGS (KILL)
-
10
20
30
40
50
60
70
80
90
100
1961
1965
1969
1973
1977
1981
1985
1989
1993
1997
200
1
200
5
200
9
2013
CATTLE (KILL)
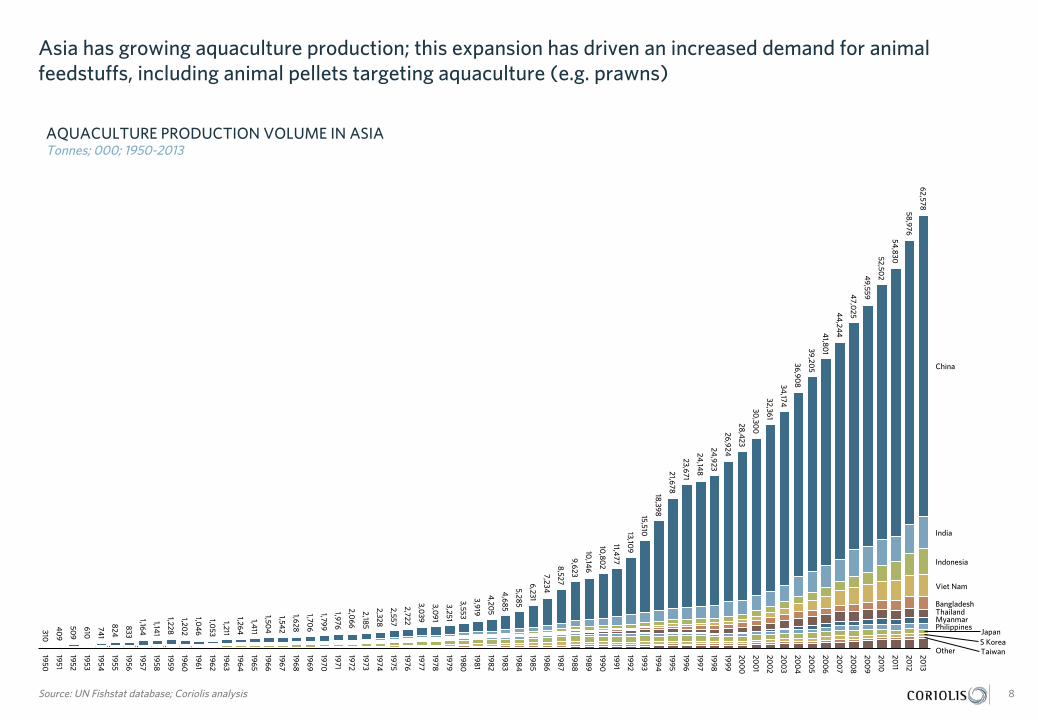
Asia has growing aquaculture production; this expansion has driven an increased demand for animal feedstuffs, including animal pellets targeting aquaculture (e.g. prawns)
8 Source: UN Fishstat database; Coriolis analysis
AQUACULTURE PRODUCTION VOLUME IN ASIA Tonnes; 000; 1950-2013
1993
India
Japan
200
1
1992
200
8
2011
200
7
1999
200
3
2010
1997
1998
Taiwan 200
4
1996
1994
200
6
200
2
200
9
200
5
1995
200
0
1991
1964
1965
1966
Bangladesh
1962
1963
Thailand
1970
1971
1972
1967
1968
1969
1952
1951
1956
1954
1953
1955
1950
1959
1960
1961
1957
China
1958
1973
1984
Other 1985
1982
1983
Myanmar
1986
1989
1990
S Korea
1987
1988
Philippines
Indonesia
1976
1977
1978
2013
1974
1975
2012
Viet Nam
1981
1979
1980
833
824
741
1,228
1,141
1,164
610
509
40
9
310
23,671
21,678 18,398
26,924
24,923
24,14
8
15,510
10,14
6
9,623
8,527
13,109
11,477
10,80
2
28,423
52,502
49,559
47,0
25
62,578 58,976 54,830
44
,244
34,174
32,361
30,30
0
41,80
1
39,205
36,908
1,706
1,628
1,542
2,066
1,976
1,799
1,504
1,053
1,04
6
1,202
1,411
1,264
1,211
2,185
4,685
4,20
5
3,919
7,234
6,231
5,285
3,553
2,722
2,557
2,328
3,251
3,091
3,039

DOCUMENT STRUCTURE
What is the global situation?
What is the strategic situation in the market?
In this environment, what is the opportunity for Western Australia?
Who are the potential in-market partners?
Who are the key firms in Western Australia capable of delivering?
9
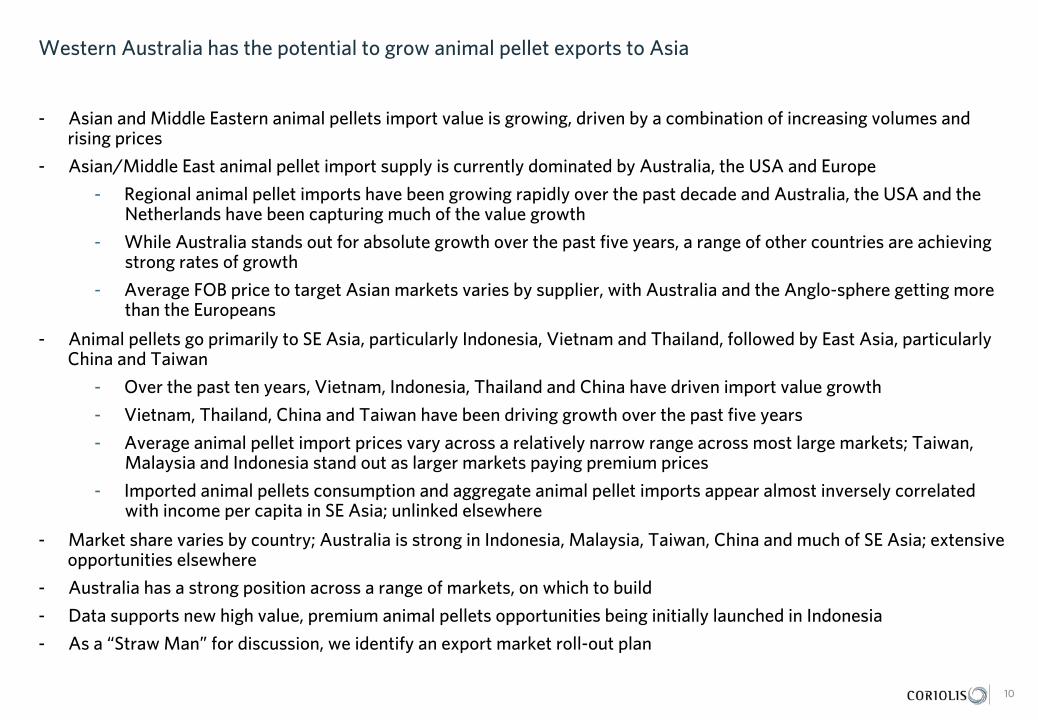
Western Australia has the potential to grow animal pellet exports to Asia
10
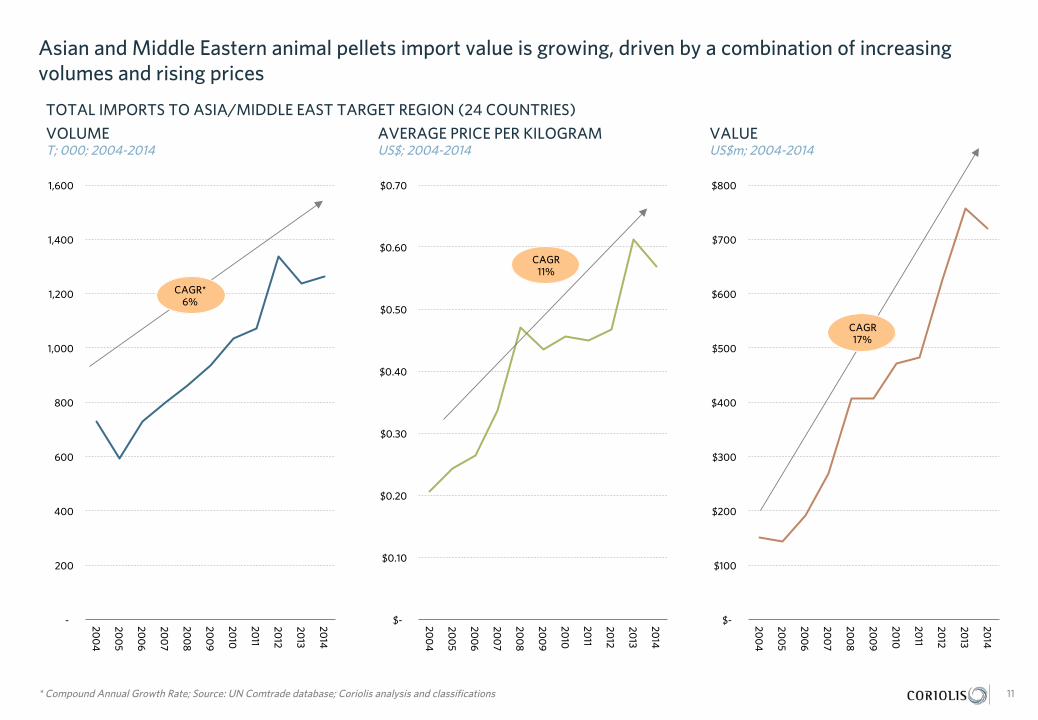
- Asian and Middle Eastern animal pellets import value is growing, driven by a combination of increasing volumes and rising prices
- Asian/Middle East animal pellet import supply is currently dominated by Australia, the USA and Europe
- Regional animal pellet imports have been growing rapidly over the past decade and Australia, the USA and the Netherlands have been capturing much of the value growth
- While Australia stands out for absolute growth over the past five years, a range of other countries are achieving strong rates of growth
- Average FOB price to target Asian markets varies by supplier, with Australia and the Anglo-sphere getting more than the Europeans
- Animal pellets go primarily to SE Asia, particularly Indonesia, Vietnam and Thailand, followed by East Asia, particularly China and Taiwan
- Over the past ten years, Vietnam, Indonesia, Thailand and China have driven import value growth
- Vietnam, Thailand, China and Taiwan have been driving growth over the past five years
- Average animal pellet import prices vary across a relatively narrow range across most large markets; Taiwan, Malaysia and Indonesia stand out as larger markets paying premium prices
- Imported animal pellets consumption and aggregate animal pellet imports appear almost inversely correlated with income per capita in SE Asia; unlinked elsewhere
- Market share varies by country; Australia is strong in Indonesia, Malaysia, Taiwan, China and much of SE Asia; extensive opportunities elsewhere
- Australia has a strong position across a range of markets, on which to build
- Data supports new high value, premium animal pellets opportunities being initially launched in Indonesia
- As a “Straw Man” for discussion, we identify an export market roll-out plan
-
200
400
600
800
1,000
1,200
1,400
1,600
200
4
200
5
200
6
200
7
200
8
200
9
2010
2011
2012
2013
2014
$-
$100
$200
$300
$400
$500
$600
$700
$800
200
4
200
5
200
6
200
7
200
8
200
9
2010
2011
2012
2013
2014
Asian and Middle Eastern animal pellets import value is growing, driven by a combination of increasing volumes and rising prices
11 * Compound Annual Growth Rate; Source: UN Comtrade database; Coriolis analysis and classifications
VOLUME T; 000; 2004-2014
$-
$0.10
$0.20
$0.30
$0.40
$0.50
$0.60
$0.70
200
4
200
5
200
6
200
7
200
8
200
9
2010
2011
2012
2013
2014
AVERAGE PRICE PER KILOGRAM US$; 2004-2014
VALUE US$m; 2004-2014
CAGR* 6%
CAGR 11%
CAGR 17%
TOTAL IMPORTS TO ASIA/MIDDLE EAST TARGET REGION (24 COUNTRIES)

Asian/Middle East animal pellet import supply is currently dominated by Australia, the USA and Europe
12 NA/ME/CA = North Africa/Middle East/Central Asia; Note: data is as reported by sender (FOB), not receiver; Source: UN Comtrade database; Coriolis analysis and classifications
EXPORT VALUE BY SUPPLIER TO TARGET REGION US$m; FOB; 2014
India
Other
Americas Australasia Europe
$184
Poland $20
$251
$13
United Kingdom $38
Canada $33
$23
USA $99
$249
Netherlands $70
Italy $15
Other Europe $4
Australia $195
Denmark $8
New Zealand $56 Spain
$12
France $13
Germany $53 Other
$13
India $23
Other Americas $15
Brazil $20
Belgium $16
Uruguay $17
TOTAL = US$720m

Regional animal pellet imports have been growing rapidly over the past decade and Australia, the USA and the Netherlands have been capturing much of the value growth
13 Note: data is as reported by sender (FOB), not receiver; Source: UN Comtrade database; Coriolis analysis and classifications
EXPORT VALUE BY SUPPLIER TO TARGET REGION US$m; FOB; 2004-2014
Spain
Italy
Uruguay
Denmark
USA
Other
France
Australia
New Zealand
Germany
10y ABS
Canada
Other Americas
Other Europe
India
2010 2008 2011 2013
United Kingdom
Belgium
Netherlands
2009 2014 2005 2012 2004
Poland
2007
Brazil
2006
$1
$14
$16
$195
$125
$4
$15
$190
$1 $1
$158
$98
$9
$18
$75
$2
$99
$9
$49
$10
$15
$23
$56
$6
$43
$1
$11
$5
$10
$49
$20
$29
$8
$86 $34
$35
$30
$20
$40
$20
$108
$10
$34
$11
+$20
+$38
+$44
+$16
+$12 +$12 +$14
+$32
+$83
+$21
+$19
+$70
+$4 +$9
+$7
$471
$407 $406
$482
$720
$758
$626
+$23
+$12 +$2
$151
$269
$192
$144
+$130
$125
$3
$16
$13
$94
$13
$77
$5
$136
$2
$54
$3
$109
$5
$0
$65
$0
$18
$7
$23
$52
$22
$0
$67
$0
$54
$0
$55
$0
$46
$22
$9
$16
$69
$15
$0
$18
$2
$9
$5
$6
$70
$14
$16 $19
$20
$6
$30
$6
$0
$9
$18
$7
$0
$20
$0
$43
$4
$6
$2
$35
$6 $0
$36
$53
$19
$0
$1
$0
$13
$51
$45
$58 $40
$62
$33
$67
$28
$39
$2
$25
$11 $1
$1
$38
$0
$11
$7
$3
$3
$15
$1
$0
$9
$1
$9
$8
$10
$2
$1
$2
$10
$18
$5
$3
$2
$4
$1
$3
$11
$2
$11
$1
$59
$2
$0
$4
$56
$1 $1
$1
$8
$0
$1
$3
$56
$3 $0 $0
$0
$15
$5
$4
$17
$1
$18
$13
$7
$14
$13
$1
$4 $2
$3
$18
$2
$13
$6
$18
$4
$7 $15
$22
$16
$17
$1
$15
$15
$12
CAGR 17%

While Australia stands out for absolute growth over the past five years, a range of other countries are achieving strong rates of growth
14 Note: data is as reported by sender (FOB), not receiver; Source: UN Comtrade database; Coriolis analysis and classifications
FIVE YEAR EXPORT GROWTH MATRIX: CHANGE IN VALUE VS. RATE OF GROWTH VS. ABSOLUTE VALUE US$m; 2009 vs. 2014
$20 $-10 $70
60%
100%
$50 $40 $30 $60
80%
$-20 $10 -20%
0%
20%
$0
40%
$90 $80
$20m
Poland
USA
Netherlands
Belgium
Germany
New Zealand
Australia
Uruguay
United Kingdom
Canada
Other Americas
Brazil
India
Other Other Europe
France
Italy
Denmark
Spain
5y absolute change in value
5y CAGR
Bubble scale: US$m; 2014 A bubble this size=
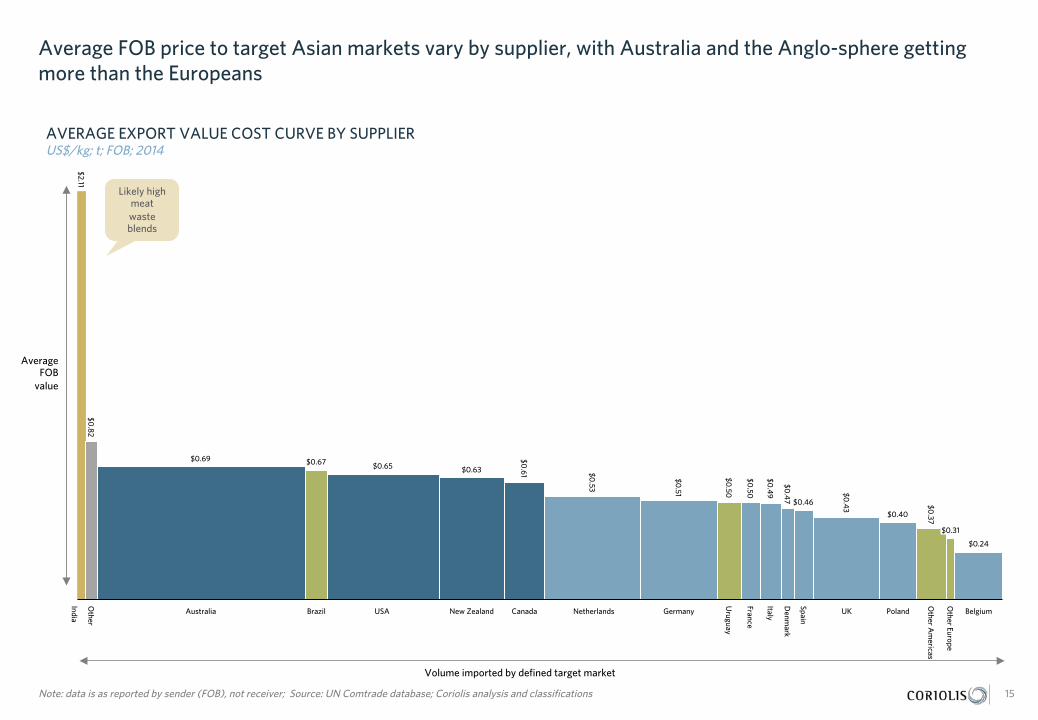
Average FOB price to target Asian markets vary by supplier, with Australia and the Anglo-sphere getting more than the Europeans
15 Note: data is as reported by sender (FOB), not receiver; Source: UN Comtrade database; Coriolis analysis and classifications
AVERAGE EXPORT VALUE COST CURVE BY SUPPLIER US$/kg; t; FOB; 2014
Uruguay
India
Germany Netherlands Canada USA Australia New Zealand
Italy
Other Europe
Poland
Spain
Belgium
Denm
ark
Other A
mericas
UK
Other
France
Brazil
$0.63
$0.46
$0.4
9
$0.50
$0.82
$0.24
$0.40
$0.31
$0.69 $0.65
$0.61
$0.53
$0.67
$0.51
$0.4
7
$0.4
3
$0.37
$2.11
$0.50
Average FOB
value
Volume imported by defined target market
Likely high meat waste blends
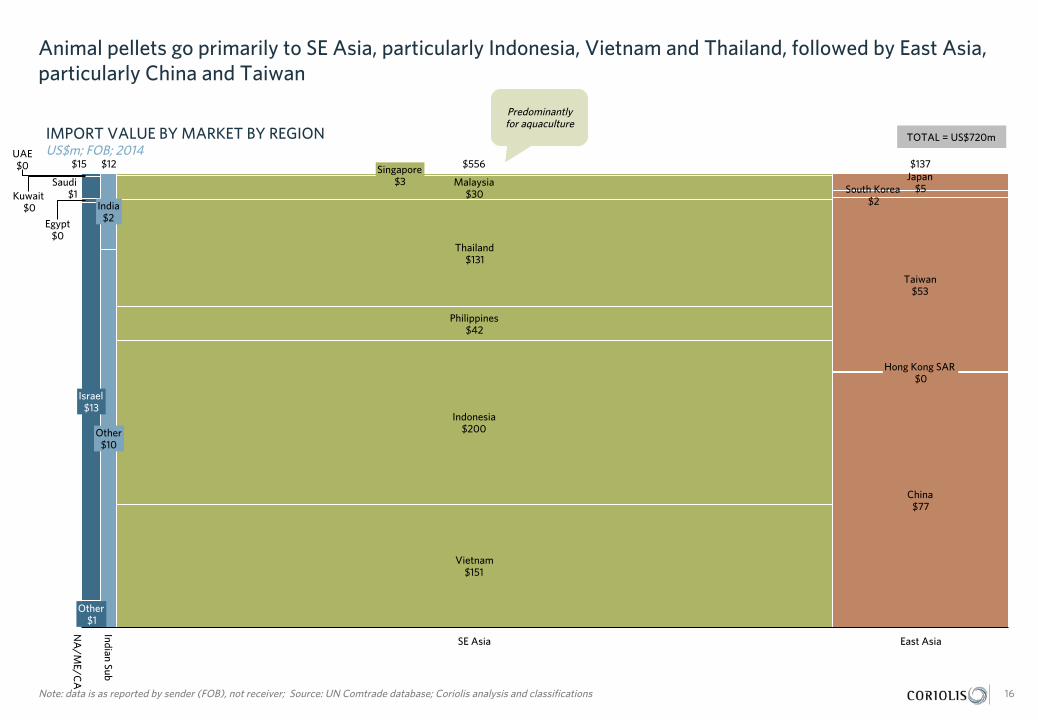
Animal pellets go primarily to SE Asia, particularly Indonesia, Vietnam and Thailand, followed by East Asia, particularly China and Taiwan
16 Note: data is as reported by sender (FOB), not receiver; Source: UN Comtrade database; Coriolis analysis and classifications
IMPORT VALUE BY MARKET BY REGION US$m; FOB; 2014
Indian Sub
SE Asia East Asia
NA
/ME/C
A
Other $10
Singapore $3
$15 $137
Israel $13
Egypt $0
$12 $556
India $2
South Korea $2
Philippines $42
Taiwan $53
Indonesia $200
Vietnam $151
Kuwait $0
Japan $5
Malaysia $30
Saudi $1
Other $1
China $77
UAE $0
Hong Kong SAR $0
Thailand $131
TOTAL = US$720m
Predominantly for aquaculture

Over the past ten years, Vietnam, Indonesia, Thailand and China have driven import value growth
17 Note: data is as reported by sender (FOB), not receiver; Source: UN Comtrade database; Coriolis analysis and classifications
IMPORT VALUE BY MARKET BY REGION US$m; FOB; 2004-2014
2008
India
2009
Philippines
Bahrain
2004
Japan
2005 2007 2006
Taiwan
2013 2014
United Arab Emirates
Malaysia
2011 2010 2012
Kuwait
Hong Kong SAR
Thailand
Israel
Indonesia
South Korea
10y ABS
China
Other Ind. Sub
Vietnam
Egypt
Singapore
Saudi Arabia
Other ME
$1
$0
$0
$1
$0
$0 $0
$1
$5
$3
$0 $0
$10
$0
$1
+$8 +$2
-$2 +$2
+$38
+$127
+$17
+$125
+$0 +$0
$63 $77
-$21 +$12
+$0 +$1
+$143
$407
$471
$269
$406
$758
$720
$482
$626
+$41
+$0
+$4 +$2
$144
$192
+$70
$151
$37
$45 $34 $35
$0 $0
$53
$0 $12 $13
$2
$2
$24 $23 $18 $21
$0 $22 $26 $11 $24
$47 $38 $31 $64
$0 $0
$0 $2
$0
$6
$1
$1
$2
$9
$1
$1
$12
$14
$17
$17 $23
$0 $0
$0
$0
$0
$1
$1
$0
$0
$13
$3 $3
$0
$0
$4
$7
$7
$4
$8
$12
$21
$21 $21
$22
$1
$1
$4
$2
$0
$0
$0
$0
$0
$0
$0
$0
$0
$1 $1 $0
$0
$0
$0
$1
$0
$0
$0
$0
$0
$1
$2
$3
$1
$0
$1
$0
$0
$0
$1
$0
$0
$1
$0
$2
$3 $3
$54
$68
$42
$73
$122
$129 $169
$163
$138 $7
$20
$4
$7
$27
$47
$47
$33 $24
$208
$151 $151
$65 $108
$1
$0 $0
$0 $1
$8 $15
$240 $200
$17
$77
$72
$18
$49
$3
$1
$3
$1
$3
$4
$11
$9
$3
$12
$11
$10
$9
$11
$0
$1
$0
$0
$0
$8
$66 $70
$29
$41
$84
$150
$131
$97
$144
$20 $6
$16 $13
$12
$6 $11
$14
$30
CAGR 17%

Bubble scale: US$m; 2014 A bubble this size=
Vietnam, Thailand, China and Taiwan have been driving growth over the past five years
18 Note: data is as reported by sender (FOB), not receiver; Source: UN Comtrade database; Coriolis analysis and classifications
FIVE YEAR IMPORT GROWTH MATRIX: CHANGE IN VOLUME VS. RATE OF GROWTH VS. ABSOLUTE VALUE US$m; t; 2009 vs. 2014
20%
80,000 100,000
15%
20,000 -20,000 0 60,000 40,000
25%
-10%
0%
-5%
10%
5%
South Korea
Lebanon
Oman
Taiwan Malaysia
China
Hong Kong SAR
$200m
Sri Lanka
Japan
Jordan
Indonesia
Philippines
Pakistan
Saudi Arabia
Kuwait
UAE
Israel
Egypt
Thailand
Vietnam
Singapore India
5y absolute change in volume
5y CAGR value
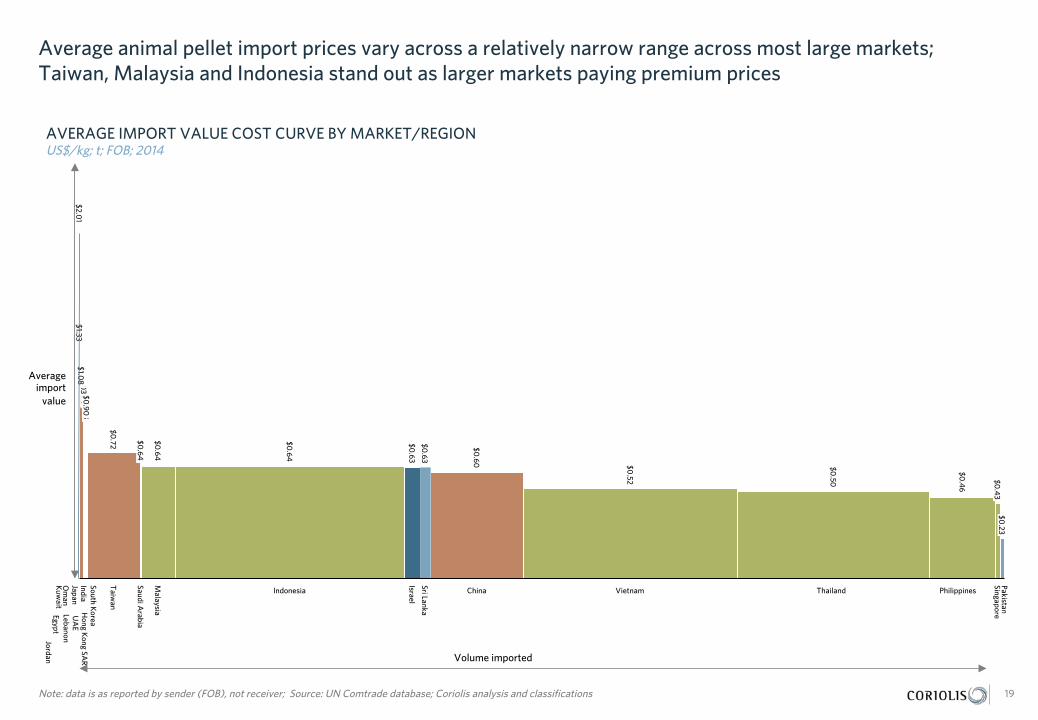
Average animal pellet import prices vary across a relatively narrow range across most large markets; Taiwan, Malaysia and Indonesia stand out as larger markets paying premium prices
19 Note: data is as reported by sender (FOB), not receiver; Source: UN Comtrade database; Coriolis analysis and classifications
AVERAGE IMPORT VALUE COST CURVE BY MARKET/REGION US$/kg; t; FOB; 2014
Malaysia
Saudi Arabia
Japan
Thailand Vietnam Indonesia
Hong K
ong SAR
Jordan
South Korea
Om
an
Israel
China
Singapore Pakistan U
AE
India
Taiw
an
Philippines
Kuw
ait Lebanon
Sri Lanka Egypt
$0.88
$0.63
$1.33 $0
.88 $2.0
1
$0.60
$0.96
$0.23
$0.4
3
$0.63
$0.64
$0.64
$0.50
$0.52
$0.96 $0
.90
$0.64
$0.72
$1.03
$0.4
6
$1.07
$1.08
Volume imported
Average import
value

Imported animal pellets consumption and aggregate animal pellet imports appear almost inversely correlated with income per capita in SE Asia; unlinked elsewhere
20 Note: data is as reported by sender (FOB), not receiver; Source: UN Comtrade database; Wikipedia (GDP/capita); Coriolis analysis and classifications
MARKET SIZE DRIVERS: GDP PER CAPITA VS. IMPORTS PER CAPITA VS. MARKET SIZE Kg; US$; t; 2014
0.0 $40,000 $20,000 $60,000 $30,000
4.5
4.0
$50,000
3.0
2.0
$0
2.5
1.5
3.5
0.5
$10,000
1.0
Egypt
Israel
100,000
Kuwait South Korea
Lebanon
Taiwan
Malaysia
Hong Kong SAR China
Sri Lanka
Jordan Japan
Indonesia Singapore
India
UAE
Thailand
Vietnam
Saudi
Pakistan
Oman
Philippines
GDP per capita
Imports per capita
Bubble scale: tonnes; 2014 A bubble this size=
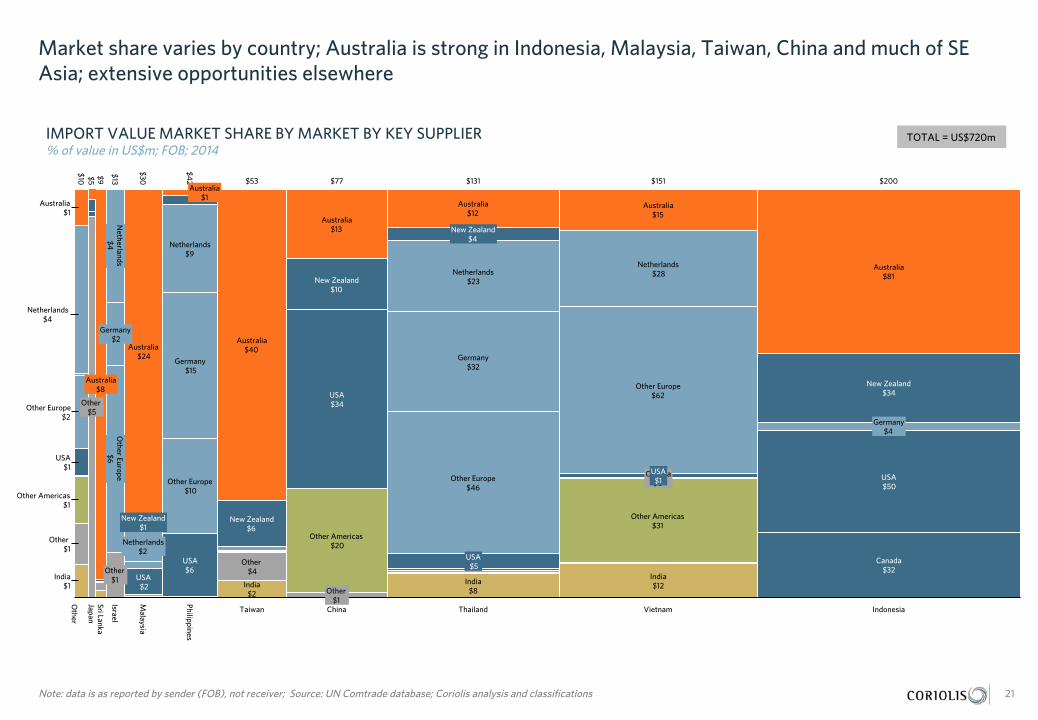
Market share varies by country; Australia is strong in Indonesia, Malaysia, Taiwan, China and much of SE Asia; extensive opportunities elsewhere
21 Note: data is as reported by sender (FOB), not receiver; Source: UN Comtrade database; Coriolis analysis and classifications
IMPORT VALUE MARKET SHARE BY MARKET BY KEY SUPPLIER % of value in US$m; FOB; 2014
China Taiwan Thailand Indonesia Vietnam
Other
Sri Lanka
Philippines
Japan
Israel
Malaysia
India $2
Other Europe
$6
Other Europe $2
$10
India $12 India
$8
Netherlands $4
Australia $1
Australia $8
Australia $24
India $1
Other Europe $10
New Zealand $34
$131
Germany $2
Netherlands $2
$77 $151
Netherlands $23
Netherlands $28
Netherlands $9
$200
Germany $32
$30
$13
$9
Germany $4
Netherlands
$4
Germany $15
$53
$5
$42
Australia $81
Canada $0
USA $2
New Zealand $6
Other Americas $1
Australia $15
Canada $32
USA $1
USA $6
USA $5
New Zealand $1
USA $34
USA $1 USA
$50
Other $1
Other $5
Other $1
Other $4
Australia $1
Australia $40
New Zealand $10
Other Americas $20
Australia $12
Australia $13
Other $1
New Zealand $4
Other Europe $46
Other Americas $31
Other Europe $62
TOTAL = US$720m
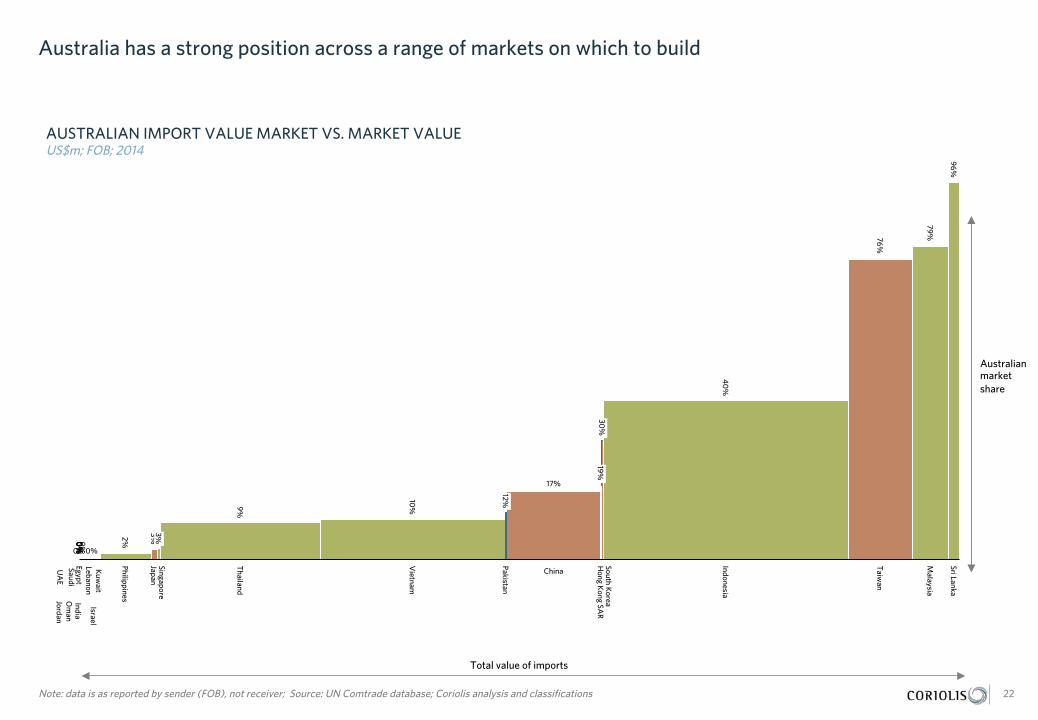
Australia has a strong position across a range of markets on which to build
22 Note: data is as reported by sender (FOB), not receiver; Source: UN Comtrade database; Coriolis analysis and classifications
AUSTRALIAN IMPORT VALUE MARKET VS. MARKET VALUE US$m; FOB; 2014
Japan
Jordan O
man
India Saudi
Singapore
UA
E
Philippines
South Korea
Hong K
ong SAR
Lebanon
Indonesia
Kuw
ait
Thailand
Pakistan
Malaysia
Egypt
China
Israel
Taiw
an
Vietnam
Sri Lanka
2%
17%
0%
0% 0%
0%
76%
79%
0%
0
%
40
%
3% 0%
19%
30%
9%
10%
96%
3% 0%
12%
Total value of imports
Australian market share
Bubble scale: US$m; 2014 A bubble this size=
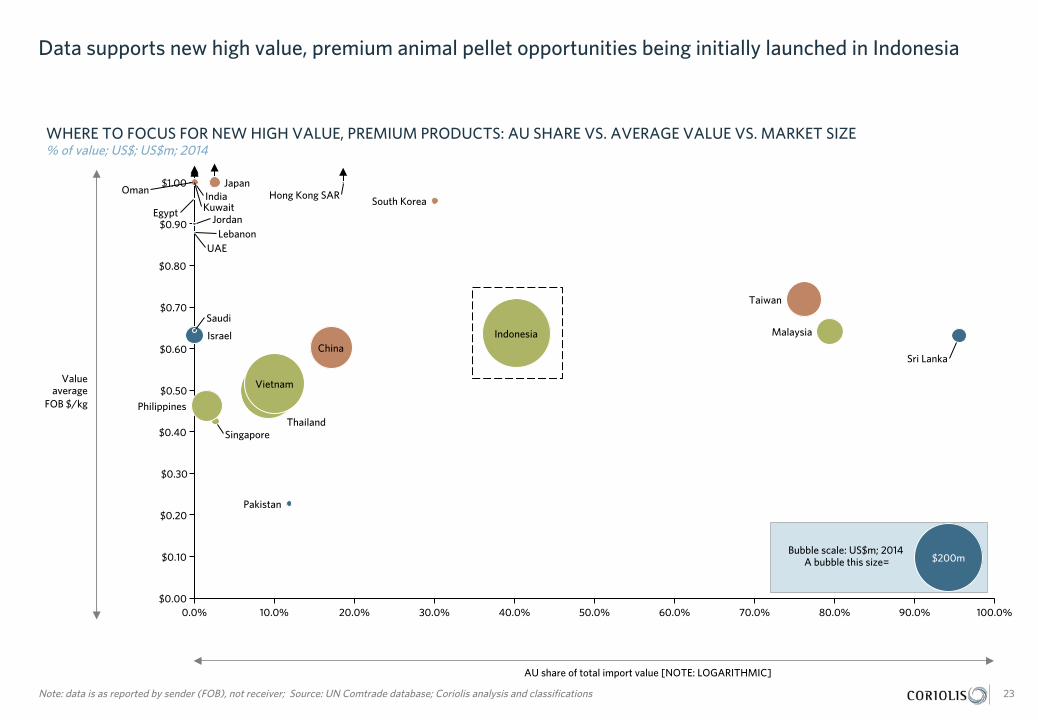
Data supports new high value, premium animal pellet opportunities being initially launched in Indonesia
23 Note: data is as reported by sender (FOB), not receiver; Source: UN Comtrade database; Coriolis analysis and classifications
WHERE TO FOCUS FOR NEW HIGH VALUE, PREMIUM PRODUCTS: AU SHARE VS. AVERAGE VALUE VS. MARKET SIZE % of value; US$; US$m; 2014
70.0% 0.0%
$0.30
80.0% 40.0%
$0.40
$0.80
$0.60
50.0% 60.0%
$0.90
$0.00 20.0%
$0.20
$0.10
$1.00
$0.70
$0.50
90.0% 10.0% 100.0% 30.0%
Vietnam
South Korea
Lebanon
Indonesia
Taiwan
Egypt
Japan
$200m
Hong Kong SAR
Jordan
Pakistan
Kuwait
UAE
Singapore
China
Philippines
Israel
Sri Lanka
India
Saudi
Oman
Malaysia
Thailand
AU share of total import value [NOTE: LOGARITHMIC]
Value average
FOB $/kg

As a “Straw Man” for discussion, we identify an export market roll-out plan
24
PRELIMINARY “STRAW MAN” DEVELOPMENT & ROLLOUT PLAN FOR ANIMAL FEED OPPORTUNITY Model; 2016
1 Export launch in Indonesia
2 Expansion to other SE Asian markets
3 Expansion into China
0 Product development and testing
DOCUMENT STRUCTURE
What is the global situation?
What is the strategic situation in the market?
In this environment, what is the opportunity for Western Australia?
Who are the potential in-market partners?
Who are the key firms in Western Australia capable of delivering?
25
Western Australia is well-positioned to grow animal feed exports to Asia
26
IS THE MARKET DEVELOPED & COMPETITIVE?
- The flow of animal pellets, from production to the farmer in Asia, is relatively straight-forward; complexity comes from needing to distribute the product to a large number of small producers across a large area
WHAT IS WA CAPABLE OF DELIVERING?
- Western Australian animal pellet producers need to continue to move forward and improve through improved product development and presentation
- Western Australian animal feeds are a premium product for which a wide rage of potential positions or claims exist to develop a more differentiated offer for Asia
- As a “Straw Man” for discussion, we identify an opportunity to further develop Western Australian animal feed by developing and marketing select characteristics
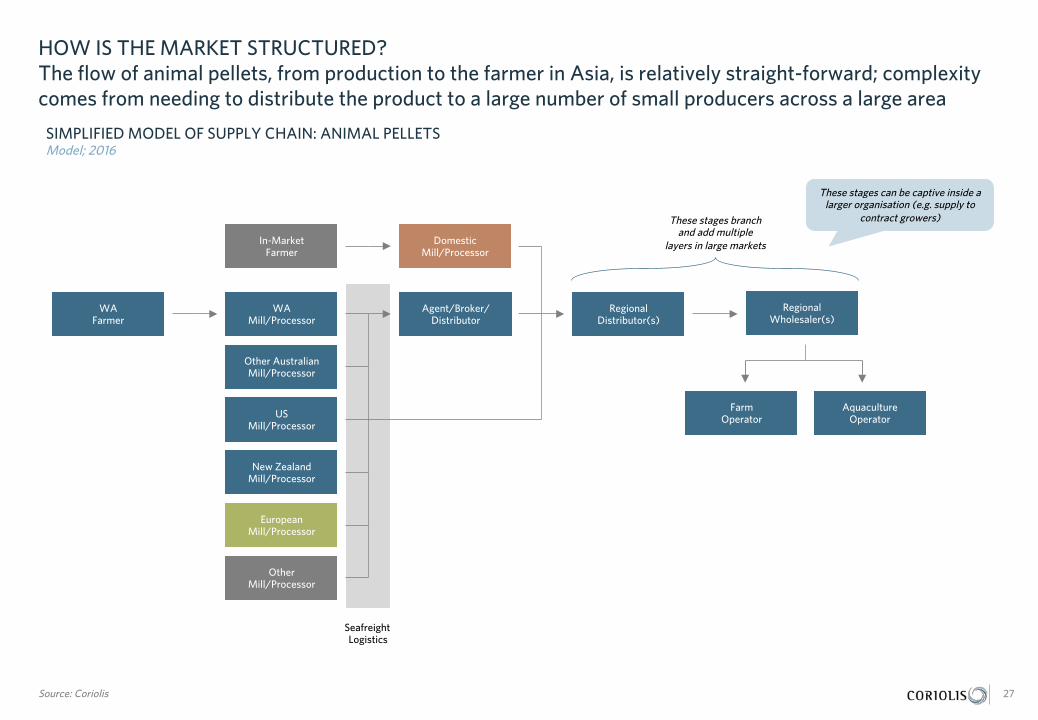
HOW IS THE MARKET STRUCTURED? The flow of animal pellets, from production to the farmer in Asia, is relatively straight-forward; complexity comes from needing to distribute the product to a large number of small producers across a large area
27 Source: Coriolis
SIMPLIFIED MODEL OF SUPPLY CHAIN: ANIMAL PELLETS Model; 2016
Farm Operator
Regional Wholesaler(s)
Regional Distributor(s)
Agent/Broker/ Distributor
WA Mill/Processor
Other Australian Mill/Processor
WA Farmer
US Mill/Processor
These stages branch and add multiple
layers in large markets
Seafreight Logistics
New Zealand Mill/Processor
Domestic Mill/Processor
In-Market Farmer
Aquaculture Operator
European Mill/Processor
Other Mill/Processor
These stages can be captive inside a larger organisation (e.g. supply to
contract growers)

WHAT IS WA CAPABLE OF DELIVERING? STRATEGIC DIRECTION Western Australian animal pellet producers need to continue to move forward and improve through improved product development and presentation
28
SUGGESTED STRATEGIC DIRECTION: WESTERN AUSTRALIAN ANIMAL PELLETS Model; 2016
Bulk animal pellets
Production system optimised
pellets
Australian branded
Superior Growth
performance
Controlled supply chain
Farmer direct
WA suppliers are here in Asia
High growth, high potential opportunities
are here
Track-&-Trace
PRELIMINARY FOR DISCUSSION
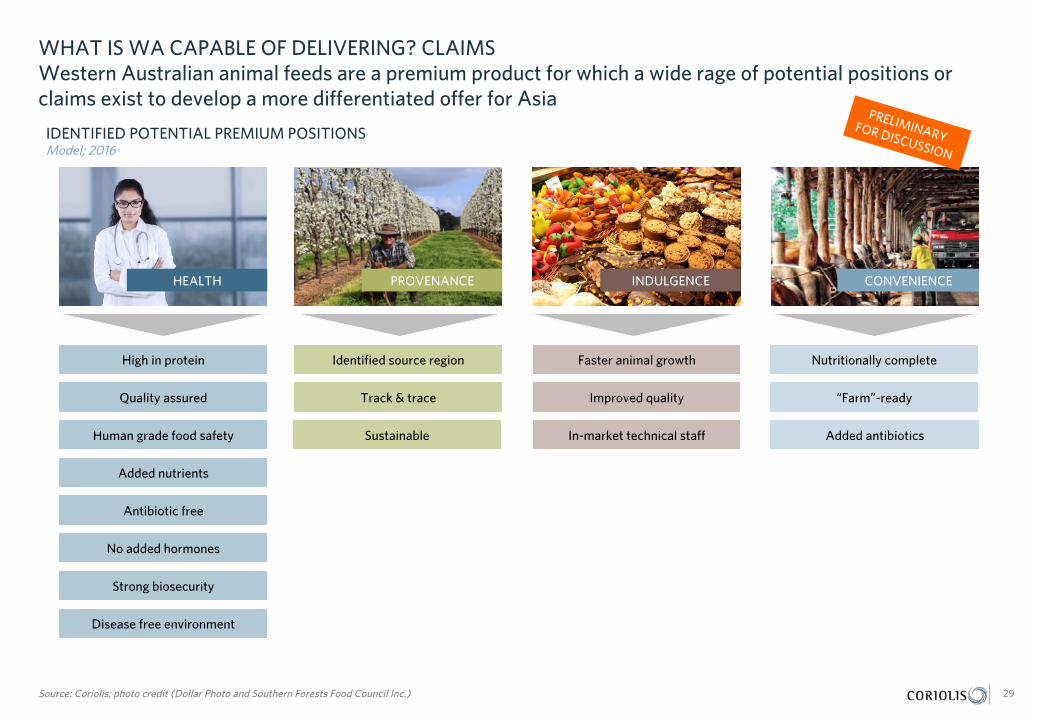
WHAT IS WA CAPABLE OF DELIVERING? CLAIMS Western Australian animal feeds are a premium product for which a wide rage of potential positions or claims exist to develop a more differentiated offer for Asia
29 Source: Coriolis; photo credit (Dollar Photo and Southern Forests Food Council Inc.)
IDENTIFIED POTENTIAL PREMIUM POSITIONS Model; 2016
Identified source region Nutritionally complete High in protein
Track & trace
HEALTH PROVENANCE INDULGENCE CONVENIENCE
Faster animal growth
“Farm”-ready Quality assured
Added nutrients
Antibiotic free
No added hormones
Improved quality
Sustainable
PRELIMINARY FOR DISCUSSION
Human grade food safety In-market technical staff
Strong biosecurity
Disease free environment
Added antibiotics
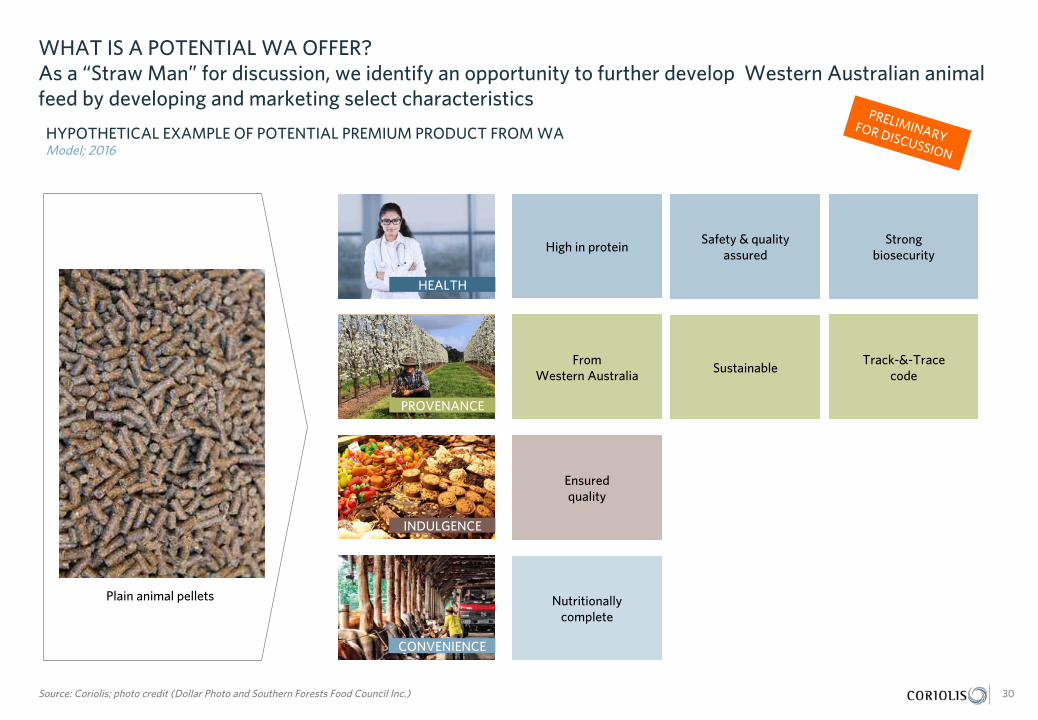
Plain animal pellets
WHAT IS A POTENTIAL WA OFFER? As a “Straw Man” for discussion, we identify an opportunity to further develop Western Australian animal feed by developing and marketing select characteristics
30 Source: Coriolis; photo credit (Dollar Photo and Southern Forests Food Council Inc.)
HYPOTHETICAL EXAMPLE OF POTENTIAL PREMIUM PRODUCT FROM WA Model; 2016
High in protein Safety & quality
assured
From Western Australia
Sustainable Track-&-Trace
code
Nutritionally complete
HEALTH
PROVENANCE
INDULGENCE
CONVENIENCE
Ensured quality
PRELIMINARY FOR DISCUSSION
Strong biosecurity
DOCUMENT STRUCTURE
What is the global situation?
What is the strategic situation in the market?
In this environment, what is the opportunity for Western Australia?
Who are the potential in-market partners?
Who are the key firms in Western Australia capable of delivering?
31
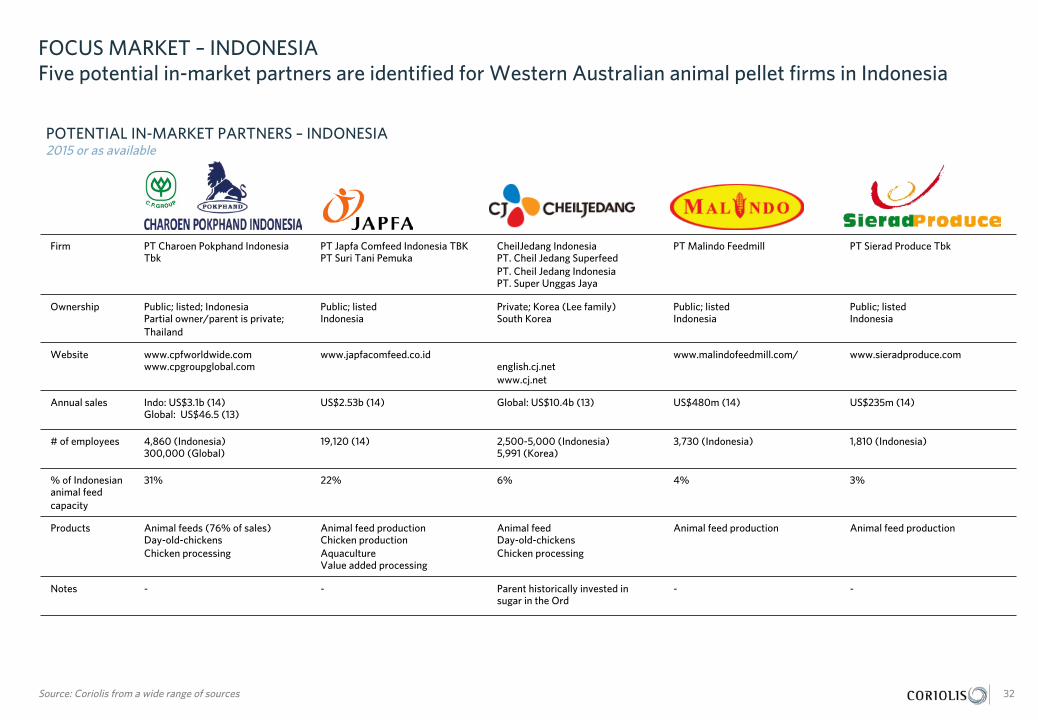
FOCUS MARKET – INDONESIA Five potential in-market partners are identified for Western Australian animal pellet firms in Indonesia
Firm PT Charoen Pokphand Indonesia Tbk
PT Japfa Comfeed Indonesia TBK PT Suri Tani Pemuka
CheilJedang Indonesia PT. Cheil Jedang Superfeed PT. Cheil Jedang Indonesia PT. Super Unggas Jaya
PT Malindo Feedmill PT Sierad Produce Tbk
Ownership Public; listed; Indonesia Partial owner/parent is private; Thailand
Public; listed Indonesia
Private; Korea (Lee family) South Korea
Public; listed Indonesia
Public; listed Indonesia
Website www.cpfworldwide.com www.cpgroupglobal.com
www.japfacomfeed.co.id english.cj.net www.cj.net
www.malindofeedmill.com/ www.sieradproduce.com
Annual sales Indo: US$3.1b (14) Global: US$46.5 (13)
US$2.53b (14) Global: US$10.4b (13) US$480m (14) US$235m (14)
# of employees 4,860 (Indonesia) 300,000 (Global)
19,120 (14) 2,500-5,000 (Indonesia) 5,991 (Korea)
3,730 (Indonesia) 1,810 (Indonesia)
% of Indonesian animal feed capacity
31% 22% 6% 4% 3%
Products Animal feeds (76% of sales) Day-old-chickens Chicken processing
Animal feed production Chicken production Aquaculture Value added processing
Animal feed Day-old-chickens Chicken processing
Animal feed production Animal feed production
Notes - - Parent historically invested in sugar in the Ord
- -
32 Source: Coriolis from a wide range of sources
POTENTIAL IN-MARKET PARTNERS – INDONESIA 2015 or as available
DOCUMENT STRUCTURE
What is the global situation?
What is the strategic situation in the market?
In this environment, what is the opportunity for Western Australia?
Who are the potential in-market partners?
Who are the key firms in Western Australia capable of delivering?
33

IDENTIFIED WA COMPANIES
GILMAC MACKIE HAY KETTRIDGES MILNE AGRIGROUP
ADDRESS: Level 3, 3 Ord St , West Perth WA 6005 ADDRESS: Cnr Harris Road & Golding Cresent, Picton WA
ADDRESS: 2 Alumina Road,East Rockingham, WA 6168
PHONE: 08 9429 4900 PHONE: 08 9724 6800 PHONE: 08 9351 0750
WEBSITE: www.gilmac.com.au WEBSITE: www.kettridges.com.au WEBSITE: www.milne.com.au
34 Sources: Coriolis from a wide range of sources
THOMPSON AND REDWOOD /PREMIUM GRAIN HANDLERS
UNIGRAIN
WELLARD GROUP
ADDRESS: 220 Almeria Parade, Upper Swan WA 6069
ADDRESS: 28 Howson Way, Bibra Lake, WA 6163 ADDRESS: 1A Pakenham Street, Fremantle, WA 6160
PHONE: 08 9296 4767 PHONE: 08 9418 6126 PHONE: 08 9432 2800
WEBSITE: www.thompsonandredwood.com.au WEBSITE: www.unigrain.com.au WEBSITE: www.wellard.com.au
WESTON MILLING ANIMAL NUTRITION
ADDRESS: 31 Sevenoaks St, Bentley, WA 6102
PHONE: 08 9350 7000
WEBSITE: www.westonanimalnutrition.com.au
AUSTRALIA Coriolis Australia Pty Ltd
PO Box 5831 St Georges Terrace
Perth, WA 6831 Australia
+61 8 9468 4691
NEW ZEALAND Coriolis (New Zealand) Limited
PO Box 90-509 Victoria Street West
Auckland, 1142 New Zealand
+64 9 623 1848
www.coriolisresearch.com
Coriolis is the leading Australasian management consulting firm specialising in the wider food value chain. We work on projects in agriculture, food and beverages, consumer packaged goods, retailing & foodservice. In other words, things you put in your mouth and places that sell them. WHERE WE WORK We focus on the Asia Pacific region, but look at problems with a global point-of-view. We have strong understanding of, and experience in, markets and systems in Australia, China, Japan, Malaysia, New Zealand, Singapore, South Korea, Thailand, the United Kingdom and the U.S. We regularly conduct international market evaluations and benchmarking. WHAT WE DO We help our clients assemble the facts needed to guide their big decisions. We develop practical, fact-based insights grounded in the real world that guide our clients decisions and actions. We make practical recommendations. We work with clients to make change happen. We assume leadership positions to implement change as necessary. HOW WE DO IT All of our team have worked across one-or-more parts of the wider food value chain, from farm-to-plate. As a result, our recommendations are grounded in the real world. Our style is practical and down-to-earth. We try to put ourselves in our clients’ shoes and focus on actions. We listen hard, but we are suspicious of the consensus. We provide an external, objective perspective. We are happy to link our fees to results. WHO WE WORK WITH We only work with a select group of clients we trust. We build long term relationships with our clients and more than 80% of our work comes from existing clients. Our clients trust our experience, advice and integrity.
Coriolis advises clients on growth strategy, mergers and acquisitions, operational improvement and organisational change. Typical assignments for clients include… FIRM STRATEGY & OPERATIONS We help clients develop their own strategy for growing sales and profits. We have a strong bias towards growth driven by new products, new channels and new markets. MARKET ENTRY We help clients identify which countries are the most attractive – from a consumer, a competition and a channel point-of-view. Following this we assist in developing a plan for market entry and growth. VALUE CREATION We help clients create value through revenue growth and cost reduction. TARGET IDENTIFICATION We help clients identify high potential acquisition targets by profiling industries, screening companies and devising a plan to approach targets. DUE DILIGENCE We help organisations make better decisions by performing consumer and market-focused due diligence and assessing performance improvement opportunities. EXPERT WITNESS We provide expert witness support to clients in legal cases and insurance claims. We assist with applications under competition/fair trade laws and regulations.