Embed Size (px)
Citation preview

[Table_yemei1] Investment Focus
[Table_yejiao1] This research report is distributed by Haitong International, a global brand name for the equity research teams of Haitong International Research Limited (“HTIRL”), Haitong Securities India Private Limited (“HSIPL”), Haitong International (Japan) K.K. (“HTIJKK”), Haitong International Securities Company Limited (“HTISCL”), and any other members within the Haitong International Securities Group of Companies (“HTISG”), each authorized to engage in securities activities in its respective jurisdiction. Please refer to the appendix for the Analyst Certification, Important Disclosures and Important Disclaimer.
Research Report
23 Dec 2020
Gland Pharma Ltd (GLAND IN)
In for the Long Haul: Initiation
[Table_Info] Initiate with OUTPERFORM Rating OUTPERFORM
Current Price Rs2,320
Target Price Rs2,790
Market cap Rs380bn / US$5.14bn
Daily traded value (3mth) US$2.89mn
Shares in issue 163.28mn
Free float (%) 80%
1 yr high - low Rs2,351.00-Rs1,820.45
Source: Factset
1mth 3mth 12mth
Absolute
Absolute USD
Relative to MSCI China
[Table_Profit] (Rs mn) Mar-20A Mar-21E Mar-22E Mar-23E
Revenue 26,332 34,115 40,046 48,266
(+/-) 29% 30% 17% 21%
Net profit 7,729 10,564 12,694 16,057
(+/-) 64% 37% 20% 26%
Diluted EPS (Rs) 50.51 64.51 77.51 98.05
GPM 58.1% 61.0% 59.0% 59.5%
ROE 23.8% 22.2% 19.8% 20.8%
P/E 46 36 30 24
Source: Company data, HTI estimates
Gland Pharma (Gland) is one of the fastest-growing small-molecule generic injectable companies in the US. It sells its products primarily under a B2B model in over 60 other countries. Driven by 45-50 yearly injectable launches across the globe, Gland has reported 27%/55% Revenue/PAT CAGR over the last three years and we believe it is likely to maintain a similar approval rate, healthy double-digit topline, and earnings growth over FY20-23E. Dominant market share in the majority of the products supported by cost leadership, supply continuity, and clean regulatory record are critical factors for its success in the injectable space. This strength is also reflected in its profitable P&L and cash-rich balance sheet. We initiate coverage on the stock with an Outperform rating and target price of Rs 2,790.
Eight benefits of Gland’s B2B model: The unique business model of Gland provides several advantages in the injectable space - 1) early market entry; 2) access to niche portfolio; 3) ability to leverage the presence of leading front end players; 4) multiple marketing partners to grab higher market share; 5) economies of scale; 6) less capital investment; 7) better compliance record; and 8) secular and predictable growth.
The US - The mainstay of Gland’s business (~67% of sales): Driven by the ramp-up in recently launched products like Enoxaparin, Caspofungin, Dexmedetomidine along with new product launches in penem, oncology, and peptide categories, we expect the US revenues to grow at ~25% CAGR over FY20-23E (to cross US$ 450 mn by FY23E).
Key earnings drivers: 1) Global Enoxaparin opportunity; 2) complex peptides, depo and long-acting injectables launches; 3) entry into the Chinese market; 4) vaccine fill and finish supply; 5) Potential M&A with Rs 30bn cash on books; and 6) improving business mix.
Financial ratios to improve further: We expect Gland to deliver 22.4/27.7/27.6% revenue/EBITDA/PAT CAGR over FY20-23E. Driven by optimal utilization of capacities, minimal Capex, and improving profitability, the ROIC should strengthen further to 45%+ while FCF generation should improve to Rs 7-8bn annually by FY23E.
View & Valuation: Due to Gland’s profit-sharing B2B model, we believe
Gland’s financial ratios are superior to both B2B (CMO) and front end peers. Moreover, there is also a multi-year runway for growth with an abundant market opportunity in the injectable space. Thus, we believe Gland’s PE is likely to remain on the up-trend for some time. We value Gland at 30x PE on Dec-22 EPS of Rs 92.8 to arrive at a target price of Rs 2,790/sh. Initiate with an Outperform rating.
Risks: US FDA risk, Incremental competition, supply disruption, Rupee
appreciation.
[Table_Author] Amey Chalke [email protected]
90
100
110
120
130
Price Return Nifty100 index
Nov-20
Vo
lum
e

23 Dec 2020 2
[Table_header1] Gland Pharma Ltd (GLAND IN) INITIATE WITH OUTPERFORM
KEY EARNINGS TRIGGERS
Source: HTI estimates
• ~US$ 4bn Low molecule heparin global opportunity
• ~US$ 1.5bn Enoxaparin market in US & EU
• Gland launched Enoxaparin in early 2019 (in US)
Low Molecule Heparins
• We estimate ~2/3rd of FY20 revenues are contributed by profit sharing contracts
• Incrementally, 85-90% of the launches in the US are likely to be with profit sharing agreements
Improving business mix
• Likely to introduce difficult to make hormones, peptides, long acting & depo injectables from FY23/24
• We estimate the opportunity size is more than US$ 5bn for these generic molecules
Entry into complex inj
•Chinese generic injectable market is close to US$ 30bn in value (vs US$ 45bn US market)
•Gland has filed 6 dossiers and planning to file total 60 products in coming years
Entry into China
• Post the IPO, Gland is expected to have Rs 30bn of cash on the books
• This could be utilised to acquire newer technological asset in the future
Cash rich B/S
• Gland has one of the largest vial bottling capacity units in the country
• The company may look to tie up with vaccine innovators to fast track manufacturing proceess
Vaccine Opportunity
23 Dec 2020 3
[Table_header1] Gland Pharma Ltd (GLAND IN) INITIATE WITH OUTPERFORM
Company Profile
Gland Pharma was established in Hyderabad, India, in 1978, and since then, the company has become a significant player in the injectable market. It covers a large part of the injectables value chain, including CDMO, own development, dossier preparation/filing, technology transfer, and manufacturing across various delivery systems. Gland is mainly a B2B player as it generates ~96% of the overall revenue (FY20). The company also gets ~84% (FY20) of its revenue through exports by selling products in over 60 countries. Major regions are the US, Canada, Europe & Australia. As per IQVIA, Gland is one of the fastest-growing small-molecule generic injectable companies (by revenue) in the US (38% rev CAGR over 2014-19).
In Nov-20, Gland completed the largest IPO in the Indian Pharmaceutical space. It was listed at Rs 1,710, a 14% premium to its issue price. Currently, the promotor, Fosun Pharmaceutical industrial Pte’s (unlisted) shareholding stands at 58.4%. Other key shareholders include Gland Celsius (Unlisted), SBI MF and the Republic of Singapore who hold 6.2%, 3.4% & 2.7%, respectively.
Figure 2: B2B contracts account for ~96% of sales Figure 3: The US is the largest geography
Source: Company Data Source: Company Data
Figure 4: Key events prior to 2020
Source: Company Data
96%
4%
B2B Business B2C Business
71.362.5 66.7 62.6
18.5
1917.7
14.5
5.2
6.96.7
6.2
5.1 11.6 8.816.7
FY18 FY19 FY20 1QFY21
US India ORM ROW
Calender year Event
2019 Filed Dexrazoxane injection in China market & receieved clinical waiver
2018 Received ANDA approval for Enoxaparin for US market and Olopatadine (first ophthalmic approval)
2017 Fosun Pharma acquired 74% stake in Gland
2016 Received USFDA approval for facilities in JNPC, Pashamlaram & Visakhapatnam SEZ
Received USFDA approval for small parenteral manufacturing facility in Visakhapatnam
Commissioned the Pashamylaram Unit-2 manufactuing facility
Received GMP certificate from MHRA (UK) for Dundigal manufacturing facility
Capital infusion of around US$ 200mn from KKR
2012 Received GMP certificate from BGV Hambury (Germany)
2010 Launched Heparin in US
2007 Capital infusion of around Rs 1.2bn from EILSF Co-Invest I LLC
2004-05 Launched Enoxaparin in India and RoW market
2003 Received USFDA approval from Dundigal facility
2000 Set-up the in-house R&D facility at Dundigal
1978 Incorporated by P.V.N. Raju
2014
Figure 1: Key shareholders
Source: Bloomberg (as on 20th Dec, 2020)
Shareholders % Shareholding
Fosun Pharma 58.4
Gland Celcius 6.2
SBI MF 3.4
Rep. of Singapore 2.7
Empower Trust 2.6
Nilay Trust 1.2
Kotak AMC 0.5
Invesco AMC 0.3
Franklin AMC 0.2
L&T MF 0.1
Baroda MF 0.1
PGIM India AMC 0.1

23 Dec 2020 4
[Table_header1] Gland Pharma Ltd (GLAND IN) INITIATE WITH OUTPERFORM
#1. B2B model provides secular growth
Gland is a unique company that predominately operates in a B2B model across global markets, unlike similar size generic injectable players, which are primarily front end companies. In FY20, ~96% of Gland’s revenues were generated from B2B contracts. However, a large portion of these B2B contracts is with profit sharing components compared to cost-plus-margin led CMO companies.
Deep dive in B2B contracts: There are four sub types: 1) IP led own ANDA filings, 2) IP led partner ANDA filings, 3) Tech-transfer, and 4) Cost+margin led CMO model.
Changing business mix: As per our understanding, Gland started its injectable business with a tech-transfer and Cost+margin led CMO model, and as it grew its technical and financial capabilities, it ventured into the IP-led business model. Now, more than 2/3rd of its revenues are coming from the first two types of business contracts, i.e., 1) IP led own ANDA filings and 2) IP led partner ANDA filings, the key reason for Gland’s improving profitability over the last several years. As most incremental launches will be Gland-owned, we believe a business mix improvement is likely to continue for a few years.
Figure 5: Business model illustration
Source: Glands RHP
1) IP led own ANDA filings: In these types of business contracts, Gland does the R&D and files the ANDA/dossier in respective markets. Also, these are non-exclusive marketing agreements with various front end players. In return, Gland gets Cost+Margin basis revenues and profit share from the front end partners.
2) IP led partner ANDA filings: In these types of business contracts, Gland does the R&D, along with the marketing partner, and the marketing partner files the ANDA/dossier in respective markets. These are exclusive marketing agreements with a sole front end player in each market. In return, Gland gets Cost+Margin basis revenues and profit share from the front end partners.
3) Tech-transfer contracts: Tech-transfer business contracts are formed when the technology is not widely available, and Gland has to do the job of CMO for its marketing partner. Apart from the regular CMO contract where Gland gets Cost+margin basis revenues, it may get a royalty payment for the tech transfer work.
4) Cost+margin led CMO model: These are regular CMO contracts where Gland does the toll manufacturing job for CMO clients and gets Cost+margin basis revenues. There is no profit sharing or royalty payment included in these types of contracts.
Royalty / Profit
Sharing
B2B Own
filingYes Yes Yes Yes Yes
IP-LedPartner
filingNo Yes Co-owned No Yes
No Yes No No Yes
No No No No No
Yes Yes Yes Yes Not applicable
B2B-Tech Transfer
B2B CMO
B2C
Rights/Ownership
ANDA/Product
registration
ownership
Development by
GlandIP ownership Marketing rights
In FY20, ~96% of Gland’s revenues were generated from B2B contracts
As majority of incremental launches will be Gland owned, the trend of business mix improvement is likely to continue for a few years.

23 Dec 2020 5
[Table_header1] Gland Pharma Ltd (GLAND IN) INITIATE WITH OUTPERFORM
Gland’s B2B presence: In markets such as the US, EU, Canada, and Australia as well as the RoW such as Brazil, Africa, APAC, Middle East, North Africa, Commonwealth of the Independent States, and South Africa, Gland’s primary business model is B2B, covering IP-led, technology transfer and contract manufacturing models. In such markets, it partners with leading pharmaceutical companies with strong and independent sales and distribution networks to market its products.
Gland’s B2C presence: Only in India, Gland operates with the B2C model, where its products are marketed and sold to institutions such as hospitals, long-term care facilities, and clinics. It also has a B2B presence in India, where it supplies products to pharmaceutical companies with a CMO/tech transfer business agreement.
Figure 6: Revenue growth comparison Figure 7: Gland’s gross margins is among the best among B2B and B2C players
Source: Gland’s RHP Source: Gland’s RHP
IP Led business accounts for 2/3rd
of overall revenue – We estimate Gland gets close to
2/3rd of its revenue from profit-sharing business contracts and yield more than 45%
EBITDA margins. The CMO/tech transfer model makes up the bulk of the remaining
revenue with EBITDA margins of around 20-30%, in our view.
In terms of approvals, currently, we estimate Gland owns 1/3rd ANDAs while the remaining 2/3rd are either partner-owned or in tech transfer contracts. In the future, a significant portion of the approved ANDAs will be owned by Gland. As a result, we expect the business mix to improve over the next 3-4 years, leading to better profitability.
Figure 8: Revenue mix (as per business models) Figure 9: % EBITDA margins as per business models
Source: Company Data Source: HTI estimate
0
2
4
6
8
10
12
14
16
18
B2C Players B2B Players Gland
Revenue Growth: 2014-19 (%)
0
10
20
30
40
50
60
70
B2C Players B2B Players Gland
2014 2019
2/3rd
1/3rd
IP led (own/partner) Tech trf/CMO/B2C
45-50 45-50
25-3020-25
~20
0
5
10
15
20
25
30
35
40
45
50
IP led(Own)
IP led(Partner)
TechTransfer
CMO B2C
Est % EBITDA margins
In all key markets, Glands works through its B2B model while the B2C model is only present in the Indian market
We estimate 1/3rd
ANDAs are owned by Gland while remaining 2/3
rd are either partner owned or in
tech transfer contracts
23 Dec 2020 6
[Table_header1] Gland Pharma Ltd (GLAND IN) INITIATE WITH OUTPERFORM
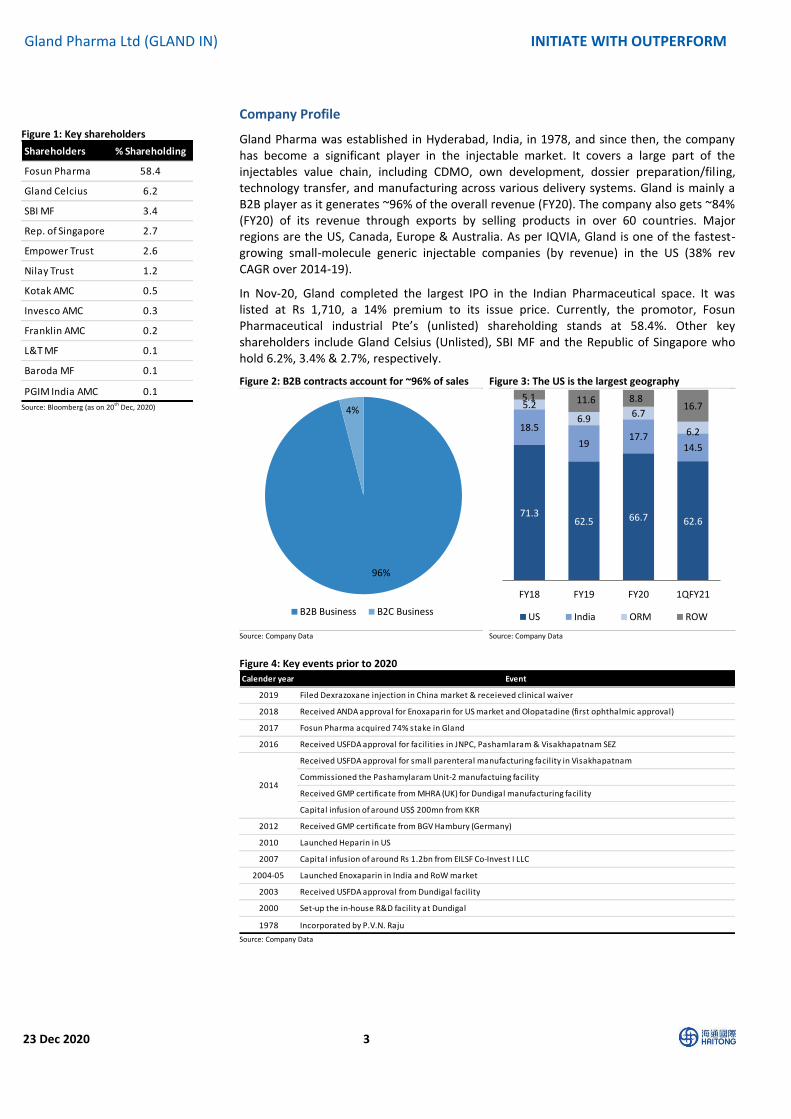
Figure 10: Of the 215 approved ANDAs, Gland owns only ~1/3rd of the same (HTI estimates)
Figure 11: Major portion of future ANDAs should come from IP led (HTI estimates)
Source: HTI Research Source: HTI Estimates
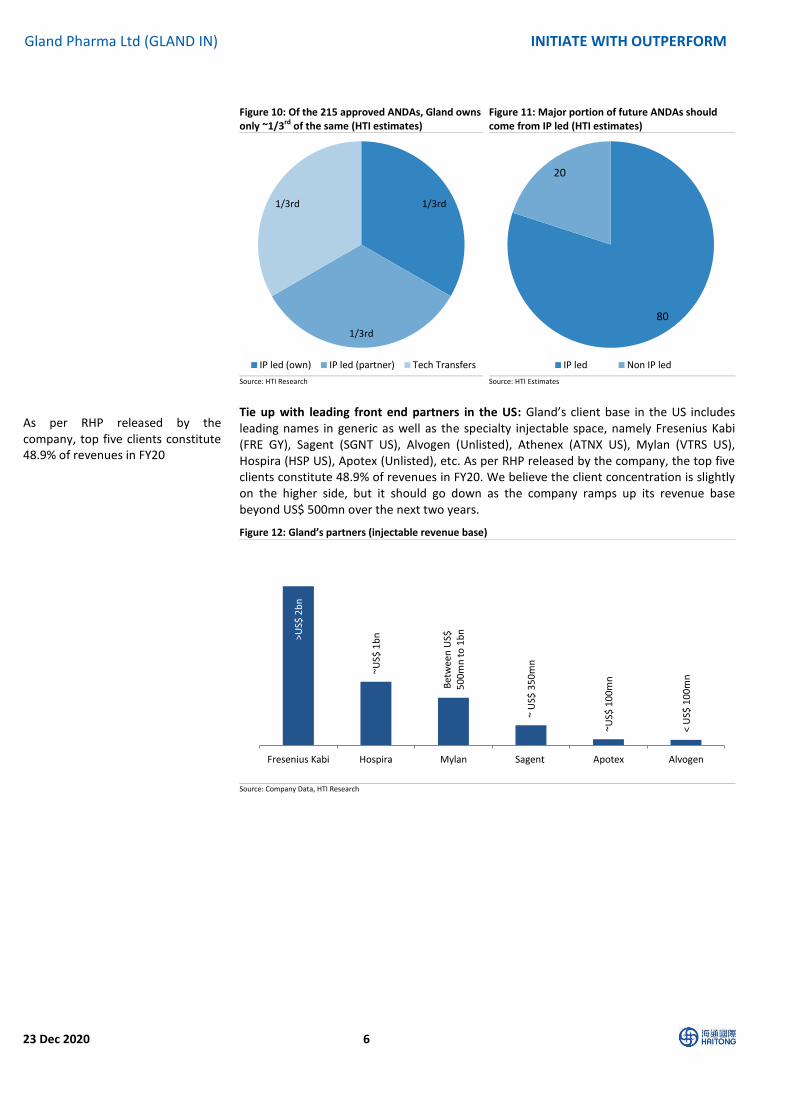
Tie up with leading front end partners in the US: Gland’s client base in the US includes leading names in generic as well as the specialty injectable space, namely Fresenius Kabi (FRE GY), Sagent (SGNT US), Alvogen (Unlisted), Athenex (ATNX US), Mylan (VTRS US), Hospira (HSP US), Apotex (Unlisted), etc. As per RHP released by the company, the top five clients constitute 48.9% of revenues in FY20. We believe the client concentration is slightly on the higher side, but it should go down as the company ramps up its revenue base beyond US$ 500mn over the next two years.
Figure 12: Gland’s partners (injectable revenue base)
Source: Company Data, HTI Research
1/3rd
1/3rd
1/3rd
IP led (own) IP led (partner) Tech Transfers
80
20
IP led Non IP led
>US$
2b
n
~US$
1b
n
Bet
wee
n U
S$
50
0m
n t
o 1
bn
~ U
S$ 3
50
mn
~US$
10
0m
n
< U
S$ 1
00
mn
Fresenius Kabi Hospira Mylan Sagent Apotex Alvogen
As per RHP released by the company, top five clients constitute 48.9% of revenues in FY20

23 Dec 2020 7
[Table_header1] Gland Pharma Ltd (GLAND IN) INITIATE WITH OUTPERFORM
B2B model has several advantages over B2C: Although Gland is sharing part of its profits with front end players and not realizing the full value of its IP, the B2B business model also has several advantages over front end players, which has been the key reason for Gland’s fast and secular growth in the challenging generic injectable market in the US.
Figure 13: Key advantages with a B2B business model
Source: HTI Research
1) Early market entry: The majority of injectable products are sold through hospital channels, an early entry with the help of a technologically capable partner (tech transfer or exclusive IP contracts)
2) Access to niche portfolio: Niche capabilities like liposomal injectables, depo, and long-acting injectables help in building stickiness with marketing partners over a more extended period without significant pricing pressure (tech-transfer or exclusive IP contracts)
3) Leveraging front end player’s presence: Tying up with a more prominent front end player that has an extensive portfolio helps in getting faster market access in challenging generic injectable hospital contracts
4) Non-exclusive contracts: Under a type one business contract, Gland has the independence to partner with multiple marketing players. It helps them to capture a large market in a short time
5) Economies of scale: Due to the above four advantages, Gland achieves economies of scale fairly quickly and attains cost leadership in most of its products. It also helps Gland to get better raw material supply terms than its peers.
6) Less capital intensive: As most litigation costs are incurred by marketing partners and some part of R&D is reimbursed, Gland operates in a less capital-intensive model than front-end peers.
7) Greater revenue visibility: Generic injectable market is mainly in an institutional segment with three- to five-year supply agreements, which is unlikely to go through sudden price cuts and market share volatility like oral solids.
8) Healthy compliance record: Being a B2B player, Gland goes through several client-related facility inspections. Moreover, since manufacturing is the core of the business model, the senior management is involved in quality compliance activities. Generally, B2B players do not face US FDA enforcement actions very frequently.
B2B business
model
Early market entry
Access to niche
products
Leverages partner's presence
Non - Exclusive contracts
Economies of scale
Less capital intensive
Greater revenue visibility
Healthy compliance
record
B2B business has been the key reason for Gland’s fast and secular growth in the difficult to penetrate generic injectable market in the US

23 Dec 2020 8
[Table_header1] Gland Pharma Ltd (GLAND IN) INITIATE WITH OUTPERFORM
Figure 14: Revenue growth of B2B players is better than India front-end players
Source: Company Data
21.8
18.2
13.8
11.7 13.5
11.1
5.9 4.1
3.1 2.4
*RECIB Gland *CTLT *LZAGY ARBP CDH CIPLA SUNP DRRD Lupin
Revenue % CAGR (2016-20)
B2B Players Indian front-end players

23 Dec 2020 9
[Table_header1] Gland Pharma Ltd (GLAND IN) INITIATE WITH OUTPERFORM
#2. The US: The mainstay of Gland’s injectable business
The US accounts for more than 2/3rd
Gland’s revenues: In FY20, at US$ ~250mn, the US business segment contributed ~67% of overall revenues. At present, it has filed for 267 ANDAs, and 52 approvals are pending with the USFDA. The company is on course to file 25+ ANDA every year. The US continues to be the largest generic injectable market globally, and Gland is only covering 10-12% of the present generic opportunity in the US. Thus, we expect the US to be the major contributor to the overall revenue and grow at more than ~25% revenue CAGR over FY20-23E. Figure 15: US accounts for more than 2/3rd of overall revenues
Source: Company Data, HTI Estimates
Injectable remains the fastest growing generic segment in the US: In the US, the injectable
segment has outperformed the overall market as it has grown at a 12.8% CAGR over 2015-
20 v/s 0.8% for oral solids. Within the global generic injectable market as well, the US is the
largest market with a US$ 46bn market value. Moreover, there is a US$ 195bn patent-
protected injectable market in the US, which will ensure that growth in the generic
injectable market is likely to remain strong for several years to come. IQVIA expects the US
generic injectable market to grow at 16% CAGR over 2019-24.
Figure 16: NA generic injectables market grew by ~13% CAGR (2014-19)
Figure 17: US generic injectables to grow at 16% CAGR
Source: IQVIA Source: Gland’s RHP
11.6 12.8 17.6 22.3 27.9 33.9
10.6
37.5
26.7 25.5
21.2
FY18 FY19 FY20 FY21E FY22E FY23E
US Revenue (Rs bn) % YoY
2546
18
2914
20
30
34
1
2
2014 (US$ bn) 2019 (US$ bn)
NA Europe RoW China India
CAGR (2014-19)North Americs - 13%Europe - 10%RoW - 7%China - 3%India - 15%
106 195
393
26
46
96
2015 (US$ bn) 2020 (US$ bn) 2025 (US$ bn)
Innovators Generics
CAGR (2020-25) Innovator - 15.1% Generics - 16.1%
We expect the US to be the major contributor to the overall revenue and grow at more than ~25% revenue CAGR over FY20-23E.
IQVIA expects US generic injectable market to grow at 16% CAGR over 2019-24.

23 Dec 2020 10
[Table_header1] Gland Pharma Ltd (GLAND IN) INITIATE WITH OUTPERFORM
Figure 18: Global Injectable sales via Geographies in 2020 (US$ bn)
Figure 19: Volume growth still strong in NA & Europe (2020)
Source: Gland’s RHP Source: Gland RHP
One of the leading Indian companies in the injectable space: At US$ 250mn in FY20, Gland is the second-largest listed Indian company in the US generic injectable space by value. However, due to the business's B2B nature, we believe in terms of volume, it should be a minimum of 2x leading injectable players like Aurobindo (ARBP IN). The economies of scale achieved in the injectable segment are also reflected in the company's profitability, which is significantly higher than Indian peers.
Figure 20: Revenue from Injectable as of FY20 Figure 21: Injectable approvals in the last 2 years
Source: HTI Research Source: Orange book
Figure 22: Total ANDA approved and pending
Source: Company Data, Note *- approvals up to Jun, 2020
NA 249
Europe 94
RoW 52
China 47
India 3
7.8
5.1
7.0
2.7
6.8
2.11.5
2.0
4.2
6.3
% Volume Growth % Price Growth
NA Europe RoW China India
>US$
2.5
bn
>US$
63
0m
n
~US$
28
0m
n
>US$
25
0m
n
~US$
19
0m
n
>US$
10
0-1
50
mn
>US$
10
0m
n
FRE
HIK
MA
AR
BP
Gla
nd
DR
RD
SUN
O
CIP
LA
0
5
10
15
20
25
30
35
Gland ARBP DRRD SunP CDH CIPLA
No. of Injectable approvals in the last 2 years
421
491
304280
222 215
165 166
93 99
28
208
101 96
156
101
5285
45 56 4820
ARBP *SUNP CDH LPC DRRD *Gland CIPLA GNP ALKEM TRP NTPCH
Approved Pending
At sales of ~US$ 250mn in FY20, Gland is the second largest listed Indian company in the US generic injectable space by value

23 Dec 2020 11
[Table_header1] Gland Pharma Ltd (GLAND IN) INITIATE WITH OUTPERFORM
Figure 23: 267 ANDAs filed up to Jun-20 Figure 24: ANDAs filed – Therapy wise
Source: Company Data Source: Company Data
Gland’s performance stands out in a crowded market: Our analysis of the injectable portfolio of Indian listed players suggests Gland is performing better than front end Indian players like Sun Pharma (SUNP IN), Dr Reddy’s Lab (DRRD IN), Cipla (CIPLA IN) and Aurobindo in crowded generic injectable products. Even in products where there are 10+ players present in the market, Gland has been able to secure a leading position with 10%+ market share. Figure 25: >10% MS in crowded market Figure 26: Key Products with highest MS (%)
Source: Bloomberg, Note Crowed market - >8 players Source: Bloomberg
The US revenues to grow at ~25% CAGR over FY20-23E: We believe the growth in the US revenues will be led by – 1) ramp up in recently launched products, 2) new product launches and 3) regular drug shortages opportunities. Ramp up in recently launched products: Gland has introduced more than 30 products in the US market over the last two years. Unlike the non-injectable space, the market share ramp up happens gradually. Hence we expect the significant revenue growth over the next two-three years will continue to come from these recently launched products – Enoxaparin, Caspofungin, Dexmedetomidine, etc.
81%
19%
Approved ANDA Pending ANDA
71%
19%
10%
Sterile Injectable Oncology Ophthalmic
21
16
10
4
0 0
Gland ARBP DRRD SUNP CIPLA CDH
No. of Injectable products in crowded market
Product nameMS
(%)
No. of
competitors
Dexrazoxane 67 8
Polymyxin 61 8
Ondansetron 51 10
Vancomycin 45 10+
Levetiracetam 29 10+
Enoxaparin 28 10+
Metoprolol 27 9
Daptomycin 25 10+
Labetoral 23 8
Heparin 22 10+
Even in products where there are 10+ players present in the market, Gland has been able to secure a leading position with 10%+ market share
Major revenue growth over next two-three years will continue to come from these recently launched products – Enoxaparin, Caspofungin, Dexmedetomidine etc

23 Dec 2020 12
[Table_header1] Gland Pharma Ltd (GLAND IN) INITIATE WITH OUTPERFORM
Figure 27: Gland’s key products in the US
Source: HTI estimates, Bloomberg, Note – Market share data is volume based
New product launches: We expect Gland to launch 20+ injectable products every year and most of these products will be owned by Gland. These products will be in general injectable, hormones, penem, and oncology categories. We expect new product launches to add at least US$ 100mn revenues in the US segment over the next three years. Some of the notable launches will be Bridion, Micafungin, Ertapenem, Meropenem. Figure 28: Expected near term launches
Source: HTI Research and estimates
Figure 29: Para 4 Opportunities
Source: HTI Research and estimates
Sizable opportunity for Gland in drug shortages - The number of injectable shortages increased by ~23% in 2018 compared to 2014. Gland has over 12-13 molecules that are currently listed on the US FDA drug shortage list and presents a market value of close to US$ 490mn. Due to Gland's extensive portfolio of more than 200 injectable products in the US, we believe such opportunities would likely be recurring for players like Gland in the US market even in the future and remain one of the revenue drivers over FY20-23E.
Products% market share
(Apr to Oct-20)No. of Partners
Partner name (% market
share)
Est US market
size (US$ mn)ANDA approval
No. of
manufacturers
Other key player
(% market share)
Enoxaparin 28 2Apotex (8%), Fresenius
Kabi (20%)500 5 10+
Sanofi (16%),
Amphastar (14%)
Daptomycin 36 2Fresenius Kabi (24%),
Sagent (12%)650 10+ 10+
Accord (8%),
Merck (12%)
Heparin 22 1 Sagent (22%) 600 10+ 10+Pfizer (30%),
Meitheal (21%)
Vancomycin 23 4
Fresenius Kabi (10%),
Alvogen (8%), Athenex
(4%), Sagent (1%)
250 10+ 10+Pfizer (28%),
Mylan (22%)
Levetiracetam 29 1 Pfizer (29%) - 10+ 10+Hikma (15%),
Mylan (22%)
ProductEst US market size
(US$ mn)ANDA approvals
No. of
manufacturer
Key players (% market
share - Oct-20)
Micafungin 110 2 2Astella (72%), Fresenius
Kabi (28%)
Ertapenem 340 3 7Par (33%), Auromedic
(37%)
Meropenem 120 10 10+App (47%), Auromedic
(27%)
Sugammadex 900 n.a 1 Merck (100%)
Brand Name Molecule Est US sales (US$ mn)Expected no. of
competitor
Bridion Sugammadex Sodium 550 10+
Lexiscan Regadenoson 350 10+
Kengreal Cangrelor 200 2
Mozobil Plerixafor 200 5
Aggrastat Tirofiban HCL 50 1
Naropin Ropivacaine HCL 34 7
Lastacaft Alcaftadine 8 3
We expect new product launches over next three years to add at least US$ 100mn revenues by FY23 in the US segment.

23 Dec 2020 13
[Table_header1] Gland Pharma Ltd (GLAND IN) INITIATE WITH OUTPERFORM
Figure 30: Molecules in shortage that are relevant to Gland
Source: Company Data
Figure 31: US revenues is expected to grow by ~24.5% CAGR over FY20-23
Source: Company Data, HTI Estimates
No. Generic Name or Active
Ingredient
Market Size (US$ Mn)
2019Market authorization status
1Ropivacaine Hydrochloride
Injection~141 Product Tentatively approved
2Ketorolac Tromethamine
Injection~73 Existing Products
3 Metronidazole Injection, USP ~59 Product filed. Awaiting approval
4Pantoprazole Sodium for
Injection~51 Product Tentatively approved
5Dexamethasone Sodium
Phosphate Injection~27 Existing products
6Calcitriol Injection USP 1MCG
/ML~24 Product Tentatively approved
7Heparin Sodium and Sodium
Chloride 0.9% Injection~24 Existing Products
8Sincalide (Kinevac) Lyophilized
Powder for Injection~22 Product Tentatively approved
9Ondansetron Hydrochloride
Injection~21 Existing Products
10Labetalol Hydrochloride
Injection~17 Existing products
11Imipenem and Cilastatin for
Injection, USP~14 Product filed. Awaiting approval
12Metoprolol Tartrate Injection,
USP~13 Existing products
Total ~486
11.6 12.8 17.6 22.3 27.9 33.9
10.6
37.5
26.7 25.5
21.2
FY18 FY19 FY20 FY21E FY22E FY23E
US Revenue (Rs bn) % YoY
Gland has over 12-13 molecules that are currently listed on the US FDA drug shortage list and presents a market value of close to US$ 490mn

23 Dec 2020 14
[Table_header1] Gland Pharma Ltd (GLAND IN) INITIATE WITH OUTPERFORM
#3. Leading generic injectable Capabilities
Intentionally, Gland restricted itself to that generic injectable space that suits its B2B business model well. Over time, it has expanded its presence from general sterile injectables to complex injectables, oncology, and ophthalmic products. The main focus is meeting diverse injectables needs with a stable supply of high-quality products at low cost.
We have compared its injectable capabilities with leading Indian generic front end players. In terms of execution in getting a higher market share and complexity of the products, Gland appears ahead of Indian peers. Moreover, a large part of its development has happened over the last four years. We expect Gland to expand its presence to Hormones, Peptides, Penems, oncology, steroid/opioids, and long-acting injectables very quickly.
Figure 32: Top injectable products for Gland & Indian peers (Niche products are highlighted)
Source: HTI Research, Note - Blue denotes highly complex product, Grey denotes Mid-level complex product & rest are general injectable
In ~80% of launched products, Gland has >10% market share: Our analysis of Gland’s injectable portfolio in the US suggests that Gland’s market share in ~80% of its launched portfolio is more than 10%. Although Aurobindo appears to be a close second among these Indian peers, Gland’s performance becomes more notable as most of these products are old and highly competitive.
Figure 33: Market share comparison for injectable product sold in the US market (As of Oct-20)
Source: HTI Research, USFDA, Bloomberg
Strength in heparin class of products:
Heparin: Heparin is an anticoagulant (blood thinner) that prevents the formation of blood clots. Heparin is used to treat and prevent blood clots caused by certain medical conditions or medical procedures. It is also used before surgery to reduce the risk of blood clots. Pharmaceutical-grade heparin is derived from mucosal tissues of slaughtered meat animals such as porcine (pig) intestines or bovine (cattle) lungs.
Gland Dr Reddy Sun Pharma Aurobindo
Enoxaparin Sodium Doxil Doxil Ertapenem
Daptomycin Daptomycin Testosterone Meropenem
Heparin Sodium Sumatriptan Leuprolide Acetate Pantoprazole Sodium
Vancomycin Palonosetron Ganirelix Acetate Lidocaine Hcl
Levetiracetam Phytonadione Ketorolac Tromethamine Piperacillin & Tazobactam
Caspofungin Fosaprepitant Chlorothiazide Sodium Bupicacaine
Keterolac Tromethamine Zolendronic Desmopressin Acetate Rocuronium Bromide
Voriconazole Carboprost Tromethamine Azelastine Sildenafil
Acetylcysteine Fondaparinux Sodium Medroxy Progesterone
Acetate Ropivacaine Hcl
Rocuronium Bromide Azacidine Pantoprazole Fondaparinux Sodium
Above 40% Between 20-40% Between 10-20% Below 10%
Sun Pharma n.a 12 24 65
Dr Reddy's Lab 8 17 33 42
Cipla n.a n.a n.a 100
Aurobindo 12 24 27 37
Cadila HC n.a 18 n.a 82
Gland 16 32 30 22
Company% of Injectable products with Market Share (Volume)…
We expect Gland to expand its presence to Hormones, Peptides, Penems, oncology, steroid/opiods and long acting injectables very quickly.
Our analysis of Gland’s injectable portfolio in the US suggests that Gland’s market share in ~80% of its launched portfolio is more than 10%

23 Dec 2020 15
[Table_header1] Gland Pharma Ltd (GLAND IN) INITIATE WITH OUTPERFORM
China controls ~80% of global Heparin raw material supply: The global heparin market size is estimated to be ~US$ 7bn (GMI). The US Heparin market size stands at US$ ~600mn (GMI). China is considered to be the largest player in the space due to the large consumption of pork as it contributes ~80% of the overall supply. Thus the majority of the API (Active Pharmaceutical Ingredient)for Heparin comes from China. Gland: A pioneer in heparin technology in India: Gland’s founder Mr. PVN Raju is known to be the one who pioneered the development of Heparin technology in India. Raju was able to crack the process of making pharmaceutical-grade Heparin from the livers of slaughtered cows in the 1960s. In 2010, the company launched Heparin in the US market. It currently sells in the US market via its partner, Sagent. Heparin still makes a significant contribution to revenues share for Gland. It is one of the oldest products and reasonably competitive. Thus, we expect Heparin revenues to remain steady for the next two years. Enoxaparin: Enoxaparin is used to prevent blood clots in the leg in patients on bedrest or who have a hip replacement, knee replacement, or stomach surgery. It is used in combination with aspirin to prevent angina complications (chest pain) and heart attacks. Enoxaparin is an advanced version of an older heparin product with lower molecular weight. It is produced from the same raw material. The US and EU account for more than US$1bn markets: The EU is considered the largest market for Enoxaparin with a market size of Euro 900mn (IQVIA). Generic Enoxaparin has been available in the US since 2010. Sandoz’s version of Enoxaparin was approved by the FDA in July 2010 and launched later that year. In the US, there are currently nine players in the market. Currently, the market size is ~US$ 500-600mn (GMI). Enoxaparin will be the growth driver for Gland over FY21-23E: In 2004-05, Gland first launched Enoxaparin in India & RoW market. It received its USFDA approval in 2018 and is sold through its partners Apotex and Fresenius Kabi. By FY20, Gland’s partners were able to capture only 15% of the market share. By Oct-20, it had already crossed 25%. We expect Gland to have a 35-40% market share in the coming year. Gland is also focusing on securing raw material supply to extend its grip on the heparin class of products like Enoxaparin. Building its strength in peptides, hormones, and long acting injectables: With the help of sterile API Technology, Gland has developed key products like Heterogeneous Peptide, Glatiramer Acetate, Aripiprazole, etc. Along with that, it has also developed non-infringing polymorphic forms of APIs such as Tigecycline and Pemetrexed, and oncology APIs such as Cabazitaxel, Decitabine, Azacitidine, and Pralatrexate. Over the next two years, we expect Gland to launch important products like Micafungin, Ertapenem, and Sugammadex. While complex products in peptides, hormones and long-acting injectables are likely to get commercialized from FY23 onwards, we estimate a US$ 5bn market size for such products under development. #1: Hormones: The hormone manufacturing process is one of the tedious ones among various pharma products due to highly potent products. As per the FDA, the companies need to produce potent Hormone products in a separate block. Also, most of the hormonal products are injectable due to the need to circumvent the gastro tract. There are many types of hormone treatment 1) Menopausal, 2) Androgen, 3) Growth Hormones, 4) Thyroid, 5) Glucocorticoid, 6) Insulin etc. We have listed some of the Hormones opportunities that could be tapped by Gland over the next few years.
We expect Heparin revenues to remain steady for next two years
We expect Gland to have a 35-40% market share in the coming year
Over next two years, we expect Gland to launch essential products like Micafungin, Ertapenem, and Sugammadex.

23 Dec 2020 16
[Table_header1] Gland Pharma Ltd (GLAND IN) INITIATE WITH OUTPERFORM
Figure 34: Select hormone opportunities in the US
Source: HTI Research and estimates
#2. Peptides: Peptides represent a unique class of pharmaceutical compounds that are molecularly poised between small molecules and protein. Peptides present an enormous opportunity for therapeutic intervention that closely mimics natural pathways. Some of the replacement hormones also fall in this category - products like Octeotride, Leuprorelin and Demopressin listed in Hormone products are peptide molecules. Some synthetic and synthetic analog peptides are generic and are difficult to manufacture, including Copaxone, Kyprolis, Miacalcin, etc. Also, there are several peptide related products in type 2 diabetes treatments. Figure 35: Peptide opportunities
Source: HTI Research and estimates
Molecule Brand Est Market Size (US$ mn)
Epinephrine Epipen 1,000
Octreotide Sandostatin LAR 900
Leuprorelin Lupron LAR 800
Fulvestrant Faslodex 500
Medroxyprogesterone Acetate Depo-Provera 200
Isoproterenol Hydrochloride Isuprel 150
Methylprednisolone Sodium Succinate Solu-Medrol 100
Norepinephrine Levophed 100
Carboprost Tromethamine Hemabate 55
Methylprednisolone Acetate Depo Medrol 30
Desmopressin Acetate Ddavp 21
Molecule Brand Name Est US Sales (US$ mn)
Dulaglutide Trulicity 3,600
Semaglutide Ozempic and Rybelsus 3,000
Liraglutide Victoza 2,700
Glatiramer Acetate Copaxone 1,200
Octreotide Sandostatin LAR 900
Leuprorelin Lupron LAR 800
Carfilzomib Kyprolis 600
Exenatide Bydueron 500
Calcitonin Salmon Miacalcin 180
Glucagon As Hydrochloride Glucagon As Hydrochloride 20
Complex products in peptides, hormones and long acting injectables are likely to be commercialised from FY23 onwards.
23 Dec 2020 17
[Table_header1] Gland Pharma Ltd (GLAND IN) INITIATE WITH OUTPERFORM
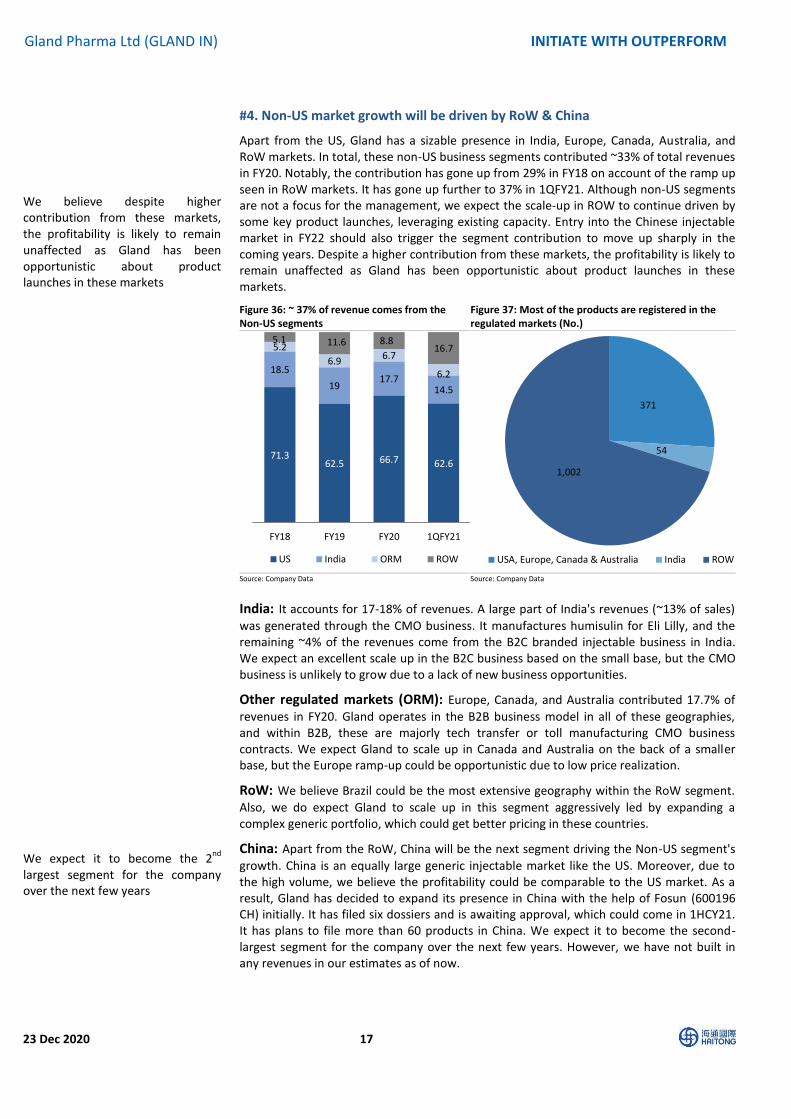
#4. Non-US market growth will be driven by RoW & China
Apart from the US, Gland has a sizable presence in India, Europe, Canada, Australia, and RoW markets. In total, these non-US business segments contributed ~33% of total revenues in FY20. Notably, the contribution has gone up from 29% in FY18 on account of the ramp up seen in RoW markets. It has gone up further to 37% in 1QFY21. Although non-US segments are not a focus for the management, we expect the scale-up in ROW to continue driven by some key product launches, leveraging existing capacity. Entry into the Chinese injectable market in FY22 should also trigger the segment contribution to move up sharply in the coming years. Despite a higher contribution from these markets, the profitability is likely to remain unaffected as Gland has been opportunistic about product launches in these markets.
Figure 36: ~ 37% of revenue comes from the Non-US segments
Figure 37: Most of the products are registered in the regulated markets (No.)
Source: Company Data Source: Company Data
India: It accounts for 17-18% of revenues. A large part of India's revenues (~13% of sales)
was generated through the CMO business. It manufactures humisulin for Eli Lilly, and the remaining ~4% of the revenues come from the B2C branded injectable business in India. We expect an excellent scale up in the B2C business based on the small base, but the CMO business is unlikely to grow due to a lack of new business opportunities.
Other regulated markets (ORM): Europe, Canada, and Australia contributed 17.7% of
revenues in FY20. Gland operates in the B2B business model in all of these geographies, and within B2B, these are majorly tech transfer or toll manufacturing CMO business contracts. We expect Gland to scale up in Canada and Australia on the back of a smaller base, but the Europe ramp-up could be opportunistic due to low price realization.
RoW: We believe Brazil could be the most extensive geography within the RoW segment.
Also, we do expect Gland to scale up in this segment aggressively led by expanding a complex generic portfolio, which could get better pricing in these countries.
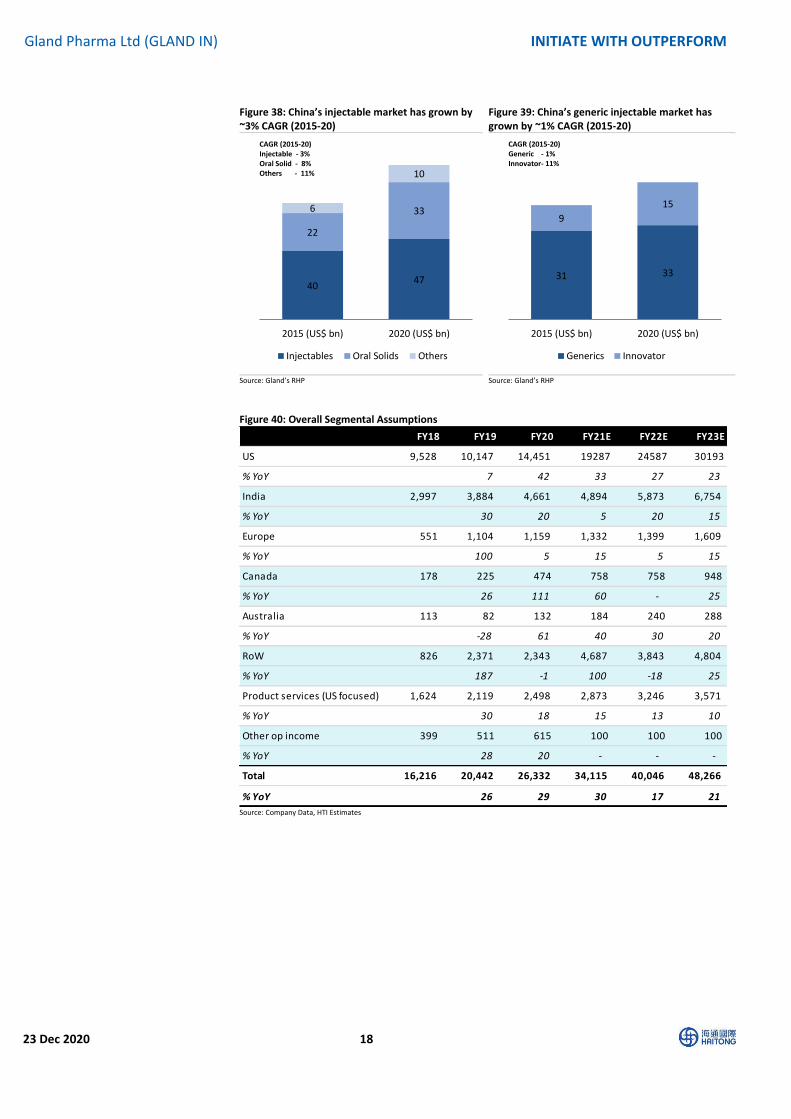
China: Apart from the RoW, China will be the next segment driving the Non-US segment's
growth. China is an equally large generic injectable market like the US. Moreover, due to the high volume, we believe the profitability could be comparable to the US market. As a result, Gland has decided to expand its presence in China with the help of Fosun (600196 CH) initially. It has filed six dossiers and is awaiting approval, which could come in 1HCY21. It has plans to file more than 60 products in China. We expect it to become the second-largest segment for the company over the next few years. However, we have not built in any revenues in our estimates as of now.
71.362.5 66.7 62.6
18.5
1917.7
14.5
5.2
6.96.7
6.2
5.1 11.6 8.816.7
FY18 FY19 FY20 1QFY21
US India ORM ROW
371
54
1,002
USA, Europe, Canada & Australia India ROW
We believe despite higher contribution from these markets, the profitability is likely to remain unaffected as Gland has been opportunistic about product launches in these markets
We expect it to become the 2nd
largest segment for the company over the next few years
23 Dec 2020 18
[Table_header1] Gland Pharma Ltd (GLAND IN) INITIATE WITH OUTPERFORM
Figure 38: China’s injectable market has grown by ~3% CAGR (2015-20)
Figure 39: China’s generic injectable market has grown by ~1% CAGR (2015-20)
Source: Gland’s RHP Source: Gland’s RHP
Figure 40: Overall Segmental Assumptions
Source: Company Data, HTI Estimates
4047
22
336
10
2015 (US$ bn) 2020 (US$ bn)
Injectables Oral Solids Others
CAGR (2015-20)Injectable - 3%Oral Solid - 8%Others - 11%
31 33
9
15
2015 (US$ bn) 2020 (US$ bn)
Generics Innovator
CAGR (2015-20)Generic - 1%Innovator- 11%
FY18 FY19 FY20 FY21E FY22E FY23E
US 9,528 10,147 14,451 19287 24587 30193
% YoY 7 42 33 27 23
India 2,997 3,884 4,661 4,894 5,873 6,754
% YoY 30 20 5 20 15
Europe 551 1,104 1,159 1,332 1,399 1,609
% YoY 100 5 15 5 15
Canada 178 225 474 758 758 948
% YoY 26 111 60 - 25
Australia 113 82 132 184 240 288
% YoY -28 61 40 30 20
RoW 826 2,371 2,343 4,687 3,843 4,804
% YoY 187 -1 100 -18 25
Product services (US focused) 1,624 2,119 2,498 2,873 3,246 3,571
% YoY 30 18 15 13 10
Other op income 399 511 615 100 100 100
% YoY 28 20 - - -
Total 16,216 20,442 26,332 34,115 40,046 48,266
% YoY 26 29 30 17 21

23 Dec 2020 19
[Table_header1] Gland Pharma Ltd (GLAND IN) INITIATE WITH OUTPERFORM
#5. Clean compliance record
Gland has seven manufacturing facilities that include two sterile injectable facilities, one
dedicated Penem facility, three API facilities, and one Oncology facility.
Vertically Integrated Supply Chain: Gland has three API manufacturing facilities that are
USFDA approved. One is an R&D pilot plant, and the other two have an annual capacity of
3,000 kg and 8,000 kg, respectively. Several of Gland's ANDAs are vertically integrated, and
the in-house APIs also support a substantial portion of their pipeline.
Clean compliance record: Being a B2B player, Gland must maintain high-quality standards
to avoid any FDA enforcement action. So far, the US FDA has been very strict with any
shortfalls of quality standards of injectable units globally and has given several warning
letters in the past. In the last 5 years, large Indian players have received six warning letters
for their injectable units. Due to Gland’s clients' repeated inspections and close
management scrutiny, Gland has maintained a clean regulatory slate, which helps Gland
get long-term contracts from major front players in the US.
Figure 42: Gland’s manufacturing units
Source: Company Data
No. Location, Facility PresentationCapacity
(Lines)
Exsisting
Capacity
(Units/annum)
Capacity
Utilisation (%)
in FY20
Key regulatory
approvals
Liquid Vials 6 240 mn 91
Lyophilizers
(7 Nos)N/A 48 mn 75
Ampoules 1 60 mn 26
Pre-filled
Syringes2 60 mn 50
Bags 2 5 mn 51
Ophthalmics 1 45 mn 17
Liquid Vials 3 132 mn 73
Lyophilizers
(3 Nos)N/A 18 mn 76
Ampoules 2 120 mn 29
Vials ( 2
Lyophilizers)1 8 mn -
Dry Powder 1 4 mn -
Liquid Vials 3 11 mn 48
Lyophilizers
(4 +1)#N/A 5 mn 24
5
Dundigal,
Hyderabad, India
(API)*
- - N/A^ -
USFDA (US),
MHRA (UK),
ANVISA (Brazil),
TGA (Australia),
BGV Hamburg
(Germany
6Vishakhapatnam,
India (API)*- - 3,000 kg/year -
USFDA (US),
ANVISA (Brazil)
7Vishakhapatnam
, India (API)*- - 8,000 kg/year -
USFDA (US),
DMA (Denmark)
USFDA (US),
AGES (Austria),
TGA (Australia),
1
2
4
Dundigal,
Hyderabad, India
(Sterile
injectables)
Pashamylaram,
Hyderabad, India
(Sterile
injectables)
Vishakhapatnam,
India (Oncology)
USFDA (US),
MHRA (UK),
ANVISA (Brazil),
TGA (Australia),
BGV Hamburg
(Germany)
USFDA (US),
GUB Munich
(Germany)
3
Pashamylaram,
Hyderabad, India
(Penems)
USFDA (US)
Figure 41: Warning letters by the USFDA in the last 5 years
Source: HTI Research
Due to repeated inspections by Gland’s clients and close management scrutiny, Gland has been able to maintain clean regulatory slate, which helps Gland to get long-term contracts from major front players in the US
Company No. of warning letters
SunP 2
Cipla 1
DRRD 1
Cadila 2
Aurobindo 0
Hikma 1
Gland 0

23 Dec 2020 20
[Table_header1] Gland Pharma Ltd (GLAND IN) INITIATE WITH OUTPERFORM
#6. Vaccine: Joker in the pack
One of the largest vial bottling capacities could be put in use: Vaccine production has several stages. First, the antigen itself is generated. Then, it is isolated from the cells used to generate it. Finally, the vaccine is formulated by adding adjuvant, stabilizers, and preservatives. The adjuvant enhances the antigen's immune response, stabilizers increase the storage life, and preservatives allow the use of multi-dose vials.
The final stage in vaccine manufacturing before distribution is fill and finish, filling vials with vaccines and packaging them for distribution. Although this is a conceptually simple part of the vaccine manufacturing process, it is often a bottleneck in distributing and administering vaccines. Gland has close to 380mn vial capacity in two large sterile plants that can be used for the fill and finish process. We believe the company would be able to at least produce a 40-50mn dosage from vacant capacity or more if Gland can optimise its production.
Fosun pharma has purchased 100mn dosages from BioNtech/Pfizer with close to 50% in bulk form, which could potentially come Gland’s way as it is one of the only large injectable subsidiaries of Fosun pharma. There could be other opportunities as well, like Moderna, Sputnik and others. All these vaccine producers are aiming to supply as many vaccines as possible to various geographies. So, any incremental bottling capacity that Gland has could come in handy for these companies.
We have found out that a typical vaccine fill and finish job accounts for 20-30% of Vaccine single dose vial COGS. Thus, we estimate for 50mn dosage of Rs 2000/dose for Pfizer/BioNtech or Rs 500/dose for a low-cost vaccine, and we estimate it could be anywhere between a Rs 4 to 15bn opportunity for Gland. We have not built these numbers into our estimates.
We believe the company would be able to at least produce a 40-50mn dosage from vacant capacity or more if Gland can optimize its production

23 Dec 2020 21
[Table_header1] Gland Pharma Ltd (GLAND IN) INITIATE WITH OUTPERFORM
#7: Led by strong business model Gland boasts robust financials
Solid top line growth to continue: In FY20, revenues grew by ~29% YoY on account of an
increase in export of key products like Daptomycin, Enoxaparin and Heparin along with 51
product launches in key regulated markets including US & Europe. With 20+ launches
expected in the US every year & expansion in RoW markets, we expect revenue to grow by
22.3% CAGR between FY20-23E.
Figure 43: Revenue is expected to grow by 22.3% CAGR (FY20-23E)
Source: Company Data, HTI Estimates
Improving product mix and business mix to drive margins: With higher utilization of high gross margin lines like Lyophilized vials, PFS, pens and Cartridges, and also improving business mix with more approvals coming in from Gland owned products, we expect the EBITDA margin to continue to expand over next 3 years and to drive 27.7% EBITDA CAGR over FY20-23E. Figure 44: EBITDA should grow by 27.7% CAGR (FY20-23E)
Source: Company Data, HTI Estimates
14.8 16.2 20.4 26.3 34.1 40.0 48.3
9.7 9.5
26.2 28.8 29.6
17.4
20.5
FY17 FY18 FY19 FY20 FY21E FY22E FY23E
Revenue (Rs bn) % Growth
6.2 5.4 7.1 9.6 14.1 15.8 19.9
42.3
33.0 34.6
36.3
41.4 39.5 41.2
FY17 FY18 FY19 FY20 FY21E FY22E FY23E
EBITDA (Rs bn) % EBITDA Margins
With 20+ launches in US and expansion in RoW, we expect revenue to grow by 22.3% CAGR (FY20-23E)
Improving product and business mix to help drive EBITDA grow by ~28% CAGR over next 3 years

23 Dec 2020 22
[Table_header1] Gland Pharma Ltd (GLAND IN) INITIATE WITH OUTPERFORM
High earnings growth, return ratios and strong B/S: Driven by 22% top line and 28% EBITDA CAGR, we expect Gland’s earnings to grow at 28% CAGR over FY20-23. Due to high profitability and low requirement of capex, the return ratios are also likely to remain healthy at ~40-50%. Gland is also likely to generate free cash flow in the range of Rs 3-7bn every year. Due to economies of scale and long term business contracts with both suppliers and front end partners, Gland boasts robust financials. Moreover, the balance sheet also looks strong with Rs 30bn+ cash on books post the IPO, which we believe could potentially be utilized to acquire new technological assets across the globe.
Figure 45: With growth in revenue and improved margins, PAT is expected to grow at ~28% CAGR (FY20-23E)
Source: Company Data, HTI Estimates
Figure 46: ROIC to remain elevated Figure 47: Leverage position to remain around current levels
Source: Company Data, HTI Estimates Source: company Data, HTI Estimates
4.1 3.2 4.7 7.7 10.6 12.7 16.1
28.0
19.8
23.1
29.4 31.0 31.7
33.3
FY17 FY18 FY19 FY20 FY21E FY22E FY23E
PAT (Rs bn) % PAT Margins
24.4
17.3
21.1
38.0
49.5 47.3
39.4
20.6
13.7 17.2
23.3 22.9 19.5 20.6
FY17 FY18 FY19 FY20 FY21E FY22E FY23E
% RoIC % RoCE
-0.3 -0.3 -0.3
-0.4
-0.5 -0.5
-0.6 -0.6
-0.5
-0.4
-0.3
-0.2
-0.1
-
FY17 FY18 FY19 FY20 FY21E FY22E FY23E
Net D/E (x)
Due to high profitability and low requirement of capex, the return ratios (ROICs) are also likely to remain healthy at ~39-50%

23 Dec 2020 23
[Table_header1] Gland Pharma Ltd (GLAND IN) INITIATE WITH OUTPERFORM
Valuation & recommendation:
We like Gland on account of: 1) Fast expanding presence in difficult to penetrate injectable space with capabilities to
take highest market share even in crowded markets at good profit margins 2) Various triggers on the horizon that includes ramp up in global enoxaparin market,
entry into China, complex product launches (ex. peptides, long acting injectables) and vaccine filling opportunity
3) Superior track record in revenue, EBITDA and earnings with respect to both B2B and front end peers
4) Robust balance sheet with Rs 30bn cash on books, healthy ROICs at ~40%, and improving free cash generation (Rs 3-7bn over FY21-23E)
Due to the hybrid model of Gland, which has B2B model advantages like economies of scale, high visibility on earnings, and fewer capital requirements along with IP rights like front end players, which enables Gland to share profits, we believe Gland’s ratios are superior to both B2B and front end companies. However, such a business model's scalability and superior returns are likely to remain restricted to the injectable/biological space. Since there is a multi-year runway for growth and abundant market opportunity, we believe Gland’s PE is likely to remain on the up-trend for some time. We value Gland at 30x (At a par with the B2B peer average of ~30.4x as of CY22E) PE on Dec-22 EPS of Rs 92.8 to arrive at a target price of Rs 2,790/sh. Initiate with an Outperform rating.
Figure 48: Peer comparison
Source: Bloomberg, HTI Estimates (marked in Grey), Note – Last updated as on 21
st Dec, 2020 (Closing)
Risks:
Due to heavy dependence on export revenue, negative forex impact could be significant
Gland’s success is dependent on their business arrangements with their marketing partners and customers for the sale of their products
Any future negative outlook from regulators esp. USFDA
Competition from future generic products
(CY15-19)/
(FY16-20)
(CY19-22E)/
(FY20-23E)
(CY15-19)/
(FY16-20)
(CY19-22E)/
(FY20-23E) FCF/EB
Net
D/E ROE
CY20E/
FY21E
CY21E/
FY22E
CY22E/
FY23E
CY20E/
FY21E
CY21E/
FY22E
CY22E/
FY23E
B2B Players
Lonza 46 11.7 6.9 23.5 11.3 34% 0.5 10.1 40.4 35.4 30.9 26.1 23.3 20.5
Catalent 17 13.8 17.7 18.6 44.6 16% 0.6 9.9 59.6 40.3 34.3 19.8 21.5 19.0
Recipharm 3 21.8 18.2 12.4 24.7 21% 0.7 6.2 50.6 32.5 26.1 16.3 14.3 13.1
Gland 5 18.2 22.4 25.2 27.6 33% -0.4 23.8 36.0 29.9 23.7 26.0 23.2 18.4
Average 16.4 16.3 19.9 27.0 26% 0.4 12.5 46.6 34.5 28.7 22.0 20.6 17.8
Front end Players
Hikma 8 11.3 4.5 17.8 -0.1 49% 0.1 25.6 20.1 17.9 16.3 12.5 11.5 10.7
SUNP 18 4.1 7.7 -4.6 14.9 36% 0.0 8.7 30.3 25.5 23.1 20.3 18.6 16.5
DRRD 11 3.1 14.0 -0.6 23.3 35% 0.0 16.6 34.4 32.5 23.4 18.3 18.5 18.2
CIPLA 8 5.9 10.1 3.3 26.4 41% 0.1 10.1 37.5 26.0 23.2 19.7 19.3 15.0
ARBP 7 13.5 8.0 8.7 12.9 201% 0.2 18.4 18.3 15.1 13.9 12.8 11.2 9.6
Average 7.6 8.9 4.9 15.5 72% 0.1 15.9 28.1 23.4 20.0 16.7 15.8 14.0
Company Market Cap
(US$ bn)
P/E EV/EBRevenue CAGR Profit CAGR CY19/FY20 Ratios
We value Gland at 30x PE on Dec-22 EPS of Rs 92.8 to arrive at a target price of Rs 2,790/sh. Initiate with an Outperform rating

23 Dec 2020 24
[Table_header1] Gland Pharma Ltd (GLAND IN) INITIATE WITH OUTPERFORM
Figure 49: Management Organization Chart
Source: HTI

23 Dec 2020 25
[Table_header2] Gland Pharma Ltd (GLAND IN) INITIATE WITH OUTPERFORM
Valuation Compendium
Source: HTI Estimates, Bloomberg (Marked in grey), Note – Last updated as on 21st Dec, 2020 (Closing)
Company
CMP
(Rs/sh)
Market Cap
(Rs bn) TP (Rs/sh) Rating (FY16-20) (FY20-23E) (FY16-20) (FY20-23E) FCF/EB Net D/E ROE FY21E FY22E FY23E FY21E FY22E FY23E
US Generics
SUNP 553 1,326 4.1 7.7 -4.6 14.9 36% 0.0 8.7 25.5 23.1 20.3 16.5 14.9 13.4
DRRD 5,069 842 6,400 Outperform 3.1 14.0 -0.6 23.3 35% 0.0 16.6 32.5 23.4 18.3 18.2 15.0 11.2
CIPLA 779 628 5.9 10.1 3.3 26.4 41% 0.1 10.1 26.0 23.2 19.7 15.0 13.8 12.1
LPC 932 422 2.4 7.3 n.a 39.6 -22% 0.3 -2.1 39.6 25.0 20.3 18.1 13.6 11.7
CDH 453 464 445 Neutral 11.1 7.8 -11.7 18.3 44% 0.6 12.3 26.4 25.0 22.0 15.8 15.3 14.0
ARBP 846 496 13.5 8.0 8.7 12.9 201% 0.2 18.4 15.1 13.9 12.8 9.6 9.1 8.4
Gland 2,320 380 2790 Outperform 18.2 22.4 25.2 27.6 33% -0.4 23.8 36.0 29.9 23.7 26.0 23.2 18.4
Average 8.3 11.0 3.4 23.3 53% 0.1 12.5 28.7 23.4 19.6 17.0 15.0 12.7
MNC peers
GLXO 1,551 263 1,790 Outperform -1.1 7.6 -0.2 18.4 8% -0.6 22.0 49.8 42.1 36.5 37.1 29.8 26.2
BOOT 15,848 337 16,800 Neutral 12.7 11.6 23.5 17.5 70% -0.9 26.7 45.7 40.9 35.1 34.0 30.6 26.0
PFIZ 5,170 237 1.9 7.3 23.0 9.2 61% -0.7 15.9 43.6 40.5 35.7 30.5 27.7 24.9
SANL 7,969 184 8.5 3.5 6.5 13.2 42% -0.5 17.8 35.5 32.3 27.9 23.8 22.4 19.6
Average 5.5 7.5 13.2 14.6 45% -0.7 20.6 43.7 38.9 33.8 31.3 27.6 24.2
India branded
TRP 2,668 451 2,450 Neutral 4.4 6.7 9.4 16.8 51% 1.1 21.5 38.6 33.6 27.7 20.2 19.4 17.4
ALKEM 2,876 344 4,400 Outperform 13.4 11.5 11.0 19.0 7% 0.1 19.4 20.6 21.8 18.1 23.6 16.1 16.5
IPCA 2,219 280 12.8 15.4 59.5 25.7 49% 0.1 17.9 24.7 24.5 21.3 18.4 18.0 15.8
NTCPH 922 168 1,090 Outperform 17.1 39.3 30.9 66.0 42% 2.2 12.7 25.9 12.9 8.1 18.3 9.9 6.5
ALPM 1,029 194 9.7 14.9 3.6 12.5 -6% 0.6 27.9 17.9 20.6 18.5 13.4 14.2 12.5
AJP 1,594 139 10.6 12.1 3.0 20.5 19% -0.1 19.3 24.6 21.2 17.4 16.1 14.5 12.5
ERIS 564 77 690 Outperform 15.8 12.0 22.0 15.0 47% -0.1 24.2 22.4 19.4 17.0 18.7 16.9 15.0
FDC 329 56 8.0 n.a 9.2 n.a. 28% 0.0 16.0 18.6 15.7 n.a. 14.0 10.6 n.a.
JBCP 1,051 81 10.2 11.0 13.7 16.8 30% 0.0 18.7 24.0 22.1 18.7 16.8 15.4 13.4
INDR 268 25 2.4 15.8 -26.3 86.8 -17% 0.2 3.6 27.4 18.2 14.0 12.8 10.1 8.3
Average 10.5 15.4 13.6 31.0 25% 0.4 18.1 24.5 21.9 19.1 16.5 14.5 12.8
CRAMS
DIVI 3,634 965 9.4 21.3 5.2 27.5 152% 0.0 19.3 50.5 42.0 34.8 35.4 29.6 24.6
SYNG 572 229 16.7 16.9 14.4 19.7 6% 0.1 19.9 57.0 46.1 35.4 33.2 26.8 21.8
Average 13.0 19.1 9.8 23.6 79% 0.0 19.6 53.7 44.0 35.1 34.3 28.2 23.2
Revenue CAGR Profit CAGR FY20 Ratios P/E EV/EB

23 Dec 2020 26
[Table_header2] Gland Pharma Ltd (GLAND IN) INITIATE WITH OUTPERFORM
Financial Statements Summary
Source: Company data, HTI estimates
Profit & Loss (Rs mn) FY19 FY20 FY21E FY22E FY23E
Total Revenues 20,442 26,332 34,115 40,046 48,266
Cost of Sales 8,570 11,020 13,305 16,419 19,548
Gross Profit 11,872 15,312 20,810 23,627 28,718
Operating Expense 4,807 5,758 6,687 7,809 8,833
EBITDA 7,065 9,555 14,124 15,818 19,885
Depreciation 821 946 1,090 1,247 1,438
Interest Expense 37 72 500 12 11
Other Income 856 1,392 1,936 2,363 2,971
Exceptional Items 200
Pre Tax Income 6,863 9,929 14,470 16,922 21,407
Tax 2,344 2,200 3,907 4,231 5,352
R - Post Tax Income 4,519 7,729 10,563 12,692 16,055
A - Post Tax Income 4,719 7,729 10,564 12,694 16,057
Key Ratios FY19 FY20 FY21E FY22E FY23E
Growth (%)
Revenue Growth 26.2 28.8 29.6 17.4 20.5
EBITDA Growth 32.0 35.2 47.8 12.0 25.7
APAT Growth 47.0 63.8 36.7 20.2 26.5
Margins (%)
Gross Margins 58.1 58.1 61.0 59.0 59.5
EBITDA Margins 34.6 36.3 41.4 39.5 41.2
Tax Rate 23.1 29.4 31.0 31.7 33.3
Profit After Tax Margins 34.2 22.2 27.0 25.0 25.0
Return Ratios (%)
RoE 17.9 23.8 22.2 19.8 20.8
ROIC 21.1 38.0 49.5 47.3 39.4
RoCE 17.2 23.3 22.9 19.5 20.6
Working Capital
Inventory (days) 162.8 104.8 113.1 114.8 113.4
Debtors (days) 90.4 83.4 85.0 85.0 85.0
Payables (days) 79.7 34.5 31.2 32.8 32.4
Cash Conversion Cycle (days) 191.4 161.2 172.4 170.9 168.7
Credit Ratio
Net D/E (x) -0.3 -0.4 -0.5 -0.5 -0.6
Valuation
P/E (x) 45.9 36.0 29.9 23.7
EV/EBITDA (x) 35.8 24.8 21.6 16.7

23 Dec 2020 27
[Table_header2] Gland Pharma Ltd (GLAND IN) INITIATE WITH OUTPERFORM
Source: Company data, HTI estimates
Balance Sheet (Rs mn) FY19 FY20 FY21E FY22E FY23E
Inventory 9,119 7,563 10,571 12,595 14,995
Debtors 5,061 6,018 7,945 9,326 11,240
Cash & Bank 7,533 13,252 29,768 37,752 47,135
Total Current Assets 23,574 28,463 50,097 61,677 75,590
Net PPE 9,297 9,681 10,691 11,544 13,106
Total Non Current Assets 11,661 12,397 13,444 14,297 15,858
Total Assets 35,235 40,860 63,541 75,974 91,449
Creditors 4,462 2,491 2,916 3,599 4,284
Total Current Liability 5,322 3,581 4,214 5,174 6,141
Non Current Liability 1,293 817 816 814 809
Total Shareholders Fund 28,620 36,462 58,511 69,985 84,499
Total Liability 35,235 40,860 63,541 75,974 91,449
Cashflow (Rs mn) FY19 FY20 FY21E FY22E FY23E
Cash flow from Operating Activities 1,853 7,009 5,696 8,952 10,970
Cash flow from Investing Activities -3,141 -7,661 -2,100 -2,100 -3,000
Cash flow from Financing Activities -76 -18 12,921 1,132 1,413
Net Cash Increase/(Decrease) -1,364 -669 16,516 7,983 9,383
Net Cash & Cash Equivalent (End) 7,533 13,252 29,768 37,752 47,135
Free Cash Flow 501 5,302 3,596 6,852 7,970

28
[Table_APPENDIX] [Table_disclaimer] APPENDIX
IMPORTANT DISCLOSURES This research report is distributed by Haitong International, a global brand name for the equity research teams of Haitong International Research Limited (“HTIRL”), Haitong Securities India Private Limited (“HSIPL”), Haitong International Japan K.K. (“HTIJKK”), Haitong International Securities Company Limited (“HTISCL”), and any other members within the Haitong International Securities Group of Companies (“HTISG”), each authorized to engage in securities activities in its respective jurisdiction.
Analyst Certification:
I, Amey Chalke, certify that (i) the views expressed in this research report accurately reflect my personal views about any or all of the subject companies or issuers referred to in this research and (ii) no part of my compensation was, is or will be directly or indirectly related to the specific recommendations or views expressed in this research report; and that I (including members of my household) have no financial interest in the security or securities of the subject companies discussed.
Conflict of Interest Disclosures
HTI and some of its affiliates may engage in investment banking and / or serve as a market maker or hold proprietary trading positions of certain stocks or companies in this research report. As far as this research report is concerned, the following are the disclosure matters related to such relationship (As the following disclosure does not ensure timeliness and completeness, please send an email to [email protected] if timely and comprehensive information is needed). Haitong Securities Co., Ltd. and/or its subsidiaries (collectively, the "Haitong") have a role in investment banking projects of 600196.CH within the past 12 months. The investment banking projects include 1. IPO projects in which Haitong acted as pre-listing tutor, sponsor, or lead-underwriter; 2. equity or debt refinancing projects of 600196.CH for which Haitong acted as sponsor, lead-underwriter or financial advisor; 3. listing by introduction in the new three board, target placement, M&A projects in which Haitong acted as lead-brokerage firm. 600196.CH is/was an investment bank clients of Haitong currently or within the past 12 months. Haitong received in the past 12 months compensation for investment banking services provided to 600196.CH. Haitong acts as a market maker or liquidity provider in the securities of 600196.CH. - HSIPL has managed the Initial Public Offer of the securities of subject company in the past twelve months. - HSIPL has received compensation for investment banking services from the subject company in the past twelve months.
Ratings Definitions (from 1 Oct 2020): Haitong International uses a relative rating system using Outperform, Neutral, or Underperform for recommending the stocks we cover to investors. Investors should carefully read the definitions of all ratings used in Haitong International Research. In addition, since Haitong International Research contains more complete information concerning the analyst's views, investors should carefully read Haitong International Research, in its entirety, and not infer the contents from the rating alone. In any case, ratings (or research) should not be used or relied upon as investment advice. An investor's decision to buy or sell a stock should depend on individual circumstances (such as the investor's existing holdings) and other considerations. Analyst Stock Ratings Outperform: The stock’s total return over the next 12-18 months is expected to exceed the return of its relevant broad market benchmark, as indicated below. Neutral: The stock’s total return over the next 12-18 months is expected to be in line with the return of its relevant broad market benchmark, as indicated below. For purposes only of FINRA/NYSE ratings distribution rules, our Neutral rating falls into a hold rating category. Underperform: The stock’s total return over the next 12-18 months is expected to be below the return of its relevant broad market benchmark, as indicated below. Benchmarks for each stock’s listed region are as follows: Japan – TOPIX, Korea – KOSPI, Taiwan – TAIEX, India – Nifty100; for all other China-concept stocks – MSCI China.
Rating Distribution

29
Haitong International Equity Research Ratings Distribution, as of September 30, 2020 Outperform Neutral Underperform (hold) HTI Equity Research Coverage 82% 15% 3% IB clients* 7% 3% 3% *Percentage of investment banking clients in each rating category. BUY, Neutral, and SELL in the above distribution correspond to our current ratings of Outperform, Neutral, and Underperform. For purposes only of FINRA/NYSE ratings distribution rules, our Neutral rating falls into a hold rating category. Please note that stocks with an NR designation are not included in the table above. Previous rating system definitions (until 30 Jun2020): BUY: The stock’s total return over the next 12-18 months is expected to exceed the return of its relevant broad market benchmark, as indicated below. NEUTRAL: The stock’s total return over the next 12-18 months is expected to be in line with the return of its relevant broad market benchmark, as indicated below. For purposes only of FINRA/NYSE ratings distribution rules, our Neutral rating falls into a hold rating category. SELL: The stock’s total return over the next 12-18 months is expected to be below the return of its relevant broad market benchmark, as indicated belo w. Benchmarks for each stock’s listed region are as follows: Japan – TOPIX, Korea – KOSPI, Taiwan – TAIEX, India – Nifty100; for all other China-concept stocks – MSCI China.
Haitong International Non-Rated Research: Haitong International publishes quantitative, screening or short reports which may rank stocks according to valuation and other metrics or may suggest prices based on possible valuation multiples. Such rankings or suggested prices do not purport to be stock ratings or target prices or fundamental values and are for information only.
Haitong International Coverage of A-Shares: Haitong International may cover and rate A-Shares that are subject to the Hong Kong Stock Connect scheme with Shanghai and Shenzhen. Haitong Securities (HS; 600837 CH), the ultimate parent company of HTISG based in Shanghai, covers and publishes research on these same A-Shares for distribution in mainland China. However, the rating system employed by HS differs from that used by HTI and as a result there may be a difference in the HTI and HS ratings for the same A-share stocks.
Haitong International Quality 100 A-share (Q100) Index: HTI’s Q100 Index is a quant product that consists of 100 of the highest-quality A-shares under coverage at HS in Shanghai. These stocks are carefully selected through a quality-based screening process in combination with a review of the HS A-share team’s bottom-up research. The Q100 constituent companies are reviewed quarterly.
IMPORTANT DISCLAIMER
For research reports on non-Indian securities: The research report is issued by Haitong International Research Limited (“HTIRL”), a wholly owned subsidiary of Haitong International Securities Group Limited (“HTISGL”) and a licensed corporation to carry on Type 4 regulated activity (advising on securities) for the purpose of the Securities and Futures Ordinance (Cap. 571) of Hong Kong, with the assistance of Haitong International (Japan) K.K. (“HTIJKK”), a wholly owned subsidiary of HTISGL and which is regulated as an Investment Adviser by the Kanto Finance Bureau of Japan.
For research reports on Indian securities: The research report is issued by Haitong Securities India Private Limited (“HSIPL”), an Indian company and a Securities and Exchange Board of India (“SEBI”) registered Stock Broker, Merchant Banker and Research Analyst that, inter alia, produces and distributes research reports covering listed entities on the BSE Limited (“BSE”) and the National Stock Exchange of India Limited (“NSE”) (collectively referred to as “Indian Exchanges”). HSIPL was acquired and became part of the Haitong International Securities Group of Compan ies (“HTISG”) on 22 December 2016.
All the research reports are globally branded under the name Haitong International and approved for distribution by Haitong International Securities Company Limited (“HTISCL”) and/or any other members within HTISG in their respective jurisdictions.
The information and opinions contained in this research report have been compiled or arrived at from sources believed to be reliable and in good faith but no representation or warranty, express or implied, is made by HTIRL, HTISCL, HSIPL, HTIJKK or any other members within HTISG from which this research report may be received, as to their accuracy, completeness or correctness. All opinions expressed herein are as of the date of this research report and are subject to change without notice. This research report is for information purpose only. Descriptions of any companies or their securities mentioned herein are not intended to be complete and this research report is not, and should not be construed expressly or impliedly as, an offer to buy or sell securities. The securities referred to in this research report may not be eligible for purchase or sale in some jurisdictions. If an investment product is denominated in a currency other than an investor's home currency, a change in exchange rates may adversely affect the investment. Past performance is not necessarily indicative of future results. Certain transactions, including those involving derivatives, give rise to substantial risk and are not suitable for all investors. You should also bear in mind that recommendations in this research report are not tailor-made for you. The analyst has not taken into account your unique financial circumstances, such as your financial situation and risk appetite. You must, therefore, analyze and s hould, where applicable, consult your own legal, tax, accounting, financial and other professional advisers to evaluate whether the recommendations suits you before investment. Neither HTISG nor any of its directors, employees or agents accepts any liability whatsoever for any direct or consequential loss arising from any use of the materials contained in this research report.
HTISG and our affiliates, officers, directors, and employees, excluding the analysts responsible for the content of this document, will from time to time have long or short positions in, act as principal in, and buy or sell, the securities or derivatives, if any, referred to in this research report. Sales, traders, and other professionals of HTISG may provide oral or written market commentary or trading strategies to the relevant clients and the companies within HTISG that reflect opinions that are contrary to the opinions expressed in this research report. HTISG may make investment decisions that are inconsistent with the recommendations or views expressed in this research report. HTI is under no obligation to ensure that such other trading decisions, ideas or recommendations are brought to the attention of any recipient of this research report.
Please refer to HTI’s website www.equities.htisec.com for further information on HTI’s organizational and administrative arrangements set up for the prevention and avoidance of conflicts of interest with respect to Research.
Non U.S. Analyst Disclosure: The HTI analyst(s) listed on the cover of this Research is (are) not registered or qualified as a research analyst with FINRA and are not subject to U.S. FINRA Rule 2241 restrictions on communications with companies that are the subject of the Research; public appearances; and trading securities by a research analyst.
30
DISTRIBUTION AND REGIONAL NOTICES
Except as otherwise indicated below, any Recipient wishing to discuss this research report or effect any transaction in any security discussed in HTI’s research should contact the Haitong International salesperson in their own country or region.
Notice to Hong Kong investors: The research report is distributed by Haitong International Securities Company Limited (“HTISCL”), which is a licensed corporation to carry on Type 1 regulated activity (dealing in securities) in Hong Kong. This research report does not constitute a solicitation or an offer of securities or an invitation to the public within the meaning of the SFO. This research report is only to be circulated to "Professional Investors" as defined in the SFO. This research report has not been reviewed by the Securities and Futures Commission. You should not make investment decisions solely on the basis of the information contained in this research report. Recipients of this research report are to contact HTISCL salespersons in respect of any matters arising from, or in connection with, the research report.
Notice to U.S. investors: As described above, this research report was prepared by HTIRL, HSIPL or HTIJKK. Neither HTIRL, HSIPL, HTIJKK, nor any of the non U.S. HTISG affiliates is registered in the United States and, therefore, is not subject to U.S. rules regarding the preparation of research reports and the independence of research analysts. This research report is provided for distribution to “major U.S. institutional investors” and “U.S. institutional investors” in reliance on the exemption from registration provided by Rule 15a -6 of the U.S. Securities Exchange Act of 1934, as amended. When distributing research reports to “U.S. institutional investors,” HTI USA will accept the responsibilities for the content of the reports. Any U.S. recipient of this research report wishing to effect any transaction to buy or sell securities or related financial instruments based on the information provided in this research report should do so only through Haitong International Securities (USA) Inc. (“HTI USA”), located at 340 Madison Avenue, 12th Floor, New York, NY 10173, USA; telephone (212) 351 6050. HTI USA is a broker-dealer registered in the U.S. with the U.S. Securities and Exchange Commission (the “SEC”) and a member of the Financial Industry Regulatory Authority, Inc. (“FINRA”). HTI USA is not responsible for the preparation of this research report nor for the analysis contained therein. Under no circumstances should any U.S. recipient of this research report contact the analyst directly or effect any transaction to buy or sell securities or related financial instruments directly through HSIPL, HTIRL or HTIJKK. The HSIPL, HTIRL or HTIJKK analyst(s) whose name appears in this research report is not registered or qualified as a research analyst with FINRA and, therefore, may not be subject to FINRA Rule 2241 restrictions on communications with a subject company, public appearances and trading securities held by a research analyst account. Investing in any non-U.S. securities or related financial instruments (including ADRs) discussed in this research report may present certain risks. The securities of non-U.S. issuers may not be registered with, or be subject to U.S. regulations. Information on such non-U.S. securities or related financial instruments may be limited. Foreign companies may not be subject to audit and reporting standards and regulatory requirements comparable to those in effect within the U.S. The value of any investment or income from any securities or related financial instruments discussed in this research report denominated in a currency other than U.S. dollars is subject to exchange rate f luctuations that may have a positive or adverse effect on the value of or income from such securities or related financial instruments. All inquiries by U.S. recipients should be directed to:
Haitong International Securities (USA) Inc. 340 Madison Avenue, 12
th Floor
New York, NY 10173 Attn: Sales Desk at (212) 351 6050
People’s Republic of China (PRC): In the PRC, the research report is directed for the sole use of those who receive the research report in accordance with the applicable PRC laws and regulations. Further, the information on the research report does not constitute "production and business activities in the PRC" under relevant PRC laws. This research report does not constitute a public offer of the security, whether by sale or subscription, in the PRC. Further, no legal or natural persons of the PRC may directly or indirectly purchase any of the security or any beneficial interest therein without obtaining all prior PRC government approvals or licenses that are required, whether statutorily or otherwise. Persons who come into possession of this research are required to observe these restrictions.
Notice to Canadian Investors: Under no circumstances is this research report to be construed as an offer to sell securities or as a solicitation of an offer to buy securities in any jurisdiction of Canada. Any offer or sale of the securities described herein in Canada will be made only under an exemption from the requirements to file a prospectus with the relevant Canadian securities regulators and only by Haitong International Securities (USA) Inc., a dealer relying on the “international dealer exemption” under National Instrument 31-103 Registration Requirements, Exemptions and Ongoing Registrant Obligations (“NI 31-103”) in Alberta, British Columbia, Ontario and Quebec. This research report is not, and under no circumstances should be construed as, a prospectus, an offering memorandum, an advertisement or a public offering of any securities in Canada. No securities commission or similar regulatory authority in Canada has reviewed or in any way passed upon this research report, the information contained herein or the merits of the securities described herein and any representation to the contrary is an offence. Upon receipt of this research report, each Canadian recipient will be deemed to have represented that the investor is an “accredited investor” as such term is defined in section 1.1 of National Instrument 45-106 Prospectus Exemptions or, in Ontario, in section 73.3(1) of the Securities Act (Ontario), as applicable, and a “permitted client” as such term is defined in section 1.1 of NI 31-103, respectively.
Notice to Singapore investors: This research report is provided in Singapore by or through Haitong International Securities (Singapore) Pte Ltd (“HTISSPL”) [Co Reg No 201306644N. HTISSPL is an Exempt Financial Adviser under the Financial Advisers Act (Cap. 110) (“FAA”) to (a) advise on securities, units in a collective investment scheme, exchange-traded derivatives contracts and over-the-counter derivatives contracts and (b) issue or promulgate research analyses or research reports on securities, exchange-traded derivatives contracts and over-the-counter derivatives contracts. This research report is only provided to institutional investors, within the meaning of Section 4A of the Securities and Futures Act (Cap. 289). Recipients of this research report are to contact HTISSPL via the details below in respect of any matters arising from, or in connection with, the research report:
Haitong International Securities (Singapore) Pte. Ltd.
10 Collyer Quay, #19-01 - #19-05 Ocean Financial Centre, Singapore 049315
Telephone: (65) 6536 1920
Notice to Japanese investors: This research report is distributed by Haitong International Japan K.K. (“HTIJKK”), which is regulated as an Investment Adviser by the Kanto Finance Bureau of Japan. This research report is solely and exclusively directed at, and made available only to “Qualified Institutional Investors” as defined in the Financial Instruments and Exchange Law of Japan.
Notice to UK and European Union investors: This research report is distributed by Haitong International Securities Company Limited. This research is directed at persons having professional experience in matters relating to investments. Any investment or investment activity to which this research relates is available only to such persons or will be engaged in only with such persons.

31
Persons who do not have professional experience in matters relating to investments should not rely on this research. Haitong International Securities Company Limited’s affiliates may have a net long or short financial interest in excess of 0.5% of the total issued share capital of the entities mentioned in this research report. Please be aware that any report in English may have been published previously in Chinese or another language.
Notice to Australian investors: The research report is distributed in Australia by Haitong International Securities (Singapore) Pte Ltd, Haitong International Securities Company Limited, and Haitong International Securities (UK) Limited in reliance on ASIC Corporations (Repeal and Transitional) Instrument 2016/396, which exempts those HTISG entities from the requirement to hold an Australian financial services license under the Corporations Act 2001 in respect of the financial services it provides to wholesale clients in Australia. A copy of the ASIC Class Orders may be obtained at the following website, www.legislation.gov.au. Financial services provided by Haitong International Securities (Singapore) Pte Ltd, Haitong International Securities Company Limited, and Haitong International Securities (UK) Limited are regulated under foreign laws and regulatory requirements, which are different from the laws applying in Australia.
Notice to Indian investors: The research report is distributed by Haitong Securities India Private Limited (“HSIPL”), an Indian company and a Securities and Exchange Board of India (“SEBI”) registered Stock Broker, Merchant Banker and Research Analyst that, inter alia, produces and distributes research reports covering listed entities on the BSE Limited (“BSE”) and the National Stock Exchange of India Limited (“NSE”) (collectively referred to as “Indian Exchanges”).
This research report is intended for the recipients only and may not be reproduced or redistributed without the written consent of an authorized signatory of HTISG.
Copyright: Haitong International Securities Group Limited 2019. All rights reserved.
http://equities.htisec.com/x/legal.html