Embed Size (px)
Citation preview
InterTubes: A Study of the US Long-haul Fiber-optic Infrastructure
1
Ram Durairajan University of Wisconsin-Madison
Paul Barford University of Wisconsin-Madison &
comScore, Inc.
Joel Sommers Colgate University
Walter Willinger NIKSUN, Inc.
ACM SIGCOMM 2015
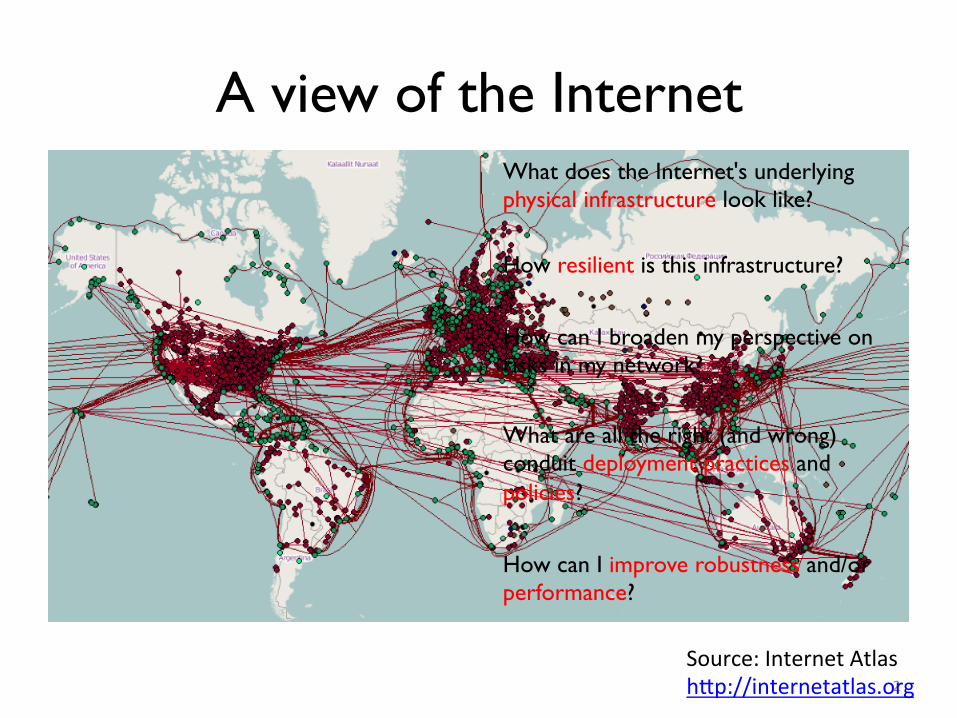
A view of the Internet
2
What does the Internet's underlying physical infrastructure look like?
How resilient is this infrastructure?
How can I broaden my perspective on risks in my network?
What are all the right (and wrong) conduit deployment practices and policies?
How can I improve robustness and/or performance?
Source: Internet Atlas h3p://internetatlas.org
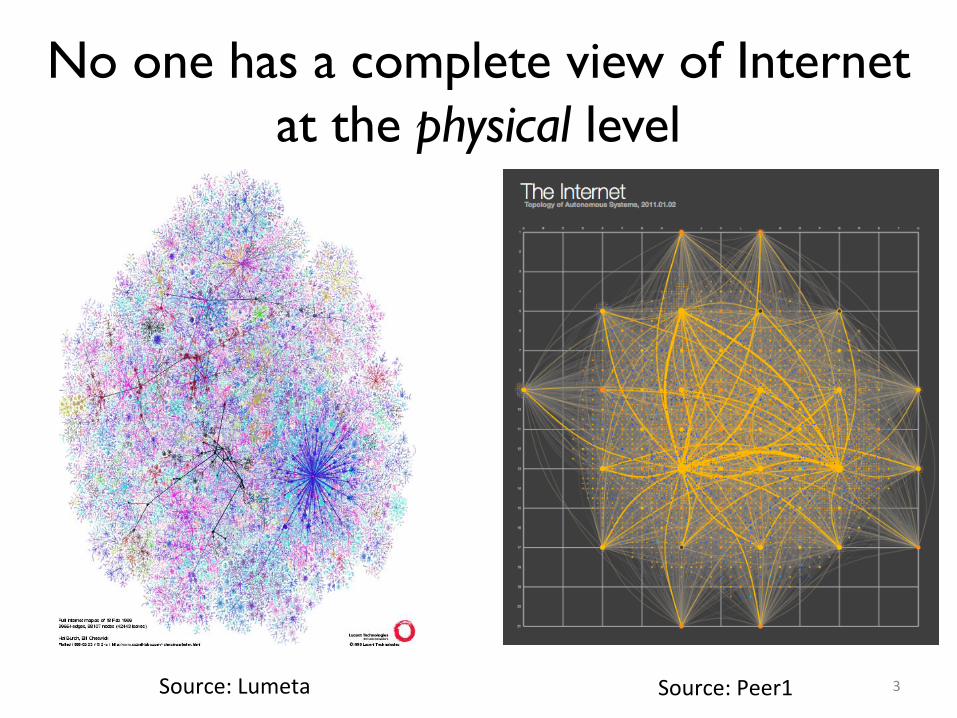
No one has a complete view of Internet at the physical level
3 Source: Lumeta Source: Peer1
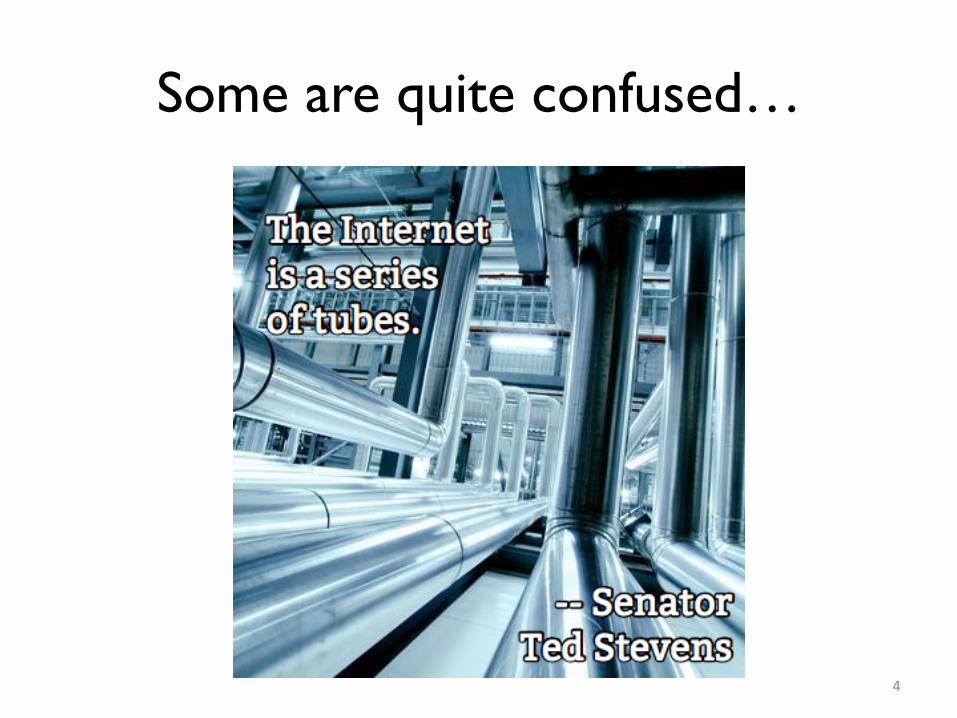
Some are quite confused…
4
InterTubes outline
• Introduction and Motivation • Process for constructing a map • Assessment of infrastructure sharing • Robustness suggestions • Implications
5
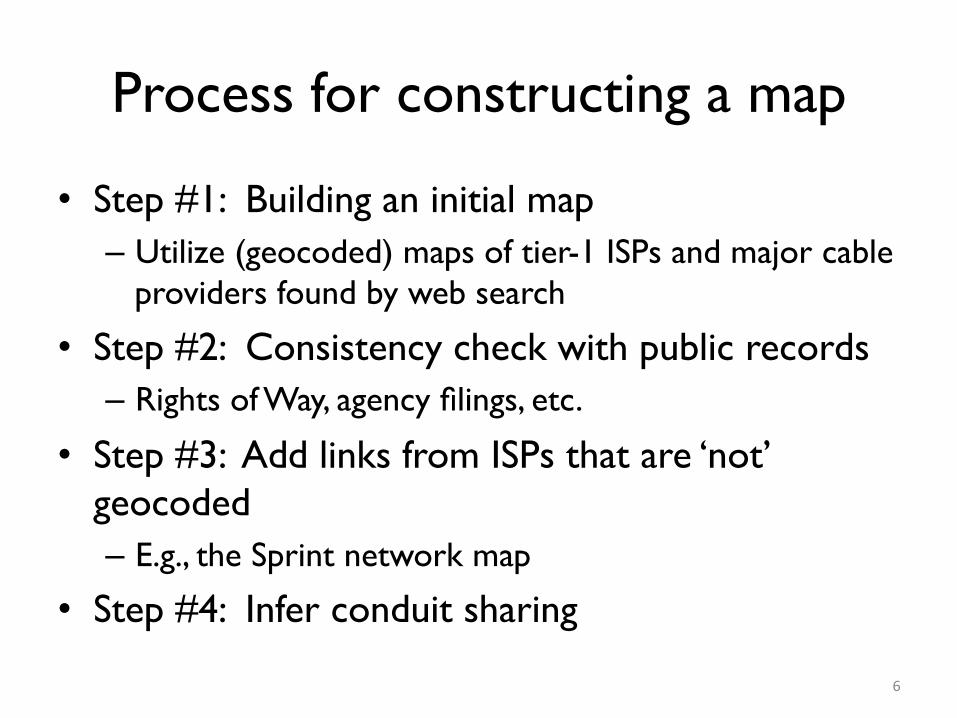
Process for constructing a map
• Step #1: Building an initial map – Utilize (geocoded) maps of tier-1 ISPs and major cable
providers found by web search
• Step #2: Consistency check with public records – Rights of Way, agency filings, etc.
• Step #3: Add links from ISPs that are ‘not’ geocoded – E.g., the Sprint network map
• Step #4: Infer conduit sharing
6
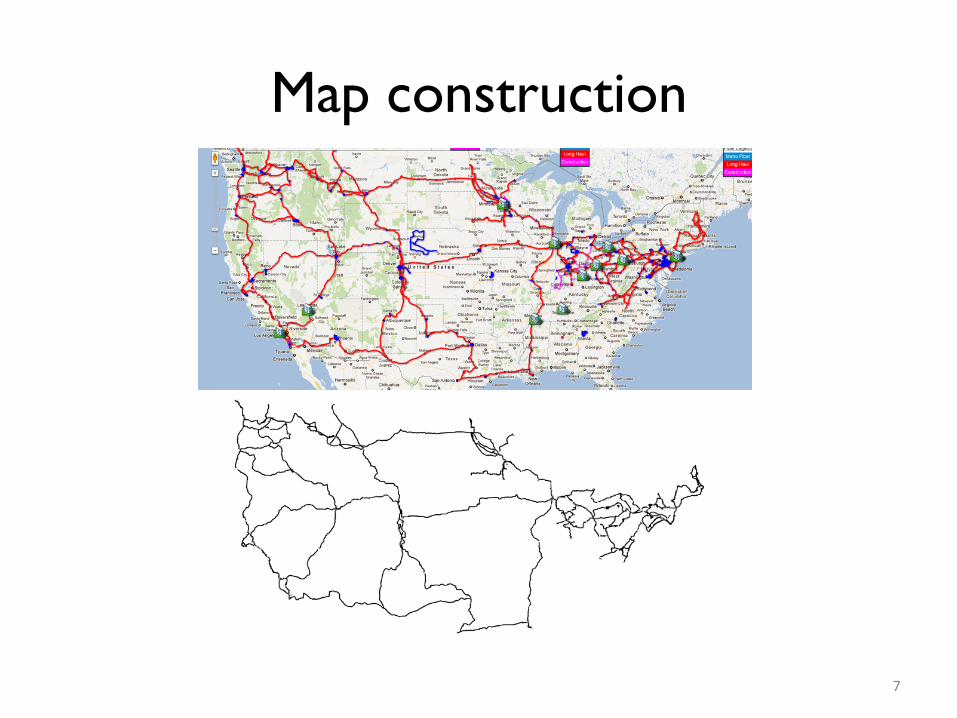
Map construction
7
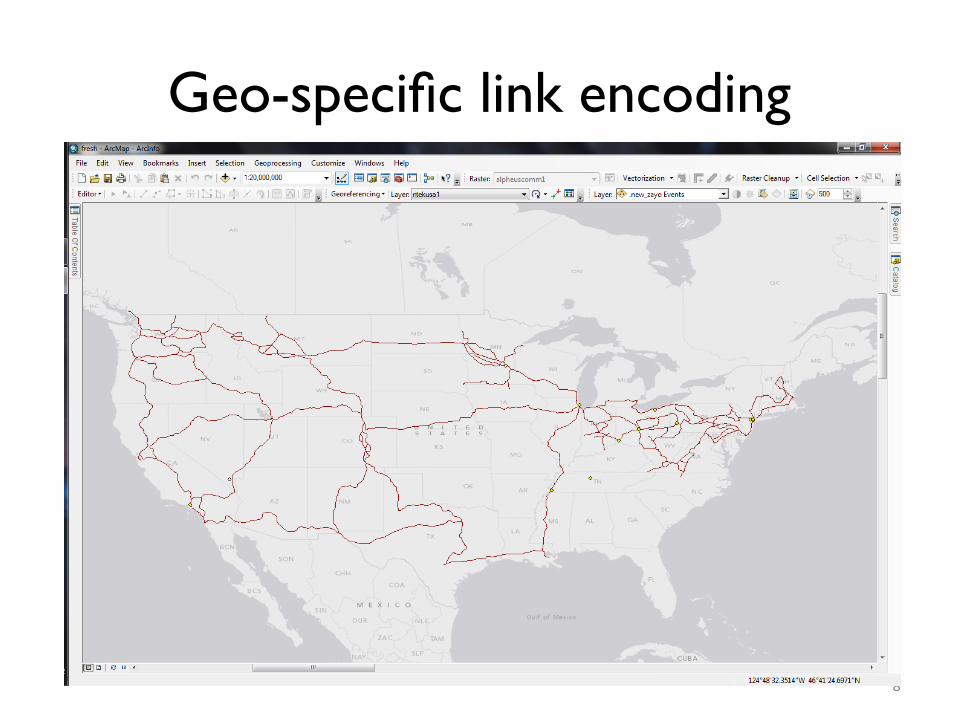
Geo-specific link encoding
8
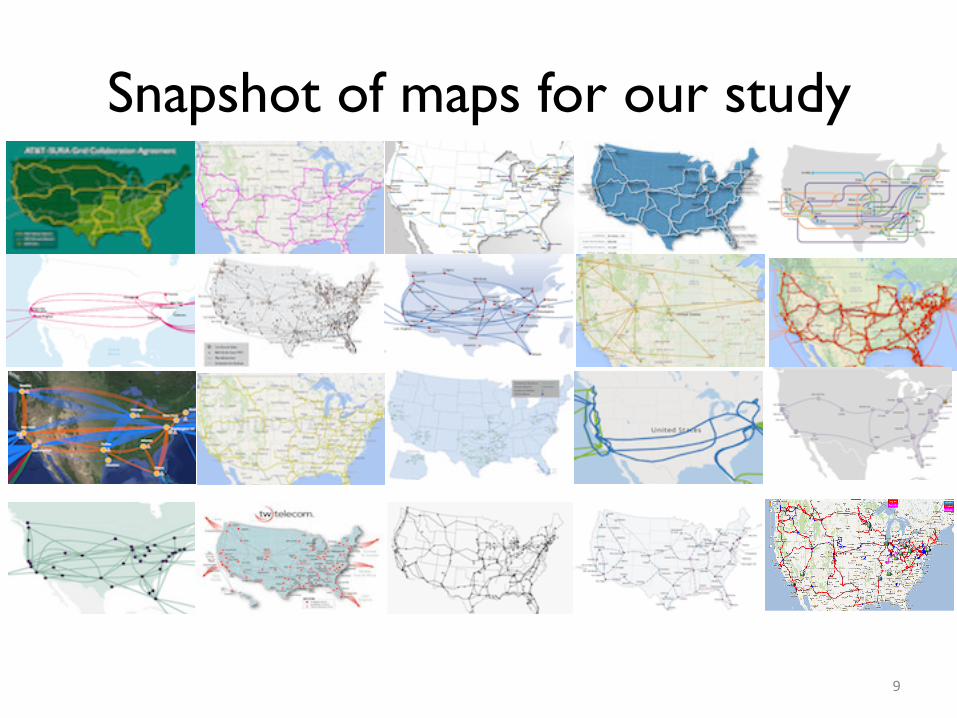
Snapshot of maps for our study
9
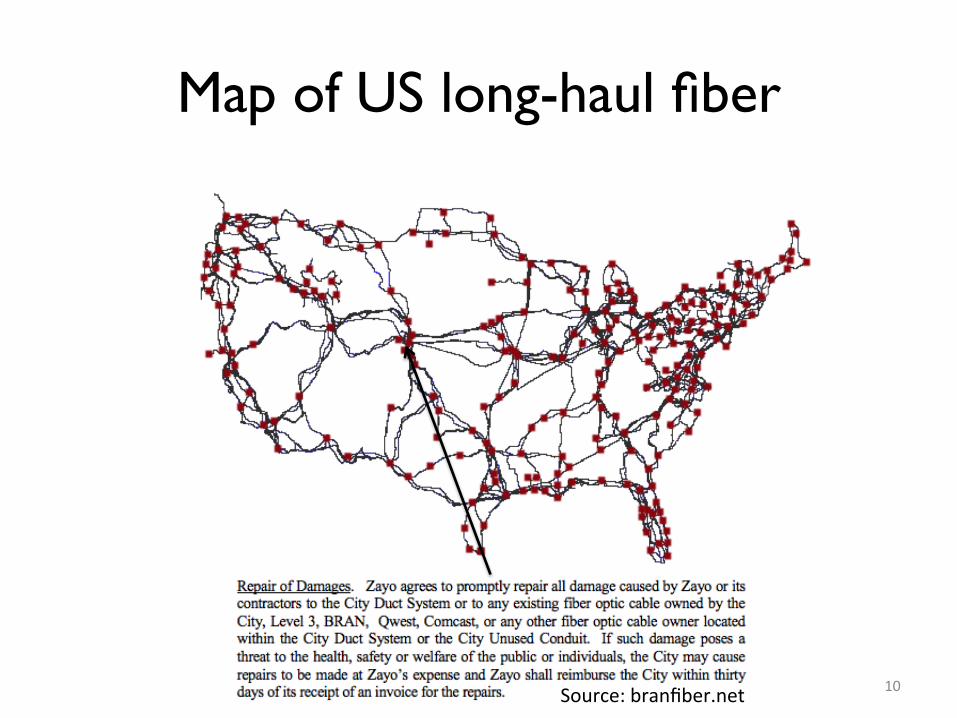
Map of US long-haul fiber
10 Source: branfiber.net
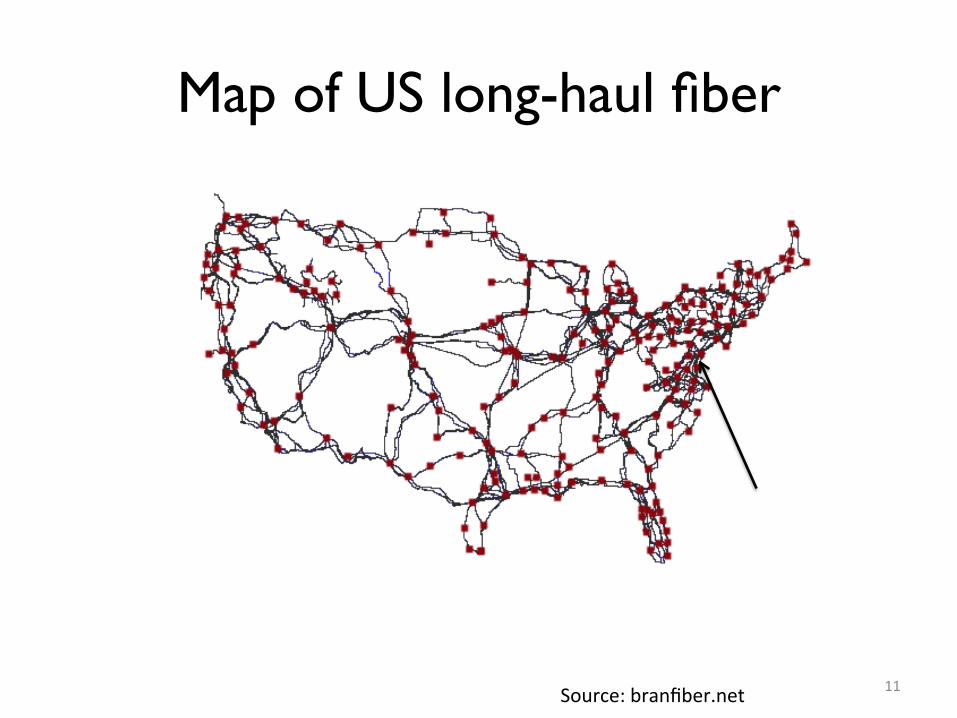
Map of US long-haul fiber
11 Source: branfiber.net
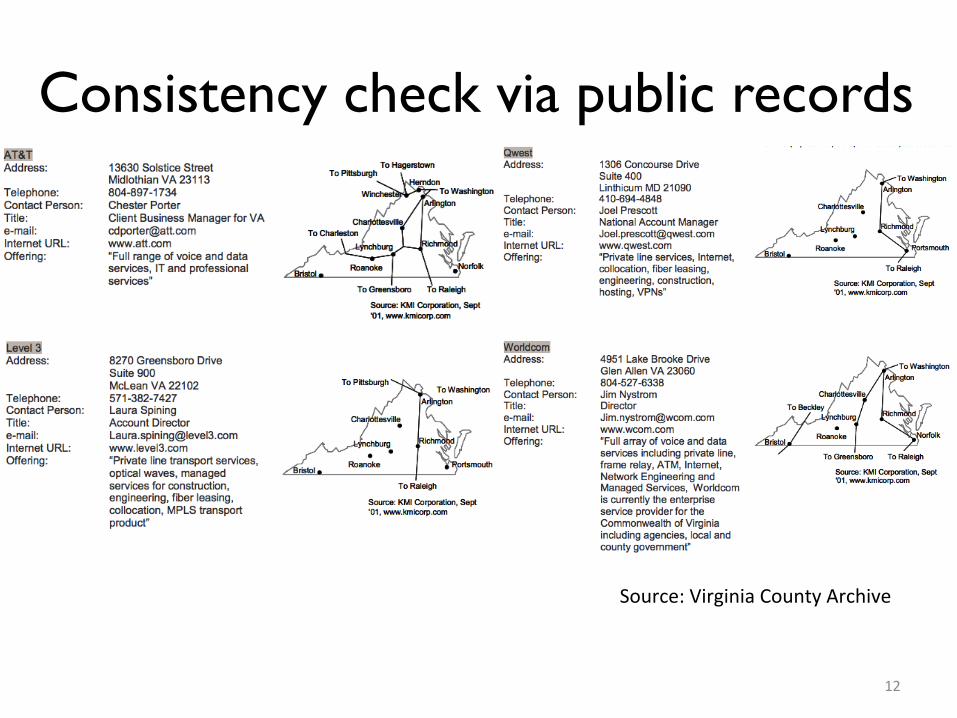
Consistency check via public records
12
Source: Virginia County Archive
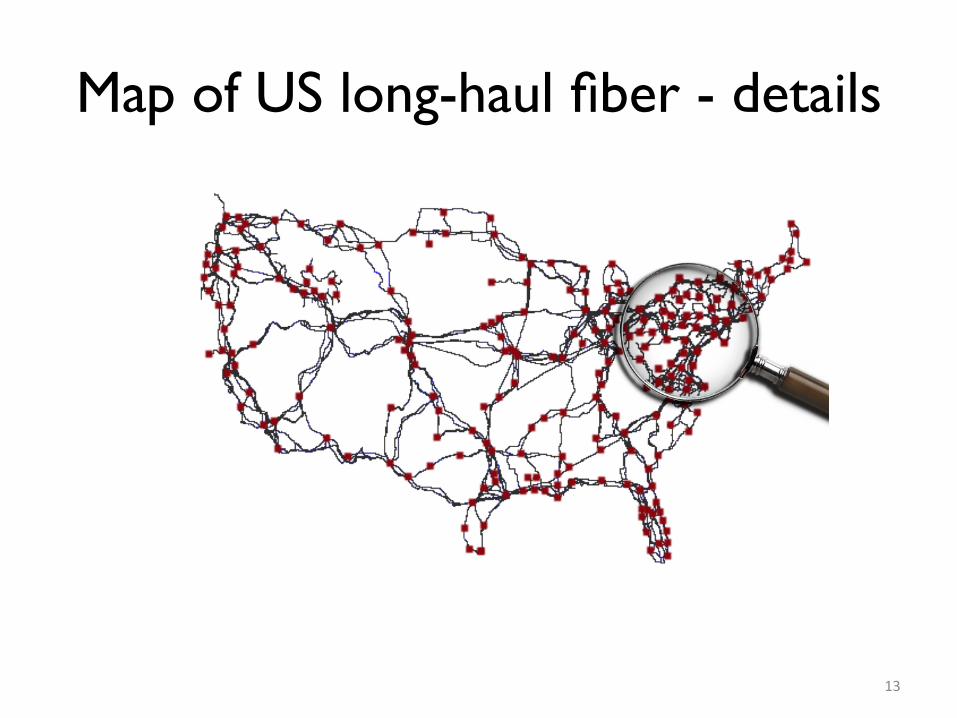
Map of US long-haul fiber - details
13
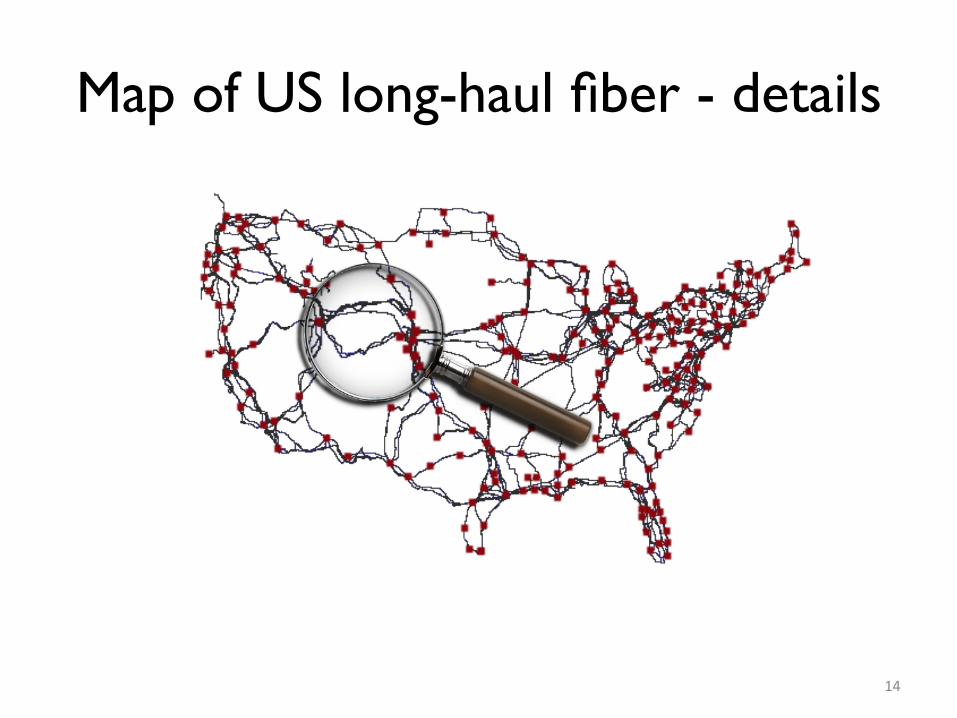
Map of US long-haul fiber - details
14
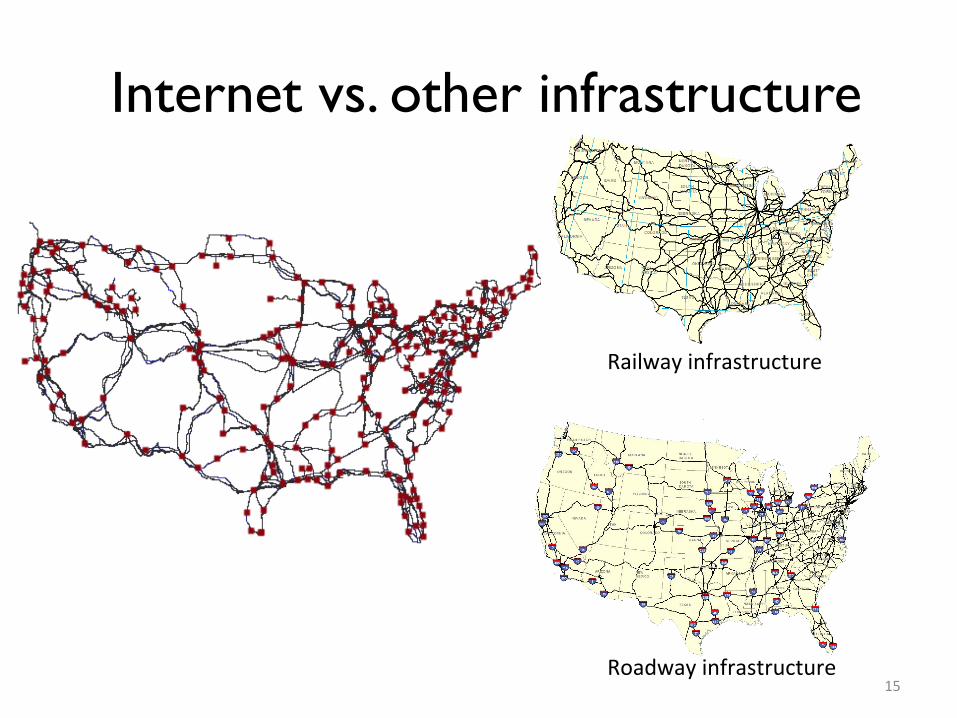
Internet vs. other infrastructure
15
Railway infrastructure
Roadway infrastructure
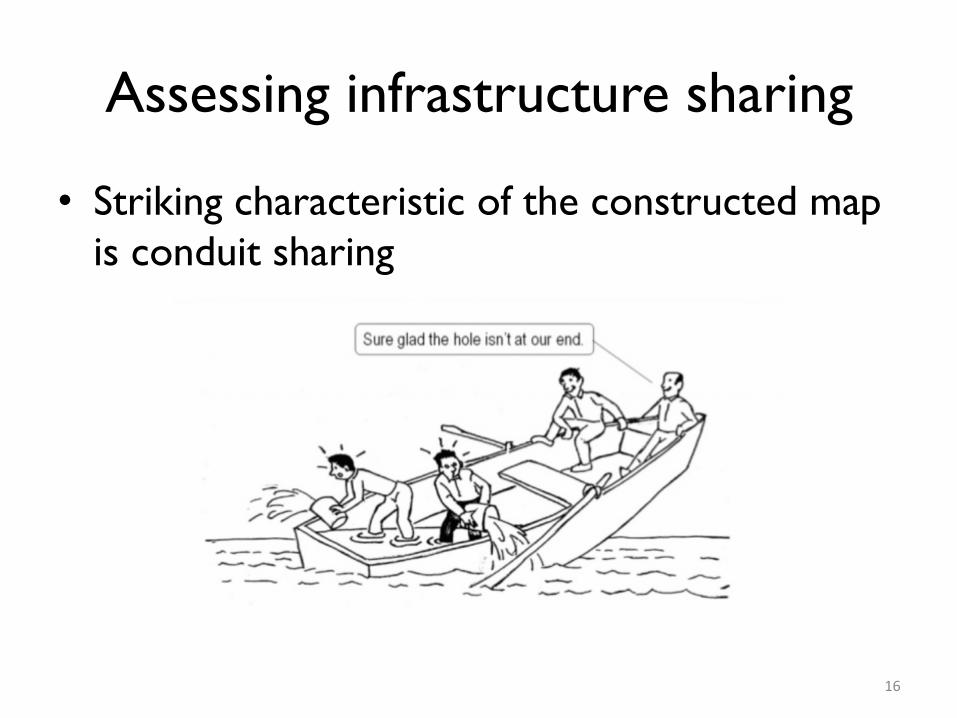
Assessing infrastructure sharing
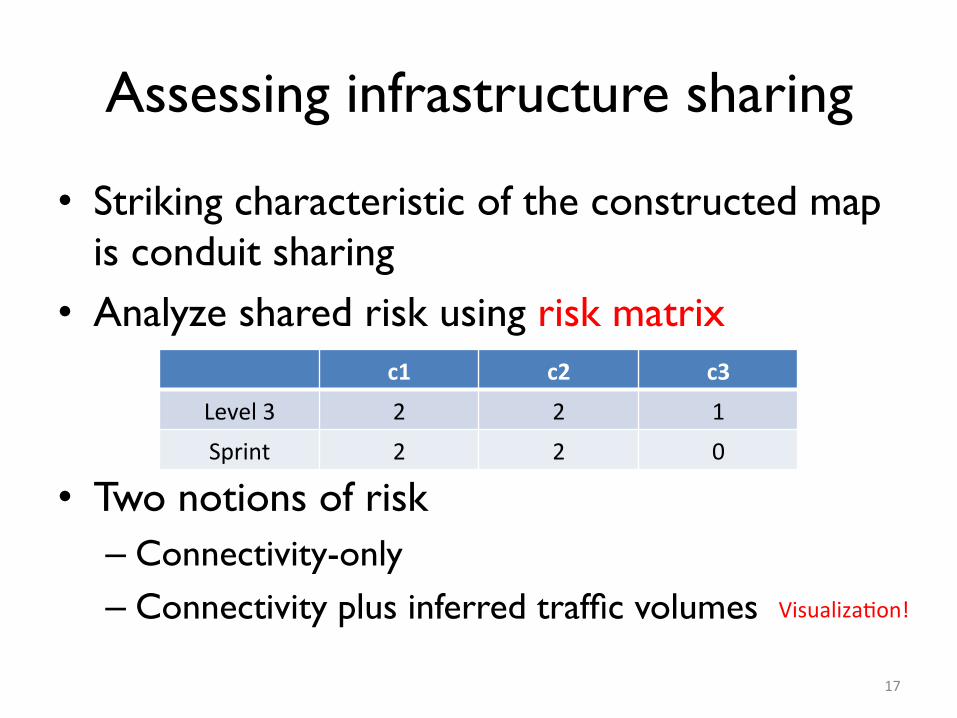
• Striking characteristic of the constructed map is conduit sharing
16
Assessing infrastructure sharing
• Striking characteristic of the constructed map is conduit sharing
• Analyze shared risk using risk matrix
• Two notions of risk – Connectivity-only – Connectivity plus inferred traffic volumes
17
c1 c2 c3 Level 3 1 1 1
c1 c2 c3 Level 3 2 2 1 Sprint 2 2 0
VisualizaOon!
Connectivity-only shared risk
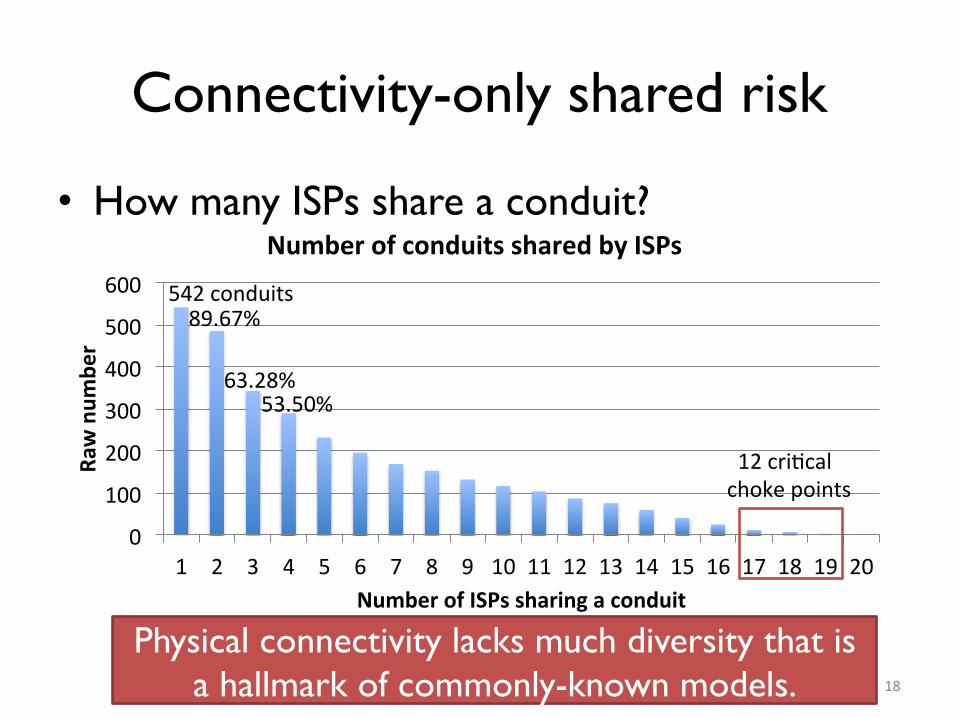
• How many ISPs share a conduit?
18
0
100
200
300
400
500
600
1 2 3 4 5 6 7 8 9 10 11 12 13 14 15 16 17 18 19 20
Raw num
ber
Number of ISPs sharing a conduit
Number of conduits shared by ISPs
542 conduits 89.67%
63.28% 53.50%
12 criOcal choke points
Physical connectivity lacks much diversity that is a hallmark of commonly-known models.
Connectivity-only shared risk
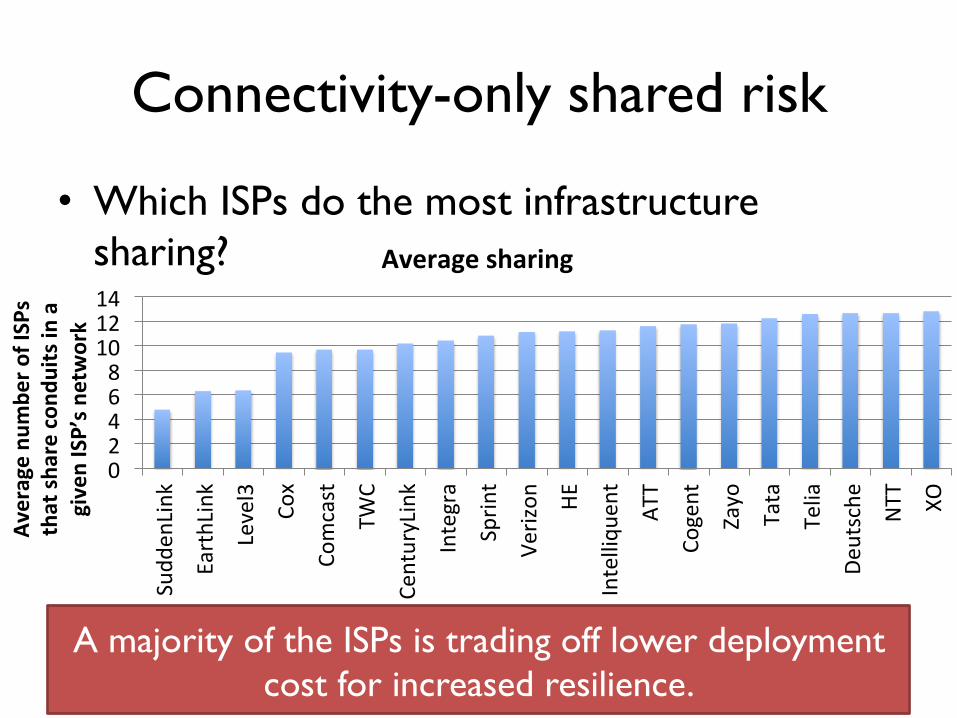
• Which ISPs do the most infrastructure sharing?
19
0 2 4 6 8 10 12 14
Sudd
enLink
EarthLink
Level3
Cox
Comcast
TWC
CenturyLink
Integra
Sprin
t
Verizon
HE
Intelliqu
ent
ATT
Cogent
Zayo
Tata
Telia
Deutsche
NTT
XO
Average nu
mbe
r of ISPs
that sh
are cond
uits in a
given ISP’s n
etwork
ISPs
Average sharing
A majority of the ISPs is trading off lower deployment cost for increased resilience.
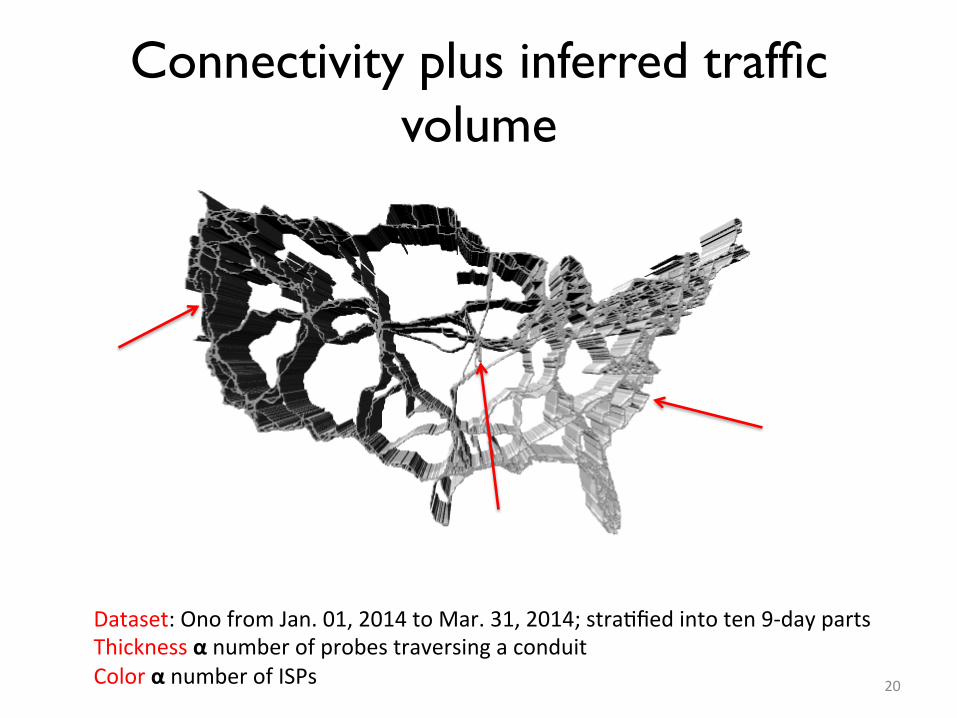
Connectivity plus inferred traffic volume
20
Dataset: Ono from Jan. 01, 2014 to Mar. 31, 2014; straOfied into ten 9-‐day parts Thickness α number of probes traversing a conduit Color α number of ISPs
Robustness suggestions
• Goal: increase robustness of infrastructure to fiber cuts, or to minimize propagation delay
• Increase network robustness – without adding new conduits
– by adding new conduits
• Minimize propagation delay – without adding new conduits – by adding new conduits
21
Robustness suggestions
• Goal: increase robustness of infrastructure to fiber cuts, or to minimize propagation delay
• Increase network robustness – without adding new conduits
– by adding new conduits
• Minimize propagation delay – without adding new conduits – by adding new conduits
22
More results in the paper!
Robustness suggestions
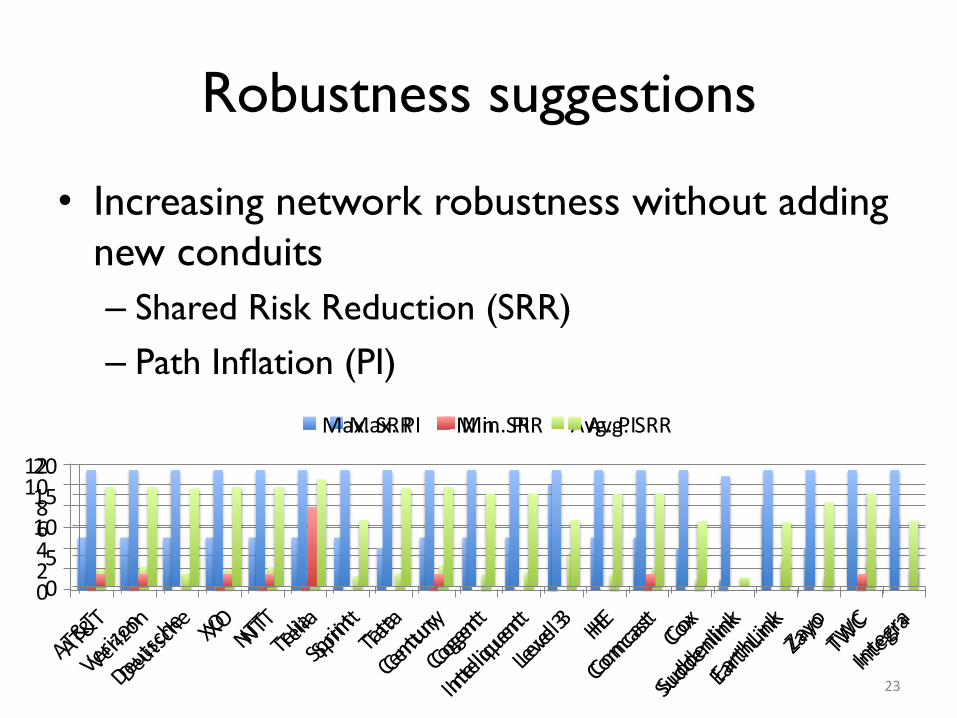
• Increasing network robustness without adding new conduits – Shared Risk Reduction (SRR)
– Path Inflation (PI)
23
0 2 4 6 8 10 12
Max. PI Min. PI Avg. PI
0 5
10 15 20
Max. SRR Min. SRR Avg. SRR
Implications for policy makers
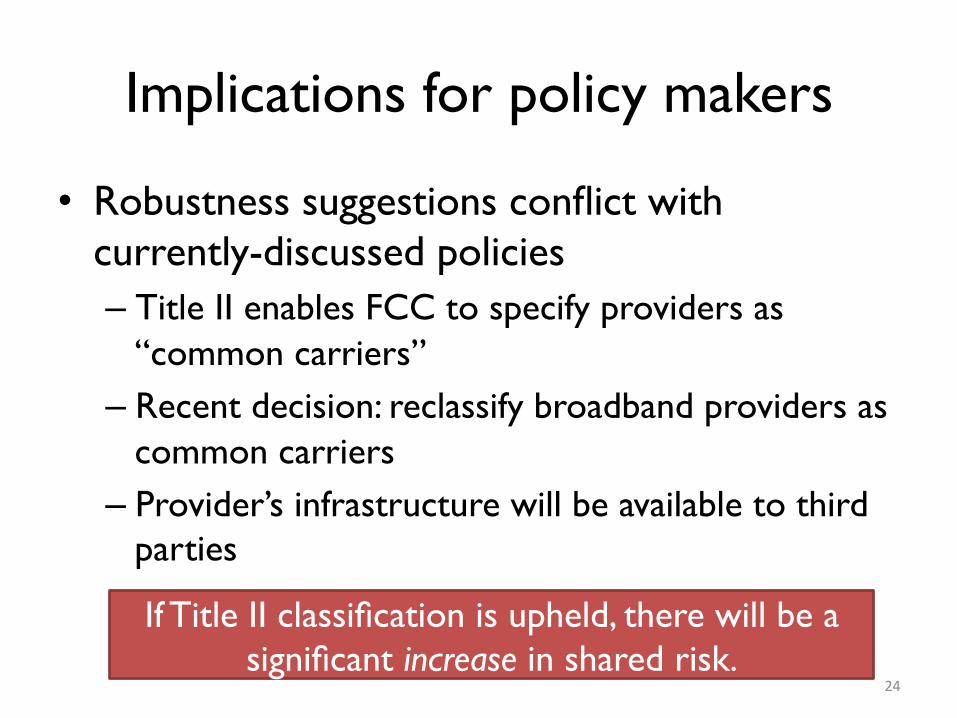
• Robustness suggestions conflict with currently-discussed policies – Title II enables FCC to specify providers as
“common carriers” – Recent decision: reclassify broadband providers as
common carriers – Provider’s infrastructure will be available to third
parties
24
If Title II classification is upheld, there will be a significant increase in shared risk.
Implications… for ISPs
• Our base map can inform: – Provisioning and management of infrastructure – Competitive insights and decisions on
deployments, peering and route selection – Regulatory and oversight activities
• Safe and accessible physical communications infrastructure
25
Exposes many critical details that are often opaque to higher layers.
Implications… for researchers
• How the conduits identified might be deployed? – From our analysis: addition of conduits at strategically-
chosen locations improves robustness – From public records: conduits are being deployed at a
steady rate based on business-related factors
• Link eXchange for conduits (like IXPs) – Compelling model for ISPs if costs are competitive
– Government support may be warranted
26
Questions?
Acknowledgement: Thank you Edgescope project (Northwestern Univ.) for Ono dataset!
Thank you!
Datasets are available to the community at www.predict.org


![0 IEEEElIEEEIIIIBBEIUBINEI0lIIII lilIII] uEEEllllEElABSTRACT-' The subject of this thesis is the design, construction anj testing of a long haul fiber-optic communication system. This](https://img.pdfslide.us/doc/110x75/614a249c12c9616cbc693966/0-ieeeelieeeiiiibbeiubinei0liiii-liliii-ueeelllleel-abstract-the-subject-of-this.jpg)