Embed Size (px)
Citation preview
Western Australian School of Mines
Impurity Rejection in the Nickel Laterite Leach System
Kai Wang
This thesis is presented for the Degree of Doctor of Philosophy
of Curtin University
September 2012

Declaration
To the best of my knowledge and belief this thesis contains no material previously
published by any other person except where due acknowledgment has been made.
This thesis contains no material which has been accepted for the award of any other
degree or diploma in any university.
Signature: … ……………………………….
Date: ………23-08-2012………………...
I
ACKNOWLEDGEMENTS
I would like to take this opportunity to acknowledge the financial support of the
Parker Cooperative Research Centre for Integrated Hydrometallurgy Solutions
(established and supported under the Australian Government’s Cooperative Research
Centres Program).
There are many people I would like to thank for helping me complete this PhD
project. First, I wish to express my most sincere gratitude to my supervisory panel:
Associate Professor Richard Browner, Dr. Jian Li and Dr. Robbie McDonald. This
thesis would not have been possible without their thoughtful guidance and
constructive suggestions. Their scientific attitudes to seeking truth have inspired me.
Thanks for helping me grow.
I am also grateful to Dr. Rob Hart, Dr. Ross Williams and Ms. Elaine Miller for their
expertise on XRD and SEM at the Centre for Materials Research (CMR), and Mr.
Peter Chapman for his assistance with FTIR at the Department of Chemistry, Curtin
University. Thanks also go to Mr. Milan Chovancek, Ms. Sophia Surin, Mr. Bruno
Latella, and Ms. Tuyen Pham from the analytical team at CSIRO Process Science
and Processing.
I wish to thank Andrew, Robert, Mike, Teresa, Warren and Neil, for providing daily
support throughout my studies. Special thanks go to my good friend, Katie Shiraishi,
for helping me in general, particularly a positive attitude towards life.
Finally, I would like to give a biggest and warmest hug to my wife, Lucy, for being
supportive, inspirational, and her unconditional love.
II
ABSTRACT
Atmospheric leaching (AL) of low-grade nickel laterite ores can produce a pregnant
leach solution (PLS) containing significant amounts of impurities such as trivalent
iron, aluminium and chromium ions. Purification of PLS by precipitation of the
impurities with an alkaline reagent often causes an associated loss of nickel. This
thesis documents an investigation of the physicochemical processes that occur during
the precipitation of iron, aluminium and chromium from both synthetic and real
nickel laterite AL leach liquors and associated nickel losses.
A chemical equilibrium model in the Fe(III)–Ni(II)–H2SO4–H2O system was
developed with the effects of ionic strength and temperature taken into account. This
model was able to calculate the concentration distribution of iron and nickel species
over the pH range from 0 to 4 and temperature from 25 to 100 °C, and predict the pH
value of the solution. In addition, the model can calculate the saturation index of iron
oxides such as goethite, ferrihydrite and schwertmannite to predict whether a specific
iron oxide will precipitate or dissolve under particular conditions. The solubility of
goethite, ferrihydrite and schwertmannite decreased substantially with increasing pH
value. Goethite, ferrihydrite and schwertmannite were all undersaturated below pH 2.
With increasing pH, ferric ions tended to precipitate first in the form of ferrihydrite
followed by goethite and schwertmannite. A mixture was formed above pH 2.5, of
which schwertmannite was the dominant phase.
Considerable effort has been put into the experimental study on the relationships
between impurities removal and nickel losses from nickel laterite AL liquors. The
precipitation experiments were conducted in either single- or multi-stage simulation
using synthetic and real PLS. For the single-stage precipitation experiments
conducted using a synthetic PLS containing Fe(III)+Ni(II), the effects of the factors
governing the iron precipitation process upon nickel losses were investigated by
statistical analysis and modelling. Temperature, pH and the initial Fe/Ni ratio in PLS
III
were found to be the important factors affecting iron removal efficiency and the level
of nickel loss to solid. These factors were studied using a three-level Box-Behnken
design combined with response surface methodology. Quadratic models were fitted
to the experimental data, to enable construction of 3D response surfaces and
corresponding contour plots. These graphs clearly demonstrated the links between
responses and the interactions of factors.
Further single-stage precipitation experiments performed using PLS containing
Fe(III)+Ni(II)+Al(III), Fe(III)+Ni(II)+Cr(III), and Fe(III)+Ni(II)+Al(III)+Cr(III)
showed that greater losses of nickel to solids occurred in the presence of aluminium
and chromium. Increasing the pH value of solution and precipitation temperature
favored the removal of iron, aluminium and chromium, but at a cost of greater nickel
losses. By carefully controlling pH and temperature using a multi-stage precipitation
process, however, the iron, aluminium and chromium can be effectively rejected with
a minimal nickel loss and desirable sludge properties. The optimum conditions for a
multi-stage precipitation process were found to be at pH 3 and 55 ºC in the first stage
followed by a second stage operated at pH 3 and 85 ºC. Using this precipitation
procedure, as much as 95% iron and chromium together with above 80% aluminium
can be removed; the level of nickel loss to the solid can be reduced to below 1%. The
sludge showed a fast settling rate of 5.05 m/h with the addition of a cationic
flocculant. Similar satisfactory results were also obtained when performing this
multi-stage precipitation procedure on real leach solutions.
The effect of water salinity on impurities removal and nickel losses was also
examined due to variable nature of process water available in Western Australia to
process nickel laterite during atmospheric leaching. This was achieved by conducting
single-stage precipitation experiments in Fe(III)+Ni(II)+Al(III)+Cr(III) systems with
various amounts of sodium chloride added. The presence of high concentration of
salts resulted in higher removal efficiencies for iron, aluminium and chromium, and
less nickel losses to the solids, particularly when the precipitation reactions were
IV
carried out at 85 ºC. XRD analysis of the residues confirmed that the poorly
structural-ordered schwertmannite and/or ferrihydrite were the dominant phases.
Natrojarosite (NaFe3(SO4)2(OH)6) can be detected when the precipitation reaction
was conducted at pH 2 and 85 ºC from synthetic solution with high salinity.
The presence of large amounts of poorly structural-ordered schwertmannite and
ferrihydrite in the iron-rich residues complicates mineralogical identification using
routine XRD technique. A comprehensive characterization was performed using a
combination of several techniques that include selective Acidified Ammonium
Oxalate (AAO) dissolution, differential XRD, SEM and FTIR spectroscopy. These
techniques in combination allowed reliable mineralogical identification for samples
containing high proportions of schwertmannite and ferrihydrite. The effects of
foreign metallic cations on the crystallization, dissolution behaviour and surface
sulphate coordination were investigated. The results suggested that the presence of
goethite in the precipitates can be identified after removing the schwertmannite
and/or ferrihydrite. Nickel, aluminium and chromium retarded the transformations of
schwertmannite and/or ferrihydrite to goethite, but aluminium and chromium
supressed the formation of 6-line ferrihydrite. Also, aluminium and chromium
influenced the symmetry of the sulphate absorbed onto the iron-rich precipitates. The
structural order of the phases became less pronounced with the presence of foreign
metallic cations, particularly aluminium and chromium. Aluminium and chromium
can strongly stabilize iron-rich precipitates making these resistant to leaching by
AAO solution. FTIR analysis confirmed the presence of goethite in the bi-metallic
precipitates and suggested that the sulphate is present to a greater extent in lower
symmetry environments.
V
TABLE OF CONTENTS
ACKNOWLEDGEMENTS ........................................................................................ I
ABSTRACT ............................................................................................................... II
TABLE OF CONTENTS .......................................................................................... V
LIST OF FIGURES ................................................................................................. XI
LIST OF TABLES .................................................................................................. XV
CHAPTER 1: INTRODUCTION ............................................................................. 1
1.1 THE ISSUE .................................................................................................... 1
1.2 THESIS AIMS ................................................................................................ 3
1.3 THESIS STRUCTURE ...................................................................................... 4
CHAPTER 2: LITERATURE REVIEW ................................................................. 6
2.1 IRON REMOVAL IN HYDROMETALLURGICAL PROCESSING ............................ 6
2.2 IRON HYDROLYSIS CHEMISTRY AND PRECIPITATION PATHWAYS ................. 10
2.3 CRYSTALLIZATION AND PRECIPITATION THEORY ......................................... 13
2.3.1 Nucleation and growth ................................................................................................... 14
2.3.2 Secondary processes....................................................................................................... 16
2.4 NICKEL LOSS DURING IRON PRECIPITATION................................................ 19
2.5 PRECIPITATION METHODS .......................................................................... 21
2.6 EXPERIMENTAL STRATEGY ......................................................................... 23
2.7 SUMMARY ................................................................................................. 23
VI
CHAPTER 3: CHEMICAL MODELLING OF THE Fe(III)-Ni(II)-H2SO4-H2O SYSTEM ................................................................................................................... 26
3.1 INTRODUCTION ......................................................................................... 26
3.2 SOLUTION CHEMICAL MODEL .................................................................... 28
3.2.1 Specify Fe3+ and Ni2+ species in sulphuric solutions .......................................................... 28
3.2.2 Bisulphate/sulphate equilibrium and activity of hydrogen ion ......................................... 30
3.2.3 Calculation of pH value of solution .................................................................................. 33
3.2.4 Equilibrium constants as a function of ionic strength ...................................................... 34
3.2.5 Extrapolation to elevated temperature ........................................................................... 37
3.2.6 Saturation index ............................................................................................................. 41
3.3 RESULTS AND DISSCUSION ......................................................................... 44
3.3.1 Solving the model equations ........................................................................................... 44
3.3.2 Ferric iron and nickel speciation ...................................................................................... 48
3.3.3 Predicting solution pH .................................................................................................... 53
3.3.4 Saturation index ............................................................................................................. 56
3.4 CONCLUSION ............................................................................................. 58
Nomenclature ..................................................................................................... 59
CHAPTER 4: THE EFFECT OF IRON PRECIPITATION UPON NICKEL LOSSES FROM SYNTHETIC ATMOSPHERIC NICKEL LATERITE LEACH SOLUTIONS ............................................................................................................ 62
4.1 INTRODUCTION ......................................................................................... 62
4.2 EXPERIMENTAL SETUP AND PROCEDURES ................................................. 63
VII
4.3 PRELIMINARY EXPERIMENTS ..................................................................... 65
4.4 STATISTICAL EXPERIMENTAL DESIGN .......................................................... 65
4.4.1 Fractional Factorial Design (FFD) ..................................................................................... 65
4.4.2 Box Behnken Design (BBD) ............................................................................................. 68
4.5 RESULTS AND DISCUSSION ......................................................................... 70
4.5.1 Preliminary experiments ................................................................................................ 70
4.5.1.1 The effect of reaction and ageing time ................................................................................... 70
4.5.1.2 The effect of gypsum formation on nickel loss ....................................................................... 71
4.5.2 Fractional factorial design (FFD) ...................................................................................... 72
4.5.3 Box-Behnken design (BBD) ............................................................................................. 77
4.5.4 Process optimization and model prediction .................................................................... 85
4.5.5 XRD analysis of the precipitates ...................................................................................... 87
4.6 CONCULSION ............................................................................................. 89
CHAPTER 5: IRON, ALUMINIUM AND CHROMIUM CO-REMOVAL FROM SYNTHETIC AND REAL ATMOSPHERIC NICKEL LATERITE LEACH SOLUTIONS ............................................................................................. 91
5.1 INTRODUCTION ......................................................................................... 91
5.2 EXPERIMENTAL .......................................................................................... 95
5.2.1 Single-stage precipitation ............................................................................................... 95
5.2.2 Multi-stage precipitation ................................................................................................ 95
5.2.3 Flocculant preparation and settling rate test ................................................................... 96
5.3 RESULTS AND DISCUSSION ......................................................................... 97
VIII
5.3.1 Single-stage precipitation experiments ........................................................................... 97
5.3.2 Statistically-designed experiments .................................................................................. 99
5.3.3 Multi-stage precipitation experiments .......................................................................... 103
5.4 CONCLUSION ............................................................................................ 113
CHAPTER 6: THE EFFECT OF WATER SALINITY ON IRON, ALUMINIUM AND CHROMIUM CO-REMOVAL AND ASSOCIATED NICKEL LOSSES 115
6.1 INTRODUCTION ........................................................................................ 115
6.2 EXPERIMENTAL ......................................................................................... 118
6.3 RESULTS AND DISCUSSION ........................................................................ 119
6.3.1 Preliminary precipitation experiments .......................................................................... 119
6.3.2 Statistically-designed experiments ................................................................................ 122
6.3.3 XRD analysis of the precipitates .................................................................................... 129
6.4 CONCLUSION ............................................................................................ 132
CHAPTER 7: CHARACTERIZATION OF IRON-RICH PRECIPITATES .. 134
7.1 INTRODUCTION ........................................................................................ 134
7.2 EXPERIMENTAL AND ANALYTICAL METHODS ............................................ 136
7.3 RESULTS AND DISCUSSION ........................................................................ 137
7.3.1 Chemical compositions and mineralogical properties of iron-rich precipitates ............... 137
7.3.2 Selective AAO dissolution of iron-rich precipitates ........................................................ 140
7.3.2.1 Dissolution kinetics ............................................................................................................... 140
7.3.2.2 Dissolution process revealed by SEM images ....................................................................... 143
7.3.2.3 Congruency of metal(s) dissolution with iron ...................................................................... 145
IX
7.3.2.4 Changes in iron to sulphur ratios ......................................................................................... 147
7.3.3 Mineralogical changes due to selective AAO dissolution ............................................... 148
7.3.3.1 XRD and DXRD analysis ........................................................................................................ 148
7.3.3.2 FTIR analysis ........................................................................................................................ 152
7.4 CONCLUSION ............................................................................................ 157
CHAPTER 8: SUMMARY AND FUTURE WORK ........................................... 158
8.1 SUMMARY ................................................................................................ 158
8.1.1 Chemical Equilibrium .................................................................................................... 158
8.1.2 Impurity removal and nickel loss .................................................................................. 159
8.1.3 Characterization of iron-rich precipitates ...................................................................... 160
8.2 FUTURE WORK ......................................................................................... 161
8.2.1 Chemical equilibrium modelling in concentrated solutions ............................................ 162
8.2.2 Improving the crystallization of iron-rich precipitates ................................................... 163
8.2.3 The effect of magnesium ions ....................................................................................... 165
8.2.4 The effect of ferrous ions .............................................................................................. 165
8.2.5 Improving dewatering and sludge properties ................................................................ 166
8.2.6 Test work using other neutralization agents .................................................................. 166
8.2.7 Nickel speciation within the iron-rich precipitates ......................................................... 166
8.2.8 The mechanism of iron oxides formation ...................................................................... 167
REFERENCES ....................................................................................................... 169
APPENDIX A: Computer Program for Chemical Equilibrium Study ............. 195

X
APPENDIX B: Box-Behnken Design ................................................................... 202
PUBLICATIONS .................................................................................................... 204
XI
LIST OF FIGURES
Figure 2.1: Stability regions of different iron precipitated phases (After Babčan
(1971)). ...……………………………………………………………………………..6
Figure 2.2: Simplified schematic presentation of various iron removal processes
(After Allen et al. (1970), Bodson (1972), Gordon and Pickering (1975), Dutrizac
(1987), Claassen (2002) and Loan et. al. (2006)). ………………………………….. 8
Figure 2.3: Change in Gibbs free energy during nucleation (After Mullin
(2001)). ………………………………………………………………………….…..15
Figure 2.4: Dissolution-recrystallization processes for phase transformation in
aqueous solution (After Blesa and Matijević (1989)). ..…………………………….18
Figure 2.5: Simplified schematic presentations of different reactors for precipitation
reactions. ..…………………………………………………………………………..22
Figure 3.1: Flowchart of the calculation procedures. ………………………………48
Figure 3.2: Ferric ions speciation diagram at 25 ºC as a function of pH. The
simulated solution contains total dissolved Fe3+ of 0.015 mol and Ni2+ of 0.0025 mol.
The pH value is adjusted by varying the total sulphate
concentration. ……………………………………………………………………… 50
Figure 3.3: Nickel ions speciation diagram at 25 ºC as a function of pH. The
simulated solution contains total dissolved Fe3+ of 0.015 mol and Ni2+ of 0.0025 mol.
The pH value is adjusted by varying the total sulphate concentration. ……………. 51
Figure 3.4: Distribution of ferric species as a function of temperature for a solution
containing total dissolved Fe3+ of 0.015 mol, Ni2+ of 0.0025 mol and SO42− of 0.05
mol. ………………………………………………………………………………… 51
XII
Figure 3.5: Distribution of nickel species as a function of temperature for a solution
containing total dissolved Fe3+ of 0.015 mol, Ni2+ of 0.0025 mol and SO42− of 0.05
mol. ………………………………………………………………………………… 52
Figure 3.6: Experimental measured and model predicted pH values of solution
containing 0.01 mol Fe3+, 0.01 mol Ni2+ and 0.025 mol SO42– as a function of
temperature. ………………………………………………………………………... 54
Figure 3.7: Saturation Index of goethite, ferrihydrite and schwertmannite at 25 ºC, as
a function of pH values of solution containing 0.015 mol Fe3+ and 0.0025 mol
Ni2+. ………………………………………………………………………………... 57
Figure 4.1: Schematic diagram of semi-batch experimental equipment. ………….. 64
Figure 4.2: Half-normal probability plots for iron removal efficiency (%). ………. 73
Figure 4.3: Half-normal probability plots of the effects for Log (nickel loss (%)). .. 74
Figure 4.4: The Box-Cox plots used to determine the power transformation applied to
the data for nickel loss (%). ………………………………………………………...76
Figure 4.5: Response surface graphs (left) and corresponding contour plots (right)
showing the effects of interaction of pH and Temperature on iron removal efficiency
(%) ((a) Fe/Ni=6; (b) Fe/Ni=12; (c) Fe/Ni=18). …………………………………....82
Figure 4.6: Response surface graphs (left) and corresponding contour plots (right)
showing the effects of interaction of pH and Temperature on nickel loss (%) ((a)
Fe/Ni=6; (b) Fe/Ni=12; (c) Fe/Ni=18). ……………………………………………..83
Figure 4.7: Response surface graphs (left) and corresponding contour plots (right)
showing the effects of interaction of Temperature and Fe/Ni ratio on nickel loss (%)
((a) pH=2; (b) pH=3; (c) pH=4). ……………………………………………………84
Figure 4.8: X-ray diffraction patterns of the final precipitates obtained from various
XIII
experimental conditions. The stick representations are those of the standard
patterns. ……………………………………………………………………………..88
Figure 5.1: Typical titration curve of an acidic mine water. The inset shows the
correction between the acidity released during titration of water from an acidic mine
pit lake to a target pH value of 8.3 and respective concentrations of major cations
(Fe(III)+Al+Fe(II)+Cu+Zn+Mn) (After España (2007)). …………………………..92
Figure 5.2: Precipitation of heavy metals as hydroxides (After Zinck (1993)). ……93
Figure 6.1: Response surface graphs (left) and corresponding contour plots (right)
showing the effects of interaction of pH and temperature on nickel loss (%) ((a) NaCl
Concentration=30 g/L; (b) NaCl Concentration=90 g/L; (c) NaCl Concentration=150
g/L). Red dots refer to experimental points. ………………………………………128
Figure 6.2: XRD patterns of precipitates formed from synthetic leach solutions under
various experimental conditions ((a) sample FNAC-5, pH=3, 85 ºC and 0 g/L NaCl ,
(b) sample ES-7, pH=3, 85 ºC and 30 g/L NaCl, (c) sample ES-8, pH=3 and 85 ºC,
90 g/L NaCl, (d) sample ES-9, pH=3, 85 ºC and 150 g/L NaCl). The standard JCPDS
patterns are given as vertical lines at the bottom of XRD patterns. ……………….130
Figure 6.3: XRD patterns of precipitates formed from synthetic leach solutions ((a)
sample ES-12, pH=4, 85 ºC and 90 g/L NaCl, (b) sample ES-8, pH=3, 85 ºC and 90
g/L NaCl, (c) sample ES-19, pH=2, 85 ºC and 90 g/L NaCl). The standard JCPDS
patterns are given as vertical lines at the bottom of XRD patterns. ……………….131
Figure 7.1: X-Ray Diffraction (XRD) patterns of the synthetic 6-line ferrihydrite (6L-
Fh), schwertmannite (Sh), single-metallic samples (F-1 and F-2), bi-metallic samples
(FN-2 and FN-4), and multi-metallic samples (FNAC-2 and FNAC-6). The standard
JCPDS patterns are given as vertical lines at the bottom of XRD patterns.
Abbreviation: Gt=goethite. ………………………………………………………..139
XIV
Figure 7.2: Dissolution curves of bi-metallic and multi-metallic precipitates obtained
at different temperatures: (a) 25 ºC and (b) 85 ºC. Lines represent the modelled curve
fits. ………………………………………………………………………………...141
Figure 7.3: SEM images of bi-metallic and multi-metallic precipitates before and
after AAO dissolution: sample FN-2 after 0 (a), 120 (b) and 240 min (c) AAO
dissolution; sample FN-4 after 0 (d), 60 (e) and 120 min (f) AAO dissolution; sample
FNAC-2 after 0 (g), 120 (h) and 240 min (i) AAO dissolution; sample FNAC-6 after
0 (j), 60 (k) and 120 min (l) AAO dissolution. The scale bar in each image
corresponds to a distance of 1µm. ………………………………………………...145
Figure 7.4: Congruent dissolution of iron and metal(s): (a) and (b) for bi-metallic
samples FN-2 and FN-4, respectively; (c) and (d) for multi-metallic samples FNAC-
2 and FNAC-6, respectively. The unit slope, represented as dash line, indicates
congruent dissolution of both iron and metal(s). ………………………………….147
Figure 7.5: Changes in Fe/S mole ratios of AAO solution as a function of dissolution
time for bi-metallic and multi-metallic samples obtained at different temperatures: (a)
25 ºC and (b) 85 ºC. ……………………………………………………………….148
Figure 7.6: XRD patterns of the precipitates after AAO dissolution: (a) and (b) for bi-
metallic sample FN-2 and FN-4, respectively; (c) and (d) for multi-metallic sample
FNAC-2 and FNAC-6, respectively. ……………………………………...............149
Figure 7.7: DXRD patterns obtained by subtracting oxalate treated pattern from
untreated pattern: (a) and (b) for bi-metallic samples FN-2 and FN-4, respectively;
(c) and (d) for multi-metallic samples FNAC-2 and FNAC-6, respectively. ……..151
Figure 7.8: FTIR spectra of the precipitates before and after AAO dissolution: (a) and
(b) for bi-metallic samples FN-2 and FN-4, respectively; (c) and (d) for multi-
metallic samples FNAC-2 and FNAC-6, respectively. ……………………………153
XV
LIST OF TABLES
Table 3.1: p parameters in Dickson’s formulas (Dickson et al., 1990)…………… 32
Table 3.2: Equilibrium constant of water and iron species for different media and
ionic strength at 25°C. ……………………………………………………………... 35
Table 3.3: b values for the Vasil'eV equation. ……………………………………...36
Table 3.4: Parameters in Eqs. 3.34 and 3.35 (sourced from Kenttämaa (1958) and
Baes and Mesmer (1976)). ………………………………………………………….37
Table 3.5: Species and thermodynamic data for Fe(III)–Ni(II)–H2SO4–H2O
system. ……………………………………………………………………………... 40
Table 3.6: Solubility products of goethite, ferrihydrite and schwertmannite. ……...42
Table 3.7: List of chemical species in Fe(III)–Ni(II)–H2SO4–H2O system. ……….
44
Table 3.8: Comparisons of calculated pH values and ionic strengths to those of other
works. ……………………………………………………………………………….56
Table 4.1: Factors and selected levels in the 25−2 resolution III fractional factorial
design. ………………………………………………………………………………66
Table 4.2: Design matrix for 5 factors and 8 experiments. …………………………66
Table 4.3: The initial and final chemical composition of synthetic solutions. …….. 67
Table 4.4: Factors and their levels in BBD. ………………………………………...69
Table 4.5: Design matrix of BBD for 3 factors and 15 experiments. ……………… 69
XVI
Table 4.6: The effect of reaction and ageing time on iron removal efficiency and
nickel loss (pH=2, 25 ºC, neutralizing agent: CaCO3, Fe/Ni=18, stirring speed: 200
rpm). ………………………………………………………………………………...70
Table 4.7: The effect of gypsum formation on nickel loss (neutralizing agent: CaCO3,
reaction time 2.5 h, ageing time 0 h, stirring speed: 500 rpm). …………………….72
Table 4.8: Elemental analyses obtained for the FFD experiments. …………………72
Table 4.9: Elemental analyses obtained for the BBD experiments. ………………...78
Table 4.10: ANOVA table for fitted quadratic model. ……………………………...80
Table 4.11: Process optimization and model prediction. …………………………... 86
Table 5.1: The initial and final chemical composition of synthetic leach liquor for
single-stage precipitation experiments from the Fe(III)+Ni(II), Fe(III)+Ni(II)+Al(III)
and Fe(III)+Ni(II)+Cr(III) systems. ………………………………………………...97
Table 5.2: Elemental analysis and metal recovery of the precipitates obtained for the
single-stage precipitation from the Fe(III)+Ni(II), Fe(III)+Ni(II)+Al(III) and
Fe(III)+Ni(II)+Cr(III) systems. ……………………………………………………..98
Table 5.3: Factors and their levels for 22 replicated factorial design
experiments. .............................................................................................................100
Table 5.4: The design matrix, initial and final chemical composition of synthetic
leach liquor. ………………………………………………………………………..101
Table 5.5: The elemental analyses for 22 replicated factorial design experiments to
investigate the effects of iron, aluminium and chromium on nickel losses. ………101
Table 5.6: Analysis of variance (ANOVA) for the results obtained in the 22 replicated
factorial design experiments. …………………………….………………………..102
XVII
Table 5.7: The experimental strategy for multi-stage precipitation processes. ……104
Table 5.8: The initial and final chemical composition of synthetic leach liquor for the
single-and multi-stage precipitation from the Fe(III)+Ni(II)+Al(III)+Cr(III) system.
……………………………………………………………………………………...106
Table 5.9: Elemental analysis of the precipitates obtained and metals removal for the
single- and multi-stage precipitation from the Fe(III)+Ni(II)+Al(III)+Cr(III) system.
……………………………………………………………………………………...107
Table 5.10: Settling rate obtained for single- and multi-stage precipitation from the
Fe(III)+Ni(II)+Al(III)+Cr(III) system. ……………………………………………109
Table 5.11: Chemical composition of real leach solutions obtained by atmospheric
column leaching of Western Australian laterite ores (after 135 days). ……………110
Table 5.12: The final chemical composition of real leach solutions for the single- and
multi-stage precipitation. ………….………………………………………………111
Table 5.13: Elemental analysis of the precipitates obtained for the single- and multi-
stage precipitation from real leach solutions. ……………………………………..111
Table 5.14: Metal recovery for the single- and multi-stage precipitation from real
leach solutions. …………………………………………………………………….112
Table 5.15: Settling rate obtained for the single- and multi-stage precipitation from
real leach liquor system. …………………………………………………………..112
Table 6.1: Summary of the initial and final chemical compositions of synthetic leach
solution for the study of the effects of water salinity. ……………………………..119
Table 6.2: Elemental analysis of the solid precipitation products and metal recovery
for the study of the effects of water salinity. ………………………………………121
XVIII
Table 6.3: Factors and their levels used in statistically-designed experiments. …..123
Table 6.4: Design matrix for 3 factors and 15 experiments. ………………………123
Table 6.5: The initial and final chemical composition of synthetic leach solutions for
statistically-designed experiments. ………………………………………………..124
Table 6.6: Elemental analysis of the precipitates obtained and metal recovery for
statistically-designed experiments. ………………………………………………..125
Table 6.7: Analysis of variance (ANOVA) for the quadratic regression
model. ………………………………………………………………..…………….126
Table 7.1: Summary of the experimental conditions and chemical composition of
synthetic leach solution for preparation of iron-rich precipitates. ………………...138
Table 7.2: The chemical composition of the iron-rich precipitates . ……………...138
Impurity Rejection in the Nickel Laterite Leach System
1
CHAPTER 1
INTRODUCTION
1.1 THE ISSUE
Nickel and its alloys have gained wide application in industry due to their excellent
corrosion and heat resistance. Approximately 70% of the land-based nickel reserves
are present in lateritic deposits, but these only account for 40% of worldwide nickel
production (Dalvi et al., 2004). Major nickel production in the future, however, is
expected to be from nickel laterite ores.
High temperature pressure acid leaching (HPAL) is almost extensively used for
processing laterite ores. Whittington and Muir (2000) systematically reviewed the
HPAL technique for processing nickel laterites in terms of mineralogy, leaching
chemistry, operating conditions, residue properties and scaling. In subsequent
publications (Whittington and Johnson, 2005; Whittington et al., 2003a; 2003b), the
effects of water salinity, ore type and acid loading were discussed in detail. However,
the HPAL process often requires high capital expenditure (CAPEX), and operating
expenditure (OPEX). In addition, the process is best suited to ores containing above
40 wt.% iron. Lateritic ores with less than 40 wt.% iron usually contain a higher
amount of acid consuming minerals such as magnesium silicates, and are not
economically suitable for direct high pressure leaching (Arroyo and Neudorf, 2004).
In recent years, a considerable amount of research has been undertaken investigating
more economical and environmentally sound hydrometallurgical approaches for the
treatment of nickel laterite ores. Particularly, interest in atmospheric leaching (AL)
has been mounting, which is considered as a potentially lower cost alternative to
HPAL for laterite projects (McDonald and Whittington, 2008a; 2008b). However, AL
is still in its infancy, and many issues have not been resolved. One of the key
K.WANG
2
problems is that the pregnant leach solution (PLS) from AL usually contains
significant amounts of impurities such as soluble trivalent iron, aluminium and
chromium ions. For example, typical concentration values for these impurities in the
PLS from the heap leaching of Greek nickeliferous laterite with sulphuric acid are
reported as 23 g/L Fe3+, 6.0 g/L Al3+ and 1.0 g/L Cr3+ (Agatzini-Leonardou et al.,
2009). In some cases, the concentration of ferric iron which is the main impurity in
the PLS can be quite high with Arroyo and Neudorf (2004) reporting 82 g/L.
Inefficient removal of those impurities represents a significant impediment to
producing pure cobalt and nickel compounds and/or metals in the subsequent
downstream hydrometallurgical processing. Therefore, effective purification methods
must be developed to selectively remove or reject these ions from the PLS.
Iron is a ubiquitous impurity in PLS for various processes, therefore, most solution
purification processes strongly focus upon iron removal. A number of methods that
include hydrolysis-precipitation, solvent extraction and ion-exchange have been
developed for the iron removal from hydrometallurgical processing solutions.
Currently, hydrolysis-precipitation is the favored technique for iron removal, as the
reagent costs are low and the precipitates are potentially feed to the iron industry.
However, a practical problem in precipitating iron and other impurities during the
processing of nickel laterite PLS is the loss of nickel (and cobalt) to the solid
precipitates. The laboratory study on iron, aluminium and chromium removal from
laterite heap leach solutions conducted by Guise and Castro (1996) showed that
26.5% nickel and 37.1% cobalt were lost to the solids when precipitation was
conducted at pH 2.5 and 90 ºC. Recently, Köse and Topkaya (2011) investigated the
impurities rejection from column leach liquors of nontronite type lateritic ores, and
showed that 100% iron, 92.6% aluminium and 99.6% chromium were removed at pH
3.5 and 90 ºC, but at a cost of 15.7% nickel loss to the iron-bearing precipitates.
The level of nickel loss to the solid in the above impurity-removal processes is very
high. Therefore, a need exists to extend investigations on the impurity-removal
Impurity Rejection in the Nickel Laterite Leach System
3
process to achieve acceptable levels of nickel loss.
1.2 THESIS AIMS
The principle aim of this thesis is to understand the physicochemical processes that
occur during the precipitation of iron and other impurities from both synthetic and
real nickel laterite leach liquors and associated nickel losses. Furthermore the aim is
to develop a precipitation process to remove impurities efficiently without causing
significant losses of nickel. This will be complemented by a series of further aims:
• Initially in this project perform research to advance the understanding of the
nature of iron precipitation. This will be achieved by the theoretical
investigation of chemical equilibrium of the Fe(III)–Ni(II)–H2SO4–H2O
system, which will give insight into the ionic behavior of a mixed metal
sulphate aqueous system that commonly occurs in hydrometallurgical
processing.
• Investigate the correlation between iron precipitation and nickel loss from
synthetic nickel laterite AL liquors containing just iron and nickel ions. The
examined factors that are governing the iron precipitation process will
include pH, temperature, neutralizing agent, the initial Fe/Ni ratio in the PLS
and stirring speed.
• Study the iron, aluminium and chromium co-removal from both synthetic and
real nickel laterite AL liquors.
• Develop a multi-step precipitation process to remove impurities effectively
and minimise the losses of nickel.
• Investigate the effect of water salinity on iron, aluminium and chromium
removal and associated nickel losses.
• Gain further insight into the impurity precipitation chemistry and the nickel
loss mechanism through mineralogical and chemical characterization of the
iron-rich precipitates by using techniques that include selective Acidified
K.WANG
4
Ammonium Oxalate (AAO) dissolution, XRD/DXRD, SEM, and FTIR
spectroscopy.
1.3 THESIS STRUCTURE
According to the aims of this thesis, Chapter 2 provides a literature review of
common iron removal processes and associated nickel losses. The theoretical
background of iron hydrolysis and solids formation is described: nucleation, growth,
aging and aggregation in precipitation processes. The methods of precipitation and
strategy of experimentation are also briefly reviewed in this chapter.
Chapter 3 presents a theoretical investigation of the chemical equilibria in the
Fe(III)–Ni(II)–H2SO4–H2O system. A non-ideal chemical speciation model is
developed to calculate the concentration distribution of iron and nickel species in a
mixed ferric and nickel sulphate aqueous solution over the pH range from 0 to 4 and
at temperatures from 25 to 100°C. The ionic strength-dependent equilibrium constant
is treated through a semi-empirical Vasil'eV equation, which is based on an extended
Debye–Hückel theory.
Chapter 4 is an experimental investigation of the correlations between iron
precipitation and associated nickel losses in synthetic PLS containing just iron and
nickel ions. The effects of the key process variables, pH, temperature, initial Fe/Ni
ratio in synthetic PLS, stirring speed and type of neutralization agent, on the nickel
losses are studied using methods of statistical analysis and modelling.
Chapter 5 describes an experimental study on iron, aluminium and chromium
co-removal and associated nickel losses from both synthetic and real nickel laterite
PLS. The first part focuses on the single-stage precipitation experiments conducted
in PLS containing Fe(III)+Ni(II)+Al(III), Fe(III)+Ni(II)+Cr(III), and
Fe(III)+Ni(II)+Al(III)+Cr(III). The second part centers on the development of a
multi-step precipitation procedure to remove iron and other impurities effectively,
Impurity Rejection in the Nickel Laterite Leach System
5
and to minimise nickel losses.
Since there is the possibility to use seawater or hypersaline water in the processing of
laterite ore under atmospheric conditions, Chapter 6 is an investigation of impurities
rejection from synthetic PLS with the presence of various amounts of chloride salts
(added as sodium chloride). The first part of this chapter investigates the effect of
water salinity on impurity removal efficiencies and associated nickel losses. The
second part focuses on the effect of water salinity on changes to the mineralogy of
the precipitates.
Chapter 7 describes a comprehensive characterization of iron-rich precipitates. The
iron-bearing residues normally contain large amounts of poorly defined phases such
as schwertmannite and ferrihydrite. This often leads to difficulty in mineralogical
identification using routine XRD methods. A combination of several techniques that
include selective dissolution using Acidified Ammonium Oxalate (AAO) solution,
Differential XRD, SEM and FTIR spectroscopy are applied to enable correct
mineralogical identifications.
Chapter 8 gives a summary of the outcomes of the work in relation to the aims of this
thesis, and future work that may be undertaken based on the outcome of the thesis.
K.WANG
6
CHAPTER 2
LITERATURE REVIEW
2.1 IRON REMOVAL IN HYDROMETALLURGICAL
PROCESSING
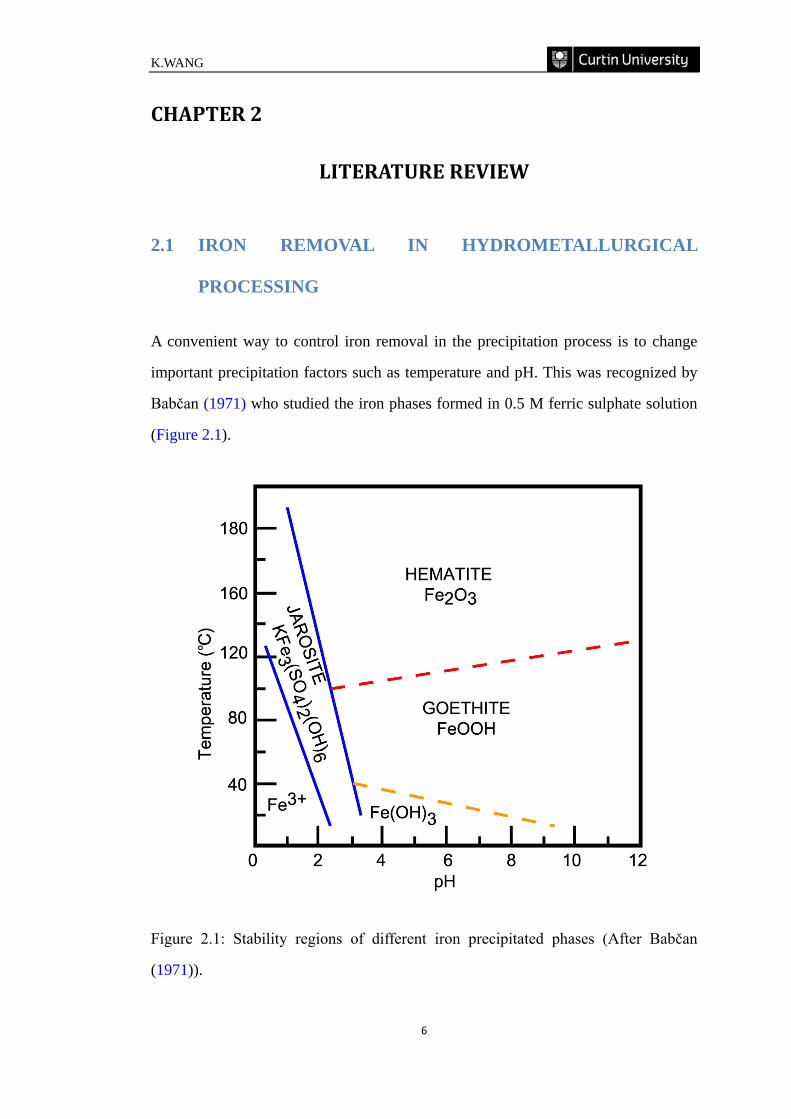
A convenient way to control iron removal in the precipitation process is to change
important precipitation factors such as temperature and pH. This was recognized by
Babčan (1971) who studied the iron phases formed in 0.5 M ferric sulphate solution
(Figure 2.1).
Figure 2.1: Stability regions of different iron precipitated phases (After Babčan
(1971)).
Impurity Rejection in the Nickel Laterite Leach System
7
The composition and physical nature of the hydrolysis products are normally
dependent on kinetic factors and equilibrium relationships. Figure 2.1 shows the
relationships between the main equilibrium iron-containing phases but does not
include any metastable phases or intermediates, such as ferrihydrite and
schwertmannite. The hydrated iron-bearing oxyhydroxide and oxyhydroxysulfate
intermediates tend to transform over time to more stable, crystalline iron oxides such
as goethite and/or hematite (Cornell and Schwertmann, 2003). In hydrometallurgical
operations, the stable and metastable iron phases are often present together in the
residues.
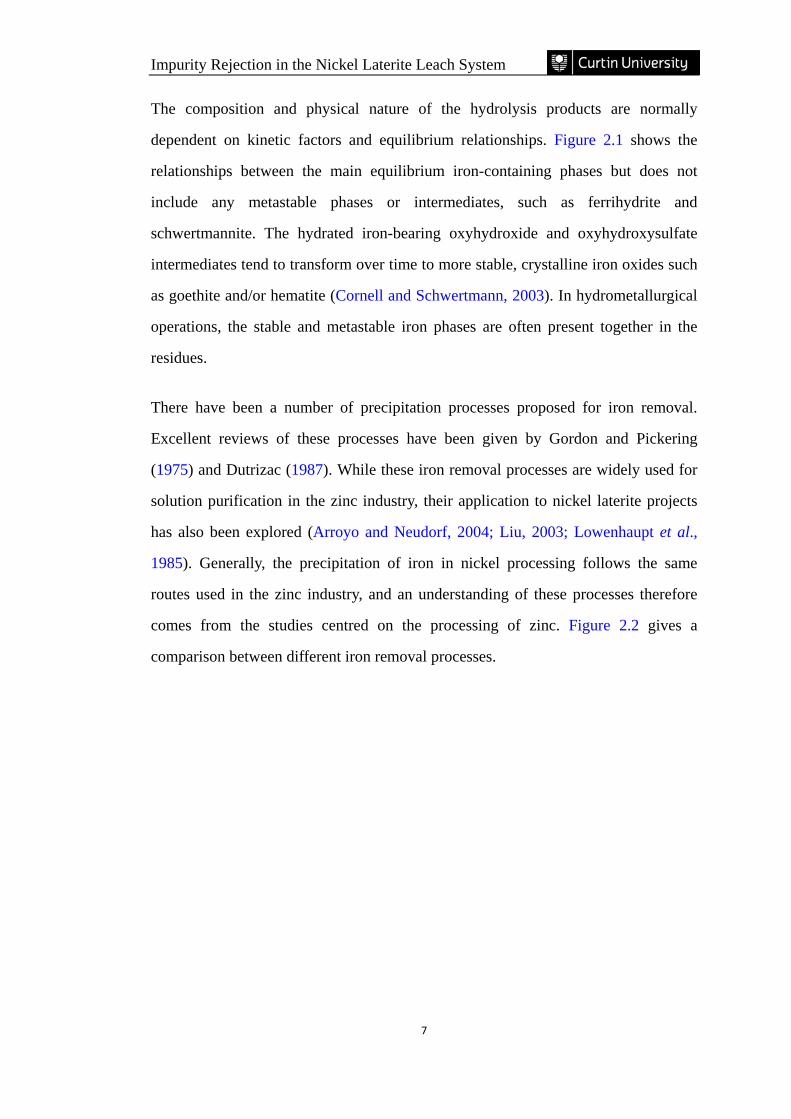
There have been a number of precipitation processes proposed for iron removal.
Excellent reviews of these processes have been given by Gordon and Pickering
(1975) and Dutrizac (1987). While these iron removal processes are widely used for
solution purification in the zinc industry, their application to nickel laterite projects
has also been explored (Arroyo and Neudorf, 2004; Liu, 2003; Lowenhaupt et al.,
1985). Generally, the precipitation of iron in nickel processing follows the same
routes used in the zinc industry, and an understanding of these processes therefore
comes from the studies centred on the processing of zinc. Figure 2.2 gives a
comparison between different iron removal processes.
K.WANG
8
Figure 2.2: Simplified schematic presentation of various iron removal processes
(After Allen et al. (1970), Bodson (1972), Gordon and Pickering (1975), Dutrizac
(1987), Claassen (2002) and Loan et. al. (2006)).
The Hematite Process in some respects is an ideal method for the precipitation of
iron from PLS, since the iron products have a greater market value with potential
application for cement, pigment and steel manufacture (Dutrizac, 1987). Such a
process, however, often requires a high temperature-pressure hydrolysis reaction,
which involves high costs to construct and maintain the autoclaves. The Jarosite
Process is the most commonly used technique for iron removal, as the jarosite-type
precipitates are easy to filter, and the precipitation can be carried out in strongly
Impurity Rejection in the Nickel Laterite Leach System
9
acidic media (Dutrizac and Kaiman, 1976). However, the larger volumes of jarosite-
type residues produced are also thermodynamically unstable, and tend to decompose
slowly to produce sulphuric acid and release heavy metals into the environment
(Gupta and Mukherjee, 1990). The essential feature of the Goethite Process is that
the concentration of ferric iron should be maintained at less than 2 g/L during
precipitation (Dutrizac, 1987). Since most leach solutions contain much higher iron
concentrations, the Goethite Process initially appears to have little place in
hydrometallurgical processing. Two approaches, however, have been developed to
allow goethite precipitation. The first method was established in the 1960s by the
Vieille-Montagne Company (V.M.) (Bodson, 1972), in which the ferric ions are first
reduced to ferrous and then oxidized by air at a controlled rate to precipitate goethite.
The Electrolytic Zinc Co. of Australasia, Ltd. (E.Z.) further improved the Goethite
Process using a dilution-precipitation approach (Allen et al., 1970). The concentrated
leach solution is diluted into a precipitation vessel containing a large volume of
solution, producing a low concentration ferric ions (<1 g/L) that are precipitated at
85 to 95 ºC and pH 2.8 to 3.5. The E.Z. method lead to the development of another
two iron removal processes in the 1990s: the Paragoethite Process and Zincor
Process (Cubeddu et al., 1996; Meyer et al., 1996). Unlike the Hematite, Jarosite and
Goethite Processes, the Paragoethite and Zincor Processes are much less common,
being in operation at only three commercial zinc production sites (Claassen et al.,
2002; Cubeddu et al., 1996; McCristal and Manning, 1998). One significant
refinement of these two new processes is the change from semi-batch or non-
continuous precipitation to a continuous process (parallel or series tanks). These two
processes are reported to give lower capital and operating cost, but the residues
contain significant amounts of poorly filterable iron oxides/hydroxides and basic iron
sulphates rather than the conventional goethite precipitates. Very little information
was available on the exact nature of the Paragoethite and Zincor residues, until the
recent studies of Loan et al. (2006) and Claassen et al. (2002) identified 6-line
ferrihydrite and schwertmannite to be the major iron precipitation products.
K.WANG
10
2.2 IRON HYDROLYSIS CHEMISTRY AND PRECIPITATION
PATHWAYS
Hydrolysis of Fe (III) consists of a series of deprotonation or polymerization steps.
The deprotonation process forms Fe(OH)x(3−x)+ species through two equilibrium
reactions (Knight and Sylva, 1974):
+++ +→←+ HFeOHOHFe 22
3 Eq. 2.1
+++ +→←+ HFe(OH)OHFeOH 222 Eq. 2.2
Two monomeric species (FeOH2+) tend to form the more stable dimer (Fe2(OH)24+).
The dimer acts as the precursor to other Fe (III) oxides and oxyhydroxide, such as 6-
line ferrihydrite (Schwertmann, 1991). Monomers and dimers can interact to produce
trimers, which are only identified in chloride media (Bottero et al., 1994). The
existence and identification of other species beyond monomers, dimers and trimers is
still contested, as polymerization reactions proceed quite fast with increasing OH−/Fe
mole ratio in solution (Flynn, 1984). It is normally difficult to stop the
polymerization reaction at a molecular level due to the high activity of polynuclear
species (Jolivet et al., 2004). Further polymerization leads to the formation of
reddish-brown polynuclear species with much higher molecular weight
(FepOr(OH)s[3p−(2r+s)]+). Iron atoms in these polynuclear species are octahedrally
coordinated to at least one H2O molecule (Schneide, 1984; Schwertmann, 1991).
These colloidal and gelatinous polynuclear species transform to nanoscale polymers
with low structural order corresponding to the formation of ferrihydrite (Misawa et
al., 1974).
It is often difficult to make a clear structure distinction between polynuclear species
and ferrihydrite. The disordered nature of ferrihydrite results in small diffracting
domains that are hard to detect by conventional X-Ray Diffraction (XRD) (Jambor
Impurity Rejection in the Nickel Laterite Leach System
11
and Dutrizac, 1998). Ferrihydrite is often wrongly designated as hydrous ferric oxide
(HFO), colloidal ferric hydroxide (Fe(OH)3) or amorphous iron oxide. Ferrihydrite is
conventionally named as “2-line” or “6-line” based on the number of X-ray
diffraction lines. Recently, Michel et al. (2007) determined the structure of 6-line
ferrihydrite and published their work in the journal Science, but their deductions
have been questioned by other researchers in the following years (Rancourt and
Meunier, 2008). Although the exact structure of ferrihydrite has not been fully
understood, the presence of hydroxyl is widely assumed to be essential for
maintaining the ferrihydrite structure. The discrepancy in the structural models of
ferrihydrite results in the various reported chemical formula: see, for example,
Fe5HO8·4H2O (Towe and Bradley, 1967), FeOx(OH)3-2x (Misawa et al., 1974),
Fe4(O,OH,H2O)12 (2-line ferrihydrite) and Fe4.6(O,OH,H2O)12 (6-line ferrihydrite)
(Eggleton and Fitzpatrick, 1988). The extensively reported formula, 5Fe2O3·9H2O,
is thought to be excessively hydrous (Jambor and Dutrizac, 1998). Michel et al.
(2010) proposed a new composition for disordered ferrihydrite,
Fe8.2O8.5(OH)7.4+3H2O, which differs significantly from previous suggested
chemical compositions.
In aqueous solution, ferrihydrite is thermodynamically unstable, and tends to
transform over time to goethite and hematite. Ferrihydrite dissolves to reform the
soluble ions such as Fe(OH)2+ in acid solution (pH~4) and Fe(OH)4
– in alkaline
media (pH~12) (Cornell and Schwertmann, 2003). The formation of goethite is
favored at such pH values, but the formation of hematite reaches a maximum at a
medium pH range (pH~7-8) when the concentration of the monovalent Fe(OH)2+ ion
is a minimum. In strong acidic media (pH<4), the growth of monovalent Fe(OH)2+ is
inhibited by the presence of FeOH2+ which is less favorable for goethite formation
than the monovalent ion. However, this process (pH<4) favours the formation of
hematite (Schwertmann and Murad, 1983). Thus, the formation of goethite and
hematite from ferrihydrite seems to be simultaneous, but the conditions that favour
the formation of goethite, on the other hand, minimise hematite formation.
K.WANG
12
Hydrolysis of concentrated ferric solutions by rapid addition of alkali to raise the pH
of solution to the pH range between 7 and 8 normally results in the formation of 2-
line ferrihydrite (Lewis and Cardile, 1989). If the hydrolysis of Fe3+ happens
relatively slowly at low concentration and pH values (pH 2.5-3.5), more ordered 6-
line ferrihydrite forms (Schwertmann, 1991). This is consistent with the work of
Michel et al. (2007) reported, 6-line ferrihydrite has few vacancies, hence better
structural ordering, presumably as a result of slower precipitate growth. However,
aging 2-line ferrihydrite in aqueous solution does not transform it into the relatively
well-ordered 6-line ferrihydrite, but usually leads to the formation of hematite and/or
goethite (Schwertmann and Murad, 1983).
In the presence of sulphate ions, hydrolysis of ferric ions becomes quite complicated
as the formation of the FeSO4+ complex strongly suppresses the polymerization of
the hydroxyl complex and the precipitation of goethite (Cornell and Schwertmann,
2003). The experimental work by Sapieszko et al. (1977) has shown that FeSO4+ is
the dominant species at the temperature range from 25 to 85 ºC in ferric sulphate
solutions. The hydroxo-forms of Fe(III) exist as mixed hydroxyl sulphate complexes
Fe2(OH)2(SO4)x4−2x. (Yakovlev et al., 1977). There is a growing awareness that
these ferric hydroxyl sulphate complexes have close relationship to schwertmannite.
Schwertmannite (Fe8O8(OH)x(SO4)y) is the predominant hydrolysis product of
ferric iron in concentrated sulphate solution at pH 2 to 4 (Bigham and Nordstrom,
2000). The optimal conditions for the formation of schwertmannite are within the pH
range from 3.0 to 4.5 and sulphate concentrations in the range of 1000 to 3000 mg/L
(Bigham et al., 1994). The ideal formula of schwertmannite is Fe8O8(OH)6SO4,
which indicates the Fe/S molar ratio of 8 is between jarosite (Fe/S=1.5) and the
normal iron oxides (no S). The schwertmannite formula may also range to
Fe8O8(OH)4.5(SO4)1.75 depending on the degree to which tunnel and surface sites are
saturated with sulphate (Bigham et al., 1996). Schwertmannite is a large and
complex hydroxy ferric sulfate with poorly crystalline nature and is commonly
Impurity Rejection in the Nickel Laterite Leach System
13
admixed with other nanophasic iron minerals. The sulphate in schwertmannite may
be partly or fully substituted by anions such as arsenate and chromate. Bigham et al.
(1994) indicated that schwertmannite is distinguished from ferrihydrite by a tunnel
structure similar to that for akaganéite, which is formed in the chloride system.
Claassen (2006) suggested that schwertmannite was nothing else but ferrihydrite
with high sulphate values. The detailed structure study of schwertmannite using
transmission electron microscopy and electron nanodiffraction by Loan et al. (2004)
indicted that schwertmannite has a structure that is consistent with the maghemite-
like structural component for ferrihydrite previously described by Janney et al.
(2000) rather than the “modified” akaganéite structure proposed by Bigham et al.
(1994).
At lower pH values (pH 1 to 2) and in the presence of monovalent ions, jarosite-type
compounds, MFe3(OH)6(SO4)2, become predominant in sulphate media, where M
refers to Na+, K+, NH4+, Ag+, 1/2Pb2+ or H3O+, etc. (Dutrizac and Jambor, 2000).
Jarosite synthesis is normally kinetically favored at elevated temperatures (>80°C).
Goethite formation is only favored at low ferric concentration and temperatures
below 100°C in sulphate solution (Dutrizac, 1987). Bigham et al. (1994) indicated
that goethite is a phase commonly associated with schwertmannite at relatively
higher pH, especially at pH exceeding 4.5. Parida and Das (1996) suggested that the
formation and crystallization of goethite was accelerated in Fe(NO3)3 solution in the
presence of sulphate, though at higher SO42−/Fe3+ ratio (1.0) formation of the FeSO4
+
complex strongly inhibited the polymerization of hydroxy complexes and goethite
precipitation.
2.3 CRYSTALLIZATION AND PRECIPITATION THEORY
Aqueous crystallization and precipitation both refer to unit operations that produce a
solid from supersaturated solution. The distinction between crystallization and
K.WANG
14
precipitation is based on the speed of the process and the size of the solid particles
produced (Jarvinen, 2008). Precipitation is generally regarded as being the process of
reactive crystallization or fast crystallization (Dirksen and Ring, 1991). The same
basic steps often occur in both crystallization and precipitation processes such as
supersaturation, nucleation and growth (Jarvinen, 2008). Precipitation occurs from a
highly supersaturated solution, resulting in fast nucleation and consequent formation
of a large number of small crystals.
2.3.1 Nucleation and growth
Primary homogeneous nucleation occurs in the absence of any solid interface, where
it is the dominant nucleation mechanism. The classical theories of primary
homogeneous nucleation assume that the solute atoms or molecule units in
supersaturated solution tend to combine together to produce clusters or embryos
(Garside, 1985). The overall change of Gibbs free energy (∆G) during the formation
of embryos consists of two parts: the free energy associated with the generation of a
new volume (∆Gv) and the free energy due to the created new surface (∆Gs). The
Gibbs free energy of nucleus formation can be written as:
γr π4kTlnSv3r π4ΔGΔGΔG 2
3
sv +
−=+= Eq. 2.3
where r is the radius of the generated particle, v is the molecular volume of the
generated embryo, k is the Boltzmann constant, T is temperature, S is the degree of
supersaturation and γ is the surface tension. Nucleation occurs spontaneously only if
∆G<0, which means S in the first term on the right-hand side of Eq. 2.3 should be
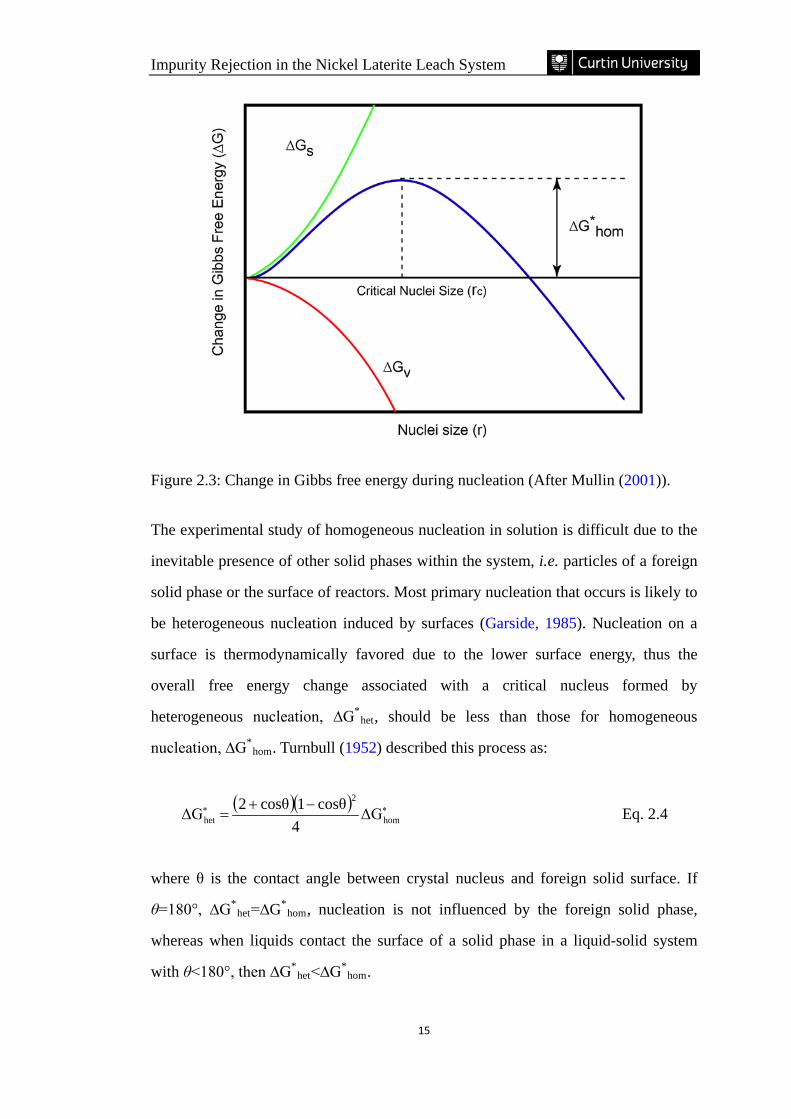
great than 1. Under this condition, ∆G has a positive maximum ∆G*hom, where
nucleus size reaches a critical value (rc). Figure 2.3 is the graphic representation of
relationships of changes in Gibbs free energy and nuclei size. The value of ∆G*hom is
the activation energy for nucleation to form critical size nuclei.
Impurity Rejection in the Nickel Laterite Leach System
15
Figure 2.3: Change in Gibbs free energy during nucleation (After Mullin (2001)).
The experimental study of homogeneous nucleation in solution is difficult due to the
inevitable presence of other solid phases within the system, i.e. particles of a foreign
solid phase or the surface of reactors. Most primary nucleation that occurs is likely to
be heterogeneous nucleation induced by surfaces (Garside, 1985). Nucleation on a
surface is thermodynamically favored due to the lower surface energy, thus the
overall free energy change associated with a critical nucleus formed by
heterogeneous nucleation, ∆G*het, should be less than those for homogeneous
nucleation, ∆G*hom. Turnbull (1952) described this process as:
( )( ) ∗∗ −+= hom
2
het ΔG4
cosθ1cosθ2ΔG Eq. 2.4
where θ is the contact angle between crystal nucleus and foreign solid surface. If
θ=180°, ∆G*het=∆G*
hom, nucleation is not influenced by the foreign solid phase,
whereas when liquids contact the surface of a solid phase in a liquid-solid system
with θ<180°, then ∆G*het<∆G*
hom.
K.WANG
16
Once the stable nuclei (particles larger than the critical size) are formed in a
supersaturated solution, these begin to grow into particles that are visible. This
growth process often involves a series of stages: (a) transport of solute from bulk
solution to the particle surface, (b) adsorption on the particle surface, (c) surface
diffusion, (d) incorporation into the particle and (e) diffusion of solvent or other
species away from the surface (Dirksen and Ring, 1991). Most of the growth
processes for iron oxides or oxyhydroxides occur on the molecular scale, which
involves the diffusion of “growth units” to the particle surface and then attachment.
These attached units can either remain at their initial point of contact or diffuse
across the surface and finally integrate into the crystal lattice at a “kink site” or return
to the solution (Garside, 1985). A rough interface has many potential kink sites, and
surface diffusion becomes less important. The attached units create new corners
which are preferred sites for subsequent attachment of additional new unites. On the
other hand, growth becomes more difficult when the interface is smooth. Surface
diffusion becomes more important as kink sites are only present at the edges of either
two-dimensional nuclei or surface steps. On the microscopic levels, surface layer or
“step bunches” are often observed. These bunches consist of many molecular layers
on the surface that have grouped together. Trapping of solvent inside the particle
structure and other defects are mainly achieved by the step bunches. At larger
macroscopic levels, heat transfer in solution is relatively fast compared to mass
transfer. Thus, mass transfer limitations are predominant in growth control. The
supersaturation or concentration gradients in solution can then influence the surface
profiles and lead to instabilities in the growth process, which cause solution
inclusions and dendrites. There are a range of theories relating to the mechanism and
kinetics of crystal growth under particular conditions (Dirksen and Ring, 1991;
Garside, 1985; Mullin, 2001; Söhnel and Garside, 1992).
2.3.2 Secondary processes
The dominant growth mechanisms that determine the final crystalline product
Impurity Rejection in the Nickel Laterite Leach System
17
formed during precipitation are secondary processes including aging,
recrystallization or Ostwald ripening and agglomeration.
Many precipitates formed are often disordered or metastable, and upon aging are
transformed to stable compounds (Demopoulos, 2009). If two phases are
supersaturated in a solution, the least stable phase precipitates first due to lower free
energy of nucleation. This behaviour is referred to as Stranski’s rule or the Ostwald
Step rule and occurs in a homogeneous nucleation dominated system (Söhnel and
Garside, 1992). A good proof of the validity of this rule is the hydrolysis reaction of
ferric iron, as described by Blesa and Matijević (1989):
hematitegoethiteteferrihydriFe3 →→→+ E.q. 2.5
Ferrihydrite is metastable with respect to goethite and/or hematite. Upon aging, it is
transformed progressively to more crystalline phases. Hence, ferrihydrite, goethite
and hematite are all supersaturated with respect to ferric ions and Stranski’s rule
predicts the least stable phase ferrihydrite precipitates first.
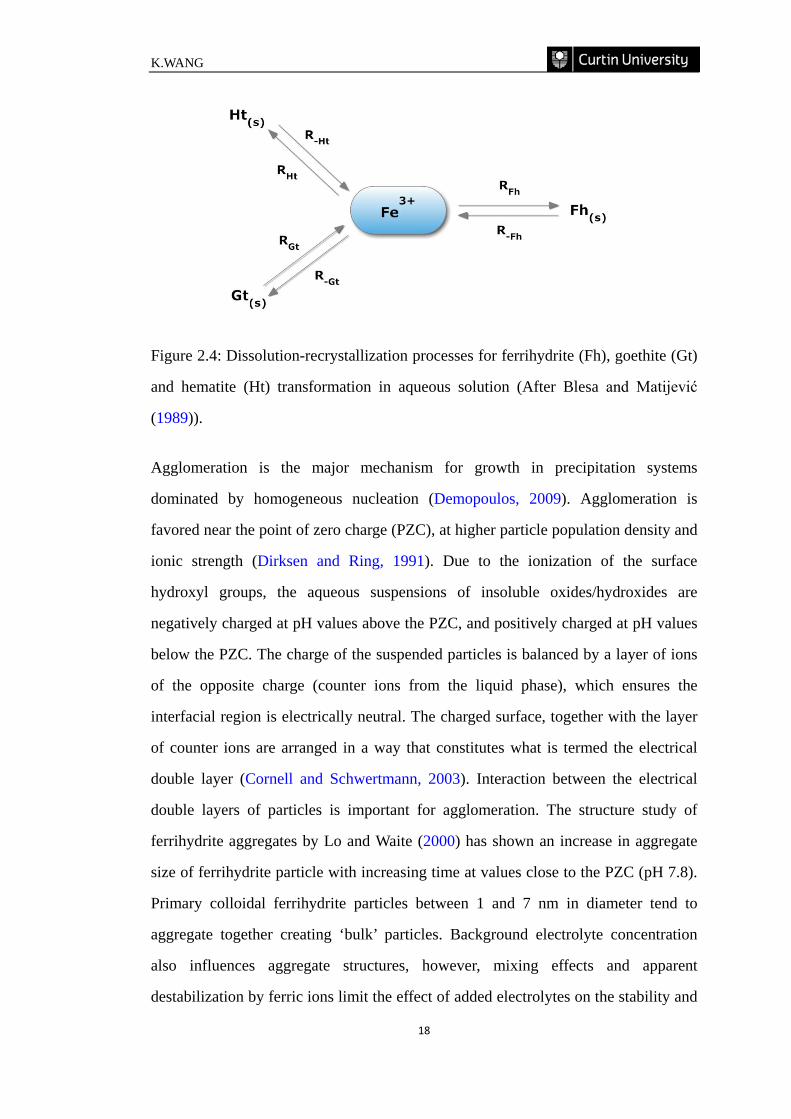
As shown in Figure 2.4, the order of solubility of ferrihydrite, goethite and hematite
and their initial precipitation rates are given as: S(Fh)>S(Gt)>S(Ht) and
RFh>RGt>RHt, respectively. According to Stranski’s rule, Fh is the least stable phase
and forms first at a rate RFh. Once the concentration of Fe3+ drops below the
solubility of Fh(S), dissolution of the latter occurs at a rate R-Fh. Solid phase Gt then
forms at a rate RGt from the new created concentration of Fe3+ (supersaturation).
Phase Gt(s) then dissolves slowly at a rate R-Gt when the concentration conditions
favor its dissolution. Similar trends apply to the change from phase Gt(s) to Ht(s).
K.WANG
18
Figure 2.4: Dissolution-recrystallization processes for ferrihydrite (Fh), goethite (Gt)
and hematite (Ht) transformation in aqueous solution (After Blesa and Matijević
(1989)).
Agglomeration is the major mechanism for growth in precipitation systems
dominated by homogeneous nucleation (Demopoulos, 2009). Agglomeration is
favored near the point of zero charge (PZC), at higher particle population density and
ionic strength (Dirksen and Ring, 1991). Due to the ionization of the surface
hydroxyl groups, the aqueous suspensions of insoluble oxides/hydroxides are
negatively charged at pH values above the PZC, and positively charged at pH values
below the PZC. The charge of the suspended particles is balanced by a layer of ions
of the opposite charge (counter ions from the liquid phase), which ensures the
interfacial region is electrically neutral. The charged surface, together with the layer
of counter ions are arranged in a way that constitutes what is termed the electrical
double layer (Cornell and Schwertmann, 2003). Interaction between the electrical
double layers of particles is important for agglomeration. The structure study of
ferrihydrite aggregates by Lo and Waite (2000) has shown an increase in aggregate
size of ferrihydrite particle with increasing time at values close to the PZC (pH 7.8).
Primary colloidal ferrihydrite particles between 1 and 7 nm in diameter tend to
aggregate together creating ‘bulk’ particles. Background electrolyte concentration
also influences aggregate structures, however, mixing effects and apparent
destabilization by ferric ions limit the effect of added electrolytes on the stability and
Impurity Rejection in the Nickel Laterite Leach System
19
structure of ferrihydrite. The PZC of most iron oxide/hydroxide particles is in the pH
range of 6 to 8 (Parks, 1965). Many studies on the synthesis and structure of iron
oxide/hydroxides have been conducted at pH values well away from the PZC, and in
dilute solutions, in order to investigate primary particles rather than ‘bulk’ aggregates
(Schwertmann and Cornell, 2000).
2.4 NICKEL LOSS DURING IRON PRECIPITATION
It is critical that the iron-bearing precipitates do not contain significant amounts of
nickel for an iron removal process to be successfully applied to the nickel laterite
PLS. When increasing the pH of an acidic leaching solution, iron and hydroxyl ions
tend to form cross-linked three-dimensional networks (Dutrizac, 1987). Rapid
growth of these networks results in the formation of an amorphous or poorly defined
gelatinous ferrihydrite with poor settling and filtration properties. This precipitate
tends to incorporate significant amounts of processing solution in its network
structure.
Ferrihydrite has a large specific surface area (200-500 m2/g) (Cornell and
Schwertmann, 2003). Such a precipitate has a strong capacity to collect various
elements either by surface adsorption or chemical bonding. For this reason, a direct
ferrihydrite precipitation process is less attractive, but is normally used in
conjunction with the formation of other iron oxides such as jarosite and goethite. For
the formation of jarosite-type compounds, the study by Dutrizac and Dinardo (1983)
on lead jarosite has shown that the extent of co-precipitation of nickel with lead-
jarosite is small, depending on the synthesis procedure. Up to 2.92% nickel was co-
precipitated with lead jarosite through autoclave synthesis (at temperatures ranging
from 130 to 180 ºC), but only 0.28% nickel was co-precipitated with lead jarosite by
slow-addition synthesis (when lithium carbonate was added slowly to adjust pH in a
reaction kettle at 97 ºC). A subsequent study by Dutrizac and Chen (2004) indicated
that minor amounts of nickel were structurally incorporated into Na-jarosite, K-
K.WANG
20
jarosite and NH4-jarosite when the precipitation reaction was conducted at pH 1.6
and temperatures from 60 to 200 ºC. The extent of incorporation of nickel into the
jarosite precipitates increased with increasing concentration of dissolved nickel;
increasing concentration of monovalent sulphate salt, and increasing pH and
temperature. K-jarosite incorporated more nickel (~1% Ni) than did Na-jarosite or
NH4-jarosite (~0.4% Ni).
In the study of nickel losses associated with goethite formation, an early patent on
the E.Z. Goethite Process (Allen et al., 1970) reported that 0.18% nickel remained in
the final dried precipitates when the reaction was conducted at 70 °C and pH 2.1 to
2.3. The laboratory study of both the V.M. and E.Z. Goethite Processes by Davey and
Scott (1976) indicated respective 1.7% and 0.15% of the total nickel was lost during
iron precipitation from the laterite leach liquor at pH 3.5. The recent experimental
work on the V.M. process by Chang et al. (2010) has shown that 4.1% nickel was lost
with the iron precipitation occurring at pH 2.5 to 3.0, whereas 15.9% was lost for
iron precipitation at pH 3.0 to 4.0.
The nickel loss associated with iron precipitation is a complicated issue. Normally,
nickel hydroxide will also be precipitated above pH 5 (Han et al., 1982). In practice,
such a high pH value is rarely used in purification processes prior to the recovery of
nickel. Conversely, it is well known that co-precipitation and/or adsorption processes
occur at a lower pH range than that of simple hydroxide precipitation, although no
clear distinction can be made between co-precipitation and adsorption (Benjamin and
Leckie, 1981; Crawford et al., 1993). Therefore, nickel may not be simply
precipitated in the form of nickel hydroxide in a lower pH environment, but is
probably incorporated into the precipitates via co-precipitation and/or adsorption.
Beukes et al. (2000) investigated the adsorption of Ni2+ by goethite and hematite in
aqueous solution and found that the amount of adsorbed nickel increased with
increasing pH from 3 to 8. Notably, nickel was only significantly adsorbed by
goethite at pH values greater than 4.
Impurity Rejection in the Nickel Laterite Leach System
21
Since there is a low level of nickel normally present in natural or synthetic iron
oxide/hydroxide, it is a major challenge to investigate the mechanism of nickel loss
by routine characterization techniques, such as X-Ray Diffraction (XRD) and
Scanning or Transmission Electron Microscopy (SEM or TEM). One investigation
on the incorporation of Ni into natural goethite by X-Ray Absorption Spectroscopy
(Carvalho-e-Silva et al., 2003) showed that the substitution of Ni for Fe was
accompanied by replacement of O2– by OH– to maintain charge neutrality to produce
NiO2(OH)4 octahedra, which had a similar structure to the FeO3(OH)3 octahedra of
pure goethite. Singh et al. (2002) made a similar observation for Ni-substitution in
synthetic goethite samples. Up to 5 mole % Ni2+ was found to substitute for Fe3+.
2.5 PRECIPITATION METHODS
Precipitation reactions can be easily conducted in either batch, semi-batch (semi-
continuous) or continuous mode (Figure 2.5). All modes are extensively used in the
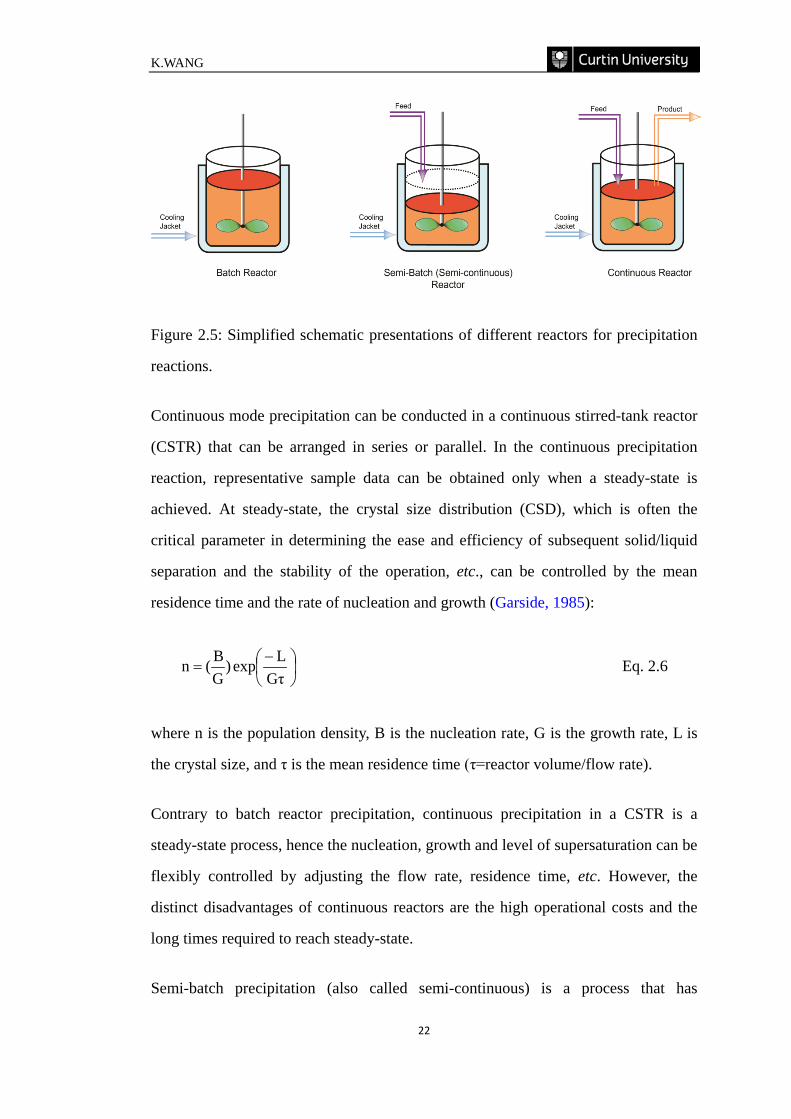
study of the hydrolysis and precipitation of iron. Each process has its own individual
advantages and disadvantages. Batch precipitation is a non-steady-state process.
Each batch is a closed system, in which the total mass of the batch is fixed, but the
volume and density may vary as the reaction proceeds. Reactant concentrations
decrease and product concentrations increase with time. The major advantage of a
batch process is the simple equipment and low operational cost. However, a batch
reactor is not good from the standpoint of supersaturation control due to the change
in reactant concentration and the degree of supersaturation (Demopoulos, 2009;
Missen et al., 1999).
K.WANG
22
Figure 2.5: Simplified schematic presentations of different reactors for precipitation
reactions.
Continuous mode precipitation can be conducted in a continuous stirred-tank reactor
(CSTR) that can be arranged in series or parallel. In the continuous precipitation
reaction, representative sample data can be obtained only when a steady-state is
achieved. At steady-state, the crystal size distribution (CSD), which is often the
critical parameter in determining the ease and efficiency of subsequent solid/liquid
separation and the stability of the operation, etc., can be controlled by the mean
residence time and the rate of nucleation and growth (Garside, 1985):
−=
GτLexp)
GB(n Eq. 2.6
where n is the population density, B is the nucleation rate, G is the growth rate, L is
the crystal size, and τ is the mean residence time (τ=reactor volume/flow rate).
Contrary to batch reactor precipitation, continuous precipitation in a CSTR is a
steady-state process, hence the nucleation, growth and level of supersaturation can be
flexibly controlled by adjusting the flow rate, residence time, etc. However, the
distinct disadvantages of continuous reactors are the high operational costs and the
long times required to reach steady-state.
Semi-batch precipitation (also called semi-continuous) is a process that has
Impurity Rejection in the Nickel Laterite Leach System
23
characteristics of both batch and continuous precipitation. In a common semi-batch
operation mode, the reactants are added into the reactor over a period of time.
Reaction occurs during the addition phase and continues to the point where the yield
of the desired product is maximized. A major difference between batch and semi-
batch operation is that for the latter, there is a dilution effect due to the additional of
reactants (Tsangaris and Baltzis, 1996).
2.6 EXPERIMENTAL STRATEGY
The conventional strategy in studying the effects of various factors during
precipitation reactions is to choose a starting point, and change one factor at a time
over its range while the others are held constant. After all tests are performed, a set of
graphs can be constructed showing how the target value is influenced by each factor
with all the other factors kept constant. This “one-factor-at-a-time” approach is
widely adopted in research. However, the major disadvantage of this approach is that
it fails to consider the possible interactions between factors. These interactions are
very common in practice, and if they occur, the “one-factor-at-a-time” approach
becomes less efficient compared to the design of experiments (DOE) using statistical
methods (Montgomery, 2005). This experimental strategy generally uses a number of
experiments in which factors are varied together to study the effects of factors and
their possible interactions. Statistically-designed experiments are widely adapted for
the studies throughout this thesis and details of these can be found in Chapters 4 to 6.
2.7 SUMMARY
Ferric iron is the major impurity in the pregnant leach solution produced by
atmospheric acid leaching of nickel laterite. Effective removal of iron is required to
produce pure nickel and cobalt compounds and/or metals during the downstream
hydrometallurgical processing of AL laterite leach liquors. This is usually achieved
by precipitation but often involves co-precipitation and/or incorporation of nickel
K.WANG
24
and cobalt.
When choosing a suitable iron removal process for nickel laterite AL system, factors
such as the cost of operation, simplicity of equipment, environmental concerns and
potential valuable metal losses should all be considered. From the literature survey,
the Goethite Process has the advantages of lower capital expenditure over the
Hematite Process and generating eco-friendly products relative to the Jarosite
Process. The “dilution-precipitation” E.Z Goethite Process is reported to cause less
loss of nickel compared to the “reduction-oxidation” V.M. Goethite Process. In
addition, E.Z Goethite Process used a semi-batch operation process with simpler
equipment and lower capital costs, which makes it a preferred option for processing
AL nickel laterite PLS containing significant amounts of ferric iron.
The literature review indicated that the hydrolysis-precipitation of iron as well as the
formation and transformation of iron oxides in aqueous solution is quite complicated
and not well understood, particularly in acidic media. There seems to be specific
conditions for the formation of the precipitates including ferrihydrite,
schwertmannite, goethite, hematite, jarosite, etc. These compounds form from
unique, and as yet unknown, polymerization reactions which change markedly with
precipitation conditions. In particular, the higher polymers of iron and sulphate are
not well defined, and it is not even certain that the dominant polymer species is
closely reproduced in the precipitate formed.
The exact nature of nickel losses associated with iron precipitation is not understood,
although it has been suggested by previous studies that nickel loss occurs as either
co-precipitation (adsorption) or incorporation into the structure of iron oxides.
However, the loss of nickel is found to be closely related to the precipitation factors
affecting iron removal such as pH and temperature. This loss shall be minimised by
carefully choosing the right combination of the above factors. The changes to these
factors can also affect both the chemical (e.g. solid composition) and physical
properties of the iron-bearing precipitates.
Impurity Rejection in the Nickel Laterite Leach System
25
It was concluded that a need exists to extend studies of the effects of various
precipitation factors during iron removal upon nickel loss in order to better
understand the complicated precipitation behavior of iron oxides and the associated
nickel loss mechanism(s). The aspects that require further investigation include: the
speciation of iron and nickel species, solubility and precipitation of iron oxides,
hydrolysis-precipitation control, co-removal of iron, aluminium and chromium, and
mineralogical characterization of the iron-bearing precipitates produced. These
identified knowledge gaps are in accord with the aims of this thesis presented in
Chapter 1, and will be addressed in each separate chapter.
K.WANG
26
CHAPTER 3
CHEMICAL MODELLING OF THE Fe(III)-Ni(II)-H2SO4-H2O
SYSTEM
3.1 INTRODUCTION
The pregnant leach solution from atmospheric leaching of nickel laterite is rich in
various dissolved metals, of which iron is the most abundant. These metals are
distributed in aqueous solution as soluble species such as metal ions and, neutral and
charged complexes. However, the experimental determination of the speciation in
such an aqueous electrolyte solution is difficult, due to the lack of suitable analysis
techniques for in situ measurement of these species. The chemical modelling of an
aqueous electrolyte solution involving different species, particularly at elevated
temperatures, can provide a wealth of information that is difficult to obtain from an
experimental approach. Thus, modelling of the aqueous electrolyte solution is
important to solidify the understanding of the design, analysis and control of the
hydrometallurgical process (Liu and Papangelakis, 2005).
Ionic equilibrium and speciation calculations have gained increasing importance in
the simulation or modelling of chemical processes. The precipitation product formed
by hydrolysis is closely related to the species present at the aqueous solution.
Identification of these species becomes of importance in postulating mechanisms
which eventually lead to the formation of a precipitation product (Blakey, 1994).
Theoretically, given the availability of thermodynamic data for a range of
temperatures, the concentration-dependent species in aqueous electrolyte solution
can be described as functions of temperatures by solving a group of mathematical
equations (Cifuentes et al., 2006). Rafal et al. (1995) indicate that phase equilibrium
models involving an aqueous phase are generally more difficult to produce than
similar models which do not require describing an aqueous phase. Indeed, the main
Impurity Rejection in the Nickel Laterite Leach System
27
reasons for the complexity associated with modelling an aqueous solution include:
(1) describing the ionic speciation via dissociation, association, hydrolysis and
precipitation reactions; (2) the description of the non-ideal behavior of the aqueous
solution involving the mean activity coefficient and the different standard state of the
aqueous phases, which often requires sound physical-chemistry knowledge to derive
the mean activity coefficient models and select reliable thermodynamic data.
Generally, two basic theories are used to describe aqueous solution chemistry and
thermodynamics: (a) ion association, and (b) ion interaction. The former tends to
describe all the solution non-idealities in terms of various complex formations. This
method is based on the ionic strength principle (Johnson and Pytkowicz, 1979),
which normally uses equilibrium quotients that only depend on the ionic strength
instead of the activity coefficients of ionic species in aqueous solution. The latter,
pioneered by Pitzer (Pitzer, 1991), assumes no existence of any complexes or ion
association in solution, but interactions between simple ions. The calculation of these
interactions is based on virial expansion theory and often requires a fairly large set of
interaction coefficients to model a system with great complexity. In addition, one
needs to quantify a fairly large number of temperature-dependent parameters
describing the physicochemical interactions of all components present in the
solution. Unfortunately, there is presently no reliable way to estimate these
parameters; instead, these must be fitted to experimentally determined quantities,
such as osmotic coefficients (Pitzer, 1991).
In this chapter, the speciation of the mixed ferric and nickel sulphate aqueous system
over the pH range from 0 to 4 and temperature from 25 to 100°C is modelled by
considering the complex ionic equilibrium reactions and, mass- and charge-balance
equations. The Pitzer model is not used due to the complexity described above;
instead, a semi-empirical equation based on Debye-Hückel theory with the ionic
strength taken into account is used. This equation was initially derived by Vasil'eV
(1962), and recently has been utilized by several researchers in various systems
K.WANG
28
(Filippou et al., 1995; Wang and Breisinger, 1998). From both the experimental and
mathematical calculation point of view, it is also convenient to describe the non-
ideality of the solution using equilibrium constants which take into account the effect
of ionic strength. The speciation model developed can predict the effect of
temperature on the concentration distribution of species and estimate the pH values
of the system. In addition, the saturation index (SI) for iron oxides such as goethite,
ferrihydrite and schwertmannite can be calculated by the model in order to predict
whether the selected iron oxide will precipitate or dissolve in a specific solution.
3.2 SOLUTION CHEMICAL MODEL
3.2.1 Specify Fe3+ and Ni2+ species in sulphuric solutions
The dissociation of electrolytes and formation of complexes occur simultaneously in
electrolyte solutions. Casas et al. (2000) defined the term “species” as any chemical
entity present in solution, e.g. ion, complex and molecule; “components” as a
minimum number of species that allows complete description of the system. The
number of components for a system is constant and given by:
RSC NNN −= Eq. 3.1
where NC is the number of components, NS is the number of species and NR is the
number of independent chemical reactions of the solution.
When a simple metal cation enters an aqueous solution, it often reacts with water to
form complexes with hydroxide ion (Baes and Mesmer, 1981). This hydrolysis
process cannot be simply described as an ionic process, as the metallic cation
hydrolyzes usually in a stepwise manner to give a series of soluble species, e.g.
cations, neutral molecules, or anions. For the solution composition of interest in this
study, the important ionic equilibrium reactions include: (a) the hydrolysis reactions
of metal ions with H2O to give hydroxo complexes and protons, (b) the dissociation
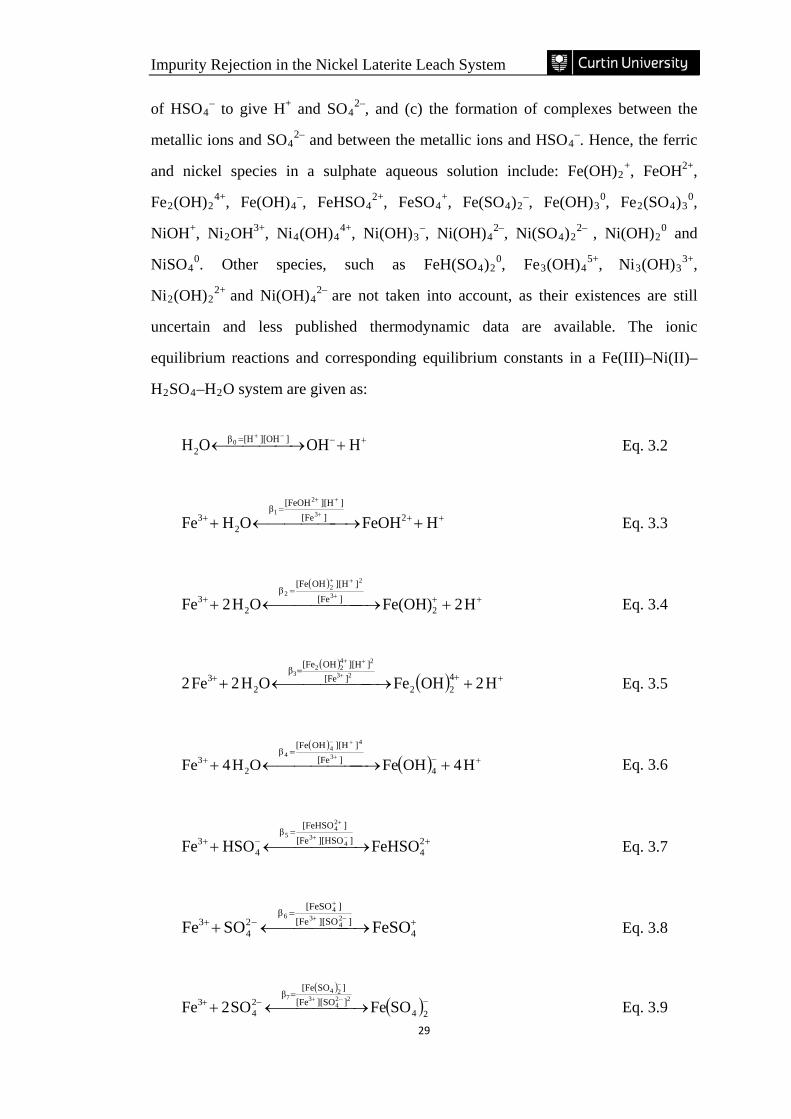
Impurity Rejection in the Nickel Laterite Leach System
29
of HSO4– to give H+ and SO4
2–, and (c) the formation of complexes between the
metallic ions and SO42– and between the metallic ions and HSO4
–. Hence, the ferric
and nickel species in a sulphate aqueous solution include: Fe(OH)2+, FeOH2+,
Fe2(OH)24+, Fe(OH)4
–, FeHSO42+, FeSO4
+, Fe(SO4)2–, Fe(OH)3
0, Fe2(SO4)30,
NiOH+, Ni2OH3+, Ni4(OH)44+, Ni(OH)3
–, Ni(OH)42–, Ni(SO4)2
2– , Ni(OH)20 and
NiSO40. Other species, such as FeH(SO4)2
0, Fe3(OH)45+, Ni3(OH)3
3+,
Ni2(OH)22+ and Ni(OH)4
2– are not taken into account, as their existences are still
uncertain and less published thermodynamic data are available. The ionic
equilibrium reactions and corresponding equilibrium constants in a Fe(III)–Ni(II)–
H2SO4–H2O system are given as:
+−= + →←−+
HOHOH ]][OH[Hβ2
0 Eq. 3.2
++=
+ + →←++
++
HFeOHOHFe 2][Fe]][H[FeOHβ
23 3
2
1
Eq. 3.3
( )
++=
+ + →←++
++
H2Fe(OH)OH2Fe 2][Fe
]][HOH[Feβ
23 3
22
2
Eq. 3.4
( )
( ) ++=
+ + →←++
++
H2OHFeOH2Fe2 422
][Fe]][HOH[Feβ
23 23
2422
3
Eq. 3.5
( )
( ) +−=
+ + →←++
+−
H4OHFeOH4Fe 4][Fe
]][HOH[Feβ
23 3
44
4
Eq. 3.6
+=
−+ →←+−+
+
24
]][HSO[Fe][FeHSO
β
43 FeHSOHSOFe 4
3
24
5
Eq. 3.7
+=
−+ →←+−+
+
4]][SO[Fe
][FeSOβ
24
3 FeSOSOFe24
34
6
Eq. 3.8
( )
( )−=
−+ →←+−+
−
24]][SO[Fe]SO[Fe
β24
3 SOFeSO2Fe22
43
247
Eq. 3.9
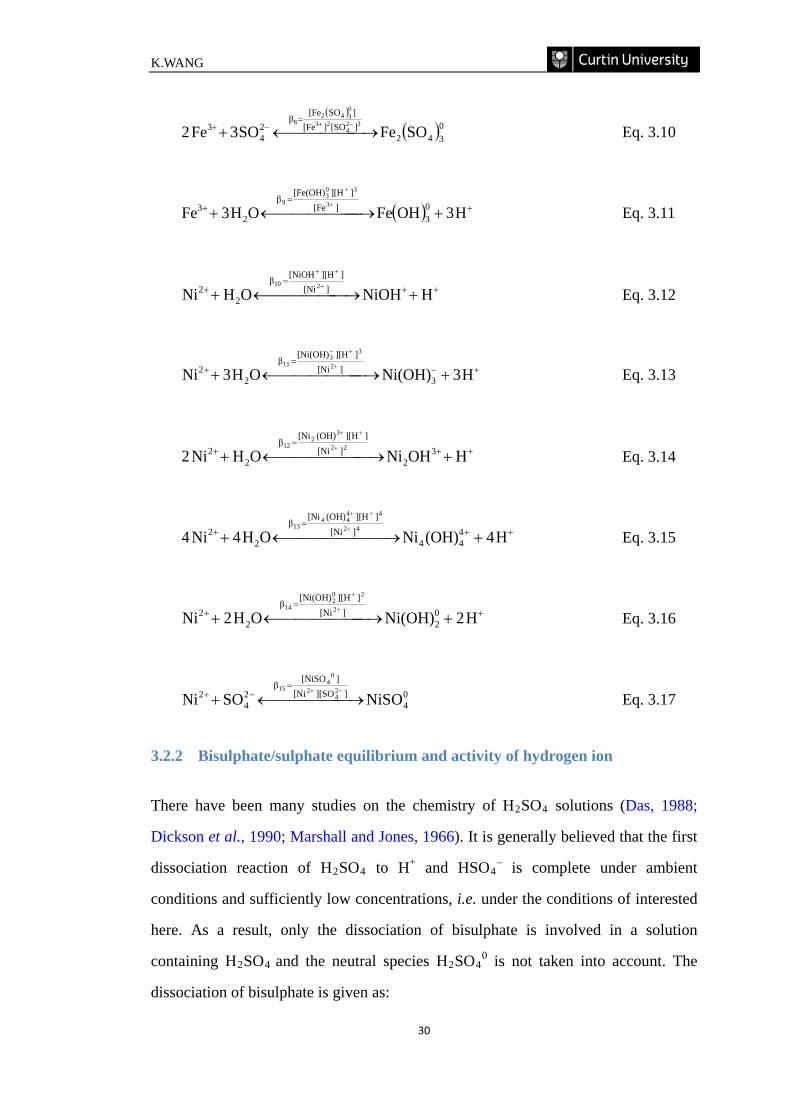
K.WANG
30
( )
( )0342][SO][Fe]SO[Fe
β24
3 SOFeSO3Fe232
423
0342
8
→←+−+=
−+ Eq. 3.10
( ) +=
+ + →←++
+
H3OHFeOH3Fe 03
][Fe]][H[Fe(OH)
β
23 3
303
9
Eq. 3.11
++=
+ + →←++
++
HNiOHOHNi ][Ni]][H[NiOHβ
22 210
Eq. 3.12
+−=
+ + →←++
+−
H3Ni(OH)OH3Ni 3][Ni
]][H[Ni(OH)β
22 2
33
11
Eq. 3.13
++=
+ + →←++
++
HOHNiOHNi2 32
][Ni]][H(OH)[Ni
β
22 22
32
21
Eq. 3.14
++=
+ + →←++
++
H4(OH)NiOH4Ni4 444
][Ni]][H(OH)[Ni
β
22 42
4444
31
Eq. 3.15
+=
+ + →←++
+
H2Ni(OH)OH2Ni 02
][Ni]][H[Ni(OH)
β
22 2
202
41
Eq. 3.16
04
]][SO[Ni][NiSO
β24
2 NiSOSONi24
2
04
51
→←+−+
=−+ Eq. 3.17
3.2.2 Bisulphate/sulphate equilibrium and activity of hydrogen ion
There have been many studies on the chemistry of H2SO4 solutions (Das, 1988;
Dickson et al., 1990; Marshall and Jones, 1966). It is generally believed that the first
dissociation reaction of H2SO4 to H+ and HSO4– is complete under ambient
conditions and sufficiently low concentrations, i.e. under the conditions of interested
here. As a result, only the dissociation of bisulphate is involved in a solution
containing H2SO4 and the neutral species H2SO40 is not taken into account. The
dissociation of bisulphate is given as:
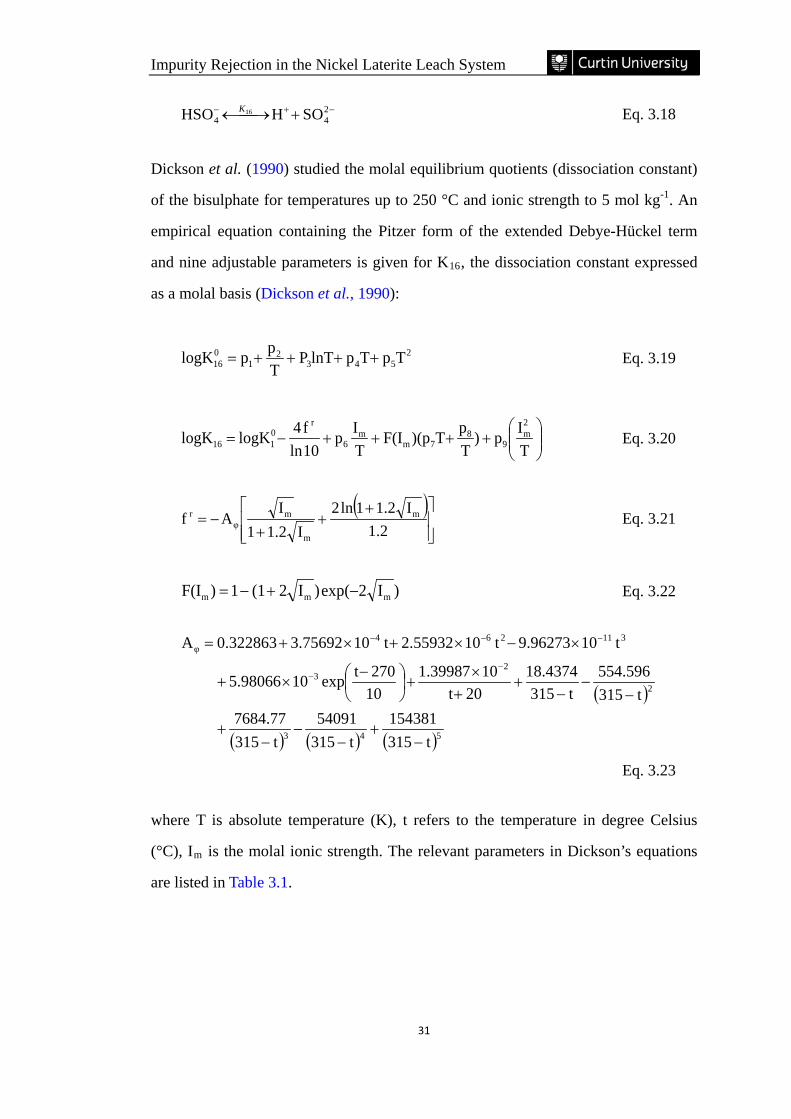
Impurity Rejection in the Nickel Laterite Leach System
31
−+− +→← 244 SOHHSO 61K Eq. 3.18
Dickson et al. (1990) studied the molal equilibrium quotients (dissociation constant)
of the bisulphate for temperatures up to 250 °C and ionic strength to 5 mol kg-1. An
empirical equation containing the Pitzer form of the extended Debye-Hückel term
and nine adjustable parameters is given for K16, the dissociation constant expressed
as a molal basis (Dickson et al., 1990):
2543
21
016 TpTplnTP
TpplogK ++++= Eq. 3.19
++++−=
TIp)
TpT)(pF(I
TIp
10lnf4logKlogK
2m
98
7mm
6
r0116 Eq. 3.20
( )
++
+−=
1.2I1.21ln2
I1.21I
Af m
m
mφ
r Eq. 3.21
)I2exp()I2(11)F(I mmm −+−= Eq. 3.22
( )
( ) ( ) ( )543
2
23
311264φ
t315154381
t31554091
t3157684.77
t315554.596
t31518.4374
20t101.39987
10270texp105.98066
t109.96273t102.55932t103.756920.322863A
−+
−−
−+
−−
−+
+×
+
−
×+
×−×+×+=−
−
−−−
Eq. 3.23
where T is absolute temperature (K), t refers to the temperature in degree Celsius
(°C), Im is the molal ionic strength. The relevant parameters in Dickson’s equations
are listed in Table 3.1.
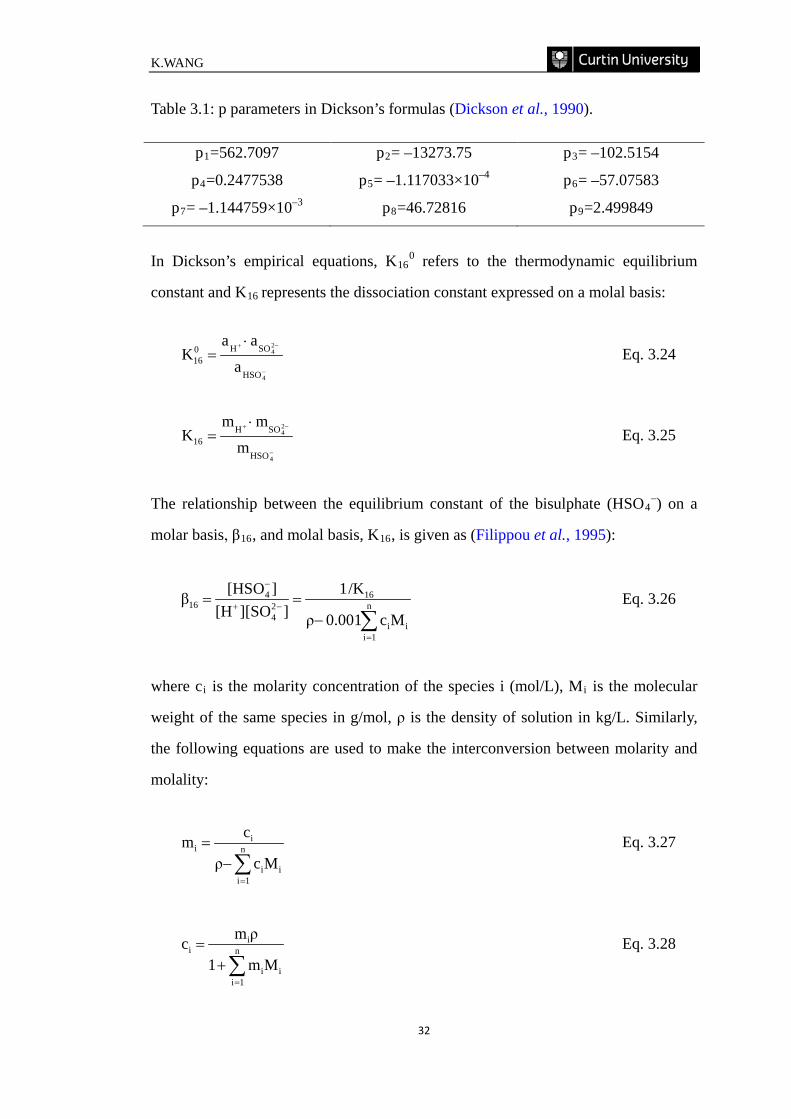
K.WANG
32
Table 3.1: p parameters in Dickson’s formulas (Dickson et al., 1990).
p1=562.7097 p2= –13273.75 p3= –102.5154
p4=0.2477538 p5= –1.117033×10⁻⁴ p6= –57.07583
p7= –1.144759×10⁻³ p8=46.72816 p9=2.499849
In Dickson’s empirical equations, K160 refers to the thermodynamic equilibrium
constant and K16 represents the dissociation constant expressed on a molal basis:
−
−+ ⋅=
4
24
HSO
SOH016 a
aaK Eq. 3.24
−
−+ ⋅=
4
24
HSO
SOH16 m
mmK Eq. 3.25
The relationship between the equilibrium constant of the bisulphate (HSO4–) on a
molar basis, β16, and molal basis, K16, is given as (Filippou et al., 1995):
∑=
−+
−
−== n
1iii
6124
461
Mc0.001ρ
/K1]][SO[H
][HSOβ Eq. 3.26
where ci is the molarity concentration of the species i (mol/L), Mi is the molecular
weight of the same species in g/mol, ρ is the density of solution in kg/L. Similarly,
the following equations are used to make the interconversion between molarity and
molality:
∑=
−= n
1iii
ii
Mcρ
cm Eq. 3.27
∑=
+= n
1iii
ii
Mm1
ρmc Eq. 3.28
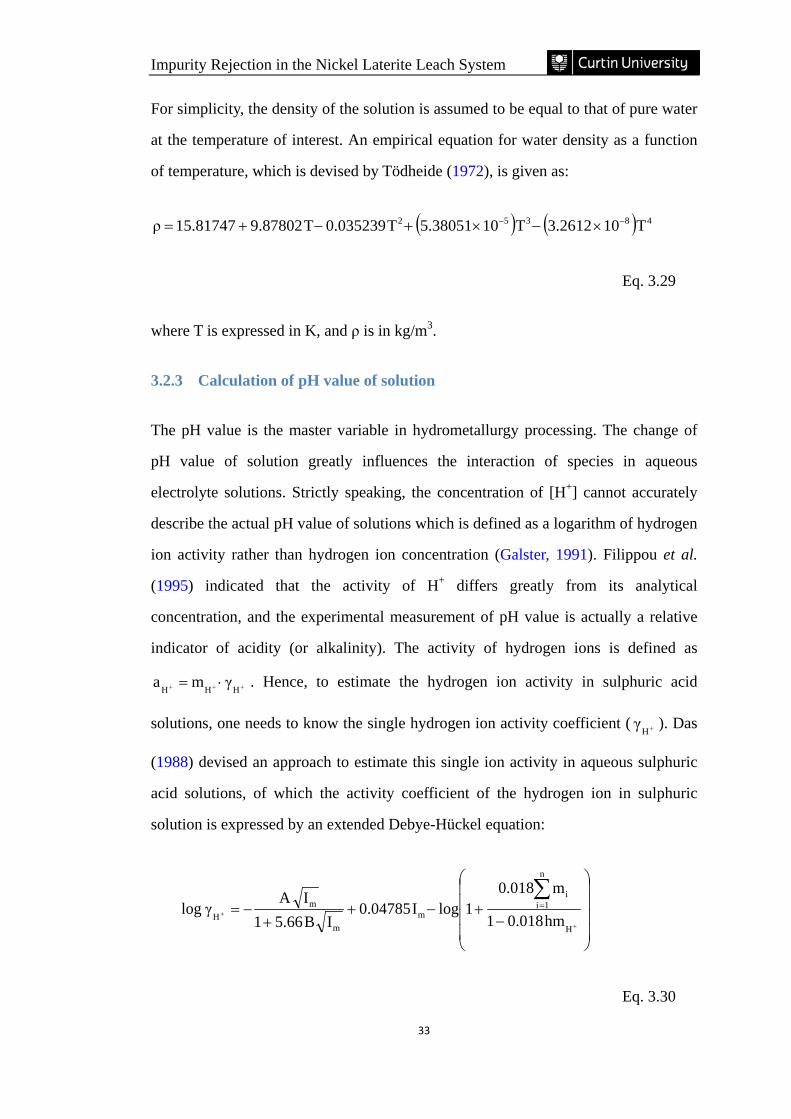
Impurity Rejection in the Nickel Laterite Leach System
33
For simplicity, the density of the solution is assumed to be equal to that of pure water
at the temperature of interest. An empirical equation for water density as a function
of temperature, which is devised by Tödheide (1972), is given as:
( ) ( ) 48352 T103.2612T105.38051T0.035239T9.8780215.81747ρ −− ×−×+−+=
Eq. 3.29
where T is expressed in K, and ρ is in kg/m3.
3.2.3 Calculation of pH value of solution
The pH value is the master variable in hydrometallurgy processing. The change of
pH value of solution greatly influences the interaction of species in aqueous
electrolyte solutions. Strictly speaking, the concentration of [H+] cannot accurately
describe the actual pH value of solutions which is defined as a logarithm of hydrogen
ion activity rather than hydrogen ion concentration (Galster, 1991). Filippou et al.
(1995) indicated that the activity of H+ differs greatly from its analytical
concentration, and the experimental measurement of pH value is actually a relative
indicator of acidity (or alkalinity). The activity of hydrogen ions is defined as
+++ ⋅= HHH γma . Hence, to estimate the hydrogen ion activity in sulphuric acid
solutions, one needs to know the single hydrogen ion activity coefficient ( +Hγ ). Das
(1988) devised an approach to estimate this single ion activity in aqueous sulphuric
acid solutions, of which the activity coefficient of the hydrogen ion in sulphuric
solution is expressed by an extended Debye-Hückel equation:
−+−+
+−=
+
+
∑=
H
n
1ii
mm
mH hm0.0181
m0.0181logI0.04785
IB5.661IA
γlog
Eq. 3.30
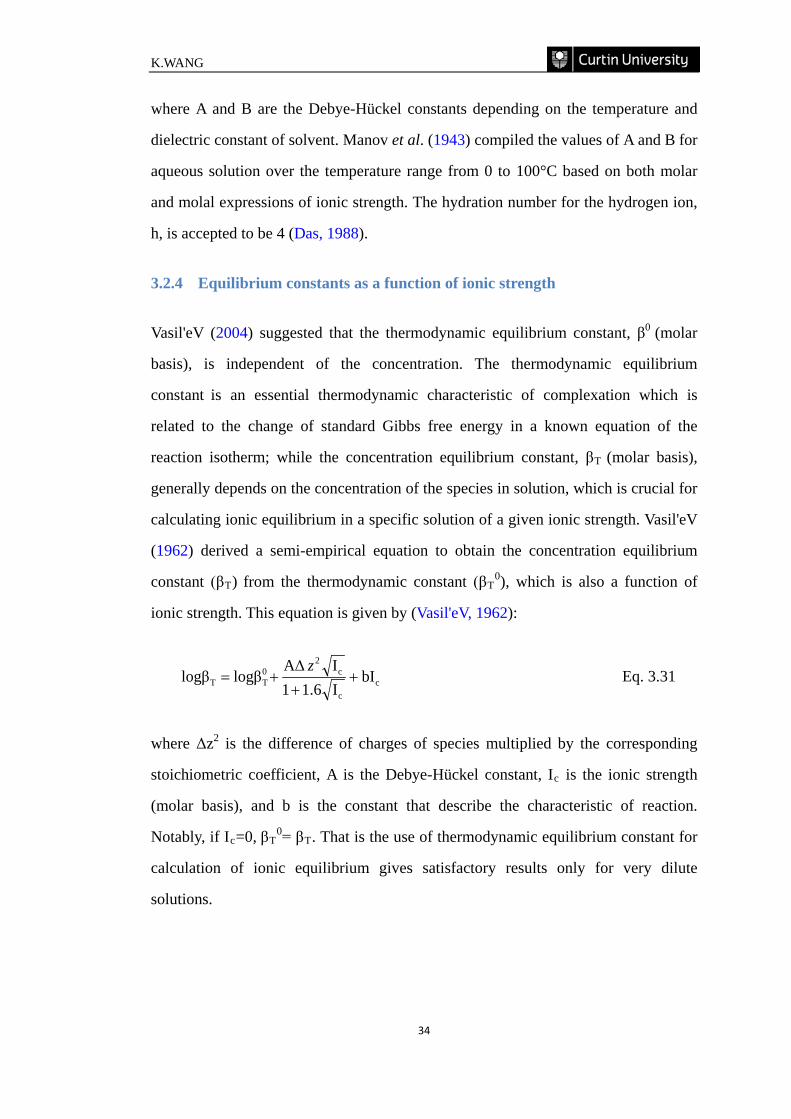
K.WANG
34
where A and B are the Debye-Hückel constants depending on the temperature and
dielectric constant of solvent. Manov et al. (1943) compiled the values of A and B for
aqueous solution over the temperature range from 0 to 100°C based on both molar
and molal expressions of ionic strength. The hydration number for the hydrogen ion,
h, is accepted to be 4 (Das, 1988).
3.2.4 Equilibrium constants as a function of ionic strength
Vasil'eV (2004) suggested that the thermodynamic equilibrium constant, β0 (molar
basis), is independent of the concentration. The thermodynamic equilibrium
constant is an essential thermodynamic characteristic of complexation which is
related to the change of standard Gibbs free energy in a known equation of the
reaction isotherm; while the concentration equilibrium constant, βT (molar basis),
generally depends on the concentration of the species in solution, which is crucial for
calculating ionic equilibrium in a specific solution of a given ionic strength. Vasil'eV
(1962) derived a semi-empirical equation to obtain the concentration equilibrium
constant (βT) from the thermodynamic constant (βT0), which is also a function of
ionic strength. This equation is given by (Vasil'eV, 1962):
cc
c2
0TT bI
I1.61IAΔ
logβlogβ ++
+=z
Eq. 3.31
where Δz2 is the difference of charges of species multiplied by the corresponding
stoichiometric coefficient, A is the Debye-Hückel constant, Ic is the ionic strength
(molar basis), and b is the constant that describe the characteristic of reaction.
Notably, if Ic=0, βT0= βT. That is the use of thermodynamic equilibrium constant for
calculation of ionic equilibrium gives satisfactory results only for very dilute
solutions.
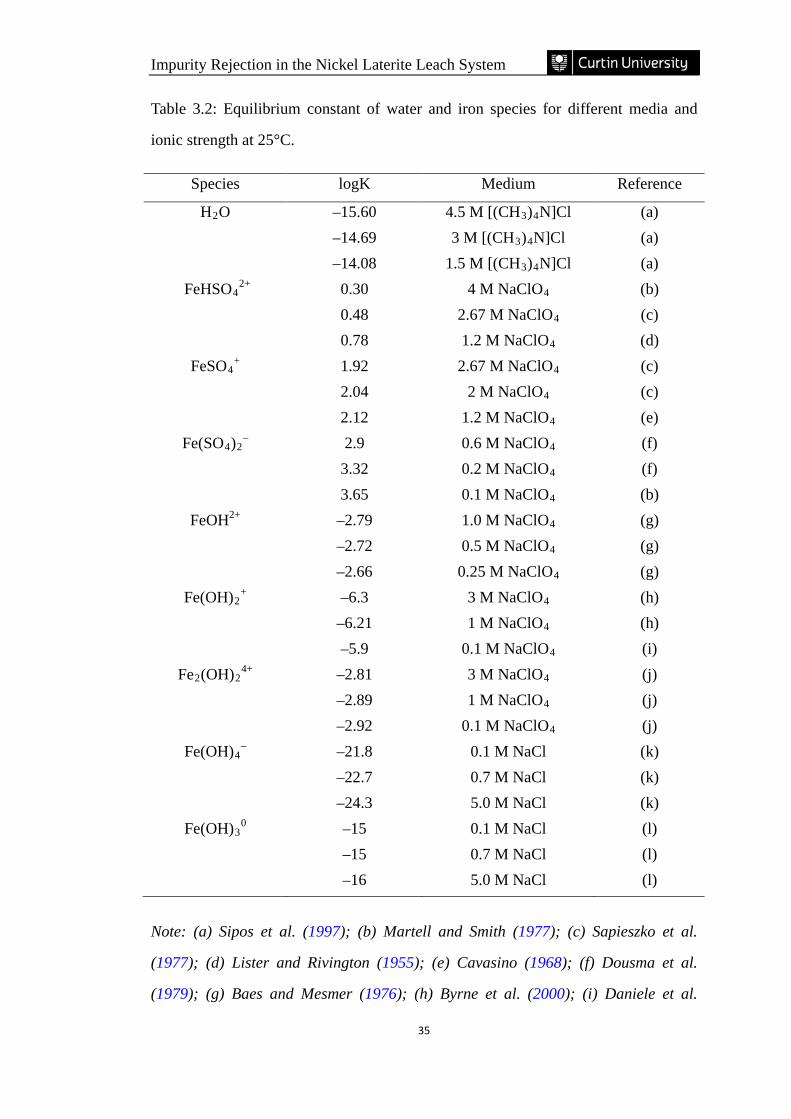
Impurity Rejection in the Nickel Laterite Leach System
35
Table 3.2: Equilibrium constant of water and iron species for different media and
ionic strength at 25°C.
Species logK Medium Reference
H2O –15.60 4.5 M [(CH3)4N]Cl (a) –14.69 3 M [(CH3)4N]Cl (a) –14.08 1.5 M [(CH3)4N]Cl (a)
FeHSO42+ 0.30 4 M NaClO4 (b)
0.48 2.67 M NaClO4 (c) 0.78 1.2 M NaClO4 (d)
FeSO4+ 1.92 2.67 M NaClO4 (c)
2.04 2 M NaClO4 (c) 2.12 1.2 M NaClO4 (e)
Fe(SO4)2– 2.9 0.6 M NaClO4 (f)
3.32 0.2 M NaClO4 (f) 3.65 0.1 M NaClO4 (b)
FeOH2+ –2.79 1.0 M NaClO4 (g) –2.72 0.5 M NaClO4 (g) –2.66 0.25 M NaClO4 (g)
Fe(OH)2+ –6.3 3 M NaClO4 (h)
–6.21 1 M NaClO4 (h) –5.9 0.1 M NaClO4 (i)
Fe2(OH)24+ –2.81 3 M NaClO4 (j)
–2.89 1 M NaClO4 (j) –2.92 0.1 M NaClO4 (j)
Fe(OH)4– –21.8 0.1 M NaCl (k)
–22.7 0.7 M NaCl (k) –24.3 5.0 M NaCl (k)
Fe(OH)30 –15 0.1 M NaCl (l)
–15 0.7 M NaCl (l) –16 5.0 M NaCl (l)
Note: (a) Sipos et al. (1997); (b) Martell and Smith (1977); (c) Sapieszko et al.
(1977); (d) Lister and Rivington (1955); (e) Cavasino (1968); (f) Dousma et al.
(1979); (g) Baes and Mesmer (1976); (h) Byrne et al. (2000); (i) Daniele et al.
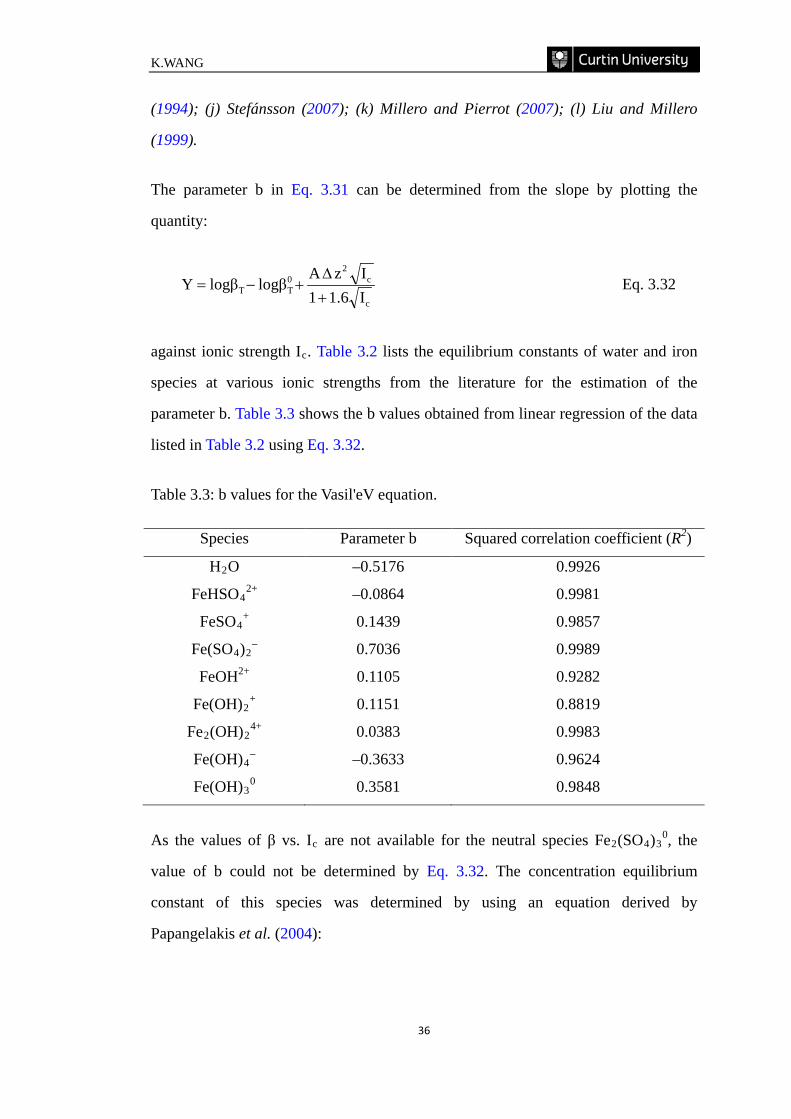
K.WANG
36
(1994); (j) Stefánsson (2007); (k) Millero and Pierrot (2007); (l) Liu and Millero
(1999).
The parameter b in Eq. 3.31 can be determined from the slope by plotting the
quantity:
c
c2
0TT I1.61
IzAlogβlogβY
+∆
+−= Eq. 3.32
against ionic strength Ic. Table 3.2 lists the equilibrium constants of water and iron
species at various ionic strengths from the literature for the estimation of the
parameter b. Table 3.3 shows the b values obtained from linear regression of the data
listed in Table 3.2 using Eq. 3.32.
Table 3.3: b values for the Vasil'eV equation.
Species Parameter b Squared correlation coefficient (R2)
H2O –0.5176 0.9926
FeHSO42+ –0.0864 0.9981
FeSO4+ 0.1439 0.9857
Fe(SO4)2– 0.7036 0.9989
FeOH2+ 0.1105 0.9282
Fe(OH)2+ 0.1151 0.8819
Fe2(OH)24+ 0.0383 0.9983
Fe(OH)4– –0.3633 0.9624
Fe(OH)30 0.3581 0.9848
As the values of β vs. Ic are not available for the neutral species Fe2(SO4)30, the
value of b could not be determined by Eq. 3.32. The concentration equilibrium
constant of this species was determined by using an equation derived by
Papangelakis et al. (2004):
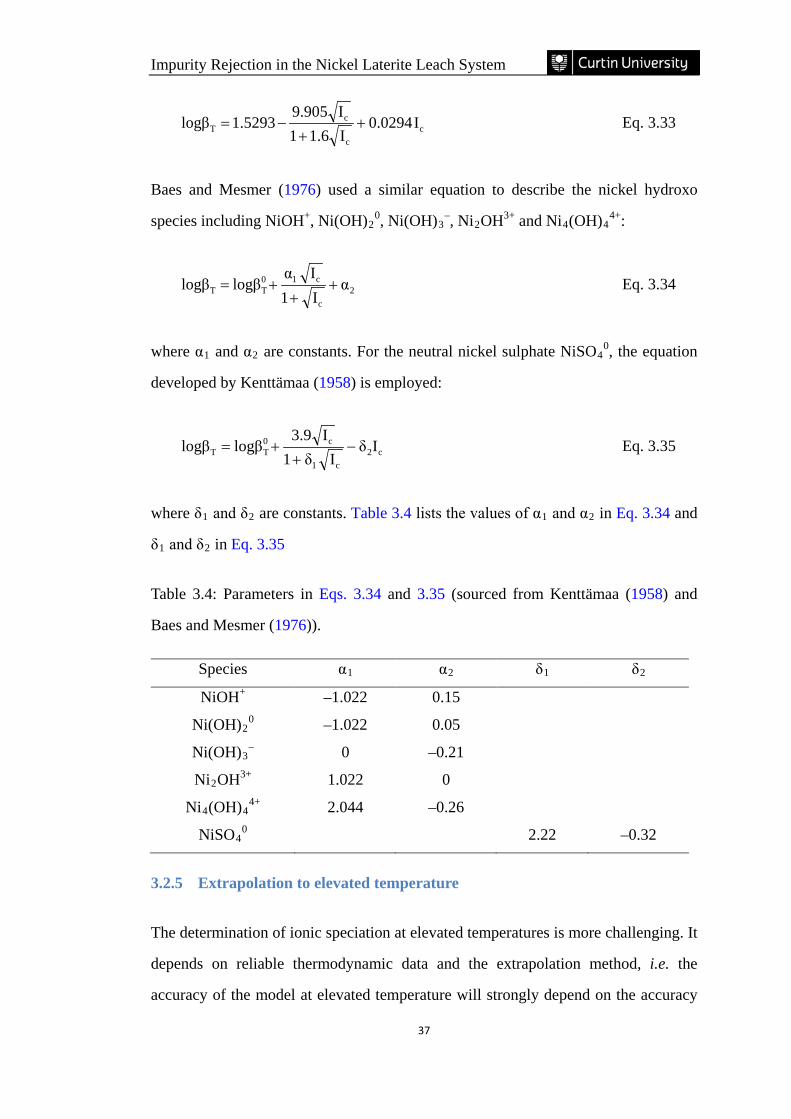
Impurity Rejection in the Nickel Laterite Leach System
37
cc
cT I0.0294
I1.61I9.905
1.5293logβ ++
−= Eq. 3.33
Baes and Mesmer (1976) used a similar equation to describe the nickel hydroxo
species including NiOH+, Ni(OH)20, Ni(OH)3
–, Ni2OH3+ and Ni4(OH)44+:
2c
c10TT α
I1Iα
logβlogβ ++
+= Eq. 3.34
where α1 and α2 are constants. For the neutral nickel sulphate NiSO40, the equation
developed by Kenttämaa (1958) is employed:
c2c1
c0TT Iδ
Iδ1I3.9
logβlogβ −+
+= Eq. 3.35
where δ1 and δ2 are constants. Table 3.4 lists the values of α1 and α2 in Eq. 3.34 and
δ1 and δ2 in Eq. 3.35
Table 3.4: Parameters in Eqs. 3.34 and 3.35 (sourced from Kenttämaa (1958) and
Baes and Mesmer (1976)).
Species α1 α2 δ1 δ2
NiOH+ –1.022 0.15
Ni(OH)20 –1.022 0.05
Ni(OH)3– 0 –0.21
Ni2OH3+ 1.022 0
Ni4(OH)44+ 2.044 –0.26
NiSO40 2.22 –0.32
3.2.5 Extrapolation to elevated temperature
The determination of ionic speciation at elevated temperatures is more challenging. It
depends on reliable thermodynamic data and the extrapolation method, i.e. the
accuracy of the model at elevated temperature will strongly depend on the accuracy
K.WANG
38
of the equilibrium constant value and the extrapolation of it to elevated temperature.
The thermodynamic equilibrium constant at temperature T can be obtained from the
changes of standard Gibbs free energy ∆GT0:
0T
0T RTlnβΔG −= Eq. 3.36
where R is the universal gas constant (8.314 J/mol∙K), T is the temperature in Kelvin
(K). The value of ∆GT0 can be obtained at temperatures higher than 298K when the
standard entropy change of the reaction at 298K (∆S2980) and the corresponding heat
capacity (∆Cp0) are known:
dTT
ΔCTΔS298)(TdTΔCΔGΔG
T
298
0p0
298
T
298
0p
0298
0T ∫∫ −−−+= Eq. 3.37
However, the values of heat capacity for some species participating in equilibrium
reactions are not always available. In such cases, extrapolation to calculate the
temperature-dependent thermodynamic properties for aqueous ions becomes
important. The well-known approaches include the van’t Hoff isochore (Burkin,
2001), the Criss-Cobble entropy correspondence principle (Criss and Cobble, 1964a;
1964b) and Helgeson’s extrapolation (Helgeson, 1967). According to the van’t Hoff
isochore, the enthalpy of the reaction, ∆H0, is assumed to be constant over the
temperature range. This assumption on constant enthalpy is equivalent to neglecting
the effect of heat capacity. Thus, the van’t Hoff isochore is strictly valid only at low
concentration and over a small temperature range. For the Criss-Cobble method
(Criss and Cobble, 1964a; 1964b), the heat capacity is assumed to be constant instead
of zero. However, some researchers (Blakey and Papangelakis, 1996; Liu and
Papangelakis, 2005) indicated that the main limitation of Criss and Cobble’s method
is the lack of model parameters for certain species, such as neutral species and metal
oxyanions. Alternatively, Helgeson (1967) assumed that the ratio of heat capacity
change at reference temperature (∆Cp,r0(T)) to the electrostatic contribution to the
Impurity Rejection in the Nickel Laterite Leach System
39
heat capacity change (∆Cp,e0(T)) is constant. This assumption gives fairly good
accuracy at temperatures below 150°C. Above this temperature limit, the influence of
the electrostatic contribution becomes strong, as the dielectric constant of water
decreases with increasing temperature. Based on this assumption, an approximation
of the equilibrium constant at any given temperature below 150°C can be estimated
by the following Helgeson equation (Jackson and Helgeson, 1985):
( )
RT2.303ΔH
θ298.15TθTθθexpexp1
θθ298.15
RT2.303ΔSlogβ
0298.15
1543
2
10298.150
T
−
−+++−−=
Eq. 3.38
The θ in the Eq. 3.38 represent the temperature-independent constants: θ1=219,
θ2=1.003229, θ3=−12.741, θ4=0.01875, and θ5=−0.000784. Table 3.5 lists the
thermodynamic data that was used to estimate the required equilibrium constants.
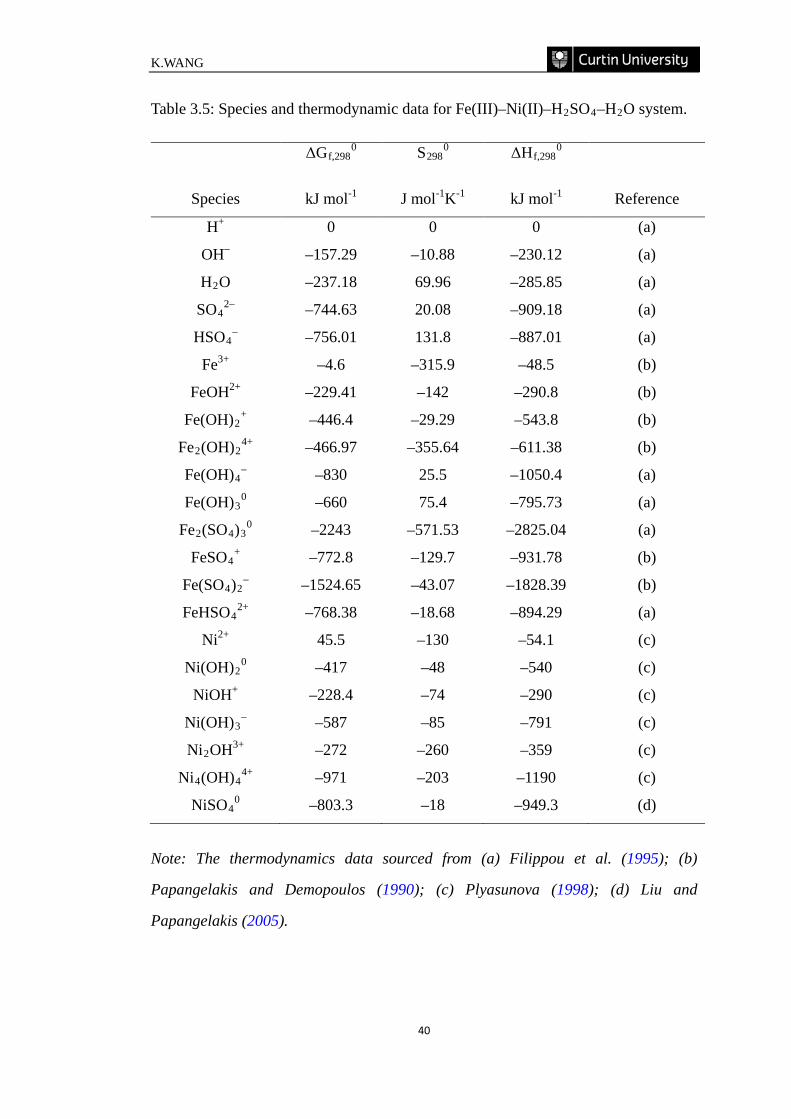
K.WANG
40
Table 3.5: Species and thermodynamic data for Fe(III)–Ni(II)–H2SO4–H2O system.
Species
ΔGf,2980
kJ mol-1
S2980
J mol-1K-1
ΔHf,2980
kJ mol-1
Reference
H+ 0 0 0 (a)
OH– –157.29 –10.88 –230.12 (a)
H2O –237.18 69.96 –285.85 (a)
SO42– –744.63 20.08 –909.18 (a)
HSO4– –756.01 131.8 –887.01 (a)
Fe3+ –4.6 –315.9 –48.5 (b)
FeOH2+ –229.41 –142 –290.8 (b)
Fe(OH)2+ –446.4 –29.29 –543.8 (b)
Fe2(OH)24+ –466.97 –355.64 –611.38 (b)
Fe(OH)4– –830 25.5 –1050.4 (a)
Fe(OH)30 –660 75.4 –795.73 (a)
Fe2(SO4)30 –2243 –571.53 –2825.04 (a)
FeSO4+ –772.8 –129.7 –931.78 (b)
Fe(SO4)2– –1524.65 –43.07 –1828.39 (b)
FeHSO42+ –768.38 –18.68 –894.29 (a)
Ni2+ 45.5 –130 –54.1 (c)
Ni(OH)20 –417 –48 –540 (c)
NiOH+ –228.4 –74 –290 (c)
Ni(OH)3– –587 –85 –791 (c)
Ni2OH3+ –272 –260 –359 (c)
Ni4(OH)44+ –971 –203 –1190 (c)
NiSO40 –803.3 –18 –949.3 (d)
Note: The thermodynamics data sourced from (a) Filippou et al. (1995); (b)
Papangelakis and Demopoulos (1990); (c) Plyasunova (1998); (d) Liu and
Papangelakis (2005).
Impurity Rejection in the Nickel Laterite Leach System
41
3.2.6 Saturation index
The dissolution and precipitation equilibrium between a sparingly soluble iron oxide
and the concentration of its ions in a saturated solution are often described by the
solubility product (Kso) (Cornell and Schwertmann, 2003). Take the dissolution of
goethite in water as an example:
−++→←+ OH3FeOHFeOOH 32 Eq. 3.39
At equilibrium, the solubility product is given by:
3OHFeso aaK 3 −+ ⋅= Eq. 3.40
where +3Fea and −OHa are the activities of Fe3+ and OH–, respectively. In an acid
solution, Eq.3.39 is often described as:
OH2FeH3FeOOH 23 +→←+ ++ Eq. 3.41
The corresponding solubility product is given by:
3HFeso aaK 3−∗
++ ⋅= Eq. 3.42
Comparison of Eqs 3.40 and 3.42, Kso and K*so has the relationship:
3Wsoso KKK ⋅= ∗ Eq. 3.43
where Kw is the ion product of water. The value of Kw depends on ionic strength and
temperature. At 25 ºC and in low ionic strength solution, logKw =13.99 (Cornell and
Schwertmann, 2003).
Table 3.6 tabulates the reported solubility products of goethite, ferrihydrite and
schwertmannite. Notably, the general trend in solubility follows the order:
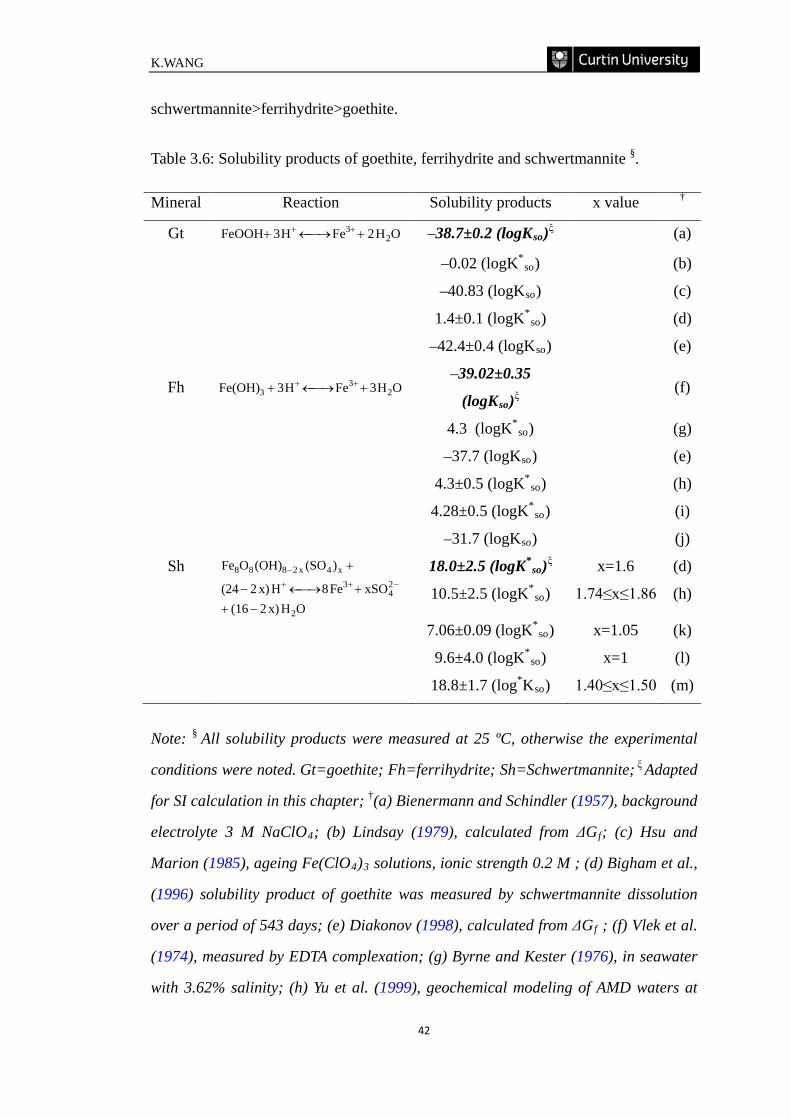
K.WANG
42
schwertmannite>ferrihydrite>goethite.
Table 3.6: Solubility products of goethite, ferrihydrite and schwertmannite §.
Mineral Reaction Solubility products x value †
Gt OH2FeH3FeOOH 23 +→←+ ++ –38.7±0.2 (logKso)ξ (a)
–0.02 (logK*so) (b)
–40.83 (logKso) (c)
1.4±0.1 (logK*so) (d)
–42.4±0.4 (logKso) (e)
Fh OH3FeH3Fe(OH) 23
3 +→←+ ++ –39.02±0.35
(logKso)ξ (f)
4.3 (logK*so) (g)
–37.7 (logKso) (e)
4.3±0.5 (logK*so) (h)
4.28±0.5 (logK*so) (i)
–31.7 (logKso) (j)
Sh
OHx)2(16xSOFe8Hx)2(24
)(SO(OH)OFe
2
24
3x4x2888
−++→←−
+−++
−
18.0±2.5 (logK*
so)ξ x=1.6 (d)
10.5±2.5 (logK*so) 1.74≤x≤1.86 (h)
7.06±0.09 (logK*so) x=1.05 (k)
9.6±4.0 (logK*so) x=1 (l)
18.8±1.7 (log*Kso) 1.40≤x≤1.50 (m)
Note: § All solubility products were measured at 25 ºC, otherwise the experimental
conditions were noted. Gt=goethite; Fh=ferrihydrite; Sh=Schwertmannite; ξ Adapted
for SI calculation in this chapter; †(a) Bienermann and Schindler (1957), background
electrolyte 3 M NaClO4; (b) Lindsay (1979), calculated from ΔGf; (c) Hsu and
Marion (1985), ageing Fe(ClO4)3 solutions, ionic strength 0.2 M ; (d) Bigham et al.,
(1996) solubility product of goethite was measured by schwertmannite dissolution
over a period of 543 days; (e) Diakonov (1998), calculated from ΔGf ; (f) Vlek et al.
(1974), measured by EDTA complexation; (g) Byrne and Kester (1976), in seawater
with 3.62% salinity; (h) Yu et al. (1999), geochemical modeling of AMD waters at
Impurity Rejection in the Nickel Laterite Leach System
43
15 ºC; (i) Byrne and Luo (2000), in 0.7 M NaClO4 solutions; (j) Fox (1988), derived
both from measurements of dissolved ferric ion over a pH range from 2.5 to 6.7 and
electrochemical values reported in the literature; (k) Kawano and Tomita (2001),
dissolution of aged natural samples at 30 ºC; (l) Majzlan et al. (2004), calculated
from ΔGf; (m) Sánchez-España et al (2011), titration of pit lake waters.
Saturation index (SI) is the logarithm of the quotient of the ion activity product (IAP)
and solubility product (Kso) (Appelo and Postma, 2005):
soK
IAPlogSI = Eq. 3.44
where IAP is the product of free ion species activity that is determined from
analytical concentrations by considering ionic strength, temperature and complex
formation (Appelo and Postma, 2005).
For dissolution-precipitation equilibrium, Gibbs free energy (∆G) is given by:
SIn
RT2.303KIAPln
nRTΔG
so
⋅−=⋅−= Eq. 3.45
When SI=0, ∆G=0, the solution is in equilibrium; when SI<0, ∆G>0, the solution is
undersaturated; when SI>0, ∆G<0, the solution is saturated.
The activity of ion species is expressed as the product of ion concentration and its
activity coefficient. The activity coefficients of ferric and sulphate ions during SI
calculation in this chapter are determined by Davies equation (Davies, 1962):
)I0.3I1
I(AZlogγ mm
m2ii −
+−= Eq. 3.46
where γi is the activity coefficient, A is the Debye-Hückel constant, Zi is the charge
of ion i , Im is the ionic strength on a molal basis.
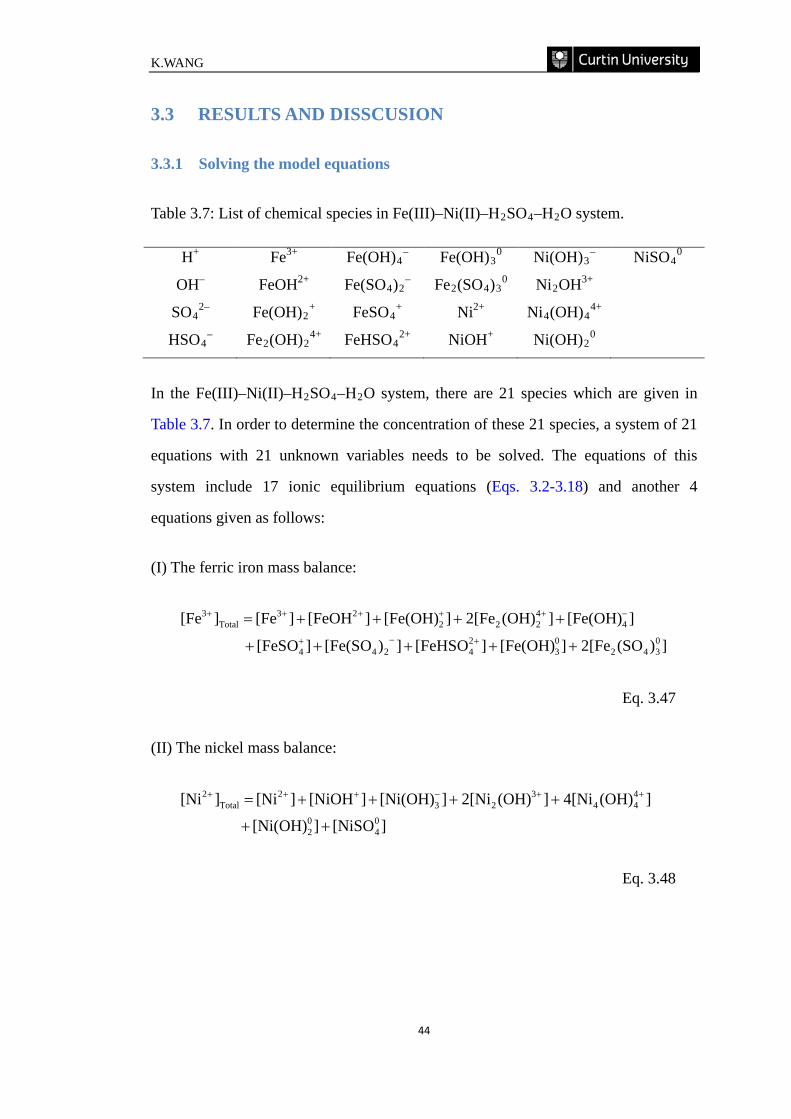
K.WANG
44
3.3 RESULTS AND DISSCUSION
3.3.1 Solving the model equations
Table 3.7: List of chemical species in Fe(III)–Ni(II)–H2SO4–H2O system.
H+ Fe3+ Fe(OH)4– Fe(OH)3
0 Ni(OH)3– NiSO4
0
OH– FeOH2+ Fe(SO4)2– Fe2(SO4)3
0 Ni2OH3+
SO42– Fe(OH)2
+ FeSO4+ Ni2+ Ni4(OH)4
4+
HSO4– Fe2(OH)2
4+ FeHSO42+ NiOH+ Ni(OH)2
0
In the Fe(III)–Ni(II)–H2SO4–H2O system, there are 21 species which are given in
Table 3.7. In order to determine the concentration of these 21 species, a system of 21
equations with 21 unknown variables needs to be solved. The equations of this
system include 17 ionic equilibrium equations (Eqs. 3.2-3.18) and another 4
equations given as follows:
(I) The ferric iron mass balance:
])(SO2[Fe][Fe(OH)][FeHSO])[Fe(SO][FeSO
][Fe(OH)](OH)2[Fe][Fe(OH)][FeOH][Fe][Fe0342
03
24244
44222
23Total
3
+++++
++++=+−+
−+++++
Eq. 3.47
(II) The nickel mass balance:
][NiSO][Ni(OH)
](OH)4[Ni](OH)2[Ni][Ni(OH)][NiOH][Ni][Ni04
02
444
323
2Total
2
++
++++= ++−+++
Eq. 3.48
Impurity Rejection in the Nickel Laterite Leach System
45
(III) The sulphate mass balance:
][NiSO][HSO
])(SO3[Fe][FeHSO])2[Fe(SO][FeSO][SO][SO044
0342
24244
24Total
24
++
++++=−
+−+−−
Eq. 3.49
(IV) The charge balance:
]2[SO][HSO][OH ][Ni(OH)])[Fe(SO
][Fe(OH)][H](OH)4[Ni]OH3[Ni][NiOH]2[Ni
]2[FeHSO][FeSO](OH)[Fe4][Fe(OH)]2[FeOH]3[Fe
244324
4444
32
2
244
4222
23
−−−−−
−+++++
++++++
+++++
=+++++
+++++
Eq. 3.50
The 21 species in the Fe(III)–Ni(II)–H2SO4–H2O system can be further reduced to
four key components (Fe3+, Ni2+, SO42– and H+), i.e. other species can all be
described by these “building blocks”. If the concentrations of all these key
components are known, the concentration of any other species can be calculated. For
instance, the concentrations of OH– and Fe(OH)2+ can be described as:
10 ][HβOH −+− = Eq. 3.51
1310
2 ]][H[FeββFeOH −+++ = Eq. 3.52
Eqs. 3.46 to 3.49 can be rearranged as:
0][SO][Feβ2]][H[Feβ
]][SO][H[Feββ]][SO[Feβ]][SO[Feβ]][H[Feβ
][H][Feβ2]][H[Feβ]][H[Feβ][Fe][Fe
324
238
339
24
3615
224
37
24
36
434
2233
232
131
3Total
3
=−−
−−−−
−−−−
−+−++
−++−+−+−++
−++−++−++++
Eq. 3.53
K.WANG
46
0]][SO[Niβ]][H[Niβ][H][Niβ4][H][Niβ2
]][H[Niβ]][H[Niβ][Ni][Ni24
251
2241
44231
12221
3211
1210
2Total
2
=−−−−
−−−−+−++−++−++
−++−++++
Eq. 3.54
0]][SO[Niβ
]][SO[Hβ][SO][Feβ3]][SO][H[Feββ
]][SO[Feβ2]][SO[Feβ][SO][SO
24
251
2461
324
238
24
3615
224
37
24
36
24Total
24
=−
−−−
−−−
−+
−+−+−++
−+−+−−
Eq. 3.55
0]2[SO]][SO[Hβ][Hβ
]][H[Niβ]][SO[Feβ]][H[Feβ][H][H][Niβ4
][H][Niβ3]][H[Niβ]2[Ni]][SO][H[Feββ2
]][SO[Feβ][H][Feβ4]][H[Feβ]][H[Feβ2]3[Fe
24
2461
10
3211
224
37
434
44231
12221
1210
224
3615
24
36
2233
232
131
3
=−−−
−−−++
++++
++++
−−+−+
−++−+−+++−++
−++−+++−++
−+−++−++−+++
Eq. 3.56
Eqs. 3.53-3.56 are non-linear equations containing only four key components (Fe3+,
Ni2+, SO42– and H+). In order to solve these non-linear equations, a Microsoft® Visual
C++ computer program was written that utilized the Newton-Raphson method
(Albarède, 1995). The complete computer program is given in Appendix A. The
conceptual flowchart of this calculation procedure is described in Figure 3.1.
The initial assumption is that all the electrolytes are completely dissociated, thus only
Fe3+, Ni2+, SO42– and H+ ions exist in the aqueous solution. Guess and input the initial
values of those species:
−−=
−==
++−
+−+
total3
total2
total24
zitotal
24free42
][Fe23][Ni][SO2
][M23][SO2]SO2[H][H i
Eq. 3.57
Impurity Rejection in the Nickel Laterite Leach System
47
total24
024 ][SO][SO −− = Eq. 3.58
total202 ][Ni][Ni ++ = Eq. 3.59
total303 ][Fe][Fe ++ = Eq. 3.60
In terms of Eq. 3.56, the hydrogen ion is assumed to only come from the free acid
corresponding to the total sulphate minus that bound to metals, stoichometrically
assuming simply sulphate (Rubisov and Papangelakis, 2000).
Based on the initial input values of the key components, the initial ionic strength on a
molar basis, Ic0, can be calculated accordingly:
)]9[Fe]4[Ni]4[SO]([H21zc
21I 030202
40
n
1i
2ii
0c
++−+
=
+++== ∑ Eq. 3.61
After solving the nonlinear equations (Eqs. 3.53-3.56), the new concentrations of
Fe3+, Ni2+, SO42– and H+ ions can be obtained. The concentrations of various species
can also be obtained according to the corresponding equilibrium reactions. When a
complete set of concentration values was obtained, the new ionic strength, Ic, can
then be calculated:
])(OH)16[Ni]OH9[Ni][Ni(OH)][NiOH])[Fe(SO][FeSO
]4[FeHSO][Fe(OH)](OH)16[Fe][Fe(OH)]4[FeOH
]9[Fe]4[Ni][HSO]4[SO][OH]([H21zc
21I
444
323244
244
4222
2
324
24
1n
1i
2iic
++−+−+
+−+++
++−−−+
=
++++++
+++++
+++++== ∑
Eq. 3.62
The accuracy of the calculated model is evaluated by comparing the new obtained Ic
to the initial Ic0. The final calculation for hydrogen ion activity and pH value of the
system are conducted only when the relative error of those two ionic strengths is
within an acceptable level.
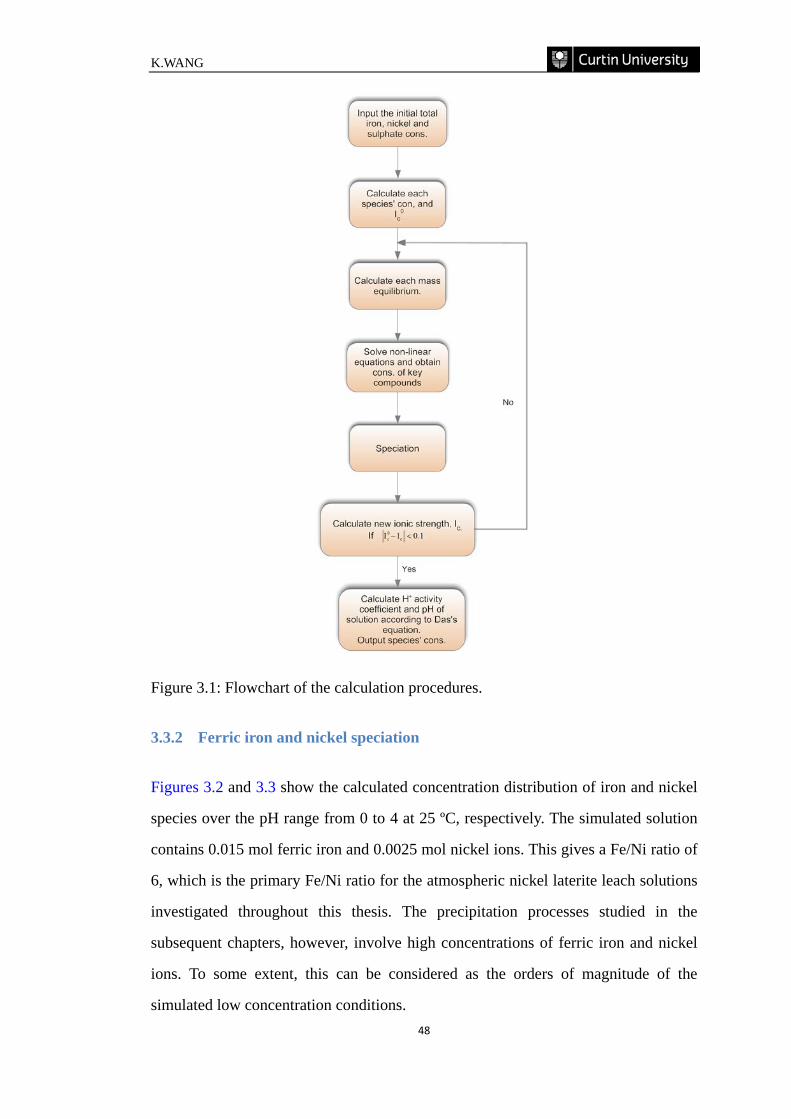
K.WANG
48
Figure 3.1: Flowchart of the calculation procedures.
3.3.2 Ferric iron and nickel speciation
Figures 3.2 and 3.3 show the calculated concentration distribution of iron and nickel
species over the pH range from 0 to 4 at 25 ºC, respectively. The simulated solution
contains 0.015 mol ferric iron and 0.0025 mol nickel ions. This gives a Fe/Ni ratio of
6, which is the primary Fe/Ni ratio for the atmospheric nickel laterite leach solutions
investigated throughout this thesis. The precipitation processes studied in the
subsequent chapters, however, involve high concentrations of ferric iron and nickel
ions. To some extent, this can be considered as the orders of magnitude of the
simulated low concentration conditions.
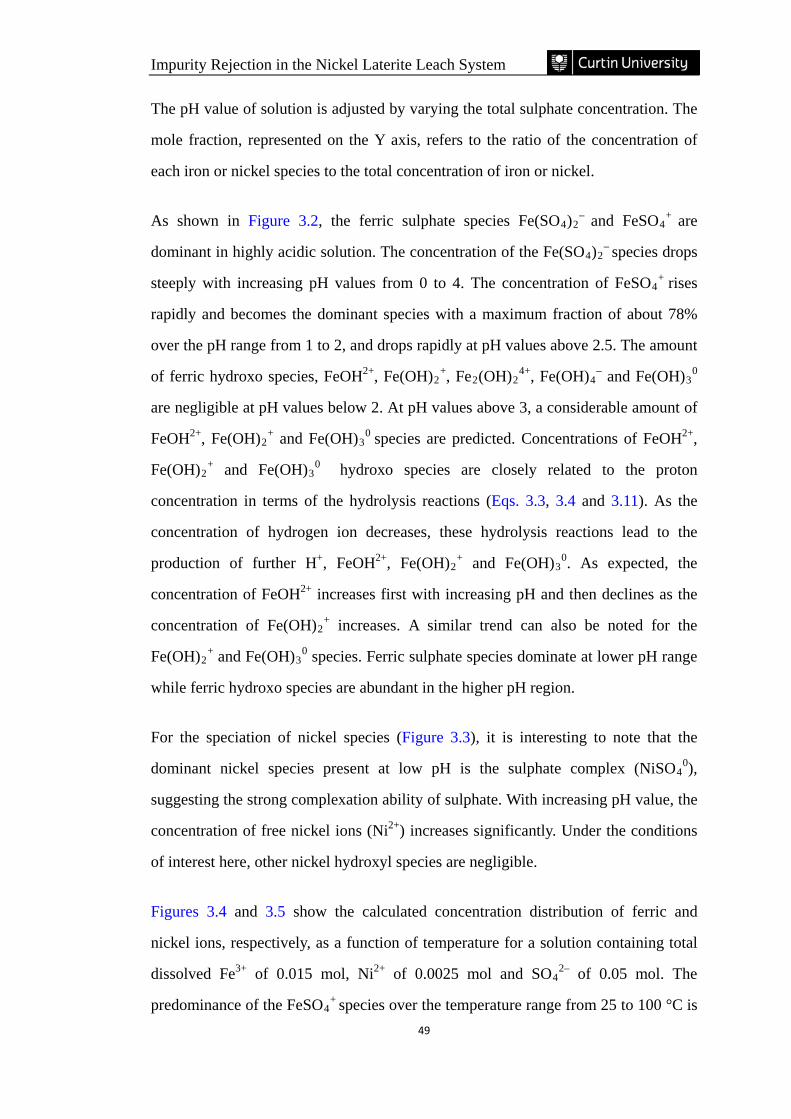
Impurity Rejection in the Nickel Laterite Leach System
49
The pH value of solution is adjusted by varying the total sulphate concentration. The
mole fraction, represented on the Y axis, refers to the ratio of the concentration of
each iron or nickel species to the total concentration of iron or nickel.
As shown in Figure 3.2, the ferric sulphate species Fe(SO4)2– and FeSO4
+ are
dominant in highly acidic solution. The concentration of the Fe(SO4)2– species drops
steeply with increasing pH values from 0 to 4. The concentration of FeSO4+ rises
rapidly and becomes the dominant species with a maximum fraction of about 78%
over the pH range from 1 to 2, and drops rapidly at pH values above 2.5. The amount
of ferric hydroxo species, FeOH2+, Fe(OH)2+, Fe2(OH)2
4+, Fe(OH)4– and Fe(OH)3
0
are negligible at pH values below 2. At pH values above 3, a considerable amount of
FeOH2+, Fe(OH)2+ and Fe(OH)3
0 species are predicted. Concentrations of FeOH2+,
Fe(OH)2+ and Fe(OH)3
0 hydroxo species are closely related to the proton
concentration in terms of the hydrolysis reactions (Eqs. 3.3, 3.4 and 3.11). As the
concentration of hydrogen ion decreases, these hydrolysis reactions lead to the
production of further H+, FeOH2+, Fe(OH)2+ and Fe(OH)3
0. As expected, the
concentration of FeOH2+ increases first with increasing pH and then declines as the
concentration of Fe(OH)2+ increases. A similar trend can also be noted for the
Fe(OH)2+ and Fe(OH)3
0 species. Ferric sulphate species dominate at lower pH range
while ferric hydroxo species are abundant in the higher pH region.
For the speciation of nickel species (Figure 3.3), it is interesting to note that the
dominant nickel species present at low pH is the sulphate complex (NiSO40),
suggesting the strong complexation ability of sulphate. With increasing pH value, the
concentration of free nickel ions (Ni2+) increases significantly. Under the conditions
of interest here, other nickel hydroxyl species are negligible.
Figures 3.4 and 3.5 show the calculated concentration distribution of ferric and
nickel ions, respectively, as a function of temperature for a solution containing total
dissolved Fe3+ of 0.015 mol, Ni2+ of 0.0025 mol and SO42– of 0.05 mol. The
predominance of the FeSO4+ species over the temperature range from 25 to 100 °C is
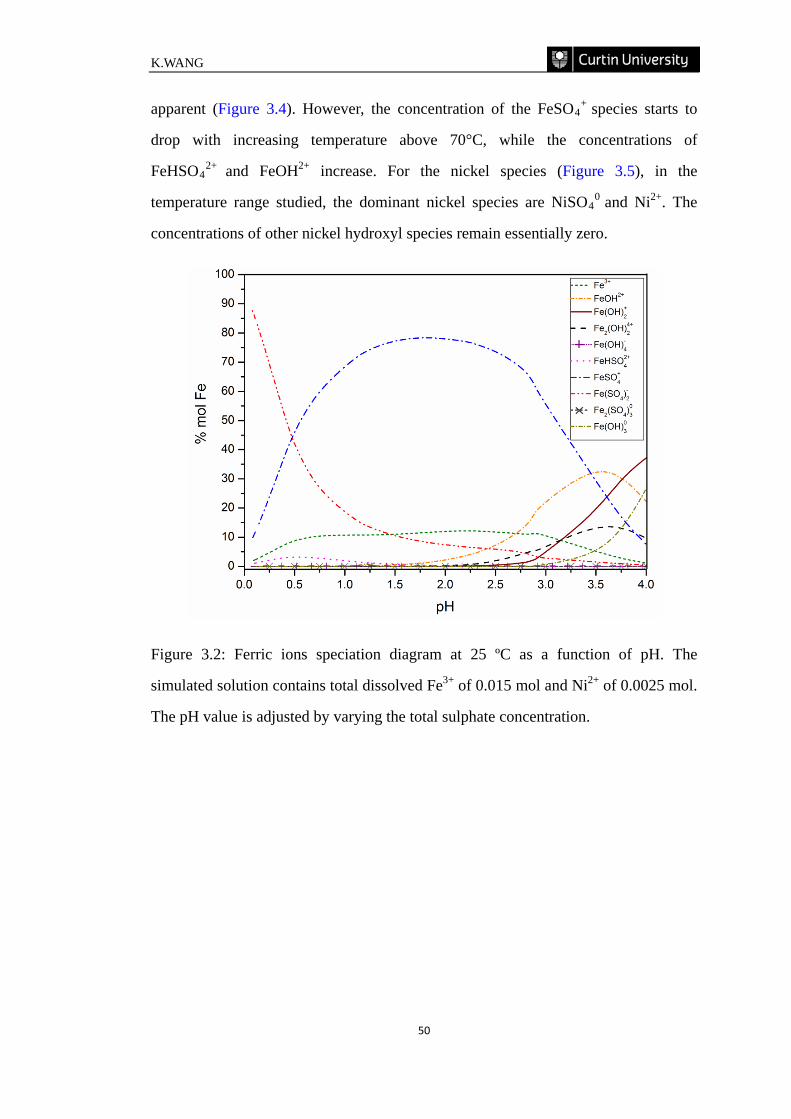
K.WANG
50
apparent (Figure 3.4). However, the concentration of the FeSO4+ species starts to
drop with increasing temperature above 70°C, while the concentrations of
FeHSO42+ and FeOH2+ increase. For the nickel species (Figure 3.5), in the
temperature range studied, the dominant nickel species are NiSO40 and Ni2+. The
concentrations of other nickel hydroxyl species remain essentially zero.
Figure 3.2: Ferric ions speciation diagram at 25 ºC as a function of pH. The
simulated solution contains total dissolved Fe3+ of 0.015 mol and Ni2+ of 0.0025 mol.
The pH value is adjusted by varying the total sulphate concentration.
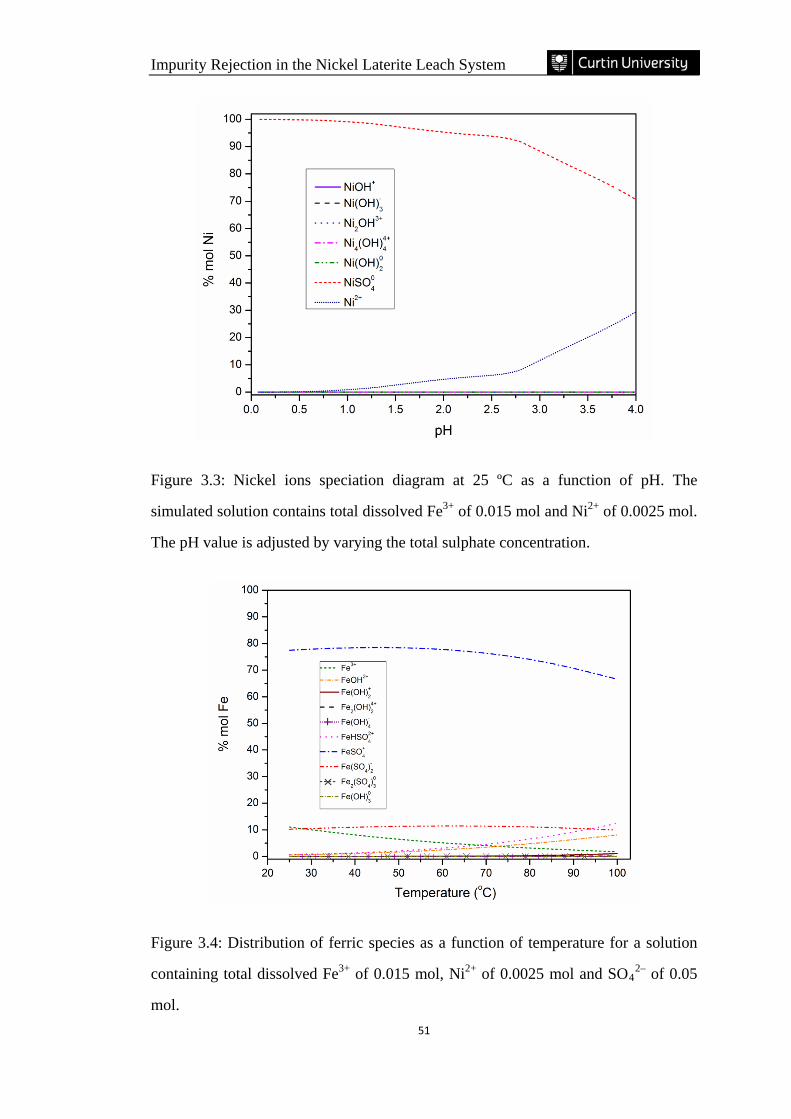
Impurity Rejection in the Nickel Laterite Leach System
51
Figure 3.3: Nickel ions speciation diagram at 25 ºC as a function of pH. The
simulated solution contains total dissolved Fe3+ of 0.015 mol and Ni2+ of 0.0025 mol.
The pH value is adjusted by varying the total sulphate concentration.
Figure 3.4: Distribution of ferric species as a function of temperature for a solution
containing total dissolved Fe3+ of 0.015 mol, Ni2+ of 0.0025 mol and SO42– of 0.05
mol.
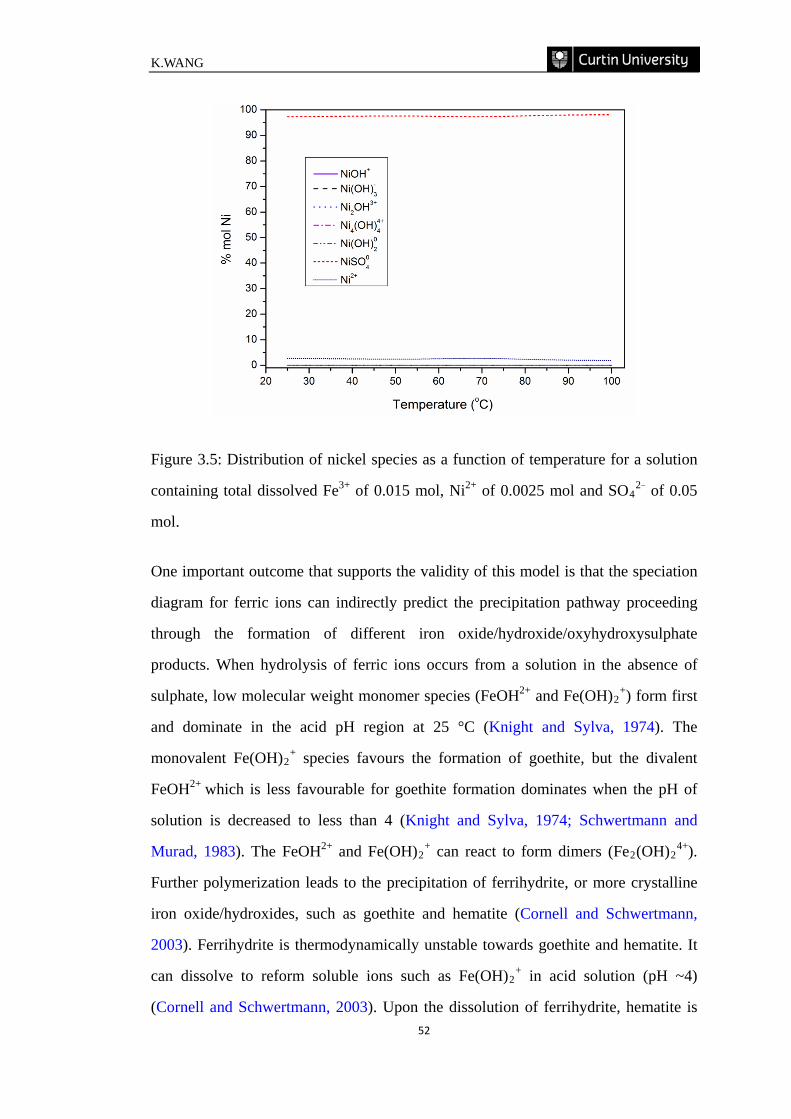
K.WANG
52
Figure 3.5: Distribution of nickel species as a function of temperature for a solution
containing total dissolved Fe3+ of 0.015 mol, Ni2+ of 0.0025 mol and SO42‒ of 0.05
mol.
One important outcome that supports the validity of this model is that the speciation
diagram for ferric ions can indirectly predict the precipitation pathway proceeding
through the formation of different iron oxide/hydroxide/oxyhydroxysulphate
products. When hydrolysis of ferric ions occurs from a solution in the absence of
sulphate, low molecular weight monomer species (FeOH2+ and Fe(OH)2+) form first
and dominate in the acid pH region at 25 °C (Knight and Sylva, 1974). The
monovalent Fe(OH)2+ species favours the formation of goethite, but the divalent
FeOH2+ which is less favourable for goethite formation dominates when the pH of
solution is decreased to less than 4 (Knight and Sylva, 1974; Schwertmann and
Murad, 1983). The FeOH2+ and Fe(OH)2+ can react to form dimers (Fe2(OH)2
4+).
Further polymerization leads to the precipitation of ferrihydrite, or more crystalline
iron oxide/hydroxides, such as goethite and hematite (Cornell and Schwertmann,
2003). Ferrihydrite is thermodynamically unstable towards goethite and hematite. It
can dissolve to reform soluble ions such as Fe(OH)2+ in acid solution (pH ~4)
(Cornell and Schwertmann, 2003). Upon the dissolution of ferrihydrite, hematite is
Impurity Rejection in the Nickel Laterite Leach System
53
formed via FeOH2+ at pH <4, while the formation of goethite is favoured at pH about
4 where the maximum of Fe(OH)2+ is achieved (Knight and Sylva, 1974;
Schwertmann and Murad, 1983). In the presence of sulphate, the FeSO4+ is
predominant, and the formation of FeSO4+ strongly suppresses the polymerization of
hydroxyl species and the precipitation of goethite (Parida and Das, 1996). Similar
conclusions were presented by Matijević et al. (1975), Musić et al. (1994) and
Sapieszko et al. (1977). The Fe2(OH)24+ species rarely occurs in low concentration
in a sulphate solution. Rather, the hydroxo-forms of Fe(III) exist in the form of
mixed hydroxyl sulphate complexes Fe2(OH)2(SO4)x4-2x (Yakovlev et al., 1977). The
Fe-OH-SO4 species are not taken into account in the model calculation, as their
existences are still uncertain and little published thermodynamic data are available.
However, such species are important in sulphate aqueous solution and are reported to
be the precursors of the poorly defined oxyhydroxysulfates which have close
relationship with schwertmannite (Kiyama and Takada, 1973; Stipp, 1990; Zinck and
Dutrizac, 1998).
3.3.3 Predicting solution pH
Using the developed speciation model, it is possible to calculate the activity of the
hydrogen ion and hence the pH value of the solution. The result of such a calculation
for the solution containing 0.01 mol Fe3+, 0.01 mol Ni2+ and 0.025 mol SO42– at
various temperatures is graphed in Figure 3.6 (solid line). In general, the model
predicts that pH of the solution decreases progressively with increasing temperature.
In order to test the model, pH measurements at various temperatures were conducted.
In these experiments, a beaker containing a sulphuric solution with nickel and iron of
unknown pH value was immersed into a thermostatically controlled oil bath. The pH
measurement system consisted of a TPS® AQUA pH meter and a METTLER
TOLEDO® pH electrode (InLab® Versatile) which has a working temperature range
from 0 to 100 °C. The pH electrode was calibrated before the measurement using pH
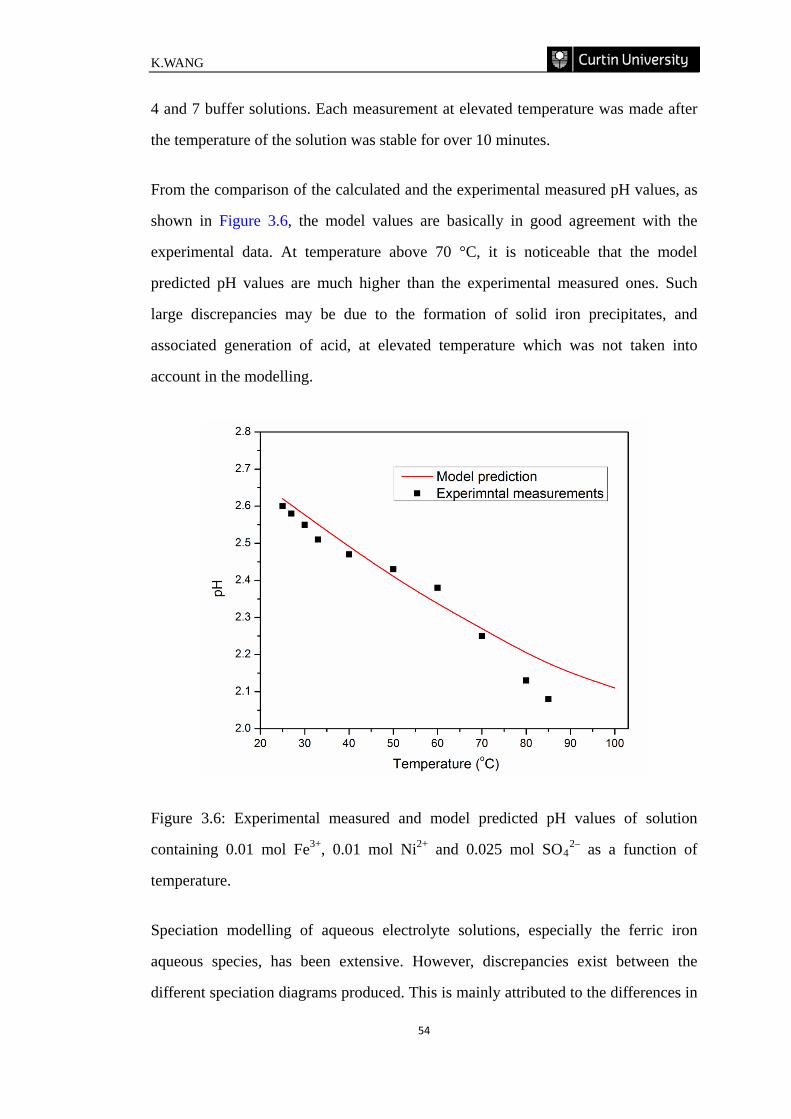
K.WANG
54
4 and 7 buffer solutions. Each measurement at elevated temperature was made after
the temperature of the solution was stable for over 10 minutes.
From the comparison of the calculated and the experimental measured pH values, as
shown in Figure 3.6, the model values are basically in good agreement with the
experimental data. At temperature above 70 °C, it is noticeable that the model
predicted pH values are much higher than the experimental measured ones. Such
large discrepancies may be due to the formation of solid iron precipitates, and
associated generation of acid, at elevated temperature which was not taken into
account in the modelling.
Figure 3.6: Experimental measured and model predicted pH values of solution
containing 0.01 mol Fe3+, 0.01 mol Ni2+ and 0.025 mol SO42– as a function of
temperature.
Speciation modelling of aqueous electrolyte solutions, especially the ferric iron
aqueous species, has been extensive. However, discrepancies exist between the
different speciation diagrams produced. This is mainly attributed to the differences in
Impurity Rejection in the Nickel Laterite Leach System
55
the thermodynamic data and modelling methods. Table 3.5 gives a comparison
between the calculated data obtained in this study and the values obtained by other
researchers. Filippou et al. (1995) in this study used a similar thermodynamic
database and modelling method to simulate the aqueous electrolyte solution. Hence,
excellent agreements exist between the values calculated in the present work and the
data previously reported by Filippou et al. (1995). Comparison is also made between
the data obtained in the present work and the values calculated by the Visual
MINTEQ® ver 3.0 computer software package. Visual MINTEQ® is a chemical
equilibrium model for the calculation of metal speciation and solubility equilibrium
for natural water, which is freely available in the public domain (Gustafsson, 2011).
It can be seen from Table 3.8 that good agreement exists for the sulphate only
solutions. More significant discrepancies exist when the simulated solution contains
ferric iron and/or nickel ions. This may be attributed to the different thermodynamic
databases and models used for ion activity correction. In the Visual MINTEQ®
software, all the values of equilibrium constants and thermodynamic data are sourced
from MINTEQA2 database. The aqueous FeHSO42+, Fe2(SO4)3
0, Ni2OH3+ and
Ni4(OH)44+ species that are taken into account for the calculation in this study are not
included in the MINTEQA2 database. In addition, the default method using in Visual
MINTEQ® software for ion activity correction is the Specific Ion Interaction (SIT)
model. Within this model, the parameters for cation-cation and anion-anion
combinations are neglected. The electrostatic term of the SIT model also gives an
inaccurate description of single electrolyte activity (Pivovarov, 2005).
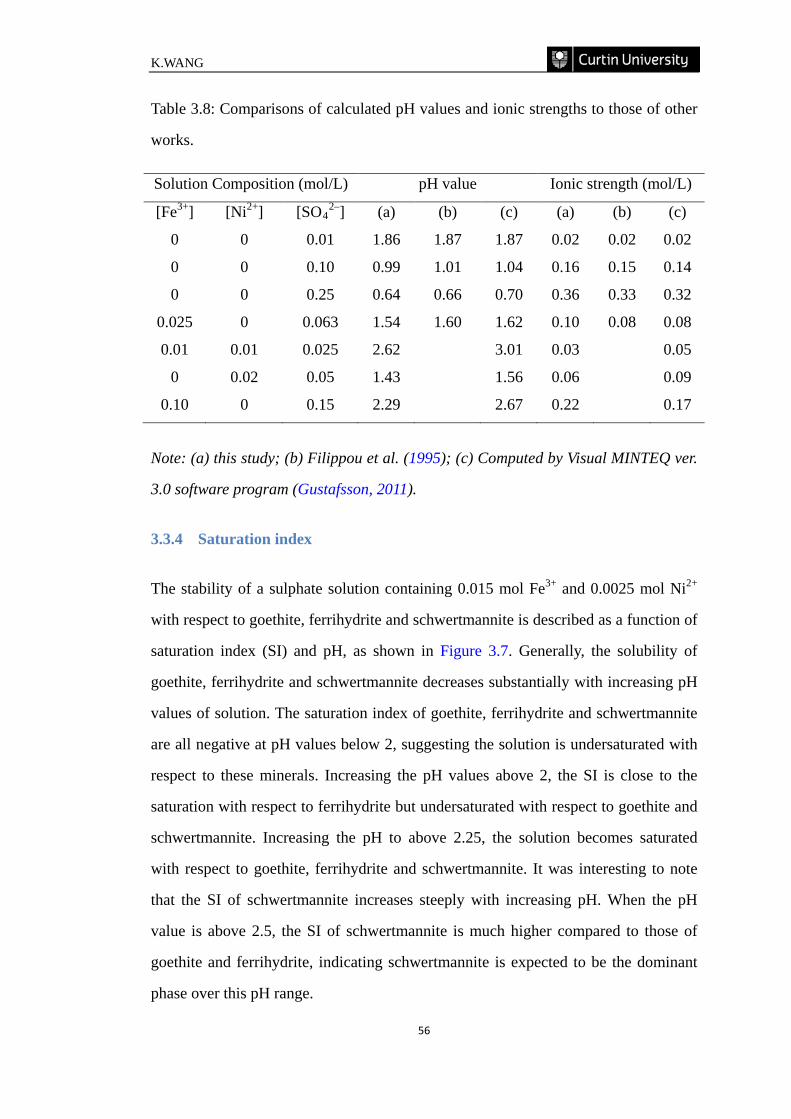
K.WANG
56
Table 3.8: Comparisons of calculated pH values and ionic strengths to those of other
works.
Solution Composition (mol/L) pH value Ionic strength (mol/L)
[Fe3+] [Ni2+] [SO42–] (a) (b) (c) (a) (b) (c)
0 0 0.01 1.86 1.87 1.87 0.02 0.02 0.02
0 0 0.10 0.99 1.01 1.04 0.16 0.15 0.14
0 0 0.25 0.64 0.66 0.70 0.36 0.33 0.32
0.025 0 0.063 1.54 1.60 1.62 0.10 0.08 0.08
0.01 0.01 0.025 2.62 3.01 0.03 0.05
0 0.02 0.05 1.43 1.56 0.06 0.09
0.10 0 0.15 2.29 2.67 0.22 0.17
Note: (a) this study; (b) Filippou et al. (1995); (c) Computed by Visual MINTEQ ver.
3.0 software program (Gustafsson, 2011).
3.3.4 Saturation index
The stability of a sulphate solution containing 0.015 mol Fe3+ and 0.0025 mol Ni2+
with respect to goethite, ferrihydrite and schwertmannite is described as a function of
saturation index (SI) and pH, as shown in Figure 3.7. Generally, the solubility of
goethite, ferrihydrite and schwertmannite decreases substantially with increasing pH
values of solution. The saturation index of goethite, ferrihydrite and schwertmannite
are all negative at pH values below 2, suggesting the solution is undersaturated with
respect to these minerals. Increasing the pH values above 2, the SI is close to the
saturation with respect to ferrihydrite but undersaturated with respect to goethite and
schwertmannite. Increasing the pH to above 2.25, the solution becomes saturated
with respect to goethite, ferrihydrite and schwertmannite. It was interesting to note
that the SI of schwertmannite increases steeply with increasing pH. When the pH
value is above 2.5, the SI of schwertmannite is much higher compared to those of
goethite and ferrihydrite, indicating schwertmannite is expected to be the dominant
phase over this pH range.
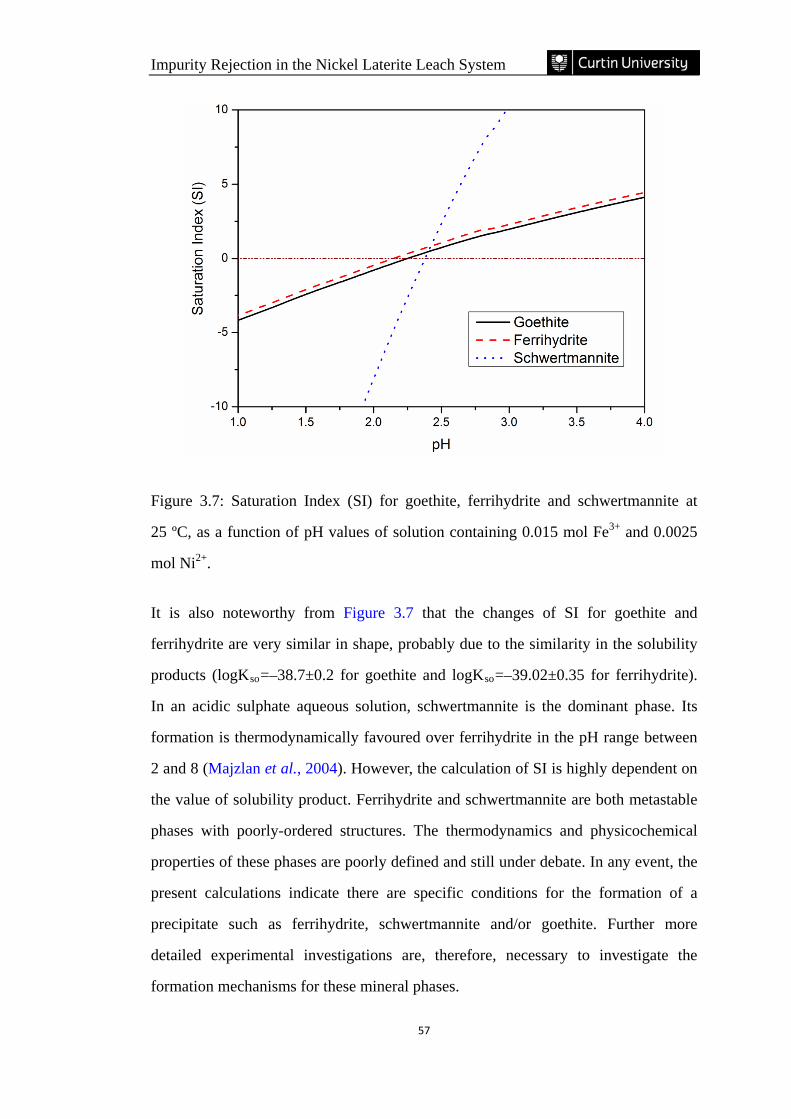
Impurity Rejection in the Nickel Laterite Leach System
57
Figure 3.7: Saturation Index (SI) for goethite, ferrihydrite and schwertmannite at
25 ºC, as a function of pH values of solution containing 0.015 mol Fe3+ and 0.0025
mol Ni2+.
It is also noteworthy from Figure 3.7 that the changes of SI for goethite and
ferrihydrite are very similar in shape, probably due to the similarity in the solubility
products (logKso=–38.7±0.2 for goethite and logKso=–39.02±0.35 for ferrihydrite).
In an acidic sulphate aqueous solution, schwertmannite is the dominant phase. Its
formation is thermodynamically favoured over ferrihydrite in the pH range between
2 and 8 (Majzlan et al., 2004). However, the calculation of SI is highly dependent on
the value of solubility product. Ferrihydrite and schwertmannite are both metastable
phases with poorly-ordered structures. The thermodynamics and physicochemical
properties of these phases are poorly defined and still under debate. In any event, the
present calculations indicate there are specific conditions for the formation of a
precipitate such as ferrihydrite, schwertmannite and/or goethite. Further more
detailed experimental investigations are, therefore, necessary to investigate the
formation mechanisms for these mineral phases.
K.WANG
58
3.4 CONCLUSION
In this chapter, a speciation model is developed with the effects of ionic strength and
temperatures taken into account. The model is able to produce speciation diagrams of
all possible species in the Fe(III)–Ni(II)–H2SO4–H2O system, calculate the activity
of hydrogen ion and corresponding pH value, and predict the precipitation or
dissolution of hydrated iron oxide phases.
In a mixed ferric and nickel sulphate aqueous solution, the predominant ferric and
nickel species are Fe(SO4)2– and FeSO4
+ and NiSO40 in the highly acidic region
(pH<3) at 25°C. At pH above 3, considerable amounts of FeOH2+, Fe(OH)2+,
Fe(OH)30 and free Ni2+ exist. The temperature dependence of the ionic equilibrium
can be calculated if the temperature dependence of the equilibrium constant can be
obtained. Hence, the accuracy of the developed model highly depends on the
accuracy of the equilibrium constants and the extrapolation of these to elevated
temperatures. As the temperature increases, the concentration of the FeSO4+ species
decreases while the formation of FeHSO42+ and FeOH2+ become increasing
favoured. The changing equilibrium of ferric and nickel species results in changes in
the pH value of the system. Increasing temperature results in a decrease in pH value.
Calculation of the saturation index of goethite, ferrihydrite and schwertmannite leads
to a better understanding of the formation conditions for goethite, ferrihydrite and
schwertmannite. This is achieved by studying the equilibrium relationship between
each phases and solution chemistry. The solubility of goethite, ferrihydrite and
schwertmannite decreases substantially with increasing pH value of solution.
Goethite, ferrihydrite and schwertmannite are all undersaturated below pH 2. With
increasing pH, ferric iron tends to precipitate first in the form of ferrihydrite followed
by goethite and schwertmannite. A mixture is formed above pH 2.5, of which
schwertmannite is predicated to be the dominant phase.
The modelling methodology presented in this chapter can be extended to simulate
Impurity Rejection in the Nickel Laterite Leach System
59
other aqueous electrolyte systems. Modelling of aqueous electrolyte solution is
extremely useful in developing understanding of solution chemistry and predicting
solution properties. The speciation model developed here for the Fe(III)–Ni(II)–
H2SO4–H2O system allows prediction of the expected precipitates. This assisted the
experimental design for the work presented in subsequent chapters, which aims to
provide insight into the mechanisms of the formation for goethite, ferrihydrite and
schwertmannite, and the associated nickel losses.
Nomenclature
A= Debye-Hückel constant
Aφ=Debye-Hückel osmotic coefficient parameter
B= Debye-Hückel constant
Cp=heat capacity, J∙mol–1∙K–1
G=Gibbs free energy, J∙mol–1
H=enthalpy, J∙mol–1
Ic=ionic strength on molar basis, mol∙L–1
Im= ionic strength on molal basis, mol∙kg–1
K0=thermodynamic equilibrium constant on molal basis, mol∙kg–1
K=equilibrium constant on molal basis, mol∙kg–1
Kso=solubility product
K*so=solubility product described in acidic media
K.WANG
60
Kw=ionic product of water
M=molecular weight, g∙mol–1
R=universal gas constant, 8.314 J∙mol–1∙K–1
S=entropy, J∙mol–1∙K–1
T=temperature in Kelvin, K
Y=auxiliary function for the estimation of the Vasil’ev constant b
a=activity
b=Vasil’ev constant
c=molar concentration, mol∙L–1
fr= Dickson’s auxiliary function
h=hydration number for the hydrogen ion in Das’s equation
i=species indicator
m=molal concentration, mol∙kg–1
p= Dickson’s parameter
t=temperature in degree Celsius, °C
z=ionic charge
α1, α2=coefficients for the estimation of equilibrium constant of nickel hydroxo
species
β0=thermodynamic equilibrium constant on molar basis, mol∙L–1
Impurity Rejection in the Nickel Laterite Leach System
61
β=equilibrium constant on molar basis, mol∙L–1
γ=activity coefficient
δ1, δ2=coefficients for the estimation of equilibrium constant of neutral nickel
sulphate
θ=Helgeson’s parameter
ρ=density of solution, kg∙L–1
∆=change
K.WANG
62
CHAPTER 4
THE EFFECT OF IRON PRECIPITATION UPON NICKEL
LOSSES FROM SYNTHETIC ATMOSPHERIC NICKEL
LATERITE LEACH SOLUTIONS
4.1 INTRODUCTION
Chapter 4 presents an experimental investigation of the effects of iron precipitation
on nickel losses from synthetic atmospheric nickel laterite leach solutions. As
reviewed in Chapter 2, the loss of nickel is expected to be related to the factors
affecting the iron precipitation such as pH, temperature and possibly iron to nickel
ratio in the leach liquor. Hence, the purpose of Chapter 4 is to study the effects of
various process variables (factors) governing the effect of iron precipitation on nickel
losses. This is achieved by using the design of experiment (DOE) and the method of
statistical analysis and modelling. The statistically-designed experimental method
generally employs a small number of experiments to study the effects of factors and
their possible interactions (Chapter 2). These have been successfully applied in many
areas of hydrometallurgical processes: see, for example, the study of the V.M.
goethite precipitation process (Agatzini-Leonardou and Burkin, 1985), the extraction
of nickel and cobalt in heap leach treatment of laterite ores (Agatzini-Leonardou et
al., 1997), the recovery of nickel and cobalt by precipitation from neutralised nickel
laterite heap leach PLS (Oustadakis et al., 2006), and the effects of agglomeration on
iron precipitation (Claassen and Sandenbergh, 2006).
Chapter 4 is separated into three parts. The first describes the preliminary
experiments to determine some ‘held constant’ factors that were fixed throughout
subsequent statistically-designed experiments. The ‘held constant’ factors include the
reaction and ageing times. The effect of these factors and gypsum formation when
Impurity Rejection in the Nickel Laterite Leach System
63
using calcium carbonate as the neutralizing agent on the iron removal efficiency and
nickel losses were detailed in this part. The second part investigates the effects of
five widely used process variables (pH, temperature, the iron to nickel ratio in the
initial leach liquor, stirring speed, and the neutralizing agents) on iron removal
efficiency and associated nickel losses, using a Fractional Factorial Design (FFD) to
screen these variables. The third part employs the Box-Behnken Design (BBD)
which is a response surface methodology (RSM) to optimize the significant
independent variables determined in the second part.
4.2 EXPERIMENTAL SETUP AND PROCEDURES
Similar to the process described by Roche (2009), a semi-batch precipitation
procedure was used in this chapter and the remaining chapters of this thesis, shown
in Figure 4.1, which includes a 2 L baffled glass reaction vessel equipped with an
overhead agitator. For better mixing, the feed solution and slurry of neutralizing
agent were injected directly above a six-bladed titanium Rushton impeller through
PTFE tubes. The pH value during reaction was monitored by a METTLER
TOLEDO® pH probe (InLab® Versatile) which has a working temperature range
from 0 to 100 ºC. A thermostatically controlled oil bath filled with polyethylene
glycol was used for temperature control. At the beginning of each experiment, de-
ionized water was placed into the reaction vessel to dilute the input streams. A
volume of synthetic PLS (500 mL) containing iron and nickel sulphates was pumped
into the reaction vessel during a specific period, at a controlled rate ranging from 10
to 20 mL/min to maintain the concentrations of ferric iron between 1.0 and 2.5 g/L
(i.e. between 0.018 and 0.045 M). The neutralizing agent was simultaneously added
at a fixed pumping rate of 5 mL/min, as a suspension in de-ionized water to achieve
the target pH value. At the completion of the reaction, the slurry was vacuum filtered
through a 0.45 µm Gelman Supor® membrane and the ferric and nickel ion
concentrations in the filtrate analysed by ICP-OES. The filter cake was washed three
times with large amounts of de-ionized water by repulping the washing water until
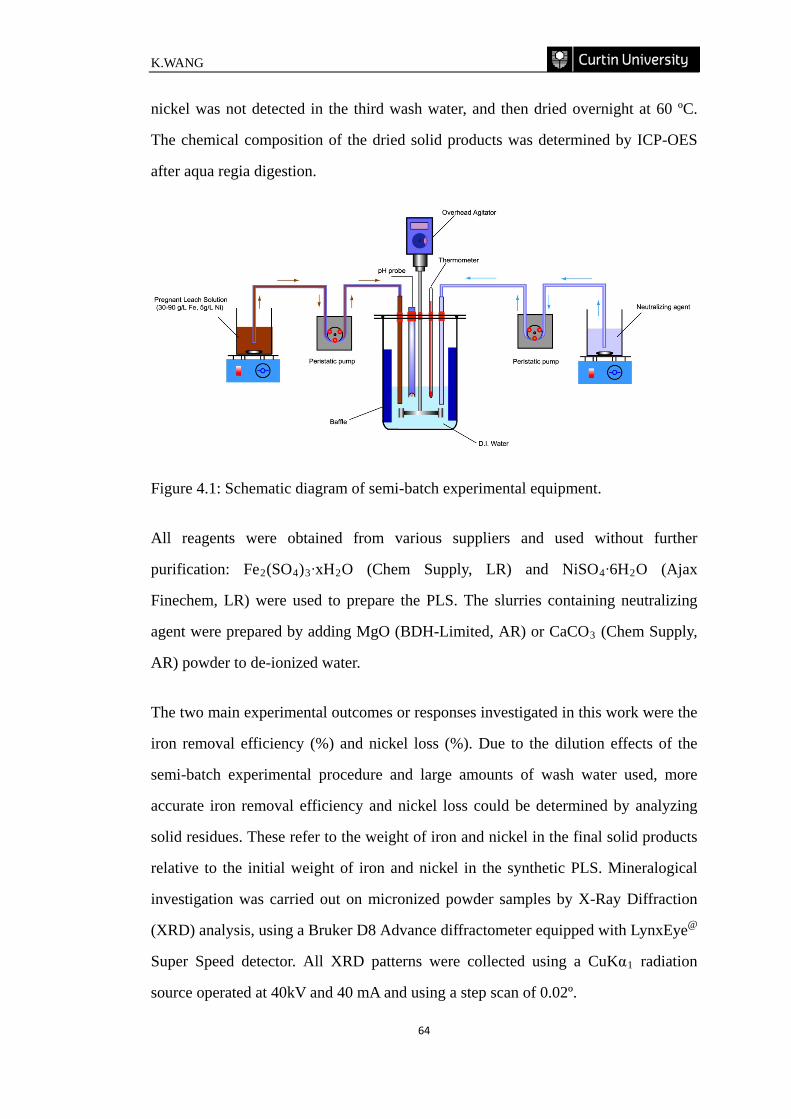
K.WANG
64
nickel was not detected in the third wash water, and then dried overnight at 60 ºC.
The chemical composition of the dried solid products was determined by ICP-OES
after aqua regia digestion.
Figure 4.1: Schematic diagram of semi-batch experimental equipment.
All reagents were obtained from various suppliers and used without further
purification: Fe2(SO4)3∙xH2O (Chem Supply, LR) and NiSO4∙6H2O (Ajax
Finechem, LR) were used to prepare the PLS. The slurries containing neutralizing
agent were prepared by adding MgO (BDH-Limited, AR) or CaCO3 (Chem Supply,
AR) powder to de-ionized water.
The two main experimental outcomes or responses investigated in this work were the
iron removal efficiency (%) and nickel loss (%). Due to the dilution effects of the
semi-batch experimental procedure and large amounts of wash water used, more
accurate iron removal efficiency and nickel loss could be determined by analyzing
solid residues. These refer to the weight of iron and nickel in the final solid products
relative to the initial weight of iron and nickel in the synthetic PLS. Mineralogical
investigation was carried out on micronized powder samples by X-Ray Diffraction
(XRD) analysis, using a Bruker D8 Advance diffractometer equipped with LynxEye@
Super Speed detector. All XRD patterns were collected using a CuKα1 radiation
source operated at 40kV and 40 mA and using a step scan of 0.02º.
Impurity Rejection in the Nickel Laterite Leach System
65
4.3 PRELIMINARY EXPERIMENTS
Preliminary experiments were conducted to determine the effects of reaction time,
ageing time and gypsum formation on the responses. The ‘reaction time’ denotes the
period for which PLS was pumped, and ‘ageing time’ refers to the retention time
after PLS pumping was completed. In this study, 2.5 and 5 hour reaction times were
studied, employing the conditions of experiment FFD-8 (Tables 4.1 and 4.2). To
study ageing time, after 2.5 hours reaction, the products were allowed to age for a
specific ageing time at the experimental pH, temperature and stirring speed. Gypsum
is a common precipitate in the sulphate solution when using CaCO3 as the
neutralizing agent. The effect of gypsum formation on the nickel loss was examined
in an acid solution of nickel sulphate with no ferric iron present. The nickel
concentration was kept at 5 g/L in the preliminary and in subsequent statistically-
designed experiments. The acidity was adjusted to a pH of approximately 0.45 using
concentrated H2SO4, which was the same value of a solution containing 90 g/L iron
and 5 g/L nickel. All the experimental procedures were kept the same as those used
in the statistically-designed experiments.
4.4 STATISTICAL EXPERIMENTAL DESIGN
4.4.1 Fractional Factorial Design (FFD)
Screening experiments were performed using a one quarter fractional factorial design
(FFD) to evaluate the factors that have significant effects on the two responses. The
factors investigated were four quantitative factors (pH, temperature, the Fe/Ni ratio
in the PLS and stirring speed) and one qualitative factor (neutralizing agent, i.e. MgO
or CaCO3). All factors were evaluated at two levels: low level (denoted as ‘–’) and
high level (denoted as ‘+’). The factors investigated and their levels are given in
Table 4.1, and the experimental design matrix in Table 4.2.
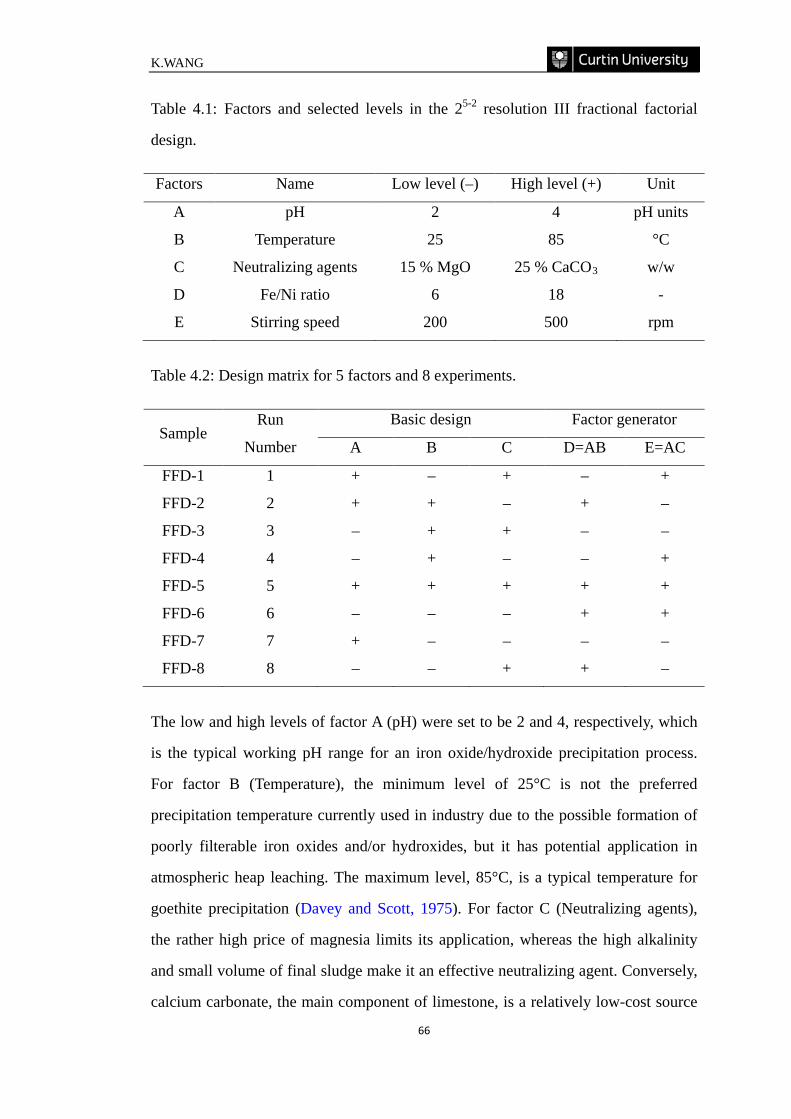
K.WANG
66
Table 4.1: Factors and selected levels in the 25-2 resolution III fractional factorial
design.
Factors Name Low level (–) High level (+) Unit
A pH 2 4 pH units
B Temperature 25 85 °C
C Neutralizing agents 15 % MgO 25 % CaCO3 w/w
D Fe/Ni ratio 6 18 -
E Stirring speed 200 500 rpm
Table 4.2: Design matrix for 5 factors and 8 experiments.
Sample Run
Number
Basic design Factor generator
A B C D=AB E=AC
FFD-1 1 + – + – +
FFD-2 2 + + – + –
FFD-3 3 – + + – –
FFD-4 4 – + – – +
FFD-5 5 + + + + +
FFD-6 6 – – – + +
FFD-7 7 + – – – –
FFD-8 8 – – + + –
The low and high levels of factor A (pH) were set to be 2 and 4, respectively, which
is the typical working pH range for an iron oxide/hydroxide precipitation process.
For factor B (Temperature), the minimum level of 25°C is not the preferred
precipitation temperature currently used in industry due to the possible formation of
poorly filterable iron oxides and/or hydroxides, but it has potential application in
atmospheric heap leaching. The maximum level, 85°C, is a typical temperature for
goethite precipitation (Davey and Scott, 1975). For factor C (Neutralizing agents),
the rather high price of magnesia limits its application, whereas the high alkalinity
and small volume of final sludge make it an effective neutralizing agent. Conversely,
calcium carbonate, the main component of limestone, is a relatively low-cost source
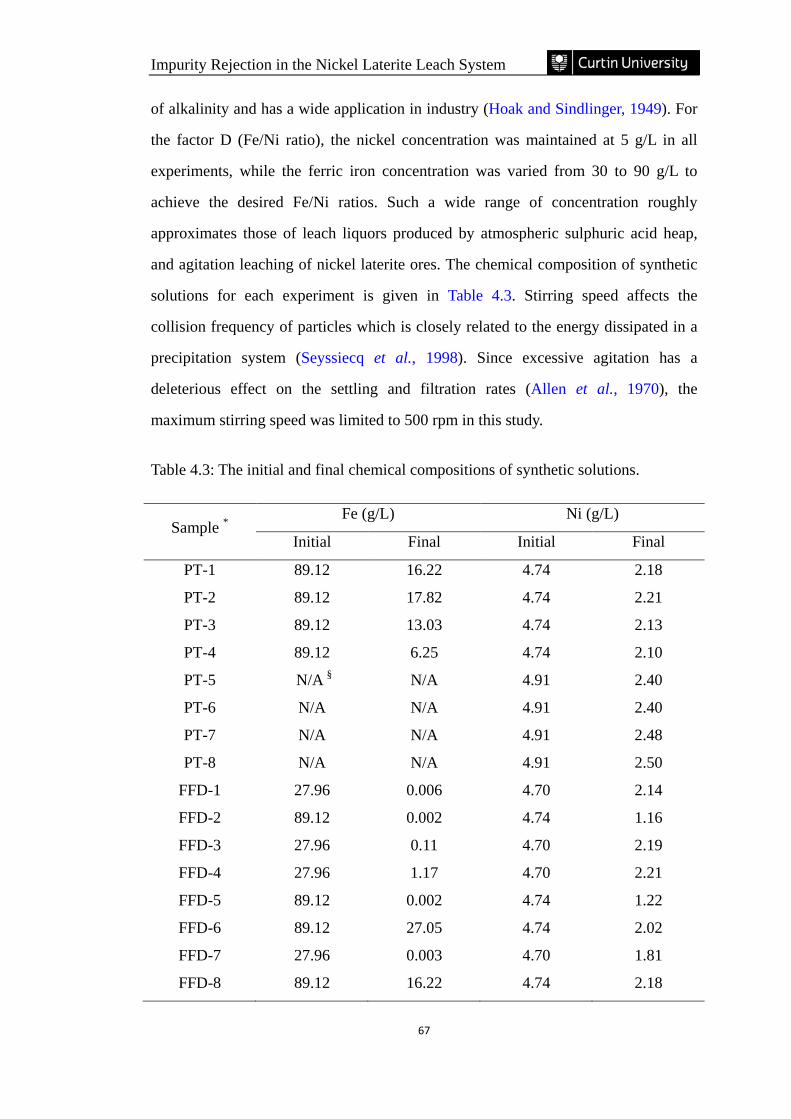
Impurity Rejection in the Nickel Laterite Leach System
67
of alkalinity and has a wide application in industry (Hoak and Sindlinger, 1949). For
the factor D (Fe/Ni ratio), the nickel concentration was maintained at 5 g/L in all
experiments, while the ferric iron concentration was varied from 30 to 90 g/L to
achieve the desired Fe/Ni ratios. Such a wide range of concentration roughly
approximates those of leach liquors produced by atmospheric sulphuric acid heap,
and agitation leaching of nickel laterite ores. The chemical composition of synthetic
solutions for each experiment is given in Table 4.3. Stirring speed affects the
collision frequency of particles which is closely related to the energy dissipated in a
precipitation system (Seyssiecq et al., 1998). Since excessive agitation has a
deleterious effect on the settling and filtration rates (Allen et al., 1970), the
maximum stirring speed was limited to 500 rpm in this study.
Table 4.3: The initial and final chemical compositions of synthetic solutions.
Sample * Fe (g/L) Ni (g/L)
Initial Final Initial Final
PT-1 89.12 16.22 4.74 2.18
PT-2 89.12 17.82 4.74 2.21
PT-3 89.12 13.03 4.74 2.13
PT-4 89.12 6.25 4.74 2.10
PT-5 N/A § N/A 4.91 2.40
PT-6 N/A N/A 4.91 2.40
PT-7 N/A N/A 4.91 2.48
PT-8 N/A N/A 4.91 2.50
FFD-1 27.96 0.006 4.70 2.14
FFD-2 89.12 0.002 4.74 1.16
FFD-3 27.96 0.11 4.70 2.19
FFD-4 27.96 1.17 4.70 2.21
FFD-5 89.12 0.002 4.74 1.22
FFD-6 89.12 27.05 4.74 2.02
FFD-7 27.96 0.003 4.70 1.81
FFD-8 89.12 16.22 4.74 2.18
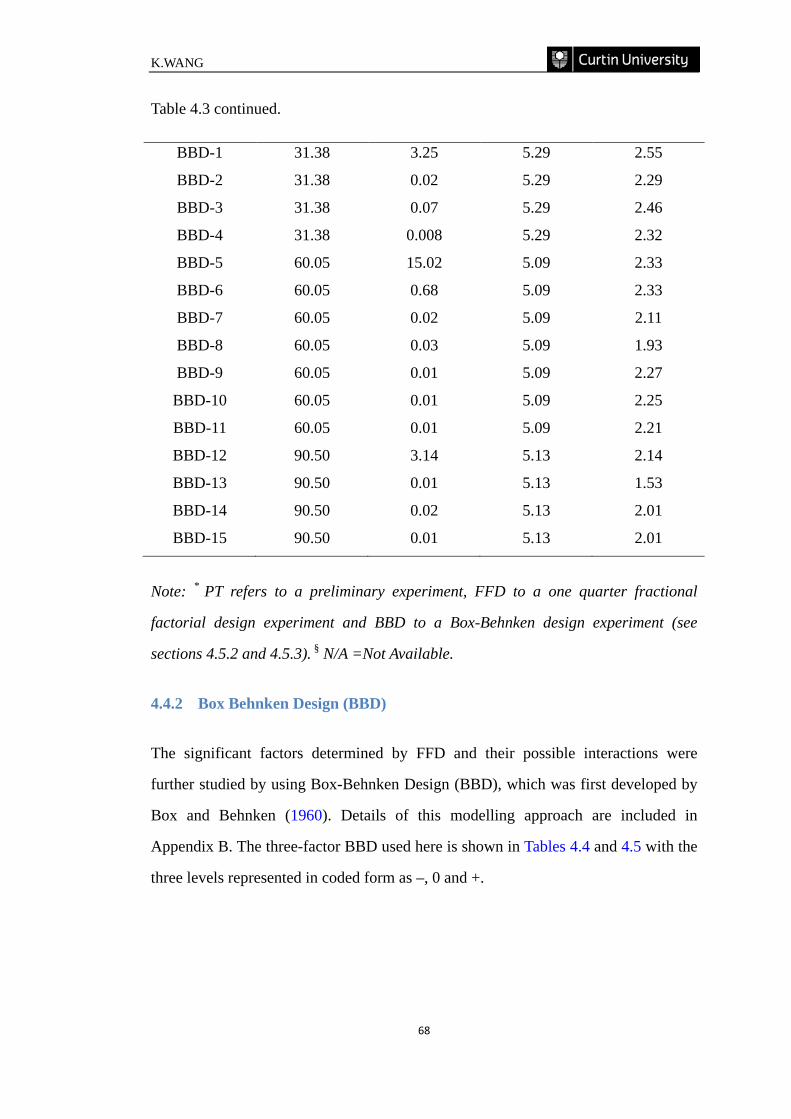
K.WANG
68
Table 4.3 continued.
BBD-1 31.38 3.25 5.29 2.55
BBD-2 31.38 0.02 5.29 2.29
BBD-3 31.38 0.07 5.29 2.46
BBD-4 31.38 0.008 5.29 2.32
BBD-5 60.05 15.02 5.09 2.33
BBD-6 60.05 0.68 5.09 2.33
BBD-7 60.05 0.02 5.09 2.11
BBD-8 60.05 0.03 5.09 1.93
BBD-9 60.05 0.01 5.09 2.27
BBD-10 60.05 0.01 5.09 2.25
BBD-11 60.05 0.01 5.09 2.21
BBD-12 90.50 3.14 5.13 2.14
BBD-13 90.50 0.01 5.13 1.53
BBD-14 90.50 0.02 5.13 2.01
BBD-15 90.50 0.01 5.13 2.01
Note: * PT refers to a preliminary experiment, FFD to a one quarter fractional
factorial design experiment and BBD to a Box-Behnken design experiment (see
sections 4.5.2 and 4.5.3). § N/A =Not Available.
4.4.2 Box Behnken Design (BBD)
The significant factors determined by FFD and their possible interactions were
further studied by using Box-Behnken Design (BBD), which was first developed by
Box and Behnken (1960). Details of this modelling approach are included in
Appendix B. The three-factor BBD used here is shown in Tables 4.4 and 4.5 with the
three levels represented in coded form as –, 0 and +.
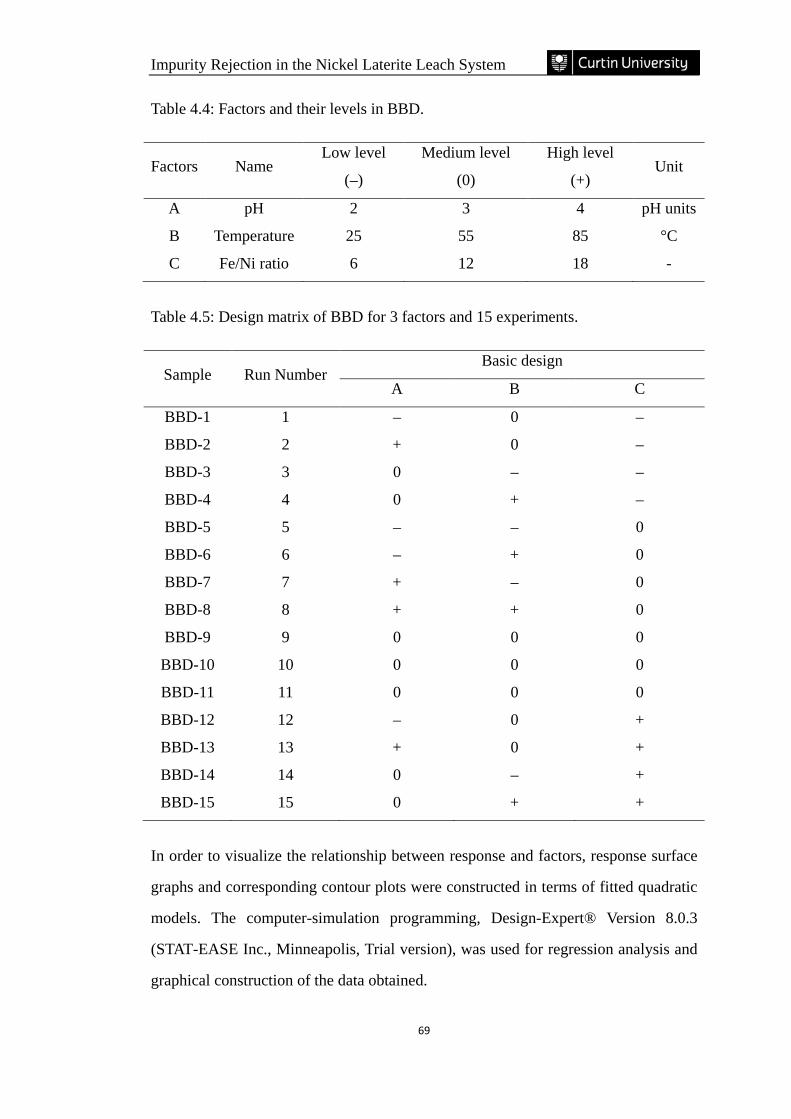
Impurity Rejection in the Nickel Laterite Leach System
69
Table 4.4: Factors and their levels in BBD.
Factors Name Low level
(–)
Medium level
(0)
High level
(+) Unit
A pH 2 3 4 pH units
B Temperature 25 55 85 °C
C Fe/Ni ratio 6 12 18 -
Table 4.5: Design matrix of BBD for 3 factors and 15 experiments.
Sample Run Number Basic design
A B C
BBD-1 1 – 0 –
BBD-2 2 + 0 –
BBD-3 3 0 – –
BBD-4 4 0 + –
BBD-5 5 – – 0
BBD-6 6 – + 0
BBD-7 7 + – 0
BBD-8 8 + + 0
BBD-9 9 0 0 0
BBD-10 10 0 0 0
BBD-11 11 0 0 0
BBD-12 12 – 0 +
BBD-13 13 + 0 +
BBD-14 14 0 – +
BBD-15 15 0 + +
In order to visualize the relationship between response and factors, response surface
graphs and corresponding contour plots were constructed in terms of fitted quadratic
models. The computer-simulation programming, Design-Expert® Version 8.0.3
(STAT-EASE Inc., Minneapolis, Trial version), was used for regression analysis and
graphical construction of the data obtained.
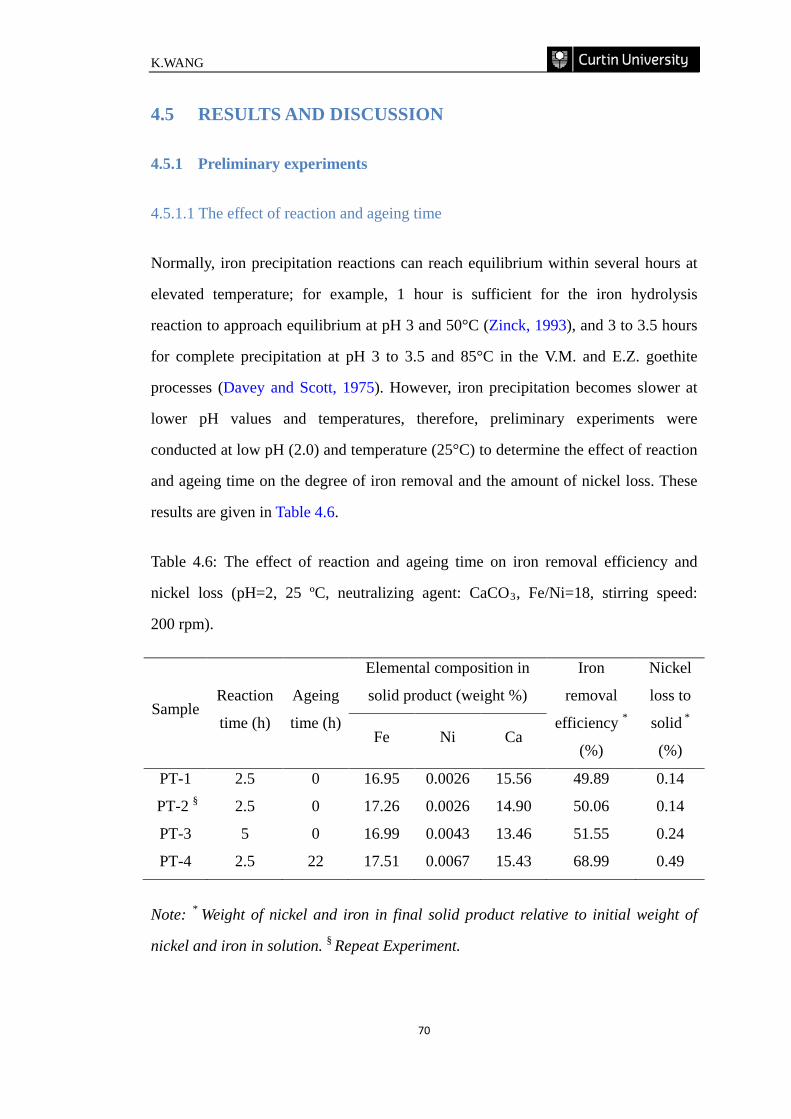
K.WANG
70
4.5 RESULTS AND DISCUSSION
4.5.1 Preliminary experiments
4.5.1.1 The effect of reaction and ageing time
Normally, iron precipitation reactions can reach equilibrium within several hours at
elevated temperature; for example, 1 hour is sufficient for the iron hydrolysis
reaction to approach equilibrium at pH 3 and 50°C (Zinck, 1993), and 3 to 3.5 hours
for complete precipitation at pH 3 to 3.5 and 85°C in the V.M. and E.Z. goethite
processes (Davey and Scott, 1975). However, iron precipitation becomes slower at
lower pH values and temperatures, therefore, preliminary experiments were
conducted at low pH (2.0) and temperature (25°C) to determine the effect of reaction
and ageing time on the degree of iron removal and the amount of nickel loss. These
results are given in Table 4.6.
Table 4.6: The effect of reaction and ageing time on iron removal efficiency and
nickel loss (pH=2, 25 ºC, neutralizing agent: CaCO3, Fe/Ni=18, stirring speed:
200 rpm).
Sample Reaction
time (h)
Ageing
time (h)
Elemental composition in
solid product (weight %)
Iron
removal
efficiency *
(%)
Nickel
loss to
solid *
(%) Fe Ni Ca
PT-1 2.5 0 16.95 0.0026 15.56 49.89 0.14
PT-2 § 2.5 0 17.26 0.0026 14.90 50.06 0.14
PT-3 5 0 16.99 0.0043 13.46 51.55 0.24
PT-4 2.5 22 17.51 0.0067 15.43 68.99 0.49
Note: * Weight of nickel and iron in final solid product relative to initial weight of
nickel and iron in solution. § Repeat Experiment.
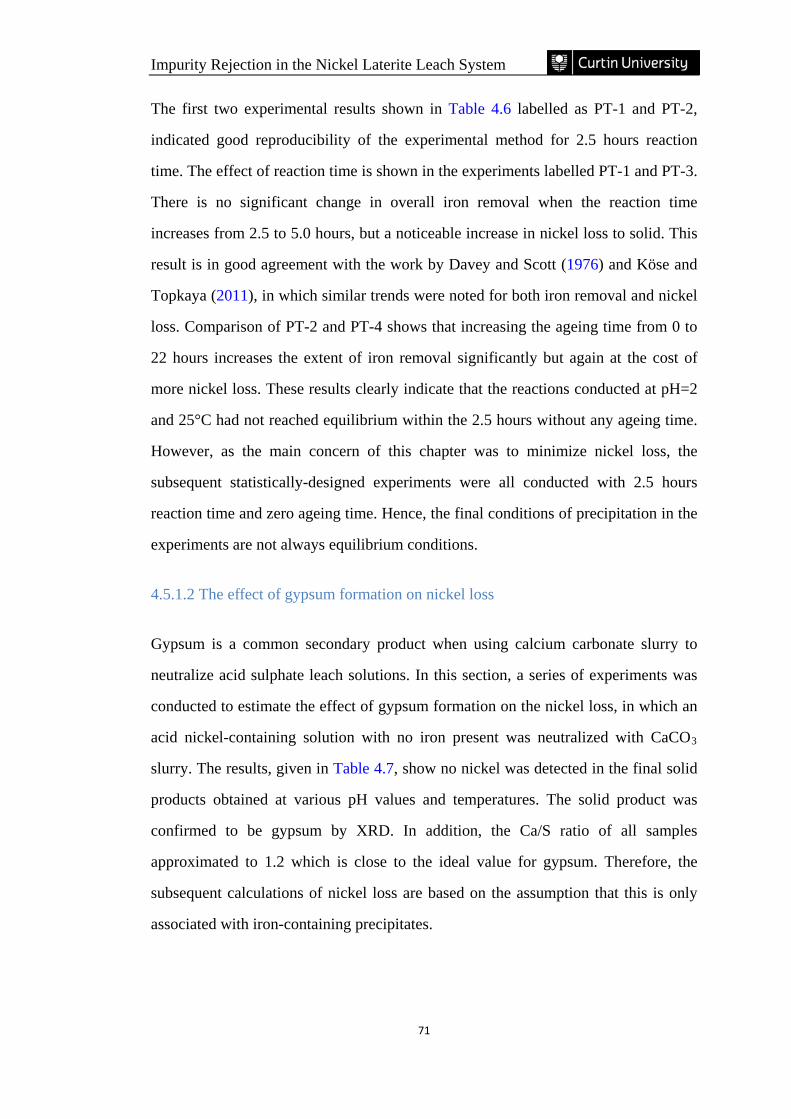
Impurity Rejection in the Nickel Laterite Leach System
71
The first two experimental results shown in Table 4.6 labelled as PT-1 and PT-2,
indicated good reproducibility of the experimental method for 2.5 hours reaction
time. The effect of reaction time is shown in the experiments labelled PT-1 and PT-3.
There is no significant change in overall iron removal when the reaction time
increases from 2.5 to 5.0 hours, but a noticeable increase in nickel loss to solid. This
result is in good agreement with the work by Davey and Scott (1976) and Köse and
Topkaya (2011), in which similar trends were noted for both iron removal and nickel
loss. Comparison of PT-2 and PT-4 shows that increasing the ageing time from 0 to
22 hours increases the extent of iron removal significantly but again at the cost of
more nickel loss. These results clearly indicate that the reactions conducted at pH=2
and 25°C had not reached equilibrium within the 2.5 hours without any ageing time.
However, as the main concern of this chapter was to minimize nickel loss, the
subsequent statistically-designed experiments were all conducted with 2.5 hours
reaction time and zero ageing time. Hence, the final conditions of precipitation in the
experiments are not always equilibrium conditions.
4.5.1.2 The effect of gypsum formation on nickel loss
Gypsum is a common secondary product when using calcium carbonate slurry to
neutralize acid sulphate leach solutions. In this section, a series of experiments was
conducted to estimate the effect of gypsum formation on the nickel loss, in which an
acid nickel-containing solution with no iron present was neutralized with CaCO3
slurry. The results, given in Table 4.7, show no nickel was detected in the final solid
products obtained at various pH values and temperatures. The solid product was
confirmed to be gypsum by XRD. In addition, the Ca/S ratio of all samples
approximated to 1.2 which is close to the ideal value for gypsum. Therefore, the
subsequent calculations of nickel loss are based on the assumption that this is only
associated with iron-containing precipitates.
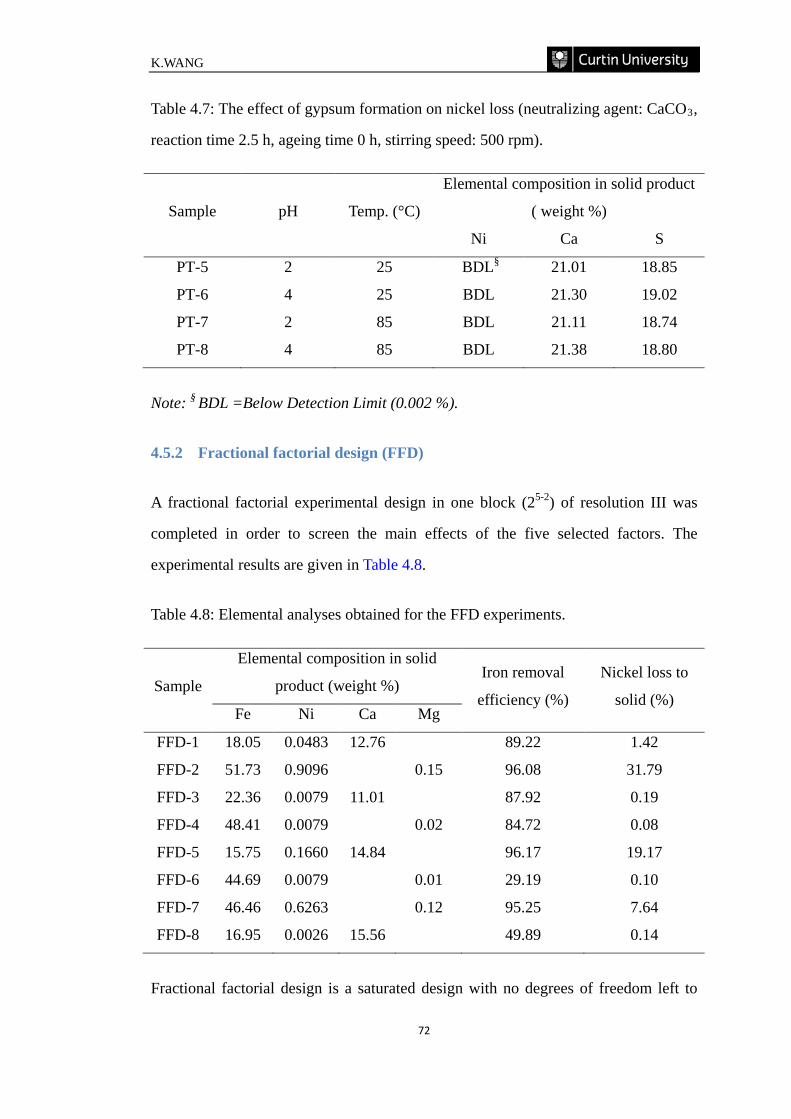
K.WANG
72
Table 4.7: The effect of gypsum formation on nickel loss (neutralizing agent: CaCO3,
reaction time 2.5 h, ageing time 0 h, stirring speed: 500 rpm).
Sample pH Temp. (°C)
Elemental composition in solid product
( weight %)
Ni Ca S
PT-5 2 25 BDL§ 21.01 18.85
PT-6 4 25 BDL 21.30 19.02
PT-7 2 85 BDL 21.11 18.74
PT-8 4 85 BDL 21.38 18.80
Note: § BDL =Below Detection Limit (0.002 %).
4.5.2 Fractional factorial design (FFD)
A fractional factorial experimental design in one block (25-2) of resolution III was
completed in order to screen the main effects of the five selected factors. The
experimental results are given in Table 4.8.
Table 4.8: Elemental analyses obtained for the FFD experiments.
Sample
Elemental composition in solid
product (weight %) Iron removal
efficiency (%)
Nickel loss to
solid (%) Fe Ni Ca Mg
FFD-1 18.05 0.0483 12.76 89.22 1.42
FFD-2 51.73 0.9096 0.15 96.08 31.79
FFD-3 22.36 0.0079 11.01 87.92 0.19
FFD-4 48.41 0.0079 0.02 84.72 0.08
FFD-5 15.75 0.1660 14.84 96.17 19.17
FFD-6 44.69 0.0079 0.01 29.19 0.10
FFD-7 46.46 0.6263 0.12 95.25 7.64
FFD-8 16.95 0.0026 15.56 49.89 0.14
Fractional factorial design is a saturated design with no degrees of freedom left to
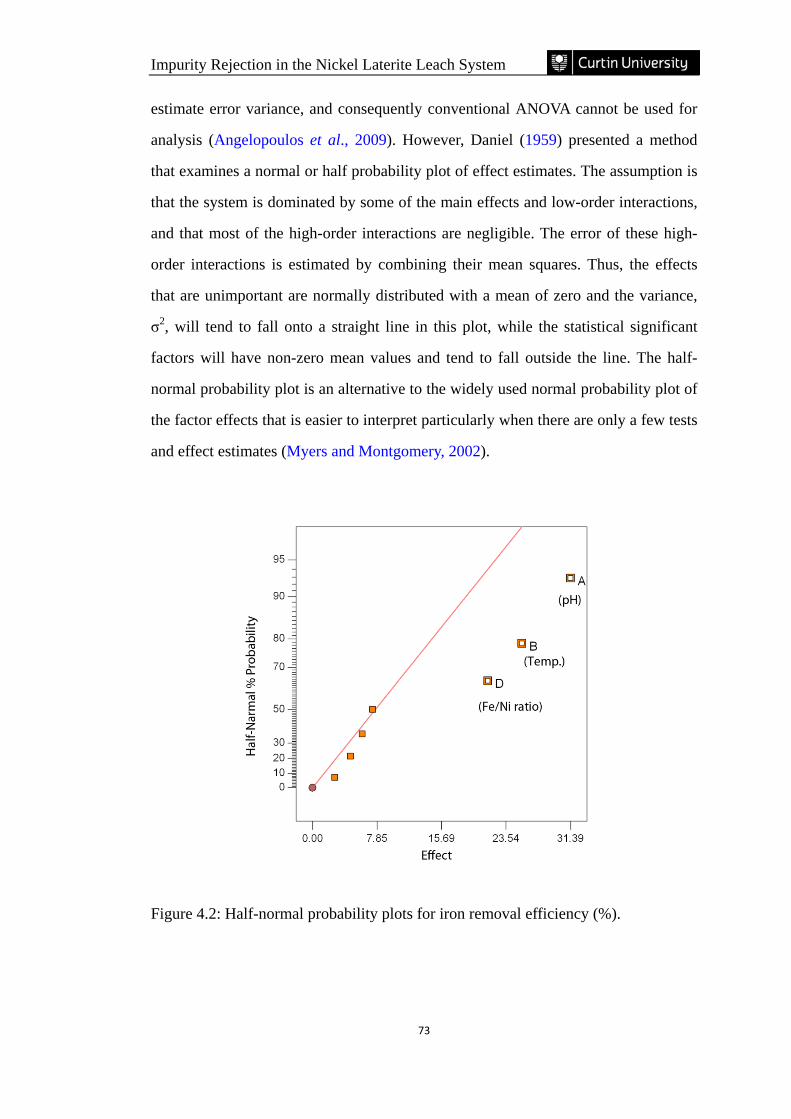
Impurity Rejection in the Nickel Laterite Leach System
73
estimate error variance, and consequently conventional ANOVA cannot be used for
analysis (Angelopoulos et al., 2009). However, Daniel (1959) presented a method
that examines a normal or half probability plot of effect estimates. The assumption is
that the system is dominated by some of the main effects and low-order interactions,
and that most of the high-order interactions are negligible. The error of these high-
order interactions is estimated by combining their mean squares. Thus, the effects
that are unimportant are normally distributed with a mean of zero and the variance,
σ2, will tend to fall onto a straight line in this plot, while the statistical significant
factors will have non-zero mean values and tend to fall outside the line. The half-
normal probability plot is an alternative to the widely used normal probability plot of
the factor effects that is easier to interpret particularly when there are only a few tests
and effect estimates (Myers and Montgomery, 2002).
Figure 4.2: Half-normal probability plots for iron removal efficiency (%).
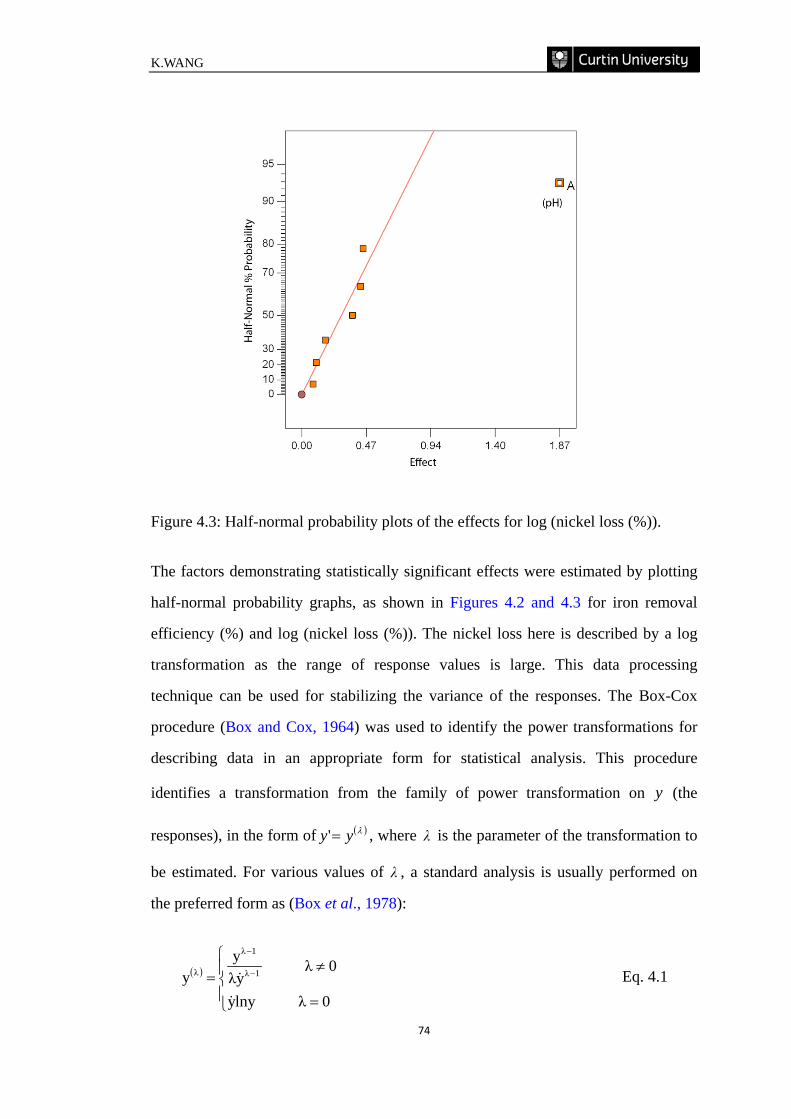
K.WANG
74
Figure 4.3: Half-normal probability plots of the effects for log (nickel loss (%)).
The factors demonstrating statistically significant effects were estimated by plotting
half-normal probability graphs, as shown in Figures 4.2 and 4.3 for iron removal
efficiency (%) and log (nickel loss (%)). The nickel loss here is described by a log
transformation as the range of response values is large. This data processing
technique can be used for stabilizing the variance of the responses. The Box-Cox
procedure (Box and Cox, 1964) was used to identify the power transformations for
describing data in an appropriate form for statistical analysis. This procedure
identifies a transformation from the family of power transformation on y (the
responses), in the form of ( )λyy =' , where λ is the parameter of the transformation to
be estimated. For various values of λ , a standard analysis is usually performed on
the preferred form as (Box et al., 1978):
( ) 0λ lny y
0λ yλy
y 1λ
1λ
λ
=
≠= −
−
Eq. 4.1
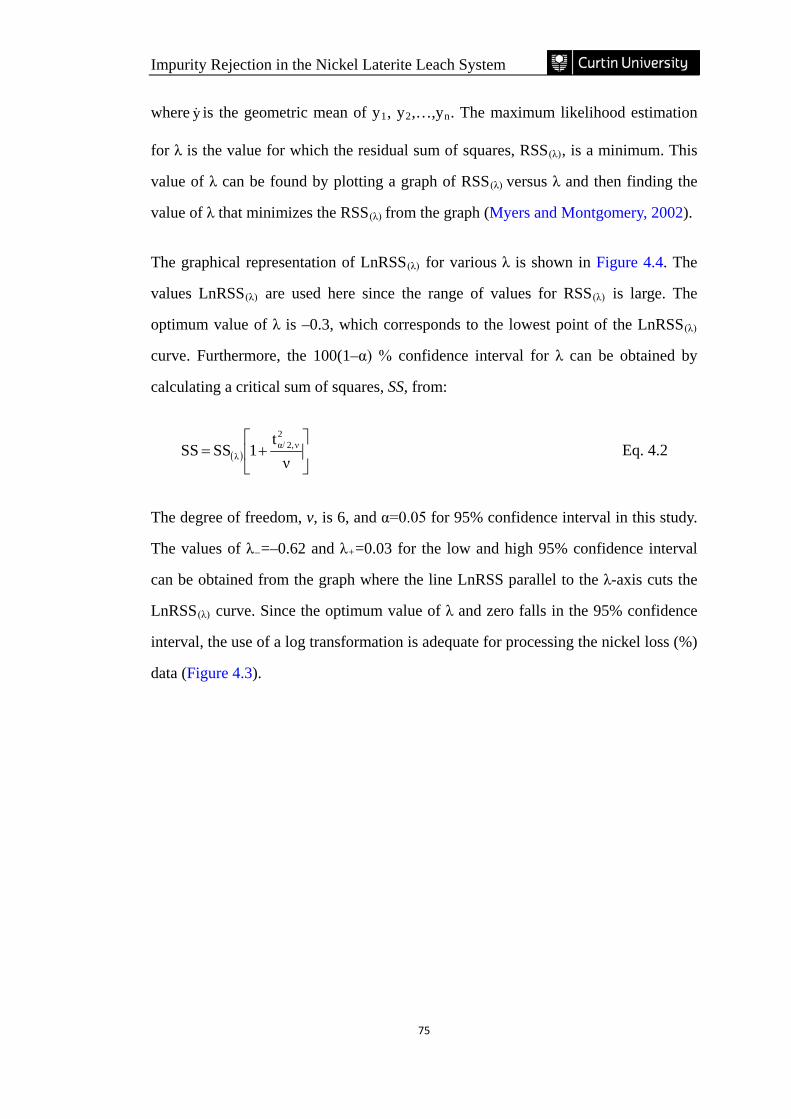
Impurity Rejection in the Nickel Laterite Leach System
75
where y is the geometric mean of y1, y2,…,yn. The maximum likelihood estimation
for λ is the value for which the residual sum of squares, RSS(λ), is a minimum. This
value of λ can be found by plotting a graph of RSS(λ) versus λ and then finding the
value of λ that minimizes the RSS(λ) from the graph (Myers and Montgomery, 2002).
The graphical representation of LnRSS(λ) for various λ is shown in Figure 4.4. The
values LnRSS(λ) are used here since the range of values for RSS(λ) is large. The
optimum value of λ is –0.3, which corresponds to the lowest point of the LnRSS(λ)
curve. Furthermore, the 100(1–α) % confidence interval for λ can be obtained by
calculating a critical sum of squares, SS, from:
( )
+=
νt
1SSSS2
ν2,α/λ Eq. 4.2
The degree of freedom, v, is 6, and α=0.05 for 95% confidence interval in this study.
The values of λ–=–0.62 and λ+=0.03 for the low and high 95% confidence interval
can be obtained from the graph where the line LnRSS parallel to the λ-axis cuts the
LnRSS(λ) curve. Since the optimum value of λ and zero falls in the 95% confidence
interval, the use of a log transformation is adequate for processing the nickel loss (%)
data (Figure 4.3).
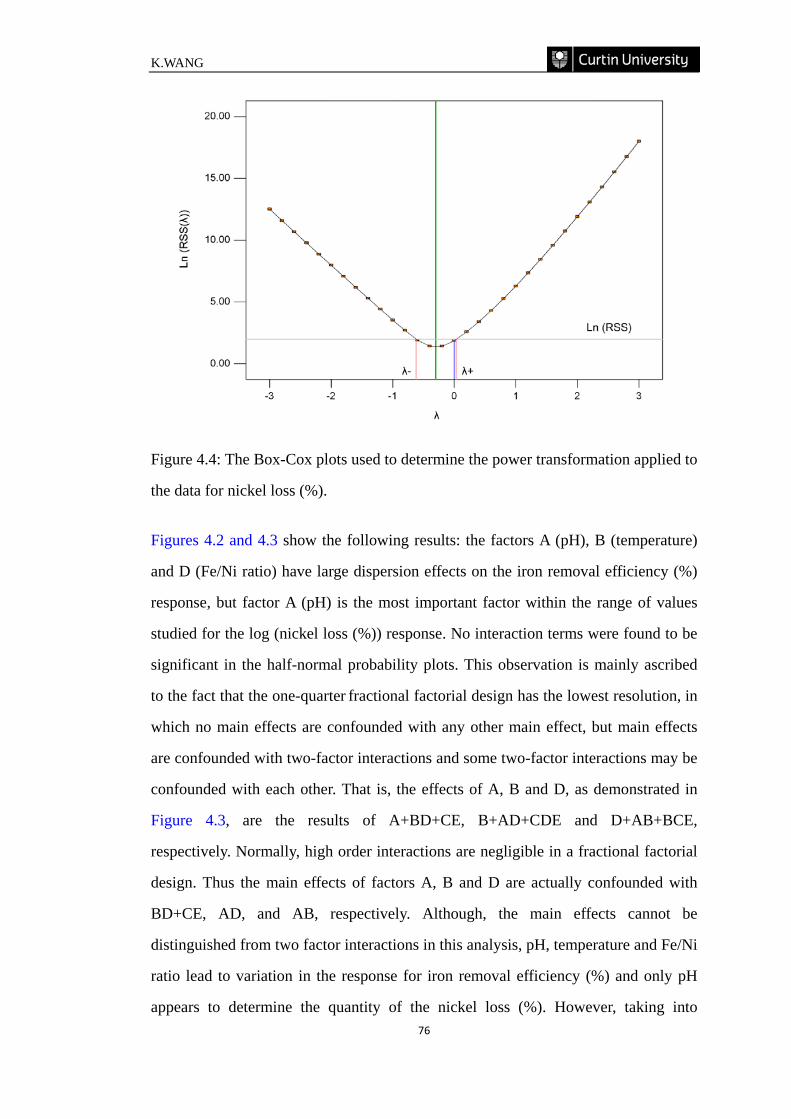
K.WANG
76
Figure 4.4: The Box-Cox plots used to determine the power transformation applied to
the data for nickel loss (%).
Figures 4.2 and 4.3 show the following results: the factors A (pH), B (temperature)
and D (Fe/Ni ratio) have large dispersion effects on the iron removal efficiency (%)
response, but factor A (pH) is the most important factor within the range of values
studied for the log (nickel loss (%)) response. No interaction terms were found to be
significant in the half-normal probability plots. This observation is mainly ascribed
to the fact that the one-quarter fractional factorial design has the lowest resolution, in
which no main effects are confounded with any other main effect, but main effects
are confounded with two-factor interactions and some two-factor interactions may be
confounded with each other. That is, the effects of A, B and D, as demonstrated in
Figure 4.3, are the results of A+BD+CE, B+AD+CDE and D+AB+BCE,
respectively. Normally, high order interactions are negligible in a fractional factorial
design. Thus the main effects of factors A, B and D are actually confounded with
BD+CE, AD, and AB, respectively. Although, the main effects cannot be
distinguished from two factor interactions in this analysis, pH, temperature and Fe/Ni
ratio lead to variation in the response for iron removal efficiency (%) and only pH
appears to determine the quantity of the nickel loss (%). However, taking into
Impurity Rejection in the Nickel Laterite Leach System
77
consideration that the pH may be confounded with the interaction of temperature and
Fe/Ni ratio, the three factors that had a major contribution to the responses, pH,
temperature and Fe/Ni ratio were chosen for a more detailed study through a
response surface methodology. The other factors that showed statistical
insignificance, e.g. neutralizing agents and stirring speed, were fixed in the
subsequent optimization experiments. Zinck and Dutrizac (1998) observed that the
variation of stirring speed from 200 to 800 rpm had little effect on the amount of iron
precipitate or its composition. Therefore, the stirring speed was kept constant: at the
higher value of 500 rpm to ensure better mixing. Calcium carbonate was used as the
neutralizing agent, mainly because of its wide application in industry and relatively
low cost.
4.5.3 Box-Behnken design (BBD)
In order to obtain more meaningful information about nickel losses during the iron
precipitation, a Box-Behnken design with fifteen experiments was performed for
three factors (pH, Temperature, Fe/Ni ratio) at three levels; with the results given in
Table 4.9.
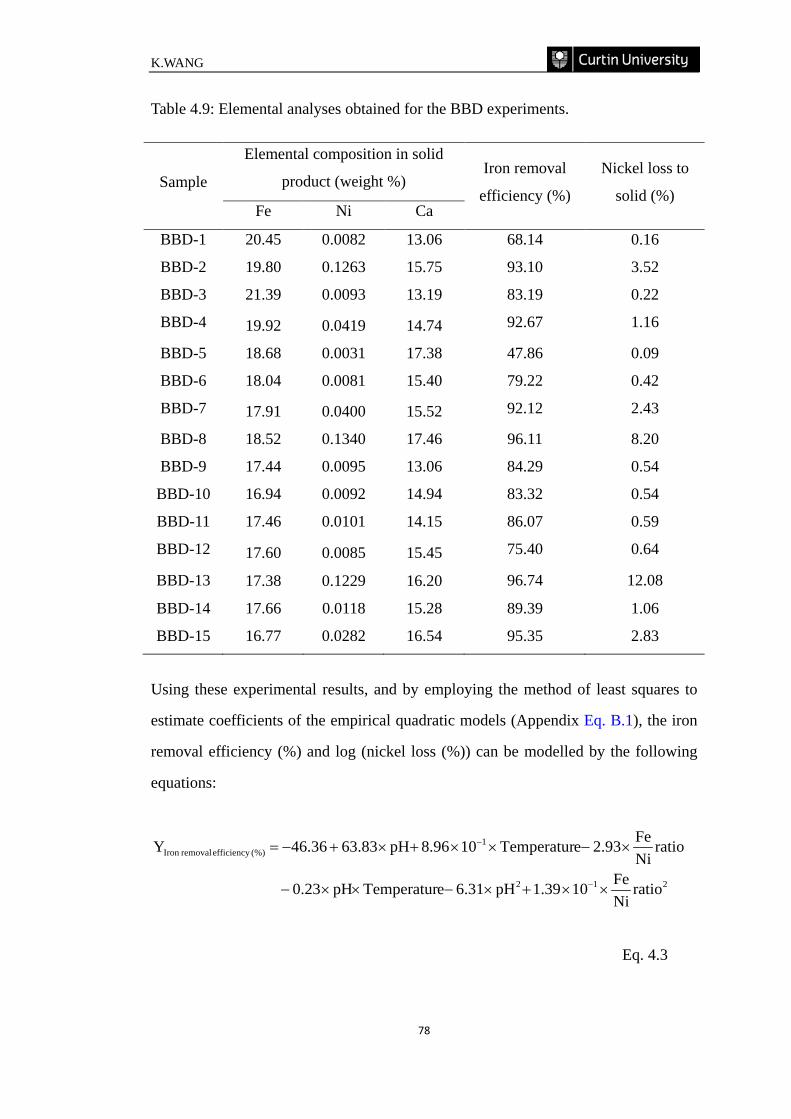
K.WANG
78
Table 4.9: Elemental analyses obtained for the BBD experiments.
Sample
Elemental composition in solid
product (weight %) Iron removal
efficiency (%)
Nickel loss to
solid (%) Fe Ni Ca
BBD-1 20.45 0.0082 13.06 68.14 0.16
BBD-2 19.80 0.1263 15.75 93.10 3.52
BBD-3 21.39 0.0093 13.19 83.19 0.22
BBD-4 19.92 0.0419 14.74 92.67 1.16
BBD-5 18.68 0.0031 17.38 47.86 0.09
BBD-6 18.04 0.0081 15.40 79.22 0.42
BBD-7 17.91 0.0400 15.52 92.12 2.43
BBD-8 18.52 0.1340 17.46 96.11 8.20
BBD-9 17.44 0.0095 13.06 84.29 0.54
BBD-10 16.94 0.0092 14.94 83.32 0.54
BBD-11 17.46 0.0101 14.15 86.07 0.59
BBD-12 17.60 0.0085 15.45 75.40 0.64
BBD-13 17.38 0.1229 16.20 96.74 12.08
BBD-14 17.66 0.0118 15.28 89.39 1.06
BBD-15 16.77 0.0282 16.54 95.35 2.83
Using these experimental results, and by employing the method of least squares to
estimate coefficients of the empirical quadratic models (Appendix Eq. B.1), the iron
removal efficiency (%) and log (nickel loss (%)) can be modelled by the following
equations:
212
1(%) efficiency removalIron
ratioNiFe101.39pH6.31eTemperaturpH0.23
ratioNiFe2.93eTemperatur108.96pH63.8346.36Y
××+×−××−
×−××+×+−=
−
−
Eq. 4.3
Impurity Rejection in the Nickel Laterite Leach System
79
2321
43
22(%)) loss (nickel log
ratioNiFe105.7pH102.09
ratioNiFeeTemperatur104.19eTemperaturpH101.05
ratioNiFe106.78eTemperatur101.79pH0.541.07Y
××+××+
×××−×××−
××−××+×−−=
−−
−−
−−
Eq. 4.4
The statistical significance of the above models and their terms were assessed by
Fisher’s F-test, with the analysis of variance (ANOVA) results given in Table 4.10.
Normally, a p-Value less than 0.05 (95% confidence level) indicates statistical
significance. It can be seen from Table 4.10, that both fitted quadratic models contain
highly significant terms with very small p-Values (<0.0001). It was noted that the
interaction of pH and temperature have a significant effect on iron removal efficiency
(%) while the interaction of pH and temperature, and temperature and Fe/Ni ratio
have a significant effect on Log (nickel loss (%)). The fitted models are adequate as
the p-Values for “lack of fit” in both models were above 0.05. In addition to the basic
analysis of variance, the fit of the quadratic models was evaluated by determining the
regression coefficient, R2. Both iron removal efficiency (%) and log (nickel loss (%))
models demonstrated satisfactory results, with R2 of 0.9622 for iron removal
efficiency and 0.9991 for log (nickel loss (%)).
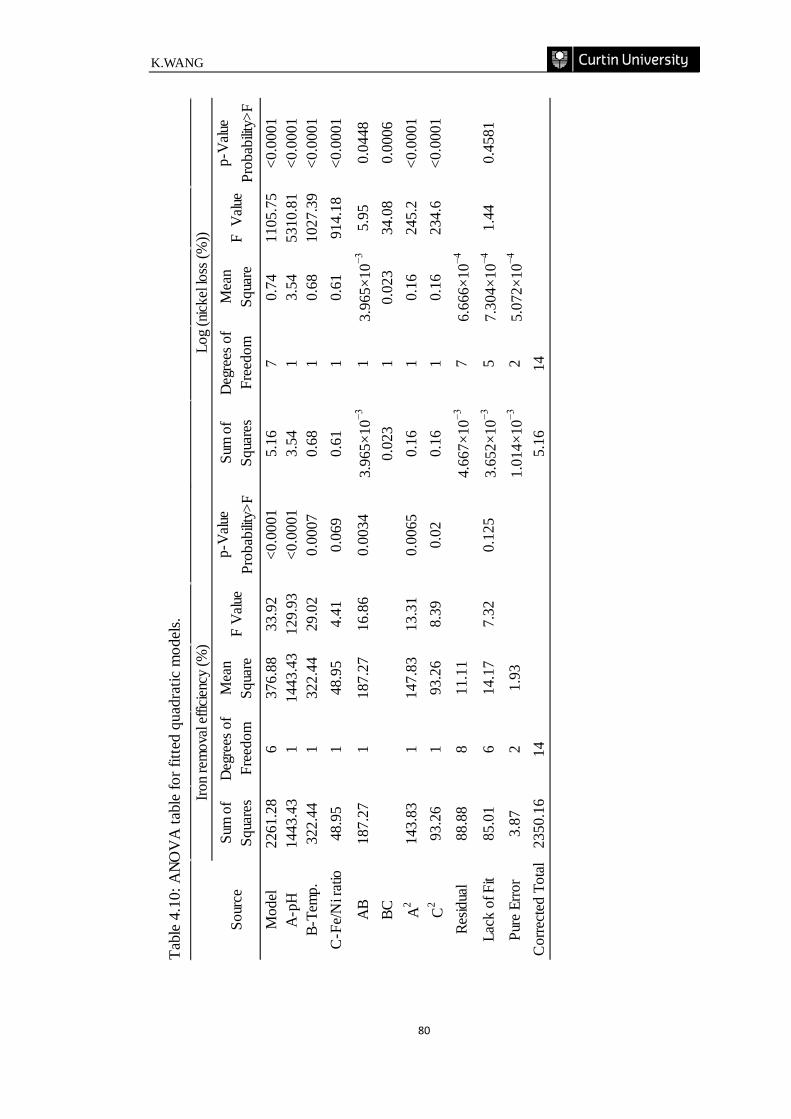
K.WANG
80
Tabl
e 4.
10: A
NOV
A ta
ble
for f
itted
qua
drat
ic m
odel
s.
p-V
alue
p-V
alue
Prob
abilit
y>F
Prob
abilit
y>F
Mod
el22
61.2
86
376.
8833
.92
<0.0
001
5.16
70.
7411
05.7
5<0
.000
1A
-pH
1443
.43
114
43.4
312
9.93
<0.0
001
3.54
13.
5453
10.8
1<0
.000
1B-
Tem
p.32
2.44
132
2.44
29.0
20.
0007
0.68
10.
6810
27.3
9<0
.000
1C
-Fe/
Ni r
atio
48.9
51
48.9
54.
410.
069
0.61
10.
6191
4.18
<0.0
001
AB
187.
271
187.
2716
.86
0.00
343.
965×
10−3
13.
965×
10−3
5.95
0.04
48BC
0.02
31
0.02
334
.08
0.00
06
A2
143.
831
147.
8313
.31
0.00
650.
161
0.16
245.
2<0
.000
1
C2
93.2
61
93.2
68.
390.
020.
161
0.16
234.
6<0
.000
1
Resid
ual
88.8
88
11.1
14.
667×
10−3
76.
666×
10−4
Lack
of F
it85
.01
614
.17
7.32
0.12
53.
652×
10−3
57.
304×
10−4
1.44
0.45
81
Pure
Erro
r3.
872
1.93
1.01
4×10
−32
5.07
2×10
−4
Cor
rect
ed T
otal
2350
.16
145.
1614
F V
alue
Iron
rem
oval
effic
iency
(%)
Log
(nick
el lo
ss (%
))
Sour
ceSu
m o
f Sq
uare
sD
egre
es o
f Fr
eedo
mM
ean
Squa
reF
Valu
eSu
m o
f Sq
uare
sD
egre
es o
f Fr
eedo
mM
ean
Squa
re
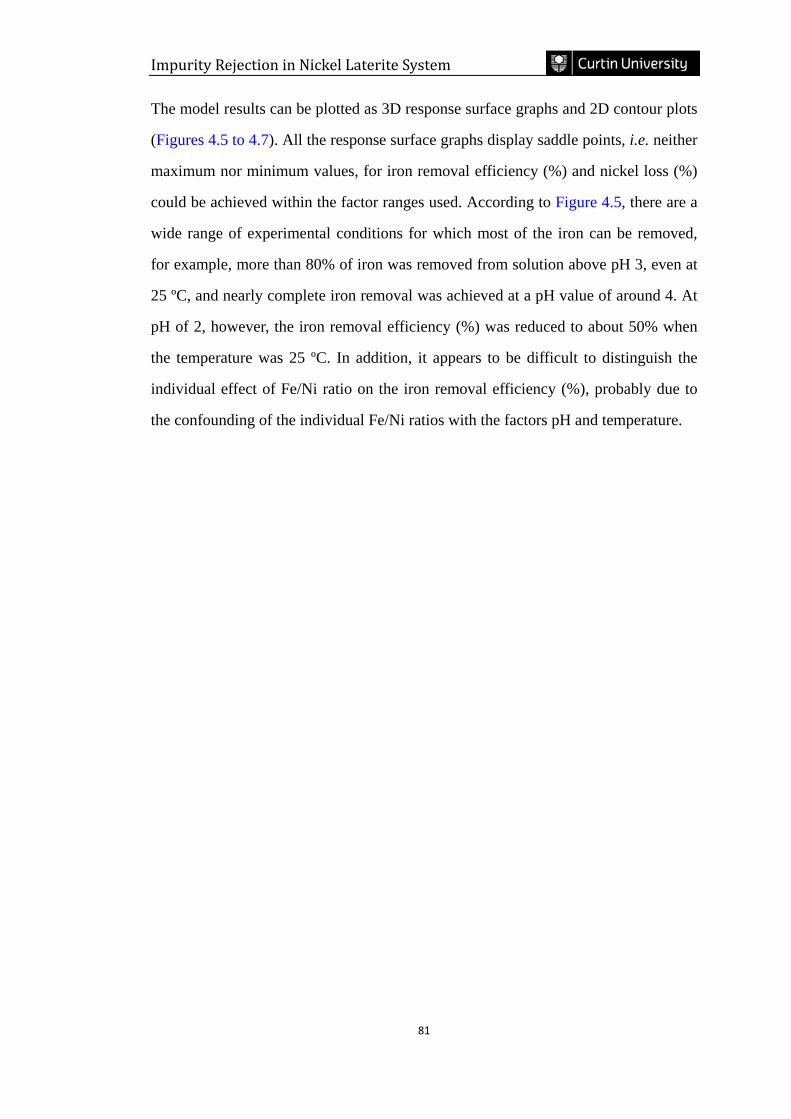
Impurity Rejection in Nickel Laterite System
81
The model results can be plotted as 3D response surface graphs and 2D contour plots
(Figures 4.5 to 4.7). All the response surface graphs display saddle points, i.e. neither
maximum nor minimum values, for iron removal efficiency (%) and nickel loss (%)
could be achieved within the factor ranges used. According to Figure 4.5, there are a
wide range of experimental conditions for which most of the iron can be removed,
for example, more than 80% of iron was removed from solution above pH 3, even at
25 ºC, and nearly complete iron removal was achieved at a pH value of around 4. At
pH of 2, however, the iron removal efficiency (%) was reduced to about 50% when
the temperature was 25 ºC. In addition, it appears to be difficult to distinguish the
individual effect of Fe/Ni ratio on the iron removal efficiency (%), probably due to
the confounding of the individual Fe/Ni ratios with the factors pH and temperature.
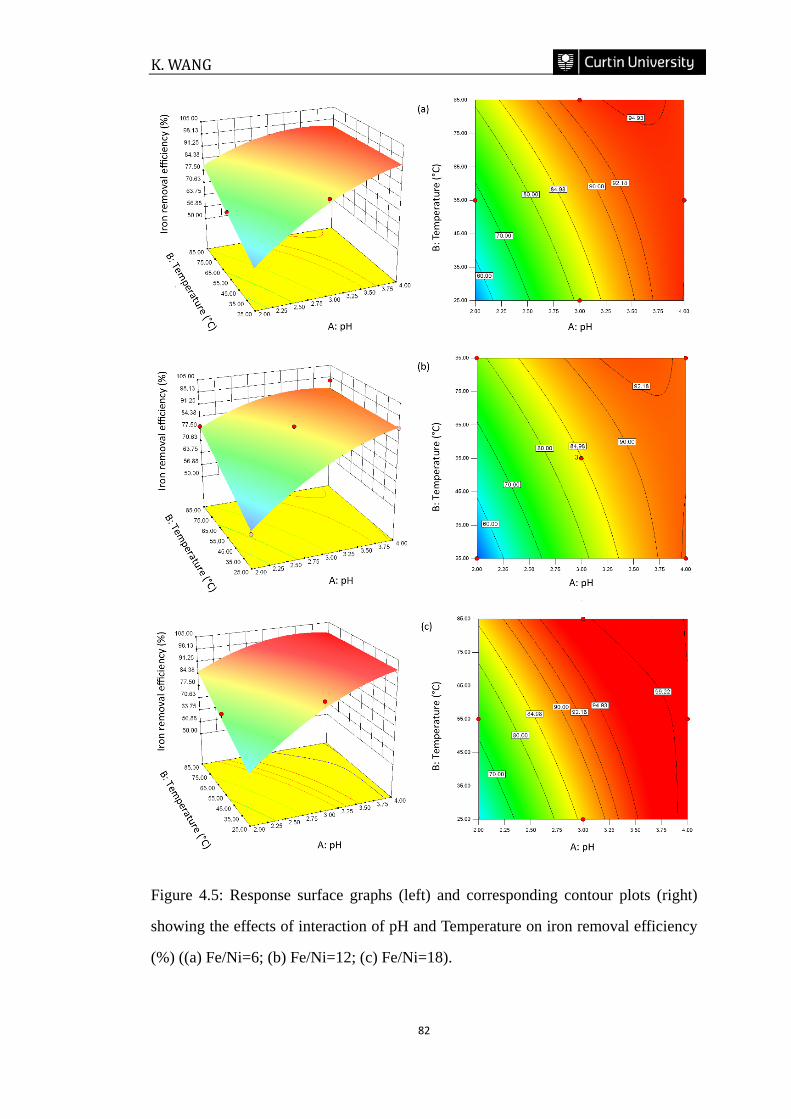
K. WANG
82
Figure 4.5: Response surface graphs (left) and corresponding contour plots (right)
showing the effects of interaction of pH and Temperature on iron removal efficiency
(%) ((a) Fe/Ni=6; (b) Fe/Ni=12; (c) Fe/Ni=18).
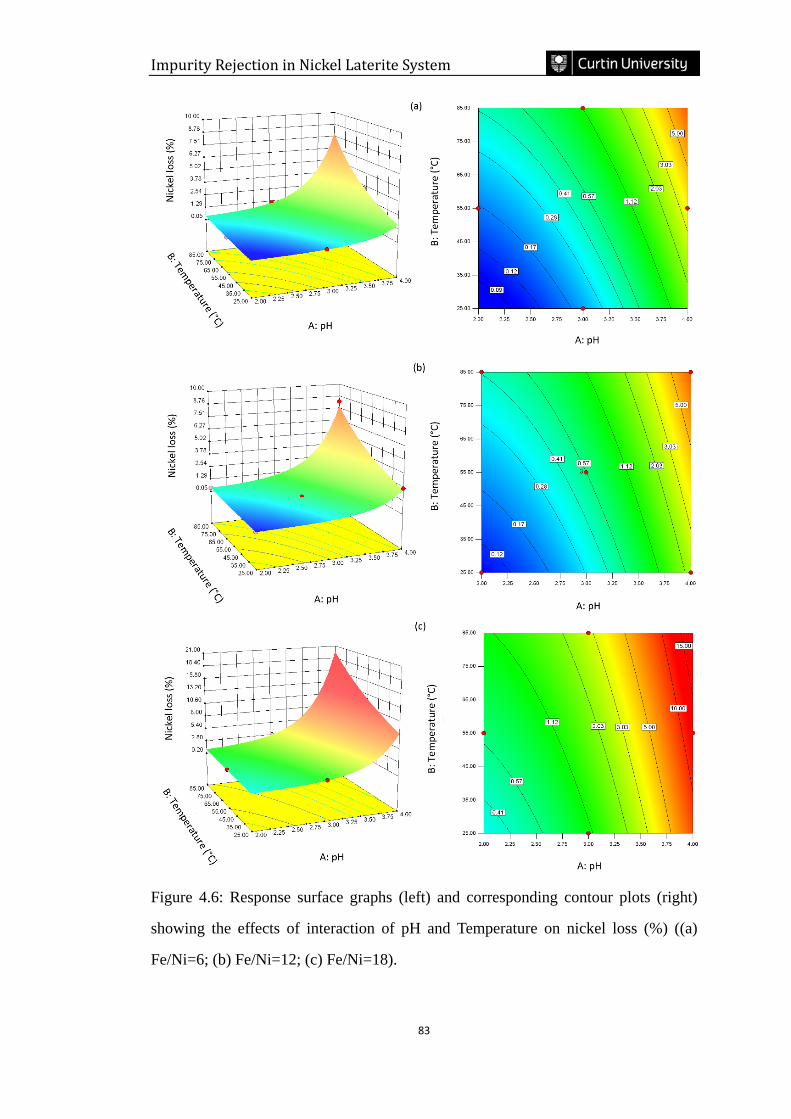
Impurity Rejection in Nickel Laterite System
83
Figure 4.6: Response surface graphs (left) and corresponding contour plots (right)
showing the effects of interaction of pH and Temperature on nickel loss (%) ((a)
Fe/Ni=6; (b) Fe/Ni=12; (c) Fe/Ni=18).
K. WANG
84
Figure 4.7: Response surface graphs (left) and corresponding contour plots (right)
showing the effects of interaction of Temperature and Fe/Ni ratio on nickel loss (%)
((a) pH=2; (b) pH=3; (c) pH=4).
Impurity Rejection in Nickel Laterite System
85
Nickel loss (%) can be minimized to less than 1% by adjusting the pH to 2 (Figures
4.5 and 4.7). At this pH value, however, increasing the temperature from 25 to 85 ºC
resulted in greater nickel loss, for example, from 0.42 to 1.06% for a Fe/Ni ratio of
18. Similar behaviour was also noted by Davey and Scott (1975), who investigated
the effect of temperature on the loss of zinc in the E.Z. process, and concluded that
increasing temperature resulted in an increase in the divalent ions incorporated into
the iron-containing precipitate. A higher Fe/Ni ratio was found to lead to greater
nickel loss in this study (Figure 4.7). These results are in good agreement with the
observations in a recent study on V.M. goethite precipitation in synthetic leach liquor
simulating the PLS produced by atmospheric leaching of laterite ores (Chang et al.,
2010), in which a higher initial Fe/Ni ratio in synthetic solutions resulted in more
nickel loss to the residue within the pH range of 2.5 to 3.0.
4.5.4 Process optimization and model prediction
The models developed by the response surface methodology allow iron removal
efficiency (%) and nickel loss (%) to be optimized independently. Figures 4.5 and 4.6
respectively show that iron removal is optimized by increased pH and temperature
and nickel loss is reduced by decreased pH and temperature, hence one response may
need to be optimized at the expense of the other. If the target value is set at 95% for
iron removal efficiency (%) and 1.5% for nickel loss (%), the optimized factors and
model predicted values are highly dependent on the priority of the target. Table 4.11
shows that if the goal of 95% iron removal efficiency is given priority it can only be
achieved with greater than 1.5% nickel loss, whereas if the goal of 1.5% nickel loss
is given priority it can only be achieved with less than 95% iron removal efficiency.
The models suggest that a “high temperature-low pH, and low temperature-high pH”
multi-step neutralizing strategy is likely to be required. This approach is the same as
that adopted by Roche (2009).
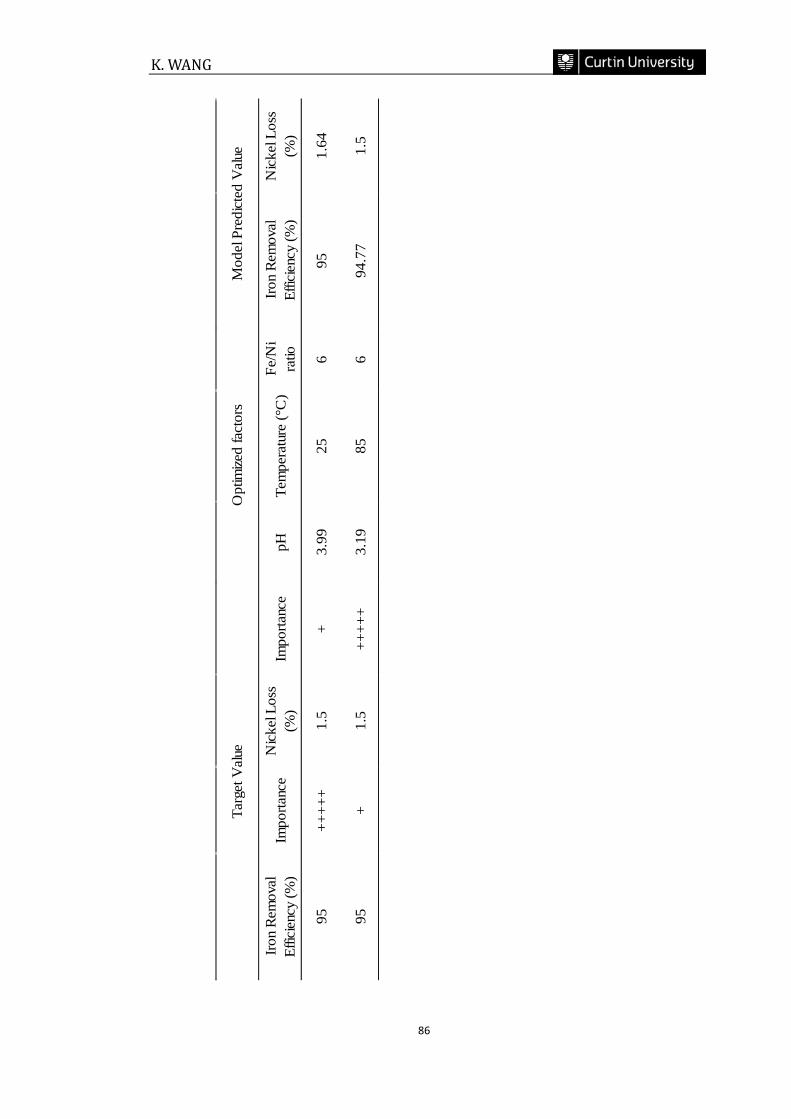
K. WANG
86
Iron
Rem
oval
Effic
iency
(%)
Impo
rtanc
eN
ickel
Loss
(%
)Im
porta
nce
pHTe
mpe
ratu
re (°
C)
Fe/N
i ra
tioIro
n Re
mov
al Ef
ficien
cy (%
)N
ickel
Loss
(%
)
95++
+++
1.5
+3.
9925
695
1.64
95+
1.5
++++
+3.
1985
694
.77
1.5
Targ
et V
alue
Opt
imize
d fa
ctor
sM
odel
Pred
icted
Valu
e
Impurity Rejection in the Nickel laterite Leach System
87
4.5.5 XRD analysis of the precipitates
The iron precipitation process used in this work is similar to the semi-batch
precipitation method reported by Roche (2009), which in turn is a modified E.Z.
goethite process. The E.Z goethite process was named by Allen et al. (1970) because
of the resemblance of the precipitates to goethite, however Gordon and Pickering
(1975) noted that the residues appeared not be the pure goethite. The extensive
experiments by Davey and Scott (1975) showed that the so-called goethite
precipitates may consist of goethite (α-FeOOH), akaganéite (β-FeOOH),
lepidocrocite (γ-FeOOH), hematite (α-Fe2O3), maghemite (γ-Fe2O3) as well as
poorly crystalline phases. Dutrizac (1987) found that the final precipitates contained
some poorly defined basic iron sulphates rather than conventional goethite
precipitates which were later identified as ferrihydrite and/or schwertmannite
(Claassen et al., 2002; Loan et al., 2002).
Figure 4.8 shows the XRD patterns of several precipitation products obtained under
various experimental conditions. Additional washing was performed to remove
gypsum from these samples before XRD analysis. It was noted that the mineralogy
of these precipitates is dominated by poorly structural-ordered schwertmannite
and/or ferrihydrite. No obvious presence of goethite was detected by XRD. In the
presence of sulphate, the formation of schwertmannite is considered to be
thermodynamically favoured over ferrihydrite in the pH range between 2 and 8
(Majzlan et al., 2004).
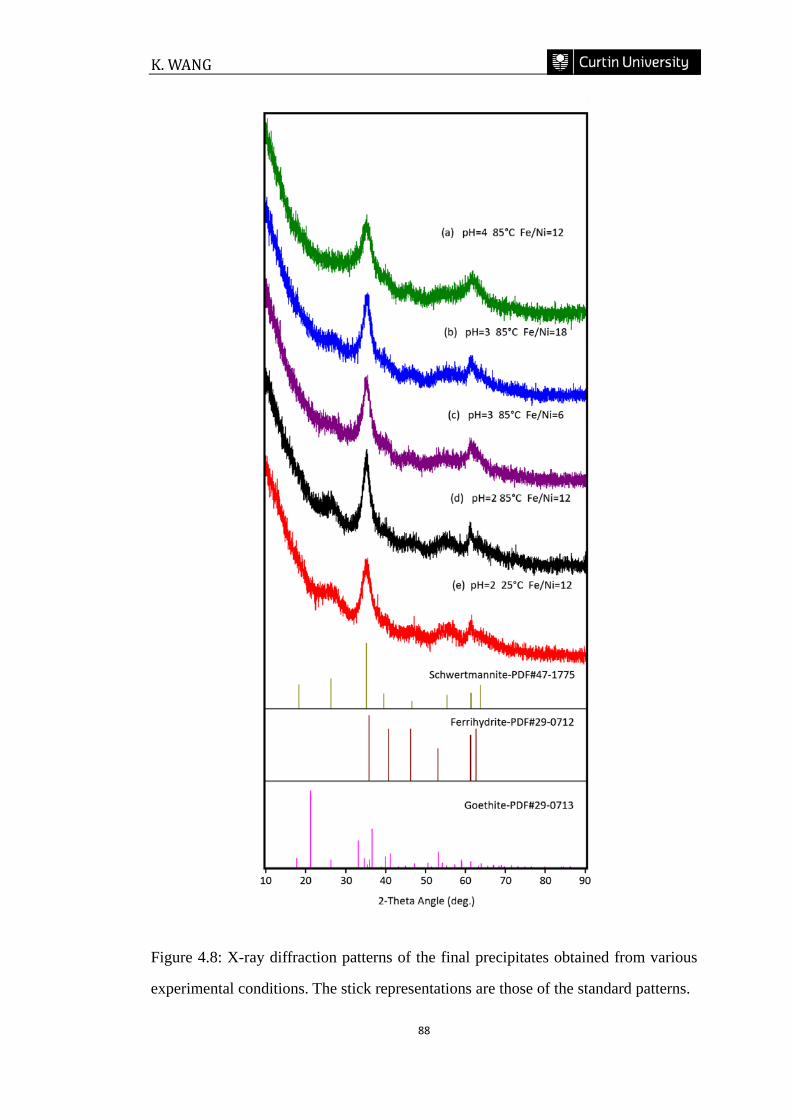
K. WANG
88
Figure 4.8: X-ray diffraction patterns of the final precipitates obtained from various
experimental conditions. The stick representations are those of the standard patterns.
Impurity Rejection in the Nickel laterite Leach System
89
The identification of ferrihydrite and schwertmannite is complicated as these occur in
small particles close to or below 10 nm in size (Murad and Rojík, 2003). The
disordered nature of ferrihydrite results in small diffracting domains that are hard to
detecte by conventional X-Ray Diffraction (XRD) (Jambor and Dutrizac, 1998).
Claassen (2006) proposed that schwertmannite is nothing more than ferrihydrite with
high sulphate values. In fact, schwertmannite is distinguished from ferrihydrite by a
tunnel structure similar to that of akaganéite, which is formed in the chloride system
(Cornell and Schwertmann, 2003). Ferrihydrite and schwertmannite are
thermodynamically unstable, and proposed to be the growth precursors of more
crystalline iron oxides, such as goethite and hematite (Bigham et al., 1996; Pollard et
al., 1992). Increasing temperature favours the transformation towards more stable
goethite and/or hematite (Jolivet et al., 2004; Schwertmann et al., 1999). The
presence of goethite is not clearly identified from the XRD analysis in the present
study (Figure 4.8), possibly because the transformation of the ferrihydrite to goethite
is inhibited by the presence of divalent Ni ions (Cornell et al., 1992), or that the main
XRD peaks of goethite are overlapped by the presence of large amounts of poorly
crystalline ferrihydrite and schwertmannite. However, it is well known that
schwertmannite and ferrihydrite can be dissolved more easily than goethite by acidic
ammonium oxalate at pH 3 and 25 ºC in the absence of light (Bigham et al., 1996).
Therefore, the presence of goethite could be confirmed after selectively removing
these poorly crystalline phases. More detailed characterization of the iron precipitates
can potentially help to understand the nickel loss mechanisms. This is pursued in
Chapter 7.
4.6 CONCULSION
In this Chapter, statistically-designed experiments combined with response surface
methodology were successfully employed for modelling the nickel loss associated
with iron precipitation from synthetic nickel laterite AL liquors containing just nickel
and iron. The following conclusions can be drawn:
K. WANG
90
1) The two-level fraction factorial design is an effective tool to identify which
factors will have significant impacts on the desired responses. Four quantitative
factors (pH, temperature, the initial Fe/Ni ratio and stirring speed) and one
qualitative factor (neutralizing agents) were considered in this stage. It was found
that the neutralizing agent and stirring speed had little effect on iron removal
efficiency (%) and log (nickel loss (%)).
2) Emphasis was placed on the investigation of the effects of important factors and
how these factors interact with each other. Three factors, pH, temperature and Fe/Ni
ratio were further studied by a three-level Box-Behnken design. Employing response
surface methodology, the data obtained from the Box-Behnken design was used to
develop mathematic models for both iron removal efficiency (%) and log (nickel loss
(%)). Satisfactory precision was obtained, as well as good accuracy.
3) Graphical response surface and contour plots were constructed to demonstrate the
links between responses and the interaction of factors. It should be noted that such
models only work satisfactorily within the ranges of factor values studied but must
be used with caution for conditions outside these ranges.
4) The data suggest that a “high temperature-low pH, and low temperature-high pH”
multi-step neutralizing strategy is best suited to the removal of iron from the
solutions examined in this chapter. It becomes clear shortly that the effects of other
trivalent metals such as aluminium and chromium on nickel loss need to be studied
in further detail, which is considered in Chapter 5.
5) The precipitates obtained in this chapter were mainly composed of ferrihydrite
and schwertmannite rather than pure goethite. The formation/presence of goethite
needs to be confirmed by further studies. Chapter 7 provides insight into this issue.
Impurity Rejection in the Nickel laterite Leach System
91
CHAPTER 5
IRON, ALUMINIUM AND CHROMIUM CO-REMOVAL FROM
SYNTHETIC AND REAL ATMOSPHERIC NICKEL LATERITE
LEACH SOLUTIONS
5.1 INTRODUCTION
As outlined in Chapter 1, the pregnant leach solution produced from atmospheric
acid leaching of nickel laterite ores often contains significant amounts of impurities,
of which ferric iron is the most abundant. The other main soluble trivalent ions
include aluminium and chromium. The effect of iron precipitation on nickel losses
has been discussed in Chapter 4. Chapter 5 presents a further experimental study on
the iron, aluminium and chromium co-removal by precipitation from both synthetic
and real atmospheric nickel laterite leach solutions.
Iron, aluminium and chromium are often removed by chemical precipitation before
the recovery of nickel (and cobalt). The pH value is the main variable that governs
the impurity rejection efficiency, as is detailed for the case of iron precipitation in
Chapter 4. An example of a titration curve of typical Acid Mine Drainage (AMD)
containing Fe3+ and Al3+ ions is given in Figure 5.1. The titration curve shows two
steep inflection points at pH values about 3.0 and 4.5. This suggests a considerable
acidity released due to the hydrolysis of Fe3+ and Al3+ ions. Their respective
following plateaus at pH values above 3.0 and 4.5 correspond to the total hydrolysis
and precipitation of iron and aluminium. The gentle slope in the pH range from 5 to 9
suggests the progressive hydrolysis of other metallic cations.
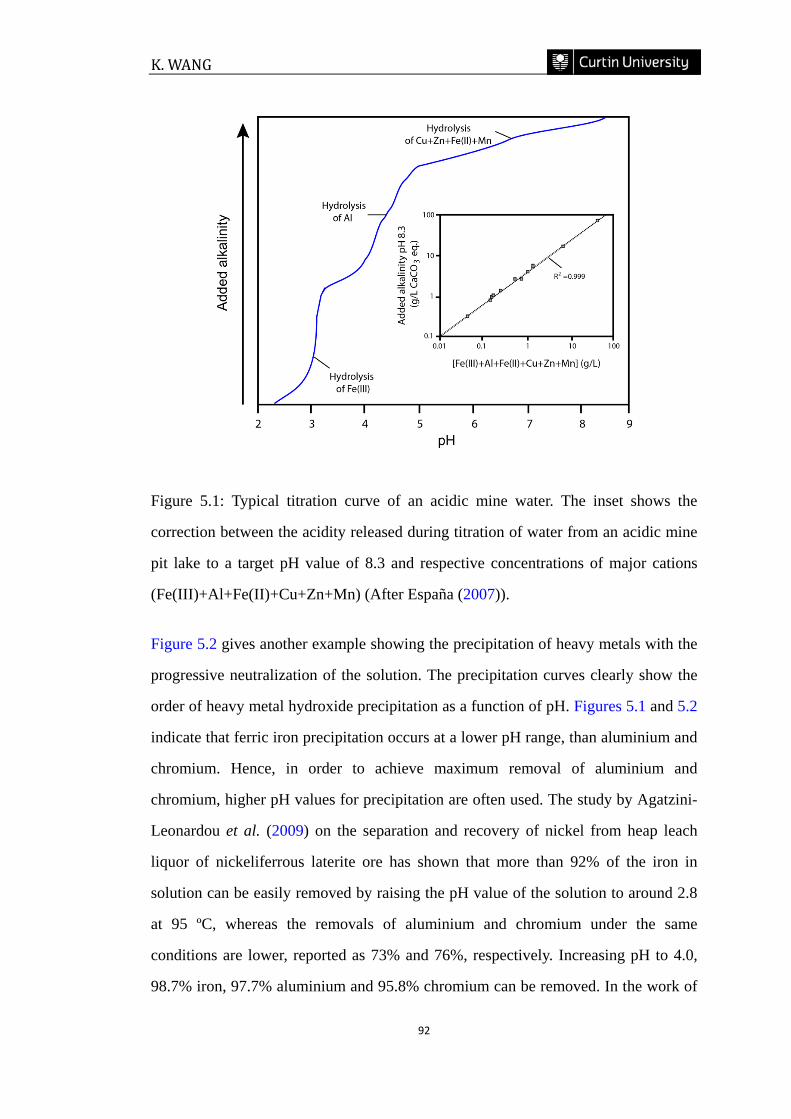
K. WANG
92
Figure 5.1: Typical titration curve of an acidic mine water. The inset shows the
correction between the acidity released during titration of water from an acidic mine
pit lake to a target pH value of 8.3 and respective concentrations of major cations
(Fe(III)+Al+Fe(II)+Cu+Zn+Mn) (After España (2007)).
Figure 5.2 gives another example showing the precipitation of heavy metals with the
progressive neutralization of the solution. The precipitation curves clearly show the
order of heavy metal hydroxide precipitation as a function of pH. Figures 5.1 and 5.2
indicate that ferric iron precipitation occurs at a lower pH range, than aluminium and
chromium. Hence, in order to achieve maximum removal of aluminium and
chromium, higher pH values for precipitation are often used. The study by Agatzini-
Leonardou et al. (2009) on the separation and recovery of nickel from heap leach
liquor of nickeliferrous laterite ore has shown that more than 92% of the iron in
solution can be easily removed by raising the pH value of the solution to around 2.8
at 95 ºC, whereas the removals of aluminium and chromium under the same
conditions are lower, reported as 73% and 76%, respectively. Increasing pH to 4.0,
98.7% iron, 97.7% aluminium and 95.8% chromium can be removed. In the work of
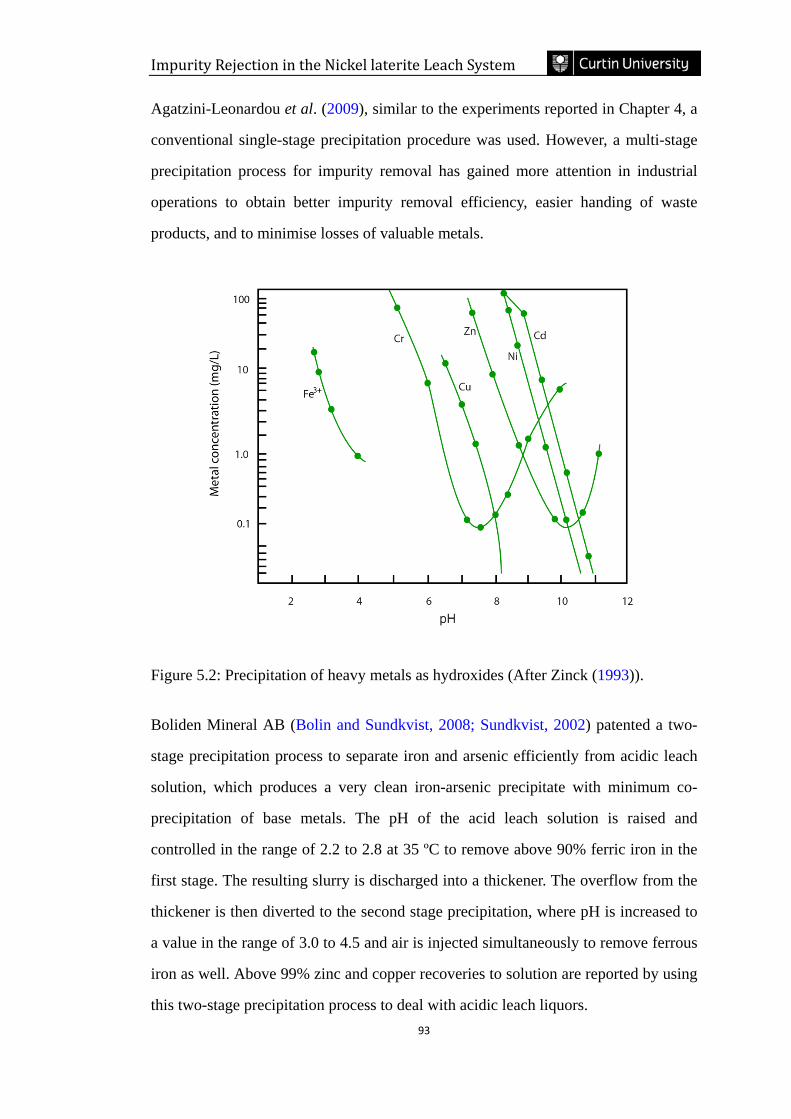
Impurity Rejection in the Nickel laterite Leach System
93
Agatzini-Leonardou et al. (2009), similar to the experiments reported in Chapter 4, a
conventional single-stage precipitation procedure was used. However, a multi-stage
precipitation process for impurity removal has gained more attention in industrial
operations to obtain better impurity removal efficiency, easier handing of waste
products, and to minimise losses of valuable metals.
Figure 5.2: Precipitation of heavy metals as hydroxides (After Zinck (1993)).
Boliden Mineral AB (Bolin and Sundkvist, 2008; Sundkvist, 2002) patented a two-
stage precipitation process to separate iron and arsenic efficiently from acidic leach
solution, which produces a very clean iron-arsenic precipitate with minimum co-
precipitation of base metals. The pH of the acid leach solution is raised and
controlled in the range of 2.2 to 2.8 at 35 ºC to remove above 90% ferric iron in the
first stage. The resulting slurry is discharged into a thickener. The overflow from the
thickener is then diverted to the second stage precipitation, where pH is increased to
a value in the range of 3.0 to 4.5 and air is injected simultaneously to remove ferrous
iron as well. Above 99% zinc and copper recoveries to solution are reported by using
this two-stage precipitation process to deal with acidic leach liquors.
K. WANG
94
The study on iron, aluminium and chromium removal from laterite heap leach
solutions by Guise and Castro (1996) showed that 41.3% iron, 21.8% aluminium and
29.5% chromium were rejected at pH 1.8 and 90 ºC by the addition of 50 g/L MgO
slurry in the first stage of the precipitation process. In the second stage of the
precipitation process operated at pH 2.5 and 90 ºC, 99.9% iron, 53% aluminium and
93.9% chromium of that remaining after the first stage were removed, but at a cost of
26.5% nickel and 37.1% cobalt losses to the solids. Köse and Topkaya (2011)
recently studied the Mixed Hydroxide Precipitation (MHP) process to remove
impurities from the leach liquors of nontronite type lateritic ores, and showed that the
concentrations of Fe3+, Al3+ and Cr3+ decreased from 38600, 3950, and 1060 ppm
respectively to 290, 1260 and 202 ppm by a first removal stage conducted at pH 2.5
and 90 ºC, and these values further dropped to 1.38, 3.6 and 0.77 ppm by a second
removal stage conducted at pH 4.25 and 70 ºC. However, nickel loss at the second
removal stage was still substantial at 17.2 %.
Unfortunately, the levels of nickel losses to the solids are very high in the impurity-
removal processes of Guise and Castro (1996) and Köse and Topkaya (2011).
Therefore, a more detailed study on the precipitation process for impurity removal is
required to achieve acceptable low levels of nickel loss, which is the aim of this
chapter. The aims of Chapter 5 are to study the effects of iron, aluminium and
chromium co-elimination upon nickel losses, develop a multi-stage precipitation
process to remove impurities efficiently without causing significant losses of nickel,
and produce precipitation sludge with satisfactory physical properties such as fast
settling rate. In order to achieve these goals, both single- and multi-stage
precipitation experiments were carried out with synthetic leach solution and real
leach liquor obtained by column leaching of low-grade Western Australia nickel
laterite ores with sulphuric acid at ambient temperature. The precipitation
experiments for the synthetic leach solution are conducted using a solution
containing various combinations of metal ions: Fe(III)+Ni(II), Fe(III)+Ni(II)+Al(III),
Fe(III)+Ni(II)+Cr(III) and Fe(III)+Ni(II)+Al(III)+Cr(III).
Impurity Rejection in the Nickel laterite Leach System
95
5.2 EXPERIMENTAL
5.2.1 Single-stage precipitation
All the single-stage precipitation experiments were conducted using a semi-batch
reaction vessel. The experimental set-up and procedure has been detailed in Chapter
4. For each experiment, a volume of 500 mL of synthetic leach solutions containing
30 g/L Fe3+ [as Fe2(SO4)3∙xH2O], 0 to 5 g/L Ni2+ [as NiSO4∙6H2O], 0 to 6.5 g/L Al3+
[as Al2(SO4)3∙18H2O], and 0 to 2 g/L Cr3+ [as Cr2(SO4)3∙xH2O] was pumped into a
baffled reaction vessel containing a pre-determined amount of de-ionized water over
a period of 2.5 hours. A CaCO3 (25% w/w) suspension in de-ionized water was
simultaneously pumped into the reaction vessel to achieve the target pH values. The
temperature was controlled using an oil bath and the precipitation reactions
conducted at 25, 55 or 85 ºC. At the completion of the reaction, the resulting slurry
was vacuum filtered through a 0.45 µm Gelman Supor® membrane. The metal
concentrations in the filtrate were analysed by ICP-OES, the filter cake was carefully
washed with large amounts of de-ionized water, and then dried overnight at 60 ºC.
The chemical composition of the dried solid products was determined by ICP-OES
after aqua regia digestion.
5.2.2 Multi-stage precipitation
Multi-stage precipitation experiments with a combination of pH and temperature
control were conducted using both synthetic and real leach solutions. The multi-stage
precipitation experiments consisted of two consecutive precipitation processes.
Similar to the single-stage precipitation described in section 5.2.1, the first stage
precipitation process involved pumping 500 mL of leach solution into a reaction
vessel within 2.5 hours. A CaCO3 (25% w/w) suspension in de-ionized water was
pumped simultaneously to control pH value. Temperature was controlled by an oil
bath. Instead of stopping the reaction after 2.5 hours, a second stage of precipitation
was conducted by ageing the resultant slurry for one hour. After leach solution
K. WANG
96
pumping was completed, the pH was adjusted to the desired value by pumping
CaCO3 (25% w/w) suspension in de-ionized water or adding concentrated H2SO4,
and the temperature was increased as required by heating. Once the new equilibrium
pH and/or temperature were reached, the reaction was maintained for 1 hour. It
should be noted that the second stage is described as a precipitation process,
however, depending on the final pH and temperature compared to the first stage, it
may involve a combination of precipitation and/or dissolution of existing precipitate.
5.2.3 Flocculant preparation and settling rate test
Two commercial polyacrylamide polymers were used as flocculants to improve the
settling rate of sludge produced from the precipitation: a non-ionic polymer, FA 920
VHM, and a cationic polymer, FO 4190 VHM. Both flocculants are supplied by SNF
FLOERGER®, France.
Flocculant was prepared by the method used by Loan (2004). The flocculant stock
solution was prepared 1 day before use. Flocculant powder, 0.25 g, was placed in a
clean 100 mL plastic bottle and 2 mL of methylated spirits added. After adding 98
mL of de-ionized water, the bottle was stoppered by a lid and shaken vigorously for
30 seconds. The bottle was then agitated on a roller for 1 hour. Before use, the
flocculant stock solution was diluted by a factor of 10 to give a fresh flocculant
solution with concentration of 0.025%.
The settling rate test was conducted in a 250 mL measuring cylinder at room
temperature. After transferring 250 mL of sludge from the reaction vessel to the
measuring cylinder, a specific dosage of fresh flocculant was added. The measuring
cylinder was inverted 10 times to ensure thorough mixing. Once the cylinder was set
upright, the settling rate was determined as a function of time from the height of the
solid-liquid interface (mud-line). The drop in the mud-line was plotted as a function
of time and the slope of the linear portion of the plot used to define the initial settling
rate.
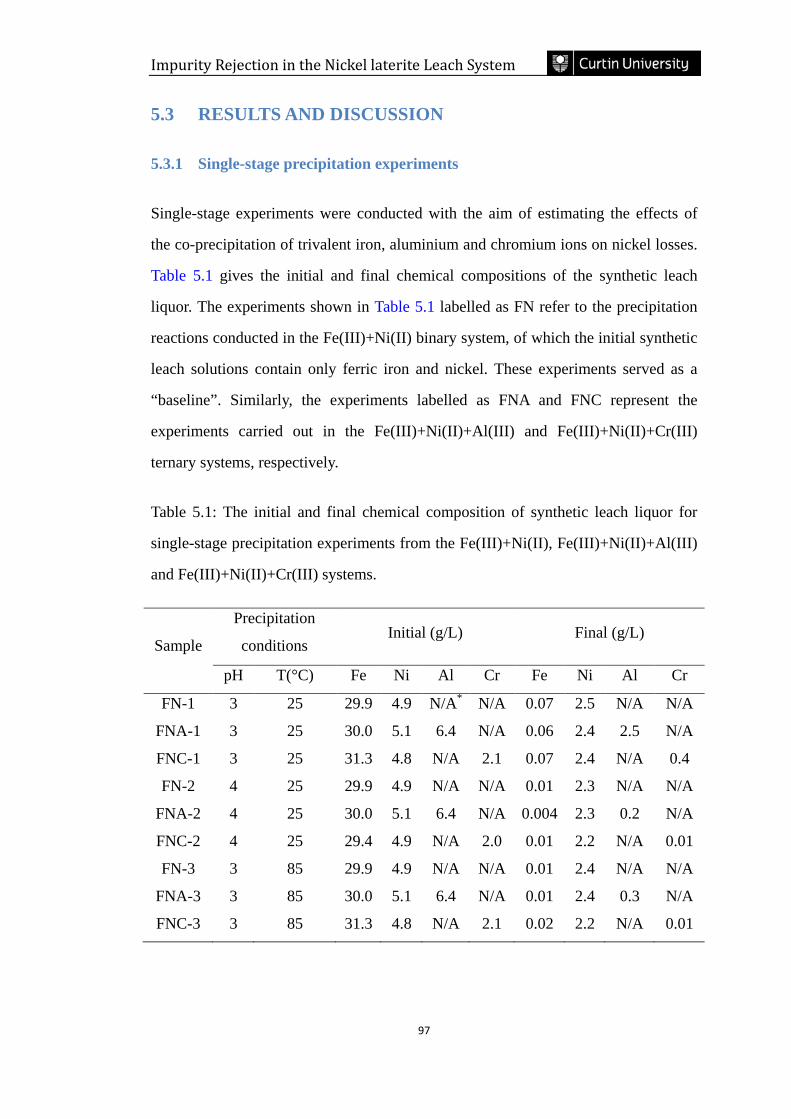
Impurity Rejection in the Nickel laterite Leach System
97
5.3 RESULTS AND DISCUSSION
5.3.1 Single-stage precipitation experiments
Single-stage experiments were conducted with the aim of estimating the effects of
the co-precipitation of trivalent iron, aluminium and chromium ions on nickel losses.
Table 5.1 gives the initial and final chemical compositions of the synthetic leach
liquor. The experiments shown in Table 5.1 labelled as FN refer to the precipitation
reactions conducted in the Fe(III)+Ni(II) binary system, of which the initial synthetic
leach solutions contain only ferric iron and nickel. These experiments served as a
“baseline”. Similarly, the experiments labelled as FNA and FNC represent the
experiments carried out in the Fe(III)+Ni(II)+Al(III) and Fe(III)+Ni(II)+Cr(III)
ternary systems, respectively.
Table 5.1: The initial and final chemical composition of synthetic leach liquor for
single-stage precipitation experiments from the Fe(III)+Ni(II), Fe(III)+Ni(II)+Al(III)
and Fe(III)+Ni(II)+Cr(III) systems.
Sample
Precipitation
conditions Initial (g/L) Final (g/L)
pH T(°C) Fe Ni Al Cr Fe Ni Al Cr
FN-1 3 25 29.9 4.9 N/A* N/A 0.07 2.5 N/A N/A
FNA-1 3 25 30.0 5.1 6.4 N/A 0.06 2.4 2.5 N/A
FNC-1 3 25 31.3 4.8 N/A 2.1 0.07 2.4 N/A 0.4
FN-2 4 25 29.9 4.9 N/A N/A 0.01 2.3 N/A N/A
FNA-2 4 25 30.0 5.1 6.4 N/A 0.004 2.3 0.2 N/A
FNC-2 4 25 29.4 4.9 N/A 2.0 0.01 2.2 N/A 0.01
FN-3 3 85 29.9 4.9 N/A N/A 0.01 2.4 N/A N/A
FNA-3 3 85 30.0 5.1 6.4 N/A 0.01 2.4 0.3 N/A
FNC-3 3 85 31.3 4.8 N/A 2.1 0.02 2.2 N/A 0.01
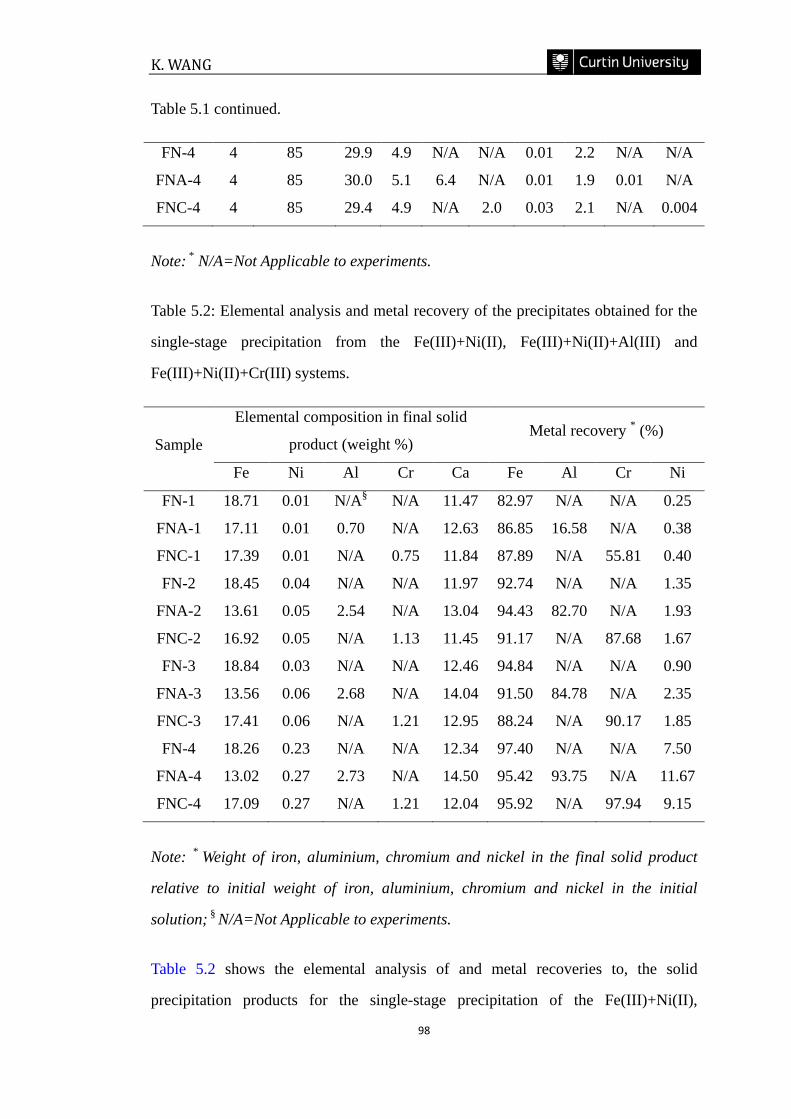
K. WANG
98
Table 5.1 continued.
FN-4 4 85 29.9 4.9 N/A N/A 0.01 2.2 N/A N/A
FNA-4 4 85 30.0 5.1 6.4 N/A 0.01 1.9 0.01 N/A
FNC-4 4 85 29.4 4.9 N/A 2.0 0.03 2.1 N/A 0.004
Note: * N/A=Not Applicable to experiments.
Table 5.2: Elemental analysis and metal recovery of the precipitates obtained for the
single-stage precipitation from the Fe(III)+Ni(II), Fe(III)+Ni(II)+Al(III) and
Fe(III)+Ni(II)+Cr(III) systems.
Sample
Elemental composition in final solid
product (weight %) Metal recovery * (%)
Fe Ni Al Cr Ca Fe Al Cr Ni
FN-1 18.71 0.01 N/A§ N/A 11.47 82.97 N/A N/A 0.25
FNA-1 17.11 0.01 0.70 N/A 12.63 86.85 16.58 N/A 0.38
FNC-1 17.39 0.01 N/A 0.75 11.84 87.89 N/A 55.81 0.40
FN-2 18.45 0.04 N/A N/A 11.97 92.74 N/A N/A 1.35
FNA-2 13.61 0.05 2.54 N/A 13.04 94.43 82.70 N/A 1.93
FNC-2 16.92 0.05 N/A 1.13 11.45 91.17 N/A 87.68 1.67
FN-3 18.84 0.03 N/A N/A 12.46 94.84 N/A N/A 0.90
FNA-3 13.56 0.06 2.68 N/A 14.04 91.50 84.78 N/A 2.35
FNC-3 17.41 0.06 N/A 1.21 12.95 88.24 N/A 90.17 1.85
FN-4 18.26 0.23 N/A N/A 12.34 97.40 N/A N/A 7.50
FNA-4 13.02 0.27 2.73 N/A 14.50 95.42 93.75 N/A 11.67
FNC-4 17.09 0.27 N/A 1.21 12.04 95.92 N/A 97.94 9.15
Note: * Weight of iron, aluminium, chromium and nickel in the final solid product
relative to initial weight of iron, aluminium, chromium and nickel in the initial
solution; § N/A=Not Applicable to experiments.
Table 5.2 shows the elemental analysis of and metal recoveries to, the solid
precipitation products for the single-stage precipitation of the Fe(III)+Ni(II),
Impurity Rejection in the Nickel laterite Leach System
99
Fe(III)+Ni(II)+Al(III) and Fe(III)+Ni(II)+Cr(III) systems. The experimental results
indicate that increasing pH and temperature favour the removal of iron, aluminium
and chromium, but at a cost of more nickel loss to the solids. Noticeably, the
precipitation recoveries of aluminium and chromium were quite low at pH 3 and
25 °C with only 16.58% for aluminium (FNA-1) and 55.81% for chromium (FNC-1).
Comparison of the results obtained in the Fe(III)+Ni(II)+Al(III) system (FNA-1 to
FNA-4) and with those of the Fe(III)+Ni(II) system (FN-1 to FN-4) shows that more
nickel was lost during iron and aluminium co-precipitation. A similar trend was
noticed when comparing the results for the Fe(III)+Ni(II)+Cr(III) system (FNC-1 to
FNC-4) to the Fe(III)+Ni(II) system (FN-1 to FN-4), where the loss of nickel
increased during iron and chromium co-precipitation. Further comparison of the
experimental results obtained in the Fe(III)+Ni(II)+Al(III) system and the
Fe(III)+Ni(II)+Cr(III) system show that the presence of aluminium ions in the initial
solution resulted in more loss of nickel to the solids than when chromium was
present. However, one exception is noted for the pair of experiments labelled as
FNA-1 and FNC-1 a slightly higher nickel loss was recorded in the
Fe(III)+Ni(II)+Cr(III) system when the precipitation reaction was conducted at pH 3
and 25 °C. As the level of nickel loss was quite low at this experimental condition,
such inconsistency could be due to analytical variation.
In Chapter 4, the effect of Fe/Ni ratio in the initial leach liquor on nickel loss was
discussed. Similarly, the Al/Ni and Cr/Ni ratios are expected to influence the nickel
loss as well. In a more complicated Fe(III)+Ni(II)+Al(III)+Cr(III) quaternary system,
for example, interactions of aluminium and chromium during co-precipitation may
also occur. Therefore, further investigation of the Fe(III)+Ni(II)+Al(III)+Cr(III)
quaternary system with various Al/Ni and Cr/Ni ratios is necessary.
5.3.2 Statistically-designed experiments
In order to examine the effects of Al/Ni and Cr/Ni ratios on nickel loss, a series of
experiments with various aluminium and chromium concentrations in the initial
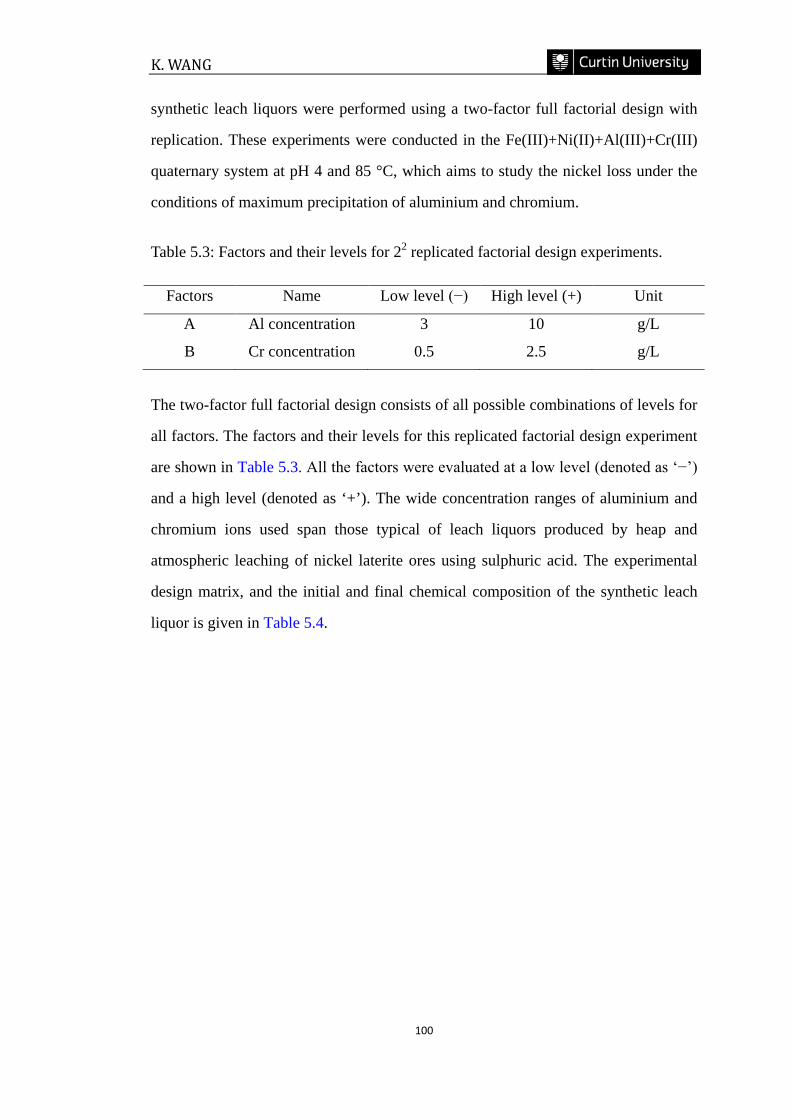
K. WANG
100
synthetic leach liquors were performed using a two-factor full factorial design with
replication. These experiments were conducted in the Fe(III)+Ni(II)+Al(III)+Cr(III)
quaternary system at pH 4 and 85 °C, which aims to study the nickel loss under the
conditions of maximum precipitation of aluminium and chromium.
Table 5.3: Factors and their levels for 22 replicated factorial design experiments.
Factors Name Low level (−) High level (+) Unit
A Al concentration 3 10 g/L
B Cr concentration 0.5 2.5 g/L
The two-factor full factorial design consists of all possible combinations of levels for
all factors. The factors and their levels for this replicated factorial design experiment
are shown in Table 5.3. All the factors were evaluated at a low level (denoted as ‘−’)
and a high level (denoted as ‘+’). The wide concentration ranges of aluminium and
chromium ions used span those typical of leach liquors produced by heap and
atmospheric leaching of nickel laterite ores using sulphuric acid. The experimental
design matrix, and the initial and final chemical composition of the synthetic leach
liquor is given in Table 5.4.
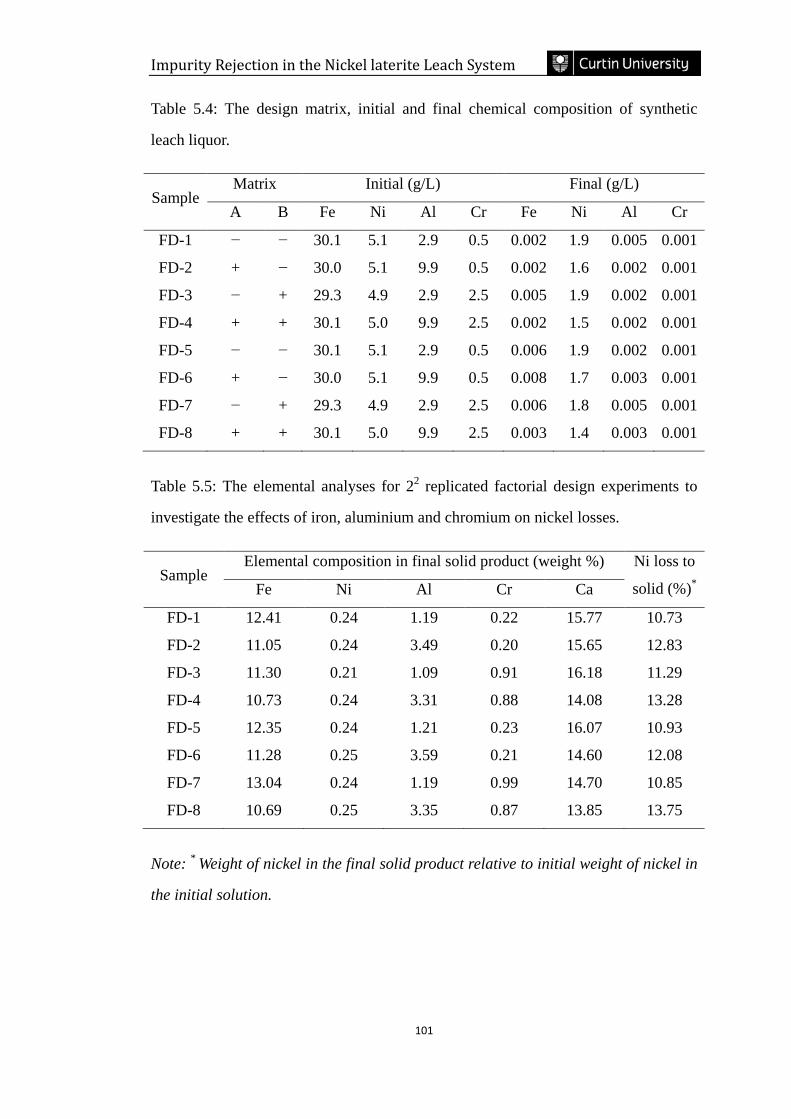
Impurity Rejection in the Nickel laterite Leach System
101
Table 5.4: The design matrix, initial and final chemical composition of synthetic
leach liquor.
Sample Matrix Initial (g/L) Final (g/L)
A B Fe Ni Al Cr Fe Ni Al Cr
FD-1 − − 30.1 5.1 2.9 0.5 0.002 1.9 0.005 0.001
FD-2 + − 30.0 5.1 9.9 0.5 0.002 1.6 0.002 0.001
FD-3 − + 29.3 4.9 2.9 2.5 0.005 1.9 0.002 0.001
FD-4 + + 30.1 5.0 9.9 2.5 0.002 1.5 0.002 0.001
FD-5 − − 30.1 5.1 2.9 0.5 0.006 1.9 0.002 0.001
FD-6 + − 30.0 5.1 9.9 0.5 0.008 1.7 0.003 0.001
FD-7 − + 29.3 4.9 2.9 2.5 0.006 1.8 0.005 0.001
FD-8 + + 30.1 5.0 9.9 2.5 0.003 1.4 0.003 0.001
Table 5.5: The elemental analyses for 22 replicated factorial design experiments to
investigate the effects of iron, aluminium and chromium on nickel losses.
Sample Elemental composition in final solid product (weight %) Ni loss to
solid (%)* Fe Ni Al Cr Ca
FD-1 12.41 0.24 1.19 0.22 15.77 10.73
FD-2 11.05 0.24 3.49 0.20 15.65 12.83
FD-3 11.30 0.21 1.09 0.91 16.18 11.29
FD-4 10.73 0.24 3.31 0.88 14.08 13.28
FD-5 12.35 0.24 1.21 0.23 16.07 10.93
FD-6 11.28 0.25 3.59 0.21 14.60 12.08
FD-7 13.04 0.24 1.19 0.99 14.70 10.85
FD-8 10.69 0.25 3.35 0.87 13.85 13.75
Note: * Weight of nickel in the final solid product relative to initial weight of nickel in
the initial solution.
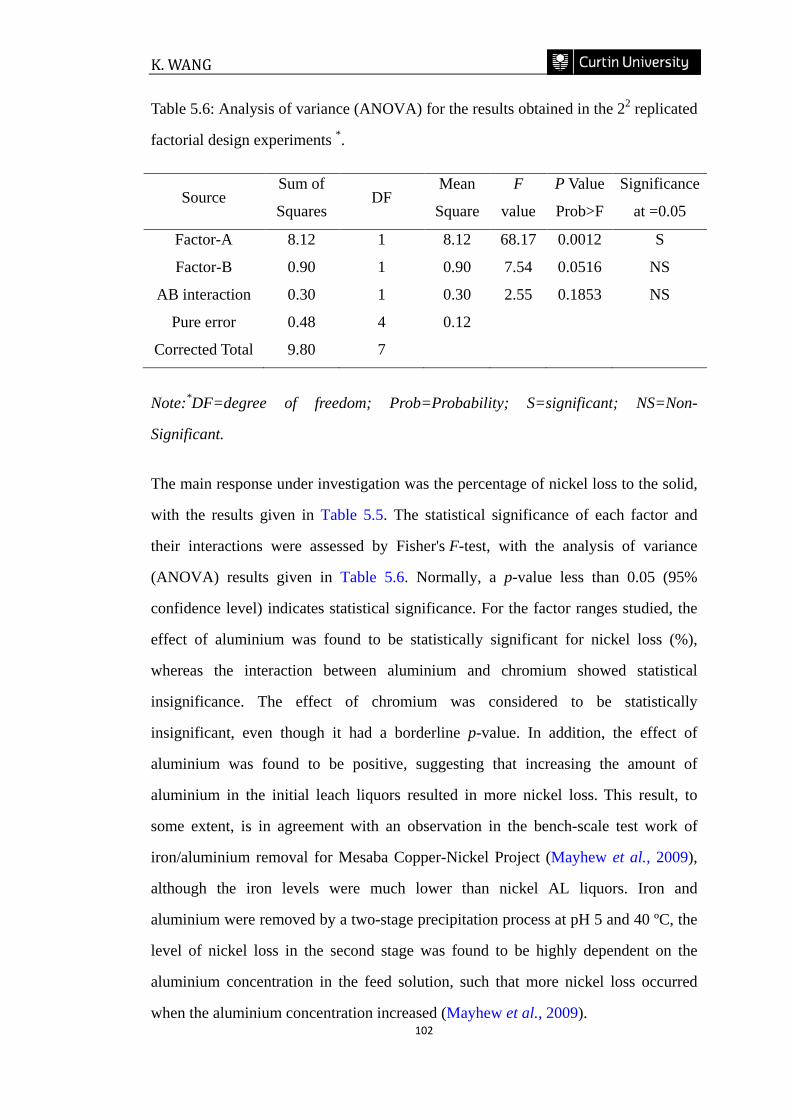
K. WANG
102
Table 5.6: Analysis of variance (ANOVA) for the results obtained in the 22 replicated
factorial design experiments *.
Source Sum of
Squares DF
Mean
Square
F
value
P Value
Prob>F
Significance
at =0.05
Factor-A 8.12 1 8.12 68.17 0.0012 S
Factor-B 0.90 1 0.90 7.54 0.0516 NS
AB interaction 0.30 1 0.30 2.55 0.1853 NS
Pure error 0.48 4 0.12
Corrected Total 9.80 7
Note:*DF=degree of freedom; Prob=Probability; S=significant; NS=Non-
Significant.
The main response under investigation was the percentage of nickel loss to the solid,
with the results given in Table 5.5. The statistical significance of each factor and
their interactions were assessed by Fisher's F-test, with the analysis of variance
(ANOVA) results given in Table 5.6. Normally, a p-value less than 0.05 (95%
confidence level) indicates statistical significance. For the factor ranges studied, the
effect of aluminium was found to be statistically significant for nickel loss (%),
whereas the interaction between aluminium and chromium showed statistical
insignificance. The effect of chromium was considered to be statistically
insignificant, even though it had a borderline p-value. In addition, the effect of
aluminium was found to be positive, suggesting that increasing the amount of
aluminium in the initial leach liquors resulted in more nickel loss. This result, to
some extent, is in agreement with an observation in the bench-scale test work of
iron/aluminium removal for Mesaba Copper-Nickel Project (Mayhew et al., 2009),
although the iron levels were much lower than nickel AL liquors. Iron and
aluminium were removed by a two-stage precipitation process at pH 5 and 40 ºC, the
level of nickel loss in the second stage was found to be highly dependent on the
aluminium concentration in the feed solution, such that more nickel loss occurred
when the aluminium concentration increased (Mayhew et al., 2009).
Impurity Rejection in the Nickel laterite Leach System
103
5.3.3 Multi-stage precipitation experiments
Previous sections confirmed the presence of aluminium ions in the leach solution
containing iron, aluminium, chromium and nickel ions exerts a significant impact on
nickel loss. Temperature and pH are two significant factors affecting each other in
controlling the precipitation of metallic ions. Higher temperatures favour the removal
of iron, aluminium and chromium, but at a cost of more nickel loss to the solids.
Aluminium often requires a higher precipitation pH compared to iron, i.e. pH 4 to 5
for aluminium and 2.5 to 3.5 for ferric iron (Steemson and Smith, 2009). Thus, it
becomes feasible to design and develop a multi-precipitation process to remove iron,
aluminium and chromium in different stages operated under these conditions with
various temperature and pH. Table 5.7 shows some strategies for a two-stage
precipitation process conducted in the Fe(III)+Ni(II)+Al(III)+Cr(III) quaternary
system using stepwise changes in temperature and pH. The central concept behind
the design of these multi-stage precipitation processes is to minimize the loss of
nickel by precipitating iron, aluminium and chromium in different stages: the
majority of iron together with some aluminium and chromium are expected to be
precipitated in the first stage; the residual iron and significant fractions of aluminium
and chromium are expected to be removed in the second stage.
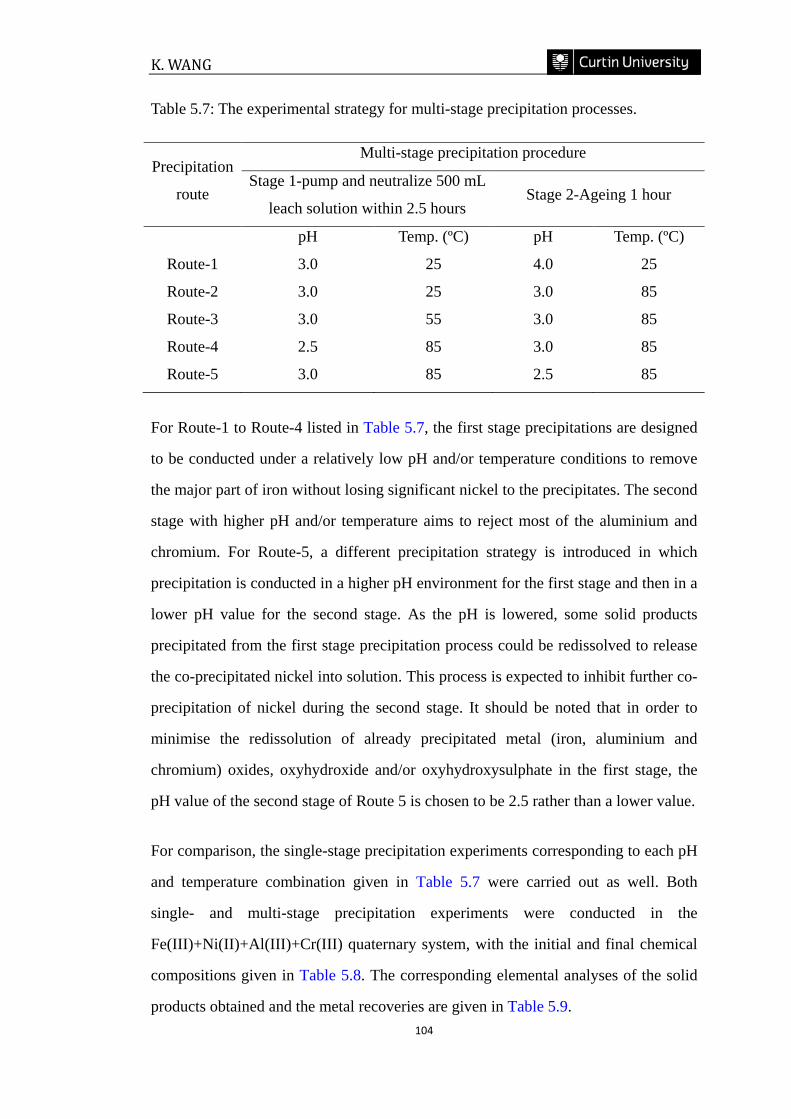
K. WANG
104
Table 5.7: The experimental strategy for multi-stage precipitation processes.
Precipitation
route
Multi-stage precipitation procedure
Stage 1-pump and neutralize 500 mL
leach solution within 2.5 hours Stage 2-Ageing 1 hour
pH Temp. (ºC) pH Temp. (ºC)
Route-1 3.0 25 4.0 25
Route-2 3.0 25 3.0 85
Route-3 3.0 55 3.0 85
Route-4 2.5 85 3.0 85
Route-5 3.0 85 2.5 85
For Route-1 to Route-4 listed in Table 5.7, the first stage precipitations are designed
to be conducted under a relatively low pH and/or temperature conditions to remove
the major part of iron without losing significant nickel to the precipitates. The second
stage with higher pH and/or temperature aims to reject most of the aluminium and
chromium. For Route-5, a different precipitation strategy is introduced in which
precipitation is conducted in a higher pH environment for the first stage and then in a
lower pH value for the second stage. As the pH is lowered, some solid products
precipitated from the first stage precipitation process could be redissolved to release
the co-precipitated nickel into solution. This process is expected to inhibit further co-
precipitation of nickel during the second stage. It should be noted that in order to
minimise the redissolution of already precipitated metal (iron, aluminium and
chromium) oxides, oxyhydroxide and/or oxyhydroxysulphate in the first stage, the
pH value of the second stage of Route 5 is chosen to be 2.5 rather than a lower value.
For comparison, the single-stage precipitation experiments corresponding to each pH
and temperature combination given in Table 5.7 were carried out as well. Both
single- and multi-stage precipitation experiments were conducted in the
Fe(III)+Ni(II)+Al(III)+Cr(III) quaternary system, with the initial and final chemical
compositions given in Table 5.8. The corresponding elemental analyses of the solid
products obtained and the metal recoveries are given in Table 5.9.
Impurity Rejection in the Nickel laterite Leach System
105
The first five experiments labelled as FNAC-1 to FNAC-5 shown in Tables 5.8 and
5.9 referred to the single-stage precipitation, while the last five experiments labelled
as FNAC-M-1 to FNAC-M-5 represented the multi-stage precipitation. As can be
seen from Table 5.9, above 80% iron and generally above 90% of the iron can be
removed in all single- and multi-stage precipitation processes. For the single-stage
precipitation experiments, a considerable amount of aluminium still remained in the
solution for the experiments labelled as FNAC-1, FNAC-3 and FNAC-4. Further
comparison of the results for the experiments with the same precipitation pH but
different temperatures (FNAC-1, FNAC-3 and FNAC-5) suggests that precipitation
of aluminium together with chromium increased as the temperature increased from
25 to 85 ºC (Tables 5.8 and 5.9). As expected, higher pH and temperature favour the
removal of iron, aluminium and chromium but at a cost of a higher level of nickel
loss. Thus, the existing single-stage precipitation processes are not acceptable with
respect to both the impurity removal and nickel loss.
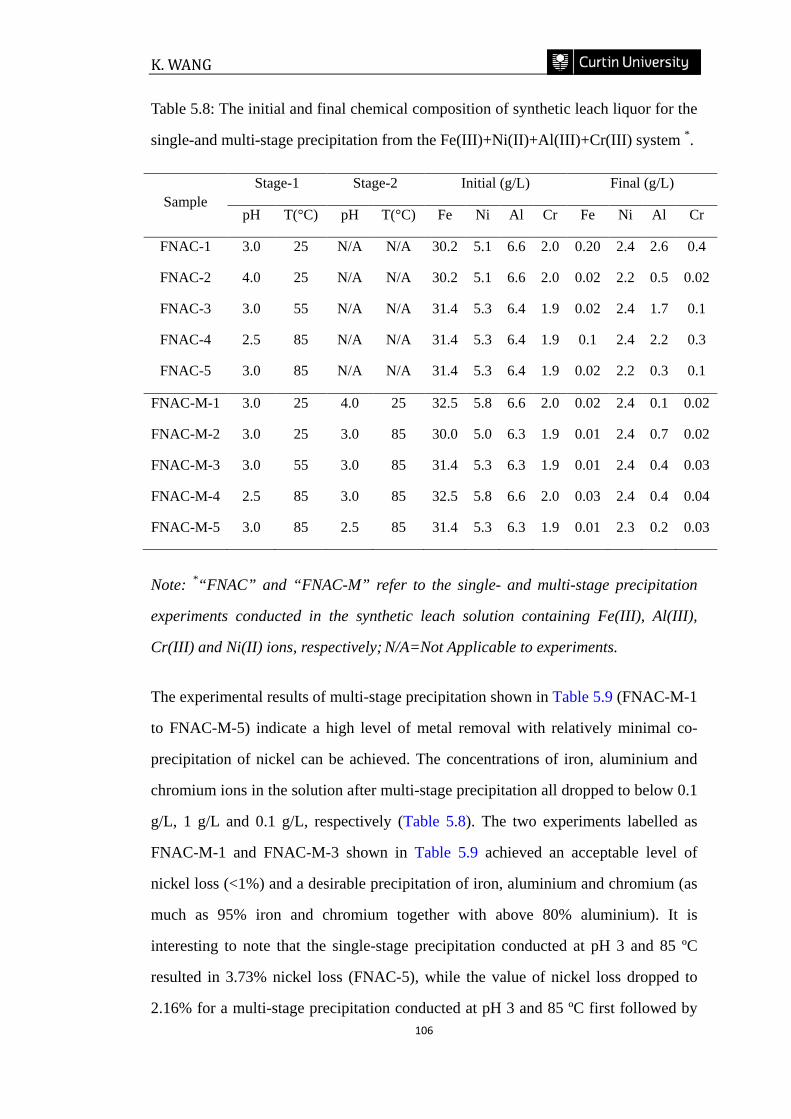
K. WANG
106
Table 5.8: The initial and final chemical composition of synthetic leach liquor for the
single-and multi-stage precipitation from the Fe(III)+Ni(II)+Al(III)+Cr(III) system *.
Sample Stage-1 Stage-2 Initial (g/L) Final (g/L)
pH T(°C) pH T(°C) Fe Ni Al Cr Fe Ni Al Cr
FNAC-1 3.0 25 N/A N/A 30.2 5.1 6.6 2.0 0.20 2.4 2.6 0.4
FNAC-2 4.0 25 N/A N/A 30.2 5.1 6.6 2.0 0.02 2.2 0.5 0.02
FNAC-3 3.0 55 N/A N/A 31.4 5.3 6.4 1.9 0.02 2.4 1.7 0.1
FNAC-4 2.5 85 N/A N/A 31.4 5.3 6.4 1.9 0.1 2.4 2.2 0.3
FNAC-5 3.0 85 N/A N/A 31.4 5.3 6.4 1.9 0.02 2.2 0.3 0.1
FNAC-M-1 3.0 25 4.0 25 32.5 5.8 6.6 2.0 0.02 2.4 0.1 0.02
FNAC-M-2 3.0 25 3.0 85 30.0 5.0 6.3 1.9 0.01 2.4 0.7 0.02
FNAC-M-3 3.0 55 3.0 85 31.4 5.3 6.3 1.9 0.01 2.4 0.4 0.03
FNAC-M-4 2.5 85 3.0 85 32.5 5.8 6.6 2.0 0.03 2.4 0.4 0.04
FNAC-M-5 3.0 85 2.5 85 31.4 5.3 6.3 1.9 0.01 2.3 0.2 0.03
Note: *“FNAC” and “FNAC-M” refer to the single- and multi-stage precipitation
experiments conducted in the synthetic leach solution containing Fe(III), Al(III),
Cr(III) and Ni(II) ions, respectively; N/A=Not Applicable to experiments.
The experimental results of multi-stage precipitation shown in Table 5.9 (FNAC-M-1
to FNAC-M-5) indicate a high level of metal removal with relatively minimal co-
precipitation of nickel can be achieved. The concentrations of iron, aluminium and
chromium ions in the solution after multi-stage precipitation all dropped to below 0.1
g/L, 1 g/L and 0.1 g/L, respectively (Table 5.8). The two experiments labelled as
FNAC-M-1 and FNAC-M-3 shown in Table 5.9 achieved an acceptable level of
nickel loss (<1%) and a desirable precipitation of iron, aluminium and chromium (as
much as 95% iron and chromium together with above 80% aluminium). It is
interesting to note that the single-stage precipitation conducted at pH 3 and 85 ºC
resulted in 3.73% nickel loss (FNAC-5), while the value of nickel loss dropped to
2.16% for a multi-stage precipitation conducted at pH 3 and 85 ºC first followed by
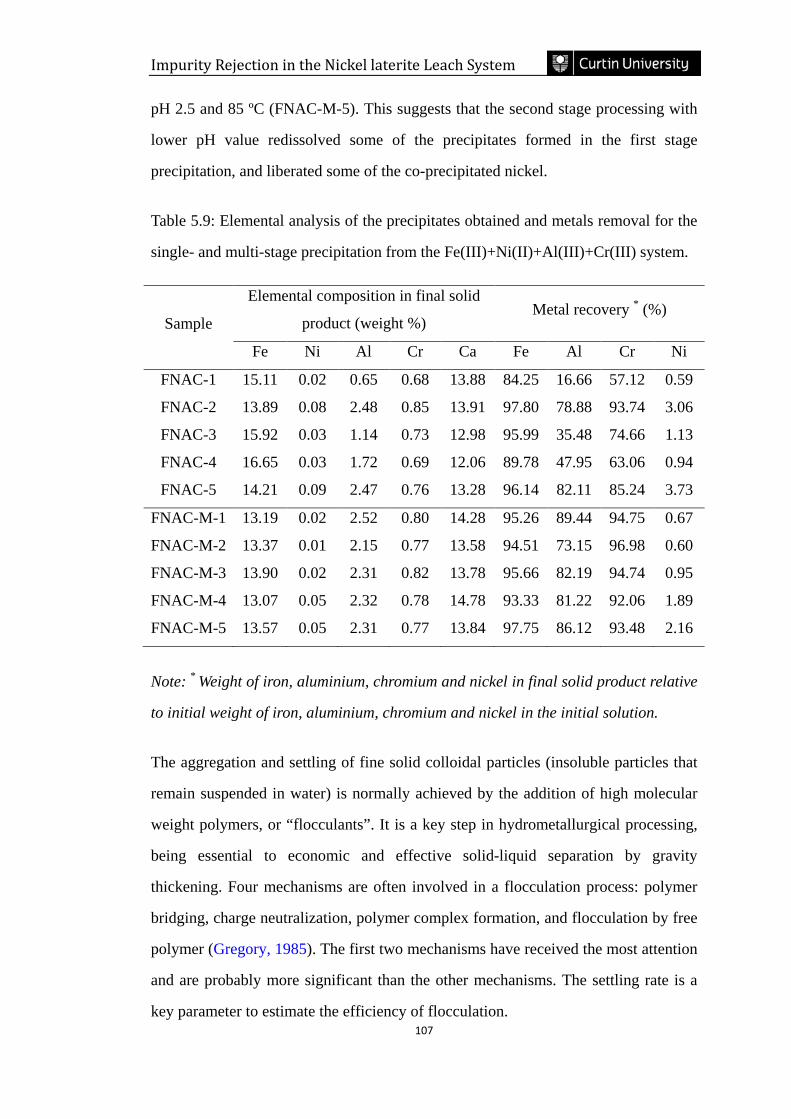
Impurity Rejection in the Nickel laterite Leach System
107
pH 2.5 and 85 ºC (FNAC-M-5). This suggests that the second stage processing with
lower pH value redissolved some of the precipitates formed in the first stage
precipitation, and liberated some of the co-precipitated nickel.
Table 5.9: Elemental analysis of the precipitates obtained and metals removal for the
single- and multi-stage precipitation from the Fe(III)+Ni(II)+Al(III)+Cr(III) system.
Sample
Elemental composition in final solid
product (weight %) Metal recovery * (%)
Fe Ni Al Cr Ca Fe Al Cr Ni
FNAC-1 15.11 0.02 0.65 0.68 13.88 84.25 16.66 57.12 0.59
FNAC-2 13.89 0.08 2.48 0.85 13.91 97.80 78.88 93.74 3.06
FNAC-3 15.92 0.03 1.14 0.73 12.98 95.99 35.48 74.66 1.13
FNAC-4 16.65 0.03 1.72 0.69 12.06 89.78 47.95 63.06 0.94
FNAC-5 14.21 0.09 2.47 0.76 13.28 96.14 82.11 85.24 3.73
FNAC-M-1 13.19 0.02 2.52 0.80 14.28 95.26 89.44 94.75 0.67
FNAC-M-2 13.37 0.01 2.15 0.77 13.58 94.51 73.15 96.98 0.60
FNAC-M-3 13.90 0.02 2.31 0.82 13.78 95.66 82.19 94.74 0.95
FNAC-M-4 13.07 0.05 2.32 0.78 14.78 93.33 81.22 92.06 1.89
FNAC-M-5 13.57 0.05 2.31 0.77 13.84 97.75 86.12 93.48 2.16
Note: * Weight of iron, aluminium, chromium and nickel in final solid product relative
to initial weight of iron, aluminium, chromium and nickel in the initial solution.
The aggregation and settling of fine solid colloidal particles (insoluble particles that
remain suspended in water) is normally achieved by the addition of high molecular
weight polymers, or “flocculants”. It is a key step in hydrometallurgical processing,
being essential to economic and effective solid-liquid separation by gravity
thickening. Four mechanisms are often involved in a flocculation process: polymer
bridging, charge neutralization, polymer complex formation, and flocculation by free
polymer (Gregory, 1985). The first two mechanisms have received the most attention
and are probably more significant than the other mechanisms. The settling rate is a
key parameter to estimate the efficiency of flocculation.
K. WANG
108
The results of settling rate tests for the precipitates produced from the current
experiments are outlined in Table 5.10. These indicate that the settling rate is
improved by increasing precipitation temperature (compare tests FNAC-1, FNAC-3
and FNAC-5) and particularly by using 4 mL cationic polymer FO 4190 VHM
compared to 2 mL as flocculant (all tests). These effects may relate to colloid
stability and change in the flocculation mechanism. High molecular weight cationic
flocculants normally represent the convergence of bridging and charge neutralization
mechanisms (Mangravite et al., 1985). The early patent on the E.Z. Goethite Process
to remove ferric iron from an iron-bearing acid leaching solutions by Allen et al.
(1970) showed that the sludge obtained by operating the precipitation process within
the range of pH from 1.7 to 3.5 and temperature from 50 °C to the boiling point can
settle rapidly with the aid of a flocculant. For example, the addition of a high
molecular weight polyacrylamide non-ionic polymer, Separan M.G.L., was found to
be effective with settling rates of up to 3.3 m/h. Fast settling rates were also observed
in the present work when using a similar non-ionic polymer as flocculant, such as the
samples obtained at elevated temperatures (FNAC-3 to FNAC-5, FNAC-M-3 to
FNAC-M-5). For the settling rates of the sludge obtained from multi-stage
precipitation processes (FNAC-M-1 to FNAC-M-5), the final settling rates seem to
be highly dependent on the first stage of the precipitation process, where the major
portion of iron is hydrolysed and precipitated. For instance, when adding 4 mL
cationic flocculant, the single-stage precipitations conducted at pH 3 and 25 °C
(FNAC-1), and pH 3 and 85 °C (FNAC-5) showed a settling rate of 0.38 m/h and
6.11 m/h, respectively. However, an intermediate settling rate of 1.92 m/h was
recorded by a multi-stage precipitation process conducted at pH 3 and 25°C for the
first stage and then pH 3 and 85°C for the second stage (FNAC-M-2).
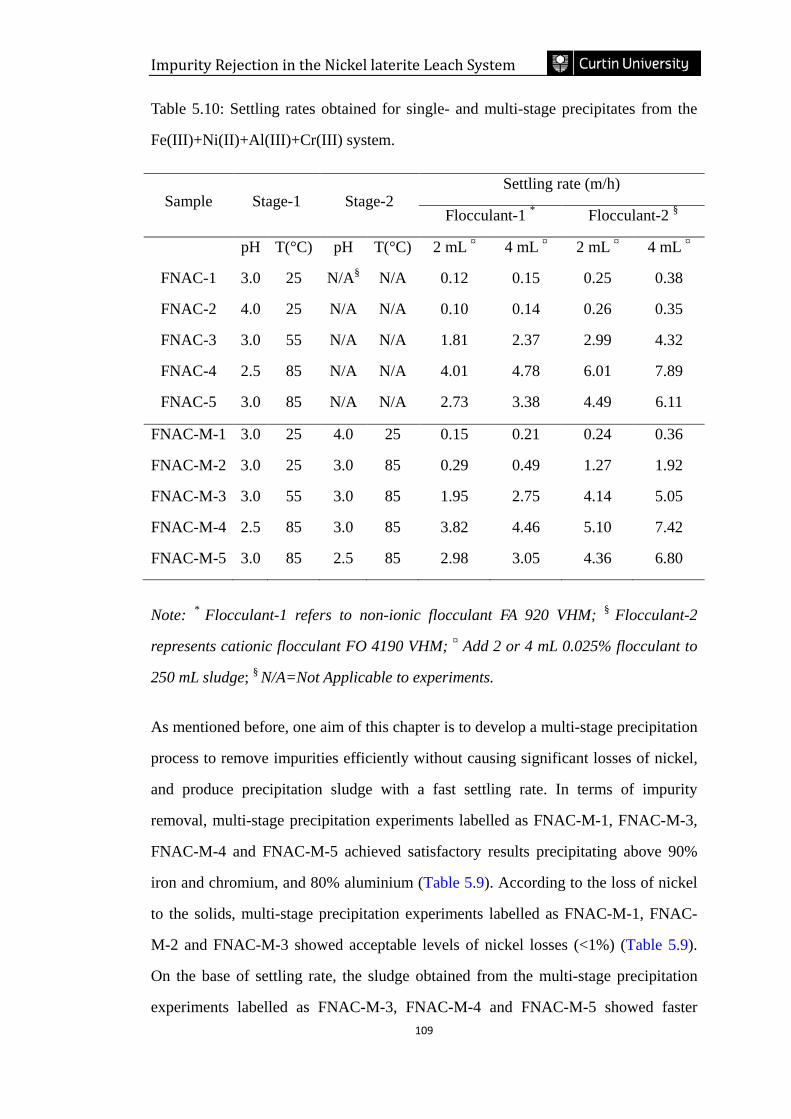
Impurity Rejection in the Nickel laterite Leach System
109
Table 5.10: Settling rates obtained for single- and multi-stage precipitates from the
Fe(III)+Ni(II)+Al(III)+Cr(III) system.
Sample Stage-1 Stage-2 Settling rate (m/h)
Flocculant-1 * Flocculant-2 §
pH T(°C) pH T(°C) 2 mL ¤ 4 mL ¤ 2 mL ¤ 4 mL ¤
FNAC-1 3.0 25 N/A§ N/A 0.12 0.15 0.25 0.38
FNAC-2 4.0 25 N/A N/A 0.10 0.14 0.26 0.35
FNAC-3 3.0 55 N/A N/A 1.81 2.37 2.99 4.32
FNAC-4 2.5 85 N/A N/A 4.01 4.78 6.01 7.89
FNAC-5 3.0 85 N/A N/A 2.73 3.38 4.49 6.11
FNAC-M-1 3.0 25 4.0 25 0.15 0.21 0.24 0.36
FNAC-M-2 3.0 25 3.0 85 0.29 0.49 1.27 1.92
FNAC-M-3 3.0 55 3.0 85 1.95 2.75 4.14 5.05
FNAC-M-4 2.5 85 3.0 85 3.82 4.46 5.10 7.42
FNAC-M-5 3.0 85 2.5 85 2.98 3.05 4.36 6.80
Note: * Flocculant-1 refers to non-ionic flocculant FA 920 VHM; § Flocculant-2
represents cationic flocculant FO 4190 VHM; ¤ Add 2 or 4 mL 0.025% flocculant to
250 mL sludge; § N/A=Not Applicable to experiments.
As mentioned before, one aim of this chapter is to develop a multi-stage precipitation
process to remove impurities efficiently without causing significant losses of nickel,
and produce precipitation sludge with a fast settling rate. In terms of impurity
removal, multi-stage precipitation experiments labelled as FNAC-M-1, FNAC-M-3,
FNAC-M-4 and FNAC-M-5 achieved satisfactory results precipitating above 90%
iron and chromium, and 80% aluminium (Table 5.9). According to the loss of nickel
to the solids, multi-stage precipitation experiments labelled as FNAC-M-1, FNAC-
M-2 and FNAC-M-3 showed acceptable levels of nickel losses (<1%) (Table 5.9).
On the base of settling rate, the sludge obtained from the multi-stage precipitation
experiments labelled as FNAC-M-3, FNAC-M-4 and FNAC-M-5 showed faster
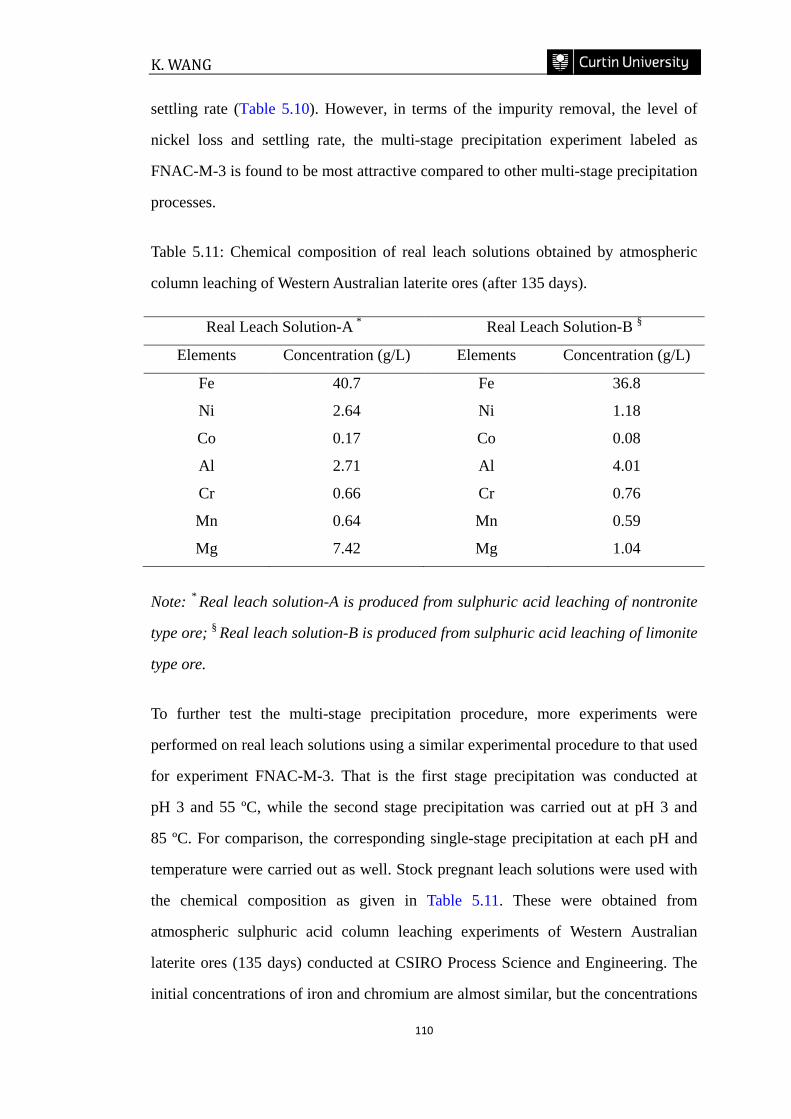
K. WANG
110
settling rate (Table 5.10). However, in terms of the impurity removal, the level of
nickel loss and settling rate, the multi-stage precipitation experiment labeled as
FNAC-M-3 is found to be most attractive compared to other multi-stage precipitation
processes.
Table 5.11: Chemical composition of real leach solutions obtained by atmospheric
column leaching of Western Australian laterite ores (after 135 days).
Real Leach Solution-A * Real Leach Solution-B §
Elements Concentration (g/L) Elements Concentration (g/L)
Fe 40.7 Fe 36.8
Ni 2.64 Ni 1.18
Co 0.17 Co 0.08
Al 2.71 Al 4.01
Cr 0.66 Cr 0.76
Mn 0.64 Mn 0.59
Mg 7.42 Mg 1.04
Note: * Real leach solution-A is produced from sulphuric acid leaching of nontronite
type ore; § Real leach solution-B is produced from sulphuric acid leaching of limonite
type ore.
To further test the multi-stage precipitation procedure, more experiments were
performed on real leach solutions using a similar experimental procedure to that used
for experiment FNAC-M-3. That is the first stage precipitation was conducted at
pH 3 and 55 ºC, while the second stage precipitation was carried out at pH 3 and
85 ºC. For comparison, the corresponding single-stage precipitation at each pH and
temperature were carried out as well. Stock pregnant leach solutions were used with
the chemical composition as given in Table 5.11. These were obtained from
atmospheric sulphuric acid column leaching experiments of Western Australian
laterite ores (135 days) conducted at CSIRO Process Science and Engineering. The
initial concentrations of iron and chromium are almost similar, but the concentrations
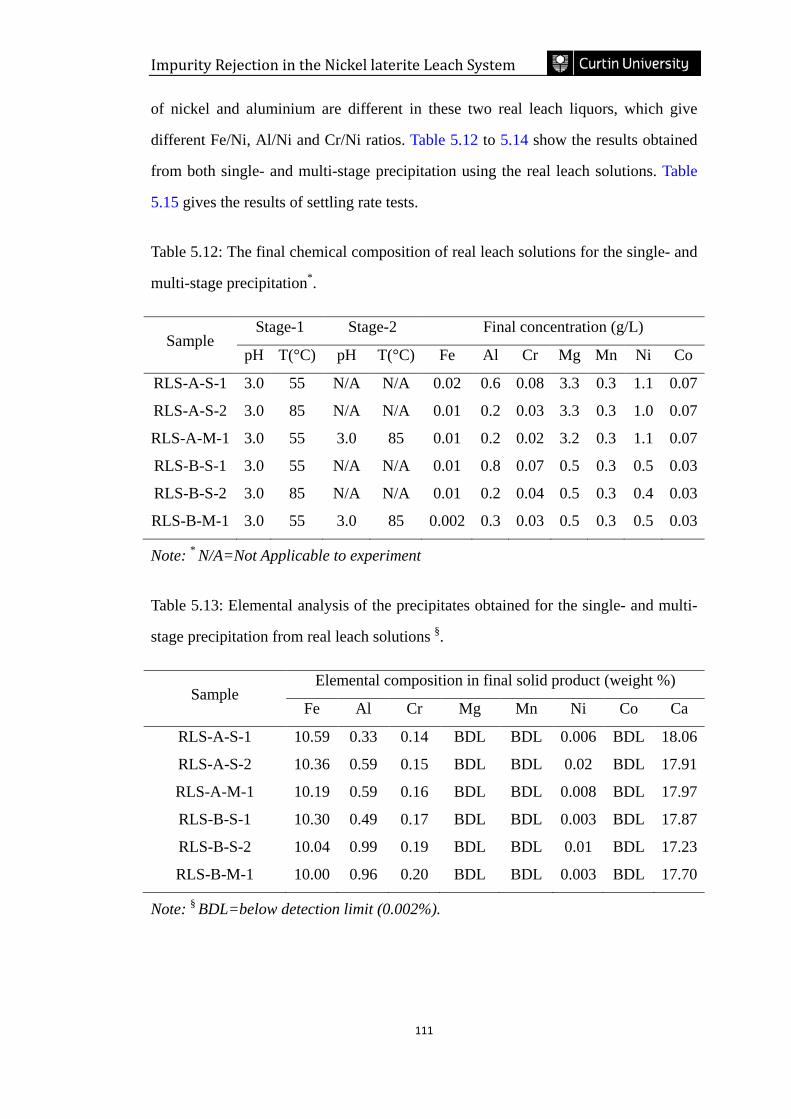
Impurity Rejection in the Nickel laterite Leach System
111
of nickel and aluminium are different in these two real leach liquors, which give
different Fe/Ni, Al/Ni and Cr/Ni ratios. Table 5.12 to 5.14 show the results obtained
from both single- and multi-stage precipitation using the real leach solutions. Table
5.15 gives the results of settling rate tests.
Table 5.12: The final chemical composition of real leach solutions for the single- and
multi-stage precipitation*.
Sample Stage-1 Stage-2 Final concentration (g/L)
pH T(°C) pH T(°C) Fe Al Cr Mg Mn Ni Co
RLS-A-S-1 3.0 55 N/A N/A 0.02 0.6 0.08 3.3 0.3 1.1 0.07
RLS-A-S-2 3.0 85 N/A N/A 0.01 0.2 0.03 3.3 0.3 1.0 0.07
RLS-A-M-1 3.0 55 3.0 85 0.01 0.2 0.02 3.2 0.3 1.1 0.07
RLS-B-S-1 3.0 55 N/A N/A 0.01 0.8 0.07 0.5 0.3 0.5 0.03
RLS-B-S-2 3.0 85 N/A N/A 0.01 0.2 0.04 0.5 0.3 0.4 0.03
RLS-B-M-1 3.0 55 3.0 85 0.002 0.3 0.03 0.5 0.3 0.5 0.03
Note: * N/A=Not Applicable to experiment
Table 5.13: Elemental analysis of the precipitates obtained for the single- and multi-
stage precipitation from real leach solutions §.
Sample Elemental composition in final solid product (weight %)
Fe Al Cr Mg Mn Ni Co Ca
RLS-A-S-1 10.59 0.33 0.14 BDL BDL 0.006 BDL 18.06
RLS-A-S-2 10.36 0.59 0.15 BDL BDL 0.02 BDL 17.91
RLS-A-M-1 10.19 0.59 0.16 BDL BDL 0.008 BDL 17.97
RLS-B-S-1 10.30 0.49 0.17 BDL BDL 0.003 BDL 17.87
RLS-B-S-2 10.04 0.99 0.19 BDL BDL 0.01 BDL 17.23
RLS-B-M-1 10.00 0.96 0.20 BDL BDL 0.003 BDL 17.70
Note: § BDL=below detection limit (0.002%).
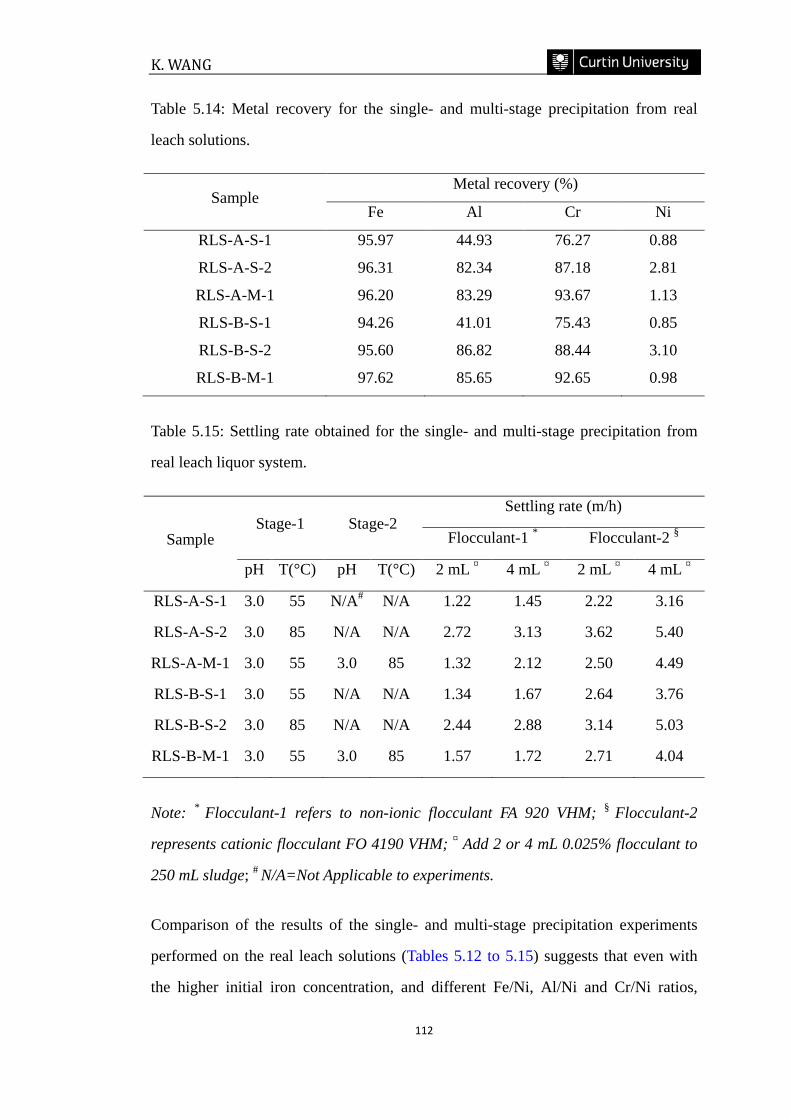
K. WANG
112
Table 5.14: Metal recovery for the single- and multi-stage precipitation from real
leach solutions.
Sample Metal recovery (%)
Fe Al Cr Ni
RLS-A-S-1 95.97 44.93 76.27 0.88
RLS-A-S-2 96.31 82.34 87.18 2.81
RLS-A-M-1 96.20 83.29 93.67 1.13
RLS-B-S-1 94.26 41.01 75.43 0.85
RLS-B-S-2 95.60 86.82 88.44 3.10
RLS-B-M-1 97.62 85.65 92.65 0.98
Table 5.15: Settling rate obtained for the single- and multi-stage precipitation from
real leach liquor system.
Sample Stage-1 Stage-2
Settling rate (m/h)
Flocculant-1 * Flocculant-2 §
pH T(°C) pH T(°C) 2 mL ¤ 4 mL ¤ 2 mL ¤ 4 mL ¤
RLS-A-S-1 3.0 55 N/A# N/A 1.22 1.45 2.22 3.16
RLS-A-S-2 3.0 85 N/A N/A 2.72 3.13 3.62 5.40
RLS-A-M-1 3.0 55 3.0 85 1.32 2.12 2.50 4.49
RLS-B-S-1 3.0 55 N/A N/A 1.34 1.67 2.64 3.76
RLS-B-S-2 3.0 85 N/A N/A 2.44 2.88 3.14 5.03
RLS-B-M-1 3.0 55 3.0 85 1.57 1.72 2.71 4.04
Note: * Flocculant-1 refers to non-ionic flocculant FA 920 VHM; § Flocculant-2
represents cationic flocculant FO 4190 VHM; ¤ Add 2 or 4 mL 0.025% flocculant to
250 mL sludge; # N/A=Not Applicable to experiments.
Comparison of the results of the single- and multi-stage precipitation experiments
performed on the real leach solutions (Tables 5.12 to 5.15) suggests that even with
the higher initial iron concentration, and different Fe/Ni, Al/Ni and Cr/Ni ratios,
Impurity Rejection in the Nickel laterite Leach System
113
satisfactory precipitation recoveries of iron, aluminium and chromium, acceptable
level of nickel loss to the solids, and fast settling rate can still be achieved using a
multi-stage precipitation process. It was also noted that the nickel losses here were
slightly higher than the synthetic system. This may, at least in part be due to the
higher ferric iron concentrations in the initial PLS (higher Fe/Ni ratio), which is in
agreement with the observation in Chapter 4.
The results of multi-stage precipitation on both synthetic and real leach solutions
presented here showed that the loss of nickel to the solids can be reduced by
carefully controlling pH and temperature. Although the experiments conducted in
this study all used the semi-batch precipitation procedures, this provides baseline
laboratory data for industrial application as a fully continuous pilot-plant scale
precipitation process. An example of this would be continuous stirred tank reactors
(CSTR) which can be arranged in parallel or series. The pregnant leach solution can
be processed with different treatments (e.g. pH and temperature) from one reactor to
the next. The slurry produced from the last reactor can be recycled to the first reactor
to act as seeds to increase the precipitation kinetics and improve crystallinity of the
precipitates. In addition, on an industrial scale, the factors such as the reactor
capacity, the consumption of neutralizing agent, and the cost of energy, should also
be taken into account to develop and optimize an effective impurity removal process.
5.4 CONCLUSION
The results obtained within this chapter answer the two questions posed: what are the
effects of iron, aluminium and chromium co-removal upon nickel losses, and how to
develop a precipitation process with desirable precipitation recoveries of impurities,
acceptable level of nickel loss to the solids, and satisfactory sludge property?
Comparison of the results of the precipitation experiments conducted in the
Fe(III)+Ni(II), Fe(III)+Ni(II)+Al(III), and Fe(III)+Ni(II)+Cr(III) systems shows that
K. WANG
114
greater loss of nickel to the solids occurred in the presence of aluminium and
chromium. In a more complicated Fe(III)+Ni(II)+Al(III)+Cr(III) quaternary system,
the presence of aluminium was more significant in impacting the level of nickel loss.
Increasing the concentration of aluminium in the initial pregnant leach solution
resulted in more nickel loss. However, the presence of chromium and the interactions
between aluminium and chromium statistically had little influence on nickel loss.
This suggests that when a precipitation reaction occurs in a mixed sulphate solution
containing iron, aluminium, chromium and nickel ions, the loss of nickel is mainly
associated with iron and aluminium co-precipitation.
Further experiments performed in the Fe(III)+Ni(II)+Al(III)+Cr(III) quaternary
system showed that 84% iron can be easily removed by simply raising the pH to 3 at
25 ºC, but the precipitation recoveries of aluminium and chromium were quite low at
17% and 57%, respectively. Increasing temperature favours the precipitation of
aluminium and chromium. About 82% aluminium and 85% chromium can be
removed from solution at pH 3 and 85 ºC, however, the loss of nickel to the solid was
substantial at about 4%. By carefully controlling pH and temperature in multi-stage
precipitation processes, the iron, aluminium and chromium can be effectively
rejected with a minimal level of nickel loss and desirable sludge properties. The
optimum conditions for a multi-stage precipitation process were found to be at pH 3
and 55 ºC in the first stage followed by a second stage operated at pH 3 and 85 ºC.
Using this multi-stage precipitation procedure, as much as 95% iron and chromium
together with above 80% aluminium can be removed, the level of nickel loss to the
solid can be reduced to below 1%. The precipitate sludge showed a fast settling rate
of 5.05 m/h with the addition of a cationic flocculant. Similar satisfactory results
were also obtained when performing this multi-stage precipitation procedure on real
leach solutions. The multi-stage precipitation process reported in this chapter has
potential industrial application. It can be easily performed in continuous reactors
which are arranged in parallel or series having varied pH and temperature control.
Impurity Rejection in the Nickel laterite Leach System
115
CHAPTER 6
THE EFFECT OF WATER SALINITY ON IRON, ALUMINIUM
AND CHROMIUM CO-REMOVAL AND ASSOCIATED
NICKEL LOSSES
6.1 INTRODUCTION
As outlined in Chapter 1, the majority of the world’s nickel resources are present in
lateritic deposits. In a nickel laterite profile, nickel and cobalt are hosted by limonite,
asbolite, and nontronite ores which are amenable to hydrometallurgical processing
methods such as acid leaching (Dalvi et al., 2004). The nature of hydrometallurgical
processes involves the extraction of metals into aqueous solution. However, nickel-
rich laterite ores are not often located in areas where large quantities of good quality
fresh water are available. For example, in the arid regions of Australia, only
hypersaline underground water may be available in significant amounts, and in
Indonesia and the Philippines where laterite deposits occur on small islands, only
large quantities of seawater are available (Liu, 2006). Thus, the water used for
processing these laterites with sulphuric acid has often been saline, ranging from low
to very high concentration of total dissolved salts (TDS). TDS is normally related to
sodium chloride content, but also other salts such as magnesium chloride or
potassium chloride and related sulphates can occur in small concentrations.
According to the United States Geological Survey (2005), saline water can be
classified into three categories: slightly saline water (1 to 3 g/L TDS), moderately
saline water (3 to 10 g/L TDS), and highly saline water (10 to 35 g/L TDS). Seawater
has a salinity of about 35 g/L. Hypersaline water refers to water having a greater
salinity than seawater.
Since the late 1990s, a considerable amount of research has been undertaken
K. WANG
116
investigating the hydrometallurgical processing of Western Australia laterites using
saline and/or hypersaline waters. Johnson et al. (2002) provided a systematic study
of the effect of process water salinity on leaching kinetics and acid consumption
during high pressure acid leaching of Cawse ores. The ore was leached at 250 ºC
with sulphuric acid in process water ranging from tap water (<1 g/L Na) to
concentrated hypersaline groundwater (~60 g/L Na). Acid consumption was found to
increase as the salinity of the process water increased. The extraction of nickel was
dependent on salinity with 95% extracted using tap water and 96% when seawater
(11 g/L Na) was used. However, extraction dropped to 91% in higher saline water.
The Bulong Nickel Operation located in the arid region of Western Australia was a
unique plant that processed clay-rich laterite ores (a significant amount of nontronite
clay and goethite with some maghemite and serpentine) using hypersaline waters.
Whittington et al. (2003a) examined the effect of water salinity on the reactions
occurring during the pressure acid leaching of Bulong laterite ores. Particular
emphasis was placed on the effect of the water salinity on the process chemistry and
residue mineralogy. The results showed that water salinity significantly affected the
leaching (e.g. acid consumption and metal extraction). Leaching in hypersaline water
resulted in the formation of amorphous silica with sodium jarosite and hematite,
whereas leaching in less saline water favoured the formation of amorphous silica and
hematite, with lesser amounts of sodium/hydronium alunite/jarosites.
Attention has also been focused on using saline water to treat laterite ores during
atmospheric leaching. The use of sea water for heap leaching of nickeliferous oxide
ores was first introduced by Agatzini-Leonardou and Dimaki in 2000 (Agatzini-
Leonardou and Dimaki, 2000). The nickel and/or cobalt were extracted from ores by
heap leaching with a dilute sulphuric acid solution prepared from sea water at
ambient temperature. Another patent application by BHP Billiton reported a process
for heap leaching of nickeliferous oxidic ores using a hypersaline water sulphuric
acid lixiviant (Liu, 2006). The preferred concentration of TDS for the hypersaline
water in this process is from 40 to 200 g/L, and most preferably from 50 to 150 g/L.
Impurity Rejection in the Nickel laterite Leach System
117
The laboratory data obtained from the column leaching of arid-region Australia ores
(10 kg of agglomerated ores were fed into eight columns with 100 mm diameter and
1.86 m height to simulate heap leaching conditions) showed improved nickel
recovery was achieved when hypersaline water was used together with sulphuric
acid. Similar good results were obtained when using hypersaline water and
hydrochloric acid as lixiviant. A recent patent, application also assigned to BHP
Billiton, described an atmospheric leaching process for the recovery of nickel and
cobalt from laterite ores using hypersaline water (Liu and Reynolds, 2011). These
atmospheric sulphuric agitation leach tests were performed on laterite ores from
Ravensthorpe Nickel Operations in Western Australia. The ores were separated into
high-iron and low-magnesium (>25 wt% Fe and 0.5-6 wt% Mg) and low-iron and
high-magnesium (5-20 wt% Fe and >8 wt% Mg) fractions. Each fraction was
separately slurried with hypersaline water having a preferable TDS concentration
ranging from 50 to 150 g/L. The limonite slurry was first leached at a temperature
between 95 to 105 ºC using sulphuric acid. The free acid remaining was neutralized
using the saprolite fraction of the ore in the second leach stage, during which iron
was also precipitated as jarosite. The results obtained showed that the overall nickel
and cobalt extractions were greater than 87% and 88%, respectively.
Hypersaline water provides large amounts of monovalent cations (e.g. Na+ and K+)
and chloride ions. In the presence of the monovalent ions, the formation of jarosite-
type compounds (MFe3(OH)6(SO4)2, where M refers to Na+, K+, NH4+, Ag+ or
H3O+, etc.) is favoured at lower pH value (<pH 2) and elevated temperature (>80 ºC)
(Dutrizac and Jambor, 2000). If the jarosite-type compounds are the preferable
phases of iron precipitates obtained from a laterite leach solution with high salinity, it
is critical that the solid precipitation products do not contain significant amounts of
nickel and cobalt. In this regard, the laboratory investigation on the behavior of
nickel and cobalt during jarosite precipitation by Dutrizac and Chen (2004) showed
that minor amounts of nickel and cobalt are structurally incorporated into sodium
jarosite, potassium jarosite and ammonium jarosite. The extent of incorporation
K. WANG
118
increases as the concentration of dissolved nickel and cobalt increases.
Previous chapters studied the relationships between impurity removal and associated
nickel losses in sulphate leaching systems. This chapter provides an experimental
investigation on the impurity removal from synthetic sulphate leach solutions with
the presence of various amounts of salts (as sodium chloride). Aims of this chapter
were to study the effect of water salinity on 1) impurity removal efficiency and
associated nickel losses; 2) the mineralogy changes of the precipitates. The latter was
based on X-Ray Diffraction (XRD) data only, which was similar to the mineralogical
study section in Chapter 4. More detailed mineralogical characterization involving an
acid dissolution technique, Difference X-Ray Diffraction (DXRD), microscopic
analysis and Fourier Transform Infra-Red (FTIR) spectroscopy is discussed in
Chapter 7.
6.2 EXPERIMENTAL
All the precipitation experiments conducted in this chapter used a single-stage
precipitation process which was similar to the semi-batch precipitation procedure
used in Chapters 4 and 5. The synthetic pregnant leach solutions were prepared by
dissolving Fe2(SO4)3∙xH2O, NiSO4∙6H2O, Al2(SO4)3∙18H2O and Cr2(SO4)3∙xH2O
to give a concentration of 30 g/L Fe3+, 5 g/L Ni2+, 6.0 g/L Al3+, and 2 g/L Cr3+. A
specific amount of sodium chloride was added to provide the required solution TDS.
For each experiment, a volume of 500 mL of synthetic leach solutions was pumped
into a baffled reaction vessel containing a pre-determined amount of de-ionized
water over a period of 2.5 hours. A CaCO3 (25% w/w) suspension in de-ionized
water was simultaneously pumped into the reaction vessel to reach the target pH
values. The temperature was controlled using an oil bath. At the completion of the
reaction, the resulting slurry was vacuum filtered through a 0.45 µm Gelman Supor®
membrane. The metal concentrations in the filtrate were analysed by ICP-OES, and
the filter cake was carefully washed with large amounts of de-ionized water then
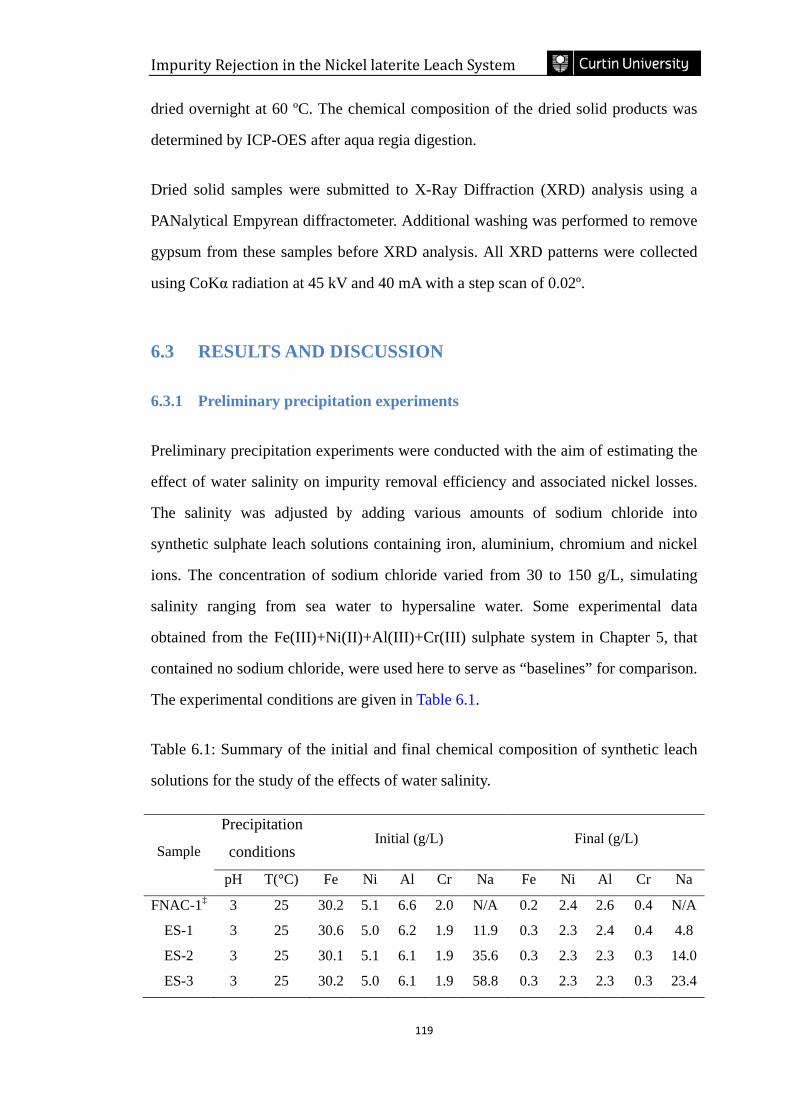
Impurity Rejection in the Nickel laterite Leach System
119
dried overnight at 60 ºC. The chemical composition of the dried solid products was
determined by ICP-OES after aqua regia digestion.
Dried solid samples were submitted to X-Ray Diffraction (XRD) analysis using a
PANalytical Empyrean diffractometer. Additional washing was performed to remove
gypsum from these samples before XRD analysis. All XRD patterns were collected
using CoKα radiation at 45 kV and 40 mA with a step scan of 0.02º.
6.3 RESULTS AND DISCUSSION
6.3.1 Preliminary precipitation experiments
Preliminary precipitation experiments were conducted with the aim of estimating the
effect of water salinity on impurity removal efficiency and associated nickel losses.
The salinity was adjusted by adding various amounts of sodium chloride into
synthetic sulphate leach solutions containing iron, aluminium, chromium and nickel
ions. The concentration of sodium chloride varied from 30 to 150 g/L, simulating
salinity ranging from sea water to hypersaline water. Some experimental data
obtained from the Fe(III)+Ni(II)+Al(III)+Cr(III) sulphate system in Chapter 5, that
contained no sodium chloride, were used here to serve as “baselines” for comparison.
The experimental conditions are given in Table 6.1.
Table 6.1: Summary of the initial and final chemical composition of synthetic leach
solutions for the study of the effects of water salinity.
Sample
Precipitation
conditions Initial (g/L) Final (g/L)
pH T(°C) Fe Ni Al Cr Na Fe Ni Al Cr Na
FNAC-1‡ 3 25 30.2 5.1 6.6 2.0 N/A 0.2 2.4 2.6 0.4 N/A
ES-1 3 25 30.6 5.0 6.2 1.9 11.9 0.3 2.3 2.4 0.4 4.8
ES-2 3 25 30.1 5.1 6.1 1.9 35.6 0.3 2.3 2.3 0.3 14.0
ES-3 3 25 30.2 5.0 6.1 1.9 58.8 0.3 2.3 2.3 0.3 23.4
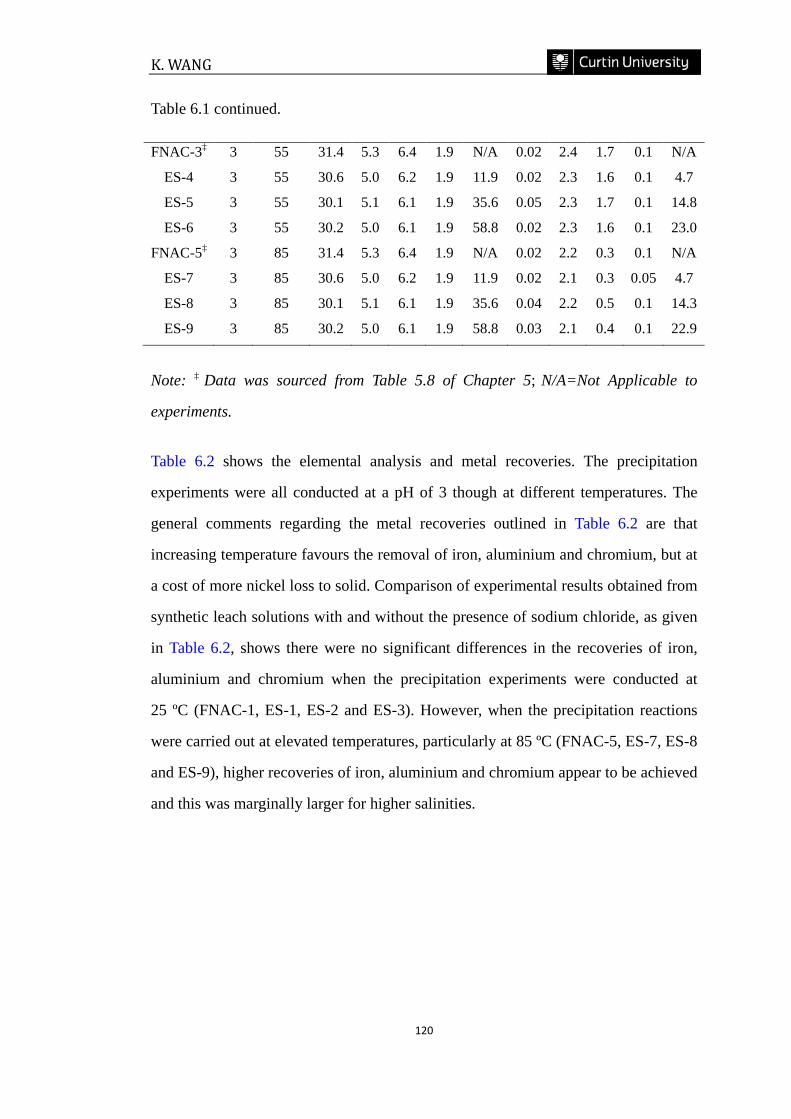
K. WANG
120
Table 6.1 continued.
FNAC-3‡ 3 55 31.4 5.3 6.4 1.9 N/A 0.02 2.4 1.7 0.1 N/A
ES-4 3 55 30.6 5.0 6.2 1.9 11.9 0.02 2.3 1.6 0.1 4.7
ES-5 3 55 30.1 5.1 6.1 1.9 35.6 0.05 2.3 1.7 0.1 14.8
ES-6 3 55 30.2 5.0 6.1 1.9 58.8 0.02 2.3 1.6 0.1 23.0
FNAC-5‡ 3 85 31.4 5.3 6.4 1.9 N/A 0.02 2.2 0.3 0.1 N/A
ES-7 3 85 30.6 5.0 6.2 1.9 11.9 0.02 2.1 0.3 0.05 4.7
ES-8 3 85 30.1 5.1 6.1 1.9 35.6 0.04 2.2 0.5 0.1 14.3
ES-9 3 85 30.2 5.0 6.1 1.9 58.8 0.03 2.1 0.4 0.1 22.9
Note: ‡ Data was sourced from Table 5.8 of Chapter 5; N/A=Not Applicable to
experiments.
Table 6.2 shows the elemental analysis and metal recoveries. The precipitation
experiments were all conducted at a pH of 3 though at different temperatures. The
general comments regarding the metal recoveries outlined in Table 6.2 are that
increasing temperature favours the removal of iron, aluminium and chromium, but at
a cost of more nickel loss to solid. Comparison of experimental results obtained from
synthetic leach solutions with and without the presence of sodium chloride, as given
in Table 6.2, shows there were no significant differences in the recoveries of iron,
aluminium and chromium when the precipitation experiments were conducted at
25 ºC (FNAC-1, ES-1, ES-2 and ES-3). However, when the precipitation reactions
were carried out at elevated temperatures, particularly at 85 ºC (FNAC-5, ES-7, ES-8
and ES-9), higher recoveries of iron, aluminium and chromium appear to be achieved
and this was marginally larger for higher salinities.
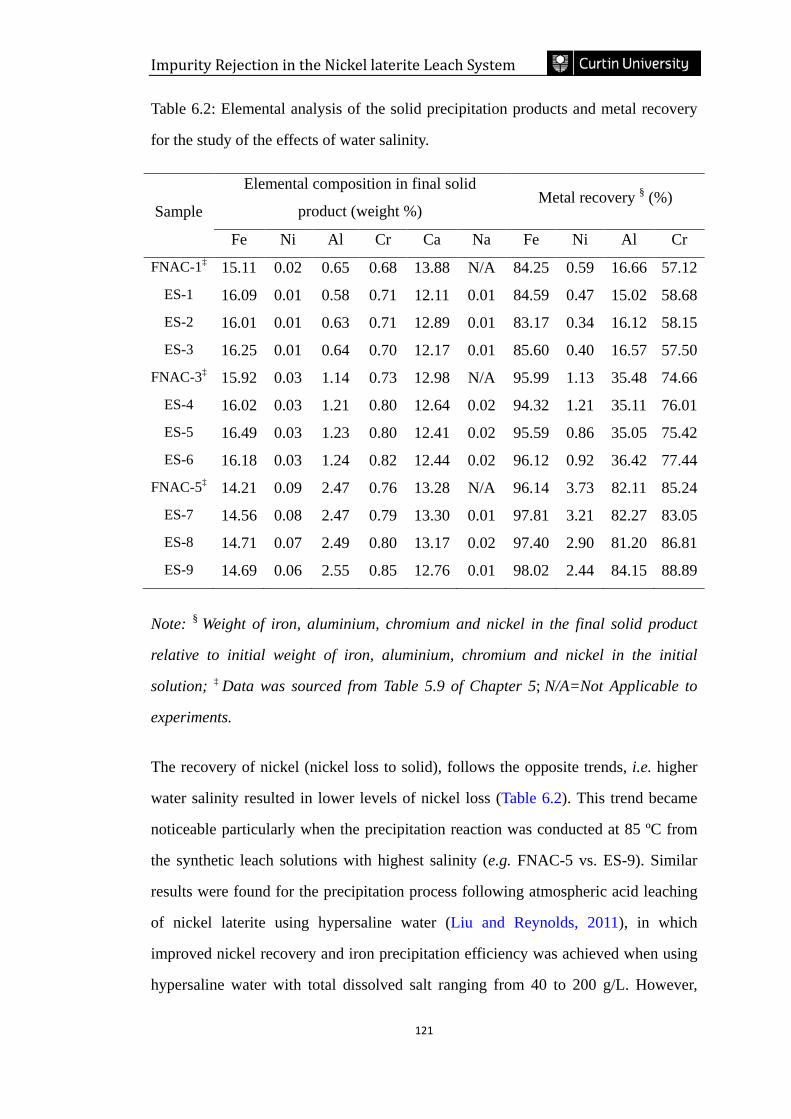
Impurity Rejection in the Nickel laterite Leach System
121
Table 6.2: Elemental analysis of the solid precipitation products and metal recovery
for the study of the effects of water salinity.
Sample
Elemental composition in final solid
product (weight %) Metal recovery § (%)
Fe Ni Al Cr Ca Na Fe Ni Al Cr
FNAC-1‡ 15.11 0.02 0.65 0.68 13.88 N/A 84.25 0.59 16.66 57.12
ES-1 16.09 0.01 0.58 0.71 12.11 0.01 84.59 0.47 15.02 58.68
ES-2 16.01 0.01 0.63 0.71 12.89 0.01 83.17 0.34 16.12 58.15
ES-3 16.25 0.01 0.64 0.70 12.17 0.01 85.60 0.40 16.57 57.50
FNAC-3‡ 15.92 0.03 1.14 0.73 12.98 N/A 95.99 1.13 35.48 74.66
ES-4 16.02 0.03 1.21 0.80 12.64 0.02 94.32 1.21 35.11 76.01
ES-5 16.49 0.03 1.23 0.80 12.41 0.02 95.59 0.86 35.05 75.42
ES-6 16.18 0.03 1.24 0.82 12.44 0.02 96.12 0.92 36.42 77.44
FNAC-5‡ 14.21 0.09 2.47 0.76 13.28 N/A 96.14 3.73 82.11 85.24
ES-7 14.56 0.08 2.47 0.79 13.30 0.01 97.81 3.21 82.27 83.05
ES-8 14.71 0.07 2.49 0.80 13.17 0.02 97.40 2.90 81.20 86.81
ES-9 14.69 0.06 2.55 0.85 12.76 0.01 98.02 2.44 84.15 88.89
Note: § Weight of iron, aluminium, chromium and nickel in the final solid product
relative to initial weight of iron, aluminium, chromium and nickel in the initial
solution; ‡ Data was sourced from Table 5.9 of Chapter 5; N/A=Not Applicable to
experiments.
The recovery of nickel (nickel loss to solid), follows the opposite trends, i.e. higher
water salinity resulted in lower levels of nickel loss (Table 6.2). This trend became
noticeable particularly when the precipitation reaction was conducted at 85 ºC from
the synthetic leach solutions with highest salinity (e.g. FNAC-5 vs. ES-9). Similar
results were found for the precipitation process following atmospheric acid leaching
of nickel laterite using hypersaline water (Liu and Reynolds, 2011), in which
improved nickel recovery and iron precipitation efficiency was achieved when using
hypersaline water with total dissolved salt ranging from 40 to 200 g/L. However,
K. WANG
122
some exceptions were also noted for the pairs of experiments labelled as ES-2 and
ES-3, FNAC-3 and ES-4. Slightly higher levels of nickel losses were recorded when
the precipitation reactions were conducted from the solutions with the presence of
more sodium chloride. In order to gain a better understanding of the effect of water
salinity, further investigation is necessary to be performed in wider pH ranges.
6.3.2 Statistically-designed experiments
A three factor Box-Behnken Design (BBD) combined with a Response Surface
Methodology (RSM) was employed to estimate the effect of water salinity on nickel
losses for wider pH ranges. This experimental strategy was successfully applied to
study the effect of iron precipitation on nickel losses in Chapter 4. Details of this
design and modelling approach are given in Chapter 4 and Appendix B.
Fifteen experiments were carried out using synthetic leach solutions which were
prepared by dissolving Fe2(SO4)3·xH2O, NiSO4·6H2O, Al2(SO4)3·18H2O and
Cr2(SO4)3·xH2O to give a chemical composition of 30 g/L Fe3+, 5 g/L Ni2+, 6 g/L
Al3+ and 2 g/L Cr3+. These synthetic leach solutions have similar Fe/Ni, Al/Ni and
Cr/Ni ratios. The salinity was adjusted by adding various amounts of sodium
chloride. The factors investigated were pH, temperature and the initial concentration
of sodium chloride. All factors were evaluated at three levels represented in coded
form as −, 0 and +, corresponding to the low, medium, and high values, respectively,
as shown in Table 6.3. The experimental design matrix is given in Table 6.4 and the
initial and final chemical composition of synthetic leach solutions for each
experiment in Table 6.5.
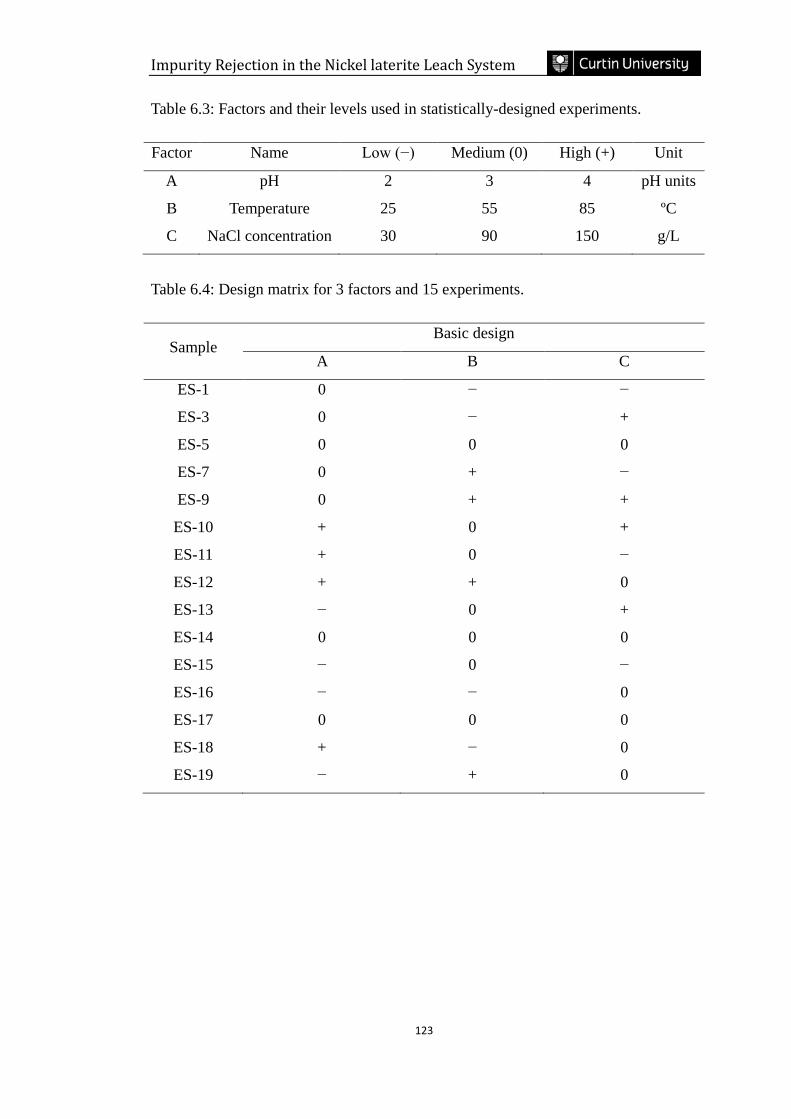
Impurity Rejection in the Nickel laterite Leach System
123
Table 6.3: Factors and their levels used in statistically-designed experiments.
Factor Name Low (−) Medium (0) High (+) Unit
A pH 2 3 4 pH units
B Temperature 25 55 85 ºC
C NaCl concentration 30 90 150 g/L
Table 6.4: Design matrix for 3 factors and 15 experiments.
Sample Basic design
A B C
ES-1 0 − −
ES-3 0 − +
ES-5 0 0 0
ES-7 0 + −
ES-9 0 + +
ES-10 + 0 +
ES-11 + 0 −
ES-12 + + 0
ES-13 − 0 +
ES-14 0 0 0
ES-15 − 0 −
ES-16 − − 0
ES-17 0 0 0
ES-18 + − 0
ES-19 − + 0
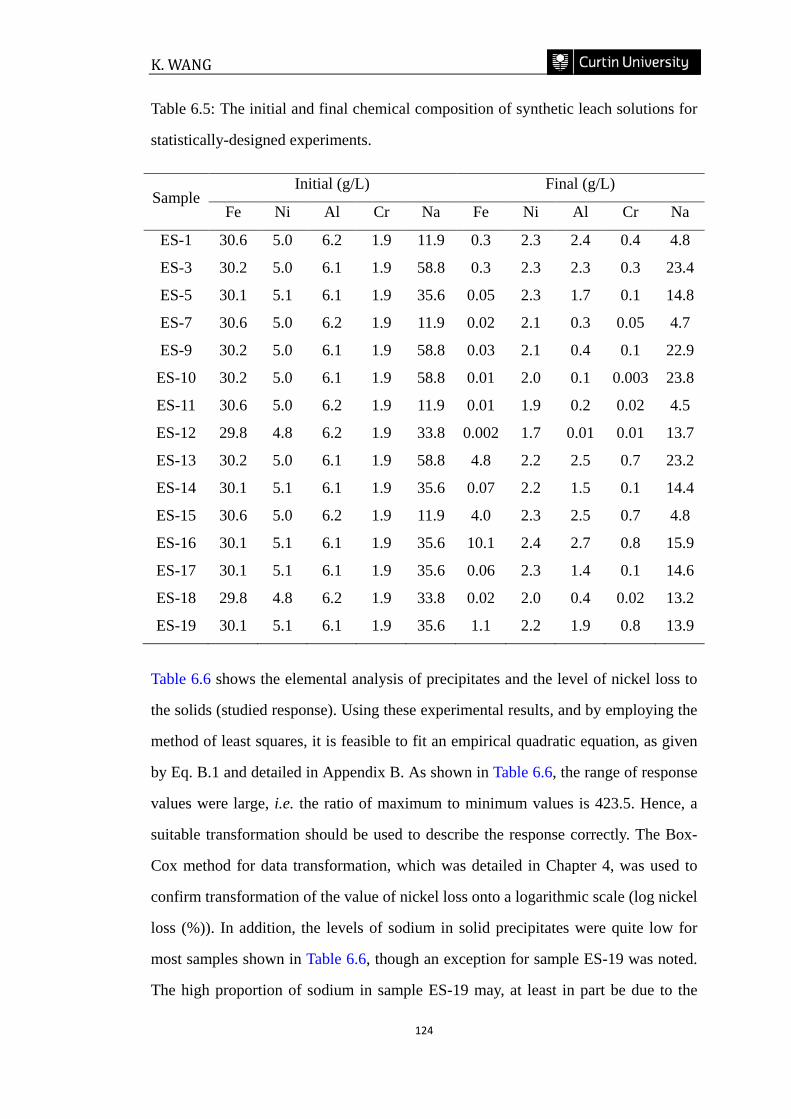
K. WANG
124
Table 6.5: The initial and final chemical composition of synthetic leach solutions for
statistically-designed experiments.
Sample Initial (g/L) Final (g/L)
Fe Ni Al Cr Na Fe Ni Al Cr Na
ES-1 30.6 5.0 6.2 1.9 11.9 0.3 2.3 2.4 0.4 4.8
ES-3 30.2 5.0 6.1 1.9 58.8 0.3 2.3 2.3 0.3 23.4
ES-5 30.1 5.1 6.1 1.9 35.6 0.05 2.3 1.7 0.1 14.8
ES-7 30.6 5.0 6.2 1.9 11.9 0.02 2.1 0.3 0.05 4.7
ES-9 30.2 5.0 6.1 1.9 58.8 0.03 2.1 0.4 0.1 22.9
ES-10 30.2 5.0 6.1 1.9 58.8 0.01 2.0 0.1 0.003 23.8
ES-11 30.6 5.0 6.2 1.9 11.9 0.01 1.9 0.2 0.02 4.5
ES-12 29.8 4.8 6.2 1.9 33.8 0.002 1.7 0.01 0.01 13.7
ES-13 30.2 5.0 6.1 1.9 58.8 4.8 2.2 2.5 0.7 23.2
ES-14 30.1 5.1 6.1 1.9 35.6 0.07 2.2 1.5 0.1 14.4
ES-15 30.6 5.0 6.2 1.9 11.9 4.0 2.3 2.5 0.7 4.8
ES-16 30.1 5.1 6.1 1.9 35.6 10.1 2.4 2.7 0.8 15.9
ES-17 30.1 5.1 6.1 1.9 35.6 0.06 2.3 1.4 0.1 14.6
ES-18 29.8 4.8 6.2 1.9 33.8 0.02 2.0 0.4 0.02 13.2
ES-19 30.1 5.1 6.1 1.9 35.6 1.1 2.2 1.9 0.8 13.9
Table 6.6 shows the elemental analysis of precipitates and the level of nickel loss to
the solids (studied response). Using these experimental results, and by employing the
method of least squares, it is feasible to fit an empirical quadratic equation, as given
by Eq. B.1 and detailed in Appendix B. As shown in Table 6.6, the range of response
values were large, i.e. the ratio of maximum to minimum values is 423.5. Hence, a
suitable transformation should be used to describe the response correctly. The Box-
Cox method for data transformation, which was detailed in Chapter 4, was used to
confirm transformation of the value of nickel loss onto a logarithmic scale (log nickel
loss (%)). In addition, the levels of sodium in solid precipitates were quite low for
most samples shown in Table 6.6, though an exception for sample ES-19 was noted.
The high proportion of sodium in sample ES-19 may, at least in part be due to the
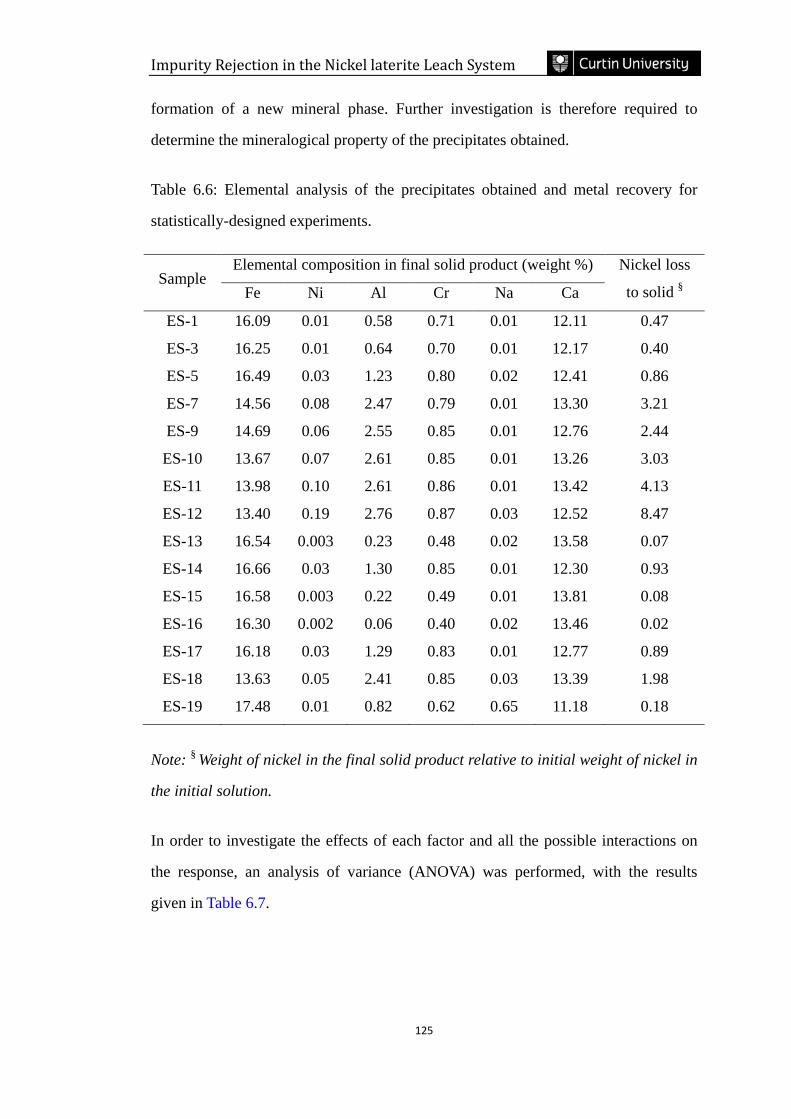
Impurity Rejection in the Nickel laterite Leach System
125
formation of a new mineral phase. Further investigation is therefore required to
determine the mineralogical property of the precipitates obtained.
Table 6.6: Elemental analysis of the precipitates obtained and metal recovery for
statistically-designed experiments.
Sample Elemental composition in final solid product (weight %) Nickel loss
to solid § Fe Ni Al Cr Na Ca
ES-1 16.09 0.01 0.58 0.71 0.01 12.11 0.47
ES-3 16.25 0.01 0.64 0.70 0.01 12.17 0.40
ES-5 16.49 0.03 1.23 0.80 0.02 12.41 0.86
ES-7 14.56 0.08 2.47 0.79 0.01 13.30 3.21
ES-9 14.69 0.06 2.55 0.85 0.01 12.76 2.44
ES-10 13.67 0.07 2.61 0.85 0.01 13.26 3.03
ES-11 13.98 0.10 2.61 0.86 0.01 13.42 4.13
ES-12 13.40 0.19 2.76 0.87 0.03 12.52 8.47
ES-13 16.54 0.003 0.23 0.48 0.02 13.58 0.07
ES-14 16.66 0.03 1.30 0.85 0.01 12.30 0.93
ES-15 16.58 0.003 0.22 0.49 0.01 13.81 0.08
ES-16 16.30 0.002 0.06 0.40 0.02 13.46 0.02
ES-17 16.18 0.03 1.29 0.83 0.01 12.77 0.89
ES-18 13.63 0.05 2.41 0.85 0.03 13.39 1.98
ES-19 17.48 0.01 0.82 0.62 0.65 11.18 0.18
Note: § Weight of nickel in the final solid product relative to initial weight of nickel in
the initial solution.
In order to investigate the effects of each factor and all the possible interactions on
the response, an analysis of variance (ANOVA) was performed, with the results
given in Table 6.7.
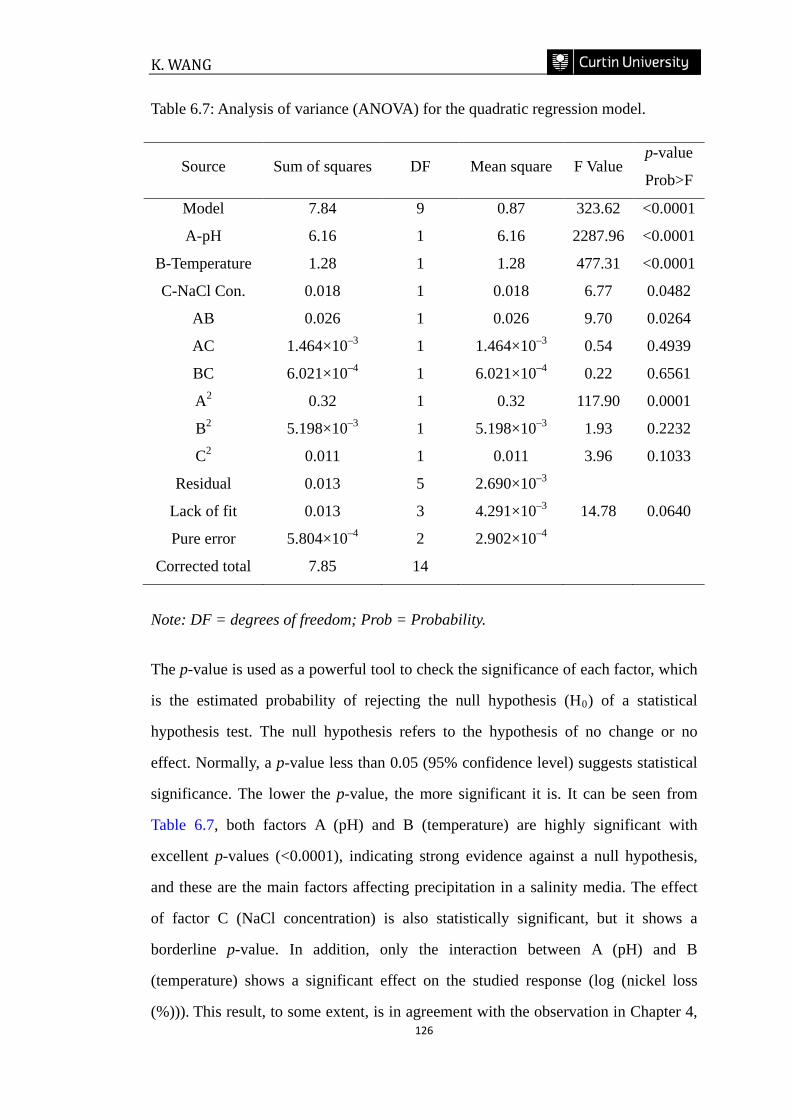
K. WANG
126
Table 6.7: Analysis of variance (ANOVA) for the quadratic regression model.
Source Sum of squares DF Mean square F Value p-value
Prob>F
Model 7.84 9 0.87 323.62 <0.0001
A-pH 6.16 1 6.16 2287.96 <0.0001
B-Temperature 1.28 1 1.28 477.31 <0.0001
C-NaCl Con. 0.018 1 0.018 6.77 0.0482
AB 0.026 1 0.026 9.70 0.0264
AC 1.464×10⁻³ 1 1.464×10⁻³ 0.54 0.4939
BC 6.021×10⁻⁴ 1 6.021×10⁻⁴ 0.22 0.6561
A2 0.32 1 0.32 117.90 0.0001
B2 5.198×10⁻³ 1 5.198×10⁻³ 1.93 0.2232
C2 0.011 1 0.011 3.96 0.1033
Residual 0.013 5 2.690×10⁻³
Lack of fit 0.013 3 4.291×10⁻³ 14.78 0.0640
Pure error 5.804×10⁻⁴ 2 2.902×10⁻⁴
Corrected total 7.85 14
Note: DF = degrees of freedom; Prob = Probability.
The p-value is used as a powerful tool to check the significance of each factor, which
is the estimated probability of rejecting the null hypothesis (H0) of a statistical
hypothesis test. The null hypothesis refers to the hypothesis of no change or no
effect. Normally, a p-value less than 0.05 (95% confidence level) suggests statistical
significance. The lower the p-value, the more significant it is. It can be seen from
Table 6.7, both factors A (pH) and B (temperature) are highly significant with
excellent p-values (<0.0001), indicating strong evidence against a null hypothesis,
and these are the main factors affecting precipitation in a salinity media. The effect
of factor C (NaCl concentration) is also statistically significant, but it shows a
borderline p-value. In addition, only the interaction between A (pH) and B
(temperature) shows a significant effect on the studied response (log (nickel loss
(%))). This result, to some extent, is in agreement with the observation in Chapter 4,
Impurity Rejection in the Nickel laterite Leach System
127
where the interaction between pH and temperature had a significant effect on log
(nickel loss (%)) during iron precipitation from synthetic sulphate leach solutions
containing just iron and nickel ions. The quadratic term for factor A also has a
significant effect. Hence, an adequate quadratic model can be fitted for the log
(nickel loss (%)) with only consideration of all significant terms (p-values <0.05),
given by:
23
4
(%)) loss log(nickel
pH0.3eTemperaturpH102.69 ionConcentrat NaCl107.95
eTemperatur0.02pH2.826.43Y
×−×××−
××−
×+×+−=
−
−
Eq. 6.1
Where NaCl concentration is in g/L and temperature is degree Celsius.
In order to visualize the relationship between response and factors that describe the
fitted quadratic model (Eq. 6.1), 3D response surface graphs and corresponding 2D
contour plots were constructed, and are shown in Figure 6.1. These graphs show the
combined effect of the interaction between pH and temperature on nickel loss for
various NaCl concentrations. Notably, these graphs were similar in shape. The effect
of NaCl concentration on nickel loss was not apparent. This is consistent with the
conclusion obtained by analysis of variance (Table 6.7). Closer inspection of the
response surface graphs shows that a slight reduction of nickel loss occurred with
increasing NaCl concentration when precipitation was conducted at pH 4 and 85°C.
For example, the maximum percentage of nickel loss was about 8.5% when the
initial leach solution contained 30 g/L NaCl (Figure 6.1 (a)), however, this value
dropped to about 7.3% during precipitation from solution containing 150 g/L NaCl
(Figure 6.1 (c)).
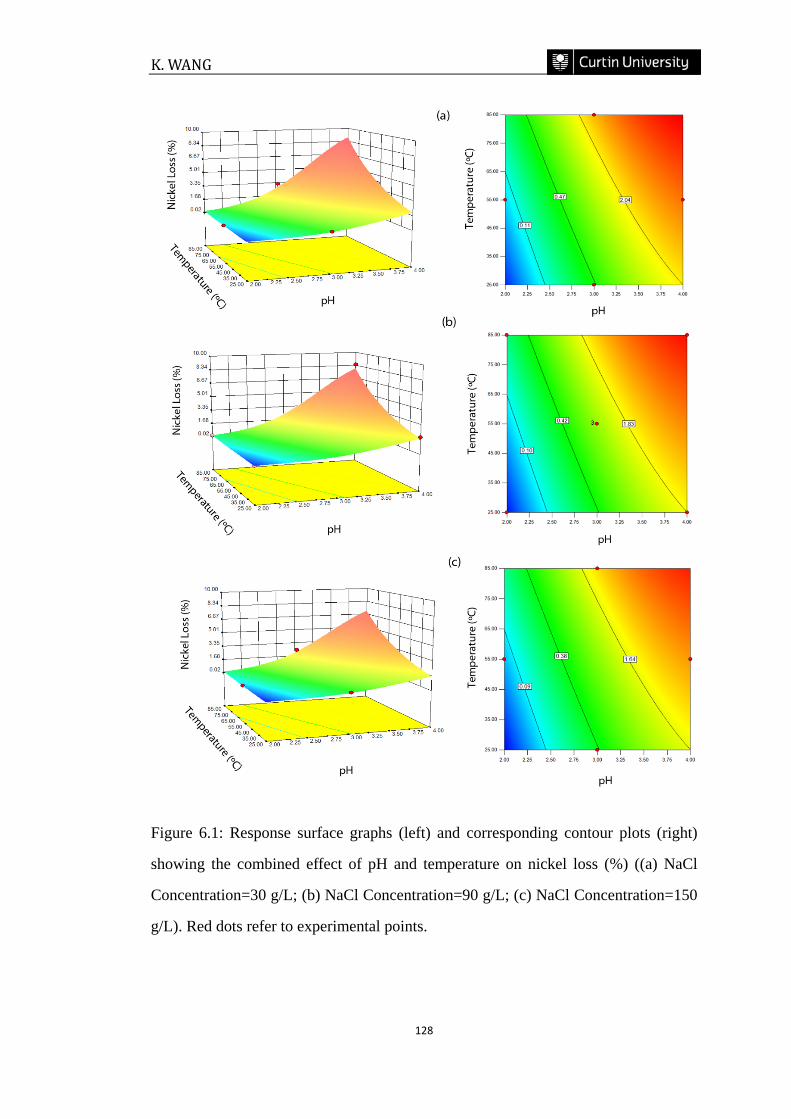
K. WANG
128
Figure 6.1: Response surface graphs (left) and corresponding contour plots (right)
showing the combined effect of pH and temperature on nickel loss (%) ((a) NaCl
Concentration=30 g/L; (b) NaCl Concentration=90 g/L; (c) NaCl Concentration=150
g/L). Red dots refer to experimental points.
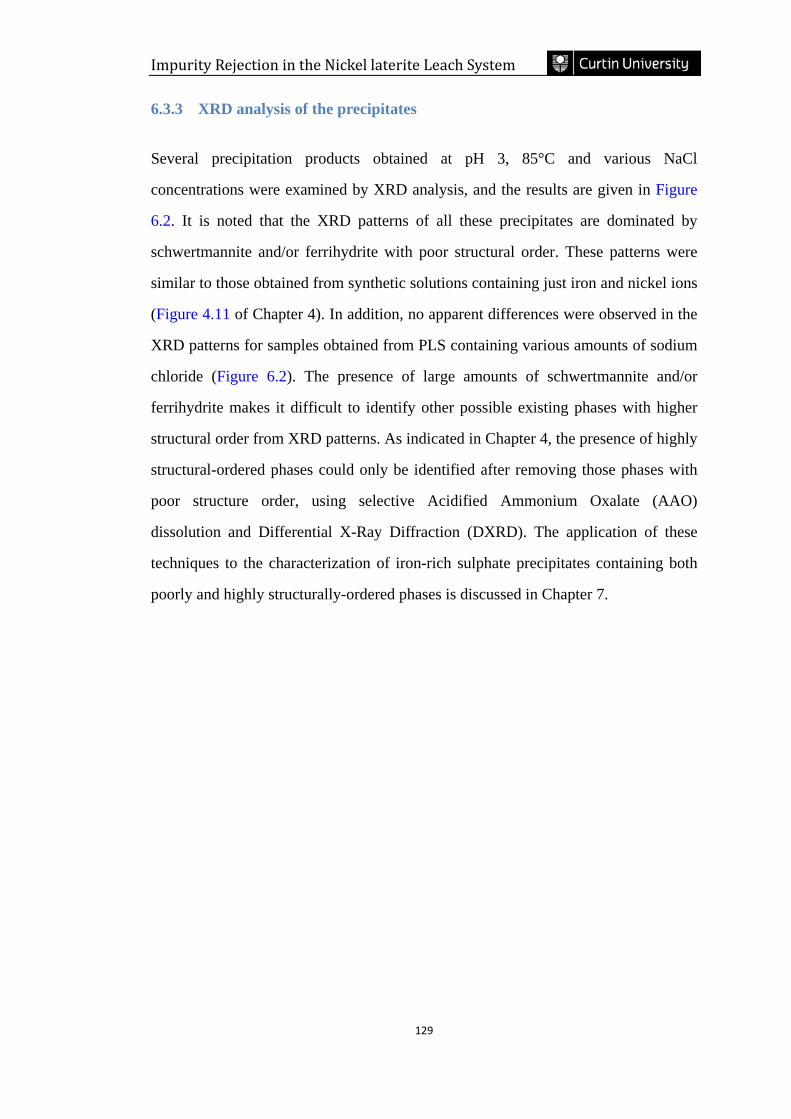
Impurity Rejection in the Nickel laterite Leach System
129
6.3.3 XRD analysis of the precipitates
Several precipitation products obtained at pH 3, 85°C and various NaCl
concentrations were examined by XRD analysis, and the results are given in Figure
6.2. It is noted that the XRD patterns of all these precipitates are dominated by
schwertmannite and/or ferrihydrite with poor structural order. These patterns were
similar to those obtained from synthetic solutions containing just iron and nickel ions
(Figure 4.11 of Chapter 4). In addition, no apparent differences were observed in the
XRD patterns for samples obtained from PLS containing various amounts of sodium
chloride (Figure 6.2). The presence of large amounts of schwertmannite and/or
ferrihydrite makes it difficult to identify other possible existing phases with higher
structural order from XRD patterns. As indicated in Chapter 4, the presence of highly
structural-ordered phases could only be identified after removing those phases with
poor structure order, using selective Acidified Ammonium Oxalate (AAO)
dissolution and Differential X-Ray Diffraction (DXRD). The application of these
techniques to the characterization of iron-rich sulphate precipitates containing both
poorly and highly structurally-ordered phases is discussed in Chapter 7.
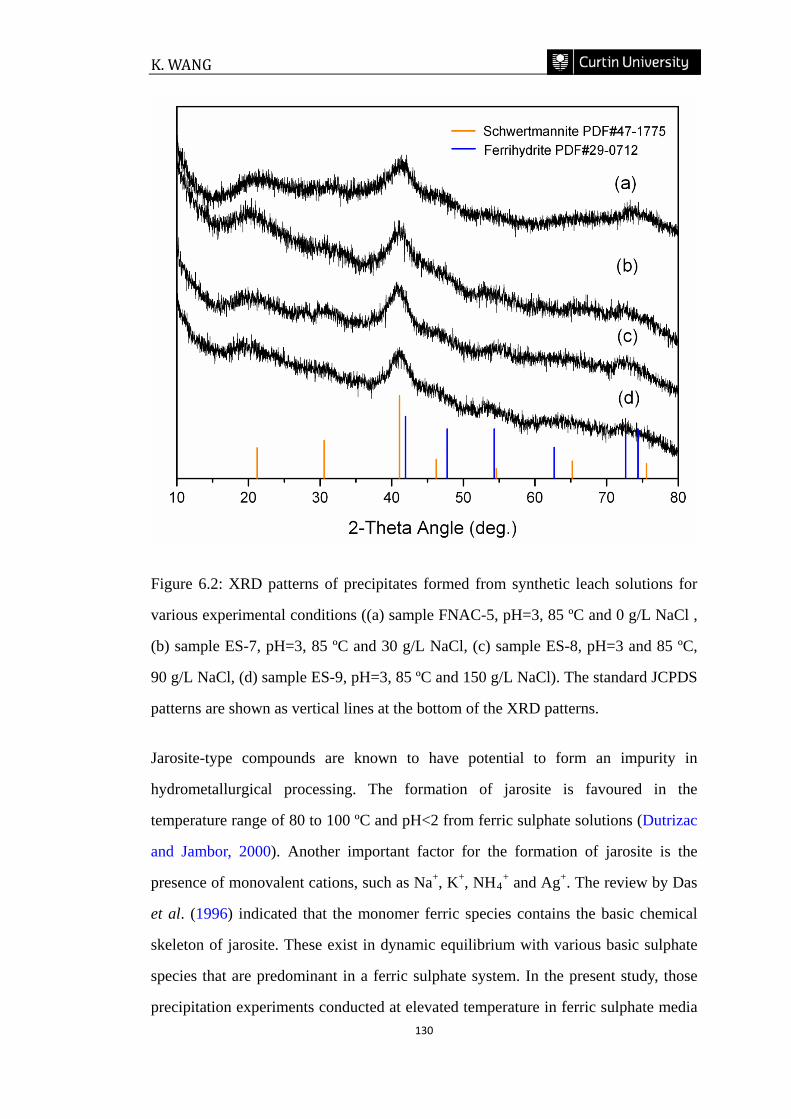
K. WANG
130
Figure 6.2: XRD patterns of precipitates formed from synthetic leach solutions for
various experimental conditions ((a) sample FNAC-5, pH=3, 85 ºC and 0 g/L NaCl ,
(b) sample ES-7, pH=3, 85 ºC and 30 g/L NaCl, (c) sample ES-8, pH=3 and 85 ºC,
90 g/L NaCl, (d) sample ES-9, pH=3, 85 ºC and 150 g/L NaCl). The standard JCPDS
patterns are shown as vertical lines at the bottom of the XRD patterns.
Jarosite-type compounds are known to have potential to form an impurity in
hydrometallurgical processing. The formation of jarosite is favoured in the
temperature range of 80 to 100 ºC and pH<2 from ferric sulphate solutions (Dutrizac
and Jambor, 2000). Another important factor for the formation of jarosite is the
presence of monovalent cations, such as Na+, K+, NH4+ and Ag+. The review by Das
et al. (1996) indicated that the monomer ferric species contains the basic chemical
skeleton of jarosite. These exist in dynamic equilibrium with various basic sulphate
species that are predominant in a ferric sulphate system. In the present study, those
precipitation experiments conducted at elevated temperature in ferric sulphate media
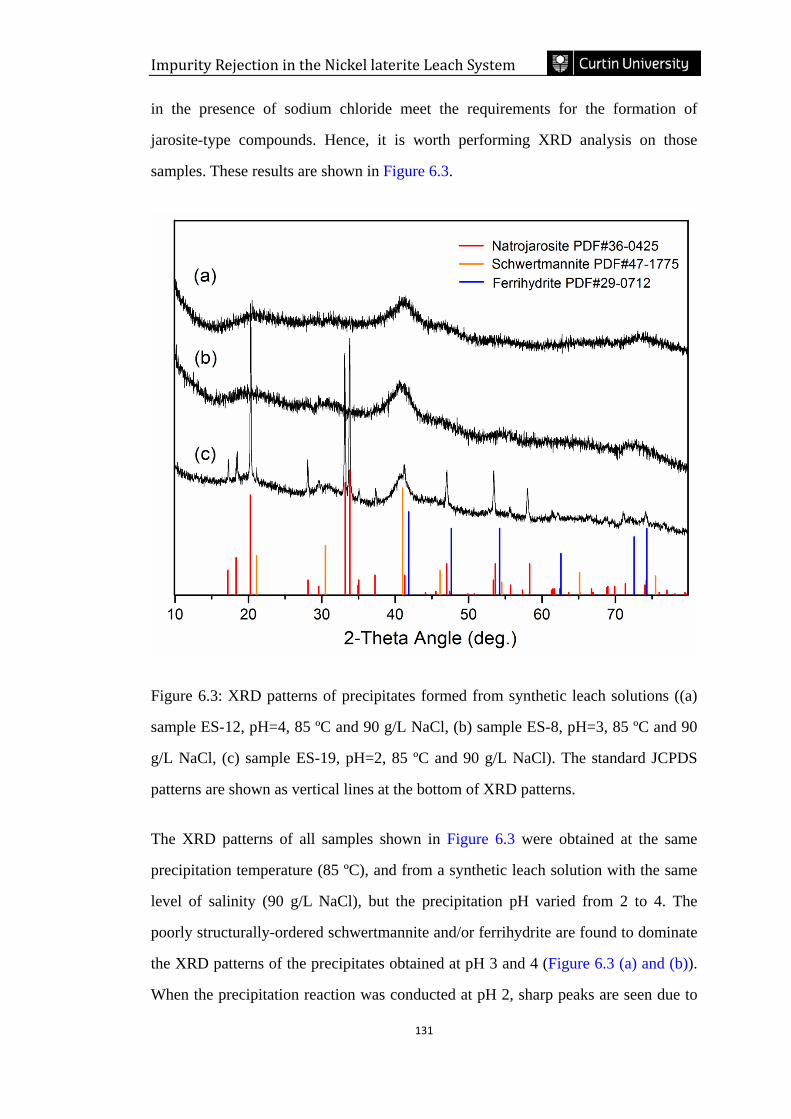
Impurity Rejection in the Nickel laterite Leach System
131
in the presence of sodium chloride meet the requirements for the formation of
jarosite-type compounds. Hence, it is worth performing XRD analysis on those
samples. These results are shown in Figure 6.3.
Figure 6.3: XRD patterns of precipitates formed from synthetic leach solutions ((a)
sample ES-12, pH=4, 85 ºC and 90 g/L NaCl, (b) sample ES-8, pH=3, 85 ºC and 90
g/L NaCl, (c) sample ES-19, pH=2, 85 ºC and 90 g/L NaCl). The standard JCPDS
patterns are shown as vertical lines at the bottom of XRD patterns.
The XRD patterns of all samples shown in Figure 6.3 were obtained at the same
precipitation temperature (85 ºC), and from a synthetic leach solution with the same
level of salinity (90 g/L NaCl), but the precipitation pH varied from 2 to 4. The
poorly structurally-ordered schwertmannite and/or ferrihydrite are found to dominate
the XRD patterns of the precipitates obtained at pH 3 and 4 (Figure 6.3 (a) and (b)).
When the precipitation reaction was conducted at pH 2, sharp peaks are seen due to
K. WANG
132
natrojarosite (NaFe3(SO4)2(OH)6) (Figure 6.3 (c)). Notably, a small peak at ca. 21.5º
2θ (d-spacing 4.83Å) appeared to be gibbsite (d-spacing 4.85Å, PDF#33-18).
However, the presence of gibbsite in sample ES-19 is questionable, as other
distinctive XRD peaks for gibbsite were not identified. In addition, no distinct
crystalline hematite (Fe2O3) was identified through XRD analysis, which was
expected to be formed at atmospheric conditions in the presence of a high level of
chloride. The reasons for non XRD-identifiable hematite in the present study are
probably due to the lack of hematite seeding and/or preferable formation of jarosite-
type compounds in a mixed sulphate and chloride aqueous media. Except for the
sharp XRD peaks of natrojarosite, broad peaks belonging to poorly structural-ordered
schwertmannite and/or ferrihydrite are also observed. This indicates that the sample
obtained at pH 2 is a mixture containing both poorly and highly structurally-ordered
phases.
6.4 CONCLUSION
The results of preliminary experiments reported within this chapter demonstrate that
initial water salinity (as added sodium chloride) exerts little impact on the recovery
of iron, aluminium and chromium when the precipitation is conducted at 25 ºC.
However, when the precipitation reactions were carried out at 85 ºC, higher
recoveries of iron, aluminium and chromium appear to be achieved and this was
marginally higher for higher salinities. Further statistically-designed experiments
confirmed that a reduction of nickel loss became notable only when the precipitation
reaction was conducted at pH 4 and 85 ºC in a high salinity media. It was also
demonstrated that pH and temperature, as well as their interaction are significant
factors affecting the level of nickel loss. Increases in pH and temperature resulted in
more loss of nickel to the solids, as also found in Chapter 4. The XRD analysis of
solid precipitation products obtained from synthetic PLS with various salinities
confirmed that schwertmannite and/or ferrihydrite were the dominant phase.
Natrojarosite was identified when the precipitation reaction occurred at pH 2 and 85

Impurity Rejection in the Nickel laterite Leach System
133
ºC. The results of experiments performed within this chapter also suggest that the
semi-batch precipitation method used in this thesis is able to process the PLS
containing high water salinity with better nickel recovery and impurity removal
efficiencies.
K. WANG
134
CHAPTER 7
CHARACTERIZATION OF IRON-RICH PRECIPITATES
7.1 INTRODUCTION
Fundamental XRD analysis in Chapters 4 and 6 showed iron-rich precipitates
obtained were mainly poorly structurally-ordered schwertmannite and/or ferrihydrite.
These iron-bearing oxyhydroxide and oxyhydroxysulphate minerals are
thermodynamically unstable, and tend to transform over time to more stable iron
oxides such as goethite and/or hematite (Cornell and Schwertmann, 2003).
Moreover, the data on the thermodynamic properties and precise crystal structures of
schwertmannite and ferrihydrite are still under debate (Jambor and Dutrizac, 1998;
Majzlan et al., 2004). The disordered nature of these structures often leads to
difficulty in mineralogical identification using routine X-Ray Diffraction (XRD)
techniques. Furthermore, the mutual poor structural order of schwertmannite and
ferrihydrite complicates their identification in a mixed assemblage. In particular,
schwertmannite and ferrihydrite can become nearly undetectable by XRD when
significant amounts of minerals with high structural order are also present in the
mixed precipitate (Campbell and Schwertmann, 1984; Schwertmann et al., 1982).
Conversely, trace to minor amounts of minerals with good structural order can be
overlooked due to their XRD peaks being masked by minerals with poor structural
order (Caraballo et al., 2009; Schulze, 1981). In such cases, a correct mineralogical
analysis can only be made using a combination of several techniques that include
selective dissolution using Acidified Ammonium Oxalate (AAO), Differential X-Ray
Diffraction (DXRD), Scanning Electron Microscopy (SEM) and, Fourier Transform
Infra-Red (FTIR) spectroscopy.
Metallic cations that include aluminium, chromium and nickel have been found to
influence both the formation and transformation of iron oxides. These either change
Impurity Rejection in the Nickel laterite Leach System
135
the composition and properties of the end products or slow the transformation rates
of their intermediates (Cornell and Schwertmann, 2003). Much research has been
directed toward understanding the association of aluminium, chromium and nickel
with goethite and ferrihydrite: see, for example, Al, Cr and Ni-goethite
(Schwertmann et al., 1989; Singh and Gilkes, 1992; Singh et al., 2002) and Al, Cr
and Ni-ferrihydrite (Giovanoli and Cornell, 1992; Lewis and Schwertmann, 1979;
Schwertmann, 1991). These studies have established the mechanism of cation
substitution for iron in goethite. However so far, no direct evidence of structural
incorporation has been provided for the co-precipitation of ferrihydrite with various
cations, probably due to the small particle size and poor crystallinity of ferrihydrite
which makes the distinction between surface adsorption and structural incorporation
difficult to determine (Cornell and Schwertmann, 2003). Furthermore, very few
studies have examined the mixtures of iron oxides, oxyhydroxide and
oxyhydroxysulphate with other metallic cations that commonly occur in the
hydrometallurgical processing of AL liquors. Acero et al. (2006) studied the
behaviour of trace metallic cations during schwertmannite precipitation and
subsequent transformation into goethite and jarosite. However, this study as well as
others (Caraballo et al., 2009; Dold, 2003b) all focused on natural precipitates from
acidic mine water and under conditions that differ from hydrometallurgical
precipitation processes.
Chapter 7 provides a detailed mineralogical characterization of iron-rich precipitates.
The aims are to apply selective AAO dissolution and characterization techniques that
include DXRD, SEM and FTIR spectroscopy to obtain an accurate and detailed
mineralogical identification of complicated iron-rich precipitates from synthetic
atmospheric nickel laterite leach solutions, which contain both poorly and highly
structural-ordered phases formed in the presence of the foreign metallic cations.
Emphasis is directed toward the effects of the foreign metallic cations on
crystallization, dissolution behavior and mineralogical properties of the precipitates.
K. WANG
136
7.2 EXPERIMENTAL AND ANALYTICAL METHODS
All precipitation experiments were conducted using a semi-batch procedure, as
detailed in Chapter 4. For each test a volume of 500 mL of synthetic PLS containing
30 g/L Fe3+ [as Fe2(SO4)3∙xH2O], 0 to 5 g/L Ni2+ [as NiSO4∙6H2O], 0 to 6.5 g/L Al3+
[as Al2(SO4)3∙18H2O], and 0 to 2 g/L Cr3+ [as Cr2(SO4)3∙xH2O] was pumped into a
baffled reaction vessel containing a pre-determined amount of de-ionized water over
a period of 2.5 h. A CaCO3 (25% w/w) suspension in de-ionized water was
simultaneously pumped into the reaction vessel to maintain the pH at 4. The
temperature was controlled using an oil bath and the precipitation reactions
conducted at both 25 and 85 ºC. At the completion of the reaction, the resulting
slurry was vacuum filtered through a 0.45 µm Gelman Supor® membrane. The metal
concentrations in the filtrate were analysed by ICP-OES, and the filter cake was
carefully washed with large amounts of hot de-ionized water until the conductivity of
the filtrate was constant (<100 μS) and then dried overnight at 60 ºC. The chemical
composition of the dried solid products was determined by ICP-OES after aqua regia
digestion.
To obtain standards for comparison, schwertmannite was synthesized by the method
of Loan et al. (2004) and 6-line ferrihydrite according to the method of Schwertmann
and Cornell (2000). Briefly, schwertmannite was prepared by placing 1L of 0.7 g/L
ferric solution (as Fe2(SO4)3∙xH2O) in a Nalgene® bottle and then agitated using a
mechanical bottle-roller water bath at 85 ºC for one hour. The solution was filtered
through a 0.45 µm Gelman Supor® membrane, washed with Milli-Q water and dried
overnight at 60 ºC. The 6-line ferrihydrite was prepared by adding 20 g of
Fe(NO3)3∙9H2O into preheated 75 ºC Milli-Q water for 10 minutes, quenching in an
ice bath and transferring the product to dialysis tubing for at least three weeks to
remove the NO3− ions. The colloidal 6-line ferrihydrite formed was collected by
freeze drying.
Impurity Rejection in the Nickel laterite Leach System
137
Selective dissolution experiments were conducted by dissolving the dried solid
samples in 0.2 M ammonium oxalate solution acidified to pH 3.0 with 0.2 M oxalic
acid at room temperature in the absence of visible light, as described by
Schwertmann et al. (1982). The dissolution kinetics was studied by shaking
approximately 2 g of sample in 1 L of acidified ammonium oxalate solution and
extracting 10 mL samples at specific time intervals. The samples were immediately
filtered and the ion concentration in the filtrate analysed by ICP-OES.
Dried solid samples were analysed by X-Ray Diffraction (XRD) using a Philips
X’pert diffractometer with CoKα radiation operated at 45 kV and 40 mA with a step
scan of 0.02º. Fourier Transform Infra-Red (FTIR) spectroscopy measurements were
made with a Bruker infrared spectrometer from 4000-400 cm-1 at room temperature
using the KBr pellet technique. Some samples were carbon-coated and examined at
high magnification with a Zeiss Neon 40EsB Focused Ion Beam-Scanning Electron
Microscope (FIB-SEM).
7.3 RESULTS AND DISCUSSION
7.3.1 Chemical compositions and mineralogical properties of iron-rich
precipitates
The first two experiments shown in Table 7.1, labelled as F-1 and F-2, refer to the
single-metallic samples obtained from PLS containing only ferric iron, which serve
as “baselines” for other experiments. FN-2 and FN-4 are the bi-metallic samples
precipitated from PLS containing iron and nickel, while FNAC-2 and FNAC-6
represent the multi-metallic samples obtained from PLS containing iron, aluminium,
chromium and nickel. Notably, from Table 7.2, increasing temperature resulted in
more aluminium, chromium, and nickel but less sulphur in the iron-rich solid
precipitates.
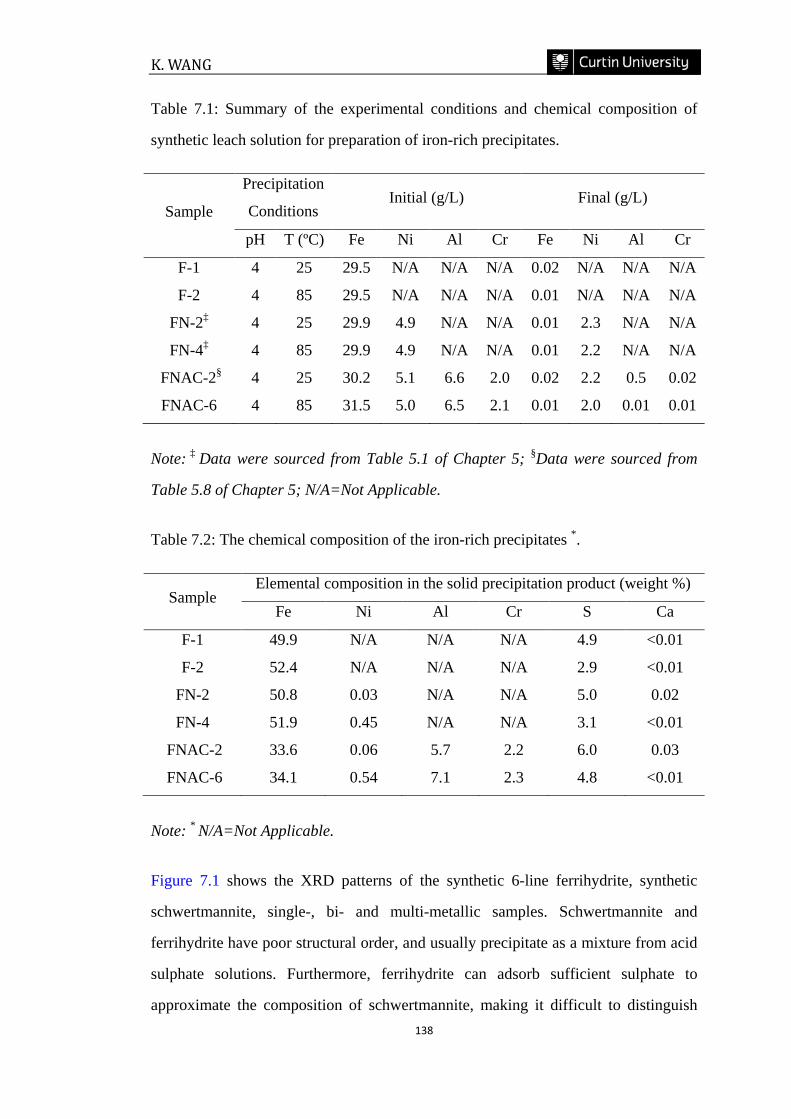
K. WANG
138
Table 7.1: Summary of the experimental conditions and chemical composition of
synthetic leach solution for preparation of iron-rich precipitates.
Sample
Precipitation
Conditions Initial (g/L) Final (g/L)
pH T (ºC) Fe Ni Al Cr Fe Ni Al Cr
F-1 4 25 29.5 N/A N/A N/A 0.02 N/A N/A N/A
F-2 4 85 29.5 N/A N/A N/A 0.01 N/A N/A N/A
FN-2‡ 4 25 29.9 4.9 N/A N/A 0.01 2.3 N/A N/A
FN-4‡ 4 85 29.9 4.9 N/A N/A 0.01 2.2 N/A N/A
FNAC-2§ 4 25 30.2 5.1 6.6 2.0 0.02 2.2 0.5 0.02
FNAC-6 4 85 31.5 5.0 6.5 2.1 0.01 2.0 0.01 0.01
Note: ‡ Data were sourced from Table 5.1 of Chapter 5; §Data were sourced from
Table 5.8 of Chapter 5; N/A=Not Applicable.
Table 7.2: The chemical composition of the iron-rich precipitates *.
Sample Elemental composition in the solid precipitation product (weight %)
Fe Ni Al Cr S Ca
F-1 49.9 N/A N/A N/A 4.9 <0.01
F-2 52.4 N/A N/A N/A 2.9 <0.01
FN-2 50.8 0.03 N/A N/A 5.0 0.02
FN-4 51.9 0.45 N/A N/A 3.1 <0.01
FNAC-2 33.6 0.06 5.7 2.2 6.0 0.03
FNAC-6 34.1 0.54 7.1 2.3 4.8 <0.01
Note: * N/A=Not Applicable.
Figure 7.1 shows the XRD patterns of the synthetic 6-line ferrihydrite, synthetic
schwertmannite, single-, bi- and multi-metallic samples. Schwertmannite and
ferrihydrite have poor structural order, and usually precipitate as a mixture from acid
sulphate solutions. Furthermore, ferrihydrite can adsorb sufficient sulphate to
approximate the composition of schwertmannite, making it difficult to distinguish
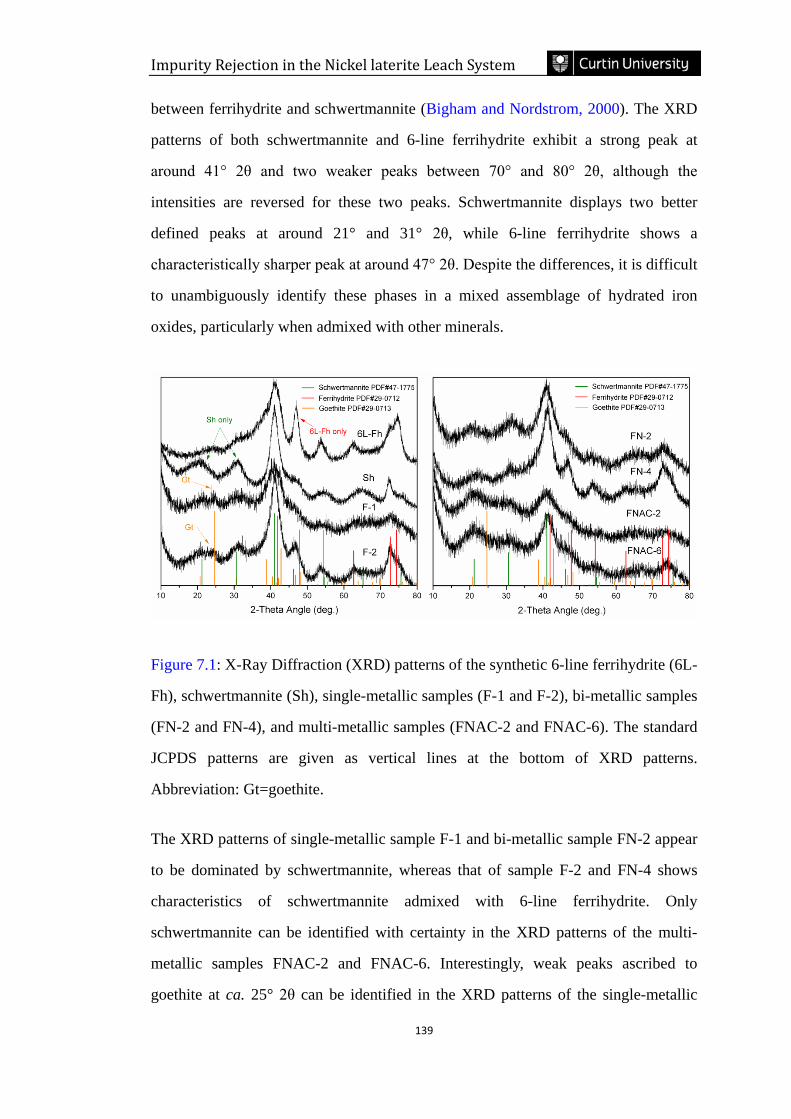
Impurity Rejection in the Nickel laterite Leach System
139
between ferrihydrite and schwertmannite (Bigham and Nordstrom, 2000). The XRD
patterns of both schwertmannite and 6-line ferrihydrite exhibit a strong peak at
around 41° 2θ and two weaker peaks between 70° and 80° 2θ, although the
intensities are reversed for these two peaks. Schwertmannite displays two better
defined peaks at around 21° and 31° 2θ, while 6-line ferrihydrite shows a
characteristically sharper peak at around 47° 2θ. Despite the differences, it is difficult
to unambiguously identify these phases in a mixed assemblage of hydrated iron
oxides, particularly when admixed with other minerals.
Figure 7.1: X-Ray Diffraction (XRD) patterns of the synthetic 6-line ferrihydrite (6L-
Fh), schwertmannite (Sh), single-metallic samples (F-1 and F-2), bi-metallic samples
(FN-2 and FN-4), and multi-metallic samples (FNAC-2 and FNAC-6). The standard
JCPDS patterns are given as vertical lines at the bottom of XRD patterns.
Abbreviation: Gt=goethite.
The XRD patterns of single-metallic sample F-1 and bi-metallic sample FN-2 appear
to be dominated by schwertmannite, whereas that of sample F-2 and FN-4 shows
characteristics of schwertmannite admixed with 6-line ferrihydrite. Only
schwertmannite can be identified with certainty in the XRD patterns of the multi-
metallic samples FNAC-2 and FNAC-6. Interestingly, weak peaks ascribed to
goethite at ca. 25° 2θ can be identified in the XRD patterns of the single-metallic
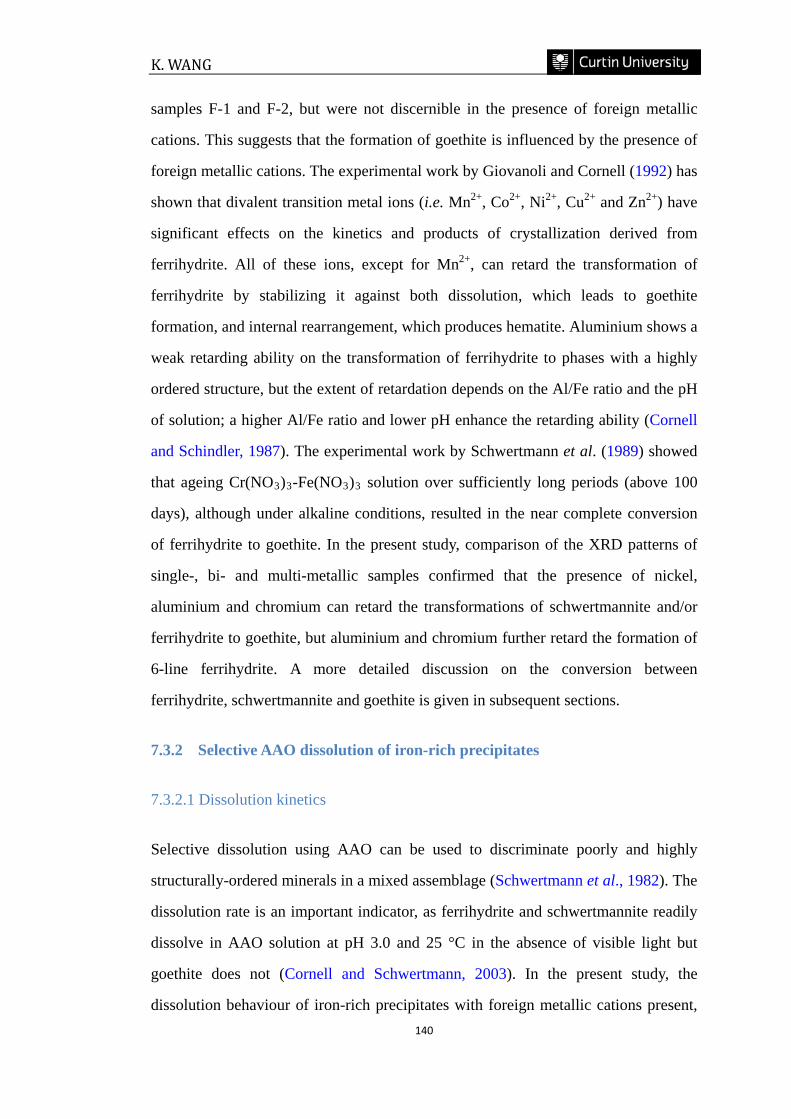
K. WANG
140
samples F-1 and F-2, but were not discernible in the presence of foreign metallic
cations. This suggests that the formation of goethite is influenced by the presence of
foreign metallic cations. The experimental work by Giovanoli and Cornell (1992) has
shown that divalent transition metal ions (i.e. Mn2+, Co2+, Ni2+, Cu2+ and Zn2+) have
significant effects on the kinetics and products of crystallization derived from
ferrihydrite. All of these ions, except for Mn2+, can retard the transformation of
ferrihydrite by stabilizing it against both dissolution, which leads to goethite
formation, and internal rearrangement, which produces hematite. Aluminium shows a
weak retarding ability on the transformation of ferrihydrite to phases with a highly
ordered structure, but the extent of retardation depends on the Al/Fe ratio and the pH
of solution; a higher Al/Fe ratio and lower pH enhance the retarding ability (Cornell
and Schindler, 1987). The experimental work by Schwertmann et al. (1989) showed
that ageing Cr(NO3)3-Fe(NO3)3 solution over sufficiently long periods (above 100
days), although under alkaline conditions, resulted in the near complete conversion
of ferrihydrite to goethite. In the present study, comparison of the XRD patterns of
single-, bi- and multi-metallic samples confirmed that the presence of nickel,
aluminium and chromium can retard the transformations of schwertmannite and/or
ferrihydrite to goethite, but aluminium and chromium further retard the formation of
6-line ferrihydrite. A more detailed discussion on the conversion between
ferrihydrite, schwertmannite and goethite is given in subsequent sections.
7.3.2 Selective AAO dissolution of iron-rich precipitates
7.3.2.1 Dissolution kinetics
Selective dissolution using AAO can be used to discriminate poorly and highly
structurally-ordered minerals in a mixed assemblage (Schwertmann et al., 1982). The
dissolution rate is an important indicator, as ferrihydrite and schwertmannite readily
dissolve in AAO solution at pH 3.0 and 25 °C in the absence of visible light but
goethite does not (Cornell and Schwertmann, 2003). In the present study, the
dissolution behaviour of iron-rich precipitates with foreign metallic cations present,
Impurity Rejection in the Nickel laterite Leach System
141
the bi-metallic and the multi-metallic precipitates, were examined, with the results
presented in Figure 7.2. There were large differences in the shape of the curves for
the bi-metallic and multi-metallic samples. The dissolution curves were sigmoidal in
shape for bi-metallic samples, whereas the curves of multi-metallic samples were
near linear. Precipitation temperature had a significant effect on the dissolution
kinetics of the precipitates. All precipitates obtained at 25 ºC dissolved much slower
compared to those precipitated at 85 ºC.
Figure 7.2: Dissolution curves of bi-metallic and multi-metallic precipitates obtained
at different temperatures: (a) 25 ºC and (b) 85 ºC. Lines represent the modelled curve
fits.
There have been many dissolution kinetic studies focusing on various natural and
synthetic, pure and metal-substituted goethites (Landers and Gilkes, 2007; Lim-
Nunez and Gilkes, 1987; Perrier et al., 2006). These studies, which were normally
conducted in strong mineral acid (e.g. HCl and H2SO4), have shown that metal
substitution plays an important role in determining dissolution rate. For instance,
Al3+, which is the most common isomorphic substituent for Fe3+, can substantially
decrease the dissolution rate of goethite in various concentrations of HCl
(Schwertmann, 1991). Chromium (as Cr3+) stabilizes goethite against dissolution in 1
M HCl to a much greater extent than aluminium, even at a small level of
incorporation, whereas nickel appears to have little effect on dissolution rate (Lim-
K. WANG
142
Nunez and Gilkes, 1987). The recent work by Kaur et al. (2010) further indicated
that chromium strongly retarded the dissolution of both single- and multi-metal
substituted goethites in 1M HCl. Since chloride is considered to activate the
dissolution sites by forming surface Fe−Cl complexes, hydrochloric acid is widely
used in controlled dissolution studies (Cornell et al., 1976). Although sulphate ions
do not form such surface complexes, the experimental work by Landers et al. (2009)
showed a similar effect for aluminium and chromium in reducing the dissolution rate
of nickeliferous goethite in 2 M H2SO4. Compared to goethite, there is far less
published data describing the dissolution behaviour of metal-substituted ferrihydrite
and schwertmannite, particularly when both phases are present and admixed with
minerals having highly ordered structures.
Normally, iron oxide dissolution proceeds by three pathways: protonation, reduction
and complexation (Schwertmann, 1991). The dissolution of iron oxide by AAO is
due to a cooperative mechanism involving the protons and oxalate ligand, which
includes steps of oxalate adsorption, iron detachment and proton adsorption/surface
restoration (Stumm et al., 1985). The study on the dissolution of Al-goethite by
Cornell and Schindler (1987) showed that highly substituted goethite (15.9 mole%
Al) dissolved much more slowly than unsubstituted goethite in acidified oxalate
solution. Incorporation of metal ions within the structure of iron oxides can affect the
dissolution behaviour by altering bond strength. The ionic radii of Al3+ (0.0535 nm)
and Cr3+ (0.0615 nm) are smaller than for Fe3+ (0.0645 nm), which results in shorter
bond lengths and larger Me−O bond energies, i.e. Al−O (29.3 kJ/mol) and Cr−O
(24.5 kJ/mol) compared with Fe−O (23.7 kJ/mol) (Wells et al., 2006). Given the
evidence from these previous studies, it can be postulated that aluminium and
chromium will play similar roles for highly disordered iron-bearing oxyhydroxide
and oxyhydroxysulphate. Aluminium and chromium appear to strongly stabilize the
multi-metallic precipitates against dissolution by AAO solution.
Impurity Rejection in the Nickel laterite Leach System
143
Depending on the type or shape of the iron dissolution curves, the data are normally
modelled by various mathematical equations, of which the Kabai equation and cube-
root law are the most common ones and have been used in various studies (Landers
and Gilkes, 2007; Singh and Gilkes, 1992; Wells et al., 2001). In this study, the
sigmoidal dissolution-time profiles of the bi-metallic samples were best modelled
using the Kabai equation (Kabai, 1973):
tαktKCC
C lnlnlnlnlnln0
0 +=+=−
αα Eq. 6.1
where C0 is the initial amount of solid, C is the amount of solid dissolved at time t, k
is a rate constant (K=kα) and α is a Kabai constant that relates to the characteristics of
the solid phases. The iron dissolution rate constant (kFe) for FN-2 and FN-4 was
12.3×10⁻³ min-1 and 27.0×10⁻³ min-1, respectively. The correlation coefficients (R2)
were both above 0.99, indicating good fit to data. The Kabai constant (α) for FN-2
and FN-4 was 0.81 and 0.89, respectively. Landers and Gilkes (2007) indicated that
when α<1, the rate of dissolution is determined by the rate of chemical reaction at the
crystal surface, whereas the dissolution reaction is diffusion controlled when α>1.
For the multi-metallic samples (FNAC-2 and FNAC-6), the dissolution data were
better described by the cube-root law (Hixson and Crowell, 1931):
kt=−− 31
)1(1 ω Eq. 6.2
where ω is the fraction of the solid dissolved at time t and k is a rate constant. The
rate constants for iron dissolution (kFe) were 0.89×10⁻³ min-1 for FNAC-2 and
1.30×10³ min-1 for FNAC-6, respectively.
7.3.2.2 Dissolution process revealed by SEM images
SEM images of the bi- and multi-metallic samples at different dissolution times are
shown in Figure 7.3. Both FN-2 and FNAC-2 showed aggregates of spherical
crystallites with diameters of about 0.5 µm (Figure 7.3 (a) and (g)). The appearance
K. WANG
144
of these particles is similar to that of schwertmannite, as reported by Schwertmann
and Carlson (2005). After 120 and 240 minutes dissolution in oxalate solution, the
“larger” spherical aggregates in sample FN-2 had dissolved to reveal “smaller”
aggregates (Figure 7.3. (b) and (c)). In comparison, partially dissolved “larger”
spherical features can still be observed in the residues for sample FNAC-2 (Figure
7.3 (h) and (i)). In the case of FN-4 and FNAC-6 (Figure 7.3 (d) and (j)), the
nanoscale particles produced were highly aggregated, having similar structural
appearance to that of ferrihydrite particles (Dold, 2003a). There were no significant
differences in the appearance of residues from samples FN-4 and FNAC-6 after 60
and 120 minutes AAO dissolution.
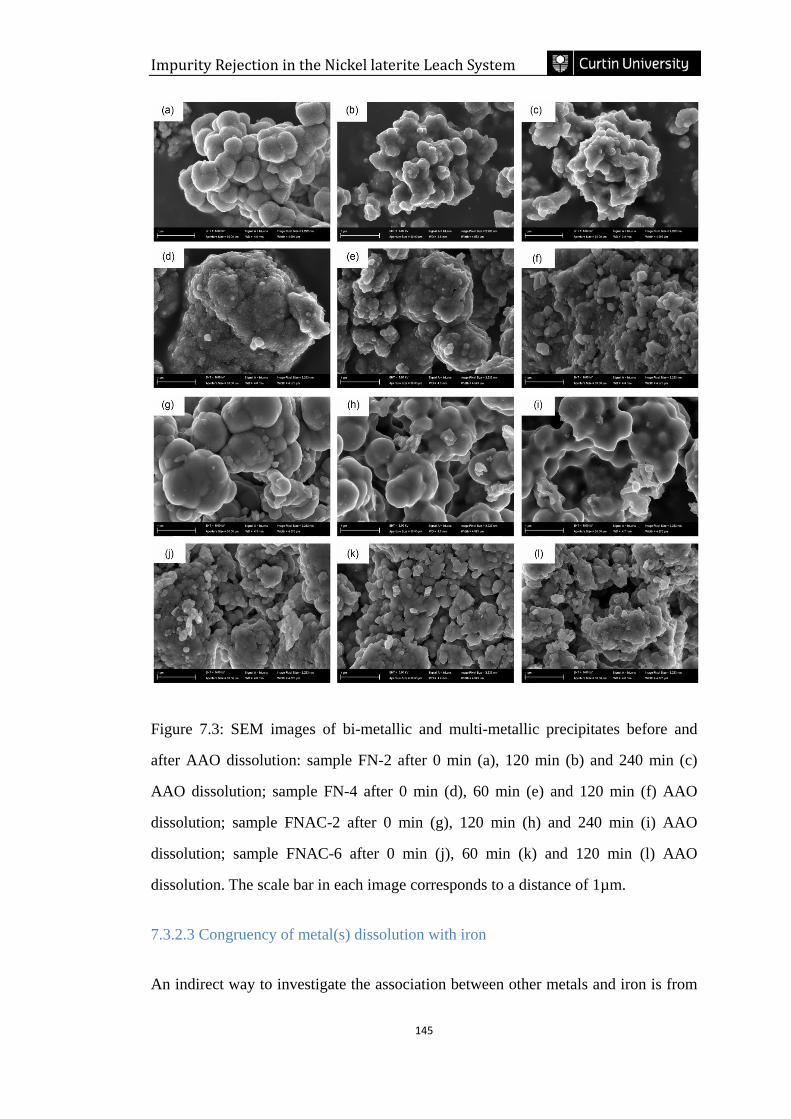
Impurity Rejection in the Nickel laterite Leach System
145
Figure 7.3: SEM images of bi-metallic and multi-metallic precipitates before and
after AAO dissolution: sample FN-2 after 0 min (a), 120 min (b) and 240 min (c)
AAO dissolution; sample FN-4 after 0 min (d), 60 min (e) and 120 min (f) AAO
dissolution; sample FNAC-2 after 0 min (g), 120 min (h) and 240 min (i) AAO
dissolution; sample FNAC-6 after 0 min (j), 60 min (k) and 120 min (l) AAO
dissolution. The scale bar in each image corresponds to a distance of 1µm.
7.3.2.3 Congruency of metal(s) dissolution with iron
An indirect way to investigate the association between other metals and iron is from
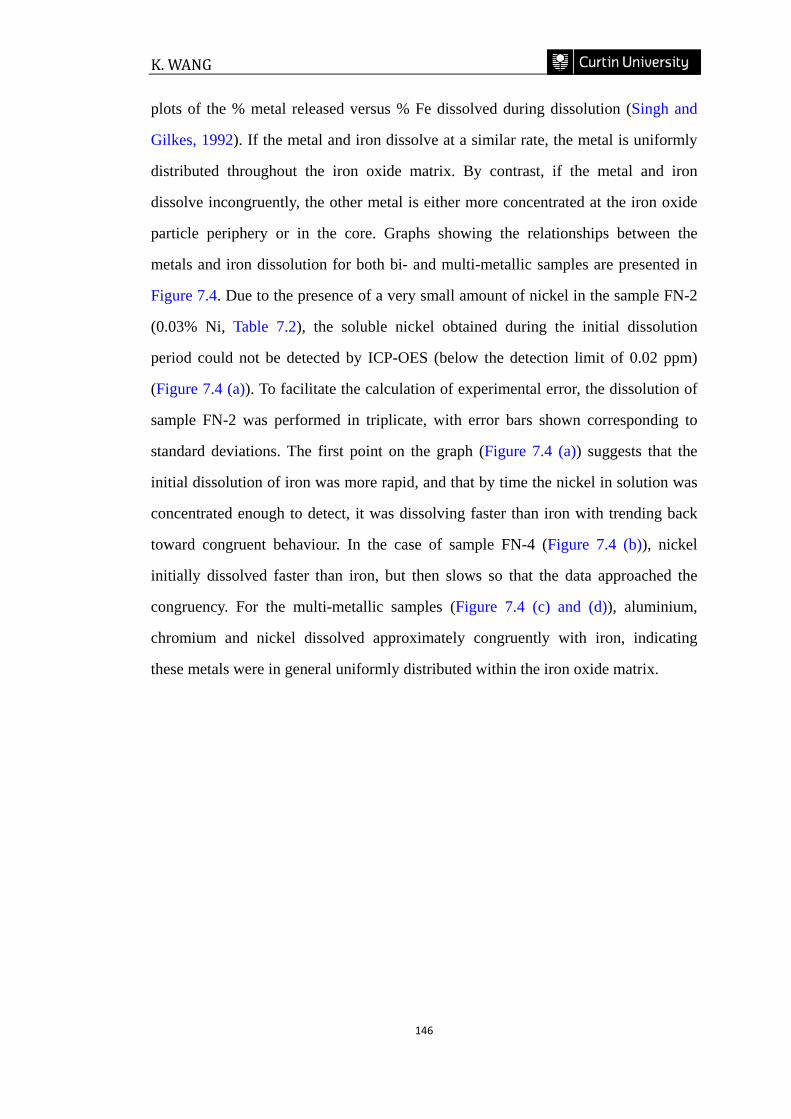
K. WANG
146
plots of the % metal released versus % Fe dissolved during dissolution (Singh and
Gilkes, 1992). If the metal and iron dissolve at a similar rate, the metal is uniformly
distributed throughout the iron oxide matrix. By contrast, if the metal and iron
dissolve incongruently, the other metal is either more concentrated at the iron oxide
particle periphery or in the core. Graphs showing the relationships between the
metals and iron dissolution for both bi- and multi-metallic samples are presented in
Figure 7.4. Due to the presence of a very small amount of nickel in the sample FN-2
(0.03% Ni, Table 7.2), the soluble nickel obtained during the initial dissolution
period could not be detected by ICP-OES (below the detection limit of 0.02 ppm)
(Figure 7.4 (a)). To facilitate the calculation of experimental error, the dissolution of
sample FN-2 was performed in triplicate, with error bars shown corresponding to
standard deviations. The first point on the graph (Figure 7.4 (a)) suggests that the
initial dissolution of iron was more rapid, and that by time the nickel in solution was
concentrated enough to detect, it was dissolving faster than iron with trending back
toward congruent behaviour. In the case of sample FN-4 (Figure 7.4 (b)), nickel
initially dissolved faster than iron, but then slows so that the data approached the
congruency. For the multi-metallic samples (Figure 7.4 (c) and (d)), aluminium,
chromium and nickel dissolved approximately congruently with iron, indicating
these metals were in general uniformly distributed within the iron oxide matrix.
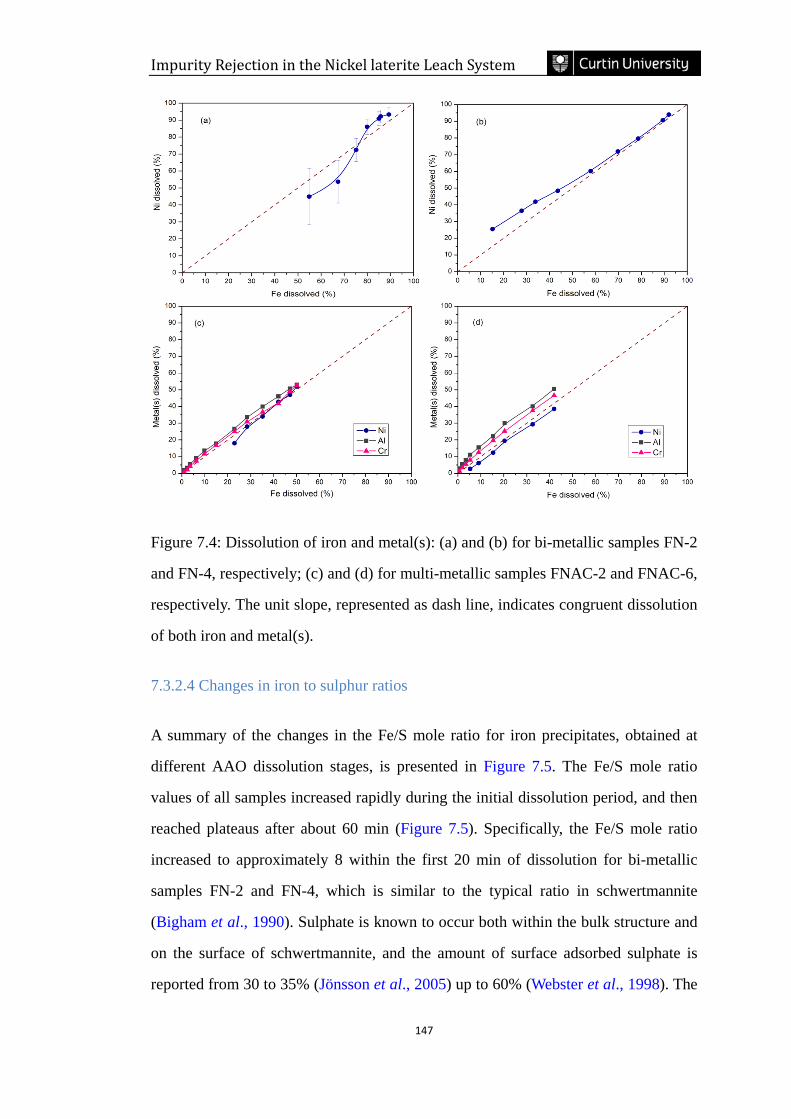
Impurity Rejection in the Nickel laterite Leach System
147
Figure 7.4: Dissolution of iron and metal(s): (a) and (b) for bi-metallic samples FN-2
and FN-4, respectively; (c) and (d) for multi-metallic samples FNAC-2 and FNAC-6,
respectively. The unit slope, represented as dash line, indicates congruent dissolution
of both iron and metal(s).
7.3.2.4 Changes in iron to sulphur ratios
A summary of the changes in the Fe/S mole ratio for iron precipitates, obtained at
different AAO dissolution stages, is presented in Figure 7.5. The Fe/S mole ratio
values of all samples increased rapidly during the initial dissolution period, and then
reached plateaus after about 60 min (Figure 7.5). Specifically, the Fe/S mole ratio
increased to approximately 8 within the first 20 min of dissolution for bi-metallic
samples FN-2 and FN-4, which is similar to the typical ratio in schwertmannite
(Bigham et al., 1990). Sulphate is known to occur both within the bulk structure and
on the surface of schwertmannite, and the amount of surface adsorbed sulphate is
reported from 30 to 35% (Jönsson et al., 2005) up to 60% (Webster et al., 1998). The
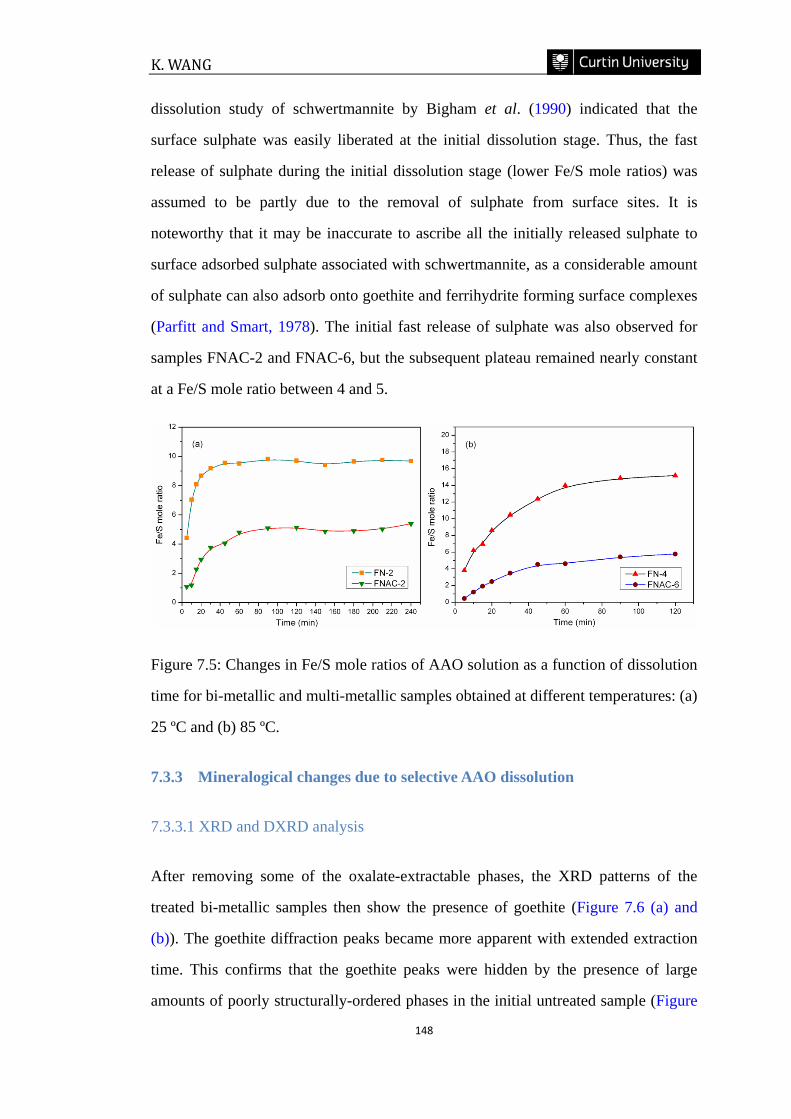
K. WANG
148
dissolution study of schwertmannite by Bigham et al. (1990) indicated that the
surface sulphate was easily liberated at the initial dissolution stage. Thus, the fast
release of sulphate during the initial dissolution stage (lower Fe/S mole ratios) was
assumed to be partly due to the removal of sulphate from surface sites. It is
noteworthy that it may be inaccurate to ascribe all the initially released sulphate to
surface adsorbed sulphate associated with schwertmannite, as a considerable amount
of sulphate can also adsorb onto goethite and ferrihydrite forming surface complexes
(Parfitt and Smart, 1978). The initial fast release of sulphate was also observed for
samples FNAC-2 and FNAC-6, but the subsequent plateau remained nearly constant
at a Fe/S mole ratio between 4 and 5.
Figure 7.5: Changes in Fe/S mole ratios of AAO solution as a function of dissolution
time for bi-metallic and multi-metallic samples obtained at different temperatures: (a)
25 ºC and (b) 85 ºC.
7.3.3 Mineralogical changes due to selective AAO dissolution
7.3.3.1 XRD and DXRD analysis
After removing some of the oxalate-extractable phases, the XRD patterns of the
treated bi-metallic samples then show the presence of goethite (Figure 7.6 (a) and
(b)). The goethite diffraction peaks became more apparent with extended extraction
time. This confirms that the goethite peaks were hidden by the presence of large
amounts of poorly structurally-ordered phases in the initial untreated sample (Figure
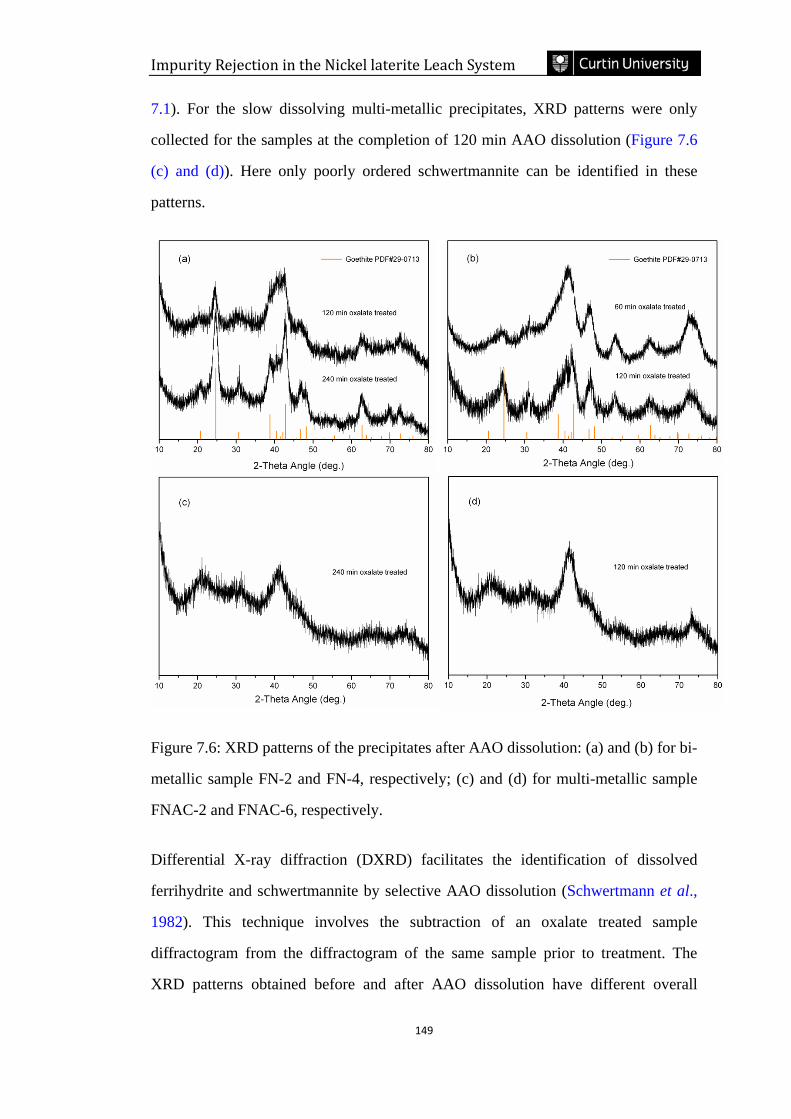
Impurity Rejection in the Nickel laterite Leach System
149
7.1). For the slow dissolving multi-metallic precipitates, XRD patterns were only
collected for the samples at the completion of 120 min AAO dissolution (Figure 7.6
(c) and (d)). Here only poorly ordered schwertmannite can be identified in these
patterns.
Figure 7.6: XRD patterns of the precipitates after AAO dissolution: (a) and (b) for bi-
metallic sample FN-2 and FN-4, respectively; (c) and (d) for multi-metallic sample
FNAC-2 and FNAC-6, respectively.
Differential X-ray diffraction (DXRD) facilitates the identification of dissolved
ferrihydrite and schwertmannite by selective AAO dissolution (Schwertmann et al.,
1982). This technique involves the subtraction of an oxalate treated sample
diffractogram from the diffractogram of the same sample prior to treatment. The
XRD patterns obtained before and after AAO dissolution have different overall
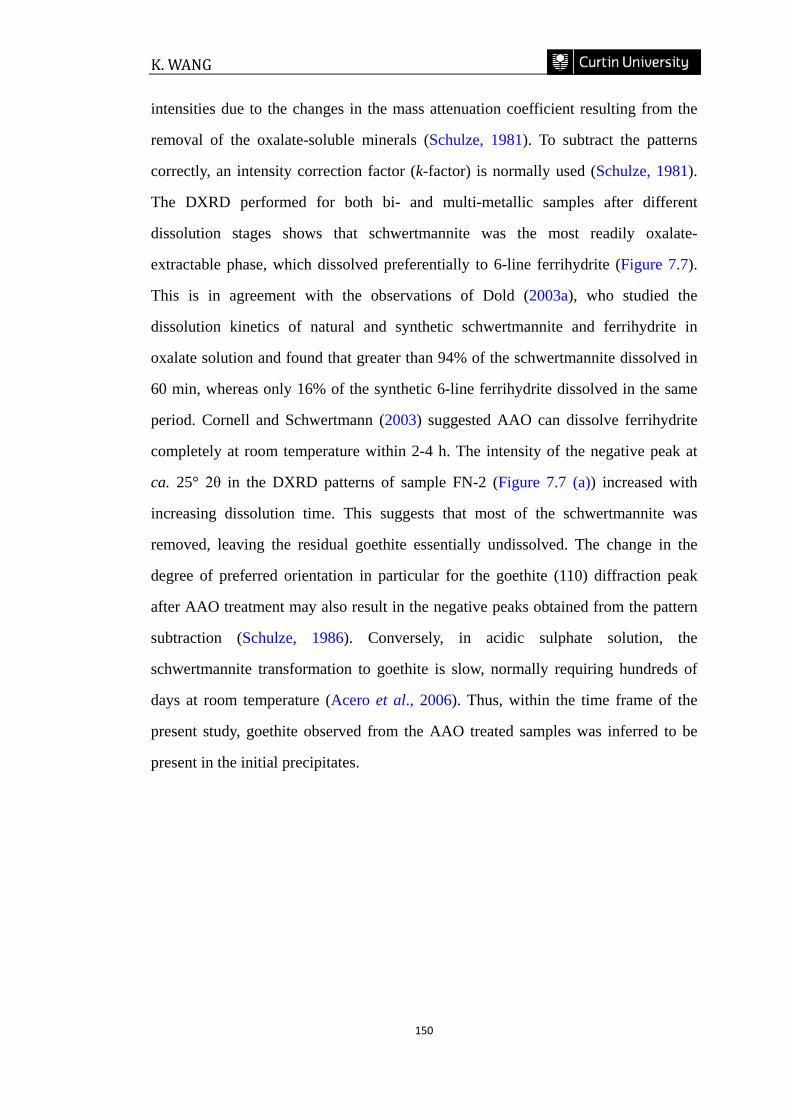
K. WANG
150
intensities due to the changes in the mass attenuation coefficient resulting from the
removal of the oxalate-soluble minerals (Schulze, 1981). To subtract the patterns
correctly, an intensity correction factor (k-factor) is normally used (Schulze, 1981).
The DXRD performed for both bi- and multi-metallic samples after different
dissolution stages shows that schwertmannite was the most readily oxalate-
extractable phase, which dissolved preferentially to 6-line ferrihydrite (Figure 7.7).
This is in agreement with the observations of Dold (2003a), who studied the
dissolution kinetics of natural and synthetic schwertmannite and ferrihydrite in
oxalate solution and found that greater than 94% of the schwertmannite dissolved in
60 min, whereas only 16% of the synthetic 6-line ferrihydrite dissolved in the same
period. Cornell and Schwertmann (2003) suggested AAO can dissolve ferrihydrite
completely at room temperature within 2-4 h. The intensity of the negative peak at
ca. 25° 2θ in the DXRD patterns of sample FN-2 (Figure 7.7 (a)) increased with
increasing dissolution time. This suggests that most of the schwertmannite was
removed, leaving the residual goethite essentially undissolved. The change in the
degree of preferred orientation in particular for the goethite (110) diffraction peak
after AAO treatment may also result in the negative peaks obtained from the pattern
subtraction (Schulze, 1986). Conversely, in acidic sulphate solution, the
schwertmannite transformation to goethite is slow, normally requiring hundreds of
days at room temperature (Acero et al., 2006). Thus, within the time frame of the
present study, goethite observed from the AAO treated samples was inferred to be
present in the initial precipitates.
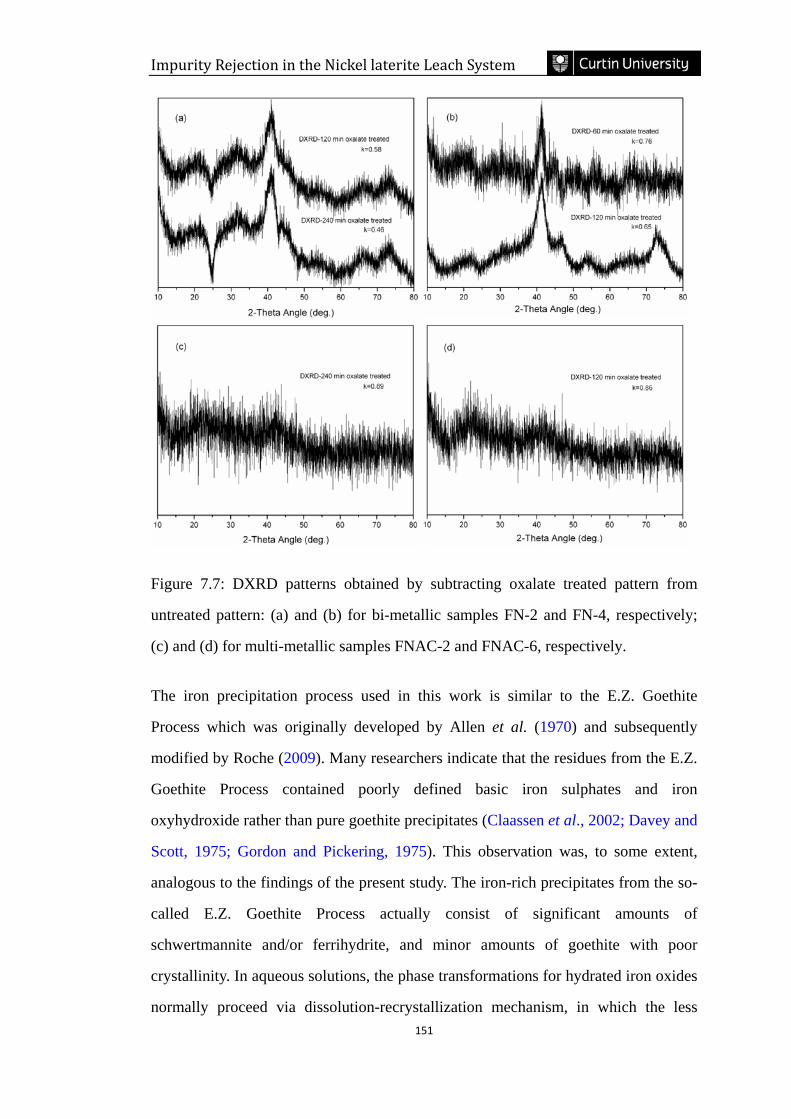
Impurity Rejection in the Nickel laterite Leach System
151
Figure 7.7: DXRD patterns obtained by subtracting oxalate treated pattern from
untreated pattern: (a) and (b) for bi-metallic samples FN-2 and FN-4, respectively;
(c) and (d) for multi-metallic samples FNAC-2 and FNAC-6, respectively.
The iron precipitation process used in this work is similar to the E.Z. Goethite
Process which was originally developed by Allen et al. (1970) and subsequently
modified by Roche (2009). Many researchers indicate that the residues from the E.Z.
Goethite Process contained poorly defined basic iron sulphates and iron
oxyhydroxide rather than pure goethite precipitates (Claassen et al., 2002; Davey and
Scott, 1975; Gordon and Pickering, 1975). This observation was, to some extent,
analogous to the findings of the present study. The iron-rich precipitates from the so-
called E.Z. Goethite Process actually consist of significant amounts of
schwertmannite and/or ferrihydrite, and minor amounts of goethite with poor
crystallinity. In aqueous solutions, the phase transformations for hydrated iron oxides
normally proceed via dissolution-recrystallization mechanism, in which the less
K. WANG
152
stable phases such as ferrihydrite and schwertmannite form first (Blesa and
Matijević, 1989). The mechanism of goethite formation from the dissolution of
ferrihydrite is well established in alkaline media due to the presence of the preferred
growth unit Fe(OH)4− (Cornell et al., 1989). However, the goethite growth
mechanism in acidic sulphate media is more complicated, as the Fe(OH)4− growth
unit is not usually present in acidic solutions, and the formation of the FeSO4+
complex strongly suppresses the polymerization of the hydroxyl complex and the
precipitation of goethite (Cornell and Schwertmann, 2003). Loan (2004) suggested
that goethite could be formed from ferrihydrite by structural re-arrangement in acid
media, in which ferrihydrite acts as a growth unit that can adsorb and orientate on the
goethite surface.
In the presence of sulphate, schwertmannite is the dominant phase, its formation
being thermodynamically favoured over ferrihydrite in the pH range between 2 and 8
(Majzlan et al., 2004). It has been shown that when schwertmannite is equilibrated
with water at room temperature, it can transform to goethite over a long time period,
e.g. 543 days at pH=3.9 (Bigham et al., 1996), and 100 days at pH=4-7.2
(Schwertmann and Carlson, 2005). The experimental work by Schroth and Parnell
(2005) has shown that goethite can be formed from schwertmannite via a
dissolution/re-precipitation mechanism which is similar to that for the ferrihydrite
transformation to goethite. In any event, there seems to be specific conditions for the
formation of precipitates such as ferrihydrite, schwertmannite and goethite. These
compounds seem to form from unique, and as yet unknown, polymerization reactions
of ferric iron species which change markedly with precipitation conditions.
7.3.3.2 FTIR analysis
FTIR spectroscopy is a sensitive tool to detect the changes in the molecular
symmetry of sulphate in schwertmannite-bearing samples (Boily et al., 2010). The
FTIR spectra for each AAO untreated bi- and multi-metallic sample presented in
Figure 7.8 show similar absorption bands to schwertmannite, i.e. v1−SO4 at 976
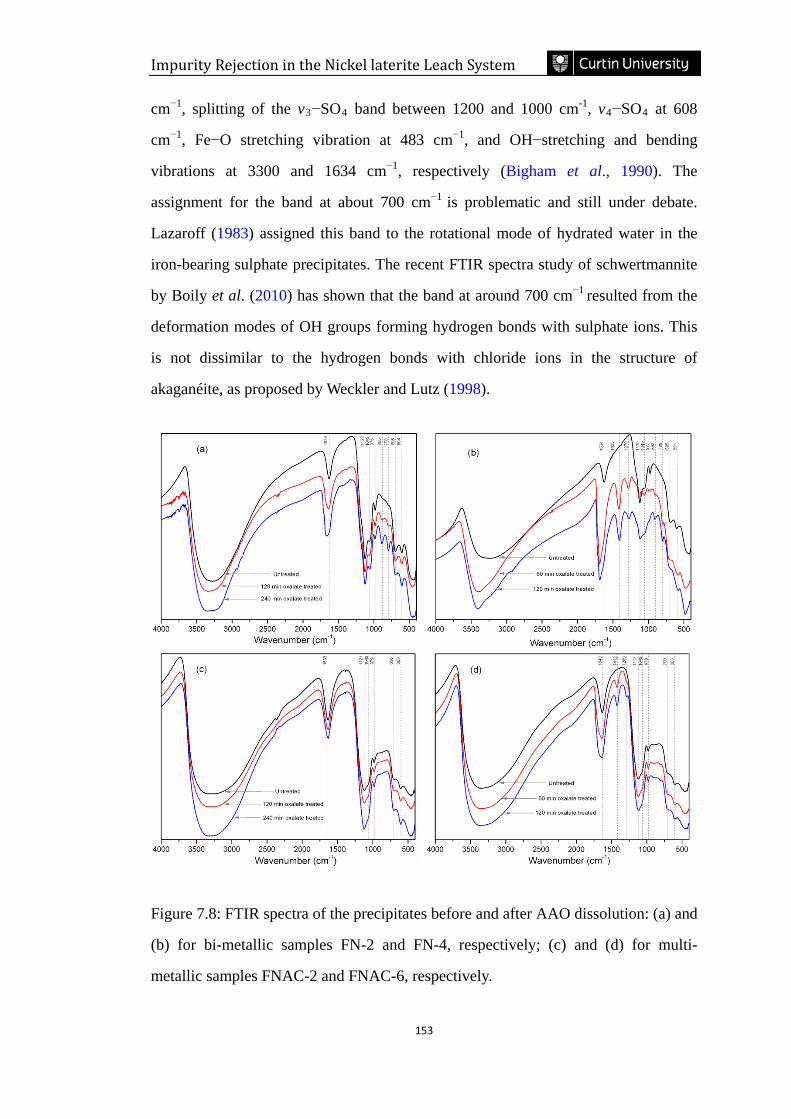
Impurity Rejection in the Nickel laterite Leach System
153
cm−1, splitting of the v3−SO4 band between 1200 and 1000 cm-1, v4−SO4 at 608
cm−1, Fe−O stretching vibration at 483 cm−1, and OH−stretching and bending
vibrations at 3300 and 1634 cm−1, respectively (Bigham et al., 1990). The
assignment for the band at about 700 cm−1 is problematic and still under debate.
Lazaroff (1983) assigned this band to the rotational mode of hydrated water in the
iron-bearing sulphate precipitates. The recent FTIR spectra study of schwertmannite
by Boily et al. (2010) has shown that the band at around 700 cm−1 resulted from the
deformation modes of OH groups forming hydrogen bonds with sulphate ions. This
is not dissimilar to the hydrogen bonds with chloride ions in the structure of
akaganéite, as proposed by Weckler and Lutz (1998).
Figure 7.8: FTIR spectra of the precipitates before and after AAO dissolution: (a) and
(b) for bi-metallic samples FN-2 and FN-4, respectively; (c) and (d) for multi-
metallic samples FNAC-2 and FNAC-6, respectively.
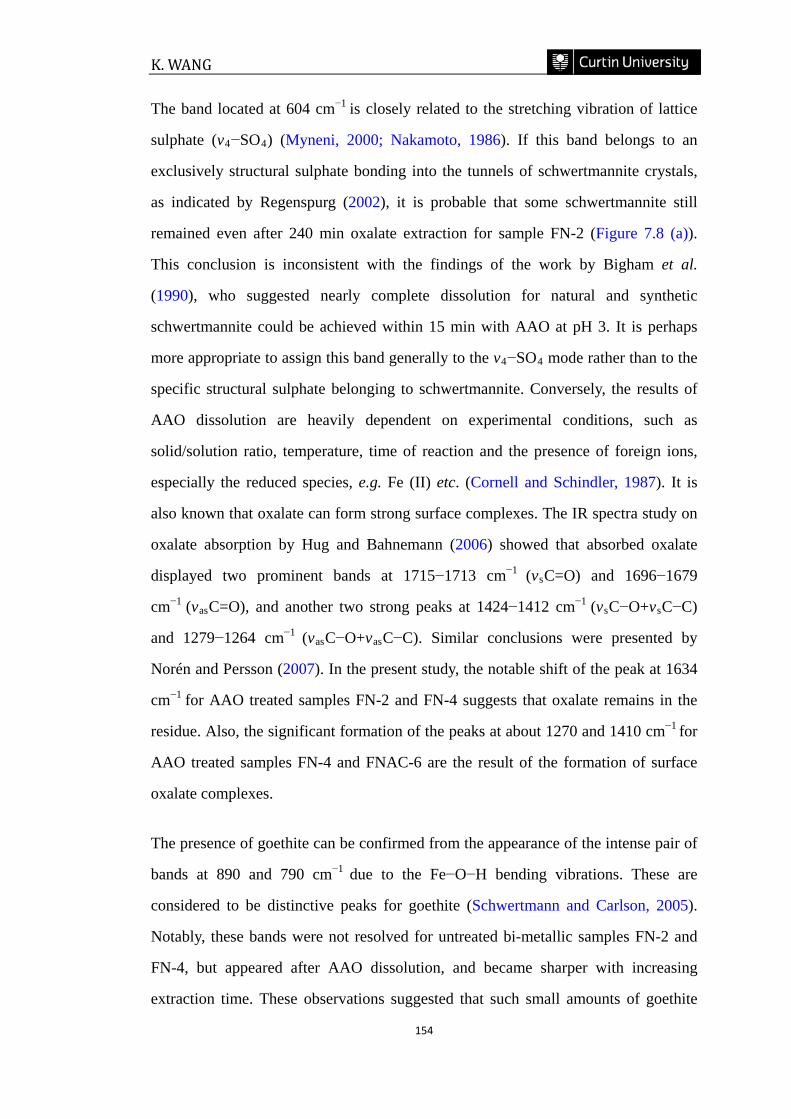
K. WANG
154
The band located at 604 cm−1 is closely related to the stretching vibration of lattice
sulphate (v4−SO4) (Myneni, 2000; Nakamoto, 1986). If this band belongs to an
exclusively structural sulphate bonding into the tunnels of schwertmannite crystals,
as indicated by Regenspurg (2002), it is probable that some schwertmannite still
remained even after 240 min oxalate extraction for sample FN-2 (Figure 7.8 (a)).
This conclusion is inconsistent with the findings of the work by Bigham et al.
(1990), who suggested nearly complete dissolution for natural and synthetic
schwertmannite could be achieved within 15 min with AAO at pH 3. It is perhaps
more appropriate to assign this band generally to the v4−SO4 mode rather than to the
specific structural sulphate belonging to schwertmannite. Conversely, the results of
AAO dissolution are heavily dependent on experimental conditions, such as
solid/solution ratio, temperature, time of reaction and the presence of foreign ions,
especially the reduced species, e.g. Fe (II) etc. (Cornell and Schindler, 1987). It is
also known that oxalate can form strong surface complexes. The IR spectra study on
oxalate absorption by Hug and Bahnemann (2006) showed that absorbed oxalate
displayed two prominent bands at 1715−1713 cm−1 (vsC=O) and 1696−1679
cm−1 (vasC=O), and another two strong peaks at 1424−1412 cm−1 (vsC−O+vsC−C)
and 1279−1264 cm−1 (vasC−O+vasC−C). Similar conclusions were presented by
Norén and Persson (2007). In the present study, the notable shift of the peak at 1634
cm−1 for AAO treated samples FN-2 and FN-4 suggests that oxalate remains in the
residue. Also, the significant formation of the peaks at about 1270 and 1410 cm−1 for
AAO treated samples FN-4 and FNAC-6 are the result of the formation of surface
oxalate complexes.
The presence of goethite can be confirmed from the appearance of the intense pair of
bands at 890 and 790 cm−1 due to the Fe−O−H bending vibrations. These are
considered to be distinctive peaks for goethite (Schwertmann and Carlson, 2005).
Notably, these bands were not resolved for untreated bi-metallic samples FN-2 and
FN-4, but appeared after AAO dissolution, and became sharper with increasing
extraction time. These observations suggested that such small amounts of goethite
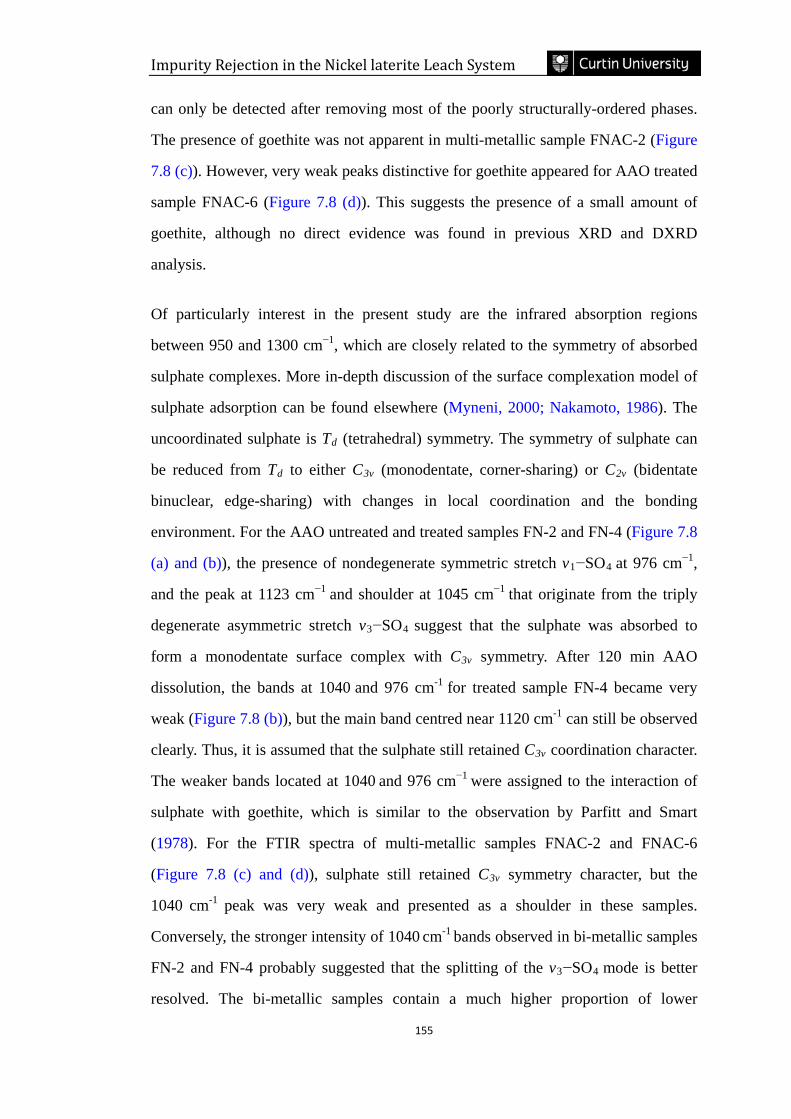
Impurity Rejection in the Nickel laterite Leach System
155
can only be detected after removing most of the poorly structurally-ordered phases.
The presence of goethite was not apparent in multi-metallic sample FNAC-2 (Figure
7.8 (c)). However, very weak peaks distinctive for goethite appeared for AAO treated
sample FNAC-6 (Figure 7.8 (d)). This suggests the presence of a small amount of
goethite, although no direct evidence was found in previous XRD and DXRD
analysis.
Of particularly interest in the present study are the infrared absorption regions
between 950 and 1300 cm−1, which are closely related to the symmetry of absorbed
sulphate complexes. More in-depth discussion of the surface complexation model of
sulphate adsorption can be found elsewhere (Myneni, 2000; Nakamoto, 1986). The
uncoordinated sulphate is Td (tetrahedral) symmetry. The symmetry of sulphate can
be reduced from Td to either C3v (monodentate, corner-sharing) or C2v (bidentate
binuclear, edge-sharing) with changes in local coordination and the bonding
environment. For the AAO untreated and treated samples FN-2 and FN-4 (Figure 7.8
(a) and (b)), the presence of nondegenerate symmetric stretch v1−SO4 at 976 cm−1,
and the peak at 1123 cm−1 and shoulder at 1045 cm−1 that originate from the triply
degenerate asymmetric stretch v3−SO4 suggest that the sulphate was absorbed to
form a monodentate surface complex with C3v symmetry. After 120 min AAO
dissolution, the bands at 1040 and 976 cm-1 for treated sample FN-4 became very
weak (Figure 7.8 (b)), but the main band centred near 1120 cm-1 can still be observed
clearly. Thus, it is assumed that the sulphate still retained C3v coordination character.
The weaker bands located at 1040 and 976 cm−1 were assigned to the interaction of
sulphate with goethite, which is similar to the observation by Parfitt and Smart
(1978). For the FTIR spectra of multi-metallic samples FNAC-2 and FNAC-6
(Figure 7.8 (c) and (d)), sulphate still retained C3v symmetry character, but the
1040 cm-1 peak was very weak and presented as a shoulder in these samples.
Conversely, the stronger intensity of 1040 cm-1 bands observed in bi-metallic samples
FN-2 and FN-4 probably suggested that the splitting of the v3−SO4 mode is better
resolved. The bi-metallic samples contain a much higher proportion of lower
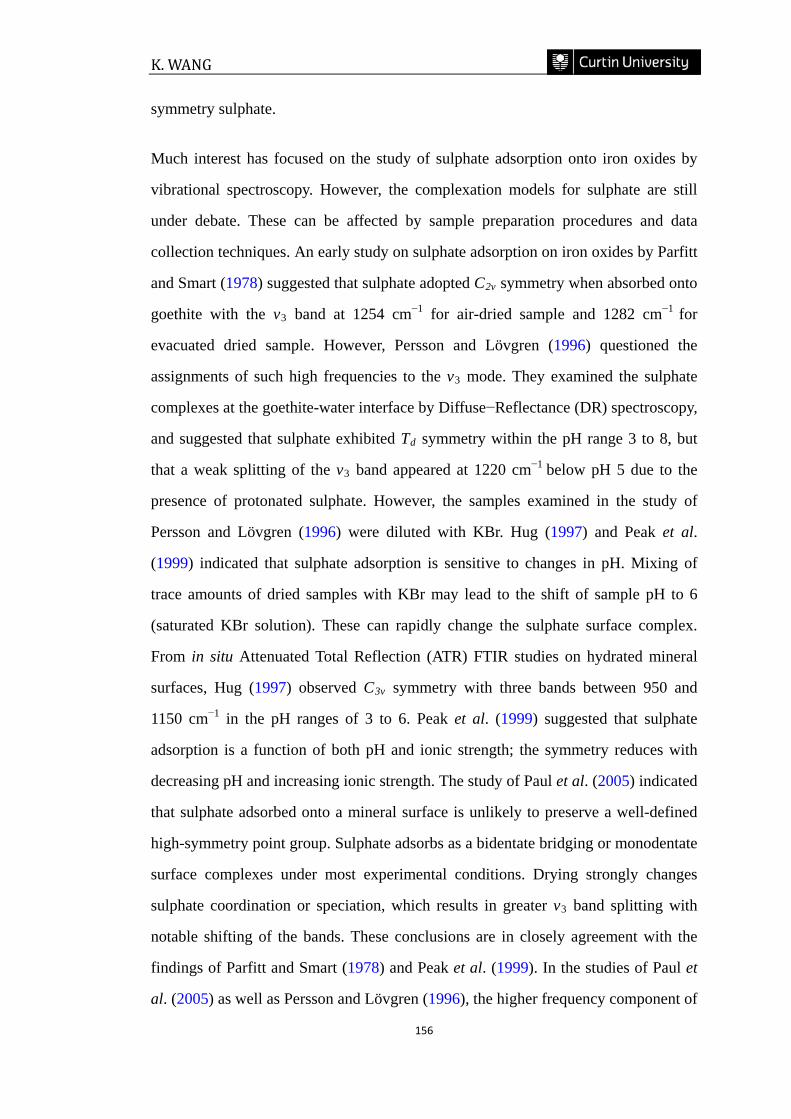
K. WANG
156
symmetry sulphate.
Much interest has focused on the study of sulphate adsorption onto iron oxides by
vibrational spectroscopy. However, the complexation models for sulphate are still
under debate. These can be affected by sample preparation procedures and data
collection techniques. An early study on sulphate adsorption on iron oxides by Parfitt
and Smart (1978) suggested that sulphate adopted C2v symmetry when absorbed onto
goethite with the v3 band at 1254 cm−1 for air-dried sample and 1282 cm−1 for
evacuated dried sample. However, Persson and Lövgren (1996) questioned the
assignments of such high frequencies to the v3 mode. They examined the sulphate
complexes at the goethite-water interface by Diffuse−Reflectance (DR) spectroscopy,
and suggested that sulphate exhibited Td symmetry within the pH range 3 to 8, but
that a weak splitting of the v3 band appeared at 1220 cm−1 below pH 5 due to the
presence of protonated sulphate. However, the samples examined in the study of
Persson and Lövgren (1996) were diluted with KBr. Hug (1997) and Peak et al.
(1999) indicated that sulphate adsorption is sensitive to changes in pH. Mixing of
trace amounts of dried samples with KBr may lead to the shift of sample pH to 6
(saturated KBr solution). These can rapidly change the sulphate surface complex.
From in situ Attenuated Total Reflection (ATR) FTIR studies on hydrated mineral
surfaces, Hug (1997) observed C3v symmetry with three bands between 950 and
1150 cm−1 in the pH ranges of 3 to 6. Peak et al. (1999) suggested that sulphate
adsorption is a function of both pH and ionic strength; the symmetry reduces with
decreasing pH and increasing ionic strength. The study of Paul et al. (2005) indicated
that sulphate adsorbed onto a mineral surface is unlikely to preserve a well-defined
high-symmetry point group. Sulphate adsorbs as a bidentate bridging or monodentate
surface complexes under most experimental conditions. Drying strongly changes
sulphate coordination or speciation, which results in greater v3 band splitting with
notable shifting of the bands. These conclusions are in closely agreement with the
findings of Parfitt and Smart (1978) and Peak et al. (1999). In the studies of Paul et
al. (2005) as well as Persson and Lövgren (1996), the higher frequency component of
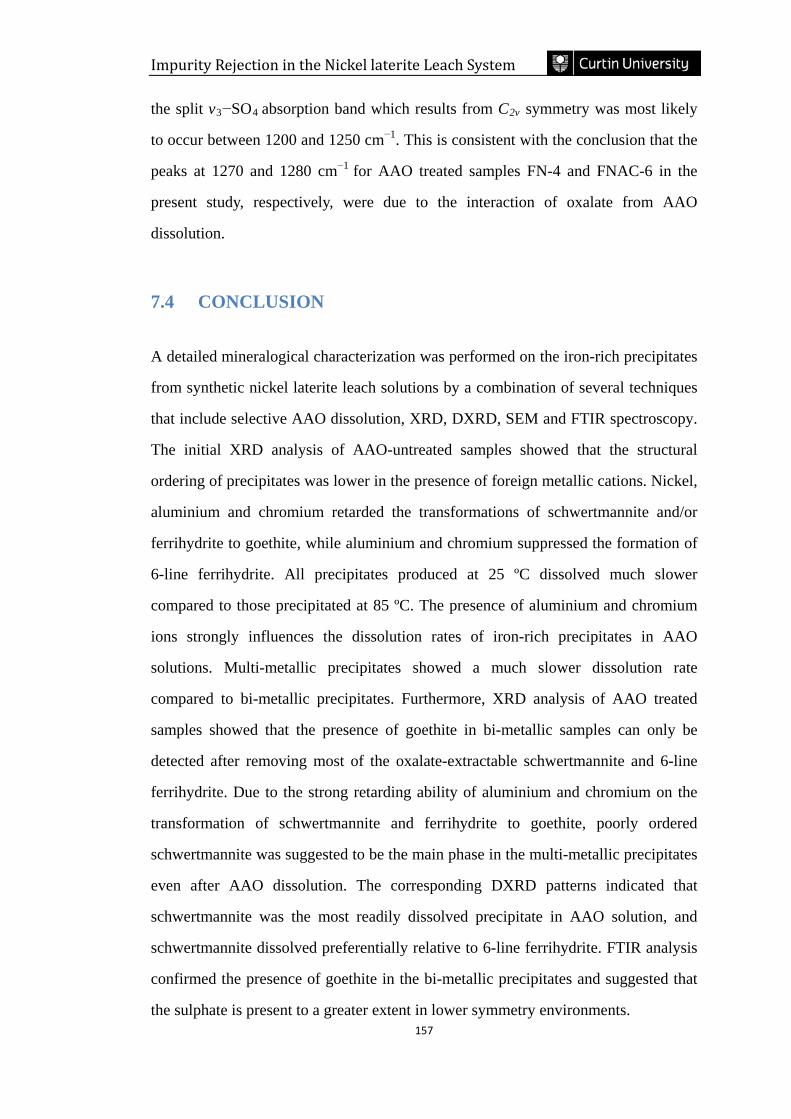
Impurity Rejection in the Nickel laterite Leach System
157
the split v3−SO4 absorption band which results from C2v symmetry was most likely
to occur between 1200 and 1250 cm−1. This is consistent with the conclusion that the
peaks at 1270 and 1280 cm−1 for AAO treated samples FN-4 and FNAC-6 in the
present study, respectively, were due to the interaction of oxalate from AAO
dissolution.
7.4 CONCLUSION
A detailed mineralogical characterization was performed on the iron-rich precipitates
from synthetic nickel laterite leach solutions by a combination of several techniques
that include selective AAO dissolution, XRD, DXRD, SEM and FTIR spectroscopy.
The initial XRD analysis of AAO-untreated samples showed that the structural
ordering of precipitates was lower in the presence of foreign metallic cations. Nickel,
aluminium and chromium retarded the transformations of schwertmannite and/or
ferrihydrite to goethite, while aluminium and chromium suppressed the formation of
6-line ferrihydrite. All precipitates produced at 25 ºC dissolved much slower
compared to those precipitated at 85 ºC. The presence of aluminium and chromium
ions strongly influences the dissolution rates of iron-rich precipitates in AAO
solutions. Multi-metallic precipitates showed a much slower dissolution rate
compared to bi-metallic precipitates. Furthermore, XRD analysis of AAO treated
samples showed that the presence of goethite in bi-metallic samples can only be
detected after removing most of the oxalate-extractable schwertmannite and 6-line
ferrihydrite. Due to the strong retarding ability of aluminium and chromium on the
transformation of schwertmannite and ferrihydrite to goethite, poorly ordered
schwertmannite was suggested to be the main phase in the multi-metallic precipitates
even after AAO dissolution. The corresponding DXRD patterns indicated that
schwertmannite was the most readily dissolved precipitate in AAO solution, and
schwertmannite dissolved preferentially relative to 6-line ferrihydrite. FTIR analysis
confirmed the presence of goethite in the bi-metallic precipitates and suggested that
the sulphate is present to a greater extent in lower symmetry environments.
K. WANG
158
CHAPTER 8
SUMMARY AND FUTURE WORK
8.1 SUMMARY
Specific conclusions have been drawn at the end of each chapter. For completeness,
further general summary are made here by combining points from the previous
conclusions. This thesis consists of three main parts: (1) theoretical investigation of
mixed iron and nickel sulphate solutions; (2) extensive experimental investigation on
the impurity-removal processes and associated nickel losses from both synthetic and
real nickel laterite AL liquors; (3) characterization of iron-rich precipitates obtained.
Although each part focused on different areas of research, these overlap with each
other. The conclusions from one part are therefore able to help answer questions
rising from others.
8.1.1 Chemical Equilibrium
A chemical equilibrium model in the Fe(III)–Ni(II)–H2SO4–H2O system was
developed with the effects of ionic strength and temperature taken into account. This
model was able to calculate the activity of hydrogen ion and corresponding pH value
at a given ionic strength and temperature in a mixed aqueous iron and nickel sulphate
solution. The modelling methodology presented can also be easily extended to
simulate other aqueous electrolyte systems. The model developed was used to
construct iron and nickel speciation diagrams, which clearly demonstrated the
changes of equilibrium relationships between ferric and nickel species. Another
important application of this model was to calculate a saturation index and predict
precipitation and dissolution behaviours of iron oxides. It was found that
schwertmannite is the dominant phase when the precipitation reaction occurs at pH
values above 2.5. This prediction was consistent with the experimental results of
Impurity Rejection in the Nickel laterite Leach System
159
subsequent chapters.
8.1.2 Impurity removal and nickel loss
Considerable effort has been put into the experimental study of the relationships
between impurities removal and nickel losses from nickel laterite AL liquors. This
was achieved by initially investigating simple synthetic leach solutions containing
Fe(III)+Ni(II), then more complicated solutions containing Fe(III)+Ni(II)+Al(III),
Fe(III)+Ni(II)+Cr(III), and Fe(III)+Ni(II)+Al(III)+Cr(III), and finally real leach
solutions. The strategy of Design of Experiments (DOE) was widely adopted
throughout these studies. A semi-batch precipitation process was used in all cases,
which is simple in design and operation. This technique used a method combining
both dilution and neutralization, which avoids directly neutralizing nickel laterite AL
liquors with high ionic concentrations in a batch process. It is also conceivable that
this process can be scaled up to a fully continuous process with several reactors
arranged in series or parallel.
From the study of the effect of iron precipitation on nickel losses in the
Fe(III)+Ni(II) binary system, the solution pH, precipitation temperature and the
initial Fe/Ni ratio in PLS were found to be the important factors affecting iron
removal efficiency and the level of nickel loss. For the Fe(III)+Ni(II)+Al(III) and
Fe(III)+Ni(II)+Cr(III) ternary systems, it was demonstrated that greater losses of
nickel to the solids occurred in the presence of aluminium and chromium. Increasing
solution pH and precipitation temperature favoured the precipitation of iron,
aluminium and chromium, but at a cost of greater nickel losses. In order to achieve
the aim of removing impurities effectively without causing significant loss of nickel,
multi-stage precipitation processes were examined by carefully controlling pH and
temperature. The optimum conditions for a multi-stage precipitation process were
found to be at pH 3 and 55 ºC in the first stage precipitation followed by a second
stage precipitation operated at pH 3 and 85 ºC. Using this multi-stage procedure, as
much as 95% iron and chromium together with more than 80% aluminium can be
K. WANG
160
removed from a synthetic AL liquor containing Fe(III)+Ni(II)+Al(III)+Cr(III), with
the level of nickel loss to solid kept to below 1%. The sludge showed a fast settling
rate of 5.05 m/h with the addition of a cationic flocculant. Similar satisfactory results
were also obtained when performing this multi-stage precipitation procedure on real
leach solutions.
The investigations of the effect of water salinity on impurities removal and nickel
losses suggest that the semi-batch precipitation method is able to process the PLS
containing high water salinity with good nickel recovery and impurities removal
efficiencies, particularly when the precipitation reactions were carried out at 85 ºC.
XRD analysis of the precipitates confirmed that the poorly structural-ordered
schwertmannite and/or ferrihydrite were the dominant phases. Natrojarosite can be
detected when the precipitation reaction is conducted at pH 2 and 85 ºC from
synthetic solution with high salinity.
8.1.3 Characterization of iron-rich precipitates
The precipitation process used in this thesis is similar to the conventional E.Z.
Goethite Process, which was original developed by Allen et al. (1970). In the
following years, many researchers suggested that the residues from E.Z. Goethite
Process contained large amounts of poorly defined basic iron sulphates and iron
oxyhydroxide rather than pure goethite precipitates (Claassen et al., 2002; Davey and
Scott, 1975; Gordon and Pickering, 1975). The conflicting reports found on this topic
are probably a result of the difficulties associated with the characterization of the
iron-rich residues with poor structural-order. Hence, an accurate and detailed
mineralogical characterization is essential to understand the nature of iron-rich
residues. The present study applied several techniques that include selective AAO
dissolution, XRD, DXRD, SEM and FTIR spectroscopy to characterize the
complicated iron-rich precipitates from synthetic atmospheric nickel laterite leach
solutions. This investigation was conducted with reference to the effects of foreign
metallic cations on crystallization, dissolution behaviour and mineralogical
Impurity Rejection in the Nickel laterite Leach System
161
properties of the precipitates. From XRD analysis of AAO-untreated samples, it was
demonstrated that nickel, aluminium and chromium retarded the transformations of
schwertmannite and/or ferrihydrite to goethite, and that aluminium and chromium
further suppressed the formation of 6-line ferrihydrite. The presence of aluminium
and chromium ions strongly influences the dissolution rates of iron-rich precipitates
in AAO solutions. XRD analysis of AAO-treated samples showed that the presence
of goethite in the bi-metallic precipitates obtained from the solution containing
Fe(III)+Ni(II) can only be detected after removing most of the oxalate-extractable
schwertmannite and 6-line ferrihydrite. Of particular interest it was found that
schwertmannite was the main phase in both AAO treated and untreated multi-
metallic precipitates that were obtained from the solution containing
Fe(III)+Ni(II)+Al(III)+Cr(III). The corresponding DXRD patterns suggested that
schwertmannite was the most readily dissolved phase in AAO solution, and that
schwertmannite dissolved preferentially relative to 6-line ferrihydrite. FTIR analysis
confirmed the presence of goethite in the bi-metallic precipitates and suggested that
the sulphate is present to a greater extent in low symmetry environments.
The results of this thesis are able to answer: (1) what are the effects of iron,
aluminium and chromium precipitation on nickel losses; (2) can a precipitation
process with desirable precipitation recoveries of impurities, acceptable level of
nickel loss to the solids, and satisfactory sludge property be developed; (3) what are
the influences of metallic cations including nickel, aluminium and chromium on the
mineralogical properties of iron-rich precipitates? The aims of this thesis, as
indicated in Chapter 1, due to improved understanding of the physicochemical
processes that occur during the precipitation of impurities from nickel laterite AL
liquors and associated nickel losses, have therefore been met.
8.2 FUTURE WORK
This thesis has made a considerable contribution to the knowledge of impurity-
K. WANG
162
removal processes and associated nickel losses from the nickel laterite atmospheric
leaching system. The following section includes suggestions for future work.
8.2.1 Chemical equilibrium modelling in concentrated solutions
In this thesis, theoretical investigation of chemical equilibrium was simplified to a
mixed sulphate system containing only ferric iron and nickel ions. The real leach
solution from atmospheric leaching of nickel laterite, however, contains various
metals other than iron and nickel, which is a concentrated multi-component system.
The ion-association approach, which was implemented to develop a speciation-based
model in this thesis, was confined to relatively low ionic strengths. However, high
concentrations come with high non-ideal thermodynamic behavior. This often brings
significant challenges in chemical modelling. The physicochemical and
thermodynamic properties of concentrated multi-component systems with high ionic
strength, needs to be further investigated. In contrast to the ion-association model,
the Pitzer ion interaction model describes the properties of solution in terms of
physicochemical interactions between free ions. The significance of this approach is
that it has a good accuracy for an electrolyte solution with ionic strength up to 10 M.
The Pitzer’s ion interaction approach requires a linear summation of a large quantity
of parameters obtained from single electrolyte solutions by fitting experimental
osmotic and activity coefficients. However, the Pitzer model has limitations in
determining the cation-anion interaction of all trace species in solutions. In this case,
the extended Pitzer model combined with an ion-paring approach would be feasible,
as noted from the speciation investigations in saline and natural water performed by
Millero et al. (1995). Alternatively, a hybrid ion-association-interaction approach, as
developed by Baghalha and Papangelakis (1998), would also be technically feasible
in describing the chemistry and thermodynamics of the participating electrolytes in
real industrial laterite leach solutions.
Impurity Rejection in the Nickel laterite Leach System
163
8.2.2 Improving the crystallization of iron-rich precipitates
Characterization of the precipitates obtained identified that schwertmannite and/or
ferrihydrite are the dominant phases. The presence of large amounts of these poorly
structural-ordered phases can result in high uptake of nickel. On the other hand,
formation of high structurally-ordered phases would have fewer defect sites for
nickel to attach. Therefore, it is worth conducting further investigation on improving
the crystallinity of precipitation residues.
The process can be conducted in a fully continuous pilot-plant scale precipitation
process, such as continuous stirred tank reactors (CSTR), which can be arranged in
parallel or series. The pregnant leach solution can be treated with multi-stage
precipitation procedures from one reactor to the next, using different combinations of
pH and temperature. The slurry produced from the last reactor can be recycled to the
first reactor to act as seed to increase the precipitation kinetics and improve
crystallinity of the precipitates. There is also the option to perform solid/liquid
separation after the first and second stages, i.e., the first via Counter Current
Decantation (CCD) and second via filtration. Underflow from CCD could be
recycled as seed and the filter cake repulped for recycle to recover nickel. Thus water
balance/usage would become a key factor in this case.
For supersaturation control, a continuous process is a far superior method to batch or
semi-batch methods. A continuous process can offer a stable supersaturation
environment rather than variable supersaturation conditions encountered in batch or
semi-batch modes. Precipitation generally occurs from a high supersaturation
solution, resulting in fast nucleation and consequent formation of a large number of
small crystals. This process can result in fragile and poorly crystalline precipitates.
Keeping a low supersaturation has the following benefits in improving precipitate
quality: avoiding the formation of large and immobile polymeric species; decreasing
the aggregation of clusters into agglomerates; facilitating the surface integration
reaction due to the larger solid/liquid interface (Demopoulos, 2009). However, there
K. WANG
164
is typically not enough time to grow large particle size precipitates. A suitable
residence time in a fully continuous process, which was beyond the scope of this
study, is required to ensure iron-rich precipitates have enough time to crystallize and
precipitate at steady state.
Improving the crystallinity of precipitates can also be achieved by adding foreign
crystalline seeds (iron oxides) directly to the reactor before the precipitation reactions
occur, which could be simply applied in the semi-batch precipitation process used in
this thesis. However, one potential problem would be the characterization of the
precipitates by XRD. Take goethite seeding as an example, it would be difficult to
identify whether the presence of goethite seed promotes the formation of further
goethite, as a higher seed loading could result in a greater intensity of the goethite
diffraction peaks. Hence, one needs to add an internal standard and perform
Quantitative X-Ray Diffraction (QXRD) to determine the goethite content of the
final iron-rich precipitates. This will require a good fit to the background and suitable
crystallographic models for the other phases. However, the presence of large amounts
of poorly structural-ordered schwertmannite and/or ferrihydrite poses a potential
problem in this approach.
In addition, the seeding of nickel laterite atmospheric leach liquor should be
investigated further to better understand the effects upon the complex precipitation
behavior of iron oxides and associated nickel loss mechanisms. This includes but is
not limited to the following:
• Study the effects of seeding on particle sizes and surface areas of precipitates
to determine whether seeding promotes the formation of larger and denser
particles with less surface area that result in less uptake of nickel.
• Study the effects of seeding on improving sludge properties such as settling
rate.
Impurity Rejection in the Nickel laterite Leach System
165
8.2.3 The effect of magnesium ions
This thesis studied the relationships between trivalent impurity ions and nickel
losses. However, real leach liquors derived from the leaching of laterite ores,
especially from the atmospheric leaching of saprolite ores, will contain a significant
amount of magnesium ions (as Mg2+). Magnesium ions are known to exert a
bisulphate “buffering” effect which is very pronounced in high temperature and
pressure acid leach systems. Even at moderate temperature under atmospheric
conditions, such as 90 to 100 ºC, the presence of significant magnesium may be
important. Hence, it is worth investigating any effect upon this important factor on
impurity rejection and nickel losses in greater detail.
8.2.4 The effect of ferrous ions
Except for the large amounts of ferric ions in nickel laterite AL liquors, ferrous ions
(as Fe2+) can also be present in various proportions relative to ferric ions, often
depending upon the nature of the ore that is leached. The removal of ferrous ions
from solution requires both oxidation and precipitation processes. The oxidation of
ferrous ions at lower pH is more difficult or slower (Morgan and Lahav, 2007). Thus,
it would be interesting to determine if the simultaneous oxidation and hydrolysis of
ferrous ions result in a higher level of nickel loss than the prior oxidation of ferrous
ions at a lower pH, followed by an increase of pH for hydrolysis. Important
parameters that would need to be taken into account are the oxidation method (i.e.
O2, H2O2, SO2/O2 or air), oxidation rate, Eh value (a function of Fe3+/Fe2+) and
catalyst (e.g. Cu2+).
A recent study by Burton et al. (2008) suggested that Fe2+ played a catalytic role in
accelerating the transformation of schwertmannite to goethite. Although this study
focused on acid-sulphate media with pH value above 5, it does give some indication
of the schwertmannite and goethite formation mechanisms. It would therefore also be
worth examining if the presence of ferrous iron affects the mineralogy of iron-rich
K. WANG
166
precipitates in the precipitation processes used in this thesis.
8.2.5 Improving dewatering and sludge properties
As good dewatering and sludge properties are critical in industrial applications,
methods for improving settling rate, sludge volume, filtration rate, cake moisture and
solids loading need to be further investigated. This study would involve the use of
effective flocculants with optimization of the amount required to increase
aggregation.
8.2.6 Test work using other neutralization agents
Although magnesia is an expensive reagent, it is still worth testing other cheaper
magnesium-containing neutralization agents, such as magnesite, dolomite and
saprolite ores. There is also scope to further examine Ca-containing reagents. The
effects of the neutralizing agent upon the solid-liquid separation properties of the
precipitates could also be considered.
8.2.7 Nickel speciation within the iron-rich precipitates
Nickel loss occurs as either co-precipitation (adsorption) or incorporation into the
structure of iron oxides. In some cases, the trace level of nickel present in iron-rich
precipitates often causes difficulty in tracking nickel by Scanning Electron
Microscopy coupled with Energy Dispersive Spectroscopy (SEM-EDS), as SEM-
EDS can only collect data from a sample’s surface to 1 µm depth with a semi-
quantitative analysis limit of 0.1 wt%.
The low level nickel uptake by iron oxides also results in only small changes in the
crystal structure and, the shape and position of XRD peaks. This makes conventional
X-ray diffraction (XRD) insensitive for the detection of discrete crystalline phases
present in amounts smaller than 1% in bulk samples. However, some high sensitivity
techniques are useful for analyzing the iron-rich samples containing trace-level
Impurity Rejection in the Nickel laterite Leach System
167
amounts of nickel. For instance, synchrotron radiation-based X-ray absorption
spectroscopy (XAS) can provide insight into the local coordination environment.
This would provide fundamental and mechanistic information on the substitution of
nickel for iron. XAS requires a high intensity X-ray source that is typically one
million times more intense than a conventional X-ray tube, and is only therefore
available at synchrotron facilities. The high intensities used for XAS make it possible
to examine most elements at concentrations down to the ppm level.
8.2.8 The mechanism of iron oxides formation
The mechanism of iron oxides (including goethite, schwertmannite and ferrihydrite)
formation from both synthetic and real AL liquors, needs to be clearly defined. This
involves investigation of the precipitation mechanisms of iron oxides that are
dominated by nucleation and aggregation, as well as the interphase-transformations.
Schwertmannite and ferrihydrite are thermodynamically unstable, and tend to
transform over time to more stable iron oxides such as goethite. However, there is no
direct evidence to confirm whether schwertmannite or ferrihydrite is a necessary
intermediate for the formation of goethite. There seems to be a balance or
competition mechanism rather than a single mechanism path. In this regard, 57Fe
Mössbauer absorption spectroscopy may be of benefit to determine the
transformation sequence. 57Fe Mössbauer absorption spectroscopy is a solid-state
nuclear probe technique that relies on the magnetic behavior of iron in a crystal
structure. The magnetic ordering in iron oxides differ considerably, which allows
Mössbauer spectroscopy to unequivocally identify and quantify various iron oxides
in mixtures (Cornell and Schwertmann, 2003). XRD is relatively insensitive to
variations in schwertmannite and ferrihydrite structures due to small particle size
and/or poor structural order. Unlike XRD, distinct spectral signals can be obtained
from both poorly and highly structural-ordered iron using 57Fe Mössbauer absorption
spectroscopy. Furthermore, Mössbauer absorption spectroscopy also provides
important information on particle size and isomorphous substitution. This may

K. WANG
168
provide further insight into the substitution mechanism(s) of metallic cations such as
nickel.
Impurity Rejection in the Nickel laterite Leach System
169
REFERENCES
Acero, P., Ayora, C., Torrentó, C. and Nieto, J.M., 2006. The behavior of trace
elements during schwertmannite precipitation and subsequent transformation into
goethite and jarosite. Geochimica et Cosmochimica Acta, 70: 4130-4139.
Agatzini-Leonardou, S. and Burkin, A.R., 1985. Statistical approach to the
precipitation of iron as 'goethite'. Transactions of the Institution of Mining and
Metallurgy Section C: Mineral Processing and Extractive Metallurgy, 94: C105-114.
Agatzini-Leonardou, S. and Dimaki, D., 2000. Method for extraction of nickel and/or
cobalt oxide ores by heap leaching with a dilute sulphuric acid solution, prepared
from sea water, at ambient temperature. Greek Patent No. 1, 003,569/2000.
Agatzini-Leonardou, S., Dimaki, D. and Boskos, E., 1997. Extraction of nickel and
cobalt from Greek low-grade nickel oxide ores by heap leaching. In: W.C. Cooper
and I. MihaylovI (Editors), Nickel-Cobalt 97 International Symposium, Sudbury,
Ontario, Canada, 489-503.
Agatzini-Leonardou, S., Tsakiridis, P.E., Oustadakis, P., Karidakis, T. and Katsiapi,
A., 2009. Hydrometallurgical process for the separation and recovery of nickel from
sulphate heap leach liquor of nickeliferrous laterite ores. Minerals Engineering, 22:
1181-1192.
Albarède, F., 1995. Introduction to geochemical modeling. Cambridge University
Press, Cambridge.
Allen, R.W., Haigh, C.J. and Hamdorf, C.J., 1970. An improved method of removing
dissolved ferric iron from iron-bearing solution. Australian Patent No. 424, 095.
Angelopoulos, P., Evangelaras, H. and Koukouvinos, C., 2009. Analyzing
K. WANG
170
unreplicated 2k factorial designs by examining their projections into k-1 factors.
Quality and Reliability Engineering International 26: 223-233.
Appelo, C.A.J. and Postma, D., 2005. Geochemistry, groundwater and pollution.
A.A. Balkema Publishers, Leiden.
Arroyo, J.C. and Neudorf, D.A., 2004. Atmospheric leach process for the recovery of
nickel and cobalt from limonite and saprolite ores. US Patent No. 6, 680, 035 B2.
Babčan, J., 1971. Synthesis of jarosite KFe3(SO4)2(OH)6. Geologicky Zbornik-
Geologica Carpathica, 22: 299-304.
Baes, C.F. and Mesmer, R.E., 1976. The hydrolysis of cations. Wiley, New York.
Baes, C.F. and Mesmer, R.E., 1981. The thermodynamics of cation hydrolysis. The
American Journal of Science, 281: 935-962.
Baghalha, M. and Papangelakis, V., 1998. The ion-association-interaction approach
as applied to aqueous H2SO4-Al2(SO4)3-MgSO4 solutions at 250°C Metallurgical
and Materials Transactions B, 29: 1021-1030.
Benjamin, M.M. and Leckie, J.O., 1981. Conceptual model for metal-ligand-surface
interactions during adsorption. Environmental Science and Technology, 15: 1050-
1057.
Beukes, J.P., Giesekke, E.W. and Elliott, W., 2000. Nickel retention by goethite and
hematite. Minerals Engineering, 13: 1573-1579.
Bienermann, G. and Schindler, P., 1957. On the solubility product of precipitated iron
(III) hydroxide. Acta Chemica Scandinavica, 11: 731-740.
Bigham, J.M., Carlson, L. and Murad, E., 1994. Schwertmannite, a new iron
Impurity Rejection in the Nickel laterite Leach System
171
oxyhydroxysulphate from Pyhäsalmi, Finland, and other localities. Mineralogical
Magazine, 58: 641-648.
Bigham, J.M. and Nordstrom, D.K., 2000. Iron and aluminum hydroxysulphates
from acid sulphate waters. In: C.N. Alpers, J.L. Jambor and D.K. Nordstrom
(Editors), Sulphate minerals: crystallography, geochemistry, and environmental
significance. Mineralogical Society of America, Washington, DC, 351-403.
Bigham, J.M., Schwertmann, U., Carlson, L. and Murad, E., 1990. A poorly
crystallized oxyhydroxysulfate of iron formed by bacterial oxidation of Fe (II) in
acid mine waters. Geochimica et Cosmochimica Acta, 54: 2743-2758.
Bigham, J.M., Schwertmann, U., Traina, S.J., Winland, R.L. and Wolf, M., 1996.
Schwertmannite and the chemical modeling of iron in acid sulfate waters.
Geochimica et Cosmochimica Acta, 60: 2111-2121.
Blakey, B.C., 1994. Synthesis and solubility of hydronium alunite under direct
sulphuric acid pressure leaching conditions. Master Thesis, University of Toronto,
Toronto.
Blakey, B.C. and Papangelakis, V.G., 1996. A study of solid-aqueous equilibria by
the speciation approach in the hydronium alunite-sulfuric acid-water system at high
temperatures. Metallurgical and Materials Transactions B, 27B: 555-566.
Blesa, M.A. and Matijević, E., 1989. Phase transformations of iron oxide,
oxohydroxides, and hydrous oxides in aqueous media. Advances in Colloid and
Interface Science, 29: 173-221.
Bodson, F.J.J., 1972. Recovery of zinc values from zinc plant residue. U.S. Patent
No. 3652264.
K. WANG
172
Boily, J.F., Gassman, P.L., Peretyazhko, T., Szanyi, J. and Zachara, J.M., 2010. FTIR
spectral components of schwertmannite. Environmental Science and Technology, 44:
1185-1190.
Bolin, N.J. and Sundkvist, J.E., 2008. Two-stage precipitation process of iron and
arsenic from acid leaching solutions. Transactions of Nonferrous Metals Society of
China, 18: 1513-1517.
Bottero, J.Y., Manceau, A., Villieras, F. and Tchoubar, D., 1994. Structure and
mechanisms of formation of iron oxide hydroxide (chloride) polymers. Langmuir,
10: 316-319.
Box, G.E.P. and Behnken, D.W., 1960. Some new three level designs for the study of
quantitative variables. Technometrics, 2: 455-475.
Box, G.E.P. and Cox, D.R., 1964. An analysis of transformations. Journal of the
Royal Statistical Society, 26B: 211-246.
Box, G.E.P., Hunter, W.G. and Hunter, J.S., 1978. Statistics for experiments: An
introduction to design, data analysis, and model building. John Wiley and Sons, Inc.,
New York.
Burkin, A.R., 2001. Chemical hydrometallurgy-theory and principles. Imperial
College Press, London.
Burton, E.D., Bush, R.T., Sullivan, L.A. and Mitchell, D.R.G., 2008. Schwertmannite
transformation to goethite via the Fe(II) pathway: Reaction rates and implications for
iron-sulfide formation. Geochimica et Cosmochimica Acta, 72: 4551-4564.
Byrne, R.H. and Kester, D.R., 1976. Solubility of hydrous ferric oxide and iron
speciation in seawater. Marine Chemistry, 4: 255-274.
Impurity Rejection in the Nickel laterite Leach System
173
Byrne, R.H. and Luo, Y.R., 2000. Direct observations of nonintegral hydrous ferric
oxide solubility products K*so=[Fe3+][H+]-2.86. Geochimica et Cosmochimica Acta,
64: 1873-1877.
Byrne, R.H., Luo, Y.R. and Young, R.W., 2000. Iron hydrolysis and solubility
revisited: observations and comments on iron hydrolysis characterizations. Marine
Chemistry, 70: 23-35.
Campbell, A.S. and Schwertmann, U., 1984. Iron oxide mineralogy of placic
horizons. Journal of Soil Science, 35: 569-582.
Caraballo, M.A., Rötting, T.S., Nieto, J.M. and Ayora, C., 2009. Sequential
extraction and DXRD applicability to poorly crystalline Fe- and Al-phase
characterization from an acid mine water passive remediation system. American
Mineralogist, 94: 1029-1038.
Carvalho-e-Silva, M.L., Ramos, A.Y., Tolentino, H.C.N., Enzweiler, J., Netto, S.M.
and Alves, M.C.M., 2003. Incorporation of Ni into natural goethite. An investigation
by X-ray absorption spectroscopy. American Mineralogist, 88: 876-882.
Casas, J.M., Alvarez, F. and Cifuentes, L., 2000. Aqueous speciation of sulfuric acid-
cupric sulfate solutions. Chemical Engineering Science, 55: 6223-6234.
Cavasino, F.P., 1968. Temperature-jump study of the kinetics of the formation of the
monosulfato complex of iron(III). The Journal of Physical Chemistry, 72: 1378-1384.
Chang, Y., Zhai, X., Li, B. and Fu, Y., 2010. Removal of iron from acidic leach liquor
of lateritic nickel ore by goethite precipitate. Hydrometallurgy, 101: 84-87.
Cifuentes, L., Casas, J.M. and Simpson, J., 2006. Temperature dependence of the
speciation of copper and iron in acidic electrolytes. Chemical Engineering Research
K. WANG
174
and Design, 84: 965-969.
Claassen, J.O., 2002. Characterisation and optimisation of the Zincor iron process.
M.Eng. Thesis, University of Pretoria.
Claassen, J.O., 2006. Product quality parameters in the reaction crystallization of
metastable iron phases from zinc-rich solutions. Ph.D Thesis, University of Pretoria.
Claassen, J.O., Meyer, E.H.O., Rennie, J. and Sandenbergh, R.F., 2002. Iron
precipitation from zinc-rich solutions defining the Zincor Process. Hydrometallurgy,
67: 87-108.
Claassen, J.O. and Sandenbergh, R.F., 2006. Particle growth parameters in the
precipitation of metastable iron phases from zinc-rich solutions. Hydrometallurgy,
84: 165-174.
Cornell, R.M., Giovanoli, R. and Schneider, W., 1989. Review of the hydrolysis of
iron(III) and the crystallization of amorphous iron (III) hydroxide hydrate. Journal of
Chemical Technology and Biotechnology, 46: 115-134.
Cornell, R.M., Giovanoli, R. and Schneider, W., 1992. The effect of nickel on the
conversion of amorphous iron (III) hydroxide into more crystalline iron oxides in
alkaline media. Journal of Chemical Technology and Biotechnology, 53: 73-79.
Cornell, R.M., Posner, A.M. and Quirk, J.P., 1976. Kinetics and mechanisms of the
acid dissolution of goethite (α-FeOOH). Journal of Inorganic and Nuclear Chemistry,
38: 563-567.
Cornell, R.M. and Schindler, P.W., 1987. Photochemical dissolution of goethite in
acid/oxalate solution. Clays and Clay Minerals, 35: 347-352.
Cornell, R.M. and Schwertmann, U., 2003. The iron oxides: structure, properties,
Impurity Rejection in the Nickel laterite Leach System
175
reactions, occurrences and uses. Wiley-VCH GmbH and Co. KGaA, Weinheim.
Crawford, R.J., Harding, I.H. and Mainwaring, D.E., 1993. Adsorption and
coprecipitation of single heavy metal ions onto the hydrated oxides of iron and
chromium. Langmuir, 9: 3050-3056.
Criss, C.M. and Cobble, J.W., 1964a. The thermodynamic properties of high
temperature aqueous solutions. IV. Entropies of the ions up to 200°C and the
correspondence principle. Journal of the American Chemical Society, 86: 5385-5390.
Criss, C.M. and Cobble, J.W., 1964b. The thermodynamic properties of high
temperature aqueous solutions. V.The calculation of ionic heat capacities up to
200°C. Entropies and heat capacities above 200°C. Journal of the American
Chemical Society, 86: 5390-5393.
Cubeddu, F., Piasentin, M., Reilly, F., Meregalli, L. and Tolomio, M., 1996. The
paragoethite process at the Enirisorse-Porto Vesme plant. In: J.E. Dutrizac and G.B.
Harris (Editors), Proceedings of the second International Symposium on Iron Control
in Hydrometallurgy. Canadian Institue of Mining, Metallurgy and Petroleum,
Ottawa, 147-161.
Dalvi, A.D., Bacon, W.G. and Osborne, R.C., 2004. The past and the future of Nickel
laterites, PDAC 2004 International Convention, Trade Show and Investors Exchange,
Toronto, 7-10.
Daniel, C., 1959. Use of half-normal plots in interpreting factorial two-level
experiments. Technometrics, 1: 311-341.
Daniele, P.G., Rigano, C., Sammartano, S. and Zelano, V., 1994. Ionic strength
dependence of formation constants-XVIII. The hydrolysis of iron (III) in aqueous
KNO3 solutions. Talanta, 41: 1577-1582.
K. WANG
176
Das, G.K., Acharya, S., Anand, S. and Das, R.P., 1996. Jarosites: a review. Mineral
Processing and Extractive Metallurgy Review, 16: 185-210.
Das, K., 1988. Single ion activities in aqueous sulfuric acid solutions: A new extra-
thermodynamic assumption. Journal of Solution Chemistry, 17: 327-336.
Davey, P.T. and Scott, T.R., 1975. Formation of β-FeOOH and α-Fe2O3 in the
Goethite Process. Transactions of the Institution of Mining and Metallurgy Section
C: Minerals Processing and Extractive Metallurgy, 84: C83-86.
Davey, P.T. and Scott, T.R., 1976. Removal of iron from leach liquors by the
"Goethite" process. Hydrometallurgy, 2: 25-33.
Davies, C.W., 1962. Ion Association. Butterworths, London.
Demopoulos, G.P., 2009. Aqueous precipitation and crystallization for the production
of particulate solids with desired properties. Hydrometallurgy, 96: 199-214.
Diakonov, I.I., 1998. Thermodynamic properties of iron oxides and hydroxides; III,
Surface and bulk thermodynamic properties of lepidocrocite (γ-FeOOH) to 500 K.
European Journal of Mineralogy, 10: 31-41.
Dickson, A.G., Wesolowski, D.J., Palmer, D.A. and Mesmer, R.E., 1990.
Dissociation constant of bisulfate ion in aqueous sodium chloride solutions to 250
degree C. The Journal of Physical Chemistry, 94: 7978-7985.
Dirksen, J.D. and Ring, T.A., 1991. Fundamentals of crystallization kinetic effects on
particle size distributions and morphology. Chemical Engineering Science, 46: 2389-
2472.
Dold, B., 2003a. Dissolution kinetics of schwertmannite and ferrihydrite in oxidized
mine samples and their detection by differential X-ray diffraction (DXRD). Applied
Impurity Rejection in the Nickel laterite Leach System
177
Geochemistry, 18: 1531-1540.
Dold, B., 2003b. Speciation of the most soluble phases in a sequential extraction
procedure adapted for geochemical studies of copper sulfide mine waste. Journal of
Geochemical Exploration, 80: 55-68.
Dousma, J., den Ottelander, D. and de Bruyn, P.L., 1979. The influence of sulfate
ions on the formation of iron(III) oxides. Journal of Inorganic and Nuclear
Chemistry, 41: 1565-1568.
Dutrizac, J.E., 1987. An overview of iron precipitation in hydrometallurgy. In: G.L.
Strathdee, M.O. Klein and L.A. Melis (Editors), Crystallization and Precipiation.
Pergamon Press, Saskatoon, Canda, 259-283.
Dutrizac, J.E. and Chen, T.T., 2004. Factors affecting the incorporation of cobalt and
nickel in jarosite-type compounds. Canadian Metallurgical Quartely, 43: 305-320.
Dutrizac, J.E. and Dinardo, O., 1983. The co-precipitation of copper and zinc with
lead jarosite. Hydrometallurgy, 11: 61-78.
Dutrizac, J.E. and Jambor, J.L., 2000. Jarosites and their application in
hydrometallurgy. In: C.N. Alpers, J.L. Jambor and D.K. Nordstrom (Editors),
Sulphate minerals: crystallography, geochemistry, and environmental significance.
Mineralogical Society of America, Washington, 405-452.
Dutrizac, J.E. and Kaiman, S., 1976. Synthesis and properties of jarosite-type
compounds. The Canadian Mineralogist, 14: 151-158.
Eggleton, R.A. and Fitzpatrick, R.W., 1988. New data and a revised structural model
for ferrihydrite. Clays and Clay Minerals, 36: 111-124.
España, J.S., 2007. Chapter 7 - The behavior of iron and aluminum in acid mine
K. WANG
178
drainage: speciation, mineralogy, and environmental significance. In: M.L. Trevor
(Editor), Thermodynamics, Solubility and Environmental Issues. Elsevier,
Amsterdam, 137-150.
Filippou, D., Demopoulos, G.P. and Papangelakis, V.G., 1995. Hydrogen ion
activities and species distribution in mixed metal sulfate aqueous systems. AIChE
Journal, 41: 171-184.
Flynn, C.M., 1984. Hydrolysis of inorganic iron(III) salts. Chemical Reviews, 84:
31-41.
Fox, L.E., 1988. The solubility of colloidal ferric hydroxide and its relevance to iron
concentrations in river water. Geochimica et Cosmochimica Acta, 52: 771-777.
Galster, H., 1991. pH Measurement: fundamentals, methods, applications,
instrumentation VCH Verlagsgesllschaft mbH, Weinheim.
Garside, J., 1985. Industrial crystallization from solution. Chemical Engineering
Science, 40: 3-26.
Giovanoli, R. and Cornell, R.M., 1992. Crystallization of metal substituted
ferrihydrites. Zeitschrift für Pflanzenernährung und Bodenkunde, 155: 455-460.
Gordon, A. and Pickering, R., 1975. Improved leaching technologies in the
electrolytic zinc industry. Metallurgical and Materials Transactions B, 6B: 43-53.
Gregory, J., 1985. The action of polymeric flocculants in flocculation, sedimentation
and consolidation. In: B.M. Moudgil and P. Somasundaran (Editors), Flocculation,
sedimentation and consolidation: Proceedings of the Engineering Foundation
Conference. American Institute of Chemical Engineers, Sea Island, Georgia, 125-
137.
Impurity Rejection in the Nickel laterite Leach System
179
Guise, L. and Castro, F., 1996. Iron, aluminium and chromium co-elimination by
hydrolytic precipitation from nickel- and cobalt-containing sulphuric acid solutions.
In: J.E. Dutrizac and G.B. Harris (Editors), Iron control and disposal: proceedings of
the Second International Symposium on Iron Control in Hydrometallurgy. Canadian
Institute of Mining, Metallurgy and Petroleum, Ottawa, 275-286.
Gupta, G.K. and Mukherjee, T.K., 1990. Hydrometallurgy in extraction processes,
Volume II. CRC Press, Florida.
Gustafsson, J.P., 2011. Visual MINTEQ ver. 3.0, Availabe from:
<http://www2.lwr.kth.se/English/OurSoftware/vminteq/index.html> [Accessed: 10
January 2012].
Han, K.N., Narita, E. and Lawson, F., 1982. The coprecipitation behavior of Co (II)
and Ni (II) with Fe (III), Cr (III) and Al (III) from aqueous ammoniacal solutions.
Hydrometallurgy, 8: 365-377.
Helgeson, H.C., 1967. Thermodynamics of complex dissociation in aqueous solution
at elevated temperatures. The Journal of Physical Chemistry, 71: 3121-3136.
Hixson, A.W. and Crowell, J.H., 1931. Dependence of reaction velocity upon surface
and agitation. Industrial and Engineering Chemistry, 23: 923-931.
Hoak, R.D. and Sindlinger, C.J., 1949. New technique for waste pickle liquor
neutralization. Industrial and Engineering Chemistry, 41: 65-70.
Hsu, P.H. and Marion, G., 1985. The solubility product of goethite. Soil Science,
140: 344-351.
Hug, S.J., 1997. In situ Fourier transform infrared measurements of sulfate
adsorption on hematite in aqueous solutions. Journal of Colloid and Interface
K. WANG
180
Science, 188: 415-422.
Hug, S.J. and Bahnemann, D., 2006. Infrared spectra of oxalate, malonate and
succinate adsorbed on the aqueous surface of rutile, anatase and lepidocrocite
measured with in situ ATR-FTIR. Journal of Electron Spectroscopy and Related
Phenomena, 150: 208-219.
Jackson, K.J. and Helgeson, H.C., 1985. Chemical and thermodynamic constraints
on the hydrothermal transport and deposition of tin: I. Calculation of the solubility of
cassiterite at high pressures and temperatures. Geochimica et Cosmochimica Acta,
49: 1-22.
Jambor, J.L. and Dutrizac, J.E., 1998. Occurrence and constitution of natural and
synethetic ferrihydrite, a widespread iron oxyhydroxide. Chemical Reviews, 98:
2549-2585.
Janney, D.E., Cowley, J.M. and Buseck, P.R., 2000. Structure of synthetic 2-line
ferrihydrite by electron nanodiffraction. American Mineralogist, 85: 1180-1187.
Jarvinen, G.D., 2008. Precipitation crystallization processes In: R.G. Wymer, D.S.
Kosson, C. Atkins-Duffin, D. DePaoli, K. Higley and T. Todd (Editors), Short
Course: Introduction to Nuclear Chemistry and Fuel Cycle Separations. Vanderbilt
University School of Engineering. Department of Civil and Environmental
Engineering, Nashville.
Johnson, J.A., McDonald, R.G., Whittington, B.I., Quan, L.P. and Muir, D.M., 2002.
Process water salinity effects in the pressure leaching of Cawse nickel laterite ores.
In: M.L. Peek and G. Van Weert (Editors), Chloride Metallurgy, Vol. 1. CIM,
Montreal, 339-354.
Johnson, K.S. and Pytkowicz, R.M., 1979. Activity coefficients in electrolyte
Impurity Rejection in the Nickel laterite Leach System
181
solutions: Vol 2. CRC Press, Boca Raton, Florida.
Jolivet, J.P., Chanéac, C. and Tronc, E., 2004. Iron oxide chemistry. From molecular
clusters to extended solid networks. Chemical Communications: 481-487.
Jönsson, J., Persson, P., Sjöberg, S. and Lövgren, L., 2005. Schwertmannite
precipitated from acid mine drainage: phase transformation, sulphate release and
surface properties. Applied Geochemistry, 20: 179-191.
Kabai, J., 1973. Determination of specific activation energies of metal oxides and
metal oxide hydrates by measurement of the rate of dissolution. Acta Chimica
Academiae Scientiarum Hungaricae, 78: 57-73.
Kaur, N., Singh, B. and Kennedy, B.J., 2010. Dissolution of Cr, Cd, Zn and Pb
single- and multi-metal substituted goethite: relation to structural and morphological
properties. Clays and Clay Minerals, 58: 415-430.
Kawano, M. and Tomita, K., 2001. Geochemical modeling of bacterially induced
mineralization of schwertmannite and jarosite in sulfuric acid spring water. American
Mineralogist, 86: 1156-1165.
Kenttämaa, J., 1958. A cryoscopic study of ionic association in bivalent metal
sulphates using saturated aqueous solutions. Acta Chemica Scandinavica, 12: 1323-
1329.
Kiyama, M. and Takada, T., 1973. The hydrolysis of ferric complexes. magnetic and
spectrophotometric studies of aqueous solutions of ferric salts. Bulletin of the
Chemical Society of Japan, 46: 1680-1686.
Knight, R.J. and Sylva, R.N., 1974. Precipitation in hydrolysed iron (III) solutions.
Journal of Inorganic and Nuclear Chemistry, 36: 591-574.

K. WANG
182
Köse, C.H. and Topkaya, Y.A., 2011. Hydrometallurgical processing of nontronite
type lateritic nickel ores by MHP process. Minerals Engineering, 24: 396-415.
Landers, M. and Gilkes, R.J., 2007. Dehydroxylation and dissolution of nickeliferous
goethite in New Caledonian lateritic Ni ore. Applied Clay Science, 35: 162-172.
Landers, M., Gilkes, R.J. and Wells, M., 2009. Dissolution kinetics of
dehydroxylated nickeliferous goethite from limonitic lateritic nickel ore. Applied
Clay Science, 42: 615-624.
Lazaroff, N., 1983. The exclusion of D2O from the hydration sphere of
FeSO4−7H2O oxidized by thiobacillus ferrooxidans. Science, 222: 1331-1334.
Lewis, D. and Cardile, C., 1989. Hydrolysis of Fe III solution to hydrous iron oxides.
Australian Journal of Soil Research, 27: 103-115.
Lewis, D.G. and Schwertmann, U., 1979. The influence of Al on iron oxides. Part III.
Preparation of Al goethites in M KOH. Clay Minerals, 14: 115-126.
Lim-Nunez, R. and Gilkes, R.J., 1987. Acid dissolution of synthetic metal-containing
goethite and hematites. In: L.G. Schultz, H.V. Olphen and F.A. Mumpton (Editors),
Proceedings of the International Clay Conference. The Clay Minerals Society,
Denver, 197-204.
Lindsay, W.L., 1979. Chemical equilibria in soils. Wiley Interscience New York.
Lister, M.W. and Rivington, D.E., 1955. Ferric sulphate complexes, and ternary
complexes with thiocyanate ions. Canadian Journal of Chemistry, 33: 1591-1602.
Liu, H., 2003. Atmospheric pressure leach process for lateritic nickel ore. World
Patent 2003/093517 A1.
Impurity Rejection in the Nickel laterite Leach System
183
Liu, H., 2006. An improved process for heap leaching of nickeliferous oxidic ores.
World Patent 2006/119559 A1.
Liu, H. and Papangelakis, V.G., 2005. Chemical modeling of high temperature
aqueous processes. Hydrometallurgy, 79: 48-61.
Liu, H. and Reynolds, G.A., 2011. Process for atmospheric leaching of laterite ores
using hypersaline leach solution. US Patent No. 2011/0056333 A1.
Liu, X. and Millero, F.J., 1999. The solubility of iron hydroxide in sodium chloride
solutions. Geochimica et Cosmochimica Acta, 63: 3487-3497.
Lo, B. and Waite, T.D., 2000. Structure of Hydrous Ferric Oxide Aggregates. Journal
of Colloid and Interface Science, 222: 83-89.
Loan, M., 2004. The paragoethite process: fundamentals of ferrihydrite,
schwertmannite and goethite precipitation. Ph.D Thesis, Curtin University.
Loan, M., Cowley, J.M., Hart, R. and Parkinson, G.M., 2004. Evidence on the
structure of synthetic schwertmannite. American Mineralogist, 89: 1735-1742.
Loan, M., Newman, O.M.G., Cooper, R.M.G., Farrow, J.B. and Parkinson, G.M.,
2006. Defining the Paragoethite process for iron removal in zinc hydrometallurgy.
Hydrometallurgy, 81: 104-129.
Loan, M., St.Pierre, T.G., Parkinson, G.M., Newman, O.M.G. and Farrow, J.B.,
2002. Identifying nanoscale ferrihydrite in hydrometallurgical residues. Journal of
Metals, 54: 40-43.
Lowenhaupt, H.E., Litz, J.E. and Howe, D.L., 1985. Methods of recovering nickel
from laterite ores. US Patent No. 4548794.
K. WANG
184
Majzlan, J., Navrotsky, A. and Schwertmann, U., 2004. Thermodynamics of iron
oxides: Part III. Enthalpies of formation and stability of ferrihydrite (~Fe(OH)3),
schwertmannite (~FeO(OH)3/4(SO4)1/8), and ε-Fe2O3. Geochimica et Cosmochimica
Acta, 68: 1049-1059.
Mangravite, F., Leitz, C. and Galick, P., 1985. Organic polymeric flocculants: Effect
of charge density, molecular weight and particle concentration. In: B.M. Moudgil and
P. Somasundaran (Editors), Flocculation, sedimentation and consolidation:
Proceedings of the Engineering Foundation Conference. American Institute of
Chemical Engineers, Sea Island, Georgia, 139-158.
Manov, G.G., Bates, R.G., Hamer, W.J. and Acree, S.F., 1943. Values of the constants
in the Debye-Hückel Equation for activity coefficients. Journal of the American
Chemical Society, 65: 1765-1767.
Marshall, W.L. and Jones, E.V., 1966. Second dissociation constant of sulfuric acid
from 25 to 350° Evaluated from solubilities of calcium sulfate in sulfuric acid
solutions. The Journal of Physical Chemistry, 70: 4028-4040.
Martell, A.E. and Smith, R.M., 1977. Critical stability constants. Plenum Press, New
York.
Matijević, E., Sapieszko, R.S. and Melville, J.B., 1975. Ferric hydrous oxide sols I.
Monodispersed basic iron(III) sulfate particles. Journal of Colloid and Interface
Science, 50: 567-581.
Mayhew, K., Mean, R., O’Connor, L. and Williams, T., 2009. Nickel and cobalt
recovery from Mesaba concentrate, Proceedings of the 14th Annual ALTA
Nickel/Cobalt Conference. ALTA Metallurgical Services, Perth, Australia.
McCristal, T.G. and Manning, J., 1998. Conversion of the Pasminco Hobart smelter
Impurity Rejection in the Nickel laterite Leach System
185
to para-goethite. In: J.E. Dutrizac, J.A. Gonzales, G.L. Bolton and P. Hancock
(Editors), Zinc and Lead Processing. The Metallurgical Society of CIM, Montreal,
439-453.
McDonald, R.G. and Whittington, B.I., 2008a. Atmospheric acid leaching of nickel
laterites review Part I. Sulphuric acid technologies. Hydrometallurgy, 91: 35-55.
McDonald, R.G. and Whittington, B.I., 2008b. Atmospheric acid leaching of nickel
laterites review. Part II. Chloride and bio-technologies. Hydrometallurgy, 91: 56-69.
Meyer, E.H.O., Howard, G., Heagele, R. and Beck, R.D., 1996. Iron control and
removal at the Zinc Corporation of South Africa. In: J.E. Dutrizac and G.B. Harris
(Editors), Proceedings of the Second International Symposium on Iron Control in
Hydrometallurgy. Canadian Institue of Mining, Metallurgy and Petroleum, Ottawa,
163-182.
Michel, F.M., Barrón, V., Torrent, J., Morales, M.P., Serna, C.J., Boilye, J.F., Liu, Q.,
Ambrosini, A., Cismasu, A.C. and Brown Jr., G.E., 2010. Ordered ferrimagnetic form
of ferrihydrite reveals links among structure, composition, and magnetism.
Proceedings of the National Academy of Science of the United States of America,
107: 2787-2792.
Michel, F.M., Ehm, L., Antao, S.M., Lee, P.L., Chupas, P.J., Liu, G., Strongin, D.R.,
Schoonen, M.A.A., Phillips, B.L. and Parise, J.B., 2007. The structure of ferrihydrite,
a nanocrystalline material. Science 316: 1726-1729.
Millero, F.J. and Pierrot, D., 2007. The activity coefficients of Fe(III) hydroxide
complexes in NaCl and NaClO4 solutions. Geochimica et Cosmochimica Acta, 71:
4825-4833.
Millero, F.J., Yao, W. and Aicher, J., 1995. The speciation of Fe(II) and Fe(III) in
K. WANG
186
natural waters. Marine Chemistry, 50: 21-39.
Misawa, T., Hashimoto, K. and Shimodaira, S., 1974. The mechanism of formation
of iron oxide and oxyhydroxides in aqueous solutions at room temperature.
Corrosion Science, 14: 131-149.
Missen, R.W., Mins, C.A. and Saville, B.A., 1999. Introduction to chemical reaction
engineering and kinetics. John Wiley and Sons, Inc., Toronto.
Montgomery, D.C., 2005. Design and analysis of experiments John Wiley and Sons,
Inc., Hoboken, New Jersey.
Morgan, B. and Lahav, O., 2007. The effect of pH on the kinetics of spontaneous
Fe(II) oxidation by O2 in aqueous solution-basic principles and a simple heuristic
description. Chemosphere, 68: 2080-2084.
Mullin, J.W., 2001. Crystallization. Elsevier Butterworth-Heinemann, London.
Murad, E. and Rojík, P., 2003. Iron-rich precipitates in a mine drainage environment:
Influence of pH on mineralogy. American Mineralogist, 88: 1915-1918.
Musić, S., Orehovec, Z. and Popović, S., 1994. Structural properties of precipitates
formed by hydrolysis of Fe3+ ions in Fe2(SO4)3 solutions. Journal of Materials
Science, 29: 1991-1998.
Myers, R.H. and Montgomery, D.C., 2002. Response surface methodology: process
and product optimization using designed experiments. John Wiley and Sons, Inc.,
New York.
Myneni, S.C.B., 2000. X-ray and vibrational spectroscopy of sulfate in earth
materials. Reviews in Mineralogy and Geochemistry, 40: 113-172.

Impurity Rejection in the Nickel laterite Leach System
187
Nakamoto, K., 1986. Infrared and Raman spectra of inorganic and coordination
compounds. John Wiley and Sons, New York.
Norén, K. and Persson, P., 2007. Adsorption of monocarboxylates at the
water/goethite interface: The importance of hydrogen bonding. Geochimica et
Cosmochimica Acta, 71: 5717-5730.
Oustadakis, P., Agatzini-Leonardou, S. and Tsakiridis, P.E., 2006. Nickel and cobalt
precipitation from sulphate leach liquor using MgO pulp as neutralizing agent.
Minerals Engineering, 19: 1204-1211.
Papangelakis, V.G. and Demopoulos, G.P., 1990. Acid pressure oxidation of
arsenopyrite: I. Reaction chemistry. Canadian Metallurgical Quarterly, 29: 1-12.
Papangelakis, V.G., Liu, H. and Rubisov, D.H., 2004. Solution chemistry and reactor
modelling of the PAL-process: Successes and challenges, in International Laterite
Nickel Symposium-2004 (ed: W P Imrie), 289-305
Parfitt, R.L. and Smart, R.S.C., 1978. The mechanism of sulphate adsorption on iron
oxides. Soil Science Society of America Journal, 42: 48-50.
Parida, K.M. and Das, J., 1996. Studies on ferric oxide hydroxides. Part 1 Effect
of sulfate ions on the formation and physico-chemical properties of ferric oxide
hydroxides prepared by a homogeneous precipitation method. Journal of Materials
Science, 29: 1991-1998.
Parks, G.A., 1965. The isoelectric points of solid oxides, solid hydroxides, and
aqueous hydroxo complex systems. Chemical Reviews, 65: 177-198.
Paul, K.W., Borda, M.J., Kubicki, J.D. and Sparks, D.L., 2005. Effect of dehydration
on sulfate coordination and speciation at the Fe-(Hydr)oxide-water interface: A
K. WANG
188
molecular orbital/density functional theory and fourier transform infrared
spectroscopic investigation. Langmuir, 21: 11071-11078.
Peak, D., Ford, R.G. and Sparks, D.L., 1999. An in situ ATR-FTIR investigation of
sulfate bonding mechanisms on goethite. Journal of Colloid and Interface Science,
218: 289-299.
Perrier, N., Gilkes, R.J. and Colin, F., 2006. Heating Fe oxide-rich soils increases the
dissolution rate of metal. Clays and Clay Minerals, 54: 165-175.
Persson, P. and Lövgren, L., 1996. Potentiometric and spectroscopic studies of
sulfate complexation at the goethite-water interface. Geochimica et Cosmochimica
Acta, 60: 2789-2799.
Pitzer, K.S., 1991. Activity coefficients in electrolyte solutions. CRC Press, Boca
Raton, Florida.
Pivovarov, S., 2005. Modeling of ionic equilibria of trace metals (Cu2+, Zn2+, Cd2+)
in concentrated aqueous electrolyte solutions at 25°C. Journal of Colloid and
Interface Science, 291: 421-432.
Plyasunova, N.V., Zhang, Y. and Muhammed, M., 1998. Critical evaluation of
thermodynamics of complex formation of metal ions in aqueous solutions. IV.
Hydrolysis and hydroxo-complexes of Ni2+ at 298.15 K. Hydrometallurgy, 48: 43-63.
Pollard, R.J., Cardile, C.M., Lewis, D.G. and Brown, L.J., 1992. Characterization of
FeOOH polymorphs and ferrihydrite using low-temperature, applied-field,
Mössbauer spectroscopy. Clay Minerals, 27: 57-71.
Rafal, M., Berthold, J.W., Scrivner, N.C. and Grise, S.L., 1995. Models for
electrolyte solutions. In: S.I. Sandler (Editor), Models for thermodynamics and phase
Impurity Rejection in the Nickel laterite Leach System
189
equilibria calculations. Marcel Dekker, New York, 601-670.
Rancourt, D.G. and Meunier, J.F., 2008. Constraints on structural models of
ferrihydrite as a nanocrystalline material. American Mineralogist, 93: 1412-1417.
Regenspurg, S., 2002. Characterisation of schwertmannite geochemical interactions
with arsenate and chromate and significance in sediments of lignite opencast lakes.
Ph.D Thesis, Universität Bayreuth.
Roche, E.G., 2009. Iron precipitation. World Patent 2009/155651 A1.
Rubisov, D.H. and Papangelakis, V.G., 2000. Sulphuric acid pressure leaching of
laterites-speciation and prediction of metal solubilities “at temperature”.
Hydrometallurgy, 58: 13-26.
Sánchez-España, J., Yusta, I. and Diez-Ercilla, M., 2011. Schwertmannite and
hydrobasaluminite: A re-evaluation of their solubility and control on the iron and
aluminium concentration in acidic pit lakes. Applied Geochemistry, 26: 1752-1774.
Sapieszko, R.S., Patel, R.C. and Matijević, E., 1977. Ferric hydrous oxide sols. 2.
Thermodynamics of aqueous hydroxo and sulfato ferric complexes. Journal of
Physical Chemistry, 81: 1061-1068.
Schneide, W., 1984. Hydrolysis of iron(III)-chaotic olation versus nucleation.
Comments on Inorganic Chemistry, 3: 205-223.
Schroth, A.W. and Parnell Jr, R.A., 2005. Trace metal retention through the
schwertmannite to goethite transformation as observed in a field setting, Alta Mine,
MT. Applied Geochemistry, 20: 907-917.
Schulze, D.G., 1981. Identification of soil iron oxide minerals by differential X-ray
diffraction. Soil Science Society of America Journal, 45: 437-440.
K. WANG
190
Schulze, D.G., 1986. Correction of mismatches in 2θ scales during differential X-ray
diffraction. Clays and Clay Minerals, 34: 681-685.
Schwertmann, U., 1991. Solubility and dissolution of iron oxide. Plant and Soil, 130:
1-25.
Schwertmann, U. and Carlson, L., 2005. The pH-dependent transformation of
schwertmannite to goethite at 25°C. Clay Minerals, 40: 63-66.
Schwertmann, U. and Cornell, R.M., 2000. Iron oxides in the laboratory: preparation
and characterization (second edition). Wiley-VCH GmbH and Co. KGaA, Weiheim.
Schwertmann, U., Friedl, J. and Stanjek, H., 1999. From Fe (III) ions to ferrihydrite
and then to hematite. Journal of Colloid and Interface Science, 209: 215-223.
Schwertmann, U., Gasser, U. and Sticher, H., 1989. Chromium-for-iron substitution
in synthetic goethites. Geochimica et Cosmochimica Acta, 53: 1293-1297.
Schwertmann, U. and Murad, E., 1983. Effect of pH on the formation of goethite and
hematite from ferrihydrite. Clays and Clay Minerals, 31: 277-284.
Schwertmann, U., Schulze, D.G. and Murad, E., 1982. Identification of ferrihydrite
in soils by dissolution kinetics, differential X-ray diffraction, and Mössbauer
spectroscopy. Soil Science Society of America Journal, 46: 869-875.
Seyssiecq, I., Veesler, S., Boistelle, R. and Lamérant, J.M., 1998. Agglomeration of
gibbsite Al(OH)3 crystals in Bayer liquors. Influence of the process parameters.
Chemical Engineering Science, 53: 2177-2185.
Singh, B. and Gilkes, R.J., 1992. Properties and distribution of iron oxides and their
association with minor elements in the soils of south-western Australia. Journal of
Soil Science, 43: 77-98.
Impurity Rejection in the Nickel laterite Leach System
191
Singh, B., Sherman, D.M., Gilkes, R.J., Wells, M.A. and Mosselmans, J.F.W., 2002.
Incorporation of Cr, Mn and Ni into goethite (α-FeOOH): mechanism from extended
X-ray absorption fine structure spectroscopy. Clay Minerals, 37: 639-649.
Sipos, P., Bódi, I., May, P.M. and Hefter, G.T., 1997. The ionic product of water in
concentrated tetramethylammonium chloride solutions. Talanta, 44: 617-620.
Söhnel, O. and Garside, J., 1992. Precipitation basic principles and industrial
applications. Butterworth-Heinemann Ltd, Oxford.
Steemson, M. and Smith, M., 2009. The development of nickel laterite heap leach
projects, Proceedings of the 14th Annual ALTA Nickel/Cobalt Conference. ALTA
Metallurgical Services, Perth, Australia.
Stefánsson, A., 2007. Iron(III) hydrolysis and solubility at 25 °C. Environmental
Science and Technology, 41: 6117-6123.
Stipp, S.L., 1990. Speciation in the iron(II)-iron(III)-sulfate-water system at
25.degree.C and low pH: sensitivity of an equilibrium model to uncertainties.
Environmental Science and Technology, 24: 699-706.
Stumm, W., Furrer, G., Wieland, E. and Zinder, B., 1985. The effect of complex-
forming ligands on the dissolution of oxides and aluminosilicates. In: J.I. Drever
(Editor), The Chemistry of Weathering, Dordrecht, Netherlands, 55-74.
Sundkvist, J.E., 2002. Method of purifying acid leaching solution by precipitation
and oxidation. US Patent No. 6, 406, 676 B1.
Tödheide, K., 1972. Water at high temperature and pressure. In: F. Franks (Editor),
Water. A Comprehensive Treatise. Plenum Press, New York, 1972-1975.
Towe, K.M. and Bradley, W.F., 1967. Mineralogical constitution of colloidal
K. WANG
192
"hydrous ferric oxides". Journal of Colloid and Interface Science, 24: 384-392.
Tsangaris, D.M. and Baltzis, B.C., 1996. Evaluation of batch and semi-batch reactor
operation for enzymatic reactions with inhibitory kinetics. Chemical Engineering
Science, 51: 2757-2762.
Turnbull, D., 1952. Kinetics of solidification of supercooled liquid mercury droplets.
The Journal of Chemical Physics, 20: 411-424.
Vasil'eV, V.P., 1962. Influence of ionic strength on the instability constants of
complexes. Russian Journal of Inorganic Chemistry, 7: 924-927.
Vasil'eV, V.P., 2004. On so-called concentration and true thermodynamic equilibrium
constant in solution. Russian Journal of Coordination Chemistry, 30: 73-74.
Vlek, P.L.G., Blom, T.J.M., Beek, J. and Lindsay, W.L., 1974. Determination of the
solubility product of various iron hydroxides and jarosite by the chelation method.
Soil Science Society of America Journal 38: 429-432.
Wang, W. and Breisinger, D., 1998. The acid-base behavior of zinc sulfate
electrolytes: The temperature effect. Metallurgical and Materials Transactions B, 29:
1157-1166.
Webster, J.G., Swedlund, P.J. and Webster, K.S., 1998. Trace metal adsorption onto
an acid mine drainage iron(III) oxy hydroxy sulfate. Environmental Science and
Technology, 32: 1361-1368.
Weckler, B. and Lutz, H.D., 1998. Lattice vibration spectra. Part XCV. Infrared
spectroscopic studies on the iron oxide hydroxides goethite (α), akaganéite (β),
lepidocrocite (γ), and feroxyhite (δ). European Journal of Solid State and Inorganic
Chemistry, 35: 531-544.
Impurity Rejection in the Nickel laterite Leach System
193
Wells, M.A., Fitzpatrick, R.W. and Gilkes, R.J., 2006. Thermal and mineral
properties of Al-, Cr-, Mn-, Ni- and Ti-substituted goethite. Clays and Clay Minerals,
54: 176-194.
Wells, M.A., Gilkes, R.J. and Fitzpatrick, R.W., 2001. Properties and acid dissolution
of metal-substituted hematites. Clays and Clay Minerals, 49: 60-72.
Whittington, B.I. and Johnson, J.A., 2005. Pressure acid leaching of arid-region
nickel laterite ore. Part III Effect of process water on nickel losses in the residue.
Hydrometallurgy, 78: 256-263.
Whittington, B.I., Johnson, J.A., Quan, L.P., McDonald, R.G. and Muir, D.M.,
2003a. Pressure acid leaching of arid-region nickel laterite ore. Part II. Effect of ore
type. Hydrometallurgy, 70: 47-62.
Whittington, B.I., McDonald, R.G., Johnson, J.A. and Muir, D.M., 2003b. Pressure
acid leaching of arid-region nickel laterite ore. Part I: effect of water quality.
Hydrometallurgy, 70: 31-46.
Whittington, B.I. and Muir, D., 2000. Pressure acid leaching of nickel laterites A
review. Mineral Processing and Extractive Metallurgy Review 21: 527-600.
Yakovlev, Y.B., Kul'ba, F.Y., Pus'ko, A.G. and Gerchikova, M.N., 1977. Hydrolysis
of iron (III) sulphate in zinc sulphate solutions at 25, 50, and 80 oC. Russian Journal
of Inorganic Chemistry, 22: 27-29.
Yu, J.Y., Heo, B., Choi, I.K., Cho, J.P. and Chang, H.W., 1999. Apparent solubilities
of schwertmannite and ferrihydrite in natural stream waters polluted by mine
drainage. Geochimica et Cosmochimica Acta, 63: 3407-3416.
Zinck, J.M., 1993. An investigation into the hydrolytic precipitation of iron (III) from
K. WANG
194
sulphate-bearing effluents. M.Eng Thesis, McGill University.
Zinck, J.M. and Dutrizac, J.E., 1998. The behaviour of zinc, cadmium, thallium, tin
and selenium during ferrihydrite precipitation from sulphate solutions. CIM Bulletin,
91: 94-101.
Every reasonable effort has been made to acknowledge the owners of copyright
material. I would be pleased to hear from any copyright owner who has been omitted
or incorrectly acknowledged.
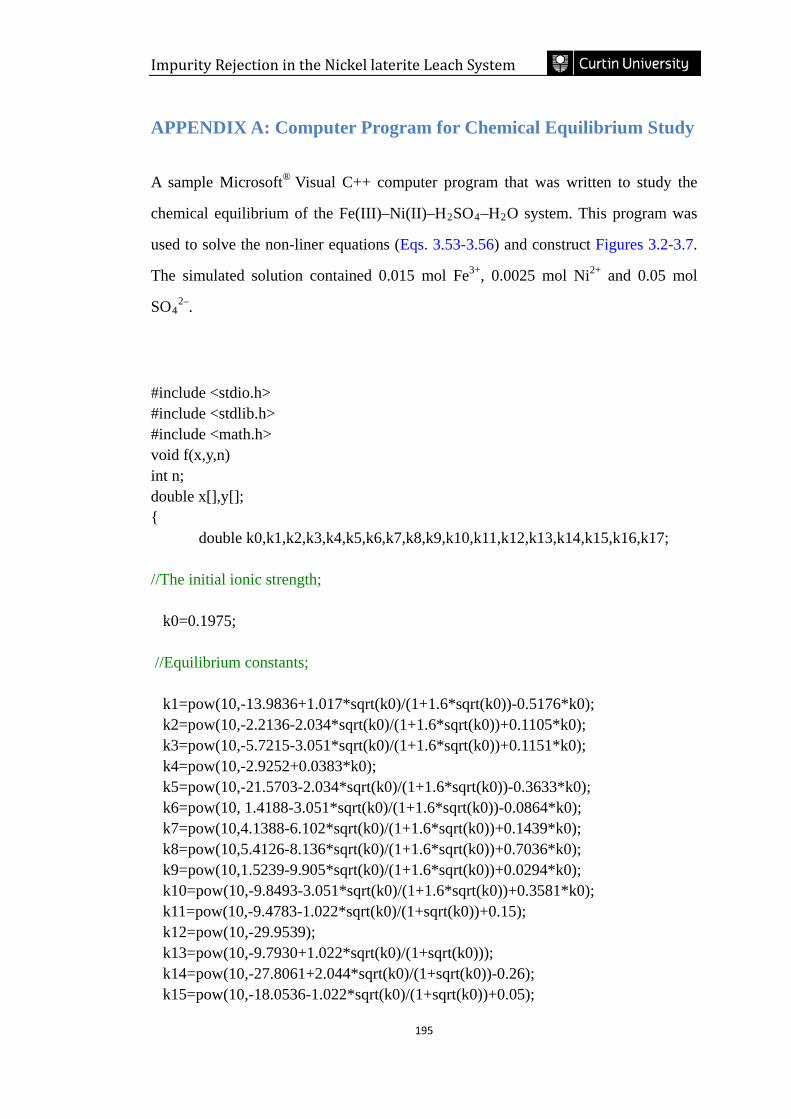
Impurity Rejection in the Nickel laterite Leach System
195
APPENDIX A: Computer Program for Chemical Equilibrium Study
A sample Microsoft® Visual C++ computer program that was written to study the
chemical equilibrium of the Fe(III)–Ni(II)–H2SO4–H2O system. This program was
used to solve the non-liner equations (Eqs. 3.53-3.56) and construct Figures 3.2-3.7.
The simulated solution contained 0.015 mol Fe3+, 0.0025 mol Ni2+ and 0.05 mol
SO42–.
#include <stdio.h> #include <stdlib.h> #include <math.h> void f(x,y,n) int n; double x[],y[]; { double k0,k1,k2,k3,k4,k5,k6,k7,k8,k9,k10,k11,k12,k13,k14,k15,k16,k17; //The initial ionic strength; k0=0.1975; //Equilibrium constants; k1=pow(10,-13.9836+1.017*sqrt(k0)/(1+1.6*sqrt(k0))-0.5176*k0); k2=pow(10,-2.2136-2.034*sqrt(k0)/(1+1.6*sqrt(k0))+0.1105*k0); k3=pow(10,-5.7215-3.051*sqrt(k0)/(1+1.6*sqrt(k0))+0.1151*k0); k4=pow(10,-2.9252+0.0383*k0); k5=pow(10,-21.5703-2.034*sqrt(k0)/(1+1.6*sqrt(k0))-0.3633*k0); k6=pow(10, 1.4188-3.051*sqrt(k0)/(1+1.6*sqrt(k0))-0.0864*k0); k7=pow(10,4.1388-6.102*sqrt(k0)/(1+1.6*sqrt(k0))+0.1439*k0); k8=pow(10,5.4126-8.136*sqrt(k0)/(1+1.6*sqrt(k0))+0.7036*k0); k9=pow(10,1.5239-9.905*sqrt(k0)/(1+1.6*sqrt(k0))+0.0294*k0); k10=pow(10,-9.8493-3.051*sqrt(k0)/(1+1.6*sqrt(k0))+0.3581*k0); k11=pow(10,-9.4783-1.022*sqrt(k0)/(1+sqrt(k0))+0.15); k12=pow(10,-29.9539); k13=pow(10,-9.7930+1.022*sqrt(k0)/(1+sqrt(k0))); k14=pow(10,-27.8061+2.044*sqrt(k0)/(1+sqrt(k0))-0.26); k15=pow(10,-18.0536-1.022*sqrt(k0)/(1+sqrt(k0))+0.05);
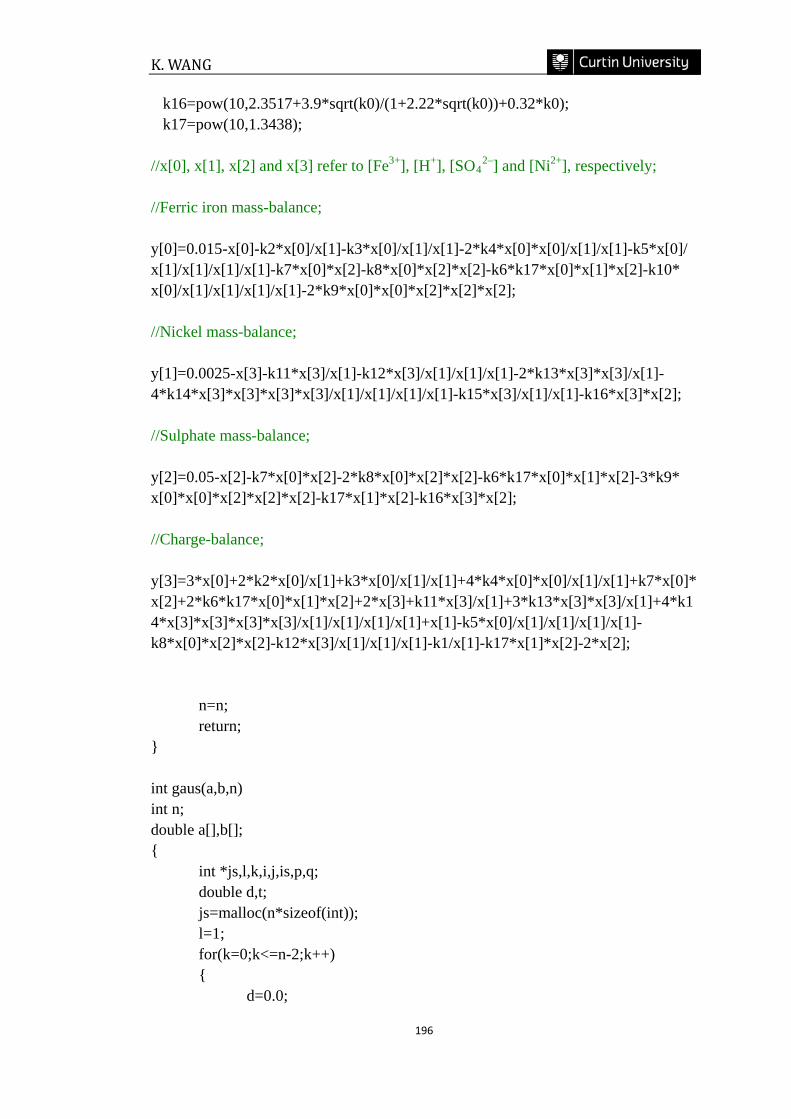
K. WANG
196
k16=pow(10,2.3517+3.9*sqrt(k0)/(1+2.22*sqrt(k0))+0.32*k0); k17=pow(10,1.3438); //x[0], x[1], x[2] and x[3] refer to [Fe3+], [H+], [SO4
2–] and [Ni2+], respectively; //Ferric iron mass-balance; y[0]=0.015-x[0]-k2*x[0]/x[1]-k3*x[0]/x[1]/x[1]-2*k4*x[0]*x[0]/x[1]/x[1]-k5*x[0]/ x[1]/x[1]/x[1]/x[1]-k7*x[0]*x[2]-k8*x[0]*x[2]*x[2]-k6*k17*x[0]*x[1]*x[2]-k10* x[0]/x[1]/x[1]/x[1]/x[1]-2*k9*x[0]*x[0]*x[2]*x[2]*x[2]; //Nickel mass-balance; y[1]=0.0025-x[3]-k11*x[3]/x[1]-k12*x[3]/x[1]/x[1]/x[1]-2*k13*x[3]*x[3]/x[1]-4*k14*x[3]*x[3]*x[3]*x[3]/x[1]/x[1]/x[1]/x[1]-k15*x[3]/x[1]/x[1]-k16*x[3]*x[2]; //Sulphate mass-balance; y[2]=0.05-x[2]-k7*x[0]*x[2]-2*k8*x[0]*x[2]*x[2]-k6*k17*x[0]*x[1]*x[2]-3*k9* x[0]*x[0]*x[2]*x[2]*x[2]-k17*x[1]*x[2]-k16*x[3]*x[2]; //Charge-balance; y[3]=3*x[0]+2*k2*x[0]/x[1]+k3*x[0]/x[1]/x[1]+4*k4*x[0]*x[0]/x[1]/x[1]+k7*x[0]*x[2]+2*k6*k17*x[0]*x[1]*x[2]+2*x[3]+k11*x[3]/x[1]+3*k13*x[3]*x[3]/x[1]+4*k14*x[3]*x[3]*x[3]*x[3]/x[1]/x[1]/x[1]/x[1]+x[1]-k5*x[0]/x[1]/x[1]/x[1]/x[1]-k8*x[0]*x[2]*x[2]-k12*x[3]/x[1]/x[1]/x[1]-k1/x[1]-k17*x[1]*x[2]-2*x[2]; n=n; return; } int gaus(a,b,n) int n; double a[],b[]; { int *js,l,k,i,j,is,p,q; double d,t; js=malloc(n*sizeof(int)); l=1; for(k=0;k<=n-2;k++) { d=0.0;
Impurity Rejection in the Nickel laterite Leach System
197
for(i=k;i<=n-1;i++) for(j=k;j<=n-1;j++) { t=fabs(a[i*n+j]); if (t>d) { d=t; js[k]=j; is=i; } } if(d+1.0==1.0) l=0; else { if(js[k]!=k) for(i=0;i<=n-1;i++) { p=i*n+k; q=i*n+js[k]; t=a[p]; a[p]=a[q]; a[q]=t; } if(is!=k) { for(j=k;j<=n-1;j++) { p=k*n+j; q=is*n+j; t=a[p]; a[p]=a[q]; a[q]=t; } t=b[k]; b[k]=b[is]; b[is]=t; } } if(l==0) { free(js); printf("fail\n");
K. WANG
198
return (0); } d=a[k*n+k]; for(j=k+1;j<=n-1;j++) { p=k*n+j; a[p]=a[p]/d; } b[k]=b[k]/d; for(i=k+1;i<=n-1;i++) { for(j=k+1;j<=n-1;j++) { p=i*n+j; a[p]=a[p]-a[i*n+k]*a[k*n+j]; } b[i]=b[i]-a[i*n+k]*b[k]; } } d=a[(n-1)*n+n-1]; if(fabs(d)+1.0==1.0) { free(js); printf("fail\n"); return (-3); } b[n-1]=b[n-1]/d; for(i=n-2;i>=0;i--) { t=0.0; for(j=i+1;j<=n-1;j++) t=t+a[i*n+j]*b[j]; b[i]=b[i]-t; } js[n-1]=n-1; for(k=n-1;k>=0;k--) if(js[k]!=k) { t=b[k]; b[k]=b[js[k]]; b[js[k]]=t; } free(js); return(1);
Impurity Rejection in the Nickel laterite Leach System
199
} int netn(n,eps,t,h,x,k,f) int n,k; void (*f)(); double eps,t,h,x[]; { int i,j,l; double am, z,beta,d,*y,*a,*b; y=malloc(n*sizeof(double)); a=malloc(n*n*sizeof(double)); b=malloc(n*sizeof(double)); l=k; am=1.+eps; while(am>=eps) { (*f)(x,b,n); am=0.; for(i=0;i<=n-1;i++) { z=fabs(b[i]); if(z>am) am=z; } if(am>=eps) { l=l-1; if(l==0) { free(y); free(b); free(a); printf("fail\n"); return (0); } for(j=0;j<=n-1;j++) { z=x[j]; x[j]=x[j]+h; (*f)(x,y,n); for(i=0;i<=n-1;i++) a[i*n+j]=y[i];
K. WANG
200
x[j]=z; } if(gaus(a,b,n)==0) { free(y); free(b); free(a); printf("fail\n"); return (-1); } beta=1.0; for(i=0;i<=n-1;i++) beta=beta-b[i]; if(fabs(beta)+1.==1.) { free(y); free(b); free(a); printf("fail\n"); return (-2); } d=h/beta; for(i=0;i<=n-1;i++) x[i]=x[i]-d*b[i]; h=t*h; } } free(y); free(b); free(a); return (k-1); } void main() { int i,k; void f(double [], double [], int); double eps, t, h; static double x[4]={1.0,1.0,1.0,1.0}; t=0.1; h=0.1; eps=1e-8; k=1000; i=netn(4,eps,t,h,x,k,f);

Impurity Rejection in the Nickel laterite Leach System
201
printf("\n"); printf("i=%d\n",i); printf("\n"); for(i=0;i<=3;i++) printf("x(%d)=%lf\n",i,x[i]); printf("\n"); }
K. WANG
202
APPENDIX B: Box-Behnken Design
Box-Behnken Design (BBD) is an incomplete three level factorial design for
response surface methodology (RSM). The number of experiments (N) for BBD is
N=2k(k‒1)+C0, where k is the number of factors and Co is the number of central
points. For three factors, this design requires 15 experiments composed of 12 middle
points at the edges and 3 replicated central points. With three experiments at the
central point, it is possible to estimate the pure error sum of squares, SSPE.
The experimental data generated by BBD are normally used to fit a quadratic model
given by:
εxβxxβxββyk
1i
2iiiji
1k
1i
k
2jij
k
1iii0 ++++= ∑∑∑∑
=
−
= ==
Eq. B.1
where xi and xj represent coded factors, β0 is a regression coefficient, βi are linear
coefficients, βij are the coefficients for the interaction terms and β ii represent
quadratic coefficients. The random error terms ε are generally assumed to follow a
normal distribution with mean of zero and constant variance of σ2, thus these errors
are independent of each other. The relationship between the natural and coded factor
is written as:
ΔX
XXx 0ii
−= Eq. B.2
where xi is the coded value of an independent factor; Xi is the actual value of an
independent factor; X0 is the actual value of an independent factor at the central
point, and ∆X is the step change value corresponding to a unit variation of the
dimensionless value.
To simplify, Eq. B.1 can be written in matrix notation as:
Impurity Rejection in the Nickel laterite Leach System
203
εXβY += Eq. B.5
where Y is a matrix of the observations, X is a matrix of the independent factors, β
and ε are the matrices of the regression coefficient and random error, respectively.
The coefficients in Eq. B.3 can be determined by the method of least squares with the
least squares function described as:
∑=
=n
ii
1
2εL Eq. B.4
The least squares estimators, b, should satisfy the relationship:
022 =+−=∂∂ XbXYXβL TT
b
Eq. B.5
Thus the solution of Eq. B.5 or the least squares estimator of β is:
YXXXb TT 1)( −= Eq. B.6
where XT is the transpose of the matrix X, and (XTX)−1 is the inverse of the matrix
XTX.
K. WANG
204
PUBLICATIONS
The following peer-reviewed journal and conference publications have arisen from
work completed by the candidate for this thesis.
Wang, K., Li, J., McDonald, R.G., Browner, R.E., 2013. Characterization of iron-rich
precipitates from synthetic atmospheric nickel laterite leach solutions. Minerals
Engineering, 40: 1-11.
Wang, K., Li, J., McDonald, R.G., Browner, R.E., 2012. The aqueous ionic
equilibrium and speciation of iron and nickel in sulphuric solutions. XXVI
International Mineral Processing Congress (IMPC), New Delhi, India, 5795-5813.
Wang, K., Li, J., McDonald, R.G., Browner, R.E., 2012. Nickel loss during iron
precipitation and product characterization. Advanced Materials Research, 402: 293-
296.
Wang, K., Li, J., McDonald, R.G., Browner, R.E., 2011. The effect of iron
precipitation upon nickel losses from synthetic atmospheric nickel laterite leach
solutions: Statistical analysis and modelling. Hydrometallurgy, 109: 140-152.