Embed Size (px)
Citation preview
Improving Aviation Safety with Information Visualization:
Airflow Hazard Display for Pilots
Cecilia R. AragonIEOR 170
UC Berkeley
Spring 2006
Spring 2006 IEOR 170 2
Acknowledgments
• This work was funded by the NASA Ames Full-
Time Graduate Study Program (Ph.D. in
Computer Science at UC Berkeley)
• Thanks to my advisor at UC Berkeley, Professor
Marti Hearst, and Navy flight test engineer
Kurtis Long
• Thanks to Advanced Rotorcraft Technology, Inc.
for the use of their high-fidelity flight simulator
Spring 2006 IEOR 170 3
Talk Outline
• Introduction
• Related Work
• Preliminary Usability Study
• Flight Simulation Usability Study
• Conclusions and Further Work
Spring 2006 IEOR 170 4
Introduction
Spring 2006 IEOR 170 5
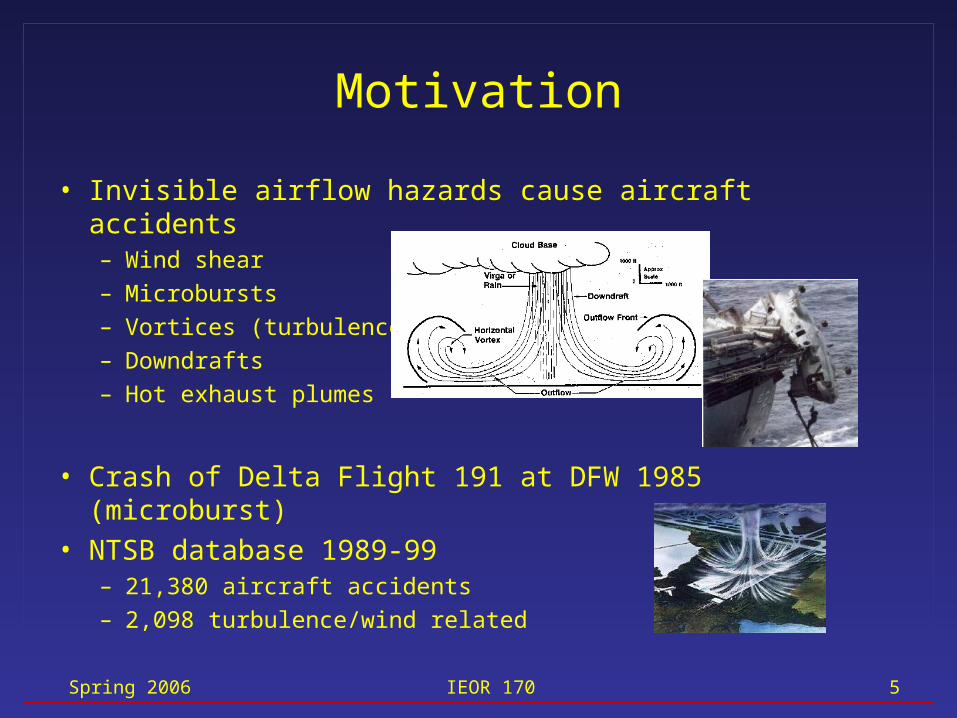
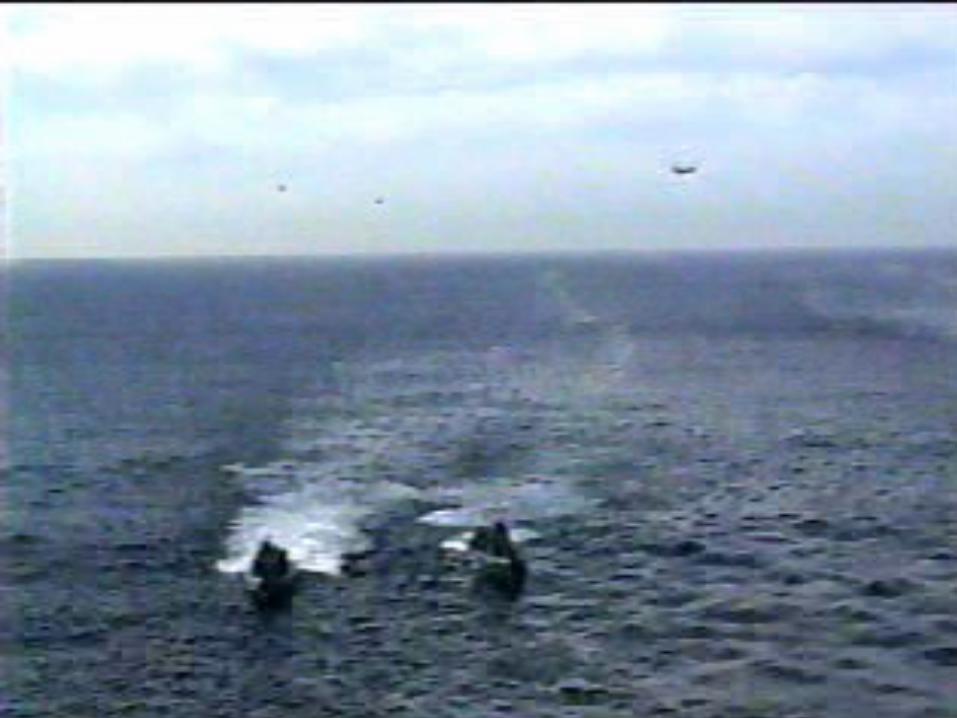
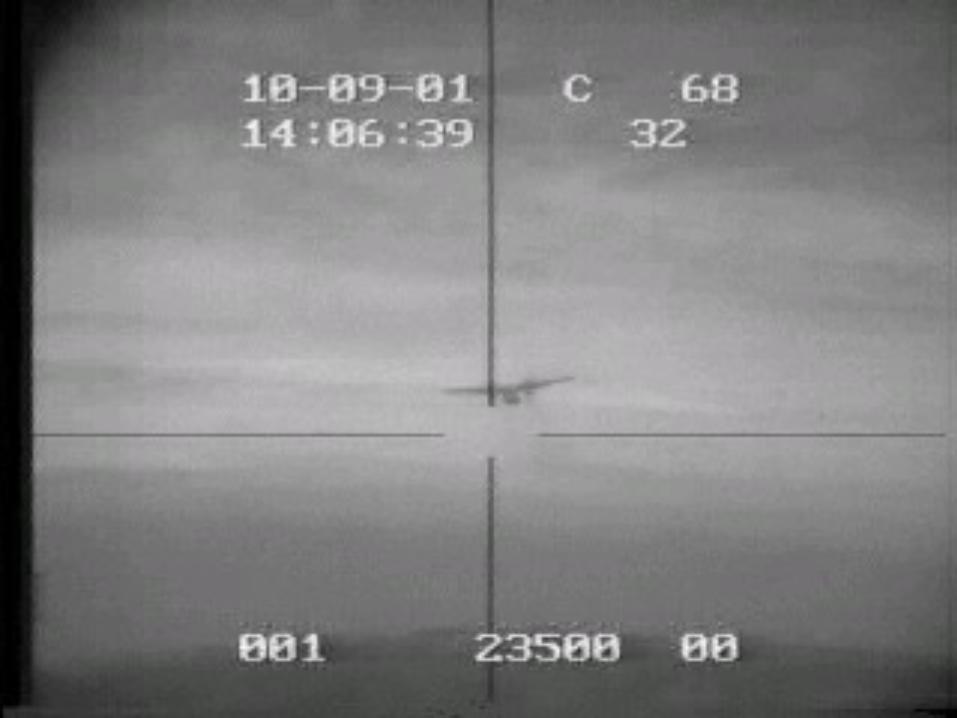
Motivation
• Invisible airflow hazards cause aircraft accidents – Wind shear– Microbursts– Vortices (turbulence)– Downdrafts– Hot exhaust plumes
• Crash of Delta Flight 191 at DFW 1985 (microburst)• NTSB database 1989-99
– 21,380 aircraft accidents– 2,098 turbulence/wind related
Spring 2006 IEOR 170 6
Spring 2006 IEOR 170 7
Spring 2006 IEOR 170 8
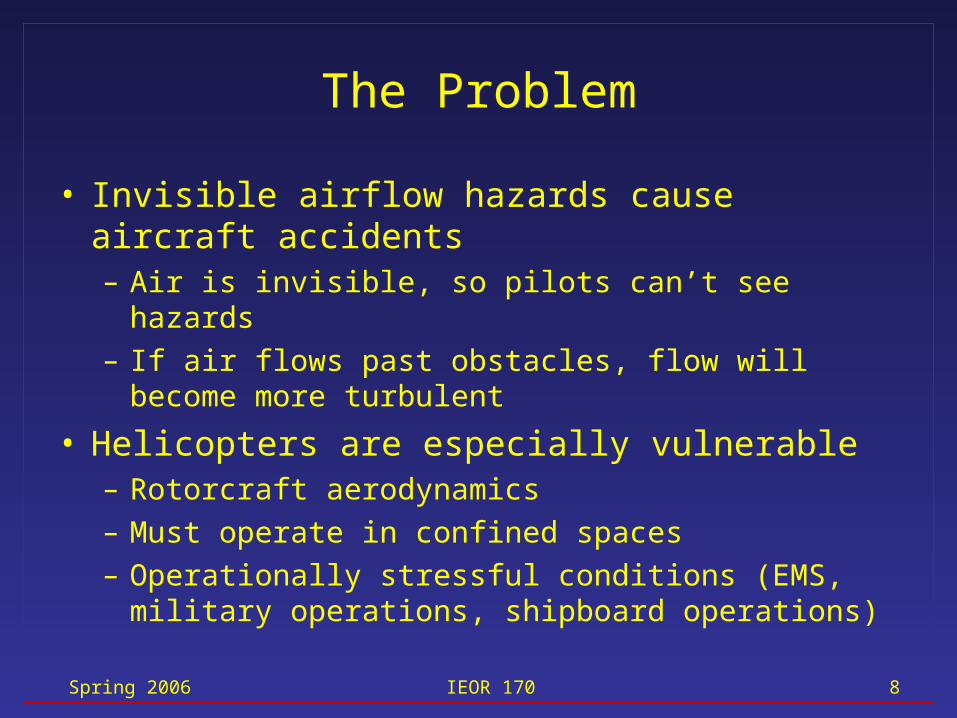
The Problem
• Invisible airflow hazards cause aircraft accidents– Air is invisible, so pilots can’t see hazards– If air flows past obstacles, flow will become more
turbulent
• Helicopters are especially vulnerable– Rotorcraft aerodynamics– Must operate in confined spaces– Operationally stressful conditions (EMS, military
operations, shipboard operations)
Spring 2006 IEOR 170 9
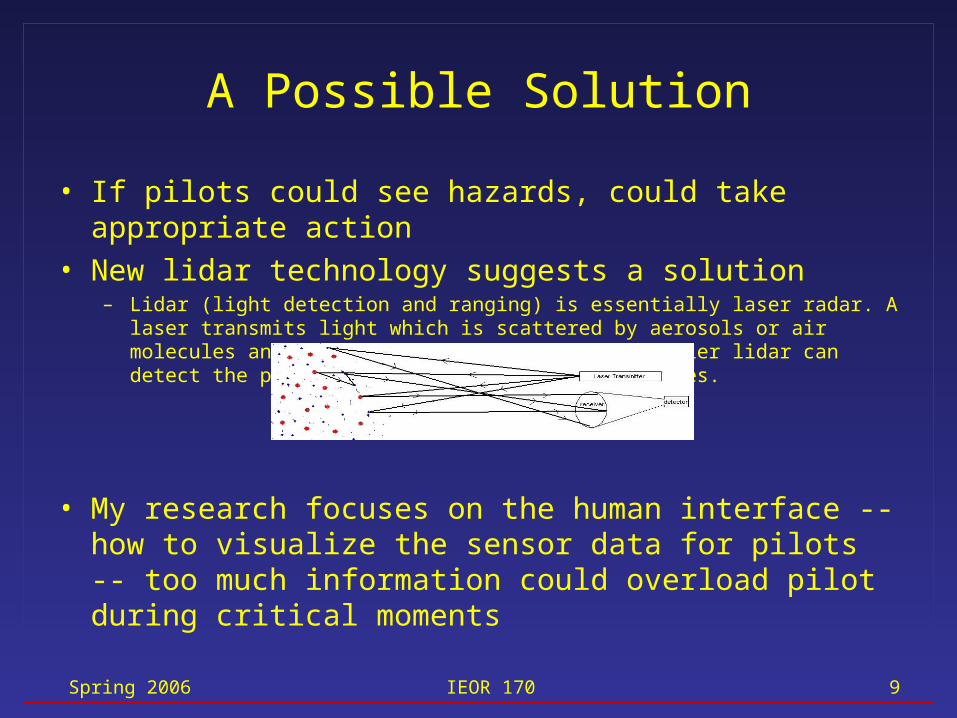
A Possible Solution
• If pilots could see hazards, could take appropriate action• New lidar technology suggests a solution
– Lidar (light detection and ranging) is essentially laser radar. A laser transmits light which is scattered by aerosols or air molecules and then collected by a sensor. Doppler lidar can detect the position and velocity of air particles.
• My research focuses on the human interface -- how to visualize the sensor data for pilots -- too much information could overload pilot during critical moments
Spring 2006 IEOR 170 10
Research Approach
• User-centered (iterative) design process• Simulated interface for head-up display (HUD)
based on lidar sensors that scan area ahead of helicopter and acquire airflow velocity data
• Focused on helicopter-shipboard landings• Importance of realism:
– Used actual flight test data from shipboard testing, high-fidelity helicopter simulator, experienced military and civilian helicopter pilots
Spring 2006 IEOR 170 11
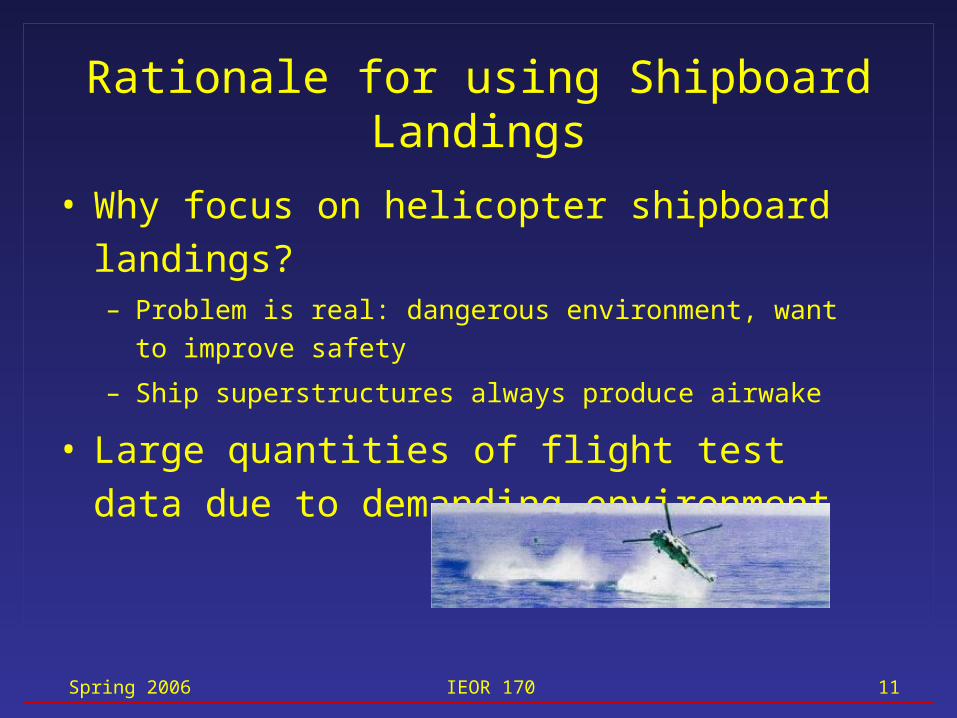
Rationale for using Shipboard Landings
• Why focus on helicopter shipboard landings?– Problem is real: dangerous environment, want to improve
safety
– Ship superstructures always produce airwake
• Large quantities of flight test data due to
demanding environment
Spring 2006 IEOR 170 12
Related Work
Spring 2006 IEOR 170 13
Related Work
• Flow visualization• Aviation displays• Navy “Dynamic Interface” flight tests
Spring 2006 IEOR 170 14
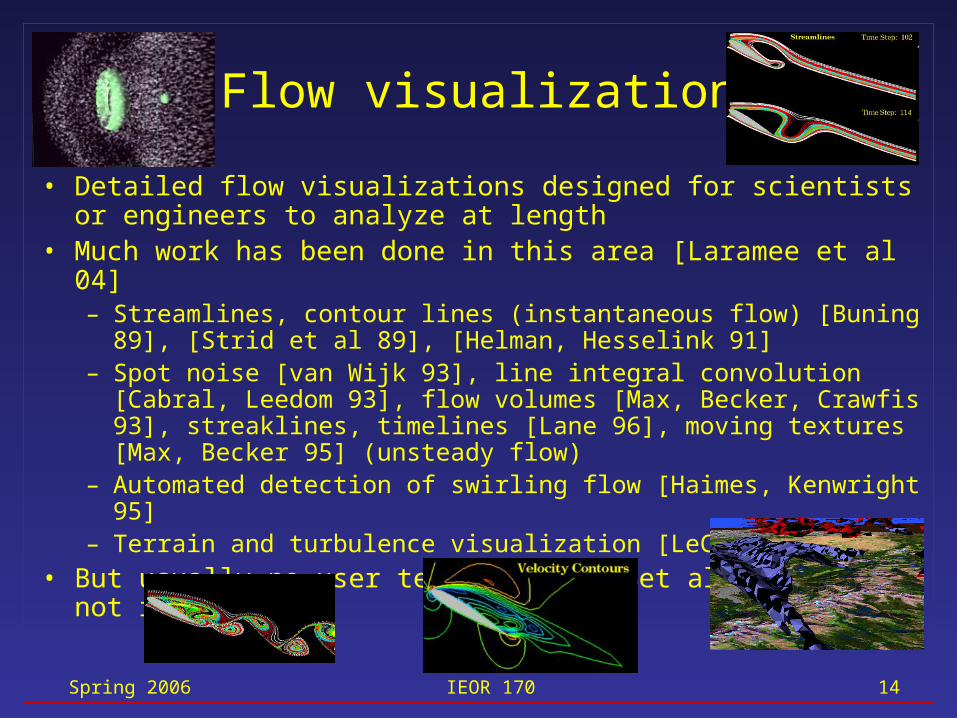
Flow visualization
• Detailed flow visualizations designed for scientists or engineers to analyze at length
• Much work has been done in this area [Laramee et al 04]– Streamlines, contour lines (instantaneous flow) [Buning 89], [Strid et
al 89], [Helman, Hesselink 91]– Spot noise [van Wijk 93], line integral convolution [Cabral, Leedom
93], flow volumes [Max, Becker, Crawfis 93], streaklines, timelines [Lane 96], moving textures [Max, Becker 95] (unsteady flow)
– Automated detection of swirling flow [Haimes, Kenwright 95]– Terrain and turbulence visualization [LeClerc et al 02]
• But usually no user tests [Laidlaw et al 01], andnot real-time
Spring 2006 IEOR 170 15
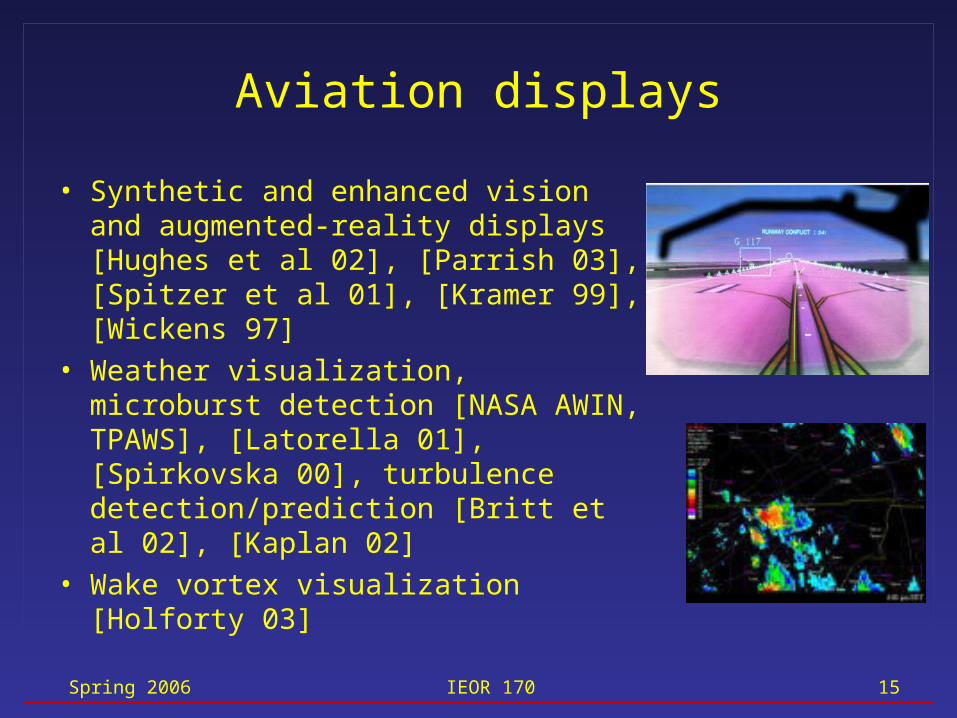
Aviation displays
• Synthetic and enhanced vision and augmented-reality displays [Hughes et al 02], [Parrish 03], [Spitzer et al 01], [Kramer 99], [Wickens 97]
• Weather visualization, microburst detection [NASA AWIN, TPAWS], [Latorella 01], [Spirkovska 00], turbulence detection/prediction [Britt et al 02], [Kaplan 02]
• Wake vortex visualization [Holforty 03]
Spring 2006 IEOR 170 16
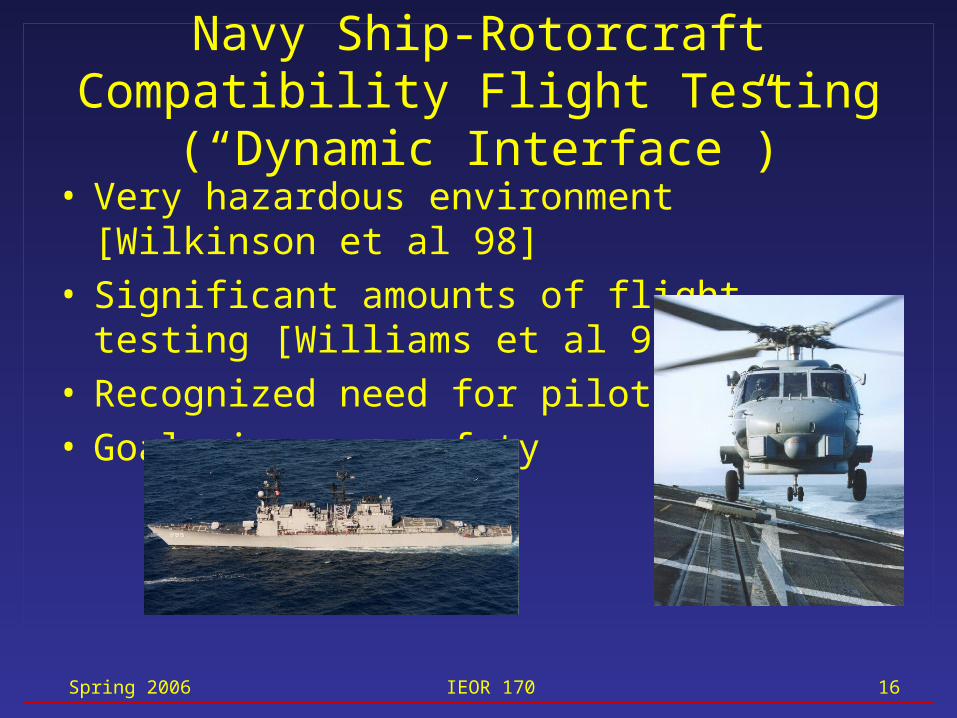
Navy Ship-Rotorcraft Compatibility Flight Testing (“Dynamic Interface”)
• Very hazardous environment [Wilkinson et al 98]• Significant amounts of flight testing [Williams et
al 99]• Recognized need for pilot testing• Goal: improve safety
Spring 2006 IEOR 170 17
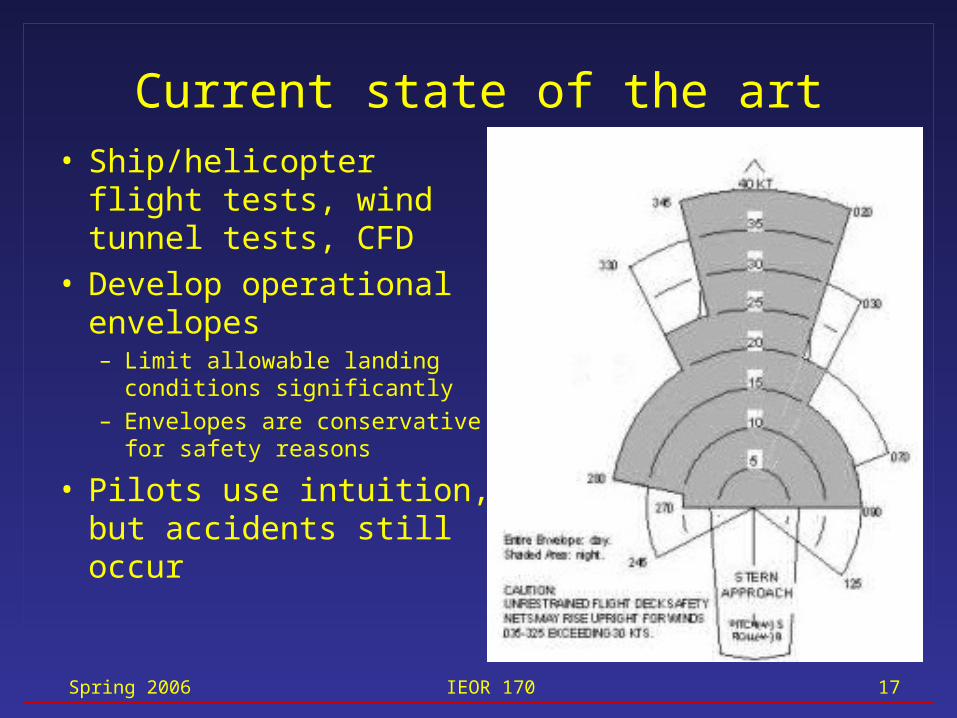
Current state of the art
• Ship/helicopter flight tests, wind tunnel tests, CFD
• Develop operational envelopes– Limit allowable landing
conditions significantly– Envelopes are conservative
for safety reasons
• Pilots use intuition, but accidents still occur
Spring 2006 IEOR 170 18
Preliminary Usability Study
Spring 2006 IEOR 170 19
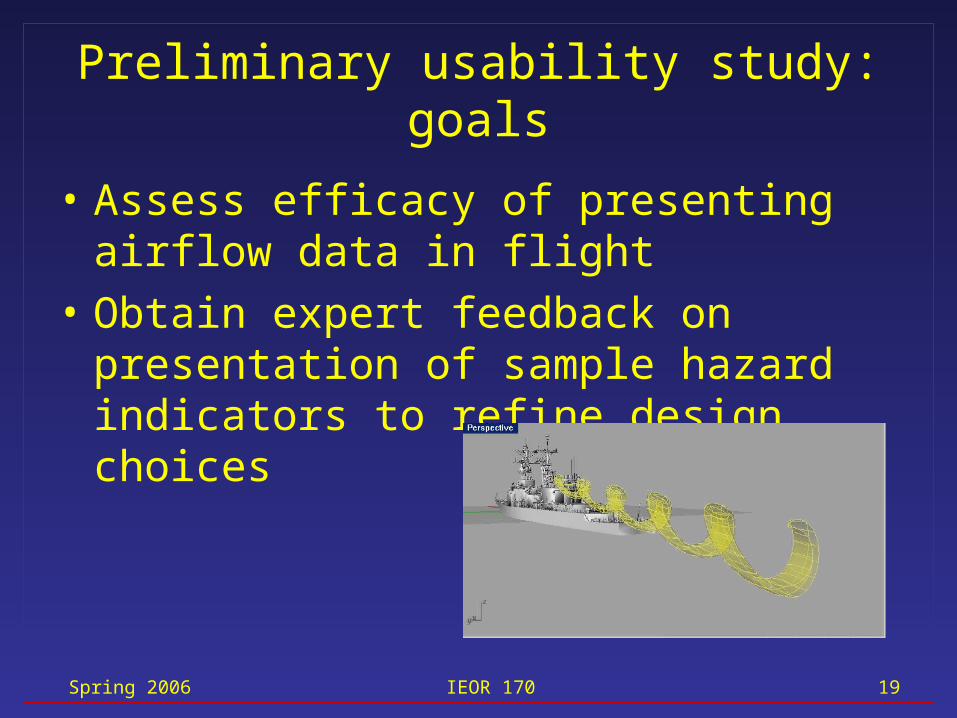
Preliminary usability study: goals
• Assess efficacy of presenting airflow data in flight
• Obtain expert feedback on presentation of sample hazard indicators to refine design choices
Spring 2006 IEOR 170 20
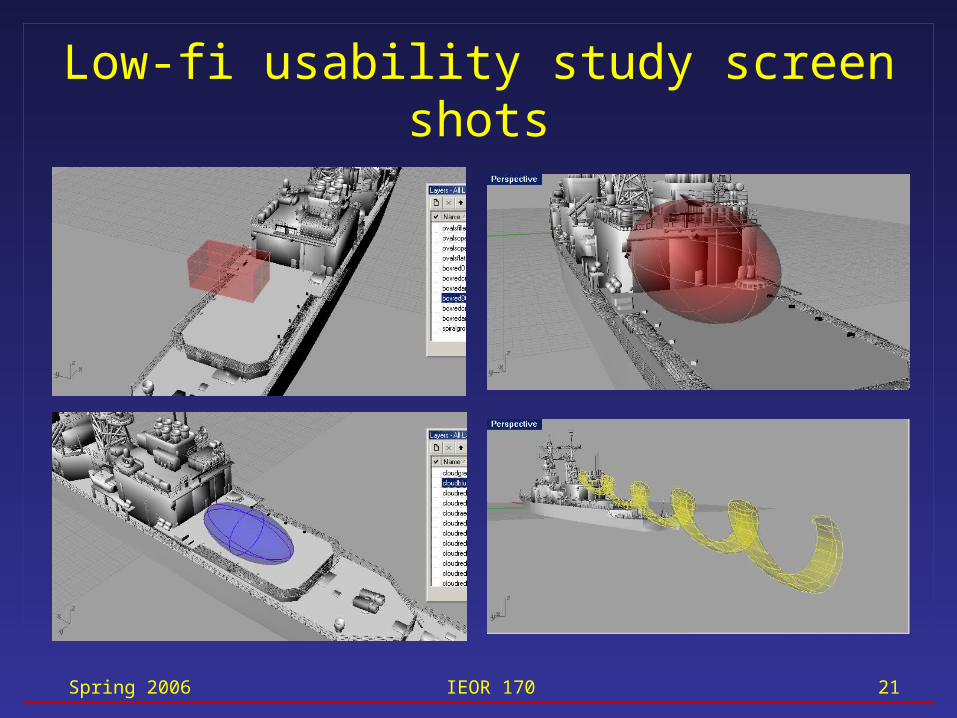
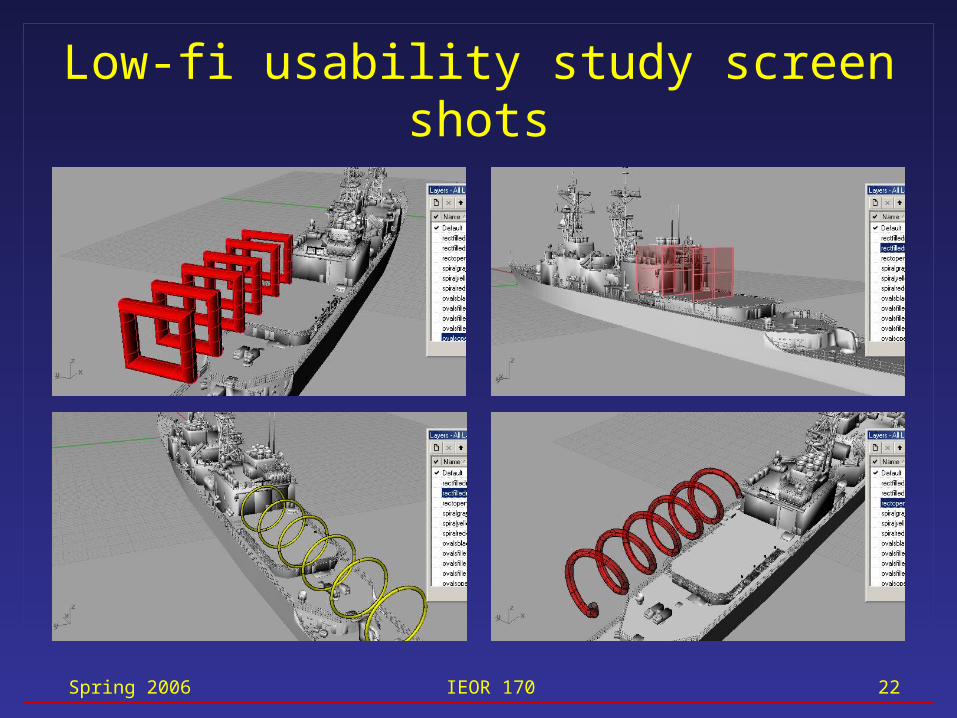
Usability study: low-fidelity prototype
• Rhino3D (3D CAD modeling program)– Easy access to ship models, ease of rapid prototyping– Chosen over 2D paper prototype, MS Flight
Simulator, WildTangent, VRML-based tools, Java and Flash
• Series of animations simulating helicopter’s final approach to landing
• Different types of hazard indicators• Get pilot feedback and suggestions (interactive
prototyping)
Spring 2006 IEOR 170 21
Low-fi usability study screen shots
Spring 2006 IEOR 170 22
Low-fi usability study screen shots
Spring 2006 IEOR 170 23
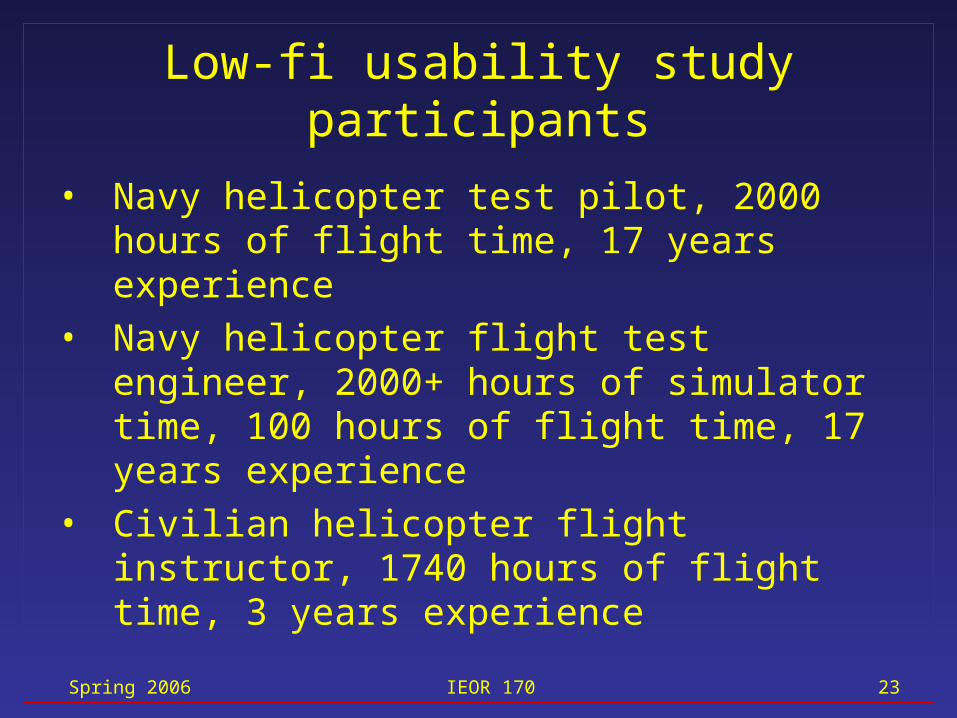
Low-fi usability study participants
• Navy helicopter test pilot, 2000 hours of flight time, 17 years experience
• Navy helicopter flight test engineer, 2000+ hours of simulator time, 100 hours of flight time, 17 years experience
• Civilian helicopter flight instructor, 1740 hours of flight time, 3 years experience
Spring 2006 IEOR 170 24
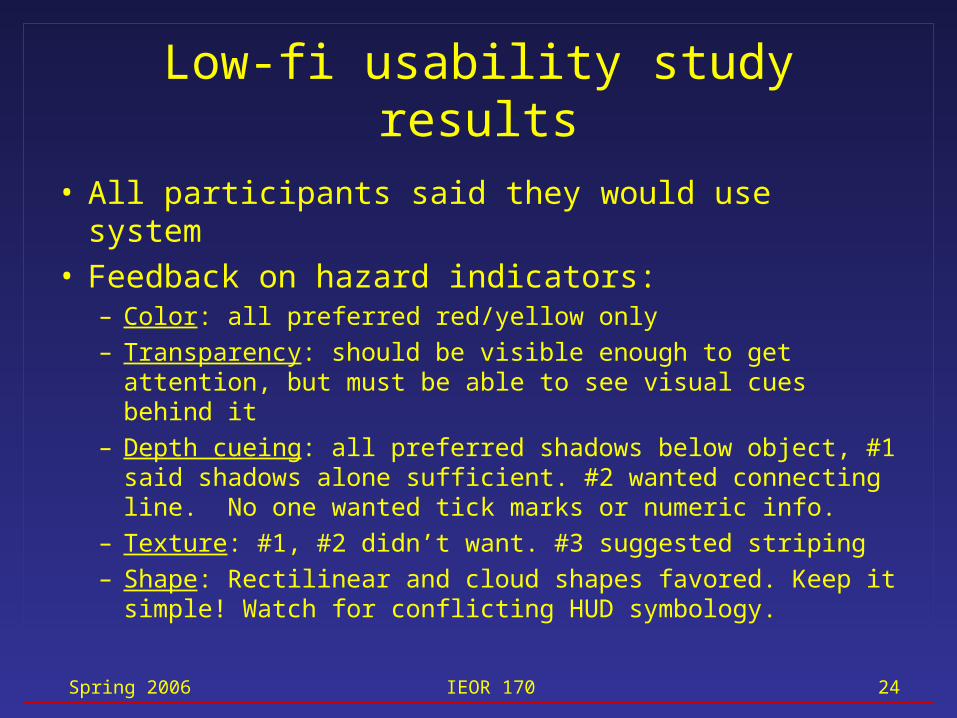
Low-fi usability study results
• All participants said they would use system• Feedback on hazard indicators:
– Color: all preferred red/yellow only
– Transparency: should be visible enough to get attention, but must be able to see visual cues behind it
– Depth cueing: all preferred shadows below object, #1 said shadows alone sufficient. #2 wanted connecting line. No one wanted tick marks or numeric info.
– Texture: #1, #2 didn’t want. #3 suggested striping
– Shape: Rectilinear and cloud shapes favored. Keep it simple! Watch for conflicting HUD symbology.
Spring 2006 IEOR 170 25
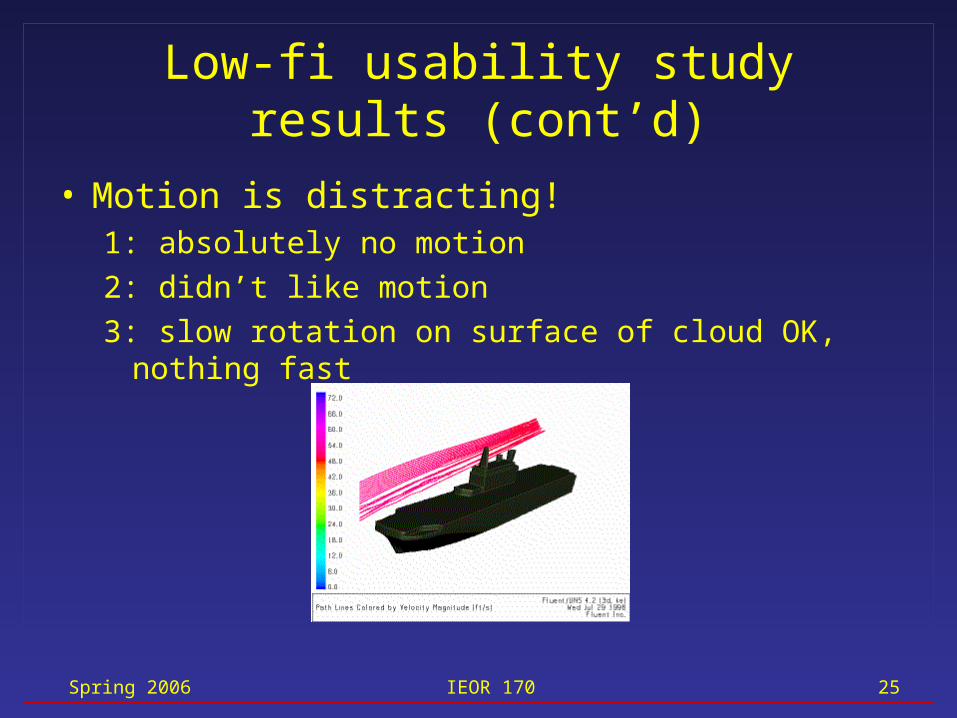
Low-fi usability study results (cont’d)
• Motion is distracting!1: absolutely no motion
2: didn’t like motion
3: slow rotation on surface of cloud OK, nothing fast
Spring 2006 IEOR 170 26
Low-fi usability study conclusions
• They want it!• Keep it simple
– Color: red & yellow only (red = danger, yellow = caution)– Less complex shapes preferred
• Use accepted symbology/metaphors– Watch for conflicting HUD symbology
• Decision support system, not scientific visualization system– Show effects rather than causes– Don’t want distraction during high-workload task– Preference for static rather than dynamic indicators
Flight Simulation Usability Study
Spring 2006 IEOR 170 28
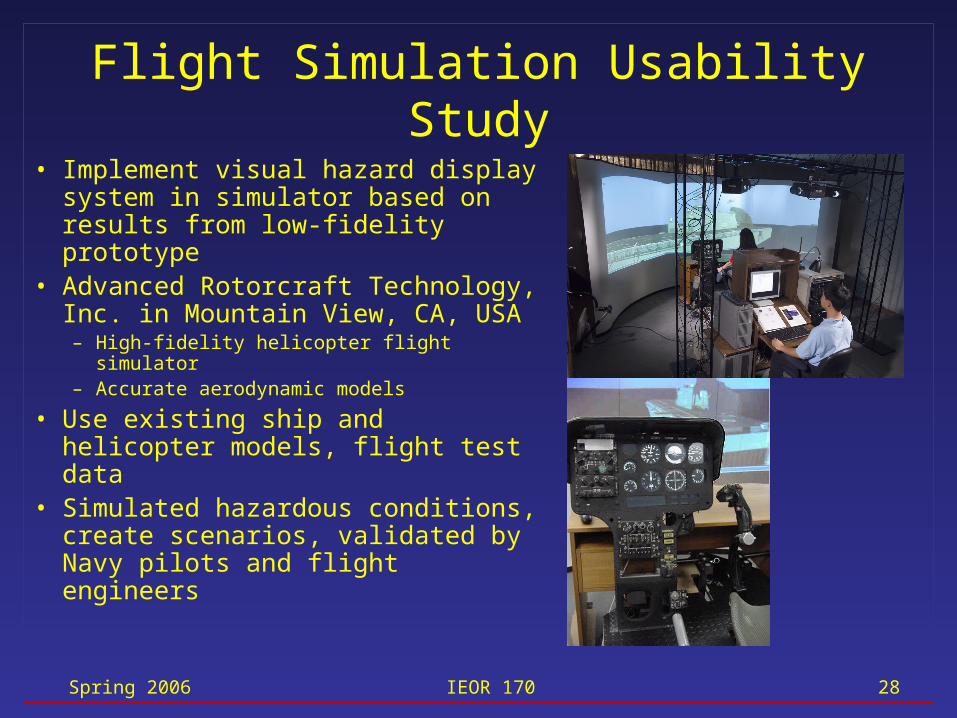
Flight Simulation Usability Study
• Implement visual hazard display system in simulator based on results from low-fidelity prototype
• Advanced Rotorcraft Technology, Inc. in Mountain View, CA, USA– High-fidelity helicopter flight simulator– Accurate aerodynamic models
• Use existing ship and helicopter models, flight test data
• Simulated hazardous conditions, create scenarios, validated by Navy pilots and flight engineers
Spring 2006 IEOR 170 29
Flight Simulation Usability Study: Participants
• 16 helicopter pilots– from all 5 branches of the military (Army, Navy, Air Force,
Coast Guard, Marines)
– civilian test pilots (NASA)
– wide range of experience• 200 to 7,300 helicopter flight hours (median 2,250 hours)
• 2 to 46 years of experience (median 13 years)
• age 25 to 65 (median age 36)
• No previous experience with airflow hazard visualization
Spring 2006 IEOR 170 30
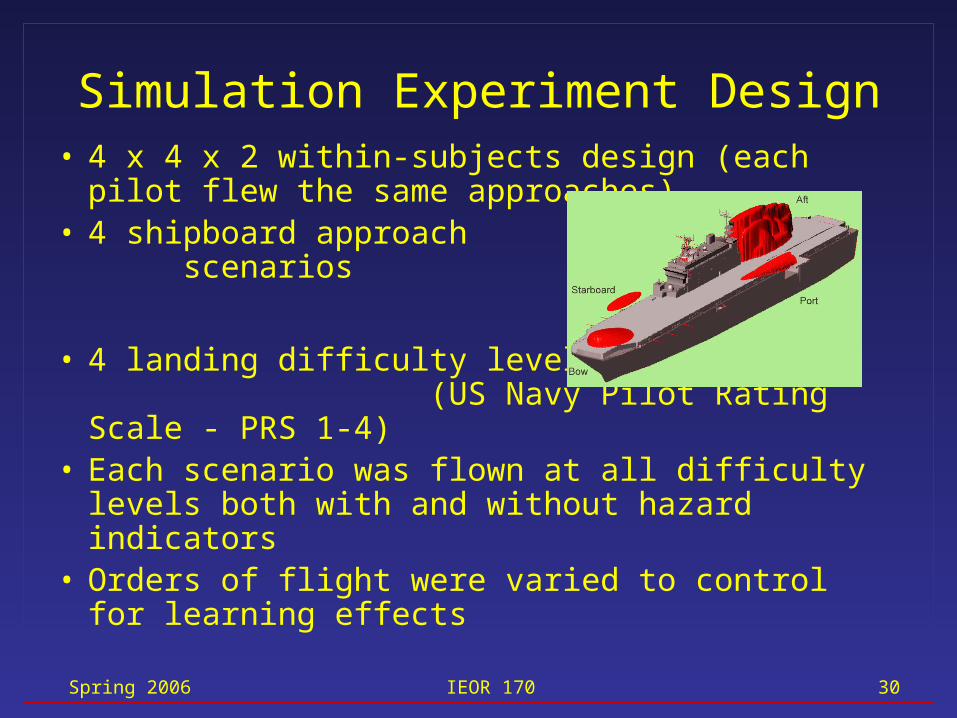
Simulation Experiment Design• 4 x 4 x 2 within-subjects design (each pilot flew
the same approaches)• 4 shipboard approach
scenarios
• 4 landing difficulty levels (US Navy Pilot Rating Scale - PRS 1-4)
• Each scenario was flown at all difficulty levels both with and without hazard indicators
• Orders of flight were varied to control for learning effects
Spring 2006 IEOR 170 31
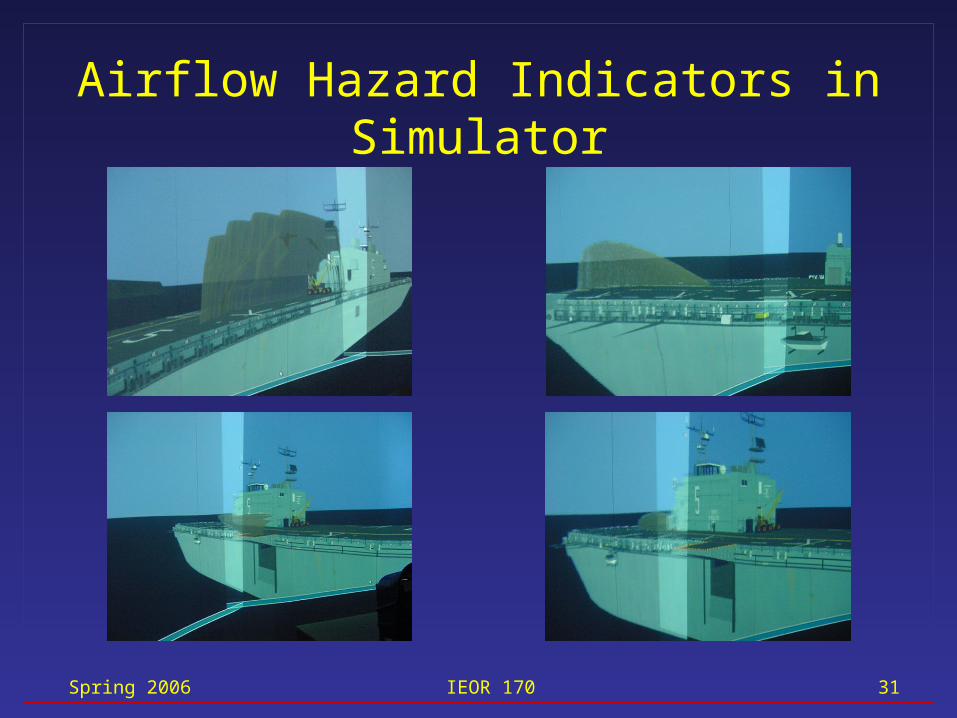
Airflow Hazard Indicators in Simulator
Spring 2006 IEOR 170 32
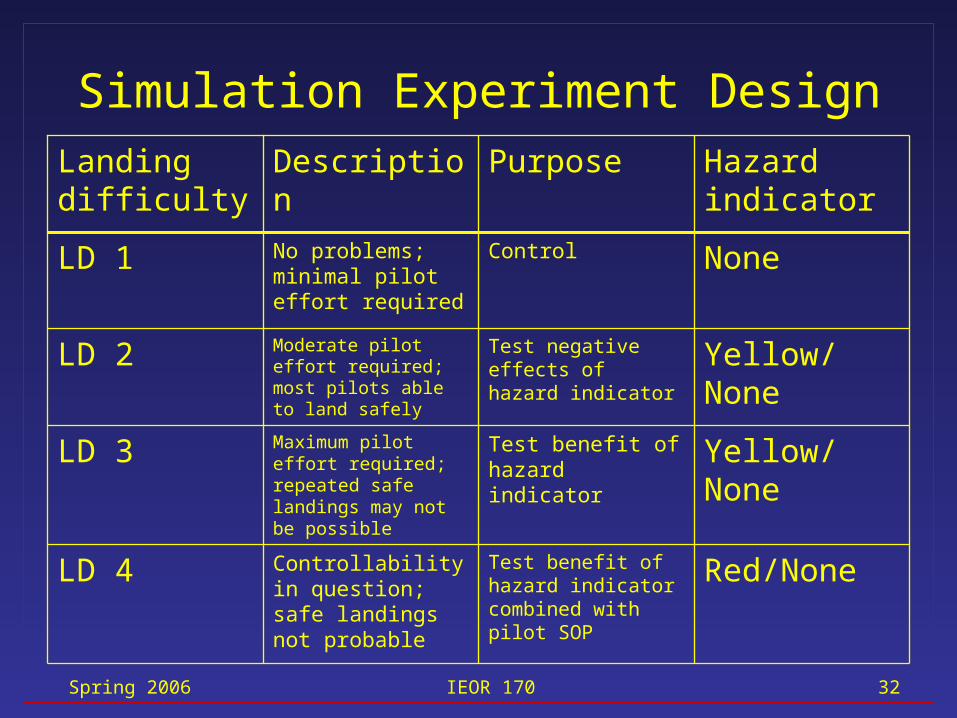
Simulation Experiment Design
Red/NoneTest benefit of hazard indicator combined with pilot SOP
Controllability in question; safe landings not probable
LD 4
Yellow/NoneTest benefit of hazard indicator
Maximum pilot effort required; repeated safe landings may not be possible
LD 3
Yellow/NoneTest negative effects of hazard indicator
Moderate pilot effort required; most pilots able to land safely
LD 2
NoneControlNo problems; minimal pilot effort required
LD 1
Hazard indicator
PurposeDescriptionLanding difficulty
Spring 2006 IEOR 170 33
Spring 2006 IEOR 170 34
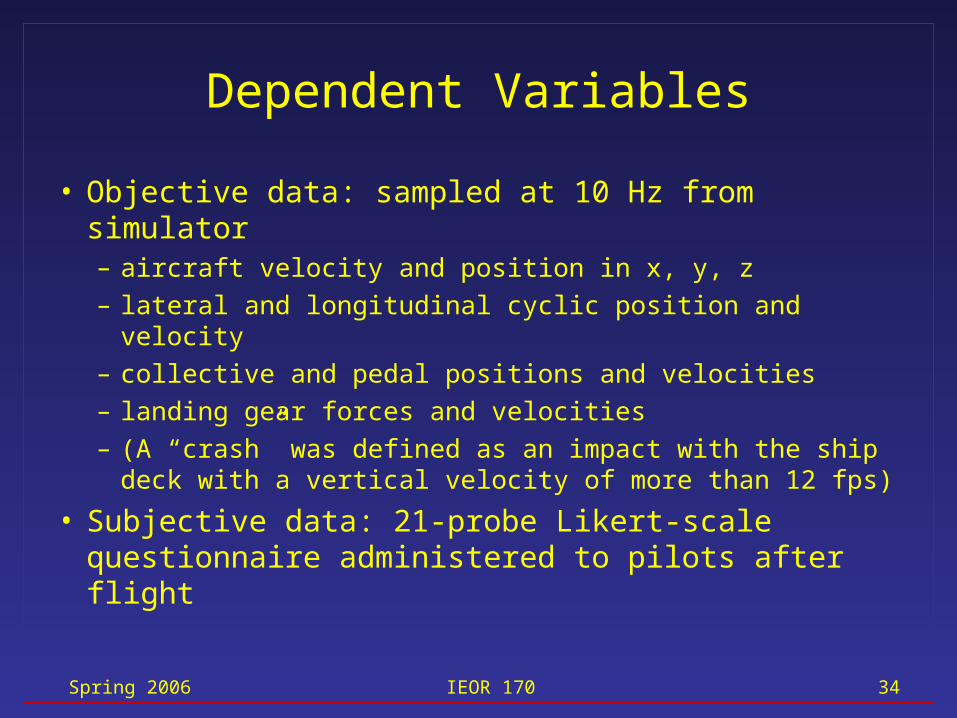
Dependent Variables
• Objective data: sampled at 10 Hz from simulator– aircraft velocity and position in x, y, z– lateral and longitudinal cyclic position and velocity– collective and pedal positions and velocities– landing gear forces and velocities– (A “crash” was defined as an impact with the ship
deck with a vertical velocity of more than 12 fps)
• Subjective data: 21-probe Likert-scale questionnaire administered to pilots after flight
Spring 2006 IEOR 170 35
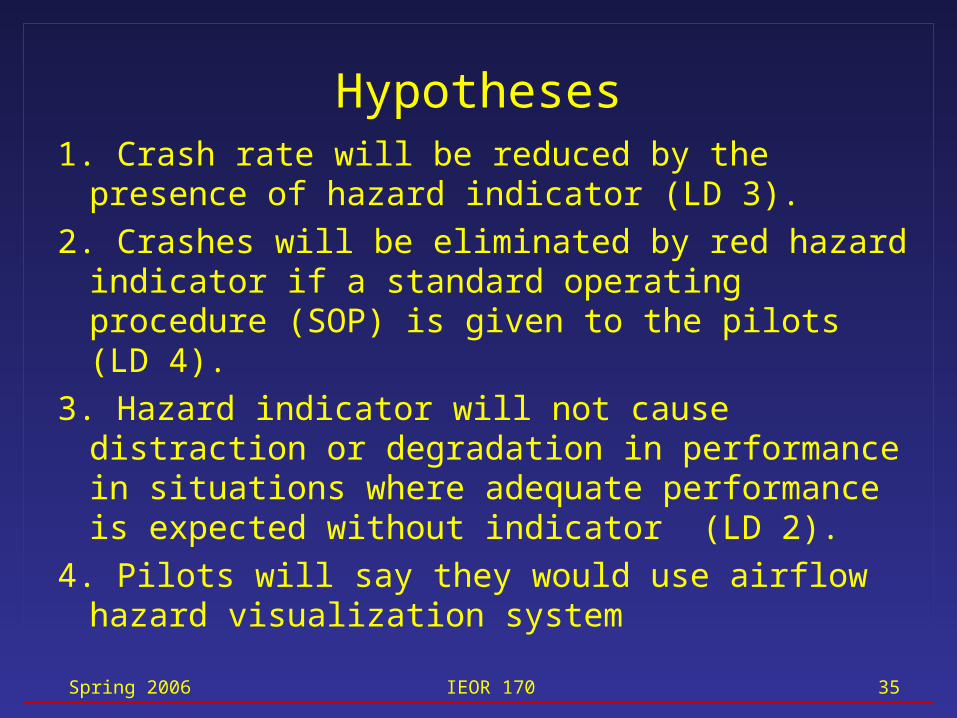
Hypotheses1. Crash rate will be reduced by the presence of
hazard indicator (LD 3).
2. Crashes will be eliminated by red hazard indicator if a standard operating procedure (SOP) is given to the pilots (LD 4).
3. Hazard indicator will not cause distraction or degradation in performance in situations where adequate performance is expected without indicator (LD 2).
4. Pilots will say they would use airflow hazard visualization system
Spring 2006 IEOR 170 36
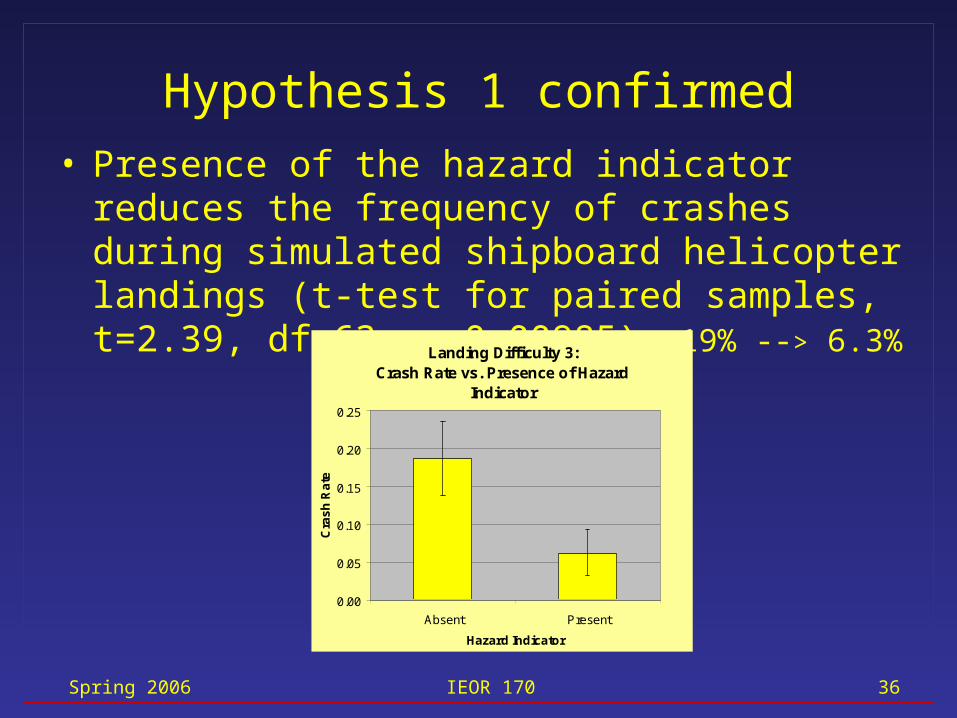
Hypothesis 1 confirmed
• Presence of the hazard indicator reduces the frequency of crashes during simulated shipboard helicopter landings (t-test for paired samples, t=2.39, df=63, p=0.00985). 19% --> 6.3%
Landing Difficulty 3:Crash Rate vs. Presence of Hazard
Indicator
0.00
0.05
0.10
0.15
0.20
0.25
Absent Present
Hazard Indicator
Cra
sh
Ra
te
Spring 2006 IEOR 170 37
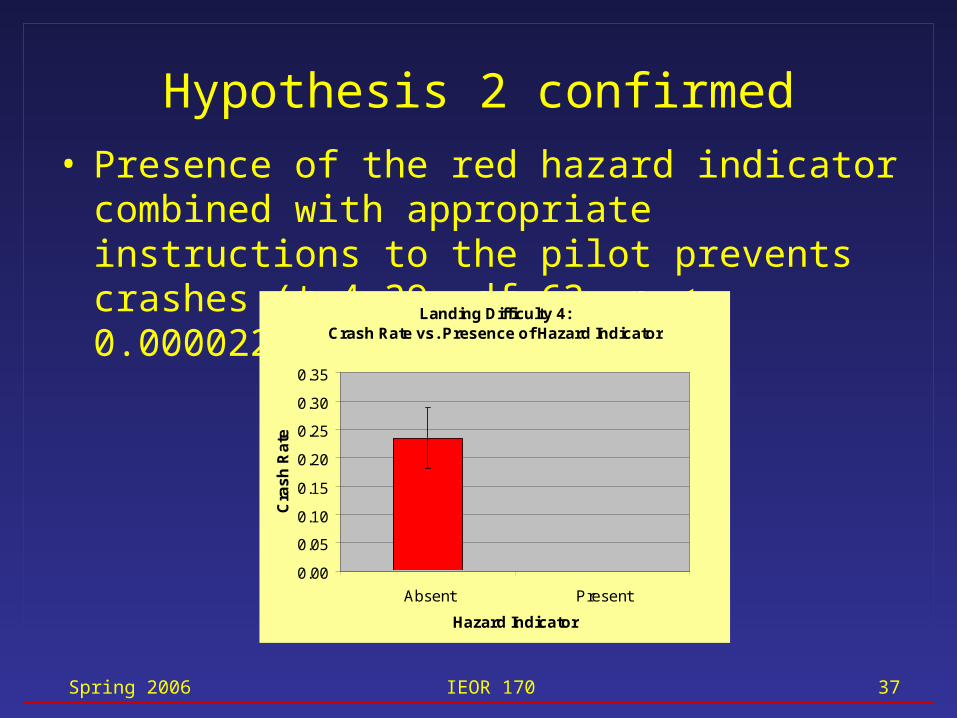
Hypothesis 2 confirmed
• Presence of the red hazard indicator combined with appropriate instructions to the pilot prevents crashes (t=4.39, df=63, p < 0.000022). 23%-->0%
Landing Difficulty 4:Crash Rate vs. Presence of Hazard Indicator
0.00
0.05
0.10
0.15
0.20
0.25
0.30
0.35
Absent Present
Hazard Indicator
Cra
sh
Ra
te
Spring 2006 IEOR 170 38
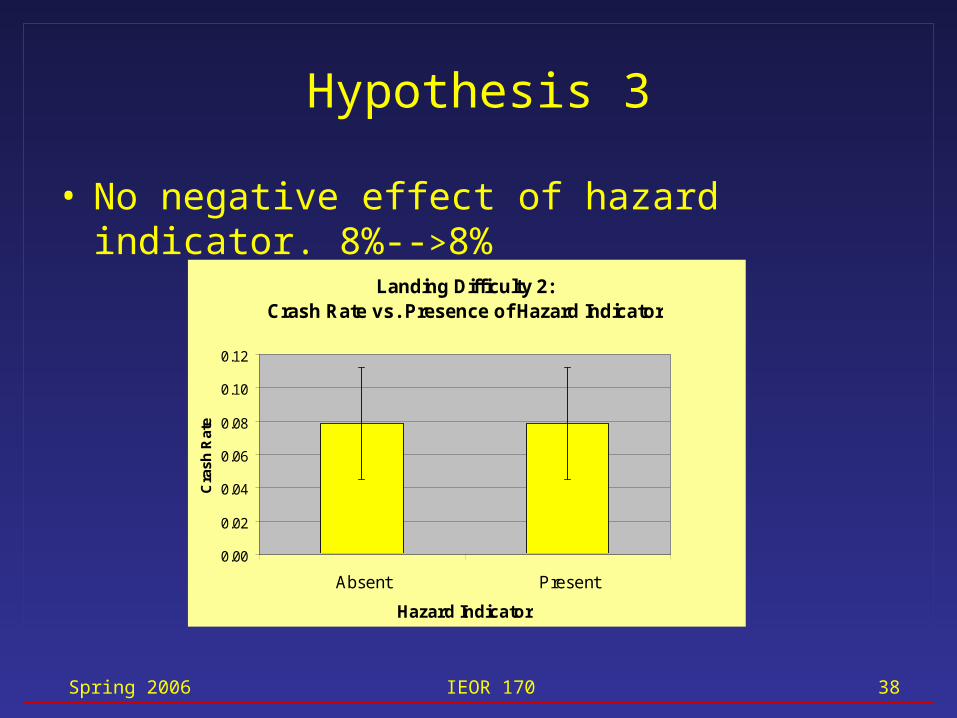
Hypothesis 3
• No negative effect of hazard indicator. 8%-->8%
Landing Difficulty 2:Crash Rate vs. Presence of Hazard Indicator
0.00
0.02
0.04
0.06
0.08
0.10
0.12
Absent Present
Hazard Indicator
Cra
sh R
ate
Spring 2006 IEOR 170 39
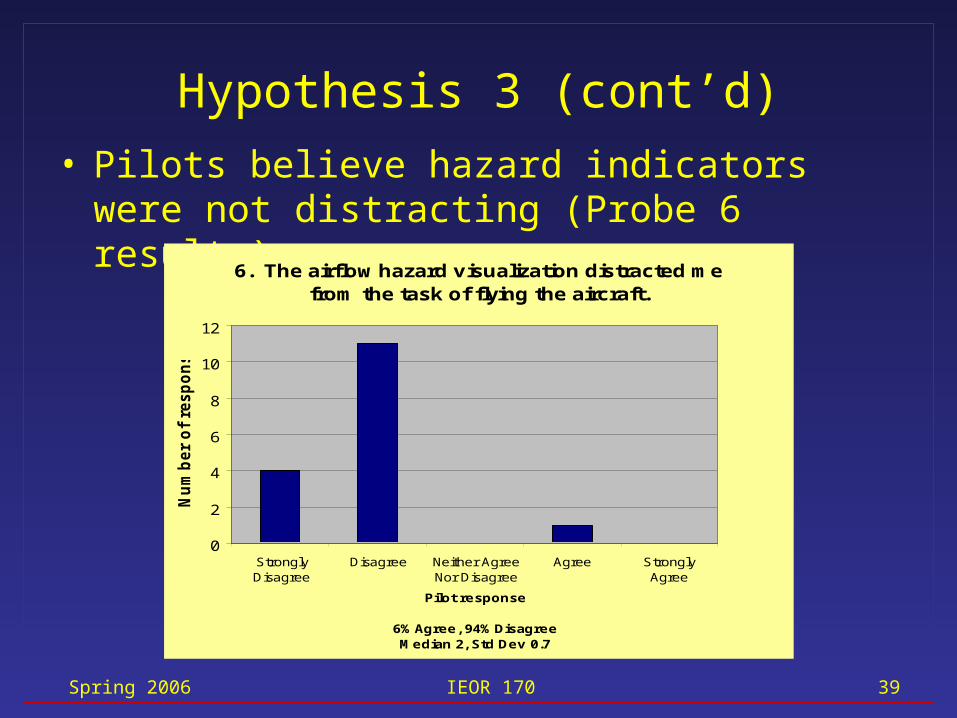
Hypothesis 3 (cont’d)
• Pilots believe hazard indicators were not distracting (Probe 6 results).
6. The airflow hazard visualization distracted me from the task of flying the aircraft.
0
2
4
6
8
10
12
StronglyDisagree
Disagree Neither AgreeNor Disagree
Agree StronglyAgree
Pilot response
6% Agree, 94% DisagreeMedian 2, Std Dev 0.7
Nu
mb
er
of
resp
on
ses
Spring 2006 IEOR 170 40
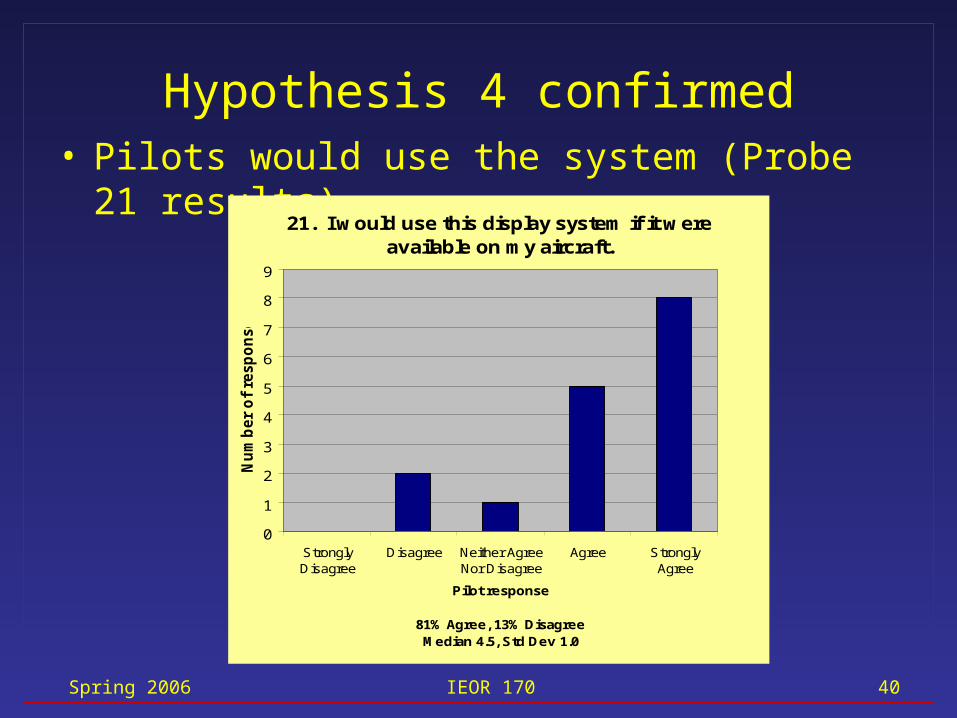
Hypothesis 4 confirmed• Pilots would use the system (Probe 21 results).
21. I would use this display system if it were available on my aircraft.
0
1
2
3
4
5
6
7
8
9
StronglyDisagree
Disagree Neither AgreeNor Disagree
Agree StronglyAgree
Pilot response
81% Agree, 13% DisagreeMedian 4.5, Std Dev 1.0
Nu
mb
er
of
resp
on
ses
Spring 2006 IEOR 170 41
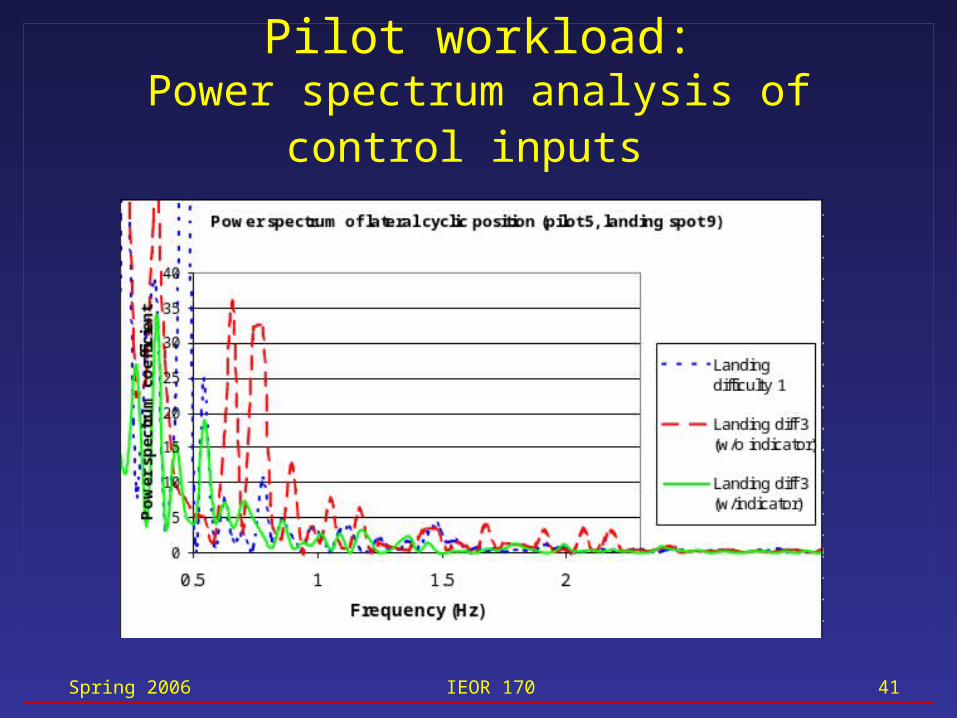
Pilot workload:Power spectrum analysis of control inputs
Spring 2006 IEOR 170 42
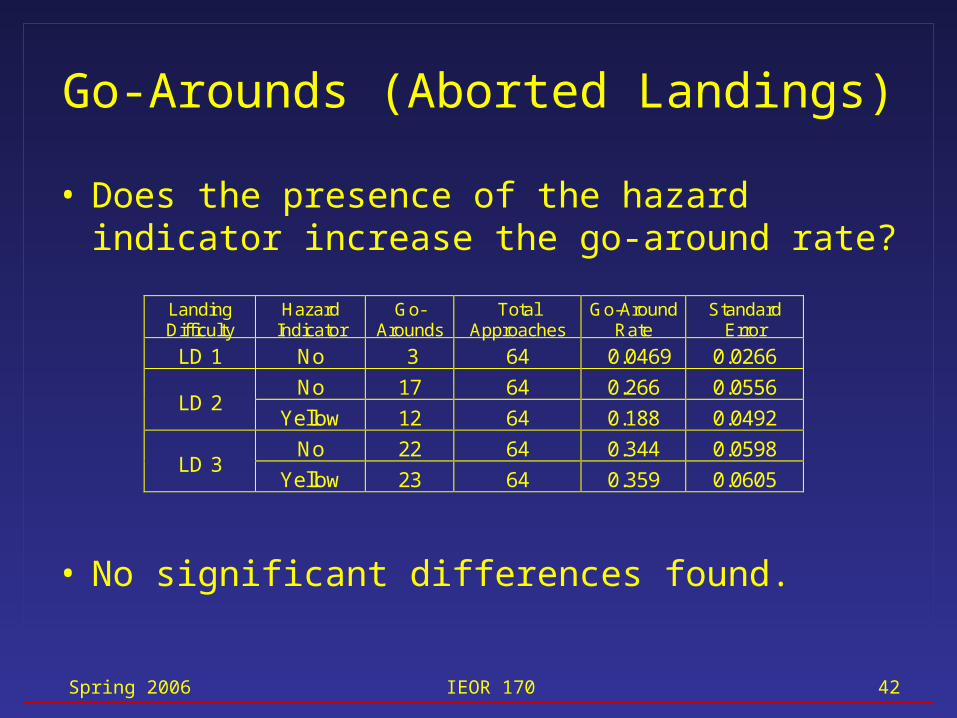
Go-Arounds (Aborted Landings)
• Does the presence of the hazard indicator increase the go-around rate?
• No significant differences found.
LandingDifficulty
HazardIndicator
Go-Arounds
TotalApproaches
Go-AroundRate
StandardError
LD 1 No 3 64 0.0469 0.0266
No 17 64 0.266 0.0556LD 2
Yellow 12 64 0.188 0.0492
No 22 64 0.344 0.0598LD 3
Yellow 23 64 0.359 0.0605
Spring 2006 IEOR 170 43
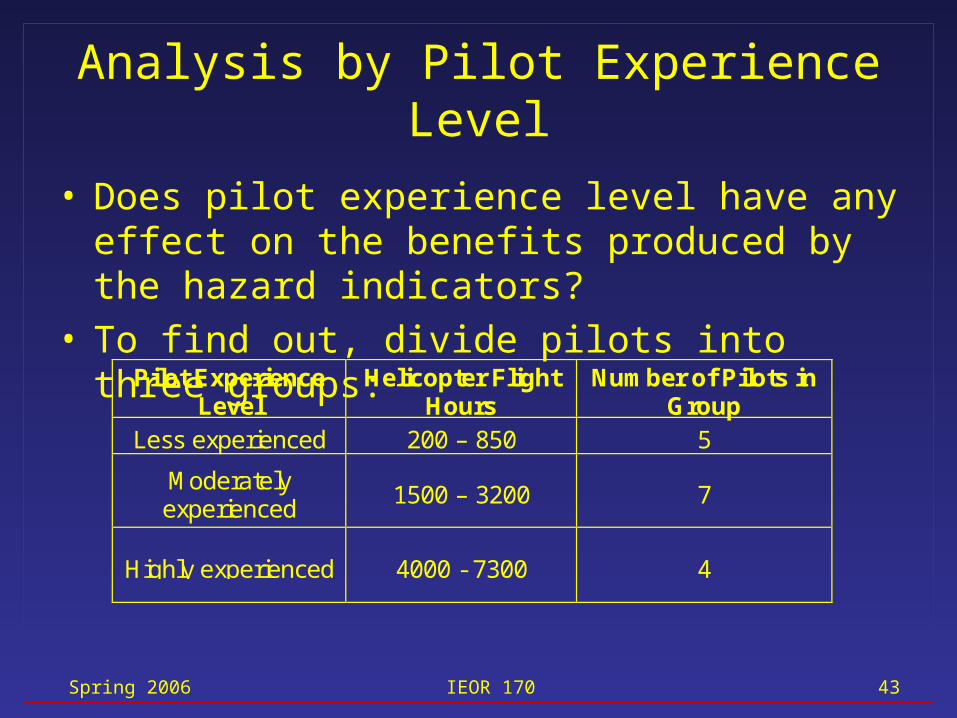
Analysis by Pilot Experience Level
• Does pilot experience level have any effect on the benefits produced by the hazard indicators?
• To find out, divide pilots into three groups:
Pilot ExperienceLevel
Helicopter FlightHours
Number of Pilots inGroup
Less experienced 200 – 850 5
Moderatelyexperienced
1500 – 3200 7
Highly experienced 4000 - 7300 4
Spring 2006 IEOR 170 44
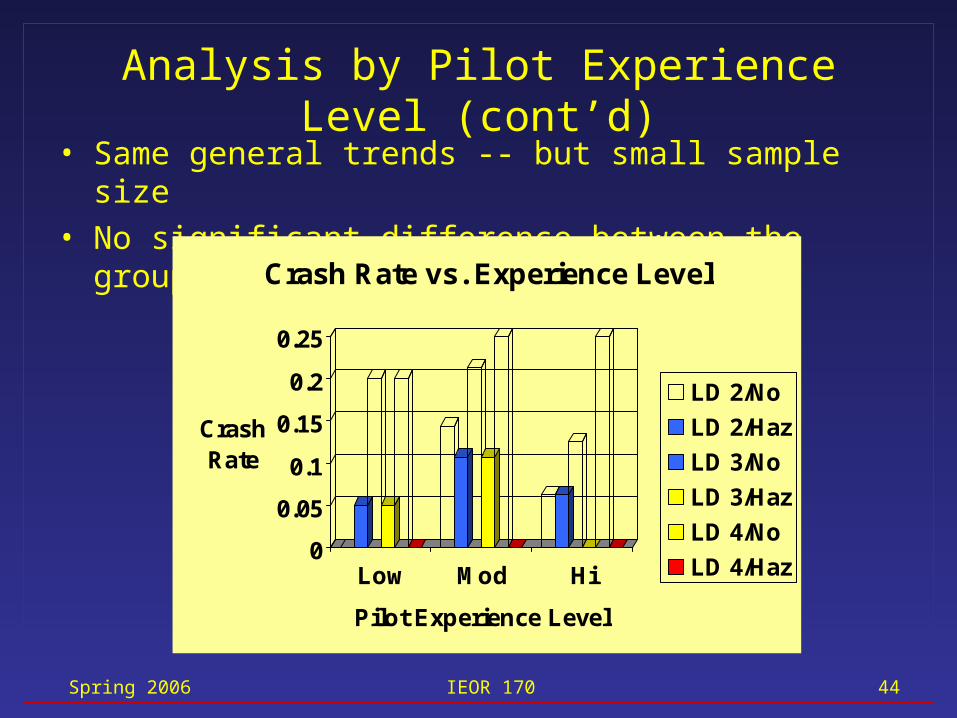
Analysis by Pilot Experience Level (cont’d)• Same general trends -- but small sample size• No significant difference between the groups
0
0.05
0.1
0.15
0.2
0.25
Crash Rate
Low Mod Hi
Pilot Experience Level
Crash Rate vs. Experience Level
LD 2/No
LD 2/Haz
LD 3/No
LD 3/Haz
LD 4/No
LD 4/Haz

Spring 2006 IEOR 170 45
Analysis of Subjective Data• 94% found hazard indicators helpful
18. The presence of the hazard indicators gave me more confidence as to the state of the winds and
airwake on deck.
0123456789
StronglyDisagree
Disagree Neither AgreeNor Disagree
Agree Strongly Agree
Pilot response
94% Agree, 6% DisagreeMedian 4, Std Dev 1.0
Nu
mb
er
of
res
po
ns
es
Spring 2006 IEOR 170 46
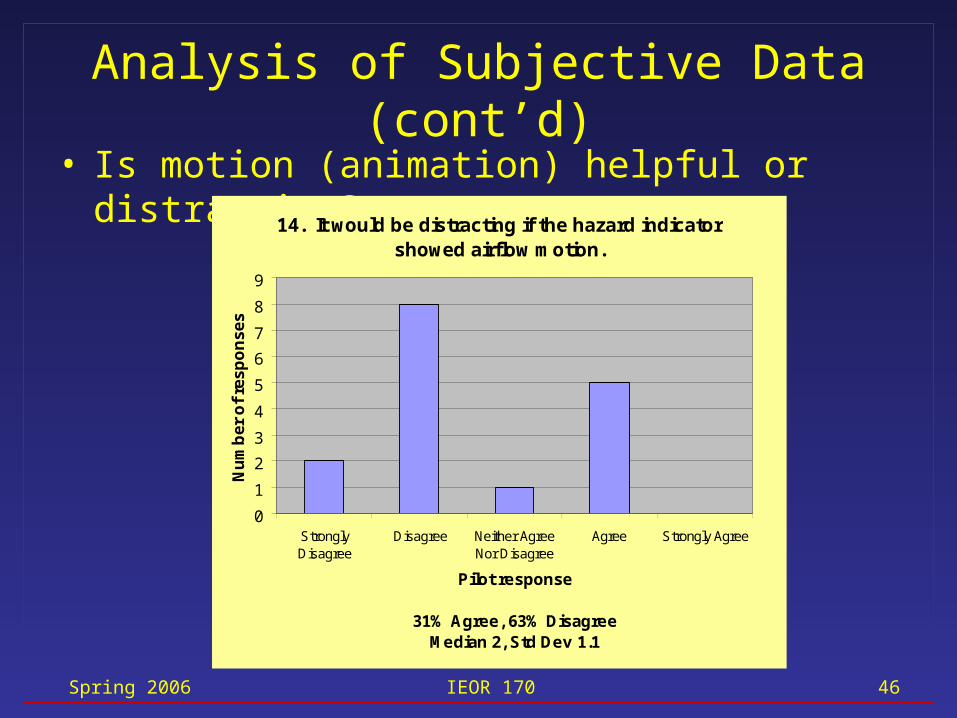
Analysis of Subjective Data (cont’d)
• Is motion (animation) helpful or distracting?14. It would be distracting if the hazard indicator
showed airflow motion.
0
1
2
3
4
5
6
7
8
9
StronglyDisagree
Disagree Neither AgreeNor Disagree
Agree Strongly Agree
Pilot response
31% Agree, 63% DisagreeMedian 2, Std Dev 1.1
Nu
mb
er o
f re
spo
nse
s
Spring 2006 IEOR 170 47
Conclusions and Further Work
Spring 2006 IEOR 170 48
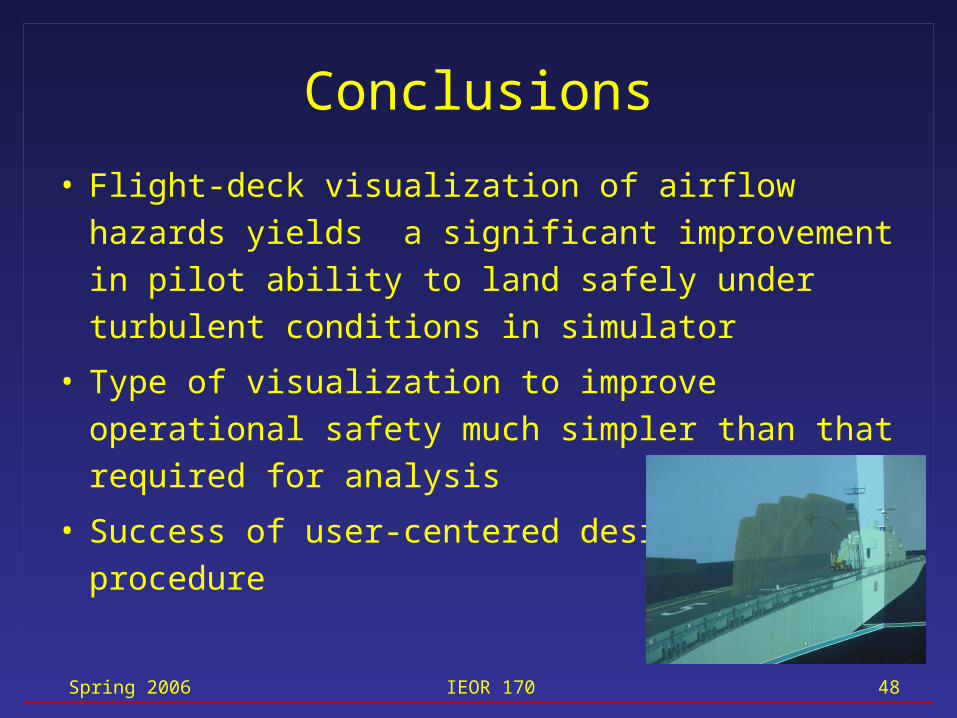
Conclusions
• Flight-deck visualization of airflow hazards yields
a significant improvement in pilot ability to land
safely under turbulent conditions in simulator
• Type of visualization to improve operational
safety much simpler than that required for
analysis
• Success of user-centered design
procedure
Spring 2006 IEOR 170 49
Further Work
• Additional data analysis
• Further studies
• Steps toward system deployment
• Extensions to other areas
Spring 2006 IEOR 170 50
Additional data analysis
• Power spectrum analysis of control input
data
• Flight path deviations and landing
dispersion
• Quantitative measures of landing quality
Spring 2006 IEOR 170 51
Further studies
• Quantitatively compare hazard indicators with other types– light/buzzer in cockpit– animated indicator– numeric information such as airflow velocity
• Adaptive displays– more detailed at beginning of approach, simpler at
end– how adapt to pilot state? physiological sensors vs.
pilot-selectable modes
Spring 2006 IEOR 170 52
Steps toward system deployment
• Collaboration with lidar developers,
integration with real-time data
• Integration with synthetic vision displays
• Augmented reality image registration
Spring 2006 IEOR 170 53
Extensions to other areas
• Other aviation domains– aerial firefighting– search and rescue– offshore oil platforms– unmanned aerial vehicles (UAVs)– fixed-wing operations
• Space exploration• Emergency response• Automobiles or other motor vehicles
Spring 2006 IEOR 170 54
Extra Slides
Spring 2006 IEOR 170 55
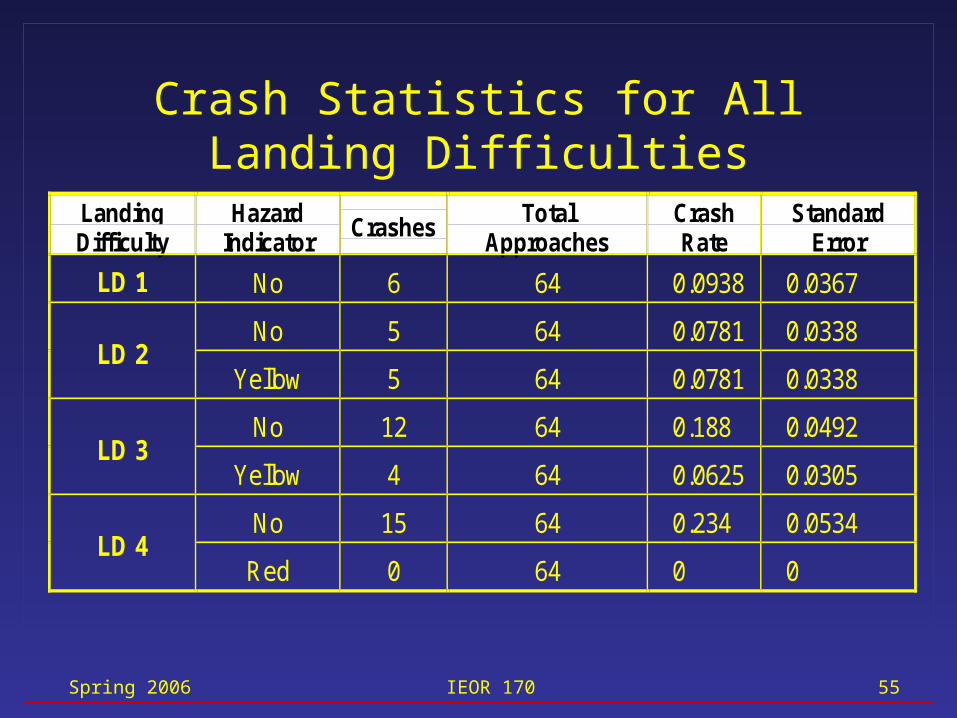
Crash Statistics for All Landing Difficulties
LandingDifficulty
HazardIndicator
CrashesTotal
ApproachesCrashRate
StandardError
LD 1 No 6 64 0.0938 0.0367
No 5 64 0.0781 0.0338LD 2
Yellow 5 64 0.0781 0.0338
No 12 64 0.188 0.0492LD 3
Yellow 4 64 0.0625 0.0305
No 15 64 0.234 0.0534LD 4
Red 0 64 0 0
Spring 2006 IEOR 170 56
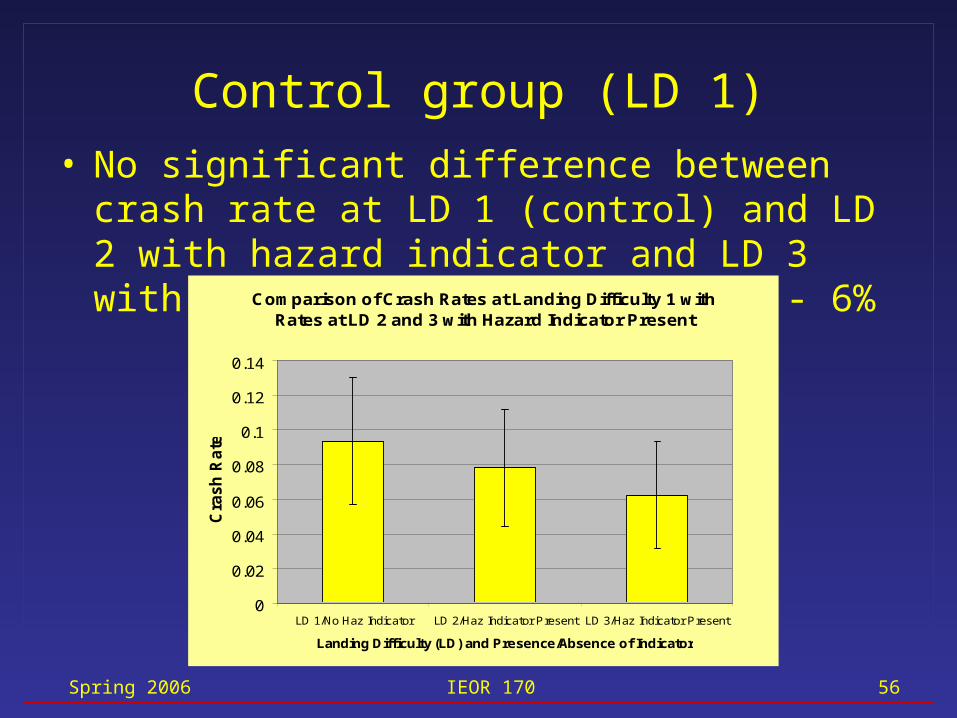
Control group (LD 1)
• No significant difference between crash rate at LD 1 (control) and LD 2 with hazard indicator and LD 3 with hazard indicator. 9% - 8% - 6%
Comparison of Crash Rates at Landing Difficulty 1 with Rates at LD 2 and 3 with Hazard Indicator Present
0
0.02
0.04
0.06
0.08
0.1
0.12
0.14
LD 1/No Haz Indicator LD 2/Haz Indicator Present LD 3/Haz Indicator Present
Landing Difficulty (LD) and Presence/Absence of Indicator
Cra
sh
Ra
te
Spring 2006 IEOR 170 57
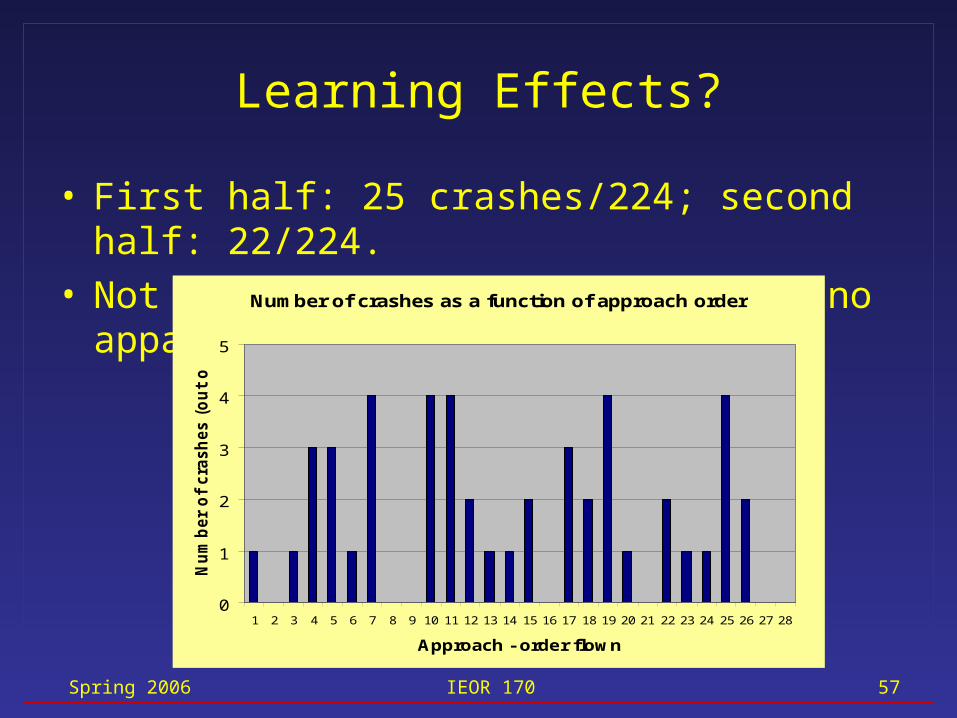
Learning Effects?
• First half: 25 crashes/224; second half: 22/224.• Not a significant difference --> no apparent bias.
Number of crashes as a function of approach order
0
1
2
3
4
5
1 2 3 4 5 6 7 8 9 10 11 12 13 14 15 16 17 18 19 20 21 22 23 24 25 26 27 28
Approach - order flown
Nu
mb
er
of
cra
sh
es (
ou
t o
f 16)
Spring 2006 IEOR 170 58
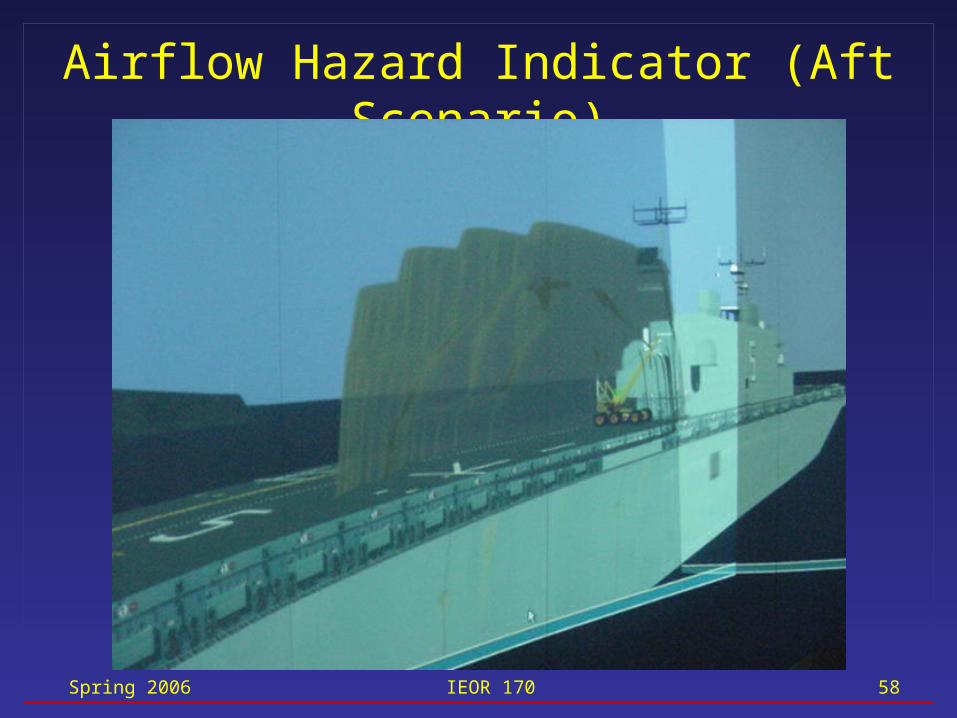
Airflow Hazard Indicator (Aft Scenario)
Spring 2006 IEOR 170 59
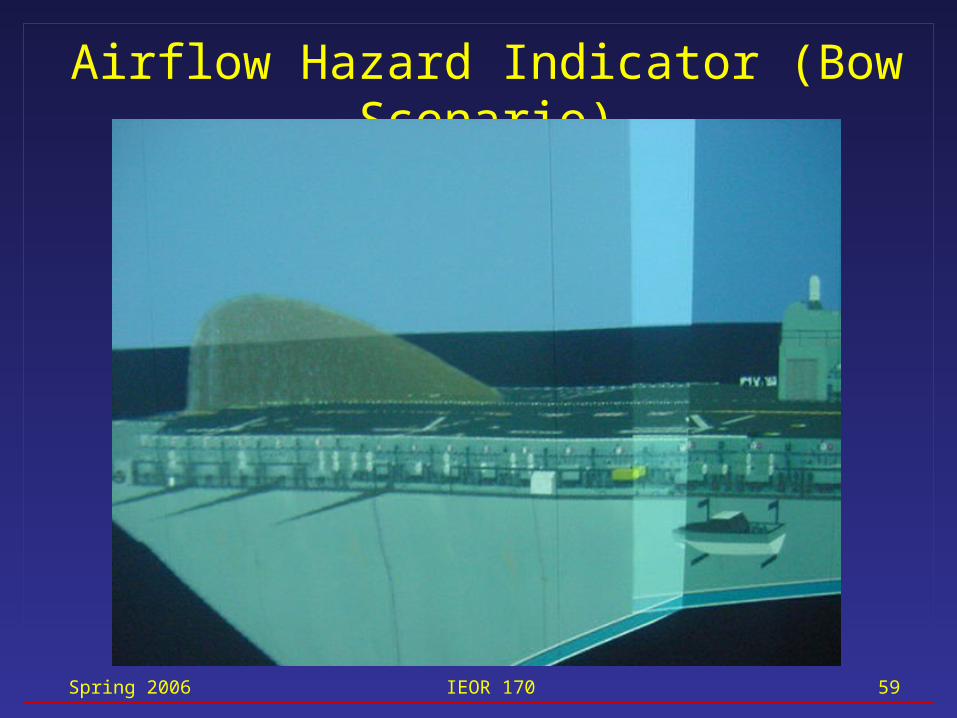
Airflow Hazard Indicator (Bow Scenario)
Spring 2006 IEOR 170 60
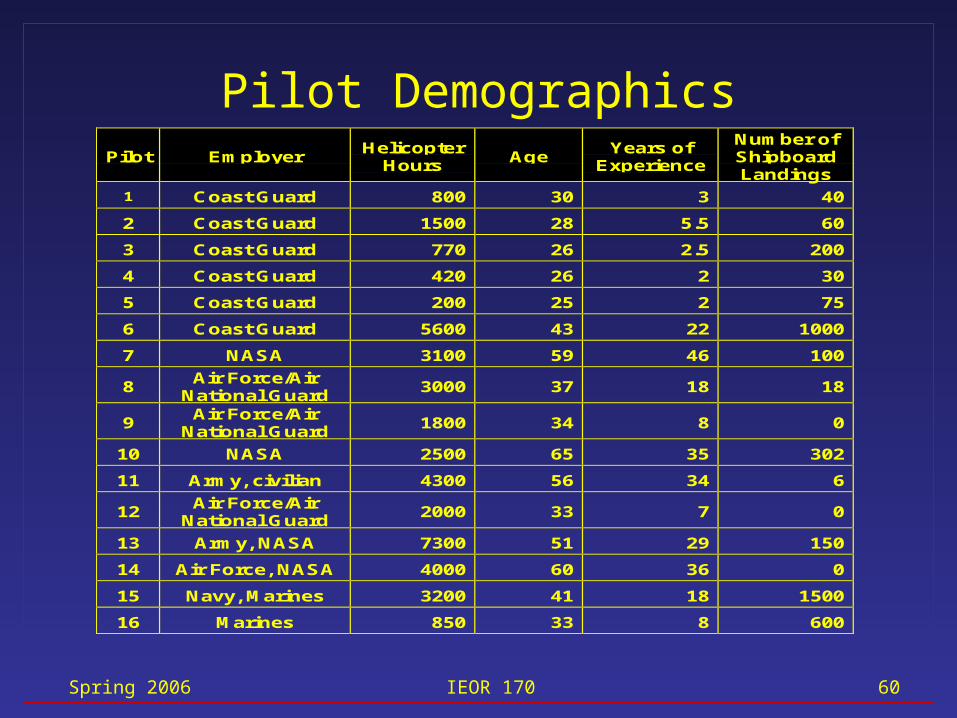
Pilot EmployerHelicopter
HoursAge
Years ofExperience
Number ofShipboardLandings
1 Coast Guard 800 30 3 40
2 Coast Guard 1500 28 5.5 60
3 Coast Guard 770 26 2.5 200
4 Coast Guard 420 26 2 30
5 Coast Guard 200 25 2 75
6 Coast Guard 5600 43 22 1000
7 NASA 3100 59 46 100
8Air Force/Air
National Guard3000 37 18 18
9Air Force/Air
National Guard1800 34 8 0
10 NASA 2500 65 35 302
11 Army, civilian 4300 56 34 6
12Air Force/Air
National Guard2000 33 7 0
13 Army, NASA 7300 51 29 150
14 Air Force, NASA 4000 60 36 0
15 Navy, Marines 3200 41 18 1500
16 Marines 850 33 8 600
Pilot Demographics
Spring 2006 IEOR 170 61
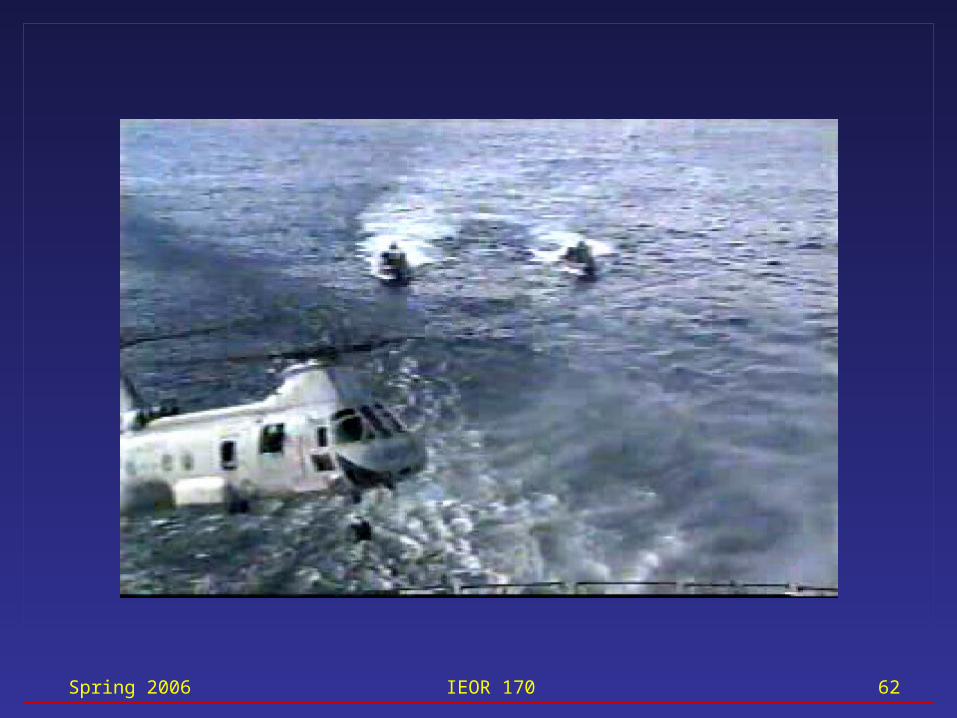
Spring 2006 IEOR 170 62
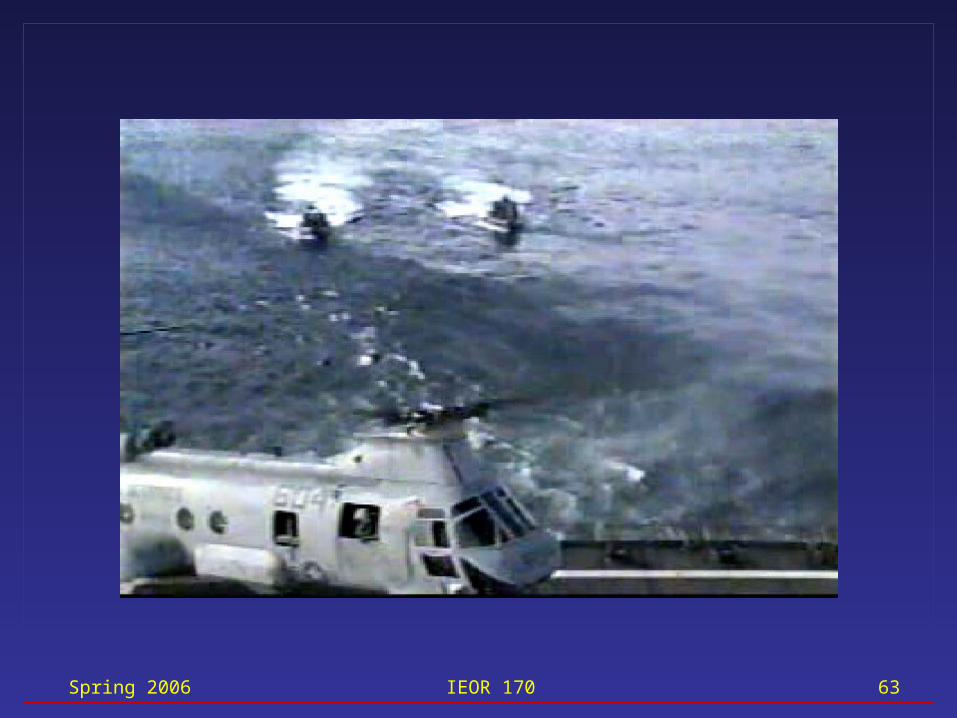
Spring 2006 IEOR 170 63
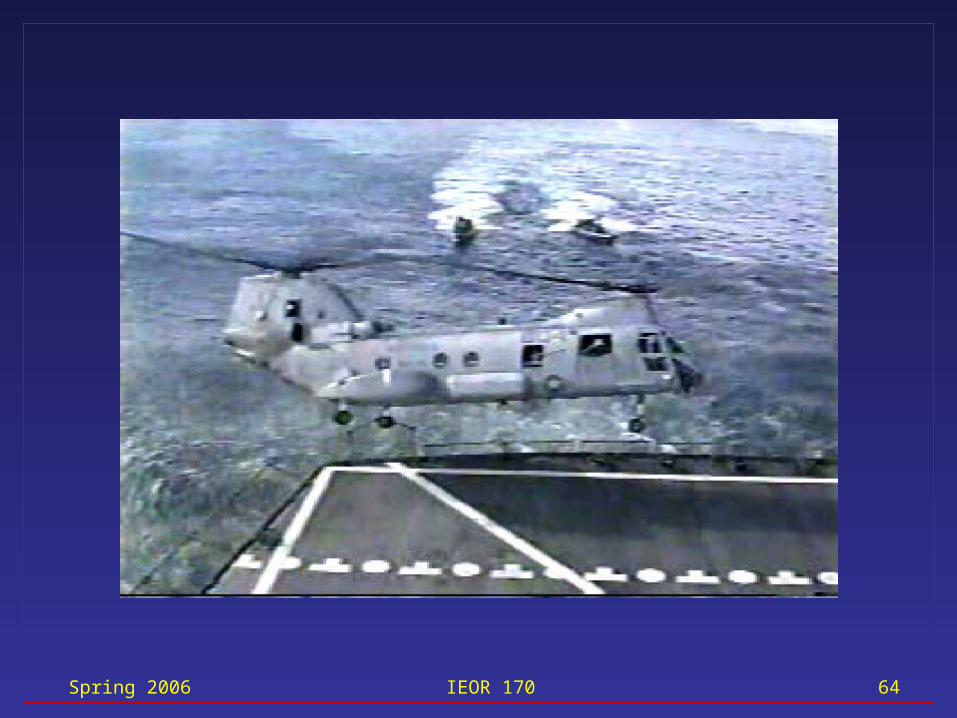
Spring 2006 IEOR 170 64
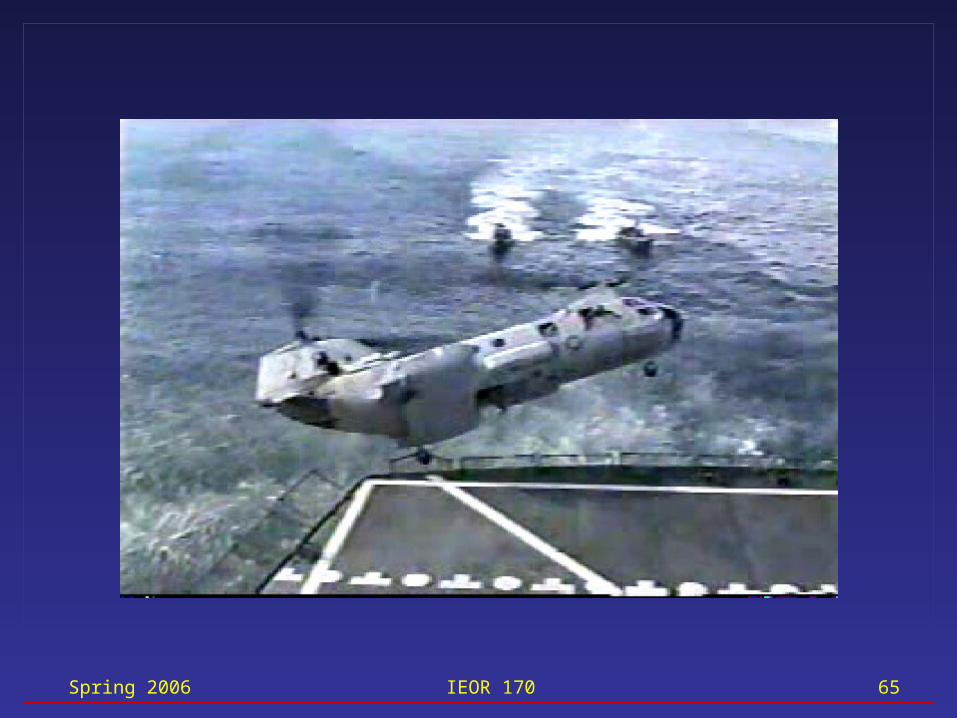
Spring 2006 IEOR 170 65
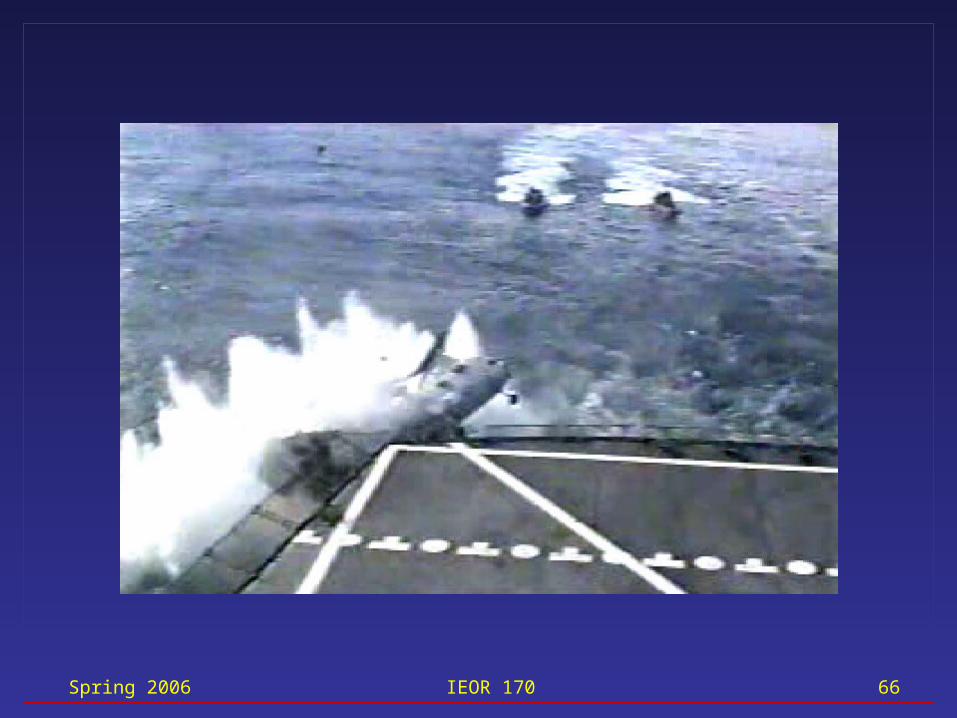
Spring 2006 IEOR 170 66
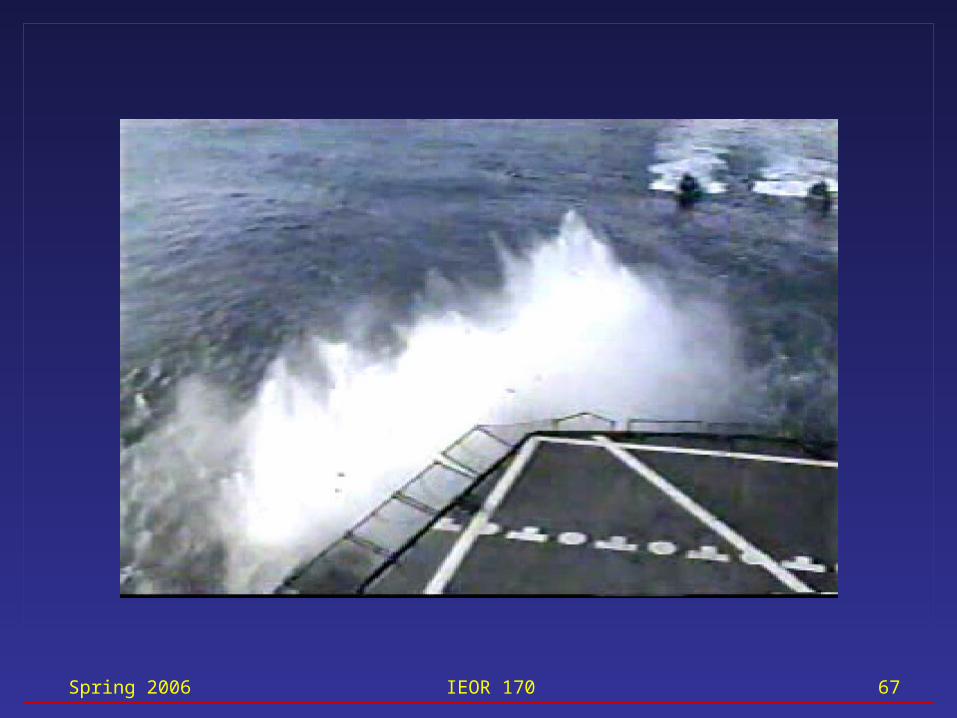
Spring 2006 IEOR 170 67
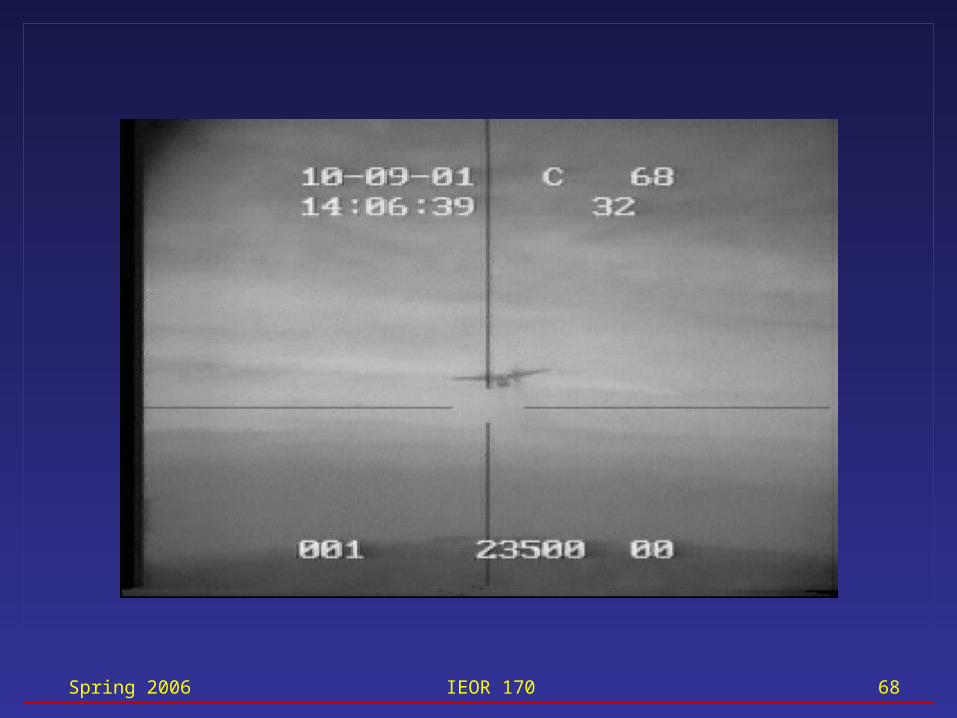
Spring 2006 IEOR 170 68
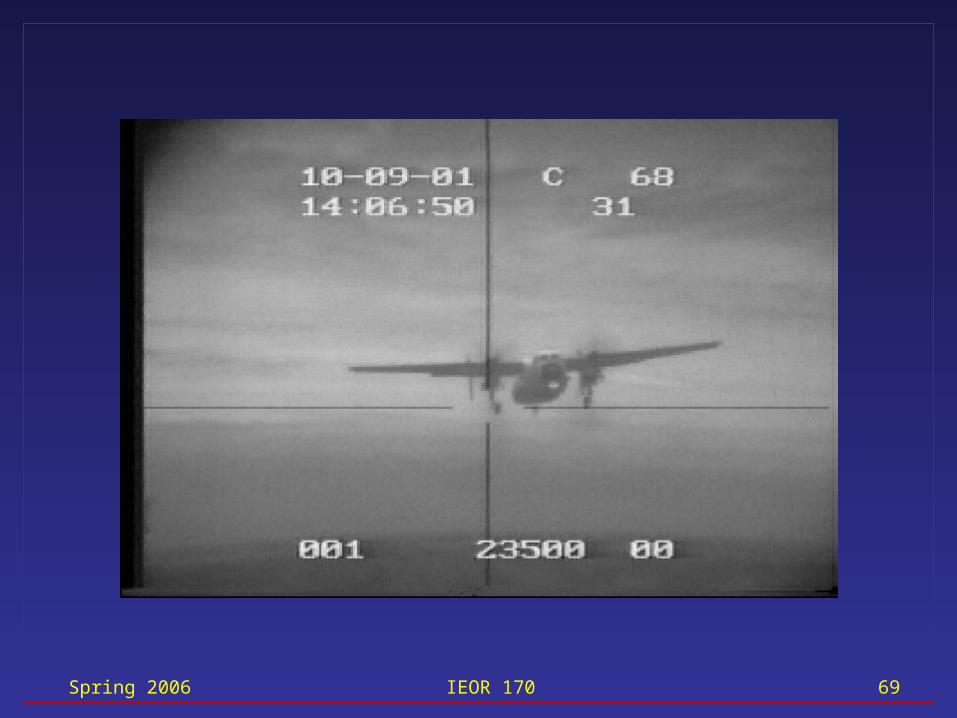
Spring 2006 IEOR 170 69
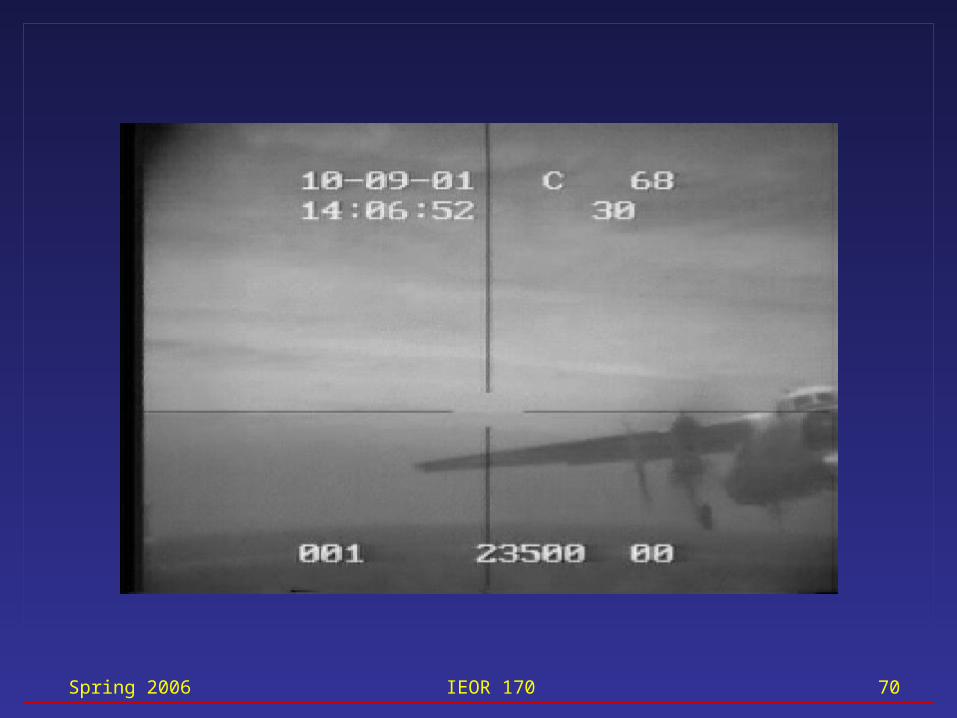
Spring 2006 IEOR 170 70
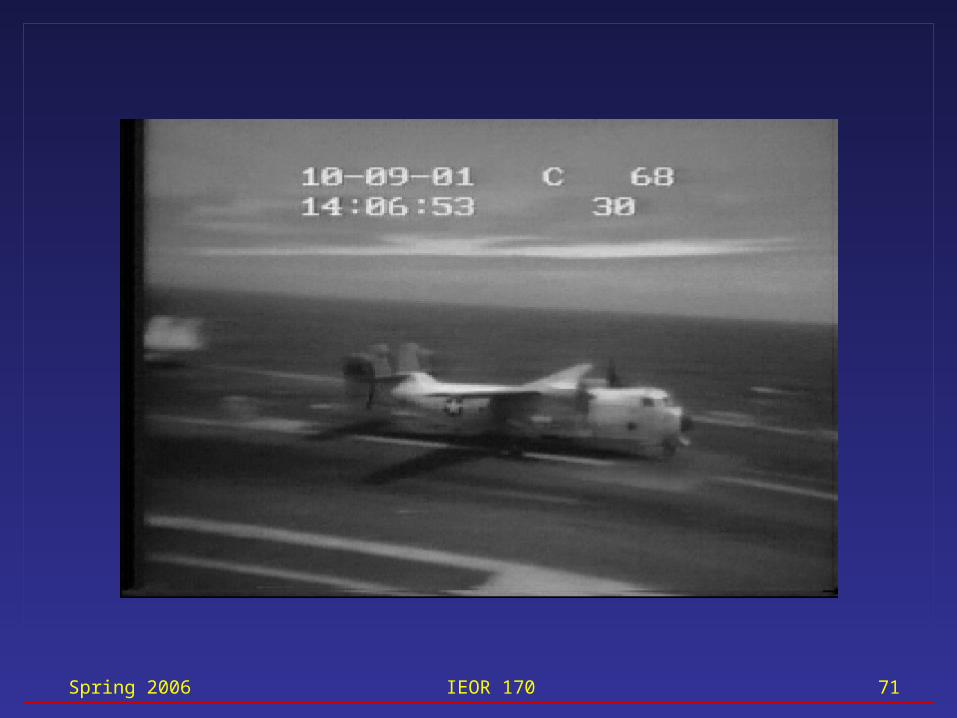
Spring 2006 IEOR 170 71
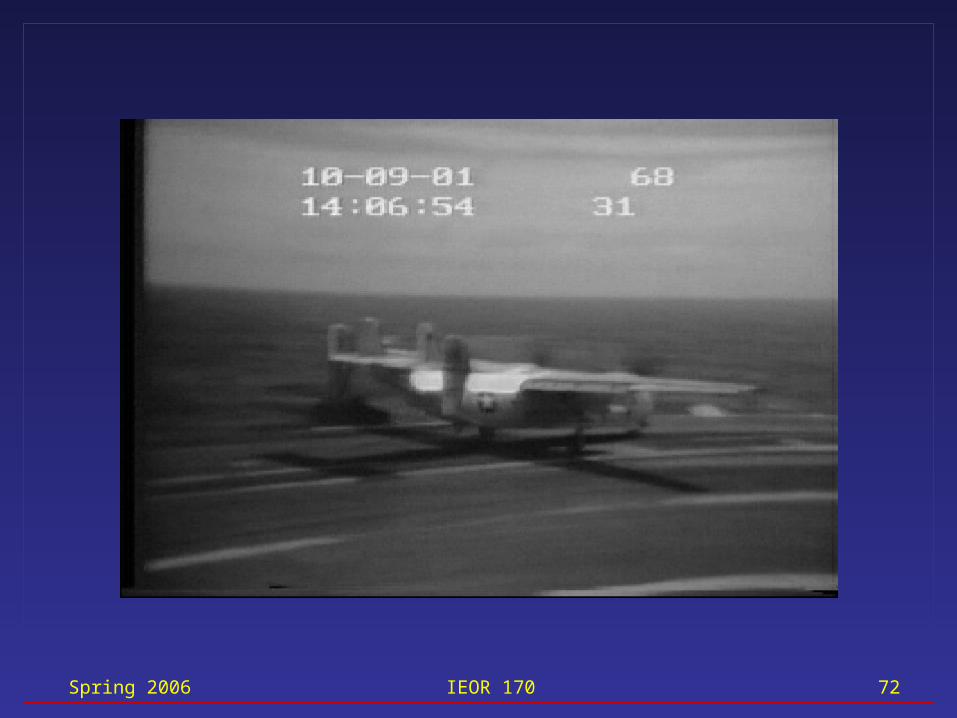
Spring 2006 IEOR 170 72
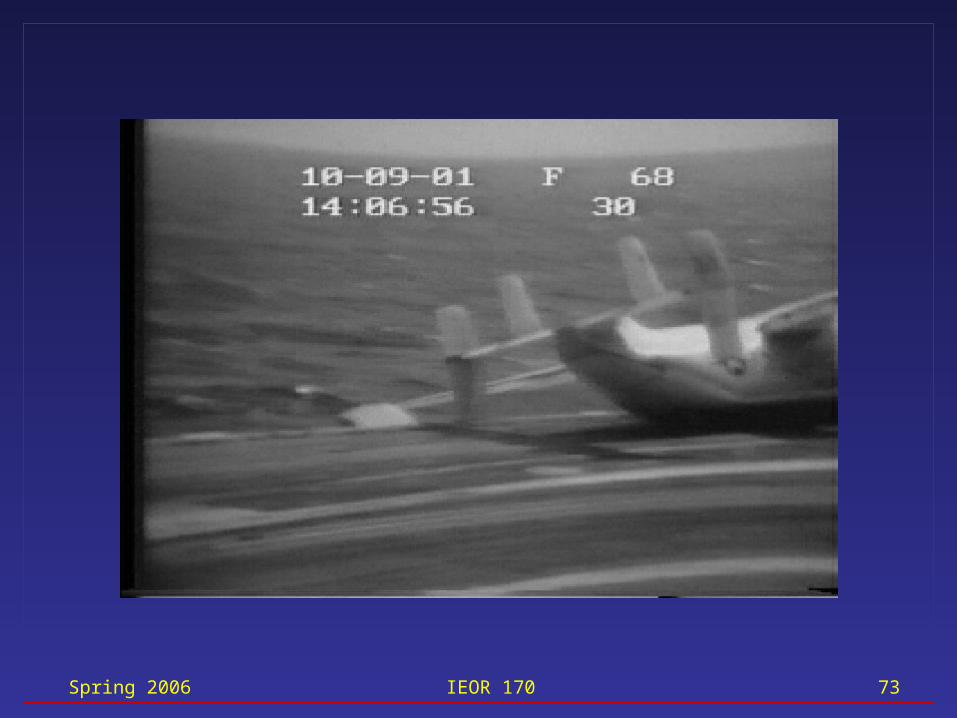
Spring 2006 IEOR 170 73
Spring 2006 IEOR 170 74
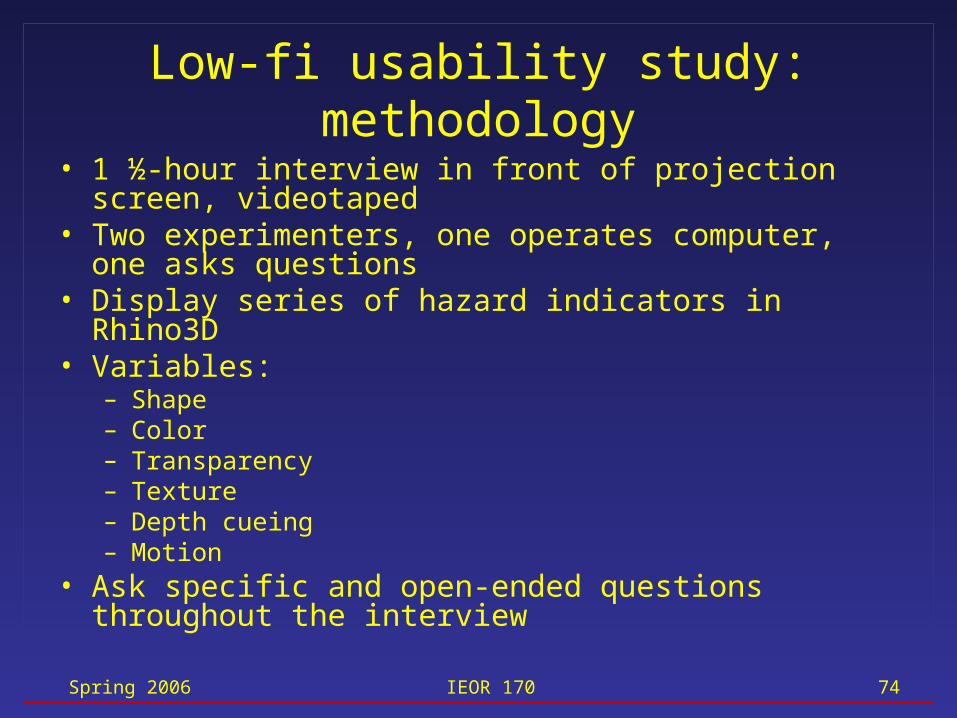
Low-fi usability study: methodology
• 1 ½-hour interview in front of projection screen, videotaped
• Two experimenters, one operates computer, one asks questions
• Display series of hazard indicators in Rhino3D • Variables:
– Shape– Color– Transparency– Texture– Depth cueing– Motion
• Ask specific and open-ended questions throughout the interview
Spring 2006 IEOR 170 75
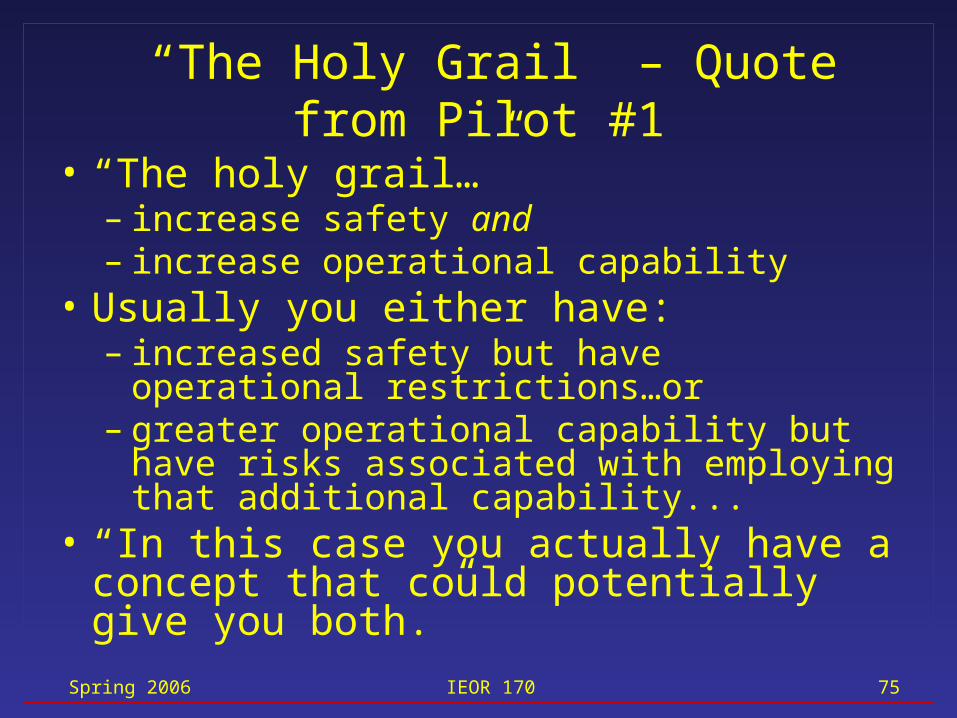
“The Holy Grail” – Quote from Pilot #1
• “The holy grail…”– increase safety and– increase operational capability
• Usually you either have:– increased safety but have operational
restrictions…or– greater operational capability but have risks
associated with employing that additional capability...
• “In this case you actually have a concept that could potentially give you both.”