Embed Size (px)
Citation preview
IMPACT OF TEACHING METHODS ON STUDENTS' PERFOMANCE IN
MATHEMATICS, WITHIN MUKONO DISTRICT, UGANDA
BY
SSEKY ANZI YEKO
BED/24378/SlDU
A RESEARCH REPORT SUBMITTED TO THE INSTITUTE OF OPEN
AND DISTANCE LEARNING IN PARTIAL FULFILMENT
OF THE REQUIREMENTS FOR THE AWARD OF A DEGREE
OF BACHELOR OF EDUCATION IN ARTS OF
KAMPALA INTERNATIONAL
UNIVERSITY
APRIL2010

DECLARATION:
I Ssekyanzi Yeko, declare that this research project is my original work and has never
been submitted to any university for any award. Where the works of others have been
cited. acknowledgment has been made.
Signature.~ ................ ..
Ssekyanzi Y eko
Date .. ?-: 1 ~- .. A..P., ; ( v ~~- ...... . .
ll
APPROVAL
I certify that the work submitted by this candidate was under my supervision as the
University assigned supervisor.
Supervisor. .... (;z ...... . Ssekajugo Derrick
2~ /oJ.t / ;_q~ Date ... . ....................... .
111
ACKNOWLEDGMENT
My gratitude goes to my supervisor Mr. Ssekajugo Derrick for the advice and
guidance while I was writing this project and also for providing useful references in
order to improve the quality of this project. On the same note, I would like to thank
my dear parents Mr.Bitegese Emmanuel and Mrs.Kiwuka Joy, my brother Stephen
Nyigira and my friend Aye bare Tumwebaze.
IV

DEDICATION
I would like to dedicate this research to my parents; Mr.Bitegese Emmanuel and Mrs.
Kiwuka Joy for the love and support accorded to me throughout my studies.
v
TABLE OF CONTENTS
DECLARATION: ............................................................................................................... ii
APPROVAL ...................................................................................................................... iii
ACKNOWLEDGMENT .................................................................................................... iv
DEDICATION .................................................................................................................... v
TABLE OF CONTENTS ................................................................................................... vi
LIST OF TABLES ............................................................................................................. ix
ABSTRACT ........................................................................................................................ x
CHAPTER ONE .................................................................................................................. I
INTRODUCTION ............................................................................................................... !
I.OBackground to the study ............................................................................................. !
1.2 Statement of the problem .......................................................................................... 3
1.3 Objectives of the Study ............................................................................................. 3
1.3.1 General Objective ................................................................................................ 3
I o ? S "fi Ob" . o .~.- pec1 IC ~ectives ............................................................................................. ~
1.4Research Questions .................................................................................................... 3
1.5 Scope ofthe Study ..................................................................................................... 4
1.6 Significance of the Study .......................................................................................... 4
CHAPTER TW0 ................................................................................................................. 5
LITERATURE REVIEW .................................................................................................... 5
2.0 Introduction ............................................................................................................... 5
2.1 Overview of Education System in Uganda ............................................................... 5
2.2 Mathematics as a Challenge ...................................................................................... 6
2.3 How teaching methods affect performance ............................................................... 7
2.4 Teaching methods and Perception of students .......................................................... 9
2.5 An Overview ........................................................................................................... 12
VI
CHAPTER THREE ........................................................................................................... l3
RESEARCH METHODOLOGY ...................................................................................... 13
3.0 Introduction ............................................................................................................. 13
3 .I Research Design ...................................................................................................... 13
3.2 Research Population ................................................................................................ 13
3.3 Study Sample ........................................................................................................... 13
3.5 Research Instruments .............................................................................................. 14
3.6 Research Procedure ................................................................................................. 14
3. 7 Data Analysis and Interpretation ............................................................................. 14
4.0 Introduction ............................................................................................................. 15
4.2.1 Bio-Data Analysis ofTeachers ......................................................................... 15
4.2.2 Bio-Data Analysis of Students ......................................................................... 17
4.3.0 Teachers Analysis ............................................................................................. 19
4.3.1 Response on how teaching methods affect performance in mathematics ........ 19
4.3.2 Responses on how effective are teaching methods on students' perception of
mathematics ............................................................................................................... 19
4.3.3 Response on whether mathematics is important in the technological field ...... 20
4.4.0 Students Analysis ............................................................................................. 21
4.4.1 Response on whether teaching methods affect students' performance in
mathematics ............................................................................................................... 21
4.4.2 Responses on how effective are teaching methods on students' perception of
mathematics ............................................................................................................... 21
4.4.3 Response on whether mathematics is important in the technological field ...... 22
CHAPTER FIVE ............................................................................................................... 23
CONCLUSIONS AND RECOMMENDATIONS ............................................................ 23
5.0 Introduction ............................................................................................................. 23
5.1 Discussion and Conclusions .................................................................................... 23
5.2 Recommendations ................................................................................................... 27
5.3 General Observation and Deduction ....................................................................... 28
VII
REFERENCES .................................................................................................................. 29
APPENDIX I ................................................................................................................. 30
RESEARCH BUDGET ................................................................................................. 30
APPENDIX II ................................................................................................................ 31
TIME FRAME .............................................................................................................. 31
APPENDIX III .............................................................................................................. 32
TEACHERS' QUESTIONNAIRE ................................................................................ 32
APPENDIX IV .............................................................................................................. 36
STUDENTS QUESTIONNAIRE ................................................................................. 36
Vlll
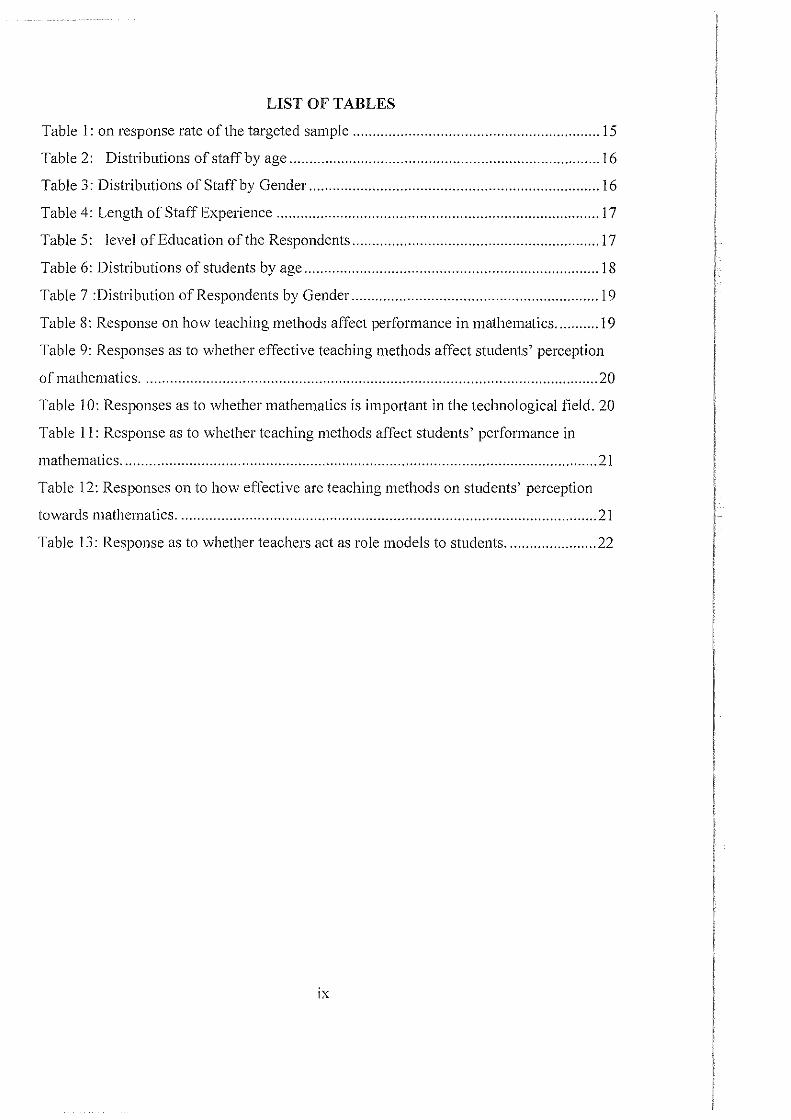
LIST OF TABLES
Table 1: on response rate of the targeted sample .............................................................. 15
Table 2: Distributions of staff by age .............................................................................. 16
Table 3: Distributions of Staff by Gender ......................................................................... l6
Table 4: Length of Staff Experience ................................................................................. 17
Table 5: level of Education of the Respondents .............................................................. 17
Table 6: Distributions of students by age .......................................................................... 18
Table 7 :Distribution of Respondents by Gender .............................................................. 19
Table 8: Response on how teaching methods affect performance in mathematics ........... 19
Table 9: Responses as to whether effective teaching methods affect students' perception
of mathematics .................................................................................................................. 20
Table l 0: Responses as to whether mathematics is important in the technological field. 20
Table II: Response as to whether teaching methods affect students' performance in
mathematics ....................................................................................................................... 21
Table 12: Responses on to how effective are teaching methods on students' perception
towards mathematics ......................................................................................................... 21
Table 13: Response as to whether teachers act as role models to students ....................... 22
ix
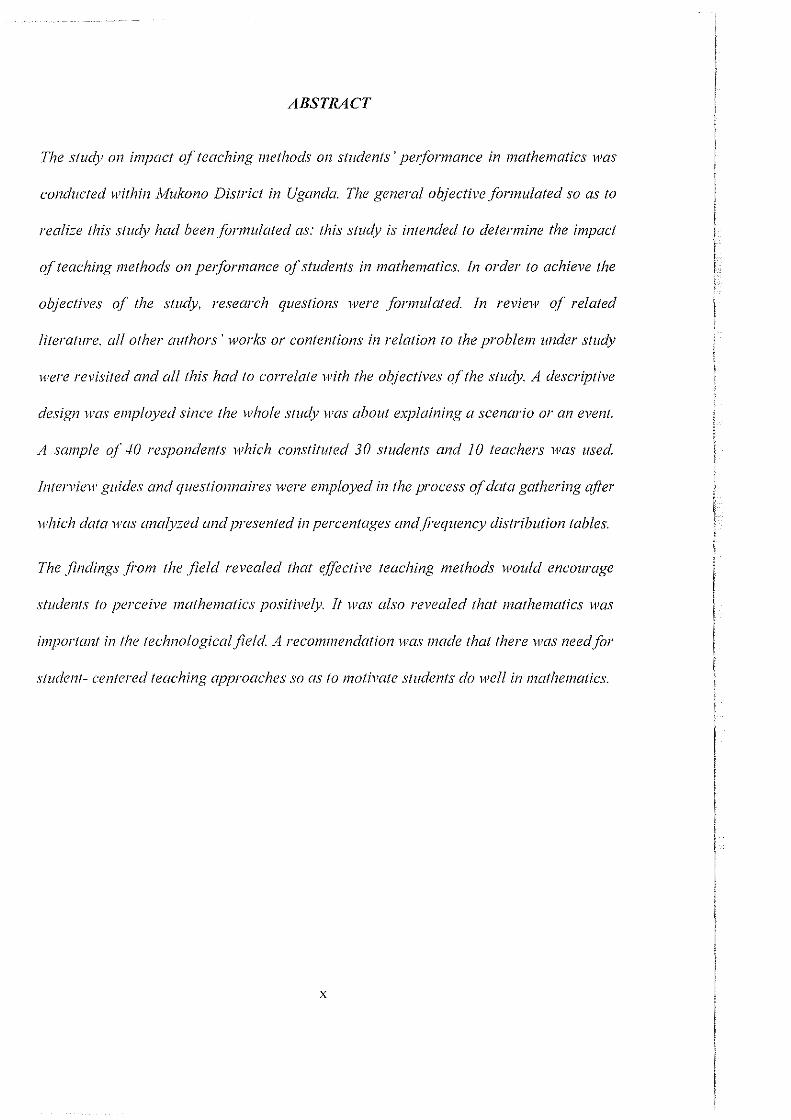
ABSTRACT
The study on impact of teaching methods on students' performance in mathematics was
conducted within lvfukono District in Uganda. The general objective formulated so as to
realize this study had been formulated as: this study is intended to determine the impact
of teaching methods on performance of students in mathematics. In order to achieve the
objectives of the study, research questions were formulated. In review of related
literature, all other authors' works or contentions in relation to the problem under study
were revisited and all this had to correlate with the objectives of the study. A descriptive
design was employed since the whole study was about explaining a scenario or an event.
A sample ()/.f.O respondents which constituted 30 students and I 0 teachers was used.
111/erview guides and questionnaires were employed in the process ol data gathering afrer
ll'hich data was analyzed and presented in percentages andfi·equency distribution tables.
The findings fi"om the field revealed that effective teaching methods would encourage
studen!s to perceive mathematics positively. It was also revealed that mathematics was
important in the technological field. A recommendation was made that there was needfor
student- centered teaching approaches so as to motivate students do well in mathematics.
X
CHAPTER ONE
INTRODUCTION
In this introductory chapter of the study, the researcher gave the context and theoretical
background of mathematics learning difficulties. The researcher proceeded to give the
statement of the problem. the objectives and the research questions that would guide the
scope of the study. The researcher also explained the limitations and delimitations that
affected the progress of the study.
l.OBackground to the study
Considering the contributions of mathematics, science, and technology to today's world,
one would have expected mounting interest in these disciplines, but the reverse seems to be
the case. Indeed, there is declining enrolment in mathematics and science subjects among
the youth. and poor performance in examinations, such as those taken in high school math
and science courses (especially physics) by the brave few who enroll (Fieldman, K.A.
1999).
It is ironical that in our pro-science and technologically oriented world, the youth who
would take charge of global affairs in the future - the running of industries and the means
of production. research laboratories, space technology. and international politics - are
shying away from the very subjects that should adequately prepare them for such roles.
Improvement of the quality of education in Uganda has been a key feature of reform
proposals of the government. These educational reforms largely focus on basic education,
which in Uganda covers both pnmary and secondary education. Attempts towards
realizing these proposals have been made in many ways.
Free primary education is now being offered to ensure every child has an equal opportunity
to the primary education. While the government is trying to ensure this, a lot of work is
being done to improve the quality of the same education. Focus is on better student
achievements in all the areas covered in the syllabus at all levels.
A lot of research has been done to find out ways of producing better quality education for
the Ugandan children. For instance a lot of research has been done in the area of
mathematics because poor performance in the subject at the end of secondary school has
been an age long problem.
Studies done show that there is constant poor performance in the subject and that gender
differences, in favour of boys, is a major issue that influences the poor performance in
mathematics (Eshiwani, I 985; Mondoh, 2006; Samumkut, I 999; Mwangi, I 996; Boil,
I 986; Irumbi. 2005; Njuguna, 2002; Katiambo, 2004).
These studies point out that the girls underachieve in mathematics due to lack of self
confidence and poor attitudes towards the subject. Gender differences in mathematics were
found to be more persistent in upper grades than in lower grades (primary school) and that
the girls in single sex schools performed better than those in mixed schools
2
1.2 Statement of the problem
Mathematics teaching as a subject has drawn a lot of controversy on the appropriate
methods to be applied for student's better understanding. Yet no clear method can be
plainly pointed as the most appropriate since there is a decline in enrolment from the
youth. Hence the study investigated how the teaching methods affect a student's perception
of mathematics.
1.3 Objectives of the Study
1.3.1Genei·al Objective
The study intended to investigate the impact of teaching methods on performance of
students in mathematics.
1.3.2 Specific Objectives
The study was intended to:
I. Determine how teaching methods affect performance of students in mathematics.
2. To raise awareness of the importance of mathematics in the technological field
3. Ensure that teachers are able to use better teaching methods for their students
1.4Research Questions
I. How does teaching methods affect performance of students in mathematics?
I. Of what importance is mathematics in the field of technology?
2. Which teaching methods should be adopted by teachers to make the teaching of
mathematics effective?
3
1.5 Scope of the Study
The research was carried out between February and April 2010. The study looked at the
impact of teaching methods on performance o students in mathematics. The research was
carried out in Mukono district.
1.6 Significance of the Study
The researcher was able to get first hand information on the effects of teaching methods on
performance of science by students therefore; it is thought to be of great importance to the
following parties:
The schools in Mukono district are expected to benefit from the research as it will help
them to evaluate the appropriate teaching methods to apply for better performance of
students.
The research will be of great help to give a kick start to other researchers who might wish
to enhance the same study later.
4
2.0 Introduction
CHAPTER TWO
LITERATURE REVIEW
This chapter gave reference to what other scholars have written about mathematics as a
subject and the effective teaching methods used in class. The materials used in the review
included magazines and journals on teaching methods, newspapers articles and education
related websites over the internet.
2.1 Overview of Education System in Uganda
Education in Uganda consists of one to three years of pre-primary education (ages 3-6),
seven years of primary education (ages 6-14). four years of secondary education (ages 14-
19). and three years of university education leading to a bachelors degree. In Uganda the
curriculum is controlled by the Uganda Curriculum Development Centre, which draws its
representation fi·om a wide range of teachers and experts from universities. (MOE,
1976).The secondary school mathematics syllabus is very demanding on the majority of
students, many of whom find certain topics extremely difficult to comprehend.
In the first year of secondary mathematics education, algebra content emphasizes
coordinates and graphs and simplifying expressions. In the second year. students encounter
linear equations; quadratic expressions and equations; linear inequalities; and basic
statistics. In the third year of secondary mathematics education, students continue their
work with quadratic expressions and equations and are introduced to binomial expansion,
matrices, sequences and series, and probability.
5
In the fourth and final year of secondary mathematics education, students study matrix
transformations, statistics involving variance and standard deviation, time series and
trends, and indexed numbers including weighted averages. In addition to these topics,
students in the fourth year also study linear programming, differentiation, and integration.
2.2 Mathematics as a Challenge
In Uganda about I 0% of the children like and are willing to study math. The rest have to
be persuaded or forced to study mathematics because it is compulsory. They have a
completely negative attitude towards the subject (especially the girls). and therefore,
teaching mathematics in Uganda has been, and still is. an uphill task. (Eshiwani. 1983)
The main reason for these problems is that up to the late 1970s, nobody chose to go to the
university to study education as a profession. The good mathematics students studied
engineering. medicine, accounting. or any other course but teaching.
Many of those who failed to meet the minimum requirements for their preferred careers
became teachers. Such mathematics teachers tended to scare the learners to cover up their
lack of content knowledge and their inadequate preparation to teach the lessons.
Children seem to find the learning of mathematics difficult and painful. It took a very
bright and brave child to accept the pain and learn mathematics. It was even worse for girls
as they often could not withstand the fear.
The situation got even worse in the 1980s as those educated in this manner became the
educators. In addition. many students came to school having had horror stories about
6
mathematics learning from their parents. These factors gave mathematics a monstrous face,
and to date, we are still trying to change this image to one with a more friendly face.
In the early eighties the government restructured the mathematics syllabus, which
previously had options to take care of varied potentials in mathematics. Now there is a
common syllabus for all.
Allowing different options of mathematics had a very negative effect on learners who
ended up with the option considered to be for weak students, while encouraging arrogance
in those who took the option for stronger students. This arrogance developed at an early
stage in life and unfortunately spilled over into the teaching of mathematics by those
students who ended up being mathematics teachers. (Eshiwani, 1983)
The common syllabus used now is appropriately designed to take care of students with
different potential. While there are many textbooks, they have the same basic content. The
Ugandan Institute of Education approves books, and teachers have a vote in approvaL
These steps have helped to improve the image of the subject. Many people now appreciate
the value of mathematics.
Also, since March of2001, the Ugandan government has banned corporal punishment in
schools, This should go a long way toward making mathematics acceptable and,
therefore, easy to teach, The good news is that in the year 2000, only 12% failed
mathematics at the KSCE (secondary) leveL Four years ago the failure rate was 38%.
This is a great improvement. (MOEST, 2002)
2.3 How teaching methods affect pel"formance
Different strategies have been used across our countries to motivate students to learn
mathematics. High stakes national examinations that have serious consequences for
7
students are one means. Sometimes in the past, punishment has been used. Making
mathematics interesting, meaningful, and useful to students is seen as a way to motivate
their learning. (Akpan, 1986)
An individual's perceived ability to do well in a subject is one variable that has received
considerable attention in psychological literature considering American females. Within an
African context. Lee and Lockheed ( 1990) conducted a study of I ,012 students enrolled in
single-sex and mixed-sex secondary schools from ten Southern states in Nigeria. The
authors found that perceived ability positively related to higher achievement in
mathematics.
Similarly, in a study of secondary and college students selected from seven state secondary
schools and one federal college in Nigeria, Aghenta (1989) found that "perceived
difficulties of science occupations" was a significant factor in preventing girls from
entering STM fields.
The attitude that one holds towards mathematics or sc1ence appears to be a powerful
predictor of achievement in the respective fields. A prior positive attitude towards STM
(Aghenta 1989). the development of a positive attitude towards STM by a teacher (Mordi
I 991 ), or a strong positive attitude toward science (Akpan I 986)
In her study of secondary students, Aghenta (I 989) found that a poor attitude towards STM
was a barrier to access of STM fields. Conversely, she found that a good or positive
attitude was one of several factors that facilitated performance in STM.
8
2.4 Teaching methods and Perception of stndents
Eshiwani (1983) reported that girls in Uganda generally have negative attitudes towards
math and these attitudes tend to depress their achievement. Generalizing from STM
education to the broader context of women's education, a review of sector studies reveals a
positive relationship between female education and several well-being indicators.
According to King, ''All of the evidence from Third World countries shows a close link
between women's education and social and economic development, and between the size
of the education gender gap and national development" (1990:6).
The links are already well-established between women's education and fetiility, child
health and survival (US-AID 1982; Bourque and Warren 1990; King 1990); formal labor
force participation (OE & OWD 1990); income and wage employment (King 1990); and
women's empowerment into the rights and responsibilities of citizenship (King 1990).
Furthermore, the links for education in the STM fields are presumed to be particularly
strong for women.
Girls who become interested in, persist m studying, and then work in STM fields,
significantly improve their life chances (e.g., standards of income, health, fertility, and
Productivity), as well as those of their family (e.g., through increased resources, and by
being available as a role model for younger female kin).
9
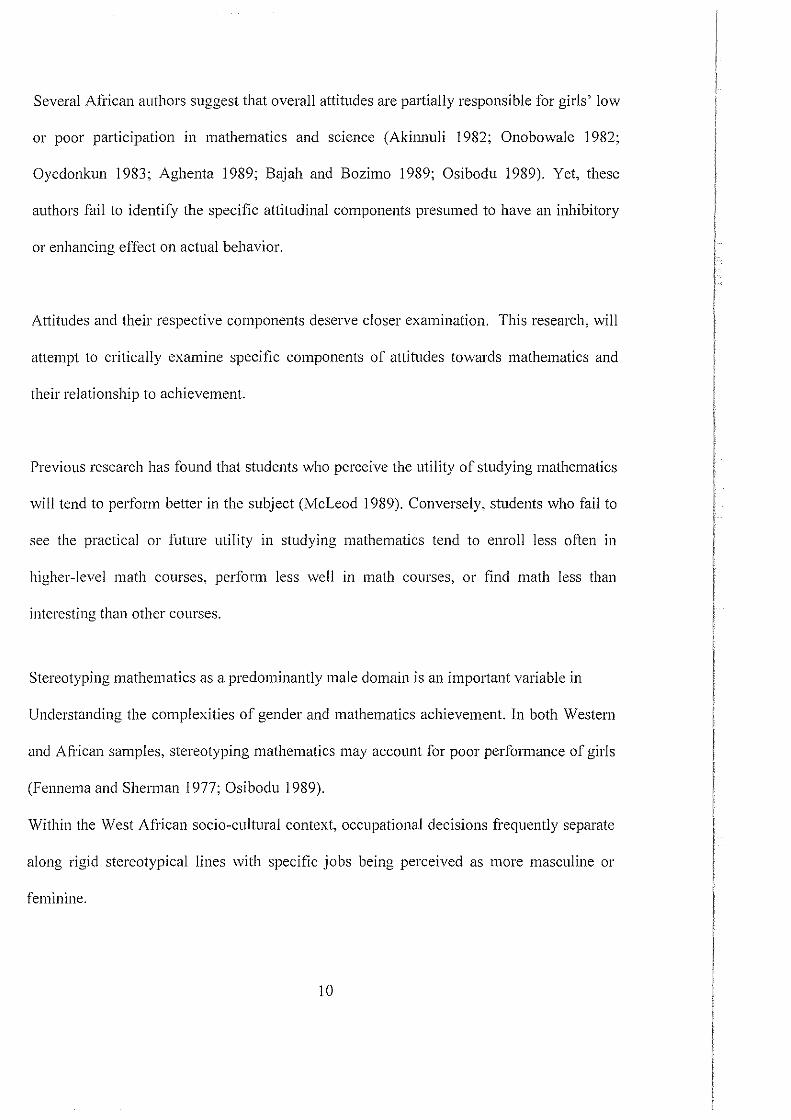
Several African authors suggest that overall attitudes are partially responsible for girls' low
or poor participation in mathematics and science (Akinnuli 1982; Onobowale 1982;
Oyedonkun 1983; Aghenta 1989; Bajah and Bozimo 1989; Osibodu 1989). Yet, these
authors fail to identify the specific attitudinal components presumed to have an inhibitory
or enhancing effect on actual behavior.
Attitudes and their respective components deserve closer examination. This research, will
attempt to critically examine specific components of attitudes towards mathematics and
their relationship to achievement.
Previous research has found that students who perceive the utility of studying mathematics
will tend to perform better in the subject (McLeod 1989). Conversely, students who fail to
see the practical or fi.tture utility in studying mathematics tend to enroll less often in
higher-level math courses. perform less well in math courses, or find math less than
interesting than other courses.
Stereotyping mathematics as a predominantly male domain is an impo11ant variable in
Understanding the complexities of gender and mathematics achievement. In both Western
and African samples, stereotyping mathematics may account for poor performance of girls
(Fennema and Sherman 1977; Osibodu 1989).
Within the West African socio-cultural context, occupational decisions frequently separate
along rigid stereotypical lines with specific jobs being perceived as more masculine or
feminine.
10
These stereotypical attitudes likewise may affect students' perceptions of their ability to
study certain subjects or pursue a certain career path.
Additionally, one might hypothesize that the longer girls stay in the educational pipeline,
the more likely they are to challenge existing traditional ideas or beliefs based on the
rigidity of gender. Likewise. the longer they stay in school, the more chances they have to
be exposed to successful female role models in mathematics and other related subjects;
these role models may positively affect the formation of students' attitudes.
An additional interpretation of this finding suggests that students with less stereotypic
views of mathematics might possess a history of successes in mathematics that in turn
influences their idea of appropriateness of the subject for them as a female.
It is possible that rural mothers perceive the value of education as higher than that of urban
mothers. and thus. are more likely to encourage their daughters to achieve. The fact that
their daughters have persisted to the secondary level of formal schooling suggests that
there is family support for their continued education.
Along this line of reasoning. one might expect that girls would be more likely to be
withdrawn from school in the rural area due to conditions such as: the high demand for
their labor contribution, early or forced marriage, lack of family financial resources to
support further education, and distance between home and school. These conditions are
believed to be more pronounced in the rural area in contrast to that of the urban area; thus,
those who do remain in school might have been more strongly encouraged to do so.
II
Educators and parents alike need to become active change agents in fostering positive
attitudes in young girls and women in order to enhance their interest and achievement in
mathematics.
"Because teachers are important role models and career counselors for students, the
participation of women in the teaching profession can be a critical factor in challenging
existing stereotypes and in promoting and supporting the expanded aspirations of female
students'' (Adams and Kruppenbach 1986) ..
2.5 An Ove1·view
The role of teachers cannot be overemphasized. particularly when "entry barriers against
women serve as obstacles for education. Some of the barriers begin at the primary school
level with teachers and textbooks projecting attitudes that discourage school attendance
and performance of girls. or promoting stereotypes of girls not being as good as boys in
technical subjects or mathematics'' (King 1990).
The role that parents play should not be overlooked. Much of the socialization that shapes
a child's life comes from the family, especially from mothers.
12
CHAPTER THREE
METHODOLOGY
3.0 Introduction
This section entails the methods used to collect the data which was necessary to come up
with the study. It specifically addresses the design, instruments, sample sized and
analysis tools employed for this particular study.
3.1 Research Design
The study used Descriptive research design. This enhanced the researcher to obtain a
better understanding of the problem of mathematics as a subject. The method chosen
allowed a collection of comprehensive intensive data and provided an in-depth study on
why past initiatives had not produced the desired results.
3.2 Research Population
The population of study was composed of teachers and students from the selected schools
in Mukono district.
3.3 Study Sample
With regard to above the study employed stratified sampling,
Sampling as follows: -
"r Students- 30 of the sample suffice.
,. Teachers- 10 teachers in the targeted sample size.
13
3.5 Research Instruments
',- Questionnaire
Primary data was collected by use of questionnaire and interviews, filled by relevant
parties to obtain ideas on what constitutes teaching methodology. These were designed in
both open and closed ended form. The method ensured high proportion of responses and
higher returns rate.
',- Interview Method
This entailed face-to-face interactions with the teachers in the mathematic department of
each school. Secondary data was obtained from the ministry of education magazines
annual report records and other researches done to give other information required in the
research.
3.6 Research Procedure
The researcher had an introductory letter from the university to present to the area
authority to obtain permission for study. This gave directive to the local administrators at
grass root level for acceptance. On acceptance by the authorities the major task of
collecting data begun.
3. 7 Data Analysis and Interpretation
The information collected was analyzed and edited to create consistency and completeness.
After collecting the questionnaires they were edited for completeness and consistency
across the respondents and to locate omissions. Information obtained from the research
study was presented and analyzed using bar charts, narratives, and statistical figures.
14
CHAPTER FOUR
DATA PRESENTATION ANALYSIS AND INTERPRETATION
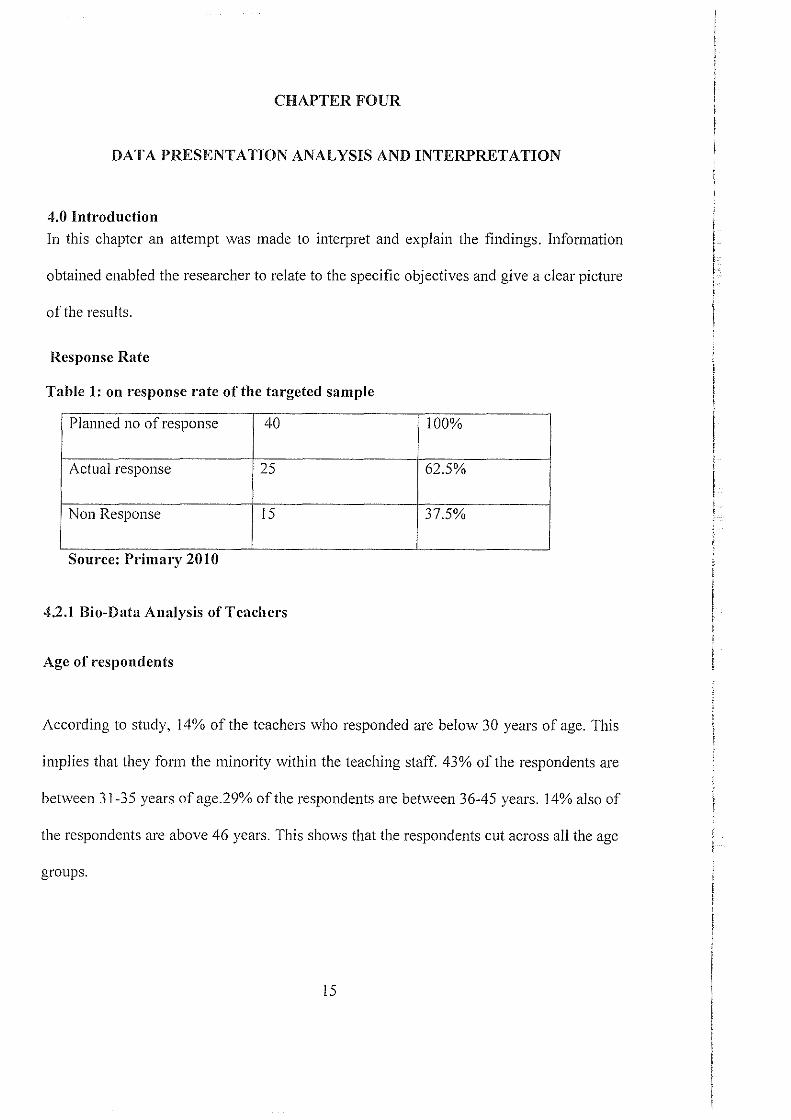
4.0 Introduction
In this chapter an attempt was made to interpret and explain the findings. Information
obtained enabled the researcher to relate to the specific objectives and give a clear picture
ofthe results.
Response Rate
Table 1: on response rate of the tat·geted sample
Planned no of response 40 100%
Actual response 25 62.5%
Non Response 15 37.5%
Source: Primary 2010
4.2.1 Bio-Data Analysis of Teachers
Age of 1·espondents
According to study, 14% of the teachers who responded are below 30 years of age. This
implies that they form the minority within the teaching staff. 43% of the respondents are
between 31-35 years ofage.29% of the respondents are between 36-45 years. 14% also of
the respondents are above 46 years. This shows that the respondents cut across all the age
gronps.
15
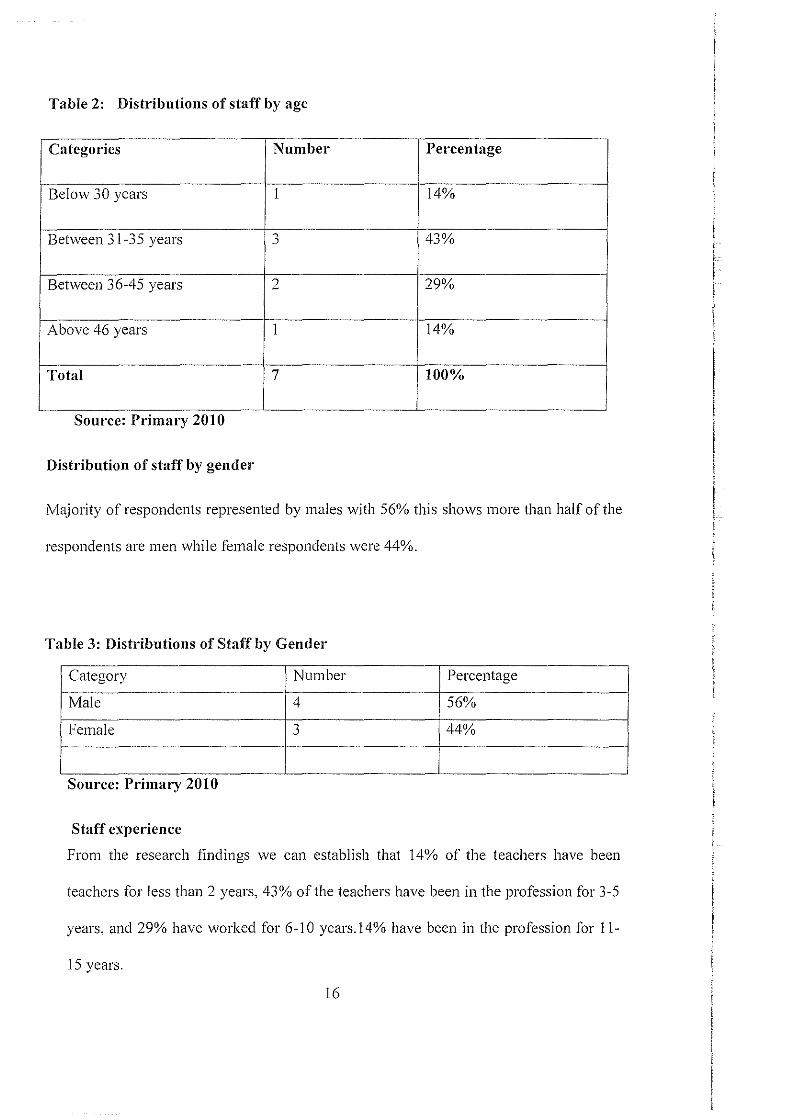
Table 2: Distributions of staff by age
Categories Number PHcentage
Below 30 years I 14%
Between 31-3 5 years 0 43% _)
Between 36-45 years 2 29%
Above 46 years I 14%
Total 7 100%
Source: Primary 2010
Distribution of staff by gende1·
Majority of respondents represented by males with 56% this shows more than half of the
respondents are men while female respondents were 44%.
Table 3: Distributions of Staff by Gender
Category Number Percentage
Male 4 56%
Female 0 44% _)
Source: Primary 2010
Staff experience
From the research findings we can establish that 14% of the teachers have been
teachers for less than 2 years, 43% of the teachers have been in the profession for 3-5
years, and 29% have worked for 6-10 years.l4% have been in the profession for II-
15 years.
16
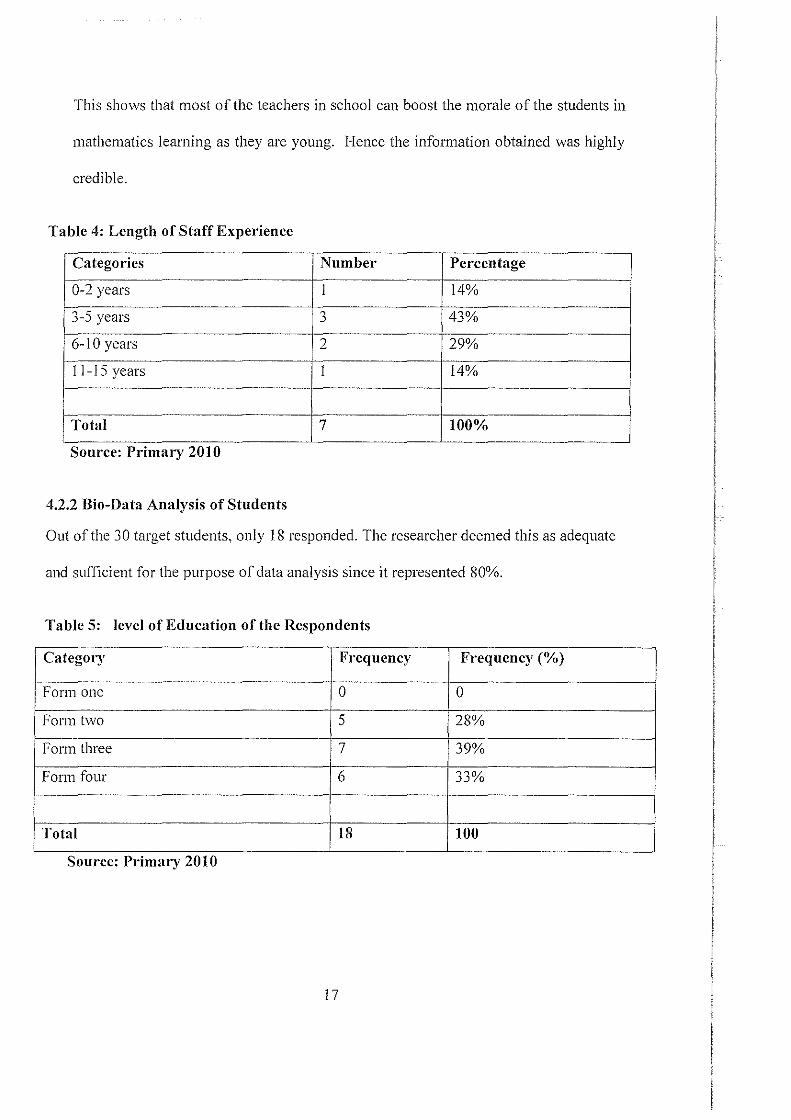
This shows that most of the teachers in school can boost the morale of the students in
mathematics learning as they are young. Hence the information obtained was highly
credible.
Table 4: Length of Staff Experience
Categol"ies Number Pet·centage
0-2 years 1 14%
3-5 years 0 43% ~
6-10 years 2 29%
11-15 years 1 14%
Total 7 100%
Source: Pnmary 2010
4.2.2 Bio-Data Analysis of Students
Out of the 30 target students, only 18 responded. The researcher deemed this as adequate
and sufficient for the purpose of data analysis since it represented 80%.
Table 5: level of Education of the Respondents
Catego11' F1·equency Frequency(%)
Form one 0 0
Form two 5 28%
Form three 7 39%
Form four 6 33%
Total 18 100
Source: Pnmm1' 2010
17
From the table above it can be seen that most of the respondents were from the upper
classes.
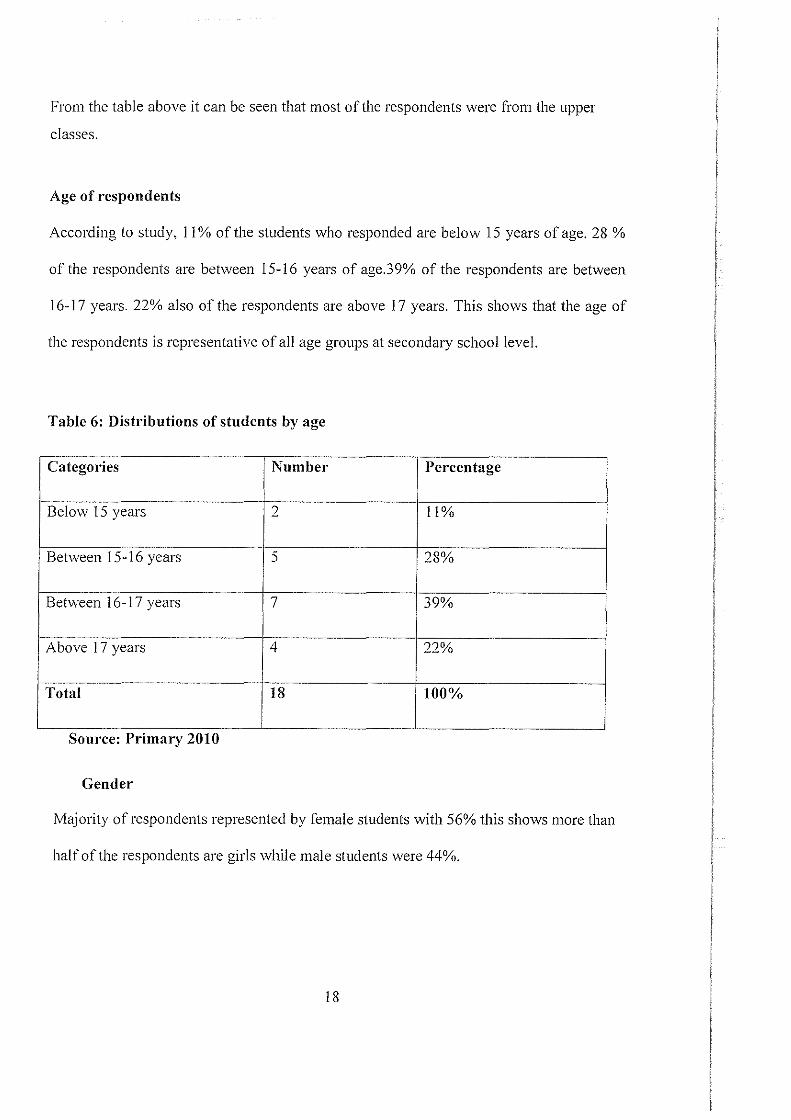
Age of respondents
According to study, 11% of the students who responded are below 15 years of age. 28%
of the respondents are between 15-16 years of age.39% of the respondents are between
16-17 years. 22% also of the respondents are above 17 years. This shows that the age of
the respondents is representative of all age groups at secondary school level.
Table 6: Distributions of students by age
Categol'ies Number Percentage
Below 15 years 2 11%
Between 15-16 years 5 28%
Between 16-1 7 years 7 39%
Above 17 years 4 22%
Total 18 100%
Source: Primary 2010
Gender
Majority of respondents represented by female students with 56% this shows more than
half of the respondents are girls while male students were 44%.
18
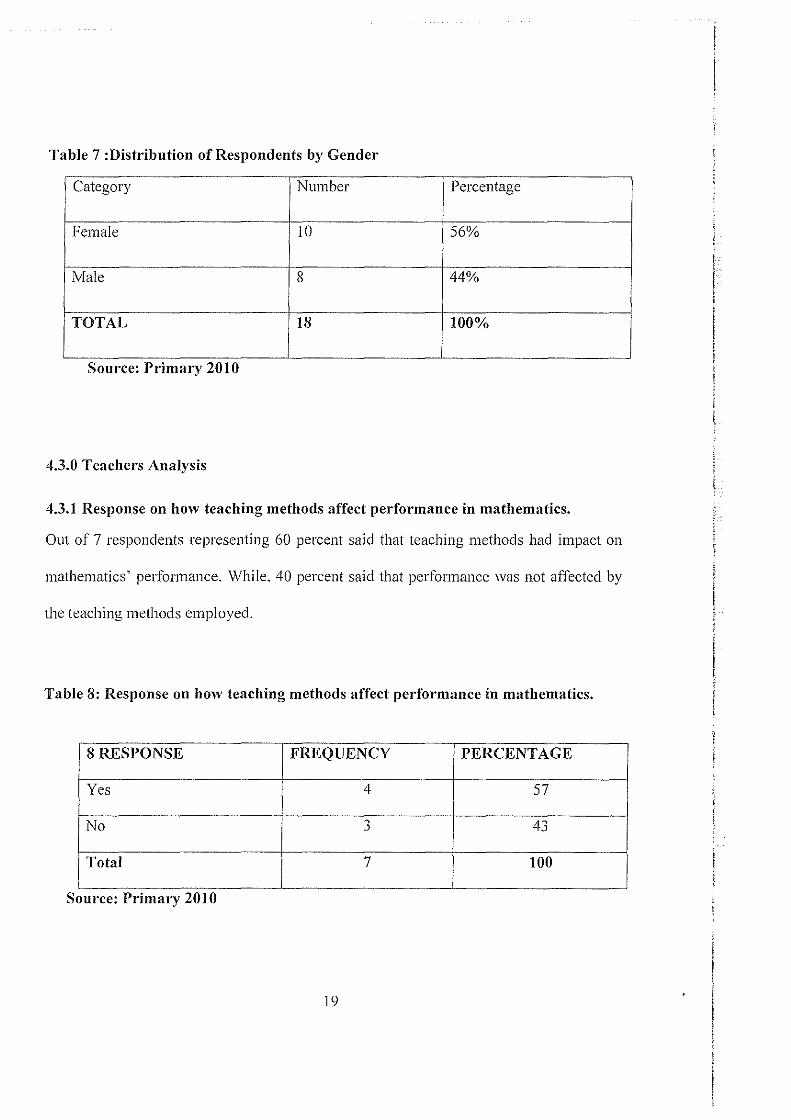
Table 7 :Distribution of Respondents by Gender
Category Number Percentage
Female 10 56%
Male 8 44%
TOTAL 18 100%
Source: Primary 2010
4.3.0 Teachc1·s Analysis
4.3.1 Response on how teaching methods affect performance in mathematics.
Out of 7 respondents representing 60 percent said that teaching methods had impact on
mathematics· performance. While. 40 percent said that performance was not affected by
the teaching methods employed.
Table 8: Response on how teaching methods affect performance in mathematics.
8 RESPONSE FREQUENCY PERCENTAGE
Yes 4 57
No " 43 .)
Total 7 100
Source: Pnmary 2010
19
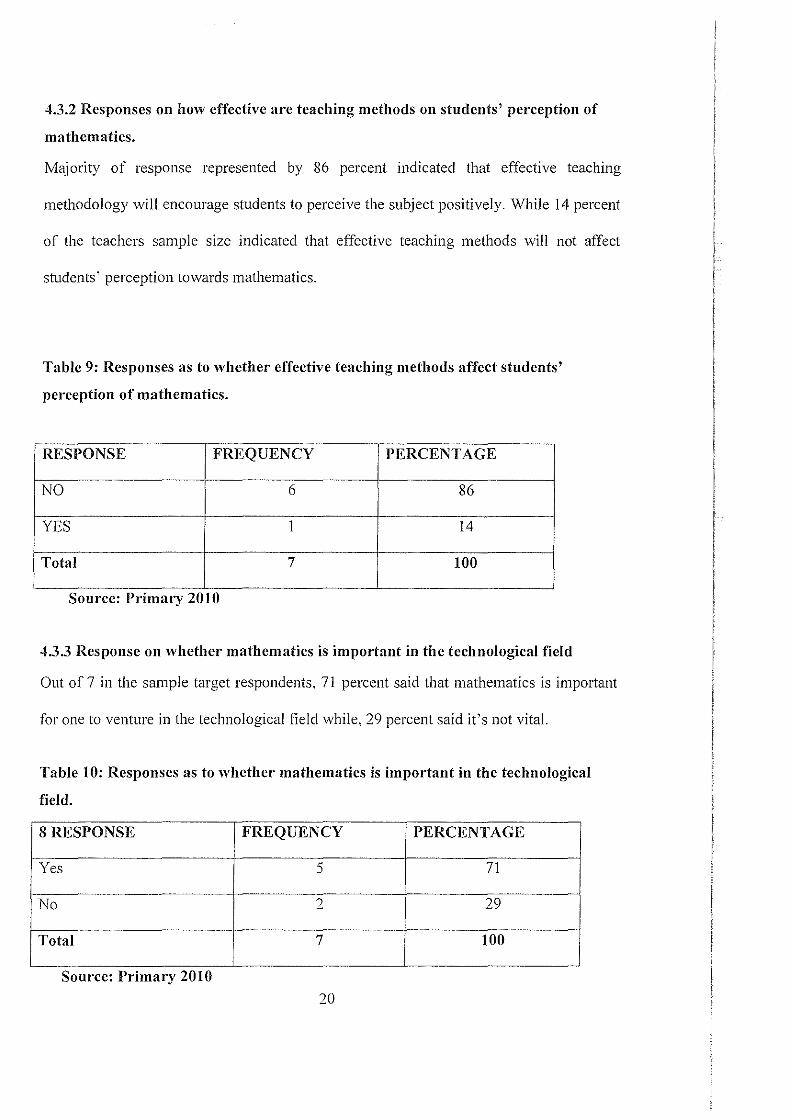
4.3.2 Responses on how effective are teaching methods on students' perception of
mathematics.
Majority of response represented by 86 percent indicated that effective teaching
methodology will encourage students to perceive the subject positively. While 14 percent
of the teachers sample size indicated that effective teaching methods will not affect
students" perception towards mathematics.
Table 9: Responses as to whether effective teaching methods affect students'
perception of mathematics.
RESPONSE FREQUENCY PERCENTAGE
NO 6 86
YES 1 14
Total 7 100
Source: Pnmary 2010
4.3.3 Response on whether mathematics is important in the technological field
Out of 7 in the sample target respondents. 71 percent said that mathematics is important
for one to venture in the technological field while, 29 percent said it's not vital.
Table 10: Responses as to whether mathematics is important in the technological
field.
8RESPONSE FREQUENCY PERCENTAGE
Yes 5 71
No 2 29
Total 7 100
Source: Pnmuy 2010
20
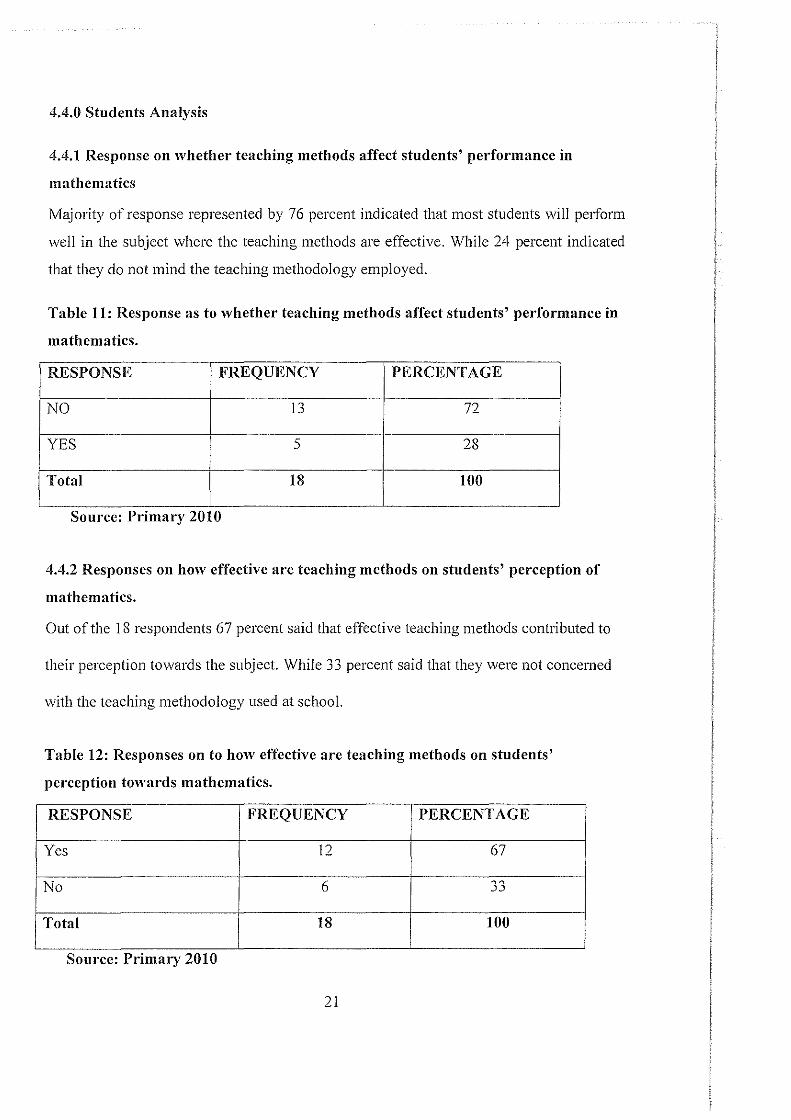
4.4.0 Students Analysis
4.4.1 Response on whether teaching methods affect students' performance in
mathematics
Majority of response represented by 76 percent indicated that most students will perform
well in the subject where the teaching methods are effective. While 24 percent indicated
that they do not mind the teaching methodology employed.
Table 11: Response as to whether teaching methods affect students' performance in
mathematics.
RESPONSE FREQUENCY PERCENTAGE
NO 13 72
YES 5 28
Total 18 100
Source: Pnmary 2010
4.4.2 Responses on how effective are teaching methods on students' perception of
mathematics.
Out of the 18 respondents 67 percent said that effective teaching methods contributed to
their perception towards the subject. While 33 percent said that they were not concerned
with the teaching methodology used at school.
Table 12: Responses on to how effective a1·e teaching methods on students'
pe1·ception towa1·ds mathematics.
RESPONSE FREQUENCY PERCENTAGE
Yes 12 67
No 6 "" ~~
Total 18 100
Source: Pnmary 2010
21
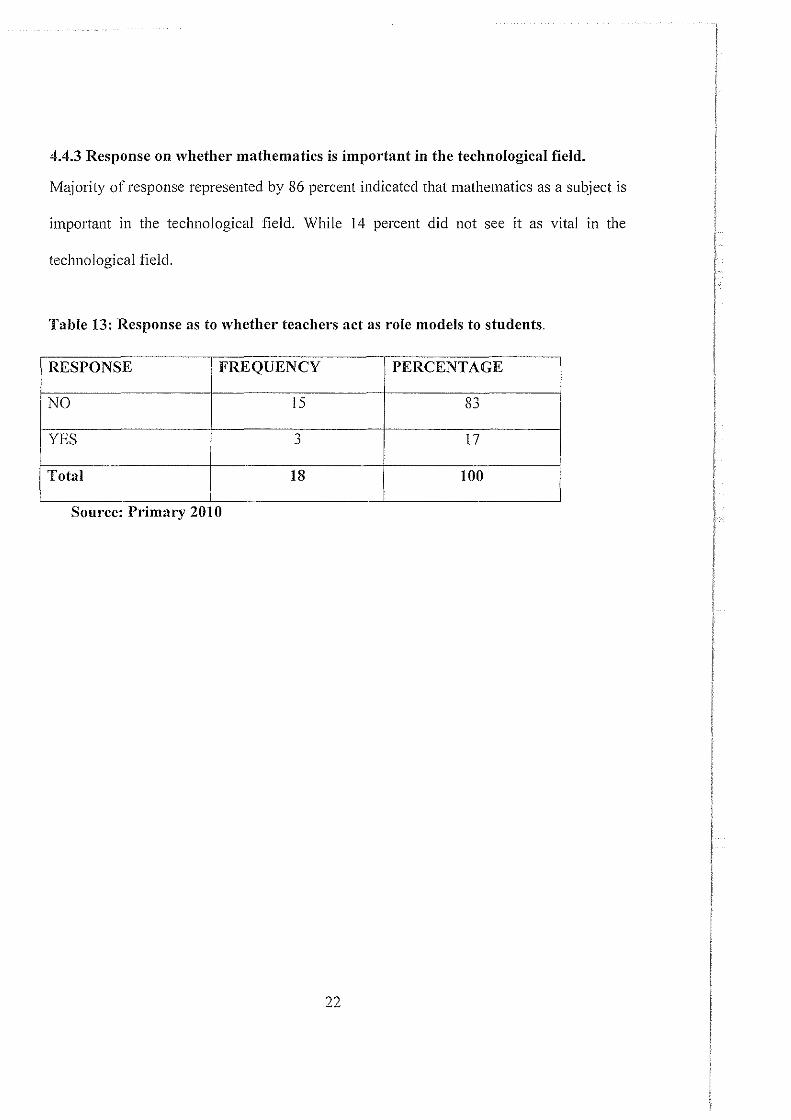
4.4.3 Response on whether mathematics is important in the technological field.
Majority of response represented by 86 percent indicated that mathematics as a subject is
important in the technological field. While 14 percent did not see it as vital in the
technological field.
Table 13: Response as to whethe1· teachm·s act as role models to students.
RESPONSE FREQUENCY PERCENTAGE
NO 15 83
YES " 17 .)
Total 18 100
Source: Primary 2010
22
5.0 Introduction
CHAPTER FIVE
CONCLUSIONS AND RECOMMENDATIONS
In this chapter an attempt was made to discuss the findings and come up with conclusions
and the recommendations there to.
5.1 Discussion and Conclusions
This study aimed to determine the factors that impact on the mathematics achievement of
student's in mathematics.
One of the findings of the present study relates to the method of teaching normally
employed in the mathematics classrooms at secondary level in Uganda. The method was
teacher-centered. and student's were passive and on the receiving end. learning algorithms
to apply to solve mathematical problems. This phenomenon reflected the lessons described
by Nunes and Bryant (Nunes&Bryant, 1997), and the descriptions of secondary classes in
Mauritius (Kember. D&Wong. A, 2000).
It seems that insufficient opportunities are provided to be involved in their own learning,
and empasises the algorithmic procedures used for solving mathematics problems. It seems
that the examination-driven curriculum in Uganda leads to a more teacher-centered
curriculum.
Teachers were to be playing a fundamental role in influencing students learning of
mathematics. as noted by Mcleod, D.B (1989).They also helped student's to develop a
positive attitude towards mathematics and motivate them towards the subject. The respect
student's have for their teachers could be noted during the classroom observations and
interviews. This supports the finding of Aldridge, Fraser and huang (Aldridge, Fraser,
&Huang, 1999) concerning the respect student's had for their teacher in Taiwan.
It was also found that teachers were seen to be strict, and that student's appreciated the
strictness, claiming that this helped them to have a disciplined class in which to learn
mathematics. Evidence of this can be found in the transcripts of student's interviews.
Teachers were found to be acting as role models, were possessing sound leadership skills
and were of helpful nature. However, there were teachers who had a gender bias in their
own perception. as described by Fieldman (Fieldman, 1999),they tended to describe male
student's as able in mathematics and female student's as being uncertain and not
possessing enough faith in their own ability.
These findings were common for average and low performing girls-findings which are in
agreement with those of Tiedemann(2000).cases where negative massages were sent to
girls about their performance in mathematics by teachers were noted in the present study
also.
Interestingly, parental interest and involvement in their children education is high in
Uganda. The contributions of parents towards the children learning in mathematics as
discussed. It was found that students are conscious of their parental aspirations and this
plays an important role in their motivation towards education.
It should also be noted that parents support towards education in Uganda is no longer
gender-biased now-as it used to be. Parents believe in the power of education and the
success of their children depends to a great extent on their educational; success. However,
the way of attributing success and failure in mathematics to boys and girls still followed
24
the pattern as described by Rodin, M & Rodin,B (2004) where the success of boys was
attributed to talent, while the success of girls was due to more effort.
Peers were found to be influential in a child's learning of mathematics and, in some cases,
in decisions to proceed further with other mathematical courses and the learning of
mathematics in generaL This agrees to the findings of Opdenakker& Van Damme (200 I),
EllisJ ( eds.) (2003 ).
Peer influence is not restricted to the classroom only or to school mates, but from a much
larger group through private tuition. The practice of private tuition allows student's of
different regions, colleges, cultures and social classes to be together and consequently to
form a larger peer group. This study was restricted to the peer influence within the
classroom towards the teaching and learning of mathematics.
A correlation coefficient of 0.336 between attitude towards mathematics and performance
in the mathematics test was noted in this study. However no gender difference in attitude
towards mathematics was observed. A positive attitude towards mathematics and interest
in the subject tends to motivate students into putting more effort into the subject, and
consequently enhanced their mathematics.
Achievements. concerning success or failure in mathematics, it was found that students
attributed success primarily to efforts-evidence coming from the transcripts of pupils
interviews as discussed. These findings agreed with the findings of Mooney and Thornton
( 1999) but no apparent gender differences were noted - contracting the outcomes reports
by Ernest (1994) and Ieder, Forgasz and Swolar (l996)Jt can be deduced that Uganda girls
are different to Australian and English girls in this respect
Prior ability in mathematics was found to play an impmiant in the mathematics
achievements of students as claimed by O'Connor and Miranda (2002).This is so because
of the hierarchical nature of the subject-mathematical concepts build on prior ones. This
finding proved to be impo1iant as the way mathematics is being taught at upper and lower
secondary levels should be taken into account There are cases of schools in Uganda where
inexperienced teachers are being sent to lower secondary classes and the more qualified
and experienced ones deal only with upper classes. The mathematical concepts have to be
learnt properly right from lower classes to ensure a solid base for the students to assist
them in their learning of mathematics at each successive leveL
A summary of these factors that impact on the mathematics performance of Students' in
Uganda as identified through the present study.
Another factoL language, was found to also play a major role in the teaching and learning
of mathematics. It was revealed in this study that students were having problems tackling
word problems or problems related to application to real life situations. Similar outcomes
were highlighted in a study conducted by zevenbergen (200 l ).indeed, there is considerable
debate related to the issue oflanguage and education in Uganda
This study has also found out that student's perceived mathematics to be a masculine
pursuit and that they have a stereotyped image of mathematicians and mathematics. the
26
drawings pupils made for a mathematician correspond to studies conducted by sumida
(2002).from some of the drawings it could be deduced that the students thought that
mathematics was much beyond their ability, as the mathematicians was shown with great
intellectual powers. Teachers need to determine their student's perception towards the
subject as negative perceptions may influence the student's involvement and subsequent
achievement in that subject.
5.2 Recommendations
The most direct impact of this study will hopefi.Illy be in the classroom and will help
teachers to use the findings. in particular;
•!• using student-centered teaching approaches
•!• using meaningful activities in their classrooms
•!• promoting conceptual understanding in mathematics
•!• emphasizing process rather than product during problem-solving sessions
•!• Promoting collaborative learning in mathematics classes.
•!• Helping pupils to develop a positive attitude towards mathematics.
•!• Motivating students in their learning of mathematics.
•!• Enhancing the mathematics achievement of all students.
•!• Promoting equity in education.
Teachers will have evidence on how different strategies can be incorporated with success
into their regular classroom transactions and within their schedule of work. One teacher,
who as a respondent of the study, stated that using cooperative learning and pupil-centered
methods would be very time consuming and that teachers would face difficulties 111
completing syllabus. As argued 111 the prev10us chapters, one of the ma111 wornes of
27
Teachers And Parents Is That Syllabus Should Be thoroughly Completed. All That Is
Required Is Readjustment.
5.3 General Obse1-vation and Deduction
Due to funding and logistic limitations, this project was conducted as a pilot study that
utilized a small sample size, relatively short time duration, and a convenience sampling
technique. It is suggested that a follow-up study should be carried out over a longer time
span (about I 5 weeks of instruction), and that the study should use a much larger sample
size. and if possible, adopt randomization procedures in sample composition.
A sufficiently large sample would make it possible to include a sizeable number of male
and female participants in the study such that more hypotheses could be built into the
research design. For example, it would be interesting to investigate both the possible effect
of gender on mathematics performance, and a possible interaction effect between treatment
(curriculum type) and gender.
Areas for Further Resem·ch
Further studies on gender and mathematics at secondary level should be conducted in
relation to single sex and co-educational schools. An investigation of the attitudes towards
mathematics and the performance of boys and girls in single sex schools, as compared to
those in co-education schools, could prove to be important.
This study has just touched upon relationship between culture and performance in
mathematics. Uganda is a multicultural country with a blend of different cultures and an
in-depth study wherein the issue of gender and mathematics in relation to ethnicity would
be valued
28
REFERENCES
Adams, M.N. and Kruppenbach, S.E. (1996). Some Issues o.f Access and Equity of
Afi·ican Females: Progress and Prospects. In: Working Papers on Women in
International Development
Akpan, E.U. (1986). Factors Affecting Student's Choice of Science Subjects in Nigerian
Secondary Schools. Research in Science and Technological Education4(1):99-109.
Education Review 34(2):209-231.
Ellis, L., Burke, D.M., Lomire, P., and McCormack, D.R. (2003). "Student Grades and
Average Ratings o,f'Instructional Quality: The Need for Adjustment." Journal of
Educational Research, 97(1 ), p. 35-40.
Eshiwani G.S ( 1986) Effectiveness of programmed conventional classroom teaching,
vol3.
Feldman. K.A. (1999). "Course Characteristics and College Students' Ratings of Their
Teachers and Courses: What We Know and What We Don 'f. "Research in Higher
Education. 9, 199-242.
Kember. D. and Wong, A. (2000). "Implicalions.for Evaluationfi'om a Study o,fStudents'
Perception of Good and Poor Teaching. "Higher education, 40, 69-97.
Marsh. H.W. and Roche, L.A. (1997). "lvfaking Students' Evaluations of Teaching
Effectiveness E[fi!ctive. " American Psychologist, 52( II), 1187-1197.
Perry, R.P., Abrami, P.C., and Leventhal, L. (1979). "Educational Seduction. The Effect
of Instructor Expressiveness and Lecture Content on Student Ratings and Achievement. "
Journal of Educational Psychology, 71, 107-116.
29
I.
2.
3.
4.
5.
6.
7.
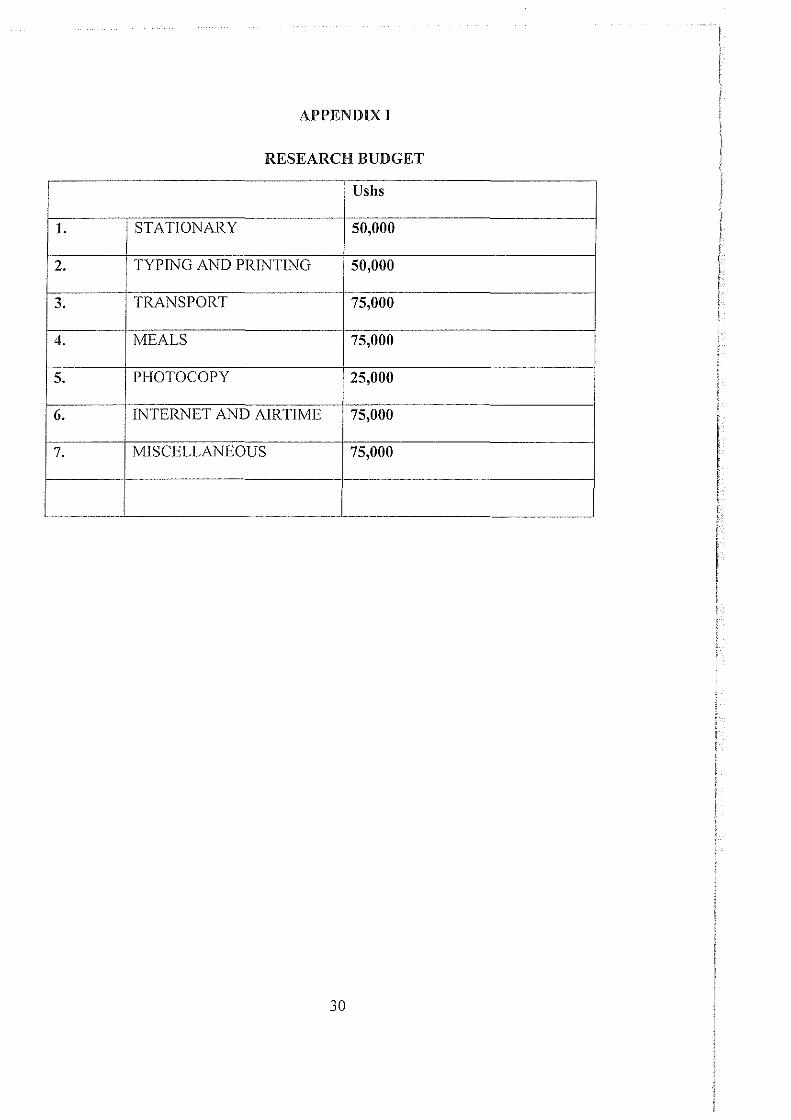
APPENDIX I
RESEARCH BUDGET
Ushs
STATIONARY 50,000
TYPING AND PRINTING 50,000
TRANSPORT 75,000
MEALS 75,000
PHOTOCOPY 25,000
INTERNET AND AIRTIME 75,000
MISCELLANEOUS 75,000
30
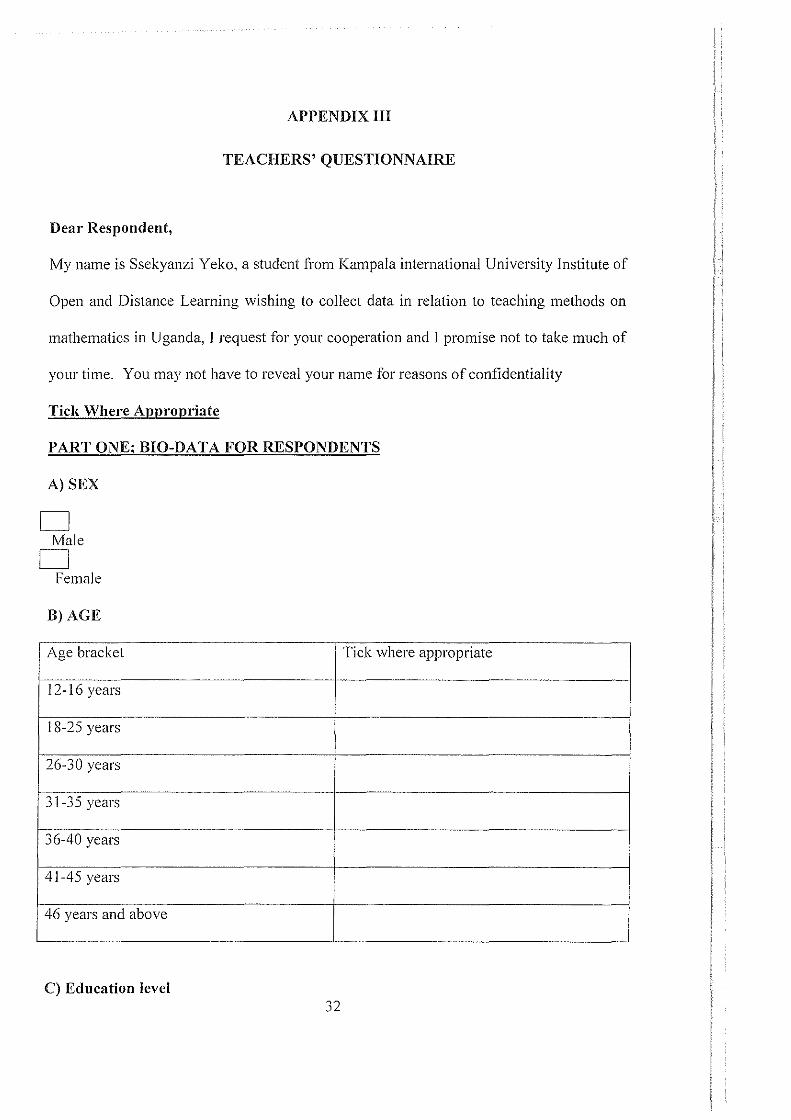
APPENDIX HI
TEACHERS' QUESTIONNAIRE
Dear Respondent,
My name is Ssekyanzi Yeko, a student from Kampala international University Institute of
Open and Distance Learning wishing to collect data in relation to teaching methods on
mathematics in Uganda, I request for your cooperation and I promise not to take much of
your time. You may not have to reveal your name for reasons of confidentiality
Tick Where Appropriate
PART ONE; BIO-DATA FOR RESPONDENTS
A) SEX
D Male
D Female
B) AGE
Age bracket Tick where appropriate
12-16 years
18-25 years
26-30 years
31-35 years
36-40 years
41-45 years
46 years and above
C) Education level 32
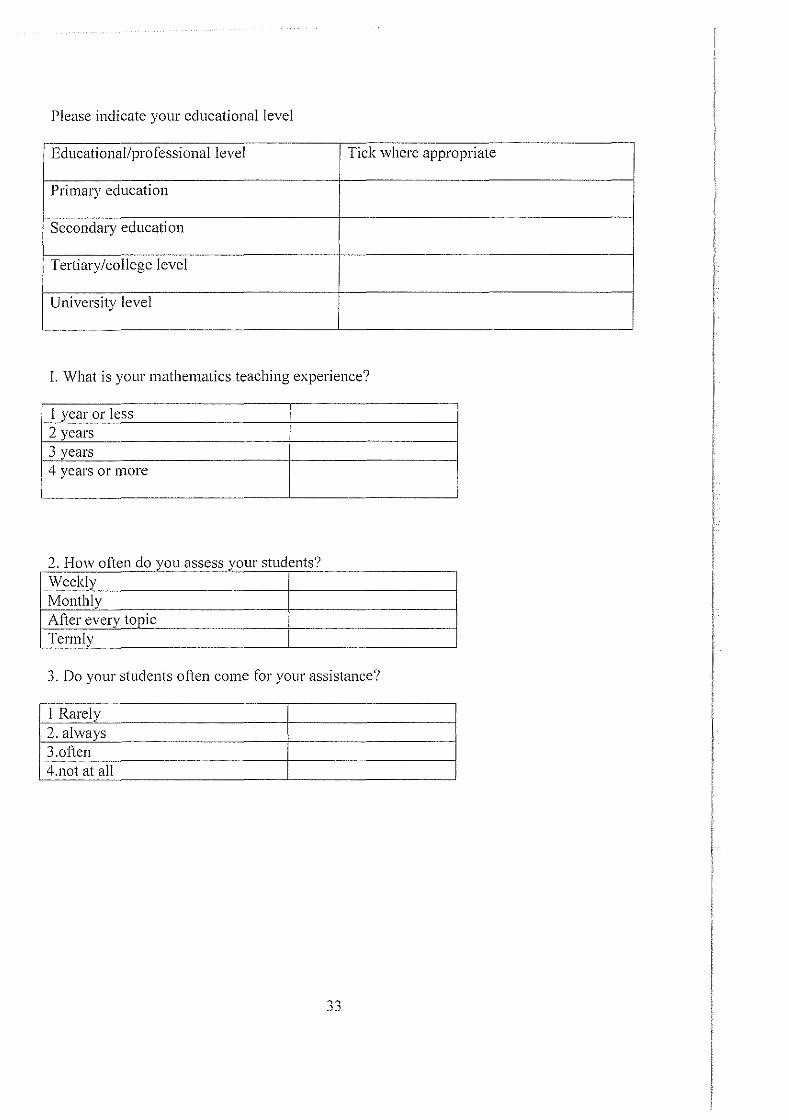
Please indicate your educational level
Educational/professional level Tick where appropriate
Primary education
Secondary education
Tertiary/college level
University level
I. What is your mathematics teaching experience?
1 year or less 2 years 3 years 4 years or more
2. How often do you assess your students? Weekly Monthly After every topic Termly
3. Do your students often come for your assistance?
1 Rarely 2. always 3.often 4.not at all
"" JJ
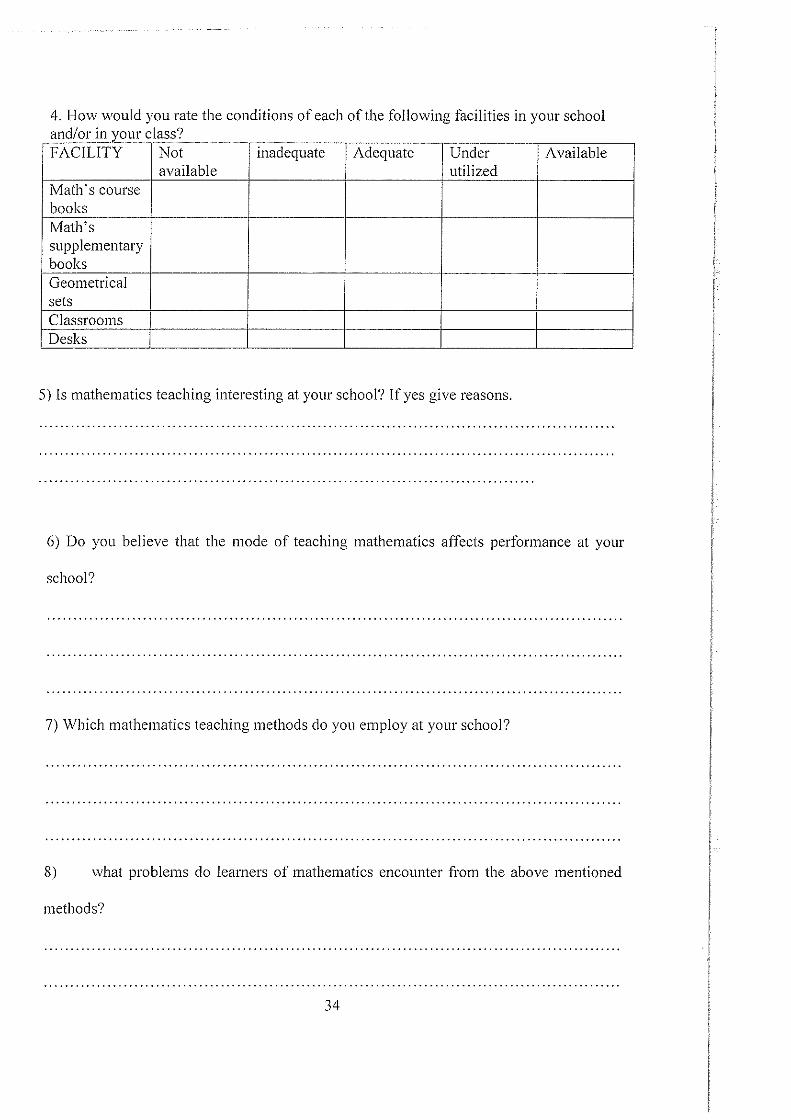
4. How would you rate the conditions of each of the following facilities in your school and/or in your class? FACILITY Not inadequate Adequate Under Available
available utilized Math's course books Math's supplementary books Geometrical sets Classrooms Desks
5) Is mathematics teaching interesting at your school? If yes give reasons.
6) Do you believe that the mode of teaching mathematics affects performance at your
school?
7) Which mathematics teaching methods do you employ at your school?
8) what problems do learners of mathematics encounter from the above mentioned
methods?
34

9)what in your opinion is the impact of teaching methods on pupil's learning of
mathematics?
Thank You
35
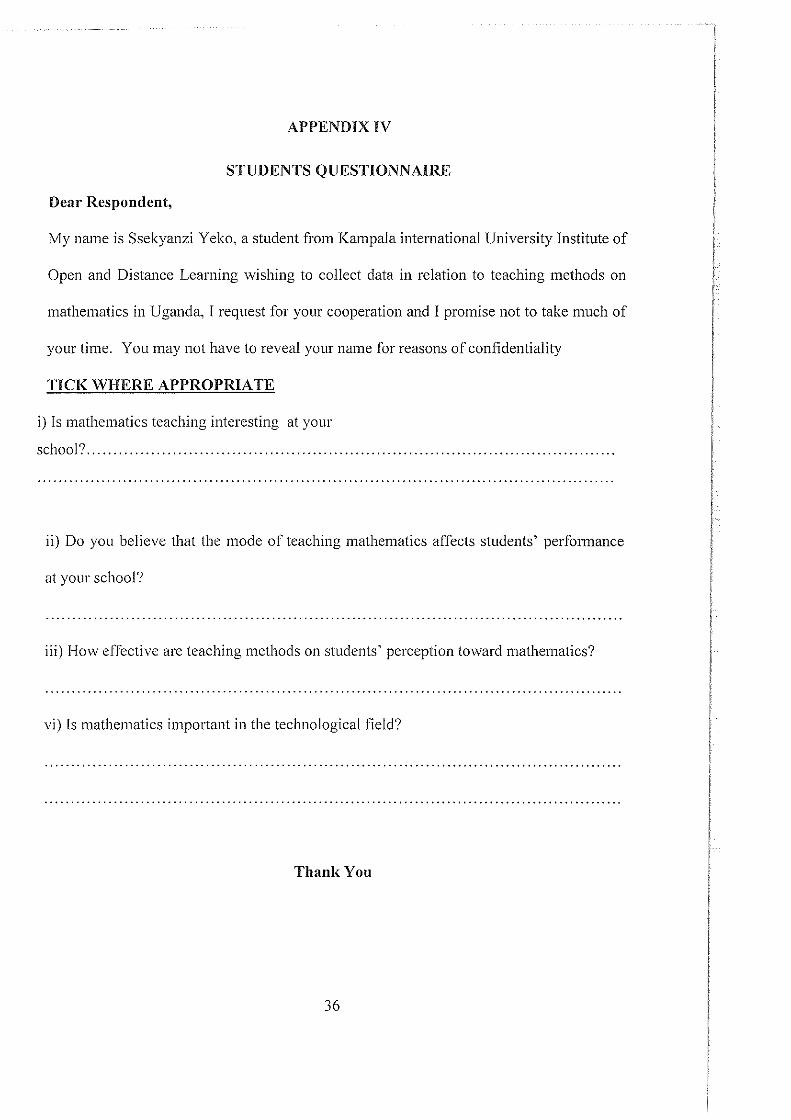
Dear Respondent,
APPENDIX IV
STUDENTS QUESTIONNAIRE
My name is Ssekyanzi Y eko, a student from Kampala international University Institute of
Open and Distance Learning wishing to collect data in relation to teaching methods on
mathematics in Uganda, I request for your cooperation and I promise not to take much of
your time. You may not have to reveal your name for reasons of confidentiality
TICK WHERE APPROPRIATE
i) Is mathematics teaching interesting at your
school? .................................................................................................. .
ii) Do you believe that the mode of teaching mathematics affects students' performance
at your school?
iii) How effective are teaching methods on students' perception toward mathematics?
vi) Is mathematics important in the technological field?
Thank You
36