Embed Size (px)
Citation preview
Technical Report NREL/TP-550-46093 July 2009
Impact of SolarSmart Subdivisions on SMUD’s Distribution System Peter McNutt and Joshua Hambrick National Renewable Energy Laboratory Golden, Colorado
Michael Keesee and David Brown Sacramento Municipal Utility District Sacramento, California
National Renewable Energy Laboratory 1617 Cole Boulevard, Golden, Colorado 80401-3393 303-275-3000 • www.nrel.gov
NREL is a national laboratory of the U.S. Department of Energy Office of Energy Efficiency and Renewable Energy Operated by the Alliance for Sustainable Energy, LLC
Contract No. DE-AC36-08-GO28308
Technical Report NREL/TP-550-46093 July 2009
Impact of SolarSmart Subdivisions on SMUD’s Distribution System Peter McNutt and Joshua Hambrick National Renewable Energy Laboratory Golden, Colorado
Michael Keesee and David Brown Sacramento Municipal Utility District Sacramento, California
Prepared under Task No. PVD9.1450
NOTICE
This report was prepared as an account of work sponsored by an agency of the United States government. Neither the United States government nor any agency thereof, nor any of their employees, makes any warranty, express or implied, or assumes any legal liability or responsibility for the accuracy, completeness, or usefulness of any information, apparatus, product, or process disclosed, or represents that its use would not infringe privately owned rights. Reference herein to any specific commercial product, process, or service by trade name, trademark, manufacturer, or otherwise does not necessarily constitute or imply its endorsement, recommendation, or favoring by the United States government or any agency thereof. The views and opinions of authors expressed herein do not necessarily state or reflect those of the United States government or any agency thereof.
Available electronically at http://www.osti.gov/bridge
Available for a processing fee to U.S. Department of Energy and its contractors, in paper, from:
U.S. Department of Energy Office of Scientific and Technical Information P.O. Box 62 Oak Ridge, TN 37831-0062 phone: 865.576.8401 fax: 865.576.5728 email: mailto:[email protected]
Available for sale to the public, in paper, from: U.S. Department of Commerce National Technical Information Service 5285 Port Royal Road Springfield, VA 22161 phone: 800.553.6847 fax: 703.605.6900 email: [email protected] online ordering: http://www.ntis.gov/ordering.htm
Printed on paper containing at least 50% wastepaper, including 20% postconsumer waste
Table of Contents
List of Figures ................................................................................................................................. ii List of Tables .................................................................................................................................. ii 1 Purpose .................................................................................................................................... 1 2 System Description .................................................................................................................. 1
2.1 SolarSmart Home and PV System Description ................................................................ 1 2.2 Distribution System Description ...................................................................................... 2 2.3 Load Tap Changer ............................................................................................................ 5 2.4 Capacitors ......................................................................................................................... 6 2.5 Monitoring the Distribution System ................................................................................. 7
3 Monitoring Results and Analysis ............................................................................................ 9 3.1 Inadvertent Switching Due To Utility Voltage Transients ............................................. 10 3.2 Solar Monitor Station ..................................................................................................... 15 3.3 Service- and Substation-Voltage Impacts due to PV Output ......................................... 18 3.4 Impact of PV Output Variability Due to Clouds ............................................................ 22 3.5 Substation voltage impact on home voltage due to clouds ............................................ 26
4 Modeling ................................................................................................................................ 27 4.1 Overview ........................................................................................................................ 27 4.2 Secondary Voltage Rise ................................................................................................. 29 4.3 Overall System Validation ............................................................................................. 31
5 Problems Encountered ........................................................................................................... 33 6 Findings ................................................................................................................................. 33 7 Next Steps .............................................................................................................................. 33 8 References ............................................................................................................................. 35
List of Figures
Figure 1. SMUD Anatolia one-line diagram and monitor locations ............................................... 3 Figure 2. Map of the Anatolia III Community ................................................................................ 4 Figure 3. ANSI C84.1 voltage ranges ............................................................................................. 5 Figure 4. SMUD Anatolia-Chrysanthy substation Capcon operating parameters .......................... 6 Figure 5. Substation operation Wednesday, June 18, 2008 – clear day, 96ºF .............................. 10 Figure 6. Home 3 power Wednesday, June 18, 2008 – clear day, 96ºF ....................................... 12 Figure 7. Transformer 3 power Wednesday, June 18, 2008 – clear day, 96ºF ............................. 13 Figure 8. System voltages Wednesday, June 18, 2008 – clear day, 96ºF ..................................... 14 Figure 9. Solar monitor / meteorological station .......................................................................... 15 Figure 10. Solar calendar for March 2009 .................................................................................... 16 Figure 11. System voltages and solar irradiance March 7, 2009 .................................................. 18 Figure 12. Substation operation March 7, 2009 ............................................................................ 19 Figure 13. Transformer 3 power March 7, 2009 ........................................................................... 20 Figure 14. Home 3 power March 7, 2009 ..................................................................................... 21 Figure 15. System voltages and solar irradiance March 6, 2009 .................................................. 22 Figure 16. Substation operation March 6, 2009 ............................................................................ 23 Figure 17. Transformer 3 power March 6, 2009 ........................................................................... 24 Figure 18. Home 3 power March 6, 2009 ..................................................................................... 25 Figure 19. System voltages and solar irradiance March 1, 2009 .................................................. 26 Figure 20. DEW model of the Anatolia system ............................................................................ 27 Figure 21. DEW transformer, secondary, and service connections .............................................. 28 Figure 22. Secondary connection to Home 3 ................................................................................ 29 Figure 23. Voltage rise vs. apparent power for Home 3 ............................................................... 30 Figure 24. Modeled voltage profiles for transformer 5K7 ............................................................ 32
List of Tables
Table 1. Distribution system power-quality monitors .................................................................... 7 Table 2. Possible technical concerns and days analyzed ................................................................ 9 Table 3. Comparison of estimated to calculated distances ........................................................... 29

1 Purpose
The purpose of this study is to analyze the distribution impacts of high penetrations of grid-integrated renewable energy systems, specifically photovoltaic (PV) equipped SolarSmart HomesSM found in the Anatolia III Residential Community (hereafter referred to as Anatolia) in Rancho Cordova, California. SolarSmart Homes combine high-efficiency features along with rooftop-integrated 2.0 kWac PV systems; they have no energy storage. Ultimately, Anatolia will have 795 homes, 600 of which will be SolarSmart, eventually amounting to 1.2 MWac potential generation.
Specific questions to investigate include:
1. Will there be excessive service voltage due to reverse power flow from exporting PV systems?
2. Will there be excessive substation voltage due to reverse power flow from exporting PV systems?
3. Do PV inverters trip off line due to utility-line voltage transients?
4. Will inverter power be limited by utility distribution operating voltages?
5. Do intermittent cloud conditions affect overall PV system performance (PV ramp rates) and affect grid conditions?
6. Can more SolarSmart Homes be connected to each distribution transformer, or can the transformers be smaller for the same number of homes?
This report covers data collected between March 2008 and March 2009.
2 System Description
As of March 2009, there were 115 homes built in Anatolia. Although one quarter of the homes to be built will not have PV systems, all the homes built so far had PV systems, comprising 238 kWac. 2.1 SolarSmart Home and PV System Description SolarSmart Homes are advertised as being able to reduce annual residential electric bills by 60%. They combine cost-effective, energy-efficient features and a rooftop PV system.
Typical Features in a SolarSmart Home • Radiant barrier: reflects summer heat that would otherwise enter the attic and cause greater
need for air conditioning.
• Furnace efficiency: a 90%-efficient furnace, exceeding the required 80% efficiency.
• Air conditioner: a 14 SEER / 12 EER HVAC system.
• Compact-fluorescent lighting: incandescent light bulbs are replaced by more energy efficient CFLs.
• ENERGY STAR-qualified windows.
1
2
• Third-party certification: independent verification is required that all energy-efficiency measures are installed and will operate correctly.
• PV systems: a 2.0 kWac PV system can generate a major portion of the electrical energy consumed in the home. If the system exports energy during the year, SMUD writes a check to the owner for the exported energy at full residential rates. The orientation of the PV systems being monitored range from southeast to south to southwest. The majority of the PV systems consist of 36 SunPower 63-watt SunTile roof-integrated modules that utilize back-contact, monocrystalline silicon cells powering a SunPower SPR-2800x positive-ground, grid-connected inverter. The inverter is mounted in the garage and can be remotely accessed by SunPower if the homeowner connects it via the internet. The systems have a 10-year warranty and the power output of the arrays is warranted for 25 years.
2.2 Distribution System Description Anatolia is served by individual single-phase lateral circuits from a three-phase primary feeder (Feeder 1201) which connects to a 20 MVA, 69 kV / 12.47 kV delta-wye transformer at the Anatolia-Chrysanthy Substation (hereafter referred to as Anatolia-Chrysanthy or substation). Figure 1 show the one-line diagram along with monitoring points. The feeder has several points along the line that allow for switching through cubicles represented as circles with an “F” in them. The length of the feeder to the switching cubicle furthest from the substation, U-10891, is about 18,895 feet and the furthest distribution transformer, 5K7, is 22,360 feet from the substation. In Anatolia, there are a total of 85 single-phase pad-mounted distribution transformers: 23 are 75 kVA and 62 are 50 kVA. Also connected to the same substation feeder is a rendering plant fed by two 1500 kVA transformers, consuming between 20 and 200 kW, a water storage plant, and residential communities between the substation and Anatolia, connected at U-10597, U-10596 and U-10763. There are 2 additional feeders (1202 and 1203) that also connect to the 20 MVA transformer that have additional customer loads. Figure 2 is a map showing the layout of the community, its distance from the substation, and the location of the distribution transformers being monitored.
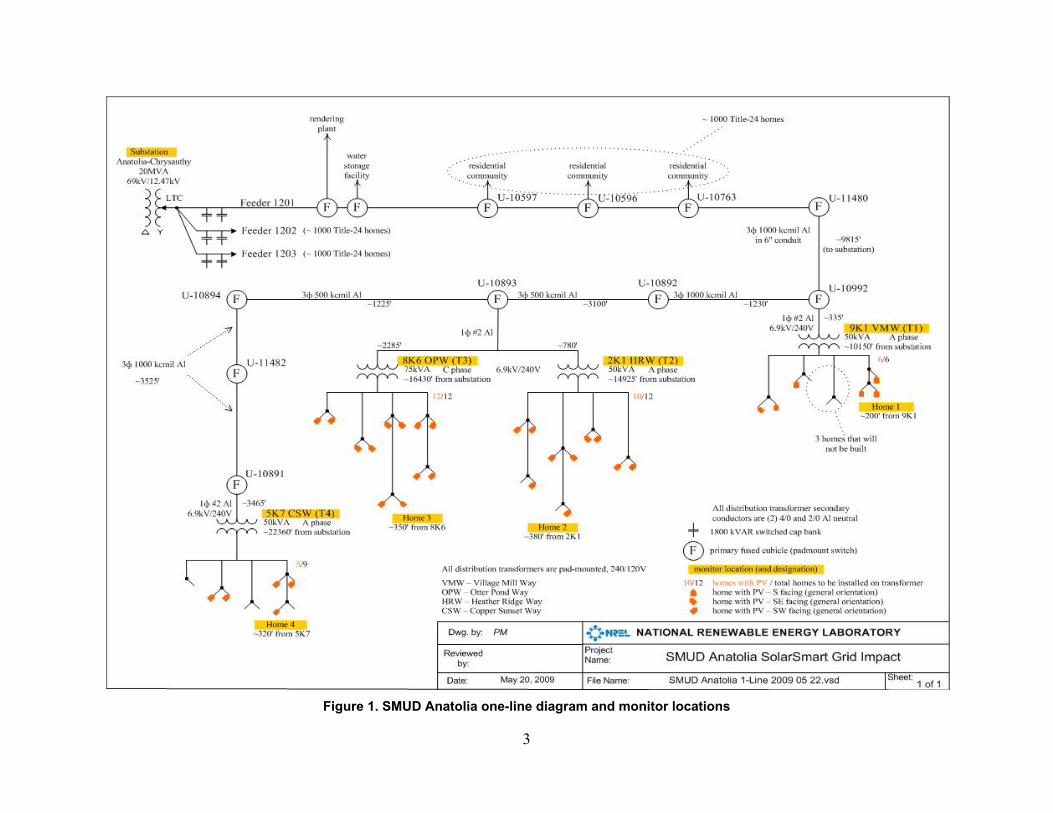
Figure 1. SMUD Anatolia one-line diagram and monitor locations
3
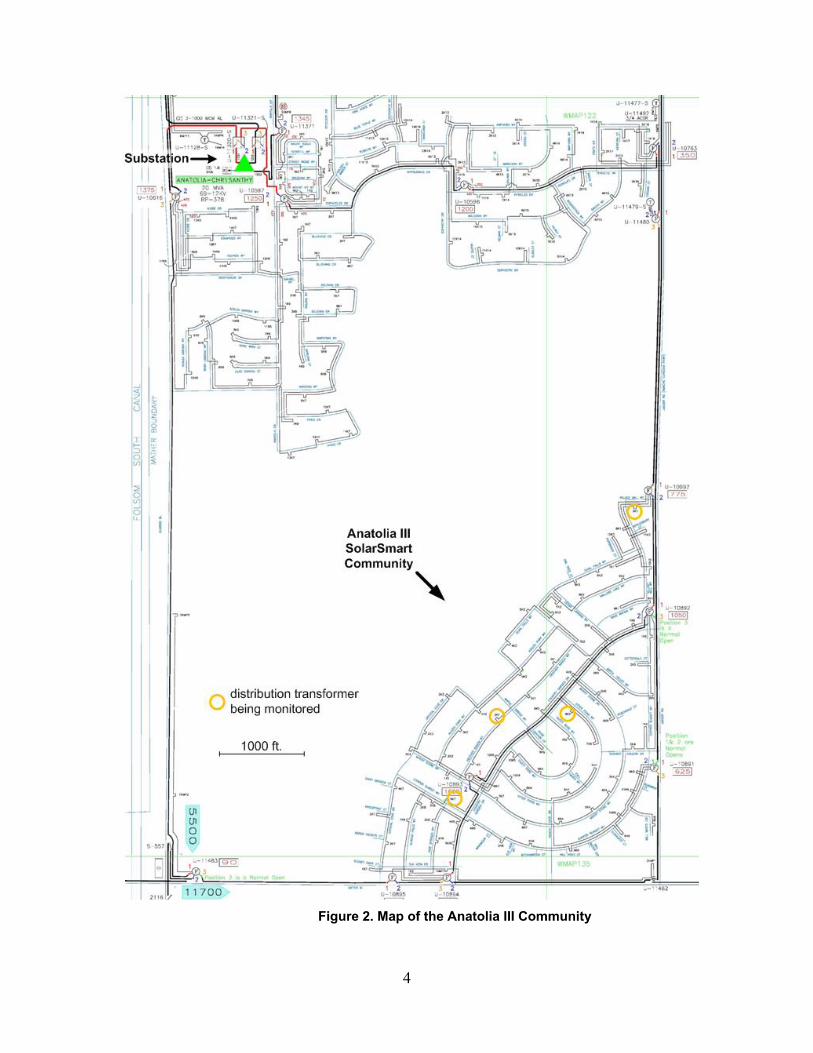
Figure 2. Map of the Anatolia III Community
4
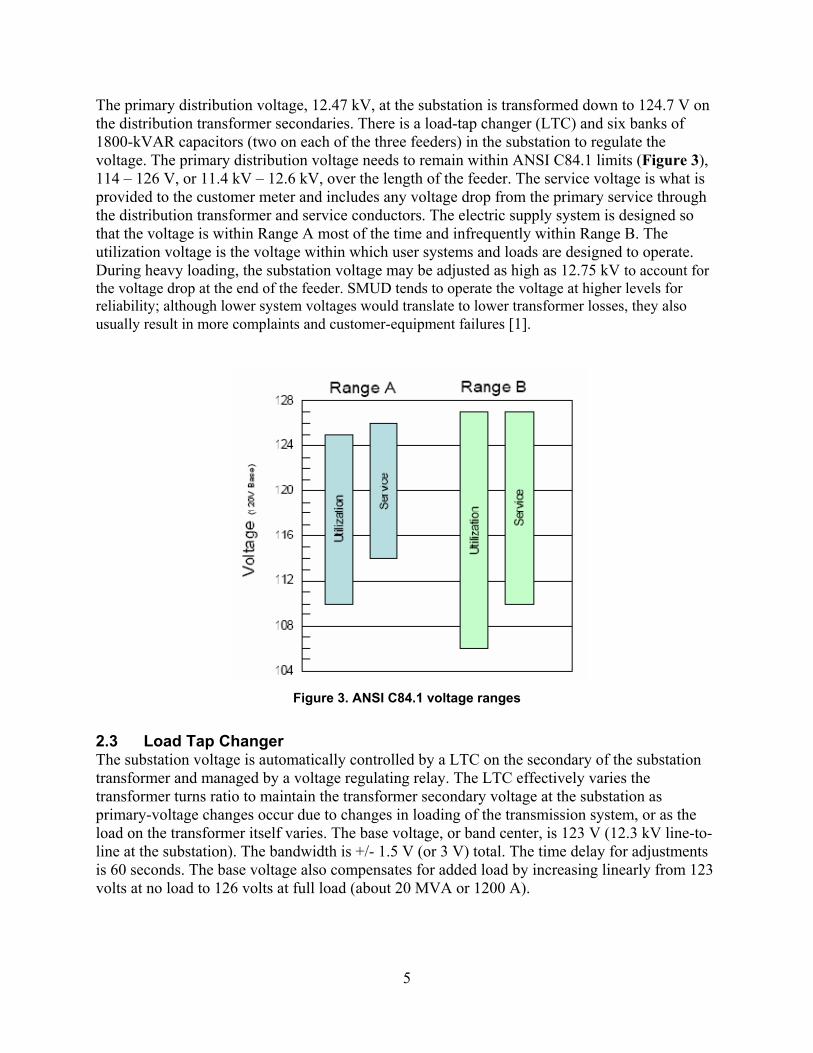
The primary distribution voltage, 12.47 kV, at the substation is transformed down to 124.7 V on the distribution transformer secondaries. There is a load-tap changer (LTC) and six banks of 1800-kVAR capacitors (two on each of the three feeders) in the substation to regulate the voltage. The primary distribution voltage needs to remain within ANSI C84.1 limits (Figure 3), 114 – 126 V, or 11.4 kV – 12.6 kV, over the length of the feeder. The service voltage is what is provided to the customer meter and includes any voltage drop from the primary service through the distribution transformer and service conductors. The electric supply system is designed so that the voltage is within Range A most of the time and infrequently within Range B. The utilization voltage is the voltage within which user systems and loads are designed to operate. During heavy loading, the substation voltage may be adjusted as high as 12.75 kV to account for the voltage drop at the end of the feeder. SMUD tends to operate the voltage at higher levels for reliability; although lower system voltages would translate to lower transformer losses, they also usually result in more complaints and customer-equipment failures [1].
Figure 3. ANSI C84.1 voltage ranges
2.3 Load Tap Changer The substation voltage is automatically controlled by a LTC on the secondary of the substation transformer and managed by a voltage regulating relay. The LTC effectively varies the transformer turns ratio to maintain the transformer secondary voltage at the substation as primary-voltage changes occur due to changes in loading of the transmission system, or as the load on the transformer itself varies. The base voltage, or band center, is 123 V (12.3 kV line-to-line at the substation). The bandwidth is +/- 1.5 V (or 3 V) total. The time delay for adjustments is 60 seconds. The base voltage also compensates for added load by increasing linearly from 123 volts at no load to 126 volts at full load (about 20 MVA or 1200 A).
5
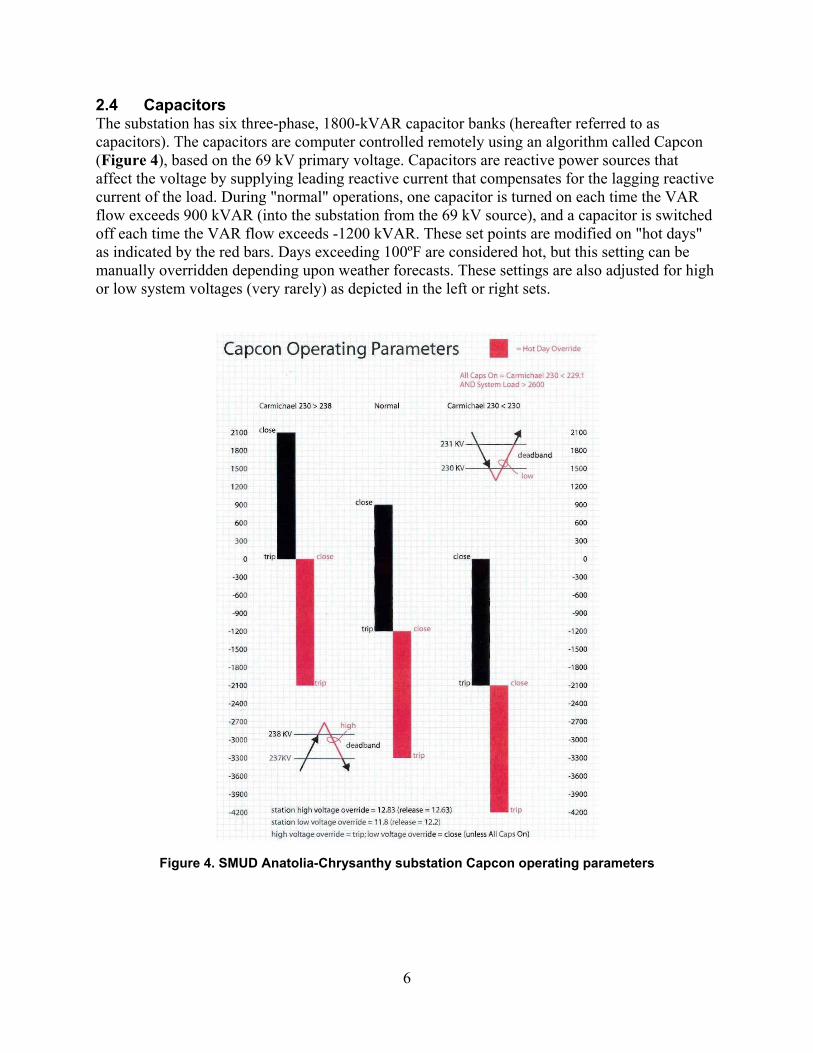
2.4 Capacitors The substation has six three-phase, 1800-kVAR capacitor banks (hereafter referred to as capacitors). The capacitors are computer controlled remotely using an algorithm called Capcon (Figure 4), based on the 69 kV primary voltage. Capacitors are reactive power sources that affect the voltage by supplying leading reactive current that compensates for the lagging reactive current of the load. During "normal" operations, one capacitor is turned on each time the VAR flow exceeds 900 kVAR (into the substation from the 69 kV source), and a capacitor is switched off each time the VAR flow exceeds -1200 kVAR. These set points are modified on "hot days" as indicated by the red bars. Days exceeding 100ºF are considered hot, but this setting can be manually overridden depending upon weather forecasts. These settings are also adjusted for high or low system voltages (very rarely) as depicted in the left or right sets.
Figure 4. SMUD Anatolia-Chrysanthy substation Capcon operating parameters
6
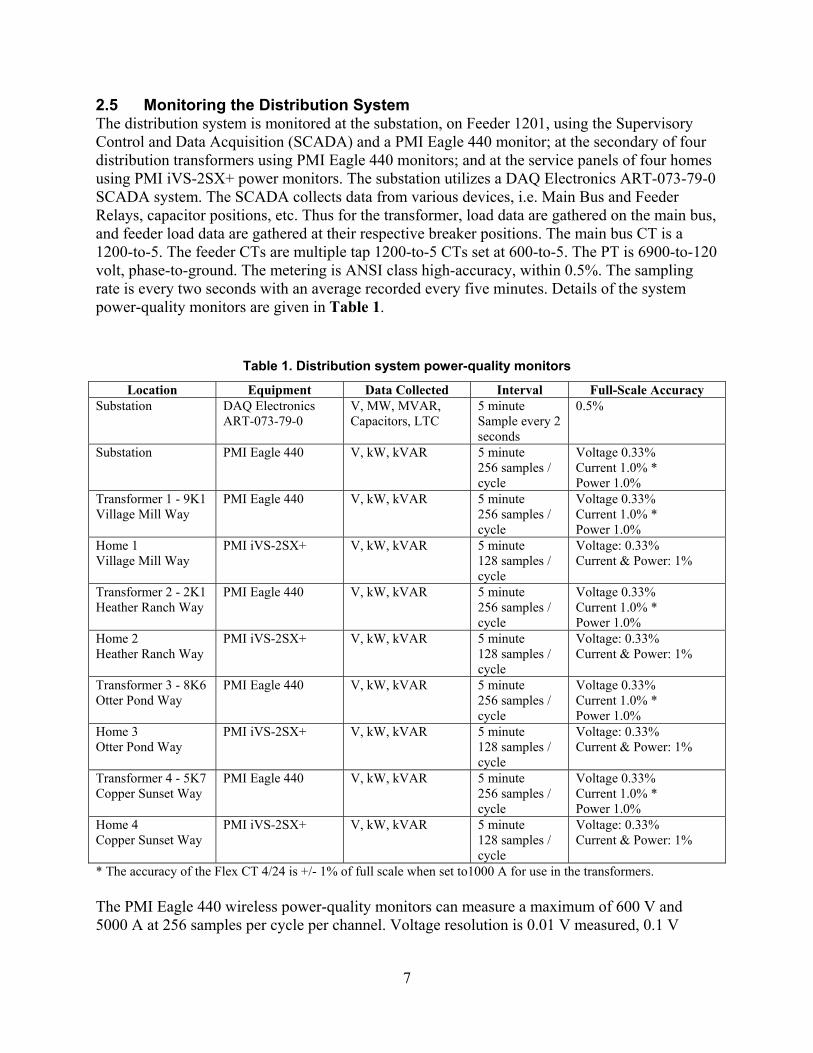
2.5 Monitoring the Distribution System The distribution system is monitored at the substation, on Feeder 1201, using the Supervisory Control and Data Acquisition (SCADA) and a PMI Eagle 440 monitor; at the secondary of four distribution transformers using PMI Eagle 440 monitors; and at the service panels of four homes using PMI iVS-2SX+ power monitors. The substation utilizes a DAQ Electronics ART-073-79-0 SCADA system. The SCADA collects data from various devices, i.e. Main Bus and Feeder Relays, capacitor positions, etc. Thus for the transformer, load data are gathered on the main bus, and feeder load data are gathered at their respective breaker positions. The main bus CT is a 1200-to-5. The feeder CTs are multiple tap 1200-to-5 CTs set at 600-to-5. The PT is 6900-to-120 volt, phase-to-ground. The metering is ANSI class high-accuracy, within 0.5%. The sampling rate is every two seconds with an average recorded every five minutes. Details of the system power-quality monitors are given in Table 1.
Table 1. Distribution system power-quality monitors
Location Equipment Data Collected Interval Full-Scale Accuracy Substation DAQ Electronics
ART-073-79-0 V, MW, MVAR, Capacitors, LTC
5 minute Sample every 2 seconds
0.5%
Substation PMI Eagle 440 V, kW, kVAR 5 minute 256 samples / cycle
Voltage 0.33% Current 1.0% * Power 1.0%
Transformer 1 - 9K1 Village Mill Way
PMI Eagle 440 V, kW, kVAR 5 minute 256 samples / cycle
Voltage 0.33% Current 1.0% * Power 1.0%
Home 1 Village Mill Way
PMI iVS-2SX+ V, kW, kVAR 5 minute 128 samples / cycle
Voltage: 0.33% Current & Power: 1%
Transformer 2 - 2K1 Heather Ranch Way
PMI Eagle 440 V, kW, kVAR 5 minute 256 samples / cycle
Voltage 0.33% Current 1.0% * Power 1.0%
Home 2 Heather Ranch Way
PMI iVS-2SX+ V, kW, kVAR 5 minute 128 samples / cycle
Voltage: 0.33% Current & Power: 1%
Transformer 3 - 8K6 Otter Pond Way
PMI Eagle 440 V, kW, kVAR 5 minute 256 samples / cycle
Voltage 0.33% Current 1.0% * Power 1.0%
Home 3 Otter Pond Way
PMI iVS-2SX+ V, kW, kVAR 5 minute 128 samples / cycle
Voltage: 0.33% Current & Power: 1%
Transformer 4 - 5K7 Copper Sunset Way
PMI Eagle 440 V, kW, kVAR 5 minute 256 samples / cycle
Voltage 0.33% Current 1.0% * Power 1.0%
Home 4 Copper Sunset Way
PMI iVS-2SX+ V, kW, kVAR 5 minute 128 samples / cycle
Voltage: 0.33% Current & Power: 1%
* The accuracy of the Flex CT 4/24 is +/- 1% of full scale when set to1000 A for use in the transformers. The PMI Eagle 440 wireless power-quality monitors can measure a maximum of 600 V and 5000 A at 256 samples per cycle per channel. Voltage resolution is 0.01 V measured, 0.1 V
7

rounded and logged. Current resolution is 5 A. The Eagle 440 monitors are placed inside the distribution transformer enclosures. Data are gathered via a wireless Bluetooth connection.
The PMI iVS-2SX+ socket-mounted monitors can measure a maximum of 140 V and 200 A at 128 samples per cycle per channel. The collar monitors plug in-line with the residential watt-hour meter. Voltage resolution is 0.1 V measured, 0.5 V rounded and logged. Current resolution is 0.2 A. Data are gathered via a serial cable.
Solar and metrological data is also collected from a solar/meteorological station installed at the substation. One-minute-interval data from the solar/meteorological station are collected automatically each day and can be found at http://www.nrel.gov/midc/smud_anatolia/.
8
3 Monitoring Results and Analysis
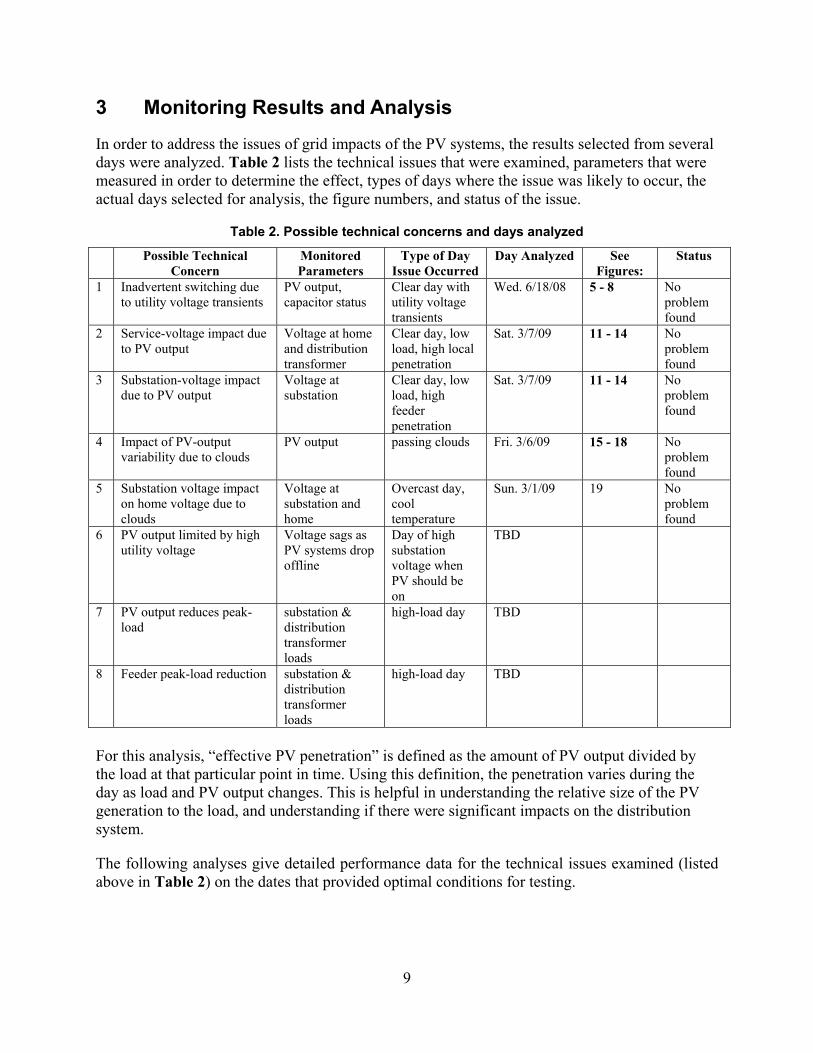
In order to address the issues of grid impacts of the PV systems, the results selected from several days were analyzed. Table 2 lists the technical issues that were examined, parameters that were measured in order to determine the effect, types of days where the issue was likely to occur, the actual days selected for analysis, the figure numbers, and status of the issue.
Table 2. Possible technical concerns and days analyzed
Possible Technical Concern
Monitored Parameters
Type of Day Issue Occurred
Day Analyzed See Figures:
Status
1 Inadvertent switching due to utility voltage transients
PV output, capacitor status
Clear day with utility voltage transients
Wed. 6/18/08 5 - 8 No problem found
2 Service-voltage impact due to PV output
Voltage at home and distribution transformer
Clear day, low load, high local penetration
Sat. 3/7/09
11 - 14 No problem found
3 Substation-voltage impact due to PV output
Voltage at substation
Clear day, low load, high feeder penetration
Sat. 3/7/09
11 - 14 No problem found
4 Impact of PV-output variability due to clouds
PV output passing clouds Fri. 3/6/09
15 - 18 No problem found
5 Substation voltage impact on home voltage due to clouds
Voltage at substation and home
Overcast day, cool temperature
Sun. 3/1/09 19 No problem found
6 PV output limited by high utility voltage
Voltage sags as PV systems drop offline
Day of high substation voltage when PV should be on
TBD
7 PV output reduces peak-load
substation & distribution transformer loads
high-load day TBD
8 Feeder peak-load reduction substation & distribution transformer loads
high-load day TBD
For this analysis, “effective PV penetration” is defined as the amount of PV output divided by the load at that particular point in time. Using this definition, the penetration varies during the day as load and PV output changes. This is helpful in understanding the relative size of the PV generation to the load, and understanding if there were significant impacts on the distribution system.
The following analyses give detailed performance data for the technical issues examined (listed above in Table 2) on the dates that provided optimal conditions for testing.
9
3.1 Inadvertent Switching Due To Utility Voltage Transients Wednesday, June 18, 2008 – Clear, Hot Weekday, 96°F Wednesday, June 18, 2008, was a hot, clear day with significant capacitor switching. As of this date, there was a 2.0 kWac PV system on Home 3, 30.1 kWac of PV (from twelve SolarSmart Homes) on Transformer 3, and 182 kWac of PV (from 85 SolarSmart Homes) on the distribution system. Because it was a clear day, it provided optimal conditions to examine whether the inverter tripped due to utility transients. At noon there was an effective PV penetration level of 8.3% (182 kW / 2200 kW) on Feeder 1201 and 2.2% on the entire substation transformer.
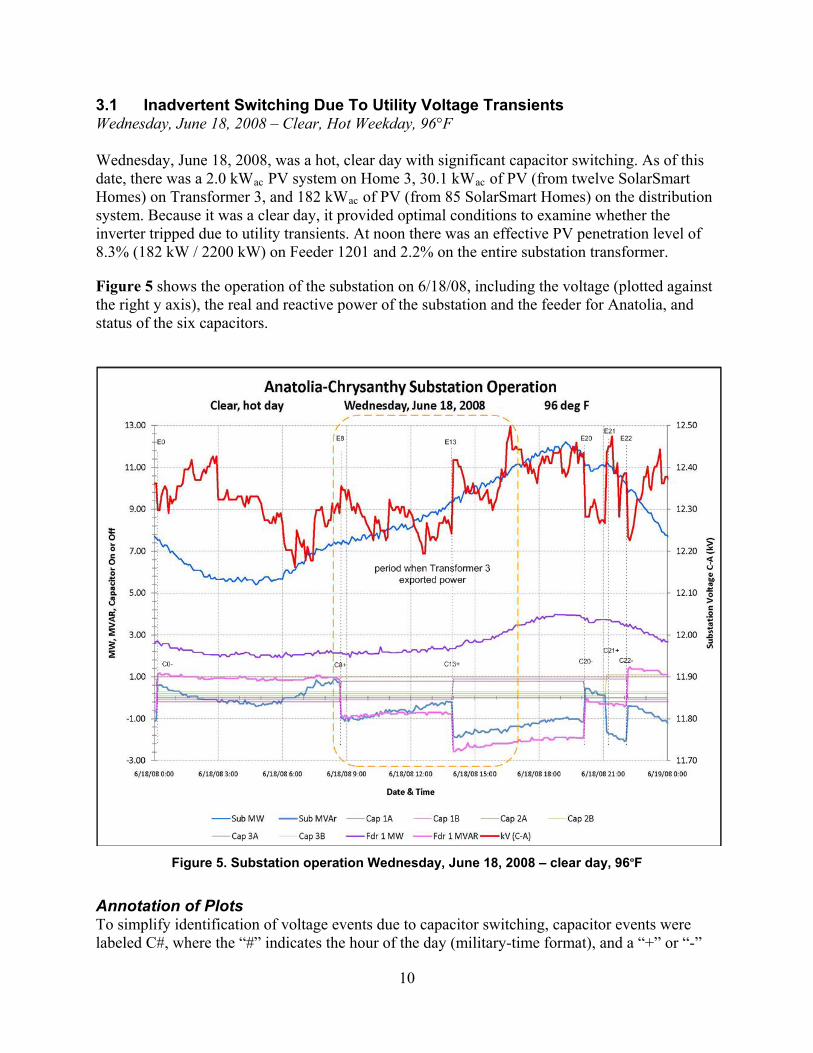
Figure 5 shows the operation of the substation on 6/18/08, including the voltage (plotted against the right y axis), the real and reactive power of the substation and the feeder for Anatolia, and status of the six capacitors.
Figure 5. Substation operation Wednesday, June 18, 2008 – clear day, 96ºF
Annotation of Plots To simplify identification of voltage events due to capacitor switching, capacitor events were labeled C#, where the “#” indicates the hour of the day (military-time format), and a “+” or “-”
10

suffix indicates a capacitor switched on or off. The status of the six 1800-kVAR capacitors can be seen on the plot. A capacitor that is on or connected to the bus is shown as approximately “1”; if it’s off or disconnected, it’s approximately “0”. Event numbers, E#, were then assigned all capacitor events, with the numbers, again, based on the military time. Voltage events are noted to help determine if they were caused by substation operations, by loads in the Anatolia community, or by PV system operation. Faint vertical lines were drawn on each of the plots to help indicate when events occurred. Orange boxes enclose the time periods in which the transformer or home was exporting power to the distribution system, or when the home voltage was greater than the substation voltage during daylight hours.
Six capacitor-switching events took place on 6/18/09 (Figure 5). As a capacitor is switched on, there is a corresponding drop in the reactive power. One of these events can be seen, for example, at E8 when C2 is switched on – the “Sub MVAR” and “Fdr 1 MVAR” values both drop from about 0.9 MVAR to -0.9 MVAR. “Sub MVAR” is the total substation reactive power and “Fdr 1 MVAR” is the reactive power of Feeder 1201 that feeds the Anatolia community. The peak load for the day occurred around 19:30, peaking around 12 MW for the substation, and 4 MW for the feeder.
11
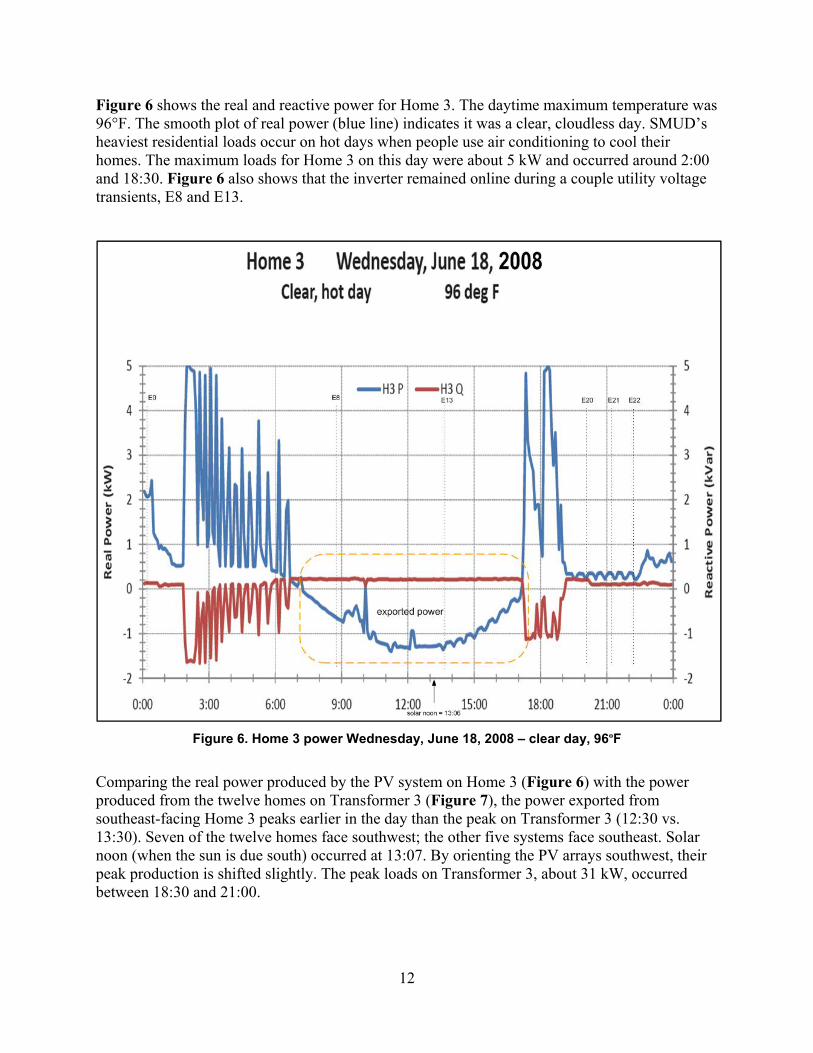
Figure 6 shows the real and reactive power for Home 3. The daytime maximum temperature was 96°F. The smooth plot of real power (blue line) indicates it was a clear, cloudless day. SMUD’s heaviest residential loads occur on hot days when people use air conditioning to cool their homes. The maximum loads for Home 3 on this day were about 5 kW and occurred around 2:00 and 18:30. Figure 6 also shows that the inverter remained online during a couple utility voltage transients, E8 and E13.
Figure 6. Home 3 power Wednesday, June 18, 2008 – clear day, 96ºF
Comparing the real power produced by the PV system on Home 3 (Figure 6) with the power produced from the twelve homes on Transformer 3 (Figure 7), the power exported from southeast-facing Home 3 peaks earlier in the day than the peak on Transformer 3 (12:30 vs. 13:30). Seven of the twelve homes face southwest; the other five systems face southeast. Solar noon (when the sun is due south) occurred at 13:07. By orienting the PV arrays southwest, their peak production is shifted slightly. The peak loads on Transformer 3, about 31 kW, occurred between 18:30 and 21:00.
12
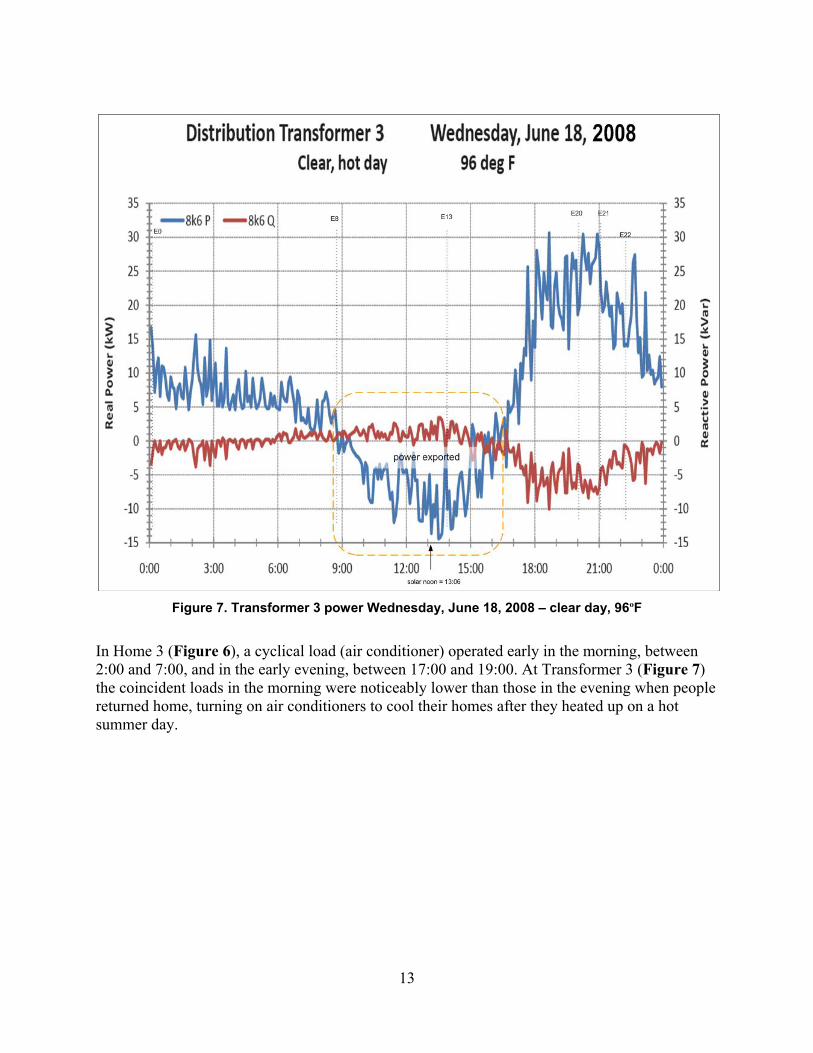
Figure 7. Transformer 3 power Wednesday, June 18, 2008 – clear day, 96ºF
In Home 3 (Figure 6), a cyclical load (air conditioner) operated early in the morning, between 2:00 and 7:00, and in the early evening, between 17:00 and 19:00. At Transformer 3 (Figure 7) the coincident loads in the morning were noticeably lower than those in the evening when people returned home, turning on air conditioners to cool their homes after they heated up on a hot summer day.
13
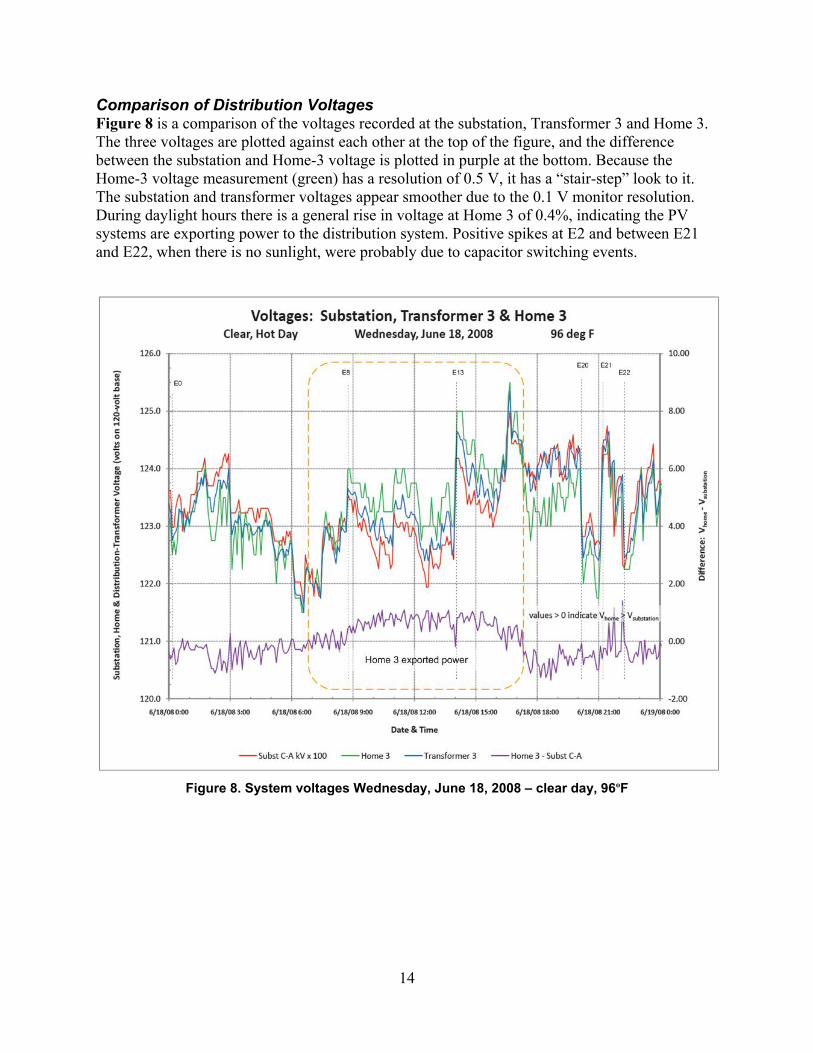
Comparison of Distribution Voltages Figure 8 is a comparison of the voltages recorded at the substation, Transformer 3 and Home 3. The three voltages are plotted against each other at the top of the figure, and the difference between the substation and Home-3 voltage is plotted in purple at the bottom. Because the Home-3 voltage measurement (green) has a resolution of 0.5 V, it has a “stair-step” look to it. The substation and transformer voltages appear smoother due to the 0.1 V monitor resolution. During daylight hours there is a general rise in voltage at Home 3 of 0.4%, indicating the PV systems are exporting power to the distribution system. Positive spikes at E2 and between E21 and E22, when there is no sunlight, were probably due to capacitor switching events.
Figure 8. System voltages Wednesday, June 18, 2008 – clear day, 96ºF
14
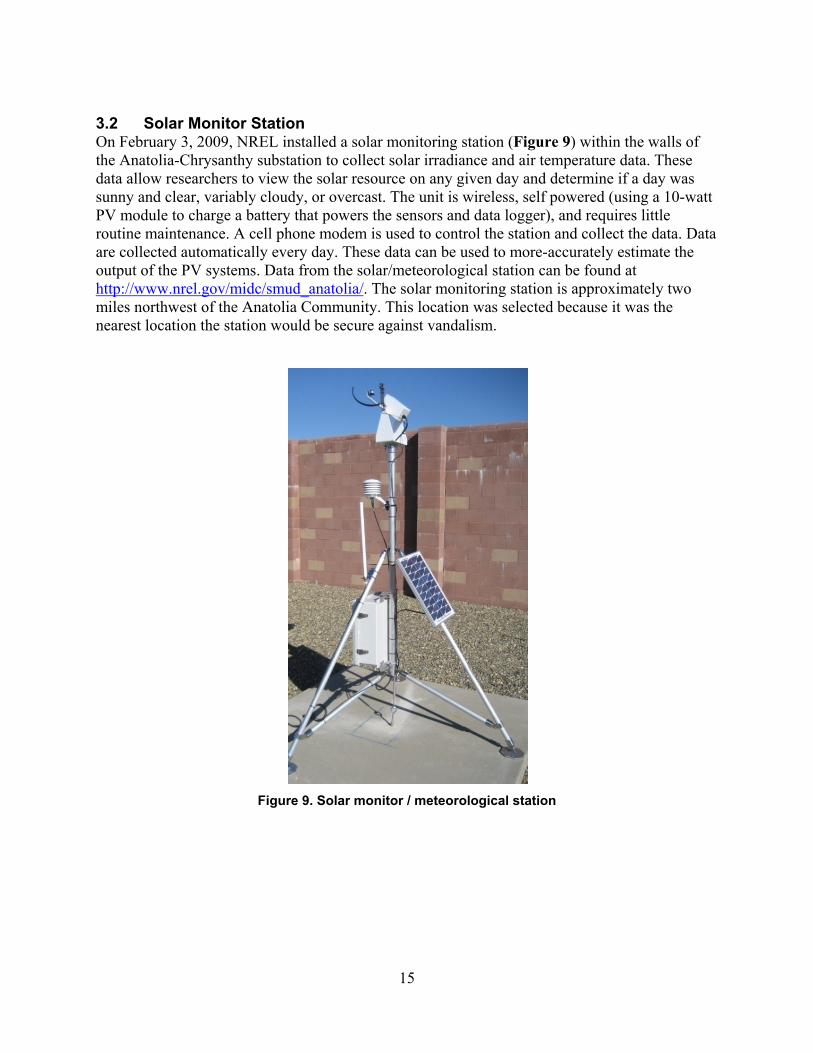
3.2 Solar Monitor Station On February 3, 2009, NREL installed a solar monitoring station (Figure 9) within the walls of the Anatolia-Chrysanthy substation to collect solar irradiance and air temperature data. These data allow researchers to view the solar resource on any given day and determine if a day was sunny and clear, variably cloudy, or overcast. The unit is wireless, self powered (using a 10-watt PV module to charge a battery that powers the sensors and data logger), and requires little routine maintenance. A cell phone modem is used to control the station and collect the data. Data are collected automatically every day. These data can be used to more-accurately estimate the output of the PV systems. Data from the solar/meteorological station can be found at http://www.nrel.gov/midc/smud_anatolia/. The solar monitoring station is approximately two miles northwest of the Anatolia Community. This location was selected because it was the nearest location the station would be secure against vandalism.
Figure 9. Solar monitor / meteorological station
15
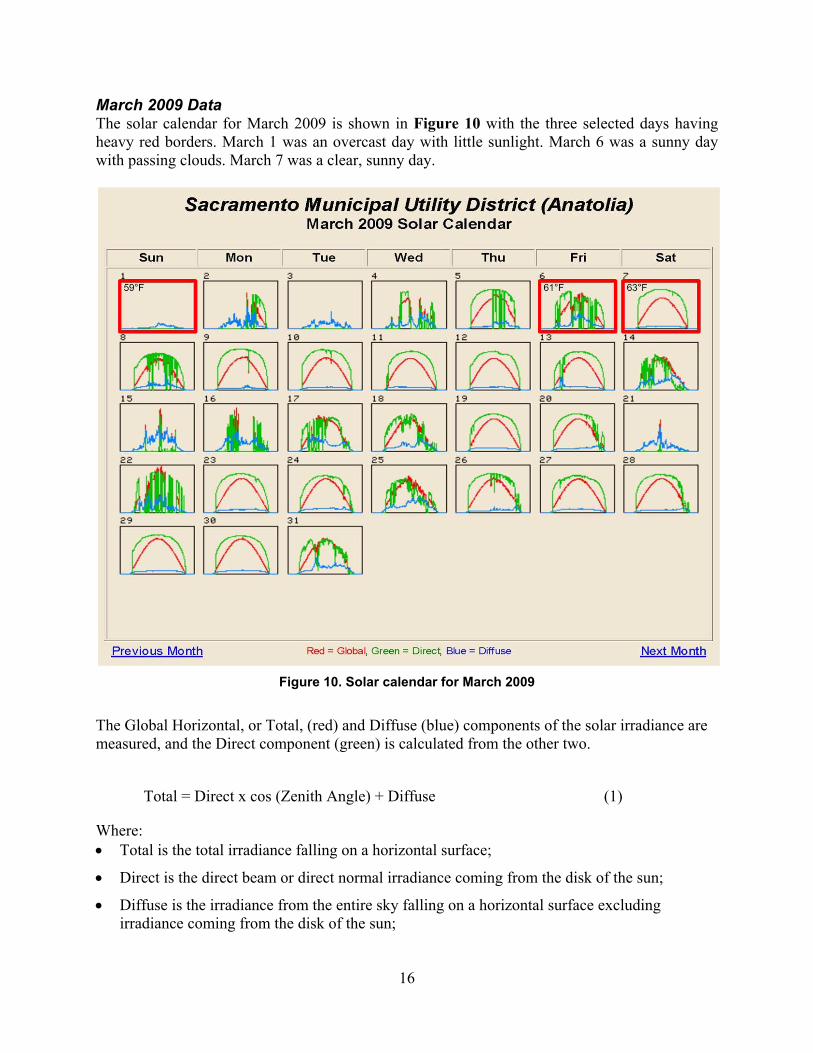
March 2009 Data The solar calendar for March 2009 is shown in Figure 10 with the three selected days having heavy red borders. March 1 was an overcast day with little sunlight. March 6 was a sunny day with passing clouds. March 7 was a clear, sunny day.
Figure 10. Solar calendar for March 2009
The Global Horizontal, or Total, (red) and Diffuse (blue) components of the solar irradiance are measured, and the Direct component (green) is calculated from the other two.
Total = Direct x cos (Zenith Angle) + Diffuse (1)
Where: • Total is the total irradiance falling on a horizontal surface;
• Direct is the direct beam or direct normal irradiance coming from the disk of the sun;
• Diffuse is the irradiance from the entire sky falling on a horizontal surface excluding irradiance coming from the disk of the sun;
16

• Zenith Angle (computed) is measured from straight overhead down an arc to a point at the center of the sun.
Three days in March 2009 were selected for analysis : • Saturday, March 7, 2009 – clear, cool weekend day, 63°F daytime high
• Friday, March 6, 2009 – variably cloudy, cool weekday, 61°F daytime high
• Sunday, March 1, 2009 – overcast, cool, weekend day, 59°F daytime high.
As of March 2009, there was a 2.0 kWac PV system on Home 3, 30.1 kWac of PV (serving twelve SolarSmart Homes) on Transformer 3, and 238 kWac of PV (serving 115 SolarSmart Homes) on the distribution system.
17
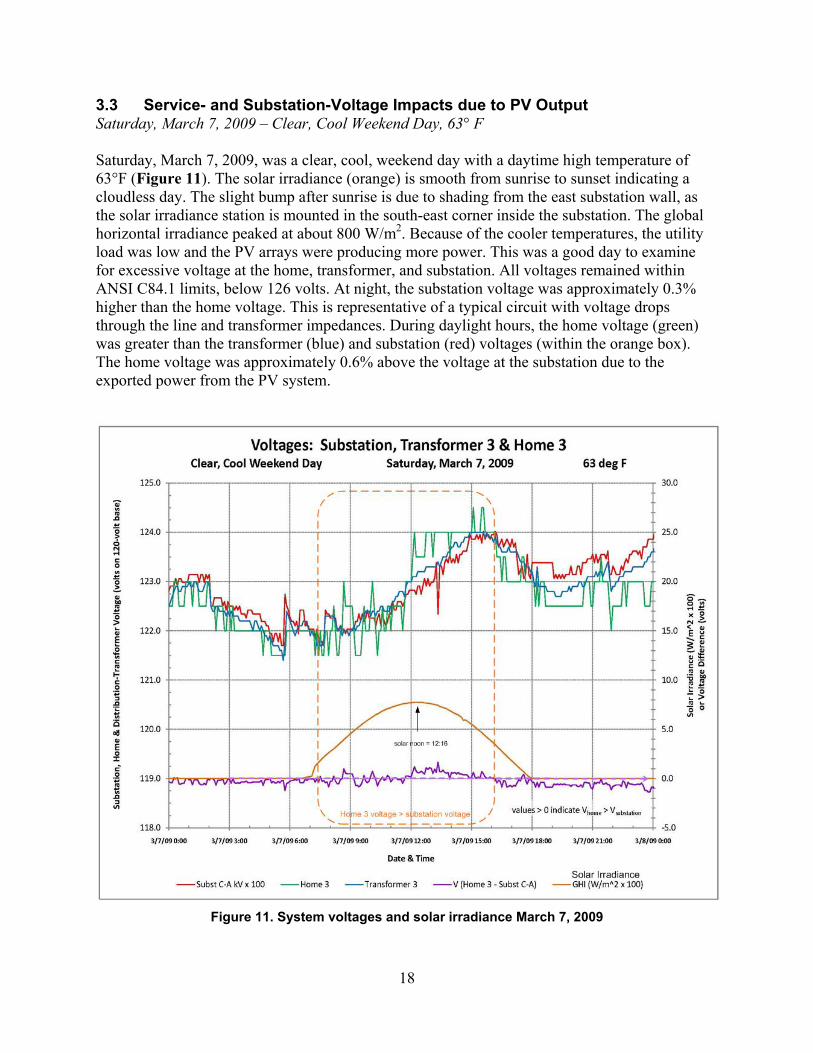
3.3 Service- and Substation-Voltage Impacts due to PV Output Saturday, March 7, 2009 – Clear, Cool Weekend Day, 63° F Saturday, March 7, 2009, was a clear, cool, weekend day with a daytime high temperature of 63°F (Figure 11). The solar irradiance (orange) is smooth from sunrise to sunset indicating a cloudless day. The slight bump after sunrise is due to shading from the east substation wall, as the solar irradiance station is mounted in the south-east corner inside the substation. The global horizontal irradiance peaked at about 800 W/m2. Because of the cooler temperatures, the utility load was low and the PV arrays were producing more power. This was a good day to examine for excessive voltage at the home, transformer, and substation. All voltages remained within ANSI C84.1 limits, below 126 volts. At night, the substation voltage was approximately 0.3% higher than the home voltage. This is representative of a typical circuit with voltage drops through the line and transformer impedances. During daylight hours, the home voltage (green) was greater than the transformer (blue) and substation (red) voltages (within the orange box). The home voltage was approximately 0.6% above the voltage at the substation due to the exported power from the PV system.
Figure 11. System voltages and solar irradiance March 7, 2009
18
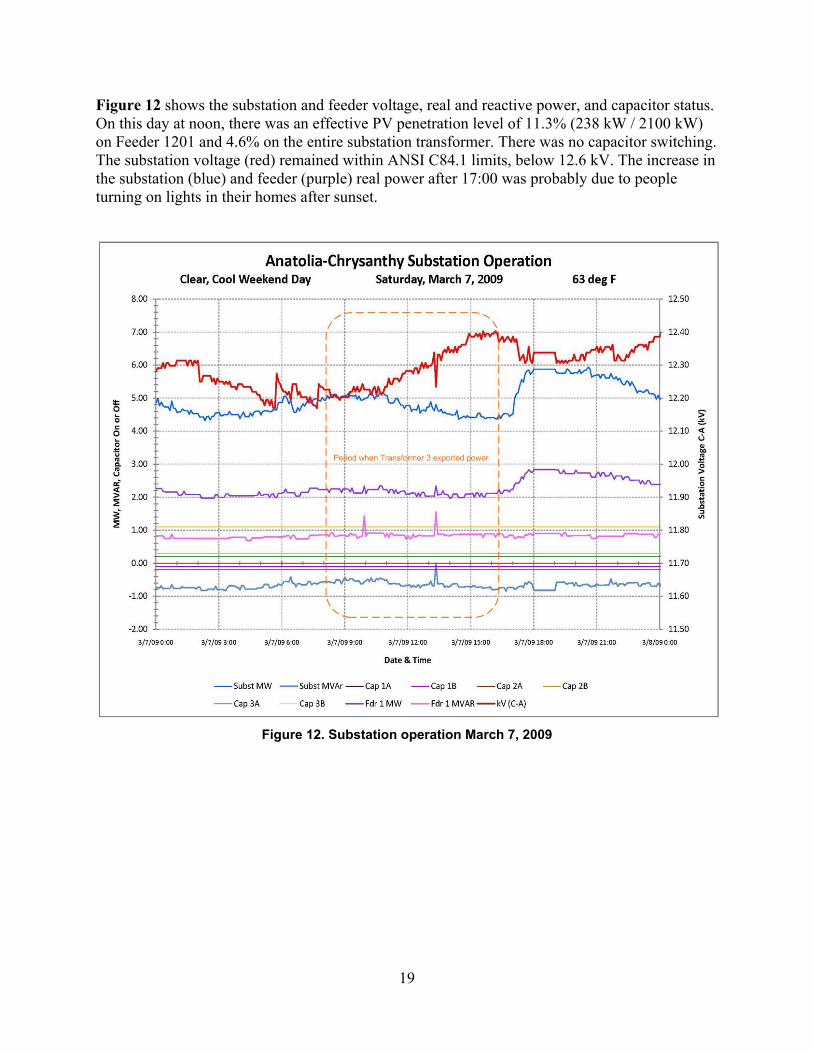
Figure 12 shows the substation and feeder voltage, real and reactive power, and capacitor status. On this day at noon, there was an effective PV penetration level of 11.3% (238 kW / 2100 kW) on Feeder 1201 and 4.6% on the entire substation transformer. There was no capacitor switching. The substation voltage (red) remained within ANSI C84.1 limits, below 12.6 kV. The increase in the substation (blue) and feeder (purple) real power after 17:00 was probably due to people turning on lights in their homes after sunset.
Figure 12. Substation operation March 7, 2009
19
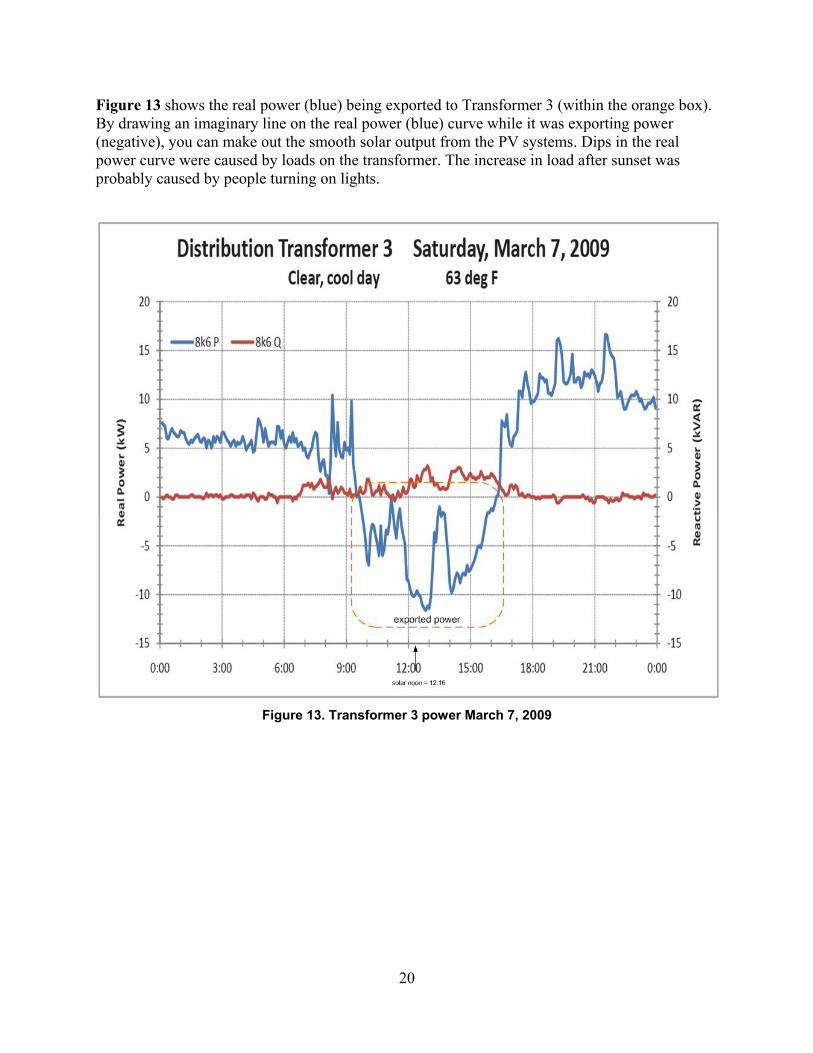
Figure 13 shows the real power (blue) being exported to Transformer 3 (within the orange box). By drawing an imaginary line on the real power (blue) curve while it was exporting power (negative), you can make out the smooth solar output from the PV systems. Dips in the real power curve were caused by loads on the transformer. The increase in load after sunset was probably caused by people turning on lights.
Figure 13. Transformer 3 power March 7, 2009
20
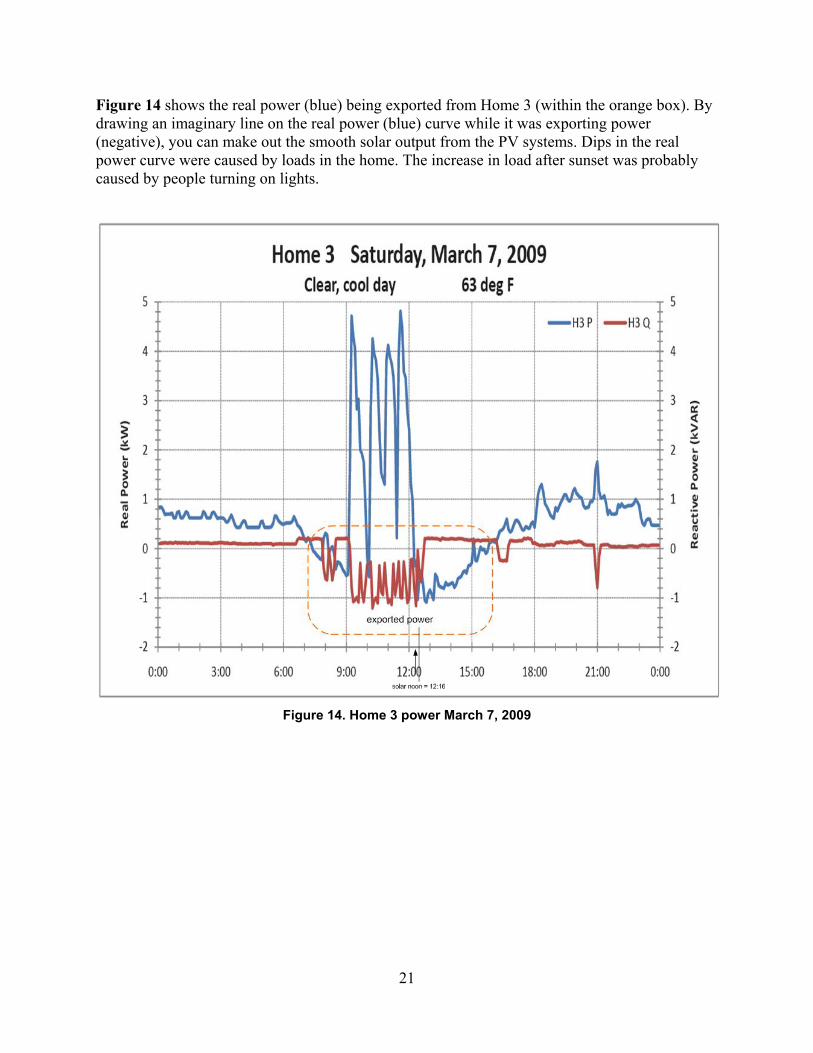
Figure 14 shows the real power (blue) being exported from Home 3 (within the orange box). By drawing an imaginary line on the real power (blue) curve while it was exporting power (negative), you can make out the smooth solar output from the PV systems. Dips in the real power curve were caused by loads in the home. The increase in load after sunset was probably caused by people turning on lights.
Figure 14. Home 3 power March 7, 2009
21
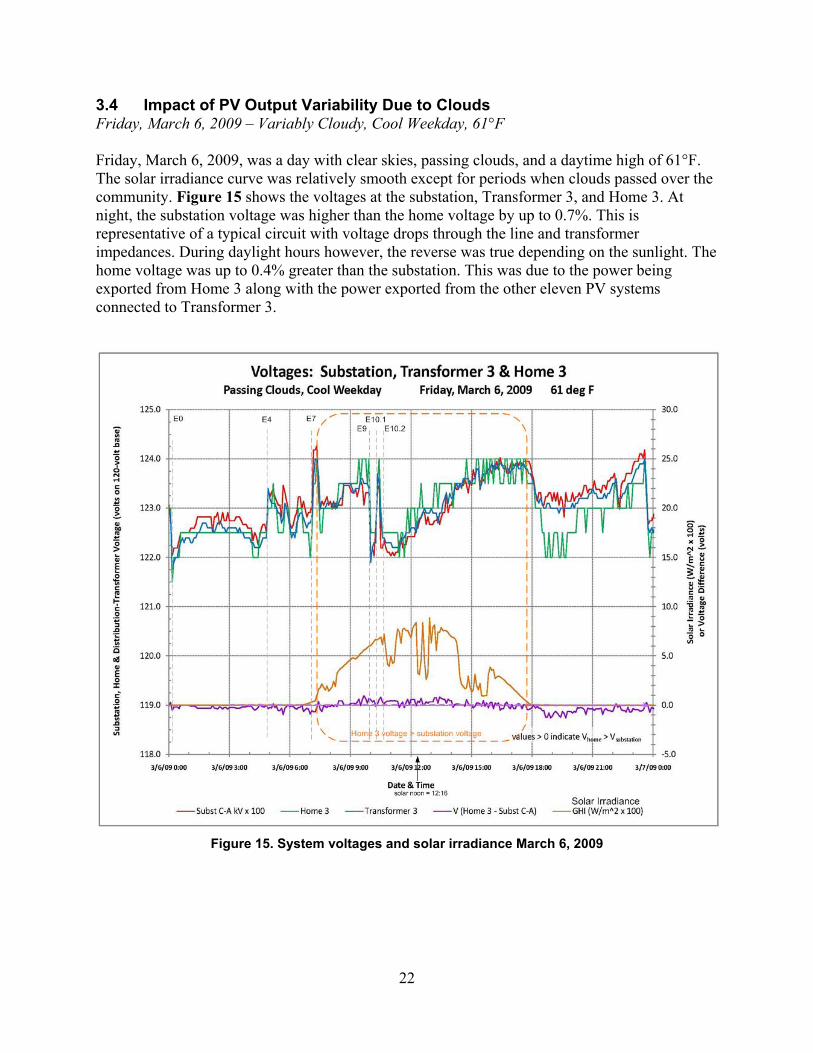
3.4 Impact of PV Output Variability Due to Clouds Friday, March 6, 2009 – Variably Cloudy, Cool Weekday, 61°F Friday, March 6, 2009, was a day with clear skies, passing clouds, and a daytime high of 61°F. The solar irradiance curve was relatively smooth except for periods when clouds passed over the community. Figure 15 shows the voltages at the substation, Transformer 3, and Home 3. At night, the substation voltage was higher than the home voltage by up to 0.7%. This is representative of a typical circuit with voltage drops through the line and transformer impedances. During daylight hours however, the reverse was true depending on the sunlight. The home voltage was up to 0.4% greater than the substation. This was due to the power being exported from Home 3 along with the power exported from the other eleven PV systems connected to Transformer 3.
Figure 15. System voltages and solar irradiance March 6, 2009
22
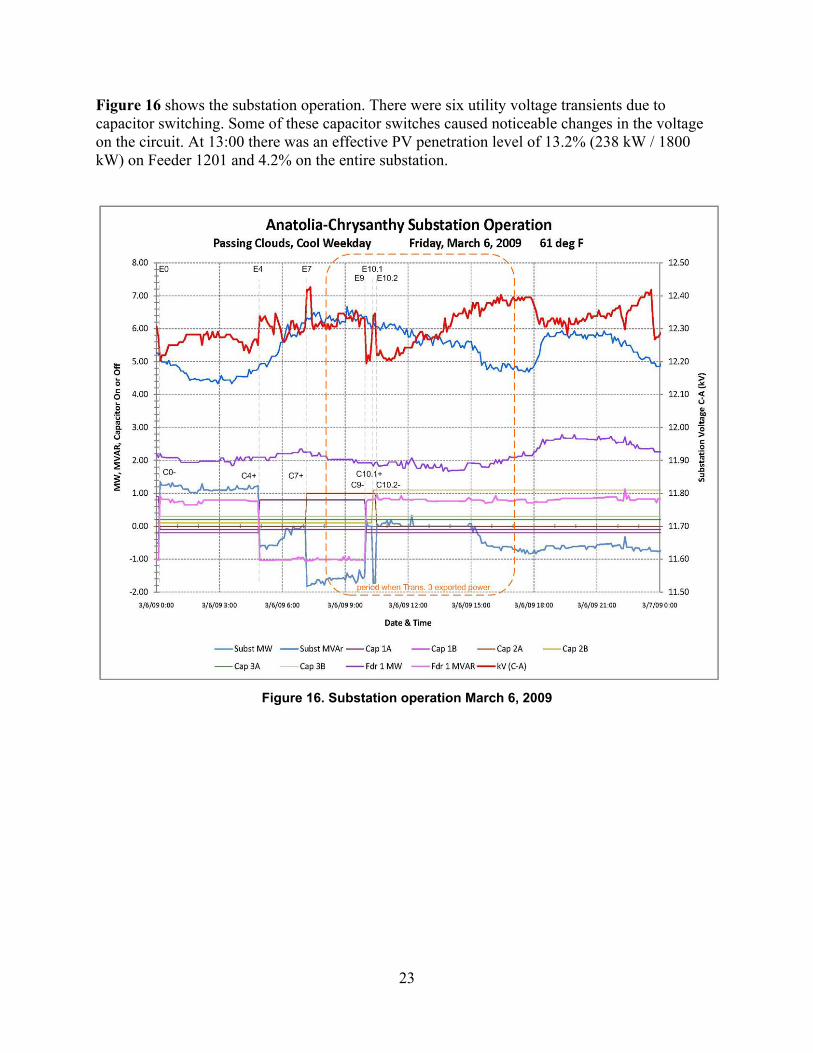
Figure 16 shows the substation operation. There were six utility voltage transients due to capacitor switching. Some of these capacitor switches caused noticeable changes in the voltage on the circuit. At 13:00 there was an effective PV penetration level of 13.2% (238 kW / 1800 kW) on Feeder 1201 and 4.2% on the entire substation.
Figure 16. Substation operation March 6, 2009
23
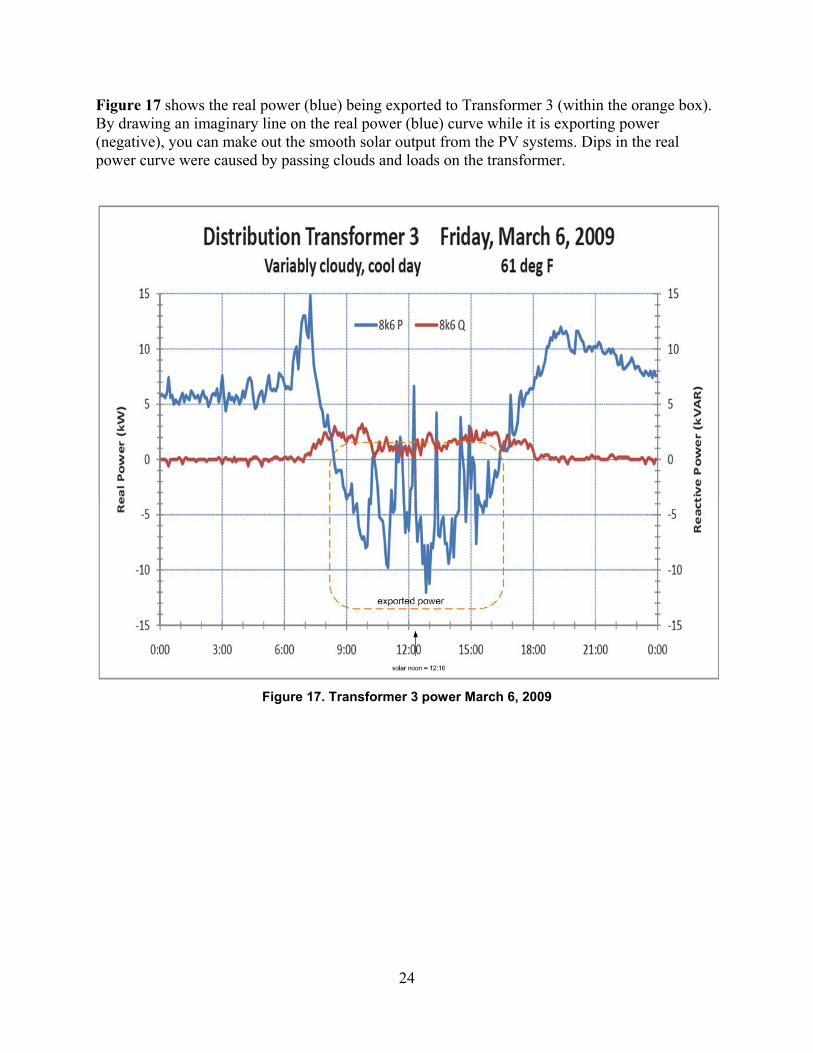
Figure 17 shows the real power (blue) being exported to Transformer 3 (within the orange box). By drawing an imaginary line on the real power (blue) curve while it is exporting power (negative), you can make out the smooth solar output from the PV systems. Dips in the real power curve were caused by passing clouds and loads on the transformer.
Figure 17. Transformer 3 power March 6, 2009
24
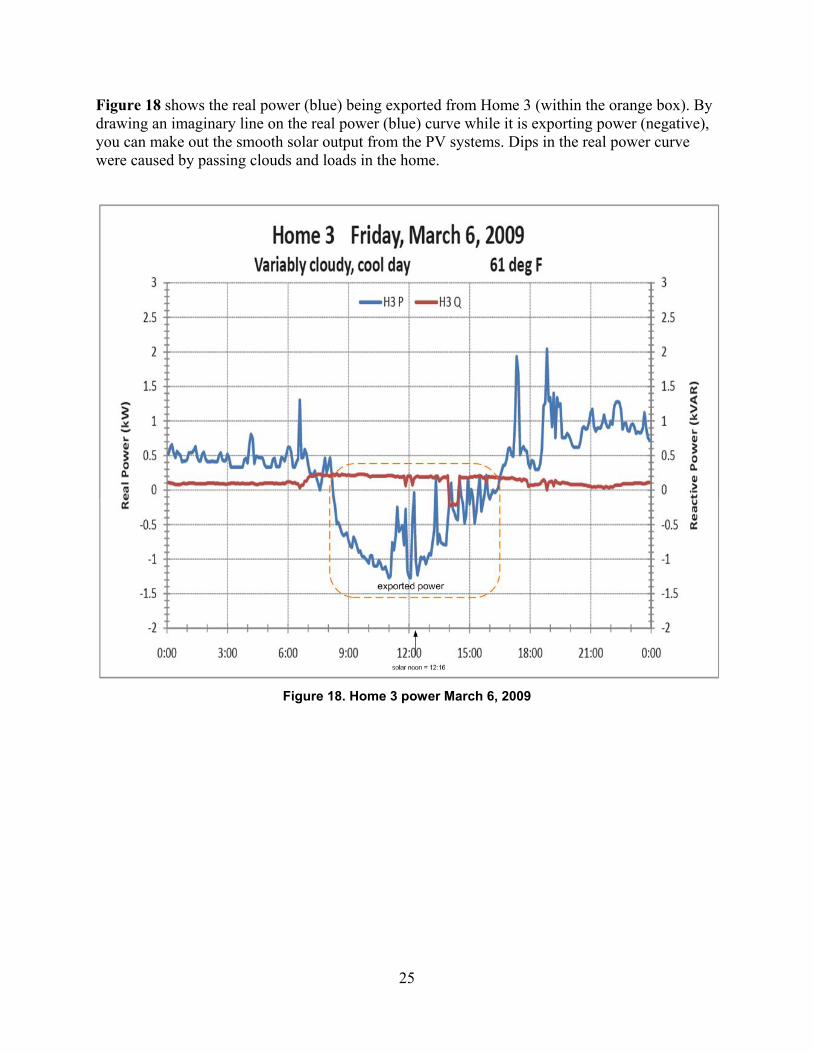
Figure 18 shows the real power (blue) being exported from Home 3 (within the orange box). By drawing an imaginary line on the real power (blue) curve while it is exporting power (negative), you can make out the smooth solar output from the PV systems. Dips in the real power curve were caused by passing clouds and loads in the home.
Figure 18. Home 3 power March 6, 2009
25
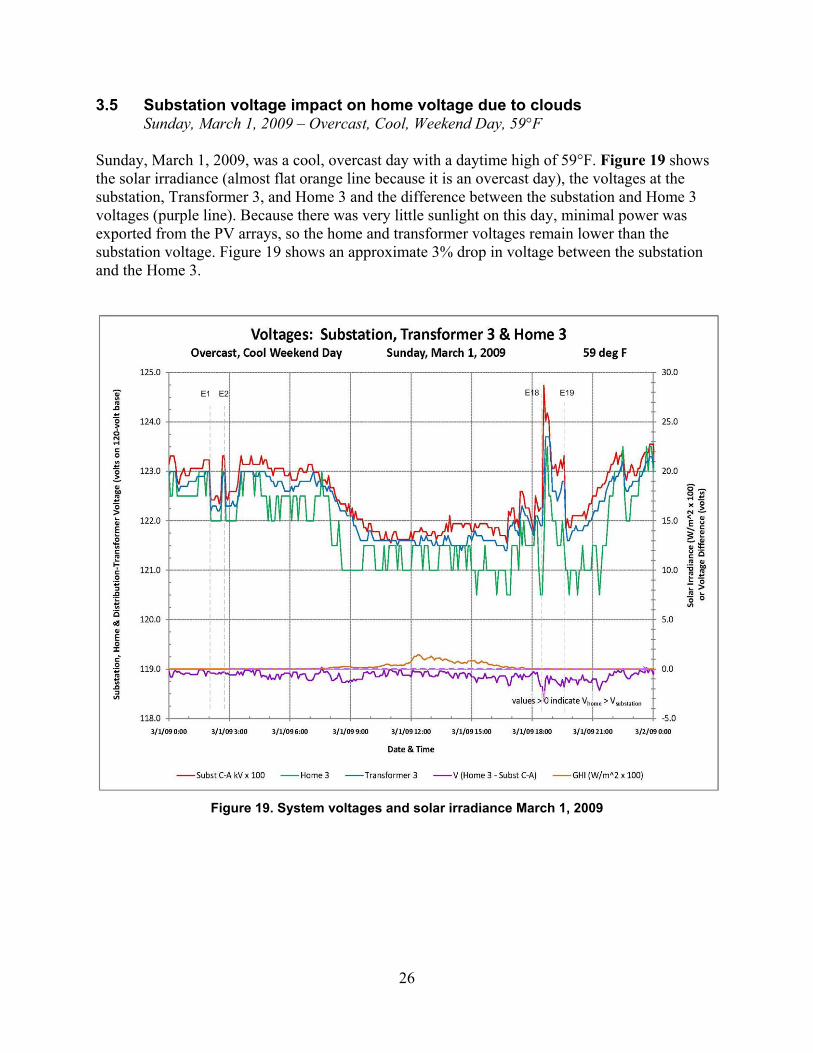
3.5 Substation voltage impact on home voltage due to clouds Sunday, March 1, 2009 – Overcast, Cool, Weekend Day, 59°F Sunday, March 1, 2009, was a cool, overcast day with a daytime high of 59°F. Figure 19 shows the solar irradiance (almost flat orange line because it is an overcast day), the voltages at the substation, Transformer 3, and Home 3 and the difference between the substation and Home 3 voltages (purple line). Because there was very little sunlight on this day, minimal power was exported from the PV arrays, so the home and transformer voltages remain lower than the substation voltage. Figure 19 shows an approximate 3% drop in voltage between the substation and the Home 3.
Figure 19. System voltages and solar irradiance March 1, 2009
26
4 Modeling
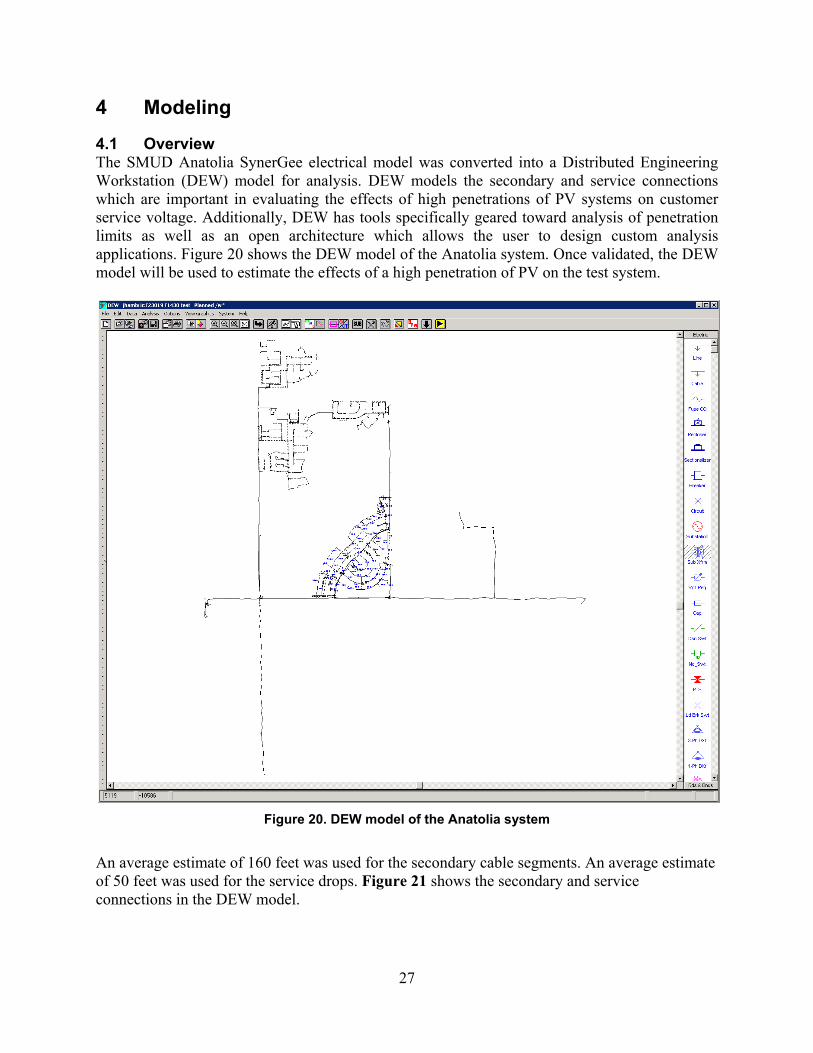
4.1 Overview The SMUD Anatolia SynerGee electrical model was converted into a Distributed Engineering Workstation (DEW) model for analysis. DEW models the secondary and service connections which are important in evaluating the effects of high penetrations of PV systems on customer service voltage. Additionally, DEW has tools specifically geared toward analysis of penetration limits as well as an open architecture which allows the user to design custom analysis applications. Figure 20 shows the DEW model of the Anatolia system. Once validated, the DEW model will be used to estimate the effects of a high penetration of PV on the test system.
Figure 20. DEW model of the Anatolia system
An average estimate of 160 feet was used for the secondary cable segments. An average estimate of 50 feet was used for the service drops. Figure 21 shows the secondary and service connections in the DEW model.
27
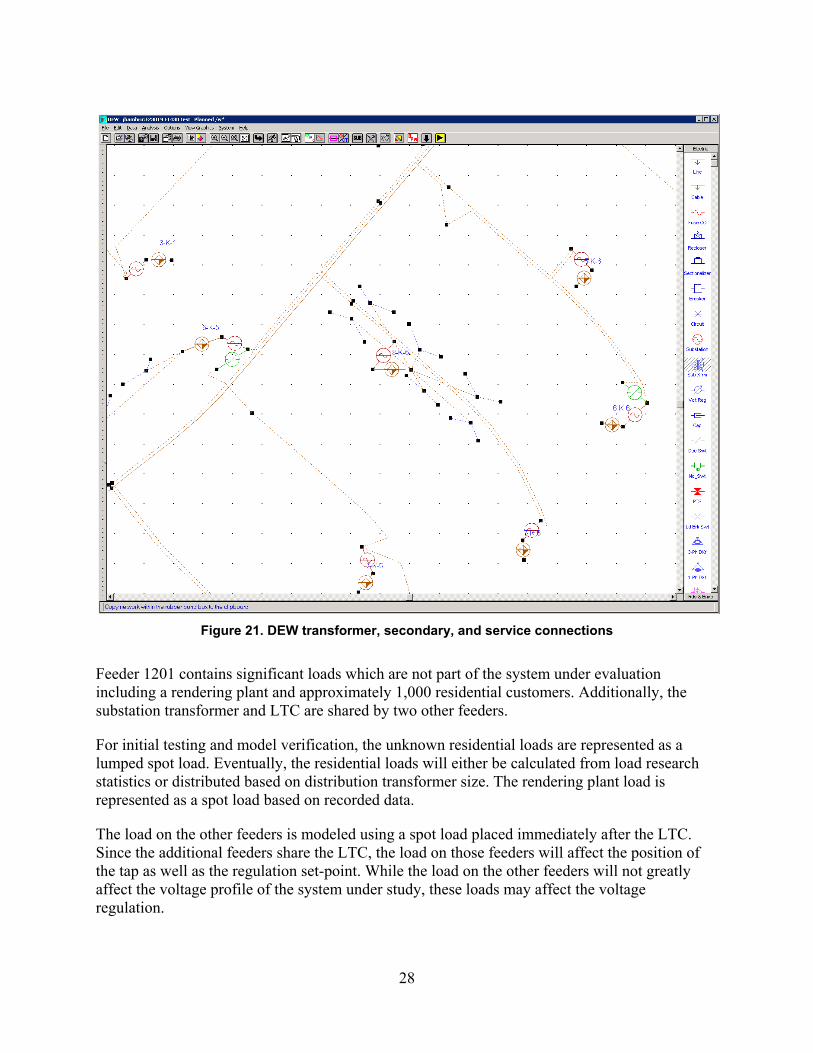
Figure 21. DEW transformer, secondary, and service connections
Feeder 1201 contains significant loads which are not part of the system under evaluation including a rendering plant and approximately 1,000 residential customers. Additionally, the substation transformer and LTC are shared by two other feeders.
For initial testing and model verification, the unknown residential loads are represented as a lumped spot load. Eventually, the residential loads will either be calculated from load research statistics or distributed based on distribution transformer size. The rendering plant load is represented as a spot load based on recorded data.
The load on the other feeders is modeled using a spot load placed immediately after the LTC. Since the additional feeders share the LTC, the load on those feeders will affect the position of the tap as well as the regulation set-point. While the load on the other feeders will not greatly affect the voltage profile of the system under study, these loads may affect the voltage regulation.
28
Verification To verify the topology of the DEW model and to ensure the switching devices are represented in their correct states, the electrical distances from the substation of the measurement points are compared against the estimated values from Figure 1. Table 3 describes this comparison. All modeled electrical distances are within 3.5% of the estimated distances.
Table 3. Comparison of estimated to calculated distances
Transformer Estimated Distance (ft)
DEW Distance from Substation (ft)
Difference (%)
9K1 10,150 10,476 3.21 2K1 14,925 15,045 0.8 8K6 16,430 16,223 1.3 5K7 22,360 22,606 1.1
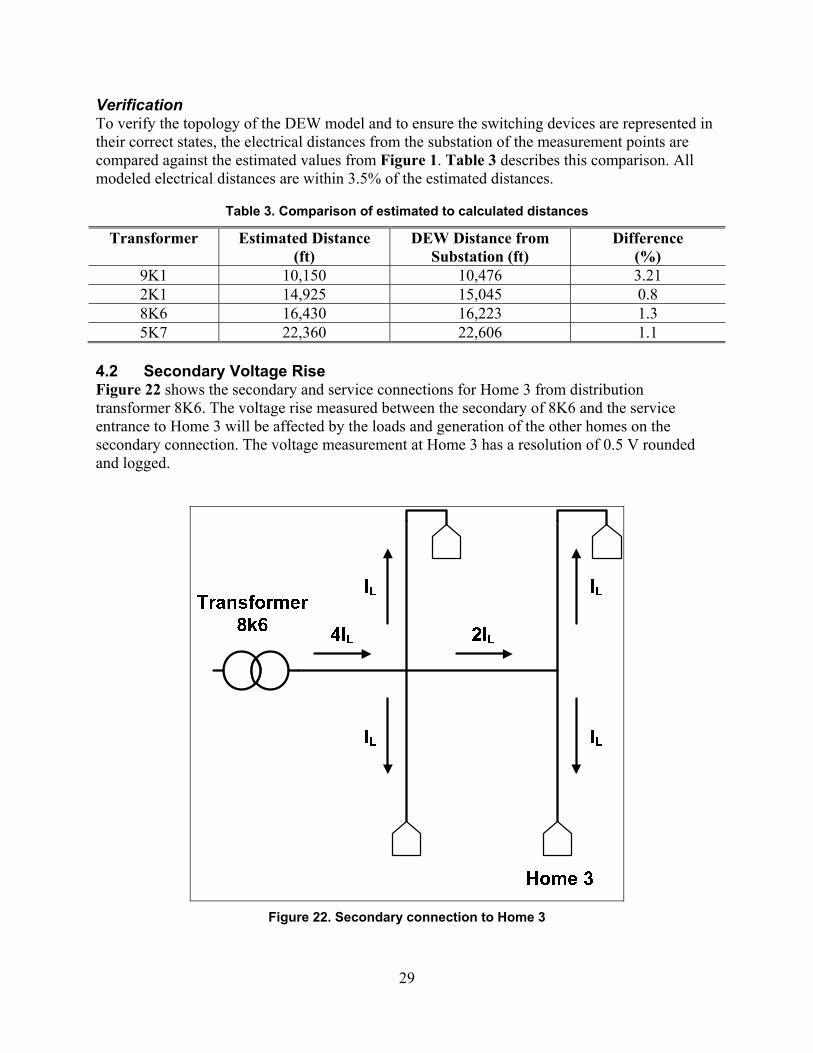
4.2 Secondary Voltage Rise Figure 22 shows the secondary and service connections for Home 3 from distribution transformer 8K6. The voltage rise measured between the secondary of 8K6 and the service entrance to Home 3 will be affected by the loads and generation of the other homes on the secondary connection. The voltage measurement at Home 3 has a resolution of 0.5 V rounded and logged.
Figure 22. Secondary connection to Home 3
29
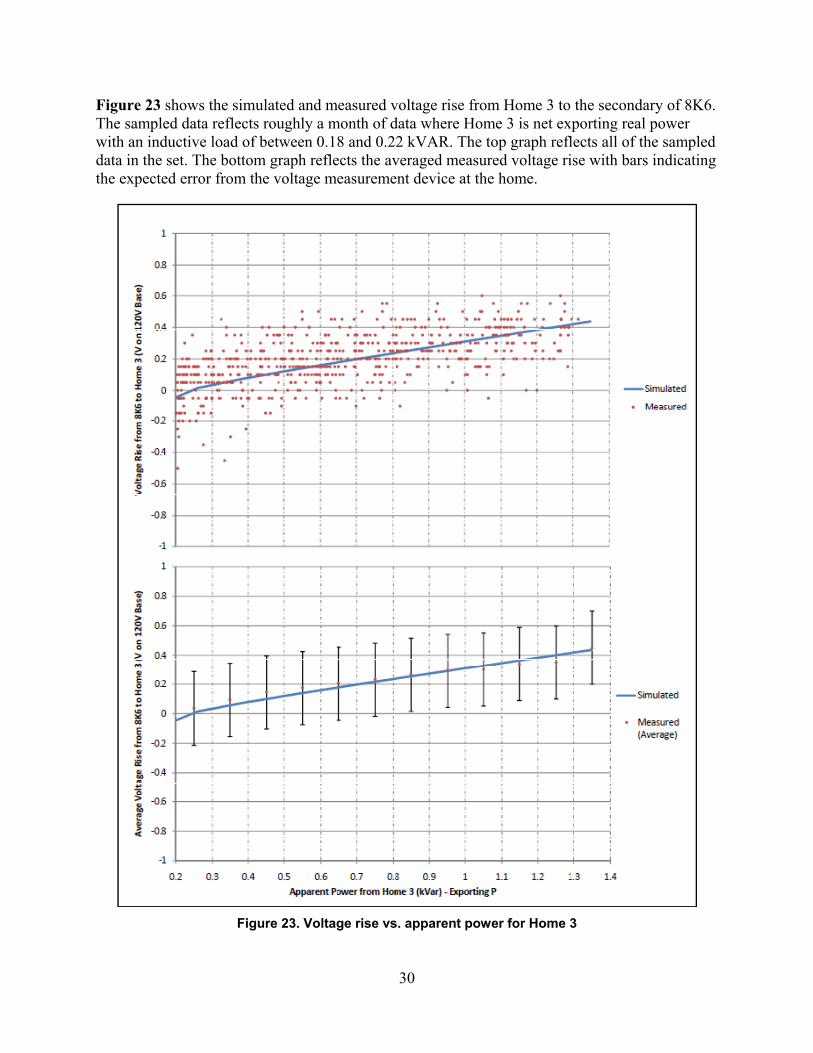
Figure 23 shows the simulated and measured voltage rise from Home 3 to the secondary of 8K6. The sampled data reflects roughly a month of data where Home 3 is net exporting real power with an inductive load of between 0.18 and 0.22 kVAR. The top graph reflects all of the sampled data in the set. The bottom graph reflects the averaged measured voltage rise with bars indicating the expected error from the voltage measurement device at the home.
Figure 23. Voltage rise vs. apparent power for Home 3
30
The secondary system was simulated assuming uniform generation from all customers connected to the secondary of the transformer. The generation from the homes was increased while maintaining a constant inductive load of 0.2 kVAR. The homes were modeled as constant current loads.
The variation in measured-voltage rise data is largely due to uncertainties with the other customers sharing the secondary connection as well as the resolution of the voltage measurement device at the home. The graphs in Figure 23 indicate that the model reasonably reflects the behavior of the actual system to the extent that can be determined given the limitations described above. With improved monitoring and meter accuracy, the model could be better validated and, if necessary, adjusted to more accurately reflect the system.
4.3 Overall System Validation A large number of unknown loads and electrical quantities as well as measurement inconsistencies make it difficult to perform a meaningful whole-system model evaluation at this time. The following is a list of concerns and their impacts on the overall system model validation:
• The voltage at the substation is measured phase-to-phase; however, the distribution transformers are connected phase-to-ground. To establish the measured rise from the substation to the service entrance at the home, the customer and transformer voltages should be compared to the phase-to-ground voltage at the substation. Since the voltages at the substation are imbalanced, the conversion to phase-to-ground from the measured values is not straightforward and will be done programmatically.
• The rendering plant load is not well known. The load has been represented as a spot load based on recorded data of a short period (about a week). Since the rendering plant shares a relatively short feeder path with the system under study (approximately 400 feet according to the model), the impact of this unknown load on voltage regulation is expected to be minor.
• The capacitor control scheme is complex and can change states based on unmonitored inputs from the transmission and sub-transmission level. The capacitors are located on the secondary of the substation transformer, just down from the LTC. As long as the LTC is within operating limits, the impact of capacitor operations on voltage regulation is expected to be minor.
• The polarity of measurement devices was switched during the study period. These data will be identified and programmatically adjusted to be compatible with the rest of the data set.
• The residential loads on the feeder outside of the study group are presently completely unknown. Because they share the same distribution primary as the study system, these loads greatly impact the voltage regulation for the Anatolia subdivision. To remedy this, monitoring equipment will be installed at the entrance of the portion of the feeder under study. Once the equipment is installed, these data points will help validate the model by eliminating a large amount of uncertainty in the measurement set going forward. Additionally, by developing a profile for the unknown portion of the circuit, some uncertainty may be removed from the existing data set.
31
32
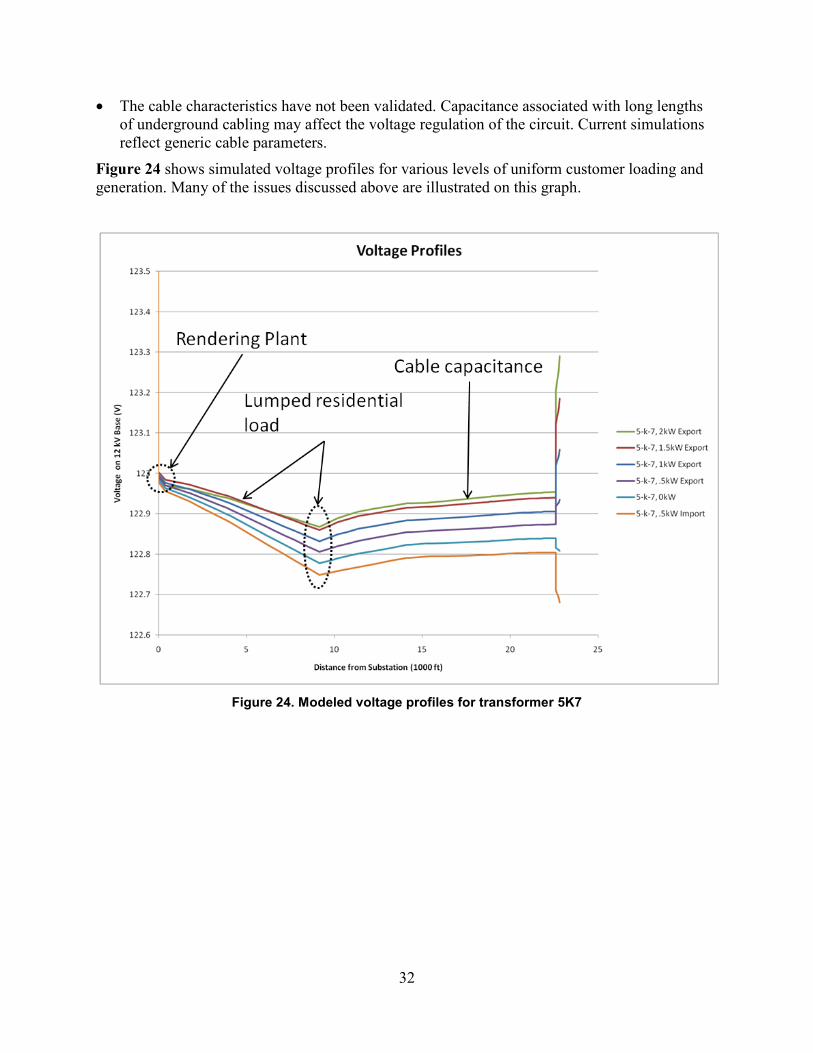
• The cable characteristics have not been validated. Capacitance associated with long lengths of underground cabling may affect the voltage regulation of the circuit. Current simulations reflect generic cable parameters.
Figure 24 shows simulated voltage profiles for various levels of uniform customer loading and generation. Many of the issues discussed above are illustrated on this graph.
Figure 24. Modeled voltage profiles for transformer 5K7
5 Problems Encountered
1. Data-loss problems with the PMI transformer monitors were common especially after periods of high daytime temperatures. The estimated temperature inside the transformer enclosures, where the power-quality monitors are placed, could be 200°F on a 110°F day in full sunlight under heavy electrical load. The manufacturer of the monitors said they are only designed to operate reliably to 131°F; above that temperature, their operation cannot be guaranteed.
2. The PMI meters installed on the homes may not be correctly reading reactive power. Typically in the data the reactive power is shown flowing in the opposite direction as the real power. Since the loads are typically inductive in nature, the reactive power should be flowing toward the loads.
3. The substation SCADA data experienced at least six major data-loss incidents.
4. Anatolia shares Feeder 1201 with a rendering plant, a water storage facility, a couple other residential communities, and agricultural pumps. This complicates efforts to determine the effect of PV on the voltage regulation of the circuit because of the low level of PV penetration.
5. There are two additional feeders (1202 and 1203) that are connected to the substation 20 MVA transformer. The loads on these feeders influence the total loading on the transformer and are typically more than 50% of the total load on the transformer.
6 Findings
1. There was no excessive service or substation voltage due to reverse power flow from exporting PV systems. The current level of penetration of PV on Feeder 1201 is approximately 11% to 13% under lightly-loaded conditions (2 MW) and around 4% of the total substation transformer load. Since the PV penetration levels are relatively low there were no adverse effects on voltage regulation. It was possible to see the effects of the PV systems on the voltage at the individual homes and the distribution transformers. This slight rise was approximately 0.6% on clear days in comparison to the normal drop of 0.3% without the PV exporting.
2. There was no indication that utility voltage transients caused the PV systems to trip off. Further analysis will be conducted to identify if other utility-voltage events will trip off the PV inverters.
3. Passing clouds did not seem to adversely affect the distribution system. At the current penetration levels, the ramps seen in the PV output due to clouds are less than the ramps produced by cycling loads such as air conditioners at the individual homes.
7 Next Steps
The following is a list of items that NREL and SMUD will address as the project continues:
1. Install monitors in distribution transformers that can operate in hot environments without losing data.
33

2. Add monitors at more individual homes.
3. Use monitors with cell-modem communication to automate data collection.
4. Encourage more homeowners with PV systems to connect their inverters to the internet for system data collection so PV inverter operation data may be collected.
5. Isolate power going into Anatolia III Community alone versus that going into other loads on Feeder 1201.
6. Compare the performance of SolarSmart Homes with comparable Title 24-Compliant Homes.
7. Plot expected PV power production based on solar irradiance and ambient temperature.
8. Determine the effect of the PV systems’ output on the substation peak demand.
9. Evaluate additional penetration scenarios using simulation model.
34
35
8 References
[1] Conversation with David Brown, Principal Distribution System Engineer, SMUD Distribution Services. 12/9/08. [2] SunPower literature. www.sunpowercorp.com. September 2007. [3] Photovoltaic Systems. Page 128. American Technical Publishers, Homewood, IL. 2007. [4] Conversation with Daryl Myers, Principal Scientist, NREL Resource Measurements and Forecasting Group. 4/29/09.
F1147-E(10/2008)
REPORT DOCUMENTATION PAGE Form Approved OMB No. 0704-0188
The public reporting burden for this collection of information is estimated to average 1 hour per response, including the time for reviewing instructions, searching existing data sources, gathering and maintaining the data needed, and completing and reviewing the collection of information. Send comments regarding this burden estimate or any other aspect of this collection of information, including suggestions for reducing the burden, to Department of Defense, Executive Services and Communications Directorate (0704-0188). Respondents should be aware that notwithstanding any other provision of law, no person shall be subject to any penalty for failing to comply with a collection of information if it does not display a currently valid OMB control number. PLEASE DO NOT RETURN YOUR FORM TO THE ABOVE ORGANIZATION. 1. REPORT DATE (DD-MM-YYYY)
July 2009 2. REPORT TYPE
Technical Report 3. DATES COVERED (From - To)
4. TITLE AND SUBTITLE
Impact of SolarSmart Subdivisions on SMUD’s Distribution System 5a. CONTRACT NUMBER
DE-AC36-08-GO28308
5b. GRANT NUMBER
5c. PROGRAM ELEMENT NUMBER
6. AUTHOR(S) P. McNutt, J. Hambrick, M. Keesee, and D. Brown
5d. PROJECT NUMBER NREL/TP-550-46093
5e. TASK NUMBER PVD9.1450
5f. WORK UNIT NUMBER
7. PERFORMING ORGANIZATION NAME(S) AND ADDRESS(ES) National Renewable Energy Laboratory 1617 Cole Blvd. Golden, CO 80401-3393
8. PERFORMING ORGANIZATION REPORT NUMBER NREL/TP-550-46093
9. SPONSORING/MONITORING AGENCY NAME(S) AND ADDRESS(ES)
10. SPONSOR/MONITOR'S ACRONYM(S) NREL
11. SPONSORING/MONITORING AGENCY REPORT NUMBER
12. DISTRIBUTION AVAILABILITY STATEMENT National Technical Information Service U.S. Department of Commerce 5285 Port Royal Road Springfield, VA 22161
13. SUPPLEMENTARY NOTES
14. ABSTRACT (Maximum 200 Words) This study analyzes the distribution impacts of high penetrations of grid-integrated renewable energy systems, specifically photovoltaic (PV) equipped SolarSmart Homes found in the Anatolia III Residential Community.
15. SUBJECT TERMS National Renewable Energy Laboratory; NREL; photovoltaic; SolarSmart; Anatolia; distribution; Sacramento Municipal Utility District; SMUD
16. SECURITY CLASSIFICATION OF: 17. LIMITATION OF ABSTRACT
UL
18. NUMBER OF PAGES
19a. NAME OF RESPONSIBLE PERSON a. REPORT
Unclassified b. ABSTRACT Unclassified
c. THIS PAGE Unclassified 19b. TELEPHONE NUMBER (Include area code)
Standard Form 298 (Rev. 8/98) Prescribed by ANSI Std. Z39.18