Embed Size (px)
Citation preview
Impact of Combination of EGR, SCR, and DPFTechnologies for the Low-Emission Rail Diesel Engines
Athanasios G. Konstandopoulos1,2 & Margaritis Kostoglou1,3& Carlo Beatrice4 &
Gabriele Di Blasio4 & Abdurrahman Imren5& Ingemar Denbratt5
Received: 13 June 2015 /Revised: 16 June 2015 /Accepted: 17 June 2015 /Published online: 3 July 2015# Springer SIP, AG 2015
Abstract The EU emission standards for new rail diesel en-gines are becoming more stringent: stage IV emission targetshave just come into effect, while stage V is in under consid-erations. Both exhaust gas recirculation (EGR) and selectivecatalytic reduction (SCR) technologies can be used to reducenitric oxide (NOx) emissions, while the PM emission controlrequires a diesel particulate filter (DPF). The use of SCR re-quires on-board storage of urea, while the use of DPF needs totake into account its impact on engine efficiency performance.Both of these technologies require specific studies when ap-plied to the rail engines; in particular, it becomes necessary toevaluate the engine performance trade-offs in order to evaluatehow these technologies can be utilized efficiently in rail ap-plications in order to meet current and future emission stan-dards. The present study assesses the application of these tech-nologies in diesel railcars on a quantitative basis using one-and three-dimensional numerical simulation tools. In particu-lar, the study considers a 560-kWrailcar enginewith the use ofdifferent technology combinations for NOx reduction: SCR or
EGR + DPF, and EGR + DPF + SCR. The NOx and PMemission performances are evaluated over the C1 homologa-tion cycle and, in the case of the DPF, over an approximatedrailcar driving cycle as well. Several BSNOx targets wereconsidered: 2 g/kWh, 1 g/kWh, and 0.4 g/kWh. Simulationresults indicate that EGR + DPF + SCR-based solution isnecessary to achieve stage IV emission limits for the 560-kW engine. On the other hand, SCR-based solutions havethe potential to go beyond the stage IV NOx limit throughscaling up the size of the SCR device and the on-board ureastorage.
Keyword Particulate emissions . NOx emissions . Exhaustgas recirculation . Selective catalytic reduction . Dieselparticulate filter
NomenclatureABDC After bottom dead centerATDC After top dead centerBBDC Before bottom dead centerBSFC Brake-specific fuel consumptionBSNOx Brake-specific nitrogen oxidesBSUC Brake-specific urea consumptionBTDC Before top dead centerCAC Charge air coolerCA crank angleCB Constant boostCDPF Catalyzed diesel particulate filterCFD Computational fluid dynamicsCL Constant lambdaCO2 Carbon dioxideCpsi Cells per square inchCR Common rail DI direct injectionDIJet Name of commercial combustion model software
* Athanasios G. [email protected]
1 Aerosol and Particle Technology Laboratory (APTL), ChemicalProcess Engineering Research Institute (CPERI), Centre forResearch and Technology Hellas (CERTH), 6th km,Charilaou–Thermi Road, Thermi 57001 Thessaloniki, Greece
2 Department of Chemical Engineering, Aristotle University ofThessaloniki, PO. Box 1517, 54006 Thessaloniki, Greece
3 Department of Chemistry, Aristotle University of Thessaloniki,Univ. Box 116, 54124 Thessaloniki, Greece
4 CNR-IM, Istituto Motori, Via G. Marconi 4, 80125 Naples, Italy5 Applied Mechanics, Chalmers University of Technology,
412 96 Gothenburg, Sweden
Emiss. Control Sci. Technol. (2015) 1:213–225DOI 10.1007/s40825-015-0020-0
DOC Diesel oxidation catalystDPF diesel particulate filterEEA European Environmental AgencyEGR Exhaust gas recirculationEVC Exhaust valve closureEVO Exhaust valve openingHACA Hydrogen abstraction acetylene additionHC Hydrocarbon emissionsHD Heavy dutyHPEGR High-pressure loop EGRHR Heat releaseHRR Heat release rateIP Injection pressureIVC Inlet valve closureIVO Inlet valve openingKH RT Kelvin-Helmholtz/Rayleigh-TaylorLD light dutyMBF Mass burned fractionMFR Mass flow rateNOx Nitric oxidesODE Ordinary differential equationOFA Open frontal area of monolithPback Exhaust backpressurePCCI Premixed charge compression ignitionpfp Peak firing pressurePM Particulate matterPSR Perfectly stirred reactorPaSR Partially stirred reactorRNG Renormalization groupSCR Selective catalytic reductionSOC Soot oxidation catalystSOF Solid organic fraction (fraction of total HC that is
adsorbed on the PM)SOI Start of injectionTC Turbochargervppm Volumetric parts per millionWG Waste gate
1 Introduction
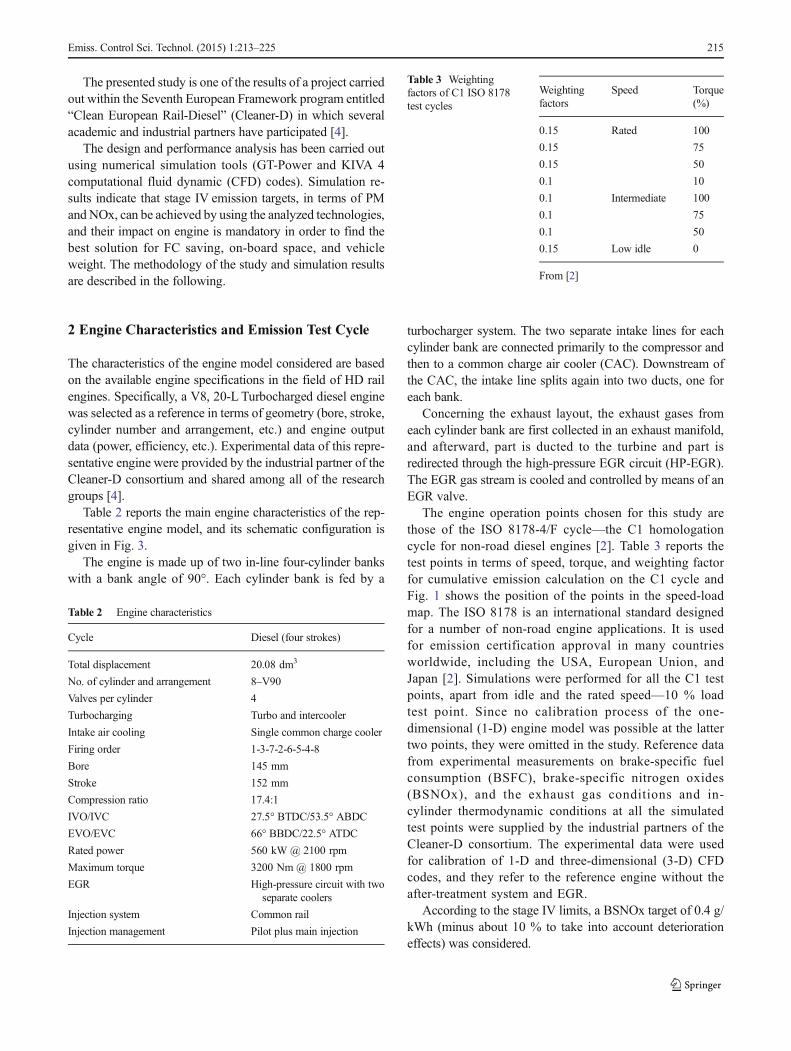
The application of the EU Non-Road Mobile Machinery(NRMM) Directive to rail diesel vehicles, and in particular,the application of the stage IV emission standards, raises sig-nificant challenges in terms of vehicle design, reliability, andlife cycle cost. Simultaneously, a new regulation for railcarsnamed stage V has been proposed. Table 1 shows the emissiontargets for the past, current, and proposed regulations [2].
According to the European Environment Agency (EEA),nitric oxide (NOx) and particulate matter (PM) emissionsfrom the rail sector account for only 1–1.5 % of the totalemissions from all transport sectors [3]. Furthermore, com-pared to the road transport sector, fuel consumption (FC)
and CO2 emissions are lower in the rail sector due to the lowerrolling resistance of rail vehicles and the higher passengerdensities achieved. Therefore, in order to avoid the risk of apartial modal shift from rail transport to a less-sustainable modesuch as road transport, it is necessary to investigate the impactsof the NRMMDirective and stage IVemission limits on the railvehicle design, reliability, and life cycle cost and, among others,to investigate the adaption of state-of-the-art emission controltechnologies in the road sector to diesel railcars.
The use of on-road diesel exhaust after-treatment tech-nologies for heavy-duty (HD) trucks in railcars is a logicalstep, having comparable engine technologies. However,while investigating their impact on engine performanceand emissions, the on-board space requirements have tobe accurately evaluated, as well. In particular, the on-board space saving is one of the main key points for thevehicle designers. Moreover, it would be unreasonable toassume a priori that such technologies could be directlytransferred to higher-power rail diesel applications such asheavy haul locomotives. Therefore, aim of the presentpaper is to address this knowledge gap since no suchstudy related to rail vehicles evaluating the different emis-sion control options exists in the literature.
Specifically, this study aims to investigate the trade-offbetween NOx and PM emissions, on the one hand, and fueland urea consumption, on the other, that is likely to arise fromthe use of exhaust gas recirculation (EGR), diesel particulatefilter (DPF) and selective catalytic reduction (SCR) technolo-gies in diesel railcars. Indeed, the trade-offs regarding PMemissions, FC, and urea consumption need to be addressedfor optimum application of these technologies to railcars.Such technologies have already been deployed successfullyin the field for on-road vehicles and naturally attract the inter-est of the rail industry for potential application [1]. In partic-ular, the present study considers a 560-kW diesel enginefor railcar applications since this application area covershigh-powered railcars (390–650 kW) which representabout 24 % of the installed power in the fleet, most ofwhich is operated in the UK. First, the impacts on emis-sions and FC have been analyzed separately for EGR +DPF and SCR. Then, their combination has been evaluatedwith respect the two separate configurations.
Table 1 Evolution of the emission standards for non-road dieselengines in the power range 130–560 kW
Stage Date Emissions (g/kWh)
CO HC NOx PM PN
IIIB 01.2011 3.5 0.19 2 0.025 –
IV 01.2014 3.5 0.19 0.4 0.025 –
V 2021 3.50 0.19 2.00 0.015 1×10¹²
For stage V, a limit on the particle number (PN) emission is proposed [1]
214 Emiss. Control Sci. Technol. (2015) 1:213–225
The presented study is one of the results of a project carriedout within the Seventh European Framework program entitled“Clean European Rail-Diesel” (Cleaner-D) in which severalacademic and industrial partners have participated [4].
The design and performance analysis has been carried outusing numerical simulation tools (GT-Power and KIVA 4computational fluid dynamic (CFD) codes). Simulation re-sults indicate that stage IV emission targets, in terms of PMandNOx, can be achieved by using the analyzed technologies,and their impact on engine is mandatory in order to find thebest solution for FC saving, on-board space, and vehicleweight. The methodology of the study and simulation resultsare described in the following.
2 Engine Characteristics and Emission Test Cycle
The characteristics of the engine model considered are basedon the available engine specifications in the field of HD railengines. Specifically, a V8, 20-L Turbocharged diesel enginewas selected as a reference in terms of geometry (bore, stroke,cylinder number and arrangement, etc.) and engine outputdata (power, efficiency, etc.). Experimental data of this repre-sentative engine were provided by the industrial partner of theCleaner-D consortium and shared among all of the researchgroups [4].
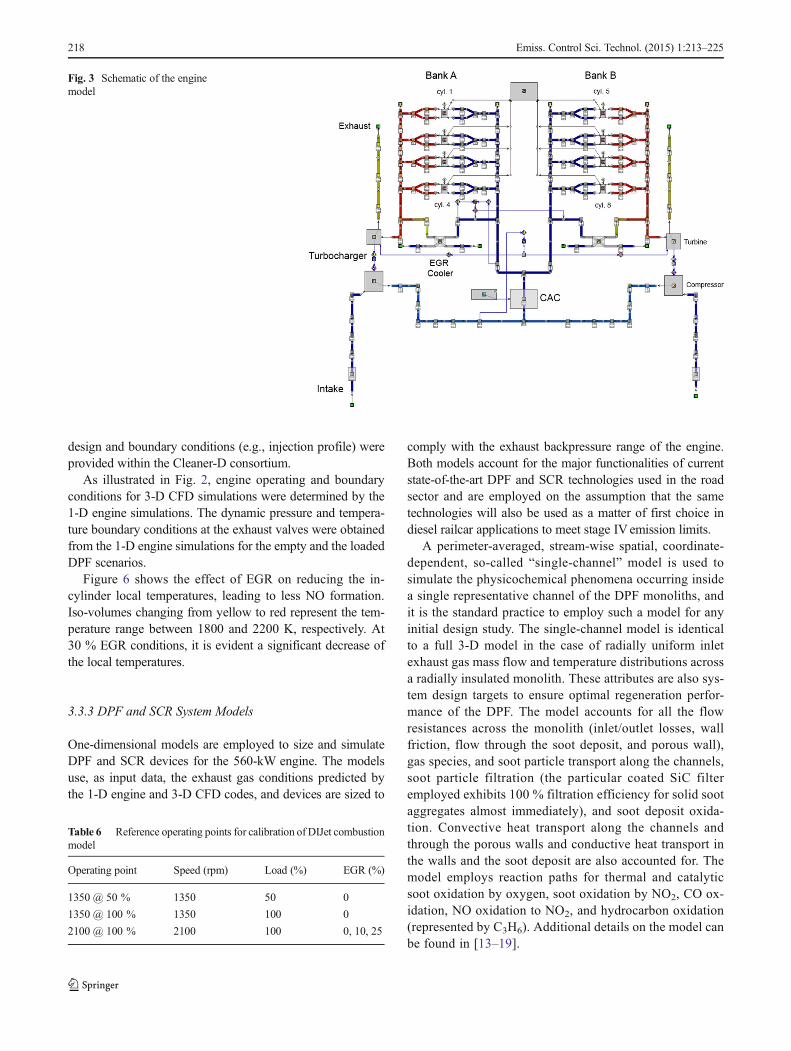
Table 2 reports the main engine characteristics of the rep-resentative engine model, and its schematic configuration isgiven in Fig. 3.
The engine is made up of two in-line four-cylinder bankswith a bank angle of 90°. Each cylinder bank is fed by a
turbocharger system. The two separate intake lines for eachcylinder bank are connected primarily to the compressor andthen to a common charge air cooler (CAC). Downstream ofthe CAC, the intake line splits again into two ducts, one foreach bank.
Concerning the exhaust layout, the exhaust gases fromeach cylinder bank are first collected in an exhaust manifold,and afterward, part is ducted to the turbine and part isredirected through the high-pressure EGR circuit (HP-EGR).The EGR gas stream is cooled and controlled by means of anEGR valve.
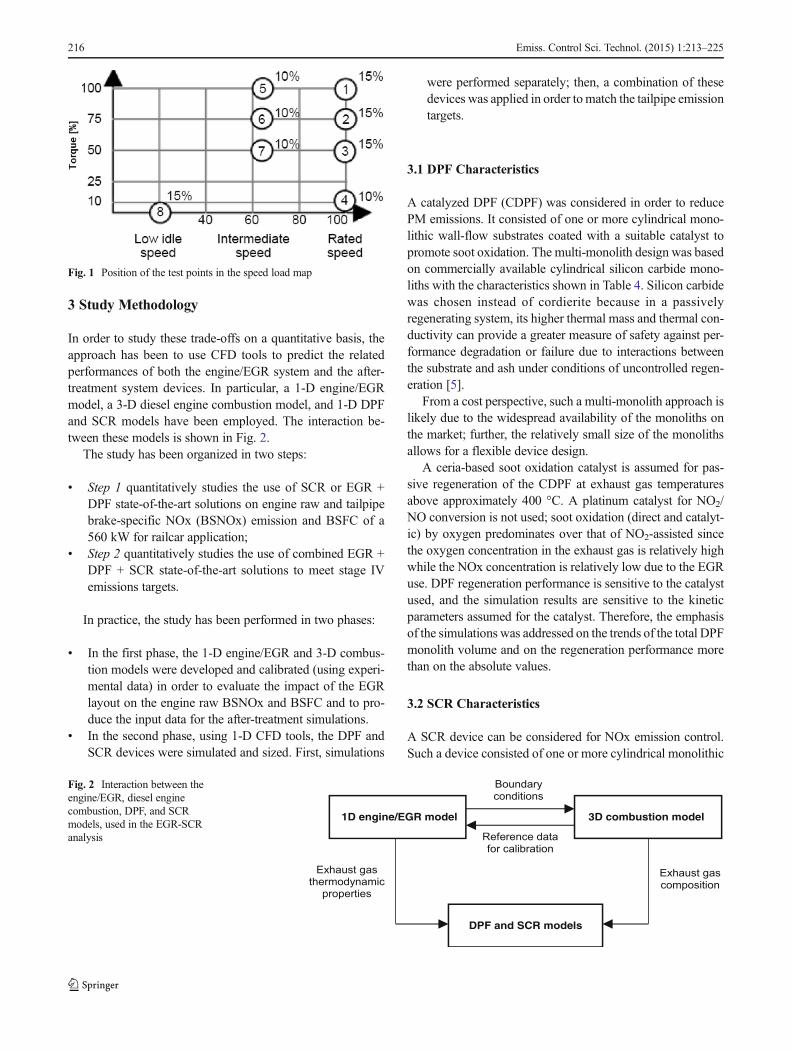
The engine operation points chosen for this study arethose of the ISO 8178-4/F cycle—the C1 homologationcycle for non-road diesel engines [2]. Table 3 reports thetest points in terms of speed, torque, and weighting factorfor cumulative emission calculation on the C1 cycle andFig. 1 shows the position of the points in the speed-loadmap. The ISO 8178 is an international standard designedfor a number of non-road engine applications. It is usedfor emission certification approval in many countriesworldwide, including the USA, European Union, andJapan [2]. Simulations were performed for all the C1 testpoints, apart from idle and the rated speed—10 % loadtest point. Since no calibration process of the one-dimensional (1-D) engine model was possible at the lattertwo points, they were omitted in the study. Reference datafrom experimental measurements on brake-specific fuelconsumption (BSFC), brake-specific nitrogen oxides(BSNOx), and the exhaust gas conditions and in-cylinder thermodynamic conditions at all the simulatedtest points were supplied by the industrial partners of theCleaner-D consortium. The experimental data were usedfor calibration of 1-D and three-dimensional (3-D) CFDcodes, and they refer to the reference engine without theafter-treatment system and EGR.
According to the stage IV limits, a BSNOx target of 0.4 g/kWh (minus about 10 % to take into account deteriorationeffects) was considered.
Table 2 Engine characteristics
Cycle Diesel (four strokes)
Total displacement 20.08 dm3
No. of cylinder and arrangement 8–V90
Valves per cylinder 4
Turbocharging Turbo and intercooler
Intake air cooling Single common charge cooler
Firing order 1-3-7-2-6-5-4-8
Bore 145 mm
Stroke 152 mm
Compression ratio 17.4:1
IVO/IVC 27.5° BTDC/53.5° ABDC
EVO/EVC 66° BBDC/22.5° ATDC
Rated power 560 kW @ 2100 rpm
Maximum torque 3200 Nm @ 1800 rpm
EGR High-pressure circuit with twoseparate coolers
Injection system Common rail
Injection management Pilot plus main injection
Table 3 Weightingfactors of C1 ISO 8178test cycles
Weightingfactors
Speed Torque(%)
0.15 Rated 100
0.15 75
0.15 50
0.1 10
0.1 Intermediate 100
0.1 75
0.1 50
0.15 Low idle 0
From [2]
Emiss. Control Sci. Technol. (2015) 1:213–225 215
3 Study Methodology
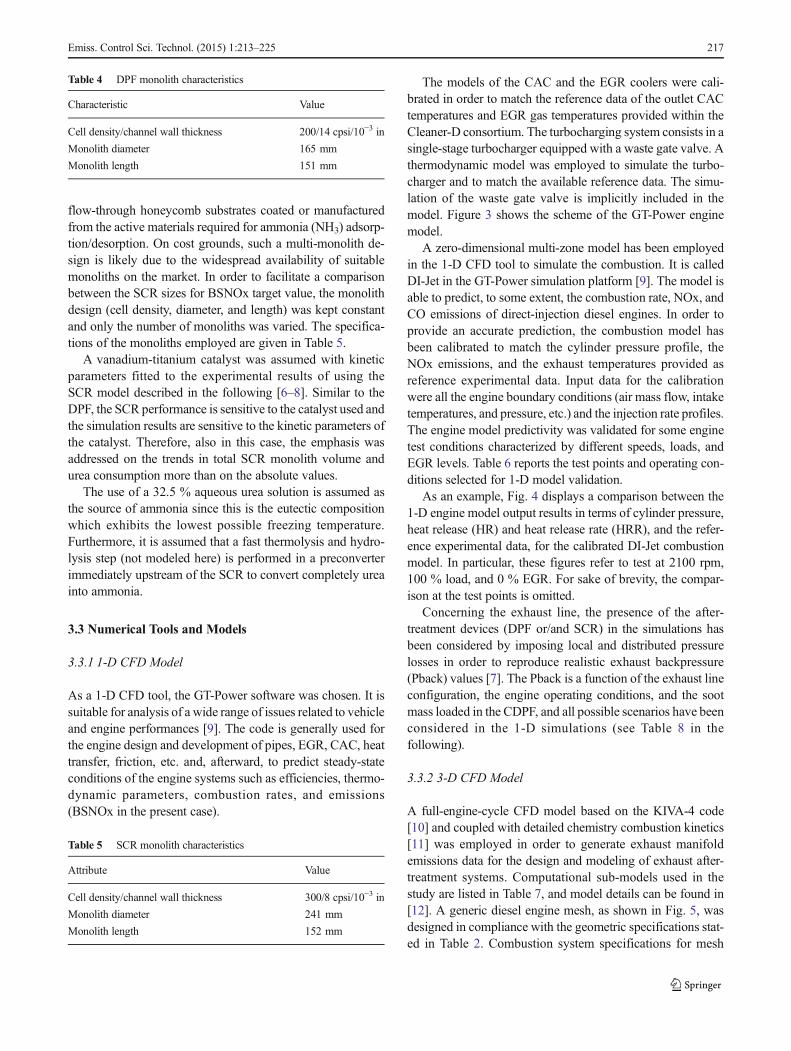
In order to study these trade-offs on a quantitative basis, theapproach has been to use CFD tools to predict the relatedperformances of both the engine/EGR system and the after-treatment system devices. In particular, a 1-D engine/EGRmodel, a 3-D diesel engine combustion model, and 1-D DPFand SCR models have been employed. The interaction be-tween these models is shown in Fig. 2.
The study has been organized in two steps:
& Step 1 quantitatively studies the use of SCR or EGR +DPF state-of-the-art solutions on engine raw and tailpipebrake-specific NOx (BSNOx) emission and BSFC of a560 kW for railcar application;
& Step 2 quantitatively studies the use of combined EGR +DPF + SCR state-of-the-art solutions to meet stage IVemissions targets.
In practice, the study has been performed in two phases:
& In the first phase, the 1-D engine/EGR and 3-D combus-tion models were developed and calibrated (using experi-mental data) in order to evaluate the impact of the EGRlayout on the engine raw BSNOx and BSFC and to pro-duce the input data for the after-treatment simulations.
& In the second phase, using 1-D CFD tools, the DPF andSCR devices were simulated and sized. First, simulations
were performed separately; then, a combination of thesedevices was applied in order tomatch the tailpipe emissiontargets.
3.1 DPF Characteristics
A catalyzed DPF (CDPF) was considered in order to reducePM emissions. It consisted of one or more cylindrical mono-lithic wall-flow substrates coated with a suitable catalyst topromote soot oxidation. The multi-monolith design was basedon commercially available cylindrical silicon carbide mono-liths with the characteristics shown in Table 4. Silicon carbidewas chosen instead of cordierite because in a passivelyregenerating system, its higher thermal mass and thermal con-ductivity can provide a greater measure of safety against per-formance degradation or failure due to interactions betweenthe substrate and ash under conditions of uncontrolled regen-eration [5].
From a cost perspective, such a multi-monolith approach islikely due to the widespread availability of the monoliths onthe market; further, the relatively small size of the monolithsallows for a flexible device design.
A ceria-based soot oxidation catalyst is assumed for pas-sive regeneration of the CDPF at exhaust gas temperaturesabove approximately 400 °C. A platinum catalyst for NO2/NO conversion is not used; soot oxidation (direct and catalyt-ic) by oxygen predominates over that of NO2-assisted sincethe oxygen concentration in the exhaust gas is relatively highwhile the NOx concentration is relatively low due to the EGRuse. DPF regeneration performance is sensitive to the catalystused, and the simulation results are sensitive to the kineticparameters assumed for the catalyst. Therefore, the emphasisof the simulations was addressed on the trends of the total DPFmonolith volume and on the regeneration performance morethan on the absolute values.
3.2 SCR Characteristics
A SCR device can be considered for NOx emission control.Such a device consisted of one or more cylindrical monolithic
Fig. 1 Position of the test points in the speed load map
1D engine/EGR model 3D combustion model
DPF and SCR models
Boundary
conditions
Reference data
for calibration
Exhaust gas
composition
Exhaust gas
thermodynamic
properties
Fig. 2 Interaction between theengine/EGR, diesel enginecombustion, DPF, and SCRmodels, used in the EGR-SCRanalysis
216 Emiss. Control Sci. Technol. (2015) 1:213–225
flow-through honeycomb substrates coated or manufacturedfrom the active materials required for ammonia (NH3) adsorp-tion/desorption. On cost grounds, such a multi-monolith de-sign is likely due to the widespread availability of suitablemonoliths on the market. In order to facilitate a comparisonbetween the SCR sizes for BSNOx target value, the monolithdesign (cell density, diameter, and length) was kept constantand only the number of monoliths was varied. The specifica-tions of the monoliths employed are given in Table 5.
A vanadium-titanium catalyst was assumed with kineticparameters fitted to the experimental results of using theSCR model described in the following [6–8]. Similar to theDPF, the SCR performance is sensitive to the catalyst used andthe simulation results are sensitive to the kinetic parameters ofthe catalyst. Therefore, also in this case, the emphasis wasaddressed on the trends in total SCR monolith volume andurea consumption more than on the absolute values.
The use of a 32.5 % aqueous urea solution is assumed asthe source of ammonia since this is the eutectic compositionwhich exhibits the lowest possible freezing temperature.Furthermore, it is assumed that a fast thermolysis and hydro-lysis step (not modeled here) is performed in a preconverterimmediately upstream of the SCR to convert completely ureainto ammonia.
3.3 Numerical Tools and Models
3.3.1 1-D CFD Model
As a 1-D CFD tool, the GT-Power software was chosen. It issuitable for analysis of a wide range of issues related to vehicleand engine performances [9]. The code is generally used forthe engine design and development of pipes, EGR, CAC, heattransfer, friction, etc. and, afterward, to predict steady-stateconditions of the engine systems such as efficiencies, thermo-dynamic parameters, combustion rates, and emissions(BSNOx in the present case).
The models of the CAC and the EGR coolers were cali-brated in order to match the reference data of the outlet CACtemperatures and EGR gas temperatures provided within theCleaner-D consortium. The turbocharging system consists in asingle-stage turbocharger equipped with a waste gate valve. Athermodynamic model was employed to simulate the turbo-charger and to match the available reference data. The simu-lation of the waste gate valve is implicitly included in themodel. Figure 3 shows the scheme of the GT-Power enginemodel.
A zero-dimensional multi-zone model has been employedin the 1-D CFD tool to simulate the combustion. It is calledDI-Jet in the GT-Power simulation platform [9]. The model isable to predict, to some extent, the combustion rate, NOx, andCO emissions of direct-injection diesel engines. In order toprovide an accurate prediction, the combustion model hasbeen calibrated to match the cylinder pressure profile, theNOx emissions, and the exhaust temperatures provided asreference experimental data. Input data for the calibrationwere all the engine boundary conditions (air mass flow, intaketemperatures, and pressure, etc.) and the injection rate profiles.The engine model predictivity was validated for some enginetest conditions characterized by different speeds, loads, andEGR levels. Table 6 reports the test points and operating con-ditions selected for 1-D model validation.
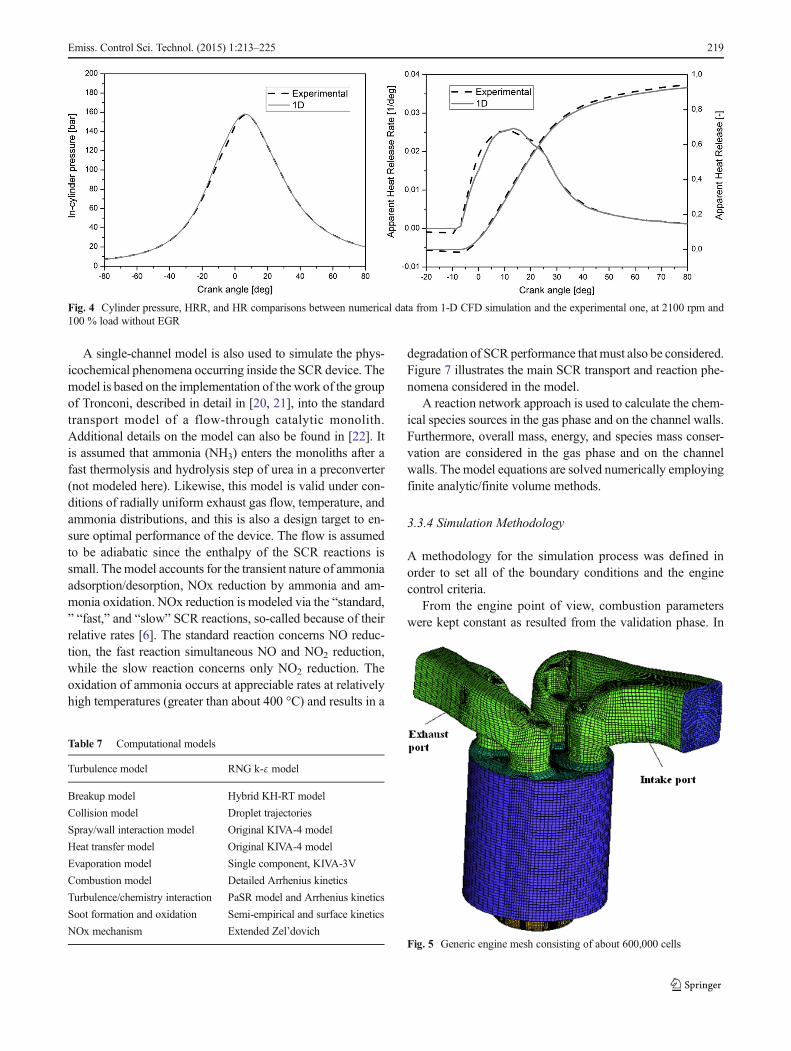
As an example, Fig. 4 displays a comparison between the1-D engine model output results in terms of cylinder pressure,heat release (HR) and heat release rate (HRR), and the refer-ence experimental data, for the calibrated DI-Jet combustionmodel. In particular, these figures refer to test at 2100 rpm,100 % load, and 0 % EGR. For sake of brevity, the compar-ison at the test points is omitted.
Concerning the exhaust line, the presence of the after-treatment devices (DPF or/and SCR) in the simulations hasbeen considered by imposing local and distributed pressurelosses in order to reproduce realistic exhaust backpressure(Pback) values [7]. The Pback is a function of the exhaust lineconfiguration, the engine operating conditions, and the sootmass loaded in the CDPF, and all possible scenarios have beenconsidered in the 1-D simulations (see Table 8 in thefollowing).
3.3.2 3-D CFD Model
A full-engine-cycle CFD model based on the KIVA-4 code[10] and coupled with detailed chemistry combustion kinetics[11] was employed in order to generate exhaust manifoldemissions data for the design and modeling of exhaust after-treatment systems. Computational sub-models used in thestudy are listed in Table 7, and model details can be found in[12]. A generic diesel engine mesh, as shown in Fig. 5, wasdesigned in compliance with the geometric specifications stat-ed in Table 2. Combustion system specifications for mesh
Table 4 DPF monolith characteristics
Characteristic Value
Cell density/channel wall thickness 200/14 cpsi/10−3 in
Monolith diameter 165 mm
Monolith length 151 mm
Table 5 SCR monolith characteristics
Attribute Value
Cell density/channel wall thickness 300/8 cpsi/10−3 in
Monolith diameter 241 mm
Monolith length 152 mm
Emiss. Control Sci. Technol. (2015) 1:213–225 217
design and boundary conditions (e.g., injection profile) wereprovided within the Cleaner-D consortium.
As illustrated in Fig. 2, engine operating and boundaryconditions for 3-D CFD simulations were determined by the1-D engine simulations. The dynamic pressure and tempera-ture boundary conditions at the exhaust valves were obtainedfrom the 1-D engine simulations for the empty and the loadedDPF scenarios.
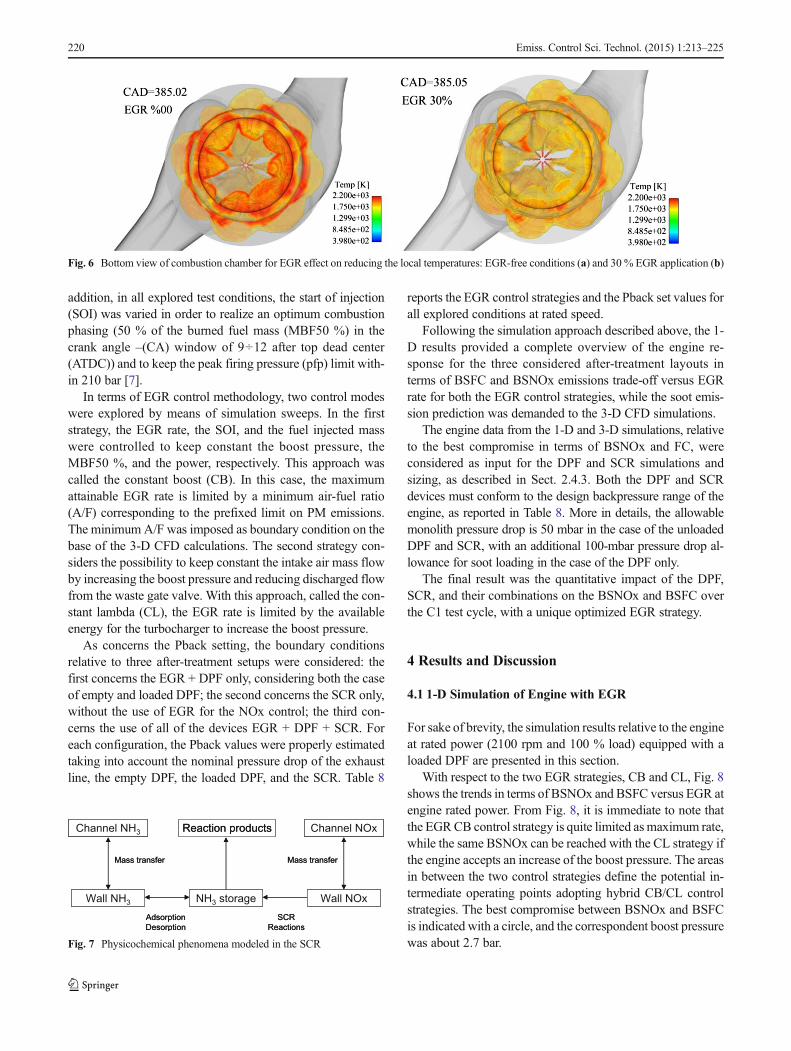
Figure 6 shows the effect of EGR on reducing the in-cylinder local temperatures, leading to less NO formation.Iso-volumes changing from yellow to red represent the tem-perature range between 1800 and 2200 K, respectively. At30 % EGR conditions, it is evident a significant decrease ofthe local temperatures.
3.3.3 DPF and SCR System Models
One-dimensional models are employed to size and simulateDPF and SCR devices for the 560-kW engine. The modelsuse, as input data, the exhaust gas conditions predicted bythe 1-D engine and 3-D CFD codes, and devices are sized to
comply with the exhaust backpressure range of the engine.Both models account for the major functionalities of currentstate-of-the-art DPF and SCR technologies used in the roadsector and are employed on the assumption that the sametechnologies will also be used as a matter of first choice indiesel railcar applications to meet stage IV emission limits.
A perimeter-averaged, stream-wise spatial, coordinate-dependent, so-called “single-channel” model is used tosimulate the physicochemical phenomena occurring insidea single representative channel of the DPF monoliths, andit is the standard practice to employ such a model for anyinitial design study. The single-channel model is identicalto a full 3-D model in the case of radially uniform inletexhaust gas mass flow and temperature distributions acrossa radially insulated monolith. These attributes are also sys-tem design targets to ensure optimal regeneration perfor-mance of the DPF. The model accounts for all the flowresistances across the monolith (inlet/outlet losses, wallfriction, flow through the soot deposit, and porous wall),gas species, and soot particle transport along the channels,soot particle filtration (the particular coated SiC filteremployed exhibits 100 % filtration efficiency for solid sootaggregates almost immediately), and soot deposit oxida-tion. Convective heat transport along the channels andthrough the porous walls and conductive heat transport inthe walls and the soot deposit are also accounted for. Themodel employs reaction paths for thermal and catalyticsoot oxidation by oxygen, soot oxidation by NO2, CO ox-idation, NO oxidation to NO2, and hydrocarbon oxidation(represented by C3H6). Additional details on the model canbe found in [13–19].
Fig. 3 Schematic of the enginemodel
Table 6 Reference operating points for calibration of DIJet combustionmodel
Operating point Speed (rpm) Load (%) EGR (%)
1350 @ 50 % 1350 50 0
1350 @ 100 % 1350 100 0
2100 @ 100 % 2100 100 0, 10, 25
218 Emiss. Control Sci. Technol. (2015) 1:213–225
A single-channel model is also used to simulate the phys-icochemical phenomena occurring inside the SCR device. Themodel is based on the implementation of the work of the groupof Tronconi, described in detail in [20, 21], into the standardtransport model of a flow-through catalytic monolith.Additional details on the model can also be found in [22]. Itis assumed that ammonia (NH3) enters the monoliths after afast thermolysis and hydrolysis step of urea in a preconverter(not modeled here). Likewise, this model is valid under con-ditions of radially uniform exhaust gas flow, temperature, andammonia distributions, and this is also a design target to en-sure optimal performance of the device. The flow is assumedto be adiabatic since the enthalpy of the SCR reactions issmall. Themodel accounts for the transient nature of ammoniaadsorption/desorption, NOx reduction by ammonia and am-monia oxidation. NOx reduction is modeled via the “standard,” “fast,” and “slow” SCR reactions, so-called because of theirrelative rates [6]. The standard reaction concerns NO reduc-tion, the fast reaction simultaneous NO and NO2 reduction,while the slow reaction concerns only NO2 reduction. Theoxidation of ammonia occurs at appreciable rates at relativelyhigh temperatures (greater than about 400 °C) and results in a
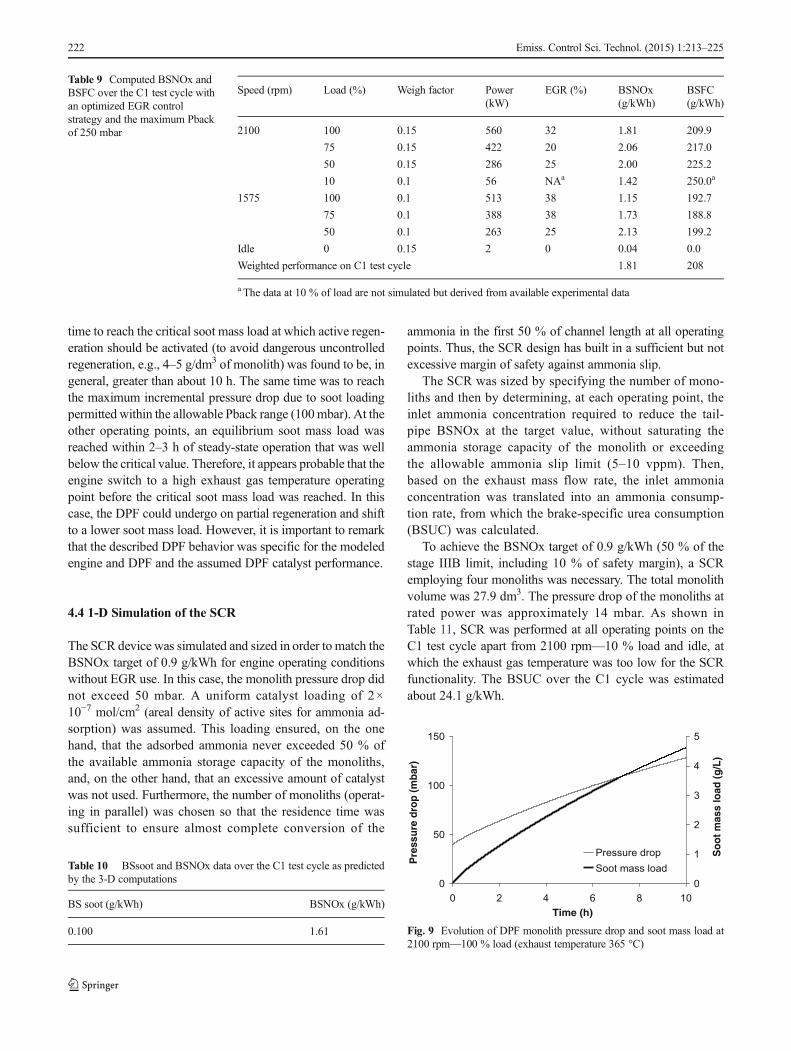
degradation of SCR performance that must also be considered.Figure 7 illustrates the main SCR transport and reaction phe-nomena considered in the model.
A reaction network approach is used to calculate the chem-ical species sources in the gas phase and on the channel walls.Furthermore, overall mass, energy, and species mass conser-vation are considered in the gas phase and on the channelwalls. The model equations are solved numerically employingfinite analytic/finite volume methods.
3.3.4 Simulation Methodology
A methodology for the simulation process was defined inorder to set all of the boundary conditions and the enginecontrol criteria.
From the engine point of view, combustion parameterswere kept constant as resulted from the validation phase. In
Fig. 4 Cylinder pressure, HRR, and HR comparisons between numerical data from 1-D CFD simulation and the experimental one, at 2100 rpm and100 % load without EGR
Table 7 Computational models
Turbulence model RNG k-ε model
Breakup model Hybrid KH-RT model
Collision model Droplet trajectories
Spray/wall interaction model Original KIVA-4 model
Heat transfer model Original KIVA-4 model
Evaporation model Single component, KIVA-3V
Combustion model Detailed Arrhenius kinetics
Turbulence/chemistry interaction PaSR model and Arrhenius kinetics
Soot formation and oxidation Semi-empirical and surface kinetics
NOx mechanism Extended Zel’dovichFig. 5 Generic engine mesh consisting of about 600,000 cells
Emiss. Control Sci. Technol. (2015) 1:213–225 219
addition, in all explored test conditions, the start of injection(SOI) was varied in order to realize an optimum combustionphasing (50 % of the burned fuel mass (MBF50 %) in thecrank angle –(CA) window of 9÷12 after top dead center(ATDC)) and to keep the peak firing pressure (pfp) limit with-in 210 bar [7].
In terms of EGR control methodology, two control modeswere explored by means of simulation sweeps. In the firststrategy, the EGR rate, the SOI, and the fuel injected masswere controlled to keep constant the boost pressure, theMBF50 %, and the power, respectively. This approach wascalled the constant boost (CB). In this case, the maximumattainable EGR rate is limited by a minimum air-fuel ratio(A/F) corresponding to the prefixed limit on PM emissions.The minimum A/F was imposed as boundary condition on thebase of the 3-D CFD calculations. The second strategy con-siders the possibility to keep constant the intake air mass flowby increasing the boost pressure and reducing discharged flowfrom the waste gate valve. With this approach, called the con-stant lambda (CL), the EGR rate is limited by the availableenergy for the turbocharger to increase the boost pressure.
As concerns the Pback setting, the boundary conditionsrelative to three after-treatment setups were considered: thefirst concerns the EGR + DPF only, considering both the caseof empty and loaded DPF; the second concerns the SCR only,without the use of EGR for the NOx control; the third con-cerns the use of all of the devices EGR + DPF + SCR. Foreach configuration, the Pback values were properly estimatedtaking into account the nominal pressure drop of the exhaustline, the empty DPF, the loaded DPF, and the SCR. Table 8
reports the EGR control strategies and the Pback set values forall explored conditions at rated speed.
Following the simulation approach described above, the 1-D results provided a complete overview of the engine re-sponse for the three considered after-treatment layouts interms of BSFC and BSNOx emissions trade-off versus EGRrate for both the EGR control strategies, while the soot emis-sion prediction was demanded to the 3-D CFD simulations.
The engine data from the 1-D and 3-D simulations, relativeto the best compromise in terms of BSNOx and FC, wereconsidered as input for the DPF and SCR simulations andsizing, as described in Sect. 2.4.3. Both the DPF and SCRdevices must conform to the design backpressure range of theengine, as reported in Table 8. More in details, the allowablemonolith pressure drop is 50 mbar in the case of the unloadedDPF and SCR, with an additional 100-mbar pressure drop al-lowance for soot loading in the case of the DPF only.
The final result was the quantitative impact of the DPF,SCR, and their combinations on the BSNOx and BSFC overthe C1 test cycle, with a unique optimized EGR strategy.
4 Results and Discussion
4.1 1-D Simulation of Engine with EGR
For sake of brevity, the simulation results relative to the engineat rated power (2100 rpm and 100 % load) equipped with aloaded DPF are presented in this section.
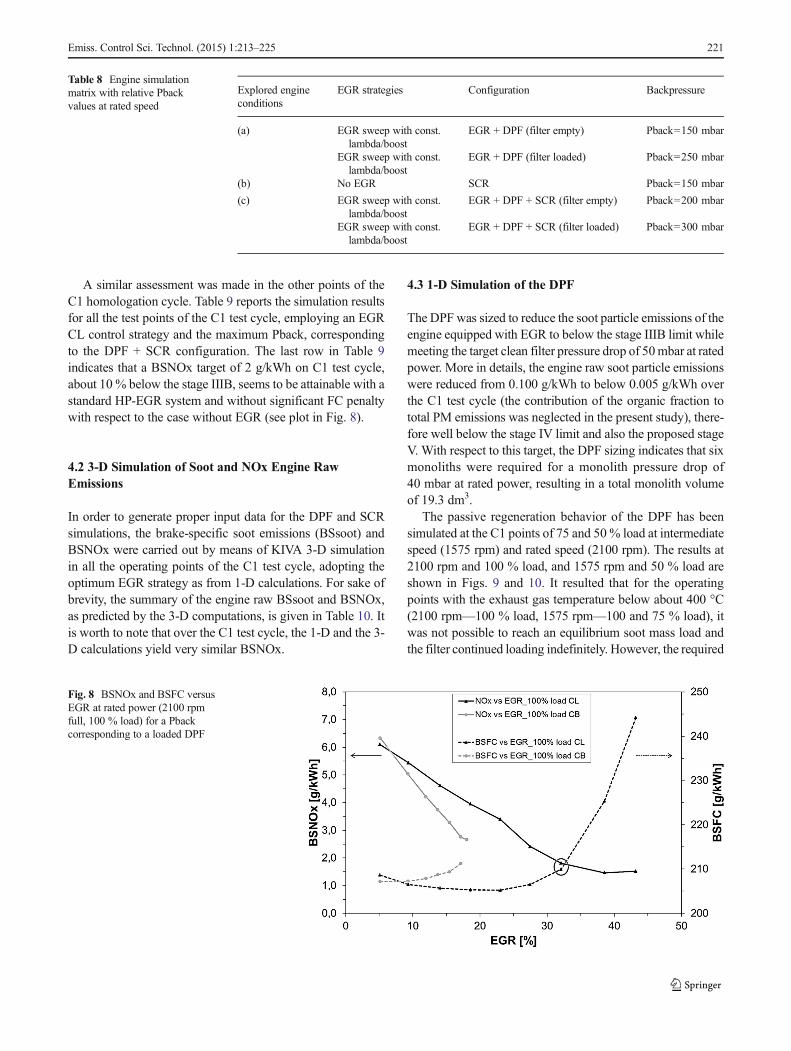
With respect to the two EGR strategies, CB and CL, Fig. 8shows the trends in terms of BSNOx and BSFC versus EGR atengine rated power. From Fig. 8, it is immediate to note thatthe EGRCB control strategy is quite limited asmaximum rate,while the same BSNOx can be reached with the CL strategy ifthe engine accepts an increase of the boost pressure. The areasin between the two control strategies define the potential in-termediate operating points adopting hybrid CB/CL controlstrategies. The best compromise between BSNOx and BSFCis indicated with a circle, and the correspondent boost pressurewas about 2.7 bar.
Fig. 6 Bottom view of combustion chamber for EGR effect on reducing the local temperatures: EGR-free conditions (a) and 30 % EGR application (b)
NH3
storage
Adsorption
Desorption
Channel NH3
Wall NH3
Mass transfer
Wall NOx
Mass transfer
SCR
Reactions
Channel NOxReaction products
NH3
storage
Adsorption
Desorption
Channel NH3
Wall NH3
Mass transfer
Wall NOx
Mass transfer
SCR
Reactions
Channel NOxReaction products
Fig. 7 Physicochemical phenomena modeled in the SCR
220 Emiss. Control Sci. Technol. (2015) 1:213–225
A similar assessment was made in the other points of theC1 homologation cycle. Table 9 reports the simulation resultsfor all the test points of the C1 test cycle, employing an EGRCL control strategy and the maximum Pback, correspondingto the DPF + SCR configuration. The last row in Table 9indicates that a BSNOx target of 2 g/kWh on C1 test cycle,about 10 % below the stage IIIB, seems to be attainable with astandard HP-EGR system and without significant FC penaltywith respect to the case without EGR (see plot in Fig. 8).
4.2 3-D Simulation of Soot and NOx Engine RawEmissions
In order to generate proper input data for the DPF and SCRsimulations, the brake-specific soot emissions (BSsoot) andBSNOx were carried out by means of KIVA 3-D simulationin all the operating points of the C1 test cycle, adopting theoptimum EGR strategy as from 1-D calculations. For sake ofbrevity, the summary of the engine raw BSsoot and BSNOx,as predicted by the 3-D computations, is given in Table 10. Itis worth to note that over the C1 test cycle, the 1-D and the 3-D calculations yield very similar BSNOx.
4.3 1-D Simulation of the DPF
The DPF was sized to reduce the soot particle emissions of theengine equipped with EGR to below the stage IIIB limit whilemeeting the target clean filter pressure drop of 50mbar at ratedpower. More in details, the engine raw soot particle emissionswere reduced from 0.100 g/kWh to below 0.005 g/kWh overthe C1 test cycle (the contribution of the organic fraction tototal PM emissions was neglected in the present study), there-fore well below the stage IV limit and also the proposed stageV. With respect to this target, the DPF sizing indicates that sixmonoliths were required for a monolith pressure drop of40 mbar at rated power, resulting in a total monolith volumeof 19.3 dm3.
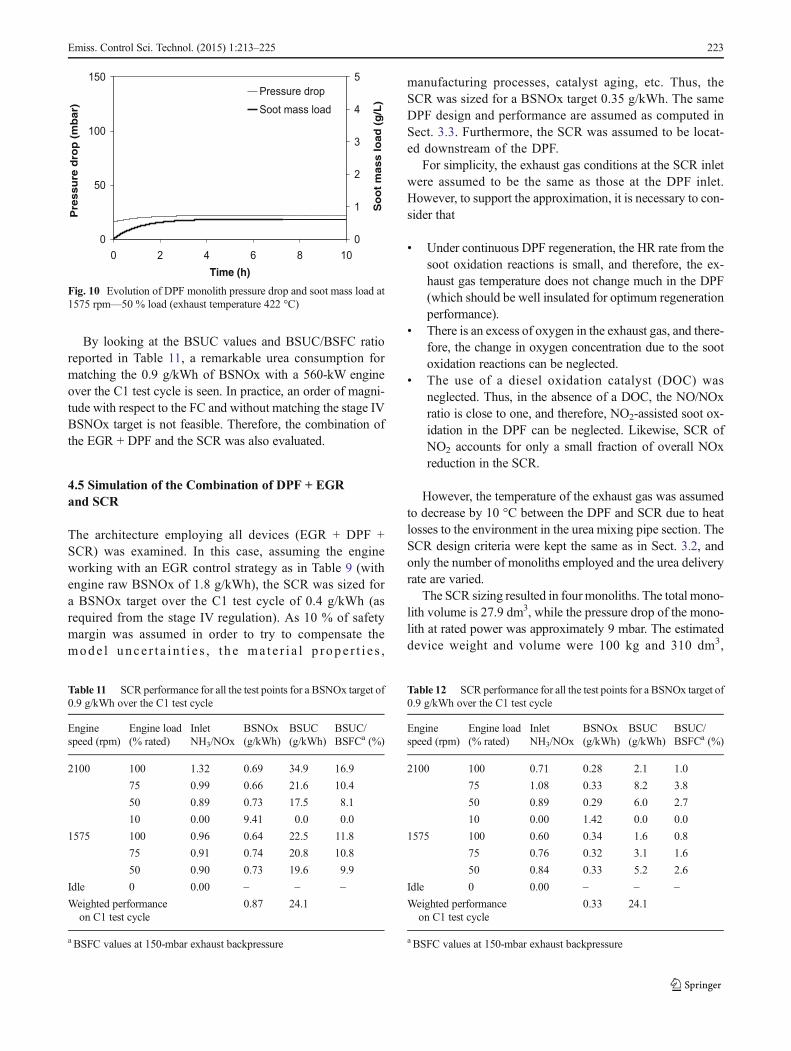
The passive regeneration behavior of the DPF has beensimulated at the C1 points of 75 and 50% load at intermediatespeed (1575 rpm) and rated speed (2100 rpm). The results at2100 rpm and 100 % load, and 1575 rpm and 50 % load areshown in Figs. 9 and 10. It resulted that for the operatingpoints with the exhaust gas temperature below about 400 °C(2100 rpm—100 % load, 1575 rpm—100 and 75 % load), itwas not possible to reach an equilibrium soot mass load andthe filter continued loading indefinitely. However, the required
Table 8 Engine simulationmatrix with relative Pbackvalues at rated speed
Explored engineconditions
EGR strategies Configuration Backpressure
(a) EGR sweep with const.lambda/boost
EGR + DPF (filter empty) Pback=150 mbar
EGR sweep with const.lambda/boost
EGR + DPF (filter loaded) Pback=250 mbar
(b) No EGR SCR Pback=150 mbar
(c) EGR sweep with const.lambda/boost
EGR + DPF + SCR (filter empty) Pback=200 mbar
EGR sweep with const.lambda/boost
EGR + DPF + SCR (filter loaded) Pback=300 mbar
Fig. 8 BSNOx and BSFC versusEGR at rated power (2100 rpmfull, 100 % load) for a Pbackcorresponding to a loaded DPF
Emiss. Control Sci. Technol. (2015) 1:213–225 221
time to reach the critical soot mass load at which active regen-eration should be activated (to avoid dangerous uncontrolledregeneration, e.g., 4–5 g/dm3 of monolith) was found to be, ingeneral, greater than about 10 h. The same time was to reachthe maximum incremental pressure drop due to soot loadingpermitted within the allowable Pback range (100mbar). At theother operating points, an equilibrium soot mass load wasreached within 2–3 h of steady-state operation that was wellbelow the critical value. Therefore, it appears probable that theengine switch to a high exhaust gas temperature operatingpoint before the critical soot mass load was reached. In thiscase, the DPF could undergo on partial regeneration and shiftto a lower soot mass load. However, it is important to remarkthat the described DPF behavior was specific for the modeledengine and DPF and the assumed DPF catalyst performance.
4.4 1-D Simulation of the SCR
The SCR device was simulated and sized in order to match theBSNOx target of 0.9 g/kWh for engine operating conditionswithout EGR use. In this case, the monolith pressure drop didnot exceed 50 mbar. A uniform catalyst loading of 2×10⁻⁷ mol/cm2 (areal density of active sites for ammonia ad-sorption) was assumed. This loading ensured, on the onehand, that the adsorbed ammonia never exceeded 50 % ofthe available ammonia storage capacity of the monoliths,and, on the other hand, that an excessive amount of catalystwas not used. Furthermore, the number of monoliths (operat-ing in parallel) was chosen so that the residence time wassufficient to ensure almost complete conversion of the
ammonia in the first 50 % of channel length at all operatingpoints. Thus, the SCR design has built in a sufficient but notexcessive margin of safety against ammonia slip.
The SCR was sized by specifying the number of mono-liths and then by determining, at each operating point, theinlet ammonia concentration required to reduce the tail-pipe BSNOx at the target value, without saturating theammonia storage capacity of the monolith or exceedingthe allowable ammonia slip limit (5–10 vppm). Then,based on the exhaust mass flow rate, the inlet ammoniaconcentration was translated into an ammonia consump-tion rate, from which the brake-specific urea consumption(BSUC) was calculated.
To achieve the BSNOx target of 0.9 g/kWh (50 % of thestage IIIB limit, including 10 % of safety margin), a SCRemploying four monoliths was necessary. The total monolithvolume was 27.9 dm3. The pressure drop of the monoliths atrated power was approximately 14 mbar. As shown inTable 11, SCR was performed at all operating points on theC1 test cycle apart from 2100 rpm—10 % load and idle, atwhich the exhaust gas temperature was too low for the SCRfunctionality. The BSUC over the C1 cycle was estimatedabout 24.1 g/kWh.
Table 9 Computed BSNOx andBSFC over the C1 test cycle withan optimized EGR controlstrategy and the maximum Pbackof 250 mbar
Speed (rpm) Load (%) Weigh factor Power(kW)
EGR (%) BSNOx(g/kWh)
BSFC(g/kWh)
2100 100 0.15 560 32 1.81 209.9
75 0.15 422 20 2.06 217.0
50 0.15 286 25 2.00 225.2
10 0.1 56 NAa 1.42 250.0a
1575 100 0.1 513 38 1.15 192.7
75 0.1 388 38 1.73 188.8
50 0.1 263 25 2.13 199.2
Idle 0 0.15 2 0 0.04 0.0
Weighted performance on C1 test cycle 1.81 208
a The data at 10 % of load are not simulated but derived from available experimental data
Table 10 BSsoot and BSNOx data over the C1 test cycle as predictedby the 3-D computations
BS soot (g/kWh) BSNOx (g/kWh)
0.100 1.61
0
50
100
150
0 2 4 6 8 10
Time (h)
)rab
m(pord
erusse r
P
0
1
2
3
4
5
So
ot
mas
s lo
ad (
g/L
)
Pressure drop
Soot mass load
Fig. 9 Evolution of DPF monolith pressure drop and soot mass load at2100 rpm—100 % load (exhaust temperature 365 °C)
222 Emiss. Control Sci. Technol. (2015) 1:213–225
By looking at the BSUC values and BSUC/BSFC ratioreported in Table 11, a remarkable urea consumption formatching the 0.9 g/kWh of BSNOx with a 560-kW engineover the C1 test cycle is seen. In practice, an order of magni-tude with respect to the FC and without matching the stage IVBSNOx target is not feasible. Therefore, the combination ofthe EGR + DPF and the SCR was also evaluated.
4.5 Simulation of the Combination of DPF + EGRand SCR
The architecture employing all devices (EGR + DPF +SCR) was examined. In this case, assuming the engineworking with an EGR control strategy as in Table 9 (withengine raw BSNOx of 1.8 g/kWh), the SCR was sized fora BSNOx target over the C1 test cycle of 0.4 g/kWh (asrequired from the stage IV regulation). As 10 % of safetymargin was assumed in order to try to compensate themode l unce r t a i n t i e s , t h e ma t e r i a l p r ope r t i e s ,
manufacturing processes, catalyst aging, etc. Thus, theSCR was sized for a BSNOx target 0.35 g/kWh. The sameDPF design and performance are assumed as computed inSect. 3.3. Furthermore, the SCR was assumed to be locat-ed downstream of the DPF.
For simplicity, the exhaust gas conditions at the SCR inletwere assumed to be the same as those at the DPF inlet.However, to support the approximation, it is necessary to con-sider that
& Under continuous DPF regeneration, the HR rate from thesoot oxidation reactions is small, and therefore, the ex-haust gas temperature does not change much in the DPF(which should be well insulated for optimum regenerationperformance).
& There is an excess of oxygen in the exhaust gas, and there-fore, the change in oxygen concentration due to the sootoxidation reactions can be neglected.
& The use of a diesel oxidation catalyst (DOC) wasneglected. Thus, in the absence of a DOC, the NO/NOxratio is close to one, and therefore, NO2-assisted soot ox-idation in the DPF can be neglected. Likewise, SCR ofNO2 accounts for only a small fraction of overall NOxreduction in the SCR.
However, the temperature of the exhaust gas was assumedto decrease by 10 °C between the DPF and SCR due to heatlosses to the environment in the urea mixing pipe section. TheSCR design criteria were kept the same as in Sect. 3.2, andonly the number of monoliths employed and the urea deliveryrate are varied.
The SCR sizing resulted in fourmonoliths. The total mono-lith volume is 27.9 dm3, while the pressure drop of the mono-lith at rated power was approximately 9 mbar. The estimateddevice weight and volume were 100 kg and 310 dm3,
0
50
100
150
0 2 4 6 8 10
Time (h)
)ra
bm(
por
der
us
ser
P
0
1
2
3
4
5
So
ot
ma
ss
lo
ad
(g
/L)
Pressure drop
Soot mass load
Fig. 10 Evolution of DPF monolith pressure drop and soot mass load at1575 rpm—50 % load (exhaust temperature 422 °C)
Table 11 SCR performance for all the test points for a BSNOx target of0.9 g/kWh over the C1 test cycle
Enginespeed (rpm)
Engine load(% rated)
InletNH3/NOx
BSNOx(g/kWh)
BSUC(g/kWh)
BSUC/BSFCa (%)
2100 100 1.32 0.69 34.9 16.9
75 0.99 0.66 21.6 10.4
50 0.89 0.73 17.5 8.1
10 0.00 9.41 0.0 0.0
1575 100 0.96 0.64 22.5 11.8
75 0.91 0.74 20.8 10.8
50 0.90 0.73 19.6 9.9
Idle 0 0.00 – – –
Weighted performanceon C1 test cycle
0.87 24.1
a BSFC values at 150-mbar exhaust backpressure
Table 12 SCR performance for all the test points for a BSNOx target of0.9 g/kWh over the C1 test cycle
Enginespeed (rpm)
Engine load(% rated)
InletNH3/NOx
BSNOx(g/kWh)
BSUC(g/kWh)
BSUC/BSFCa (%)
2100 100 0.71 0.28 2.1 1.0
75 1.08 0.33 8.2 3.8
50 0.89 0.29 6.0 2.7
10 0.00 1.42 0.0 0.0
1575 100 0.60 0.34 1.6 0.8
75 0.76 0.32 3.1 1.6
50 0.84 0.33 5.2 2.6
Idle 0 0.00 – – –
Weighted performanceon C1 test cycle
0.33 24.1
a BSFC values at 150-mbar exhaust backpressure
Emiss. Control Sci. Technol. (2015) 1:213–225 223
respectively. Simulations were performed at all operatingpoints apart from 2100 rpm—10 % load and idle, where theexhaust temperature is too low for the SCR functionality. Thesimulations indicated that steady-state conditions werereached at all operating points in 1÷2 min after the start ofurea delivering. Furthermore, ammonia slip is predicted not toexceed 1 vppm.
Table 12 reports the simulation results in terms of BSNOxand BSUC over the C1 test cycle. Simulations indicated alsothat a three-monolith design might also be adequate instead ofa four-monolith design, since the pressure drop could furtherincrease without penalty on engine performance. However,with three-monolith design, the design criterion of achievingalmost complete ammonia conversion within the first 50 % ofchannel length could be exceeded at certain operating condi-tions; therefore, a design employing four monoliths appearssuitable for this case study. As observed from Table 12, thestage IV BSNOx limit can be reached with remarkably lowerBSUC. On the contrary, the total volume of the whole after-treatment system and the relative weight is a challenge forvehicle designers.
5 Conclusions
The present study investigated the impact of the use of EGR,DPF, and SCR devices on pollutant emissions, fuel, and ureaconsumption for a 560-kW diesel engine as a railcar applica-tion with respect to the stage IV emission limits and beyond.The study was a part of the work program carried out in theFP7 European Cleaner-D project.
A methodology based on the combined use of 1-D and 3-DCFD tools was specifically developed for the study. Engineand EGR were modeled by means of GT-Power and KIVA 4-V platform in order to provide accurate predictions of theengine raw emissions. Proprietary 1-D models were used forDPF and SCR simulation and sizing. The industrial partners ofthe Cleaner-D project provided an experimental dataset for themodel validation.
The results reveal that the use of the EGR + DPF configu-ration has potential to reach PM emission limits, beyond thestage IV and for the proposed stage V, with an acceptableimpact on FC and engine performance. However, this config-uration could not meet the stage IV BSNOx limits. Achievingdesired NOx levels by using only SCR, assuming that theengine measures are able to control PM emissions, is feasiblefor stage IV BSNOx, but it requires a remarkable on-boardurea storage and consumption: about an order of magnitudewith respect to BSFC. However, with a proper combination ofthe all the considered devices (EGR + DPF + SCR), stage IVtargets can be approached with reasonable impact on fuel andurea consumption. In this last case, the total volume of the
whole after-treatment system and the relative weight becomea challenging task for rail powertrain designers.
Acknowledgments The authors want to thank the European Commis-sion for funding this work through the Clean European Rail-Diesel pro-ject Seventh Framework Programme 7.2.1.1—Sustainable SurfaceTransport
References
1. Johnson, T.: Vehicular emissions in review. SAE Int J Engines 7(3),1207–1227 (2014). doi:10.4271/2014-01-1491
2. www.dieselnet.com3. Environmental Energy Agency report. “Change in emissions by
transport sub-sector for NOX and PM2.5 (EEA—32)”, 2009.http://www.eea.europa.eu/data-and-maps/figures/change-in-emissions-by-transport
4. www.cleaner-d.eu5. Merkel, G.A., Cutler, W.A., Warren, C.J.: “Thermal Durability of
Wall-Flow Ceramic Diesel Particulate Filters”, SAE Tech. Paper,2001–01–0190
6. Koebel, M., Madia, G., Elsener, M.: Selective catalytic reduction ofNO and NO2 at low temperatures”. Catal Today 73, 239–247(2002)
7. Beatrice, C., Rispoli, N., Di Blasio, G., Patrianakos, G. et al.:“Emission Reduction Technologies for the Future Low EmissionRail Diesel Engines: EGR vs SCR,” SAE Technical Paper 2013–24–0087, 2013, doi:10.4271/2013-24-0087
8. Winkler, C., Florchinger, P., Patil, M.D., Gieshoff, J., Spurk, P.,Pfeifer, M.: “Modeling of SCR DeNOx Catalyst—Looking at theImpact of Substrate Attributes”, SAE Tech. Paper, 2003–01–0845.
9. https://www.gtisoft.com/10. Torres, D.J., Trujillo, M.F.: KIVA-4: an unstructured ALE code for
compressible gas flow with sprays. J Comput Phys 219, 943–975(2006)
11. Golovitchev, VI., Nordin, N., Jarnicki, R., Chomiak, J.: 3D dieselspray simulation using a new detailed chemistry turbulent combus-tion model. SAE Tech. Paper, 2000–01–1891.
12. Imren, A., Soruşbay, C., Golovitchev, V.I. and Valentino, G.: ‘TheFull Cycle HD Diesel Engine Simulations Using KIVA-4 Code’,SAE Tech. Paper, 2010–01–2234.
13. Konstandopoulos, A.G., Johnson, J.H.: “Wall-Flow DieselParticulate Filters—Their Pressure Drop and CollectionEfficiency”, SAE Tech. Paper, 890405.
14. Konstandopoulos, A.G., Kostoglou, M.: Reciprocating flowregeneration of soot filters. Combust Flame 121, 488–500(2000)
15. Konstandopoulos, A.G., Kostoglou, M., Skaperdas, E.,Papaioannou, E., Zarvalis, D., Kladopoulou, E.: “FundamentalStudies of Diesel Particulate Filters: Transient Loading,Regeneration and Aging”, SAE Tech. Paper, 2000–01–1016.
16. Kostoglou, M., Housiada, P., Konstandopoulos, A.G.: Multi-channel simulation of regeneration in honeycomb monolithicdiesel particulate filters. Chem Eng Sci 58, 3273–3283(2003)
17. Konstandopoulos, A.G., Kostoglou,M., Vlachos, N., Kladopoulou,E.: “Progress in Diesel Particulate Filter Simulation”, SAE Tech.Paper, 2005–01–0946.
18. Konstandopoulos, A.G., Kostoglou, M., Lorentzou, S.: “Wall-ScaleReaction Models in Diesel Particulate Filters”, SAE Tech. Paper,2007–01–1130.
19. Konstandopoulos, A.G., Kostoglou, M., Lorentzou, S.,Pagkoura, C., Papaioannou, E., Ohno, K., Ogyu, K., Oya, T.:
224 Emiss. Control Sci. Technol. (2015) 1:213–225
“Soot Oxidation Kinetics in Diesel Particulate Filters”, SAETech. Paper, 2007–01–1129.
20. Lietti, L., Nova, I., Tronconi, E., Forzatti, P.: Transient kineticstudy of the SCR-DeNOx reaction. Catal Today 45, 85–92(1998)
21. Troconi, E., Cavanna, A., Forzatti, P.: Unsteady analysis ofNO reduction over selective catalytic reduction—DeNOx
monolith catalysts. Ind Eng Chem Res 37, 2341–2349(1998)
22. Dubien, C., Schweich, D., Mabilon, G., Martin, B., Prigent, M.:Three-way catalytic converter modeling: fast- and slow-oxidizinghydrocarbons, inhibiting species, and steam-reforming reaction.Chem Eng Sci 53(3), 471–481 (1998)
Emiss. Control Sci. Technol. (2015) 1:213–225 225