Embed Size (px)
Citation preview

Low Emissions Potential ofEGR-SCR-DPF and Advanced Fuel Formulations-A Progress Report
Low Emissions Potential ofEGR-SCR-DPF and Advanced Fuel Formulations-A Progress Report
Department of Emissions ResearchAutomotive Products and Emissions
Research DivisionAugust 2003
Department of Emissions ResearchAutomotive Products and Emissions
Research DivisionAugust 2003
Southwest Research InstituteTM
Southwest Research InstituteTM
RR
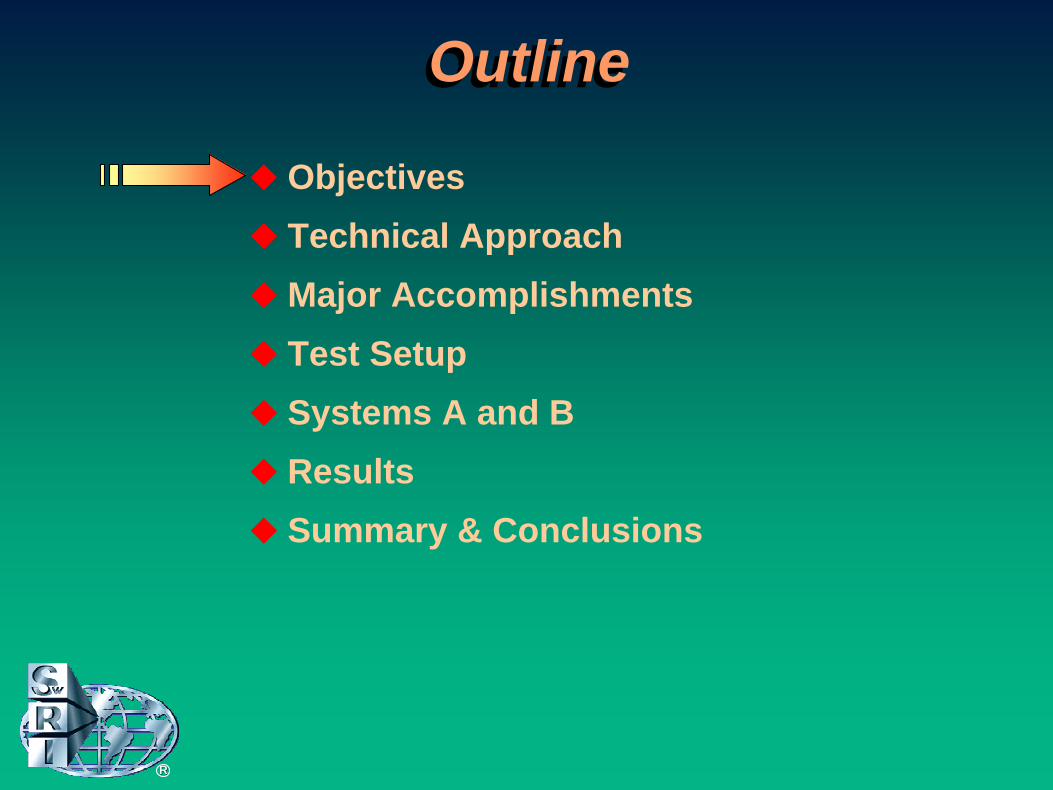
OutlineOutline
ObjectivesTechnical Approach Major AccomplishmentsTest Setup Systems A and BResultsSummary & Conclusions
RR
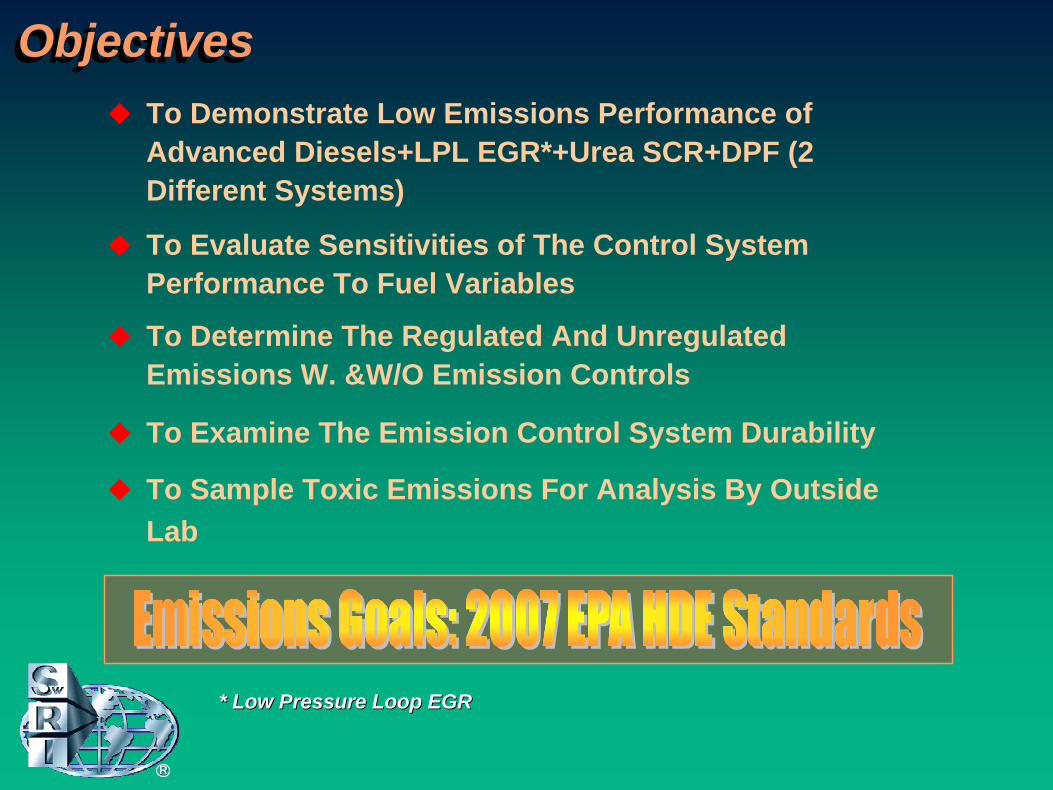
To Evaluate Sensitivities of The Control System Performance To Fuel Variables
To Determine The Regulated And Unregulated Emissions W. &W/O Emission Controls
To Examine The Emission Control System Durability
To Sample Toxic Emissions For Analysis By Outside Lab
RR
ObjectivesObjectives
* Low Pressure Loop EGR* Low Pressure Loop EGR
To Demonstrate Low Emissions Performance of Advanced Diesels+LPL EGR*+Urea SCR+DPF (2 Different Systems)
OutlineOutline
RR
ObjectivesTechnical Approach Major AccomplishmentsTest Setup Systems A and BResultsSummary & Conclusions

Technical Approach--Development (φ 1)Technical Approach--Development (φ 1)
CorrelationCorrelation Characterization Characterization
EngineEngineBaselineBaseline4.0 NO4.0 NOxx
2D Fuel2D Fuel500 ppm500 ppm
SwRISwRICaterpillarCaterpillar
2D Fuel2D FuelDECSE 3DECSE 3
SteadySteady--StateState+Transient+Transient
DesignDesign DevelopmentDevelopment
EGREGRand Controland Control
2.0 NO2.0 NOxx
PartsPartsProcurementProcurement
FabricationFabrication Engine Engine InstallationInstallation
Test & Test & ControlControl
CBCB--DPFDPFAdaptationAdaptation
DesignDesign DevelopmentDevelopment
TotalTotalSystemSystem
IntegrationIntegration
EGR EGR OptimizedOptimized
UreaUreaInjectionInjection
Engine Engine InstallationInstallation
Test & Test & ControlControl
3 Fuels3 Fuels Test ProtocolTest Protocol
DECSE3 + 8, 15,DECSE3 + 8, 15,30 30 ppmppm & BP15& BP15
[10[10--100100--200]200]--Hrs.Hrs.
C+3HsC+3Hs 2 OICAs2 OICAs
2007 System2007 SystemCharacterization Characterization
RR
RR
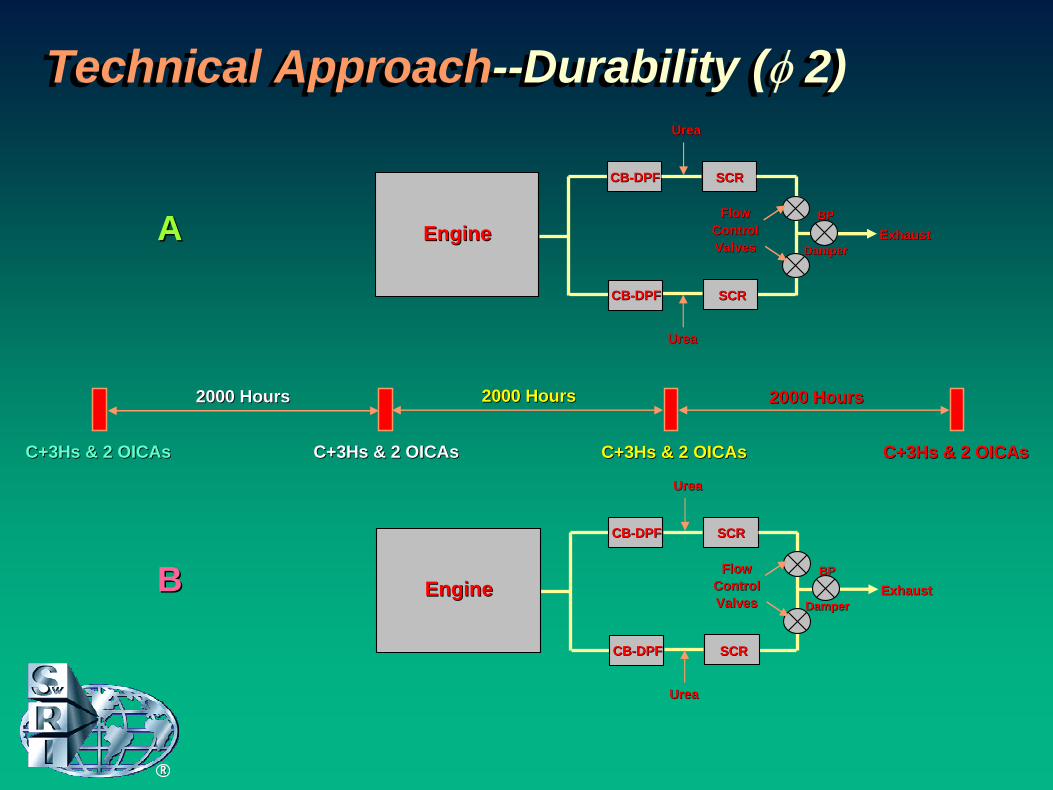
Technical Approach--Durability (φ 2)Technical Approach--Durability (φ 2)
2000 Hours2000 Hours 2000 Hours2000 Hours 2000 Hours2000 Hours
C+3Hs & 2 OICAsC+3Hs & 2 OICAsC+3Hs & 2 OICAsC+3Hs & 2 OICAs C+3Hs & 2 OICAsC+3Hs & 2 OICAs C+3Hs & 2 OICAsC+3Hs & 2 OICAs
EngineEngine
CBCB--DPFDPF SCRSCR
CBCB--DPFDPF SCRSCR
UreaUrea
UreaUrea
FlowFlowControlControlValvesValves
BPBP
DamperDamperExhaustExhaustAA
EngineEngine
CBCB--DPFDPF SCRSCR
CBCB--DPFDPF SCRSCR
UreaUrea
UreaUrea
FlowFlowControlControlValvesValves
BPBP
DamperDamperExhaustExhaustBB
OutlineOutline
RR
ObjectivesTechnical Approach Major AccomplishmentsTest Setup Systems A and BResultsSummary & Conclusions
RR
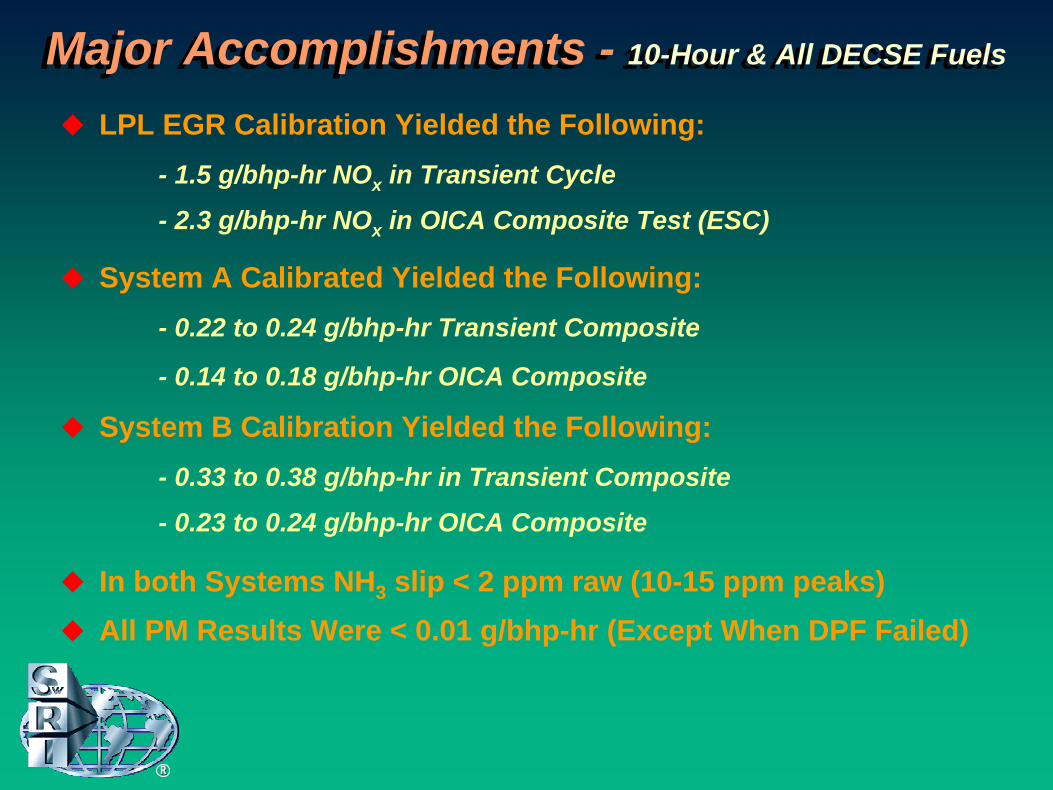
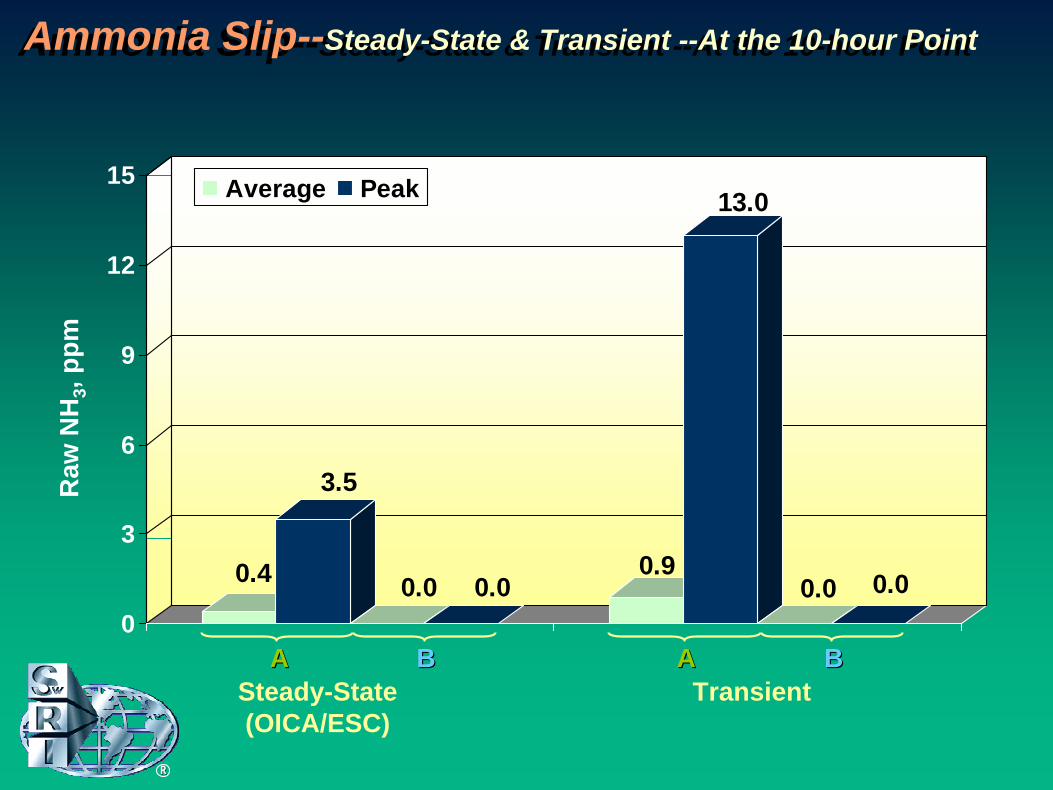
In both Systems NH3 slip < 2 ppm raw (10-15 ppm peaks) All PM Results Were < 0.01 g/bhp-hr (Except When DPF Failed)
Major Accomplishments - 10-Hour & All DECSE FuelsMajor Accomplishments - 10-Hour & All DECSE Fuels
LPL EGR Calibration Yielded the Following:- 1.5 g/bhp-hr NOx in Transient Cycle
- 2.3 g/bhp-hr NOx in OICA Composite Test (ESC)
System A Calibrated Yielded the Following:- 0.22 to 0.24 g/bhp-hr Transient Composite
- 0.14 to 0.18 g/bhp-hr OICA Composite
System B Calibration Yielded the Following:- 0.33 to 0.38 g/bhp-hr in Transient Composite
- 0.23 to 0.24 g/bhp-hr OICA Composite
OutlineOutline
RR
ObjectivesTechnical Approach Major AccomplishmentsTest Setup Systems A and BResultsSummary & Conclusions
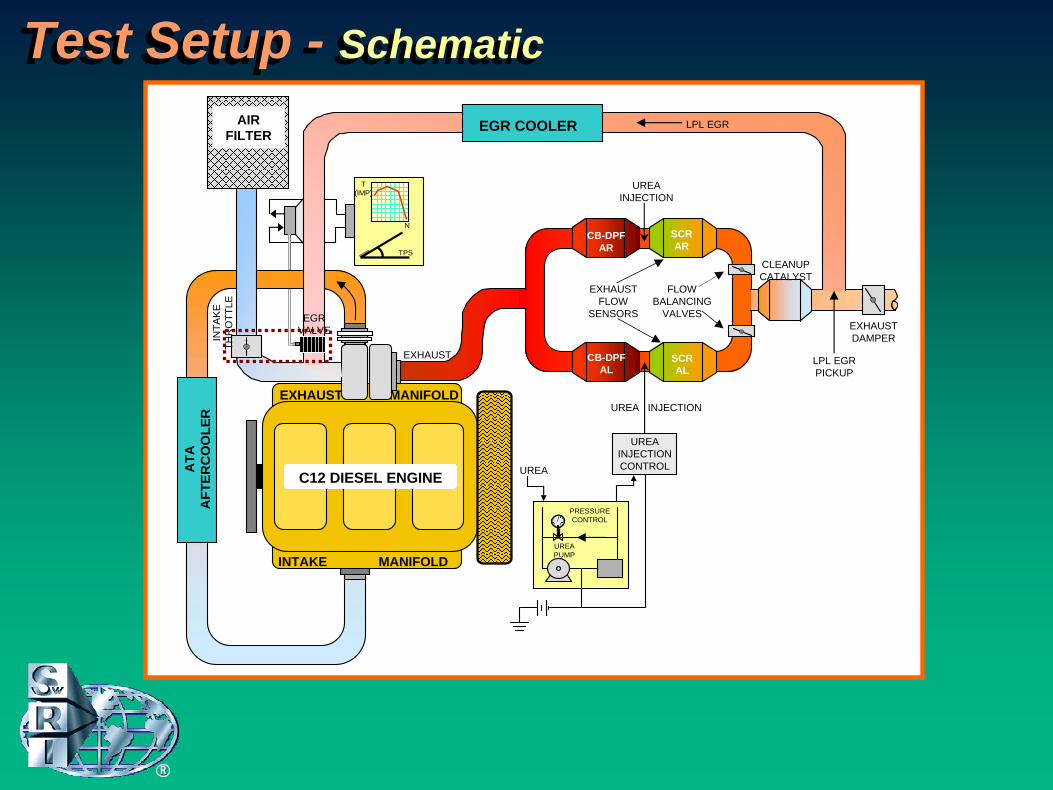
Test Setup - SchematicTest Setup - Schematic
INTAKE MANIFOLD
MANIFOLD
ATA
A
FTER
CO
OLE
R
C12 DIESEL ENGINE
EXHAUST
AIR FILTER
FLOW BALANCING
VALVES
EXHAUST
EXHAUST FLOW
SENSORS
CB-DPF AR
CB-DPF AL
SCR AL
SCR AR
UREA INJECTION
UREA INJECTION
EXHAUST DAMPER
CLEANUP CATALYST
LPL EGR PICKUP
INTA
KE
THR
OTT
LE
T (IMP)
N
TPS
PRESSURE CONTROL
UREA PUMP
UREA INJECTION CONTROLUREA
EGR COOLER
EGR VALVE
LPL EGR
RR
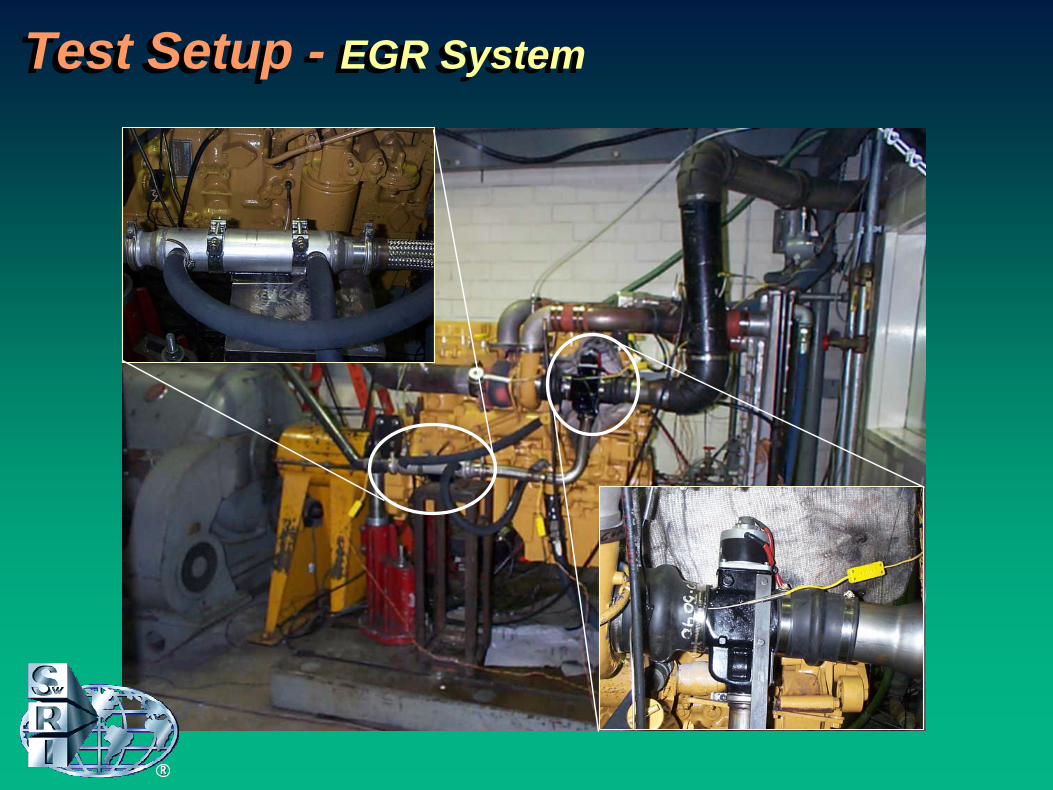
Test Setup - EGR SystemTest Setup - EGR System
RR
OutlineOutline
RR
ObjectivesTechnical Approach Major AccomplishmentsTest Setup Systems A and BResultsSummary & Conclusions
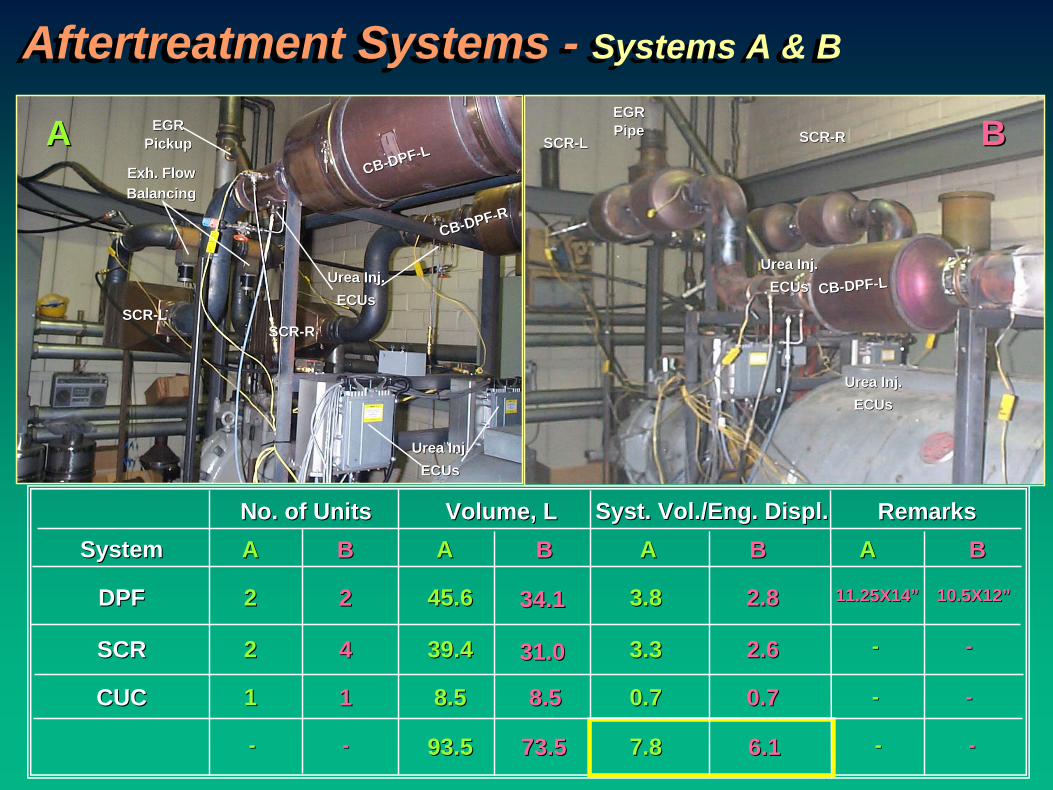
Aftertreatment Systems - Systems A & BAftertreatment Systems - Systems A & B
CBCB--DPFDPF--LL
CBCB--DPFDPF--RR
SCRSCR--LLSCRSCR--RR
ExhExh. Flow. FlowBalancingBalancing
Urea Urea InjInj..ECUsECUs
Urea Urea InjInj..ECUsECUs
EGREGRPickupPickupAA
CBCB--DPFDPF--LL
SCRSCR--LL
Urea Urea InjInj..ECUsECUs
Urea Urea InjInj..ECUsECUs
EGREGRPipePipe SCRSCR--RR BB
No. of UnitsNo. of Units Volume, LVolume, L SystSyst. Vol./Eng. . Vol./Eng. DisplDispl..
DPFDPF
SCRSCR
CUCCUC
SystemSystem
22
22
11
AA
45.645.6
39.439.4
8.58.5
93.593.5
3.83.8
3.33.3
0.70.7
7.87.8
22
44
11
BB AA BB AA BBRemarksRemarks
AA BB
34.134.1
31.031.0
8.58.5
73.573.5
2.82.8
2.62.6
0.70.7
6.16.1
10.5X1210.5X12””11.25X1411.25X14””
-- --
-- ---- --
-- --

OutlineOutline
RR
ObjectivesTechnical Approach Major AccomplishmentsTest Setup Systems A and BResultsSummary & Conclusions

0.00 0.02 0.010.29
2.32
4.63
0.005 0.0260.342 0.328
0.0
0.5
1.0
1.5
2.0
2.5
3.0
3.5
4.0
4.5
5.0
g/bh
p-hr
BSHC BSCO BSNOx BSPM BSFC
W. EGR As-Received
Steady-State Emissions Comparison--As-Received Vs. W.EGR*--DECSE 3ppm FuelSteady-State Emissions Comparison--As-Received Vs. W.EGR*--DECSE 3ppm FuelFuel
EGR* : Low Pressure Loop EGR With CBEGR* : Low Pressure Loop EGR With CB--DPFDPFRR
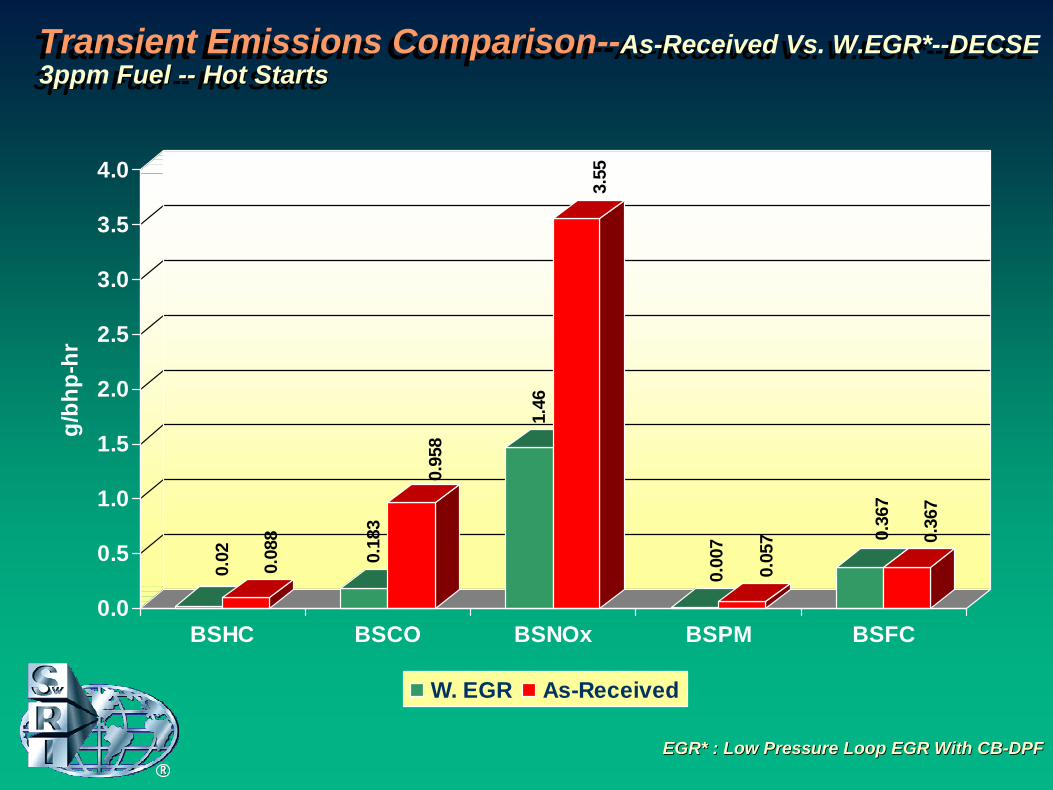
0.02 0.08
8
0.18
3
0.95
8
1.46
3.55
0.00
7
0.05
7 0.36
7
0.36
7
0.0
0.5
1.0
1.5
2.0
2.5
3.0
3.5
4.0
g/bh
p-hr
BSHC BSCO BSNOx BSPM BSFC
W. EGR As-Received
RREGR* : Low Pressure Loop EGR With CBEGR* : Low Pressure Loop EGR With CB--DPFDPF
Transient Emissions Comparison--As-Received Vs. W.EGR*--DECSE 3ppm Fuel -- Hot StartsTransient Emissions Comparison--As-Received Vs. W.EGR*--DECSE 3ppm Fuel Fuel ---- Hot StartsHot Starts
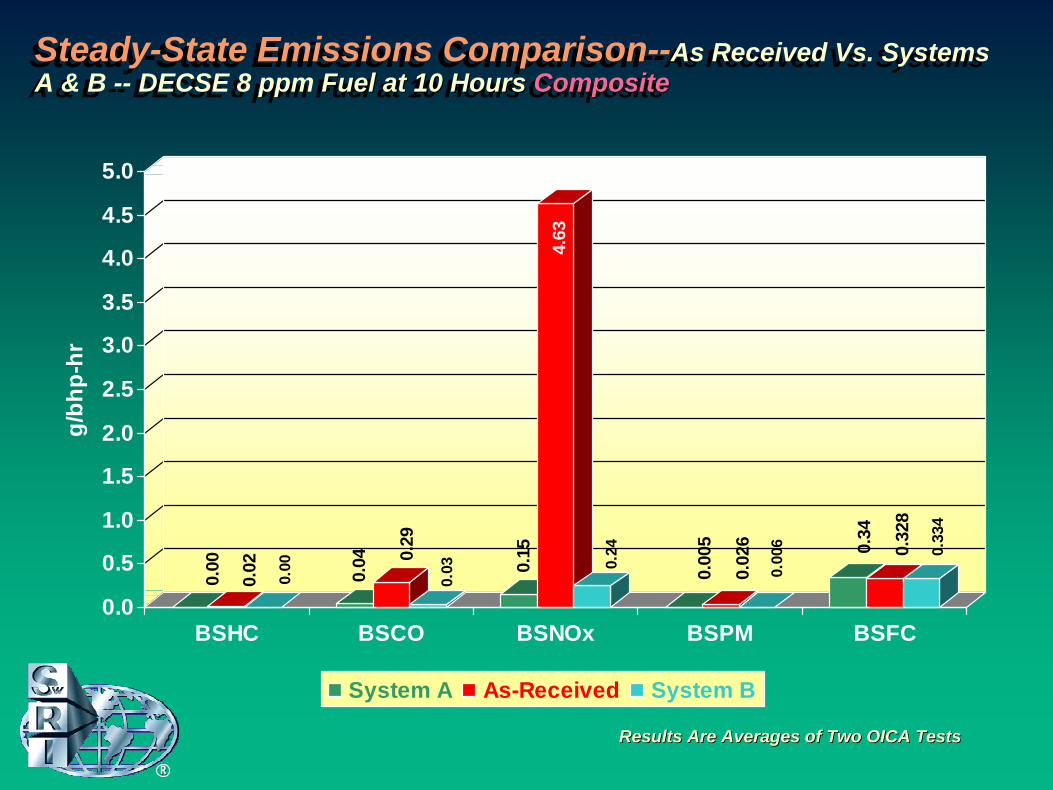
0.00
0.02
0.00 0.04 0.
29
0.03 0.
15
4.63
0.24
0.00
5
0.02
6
0.00
6 0.34
0.32
8
0.33
4
0.0
0.5
1.0
1.5
2.0
2.5
3.0
3.5
4.0
4.5
5.0
g/bh
p-hr
BSHC BSCO BSNOx BSPM BSFC
System A As-Received System B
Steady-State Emissions Comparison--As Received Vs. Systems A & B -- DECSE 8 ppm Fuel at 10 Hours CompositeSteady-State Emissions Comparison--As Received Vs. Systems A & B -- DECSE 8 ppm Fuel at 10 Hours Fuel at 10 Hours CompositeComposite
Results Are Averages of Two OICA TestsResults Are Averages of Two OICA Tests
RR

0.02
7
0.08
8
0.02
2 0.34
2
0.95
8
0.15
7
0.22
3.55
0.37
1
0.00
4
0.05
7
0.00
8 0.36
7
0.36
7
0.36
8
0.0
0.5
1.0
1.5
2.0
2.5
3.0
3.5
4.0
g/bh
p-hr
BSHC BSCO BSNOx BSPM BSFC
System A As-Received System B
RR
Transient Emissions Comparison--As Received Vs. Systems A & B --DECSE 8 ppm Fuel -- 10 Hours CompositeTransient Emissions Comparison--As Received Vs. Systems A & B --DECSE 8 ppm Fuel Fuel ---- 10 Hours 10 Hours CompositeComposite
* Composite Based on Cold + First Hot-Start EPA Transient Tests

RR
0.00
5
0.00
7
0.00
5 0.00
9
0.00
5
0.00
6
0.00
7 0.01
2
0.000
0.005
0.010
0.015
0.020g/
bhp-
hr
3 ppm 8 ppm 15 ppm 30 ppmSulfur Content
2007 PM Limit
Sensitivity To Fuel Sulfur--Steady-State Composite Emissions -- Average of 2 OICA Tests at 10 HoursSensitivity To Fuel Sulfur--Steady-State Composite Emissions -- Average of 2 OICA Tests at 10 Hours
0.18
0.24
0.15 0.
23
0.15 0.
24
0.14 0.
240
0.00
0.05
0.10
0.15
0.20
0.25
0.30
g/bh
p-hr
3 ppm 8 ppm 15 ppm 30 ppmSulfur Content
Target NOx Limit
System ASystem ASystem A
System BSystem BSystem B

RR
0.00
8
0.00
5
0.00
4 0.00
8
0.00
4
0.00
5
0.00
4
0.00
6
0.000
0.005
0.010
0.015
0.020g/
bhp-
hr
3 ppm 8 ppm 15 ppm 30 ppmSulfur Content
2007 PM Limit
* Composite Based on Cold + First Hot-Start EPA Transient Tests
Sensitivity To Fuel Sulfur--Transient Emissions -- Cold and first Hot Composite at 10 HoursSensitivity To Fuel Sulfur--Transient Emissions -- Cold and first Hot Composite at 10 Hours
0.23
2
0.34
8
0.22
0
0.37
1
0.24
0
0.38
3
0.23
7 0.32
9
0.000.050.100.150.200.250.300.350.40
g/bh
p-hr
3 ppm 8 ppm 15 ppm 30 ppmSulfur Content
Target NOx Limit
System ASystem ASystem A
System BSystem BSystem B
RR
Ammonia Slip--Steady-State & Transient --At the 10-hour PointAmmonia Slip--Steady-State & Transient --At the 10-hour Point
0.4
3.5
0.0 0.00.9
13.0
0.0 0.00
3
6
9
12
15 Average Peak
Steady-State (OICA/ESC)
Transient
Raw
NH
3, pp
m
AA AABB BB
RR
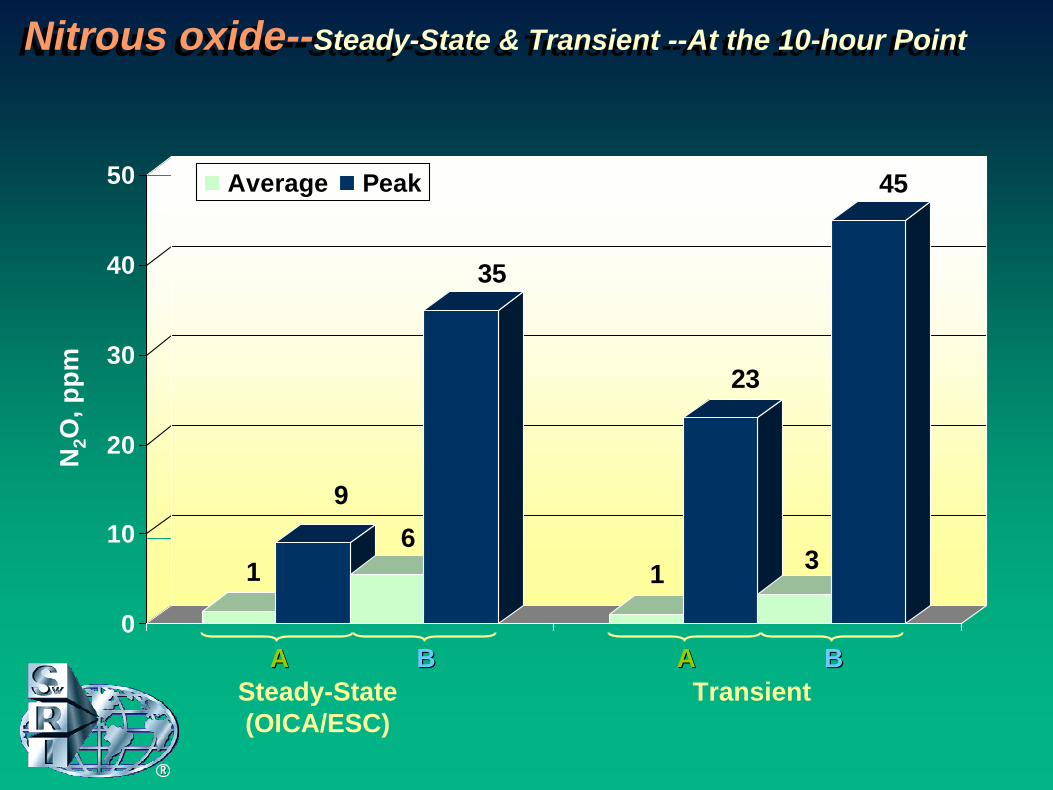
Nitrous oxide--Steady-State & Transient --At the 10-hour PointNitrous oxide--Steady-State & Transient --At the 10-hour Point
1
96
35
1
23
3
45
0
10
20
30
40
50 Average Peak
AA AABB BBSteady-State (OICA/ESC)
Transient
N2O
, ppm
RR
OutlineOutline
ObjectivesTechnical Approach Major AccomplishmentsTest Setup Systems A and BResultsSummary & Conclusions

Summary and ConclusionsSummary and ConclusionsThe LPL EGR system was installed and calibrated to yield:
−over 50% NOx reduction and,
− about 90%PM reduction
System A was optimized and yielded an average of 0.16/0.006 g/bhp-hr NOx/PM for all fuels in the OICA test.
System B was optimized and yielded an average of 0.24/0.009 g/bhp-hr NOx/PM for all fuels in the OICA test.
System A calibration for the EPA transient test cycle yielded composite average for all fuels of 0.232/0.005 g/bhp-hr NOx/PM.
System B calibration for the EPA transient test cycle yielded composite average for all fuels of 0.358/0.008 g/bhp-hr NOx/PM.
Fuel sulfur content did not appear to have a discernable effect on emissions at the 10-hour test point.

RR