Embed Size (px)
Citation preview
IMPACT ASSESSMENT STUDY OF
E-GOVERNMENT PROJECTS IN INDIA
Prepared by
Center for e-Governance, Indian Institute of Management, Ahmedabad
Submitted to Department of Information Technology, Government of India, New Delhi
January 2007

Impact Assessment Study
Study Team Prof. Subhash Bhatnagar (Coordinator), Prof. T.P. Rama Rao, Nupur Singh, Ranjan
Vaidya and Mousumi Mandal
Acknowledgments We would like to acknowledge the help extended to us by all employees and staff of the implementing agencies. In particular, we are grateful to the following in providing information, arranging interviews, and helping us to conduct surveys of citizens, front-desk employees and supervisors of their respective departments:
Mr. S.M. Bhavikatti, Assistant Inspector General of Registration (Computer), Government of Karnataka Mr. V N. Thippanagouda, District Registrar & Deputy Commissioner of Stamps, Bangalore (Urban) Mr. K. T. Vijaya Krishna Kumar, Deputy Director of Treasuries, Government of Karnataka Mr. K. Bikshapathi, Project Manager, eProcurement, Government of Andhra Pradesh Mr. P. Raghuveer, Additional Secretary, Government of Andhra Pradesh Dr. N. Sailaja, Special Officer (Promotions) & HR, Department of IT & Communication, Government of Andhra Pradesh Mr. Bireshwar Das, Deputy Director (Technical), eSeva Mr. Guruprasad Mohapatra, Transport Commissioner, Government of Gujarat Mr. S.B. Patel, Joint Director, Transport Office, Government of Gujarat
Preface An impact assessment study was initiated in January 2006 by Indian Institute of Management, Ahmedabad with the sponsorship of the eGovernment Practice Group of the World Bank, Washington DC. The study was to define a framework and methodology for impact assessment of e-government projects and use the methodology to assess Government to citizen service delivery projects from 3 states in India and 2 projects from Chile. A report titled ‘Impact Assessment Study of Computerized Service Delivery Projects from India and Chile’ is under publication by the World Bank. The report outlines a methodology for impact assessment, provides the rationale for the methodology and presents the results of assessment of impact of the selected projects from India and Chile. The IIM, Ahmedabad study team requested the Department of Information Technology (DIT), Government of India to provide financial support to cover the assessment of five additional projects and also support the organization of a workshop at the end of the study to disseminate the findings and to encourage different stake holders to participate in a national program of impact assessment being launched by DIT. The IIMA proposal was approved by the Ministry of Communications & Information Technology (MCIT) vide their letter No. 3(78)/2006-EGD dated 9/10/2006. This report presents the results of the assessment of five Indian projects undertaken for the DIT project using the framework proposed in the World Bank report.
Table of Contents
Executive Summary ...................................................................................................... 7
Organisation of the Report......................................................................................... 10
1. Introduction............................................................................................ 10
MEASUREMENT FRAMEWORK AND DATA ANALYSIS 11 2. Measurement Framework and Methodology for Impact Assessment11
2.1. Applying the measurement framework to selected projects..................... 12
3. Nature of Data Analysis Performed on Data from Surveys of Clients/Users and Agencies.................................................................. 13
3.1. Impact on clients...................................................................................... 13
3.2. Cost of accessing the service by clients .................................................. 14
3.3. Quality of service ..................................................................................... 15
3.4. Quality of governance.............................................................................. 15
3.5. Composite score...................................................................................... 15
3.6. Analysis of data collected from agencies ................................................. 15
ASSESSMENT RESULTS 16 4. Assessment of Individual Projects for all Stakeholders .................... 16
4.1. KAVERI - Computerization of sub registrar’s offices in Karnataka........... 16
4.2. Khajane - Computerization of treasuries in Karnataka............................. 17
4.3. eProcurement - Online tendering in Andhra Pradesh .............................. 18
4.4. eSeva - One stop shop for many services ............................................... 19
4.5. Computerised interstate check posts in Gujarat ...................................... 20
5. A Comparative Analysis of Projects from Client Perspective ........... 20
5.1. Preferred attributes for each project ........................................................ 23
5.2. Comparison of five projects on overall client impact ................................ 24
5.3. Variability of client impact across different delivery centers of a project .. 27
6. Impact on Agencies............................................................................... 27
6.1. Economic viability of projects................................................................... 28
6.2. Impact on the agency: perception of supervisors..................................... 29
7. Impact on Society .................................................................................. 29
7.1. Attitude towards computerized service delivery ....................................... 30
CONCLUSIONS AND FUTURE ACTION 31 8. Operationalizing the Proposed Framework for Assessment of
Projects in the Future ............................................................................ 31
8.1. Selection of projects for assessment ....................................................... 31
8.2. Constructing a project profile ................................................................... 32
8.3. Design of data collection instrument ........................................................ 32
8.4. Selection and training of investigators ..................................................... 33
8.5. Determining the sample size.................................................................... 33
8.6. Conduct of the survey.............................................................................. 34
8.7. Data entry and establishing data validity.................................................. 34
8.8. Challenges that were faced in data collection and analysis ..................... 35
9. Summary of Key Findings on Impact of Projects for E-delivery of Services to Citizens............................................................................... 35
10. Limitations of the Study ........................................................................ 36
LIST OF TABLES Table-I Profile of respondents .............................................................................. 14
Table-II Cost to client ............................................................................................ 21
Table-III Impact on clients (users).......................................................................... 22
Table-IV Descending order of improvement in composite scores .......................... 23
Table-V Top four attributes desired in the application ........................................... 24
Table-VI Rating of client impact (after elimination of scale bias) ............................ 25
Table-VII Impact on agency .................................................................................... 27
Table-VIII Economic viability of projects................................................................... 29
Table-IX Savings in cost to customers - Estimates for entire client population ...... 30
Table-X Attitude to e-government.......................................................................... 31
Table-XI Determination of Sample Size ................................................................. 34
LIST OF APPENDICES Annexure-I Location-wise assessment on different dimensions................................. 38 Annexure-II Perception of supervisors of impact on agency ....................................... 41 Annexure-III Fact sheets on projects............................................................................ 43 Annexure-IV Preliminary measurement framework ...................................................... 85

Annexure-V Survey among targeted clients, KAVERI ................................................. 93
LIST OF FIGURES Figure-I Radial charts representing client impact .................................................. 26
7
Impact Assessment Study
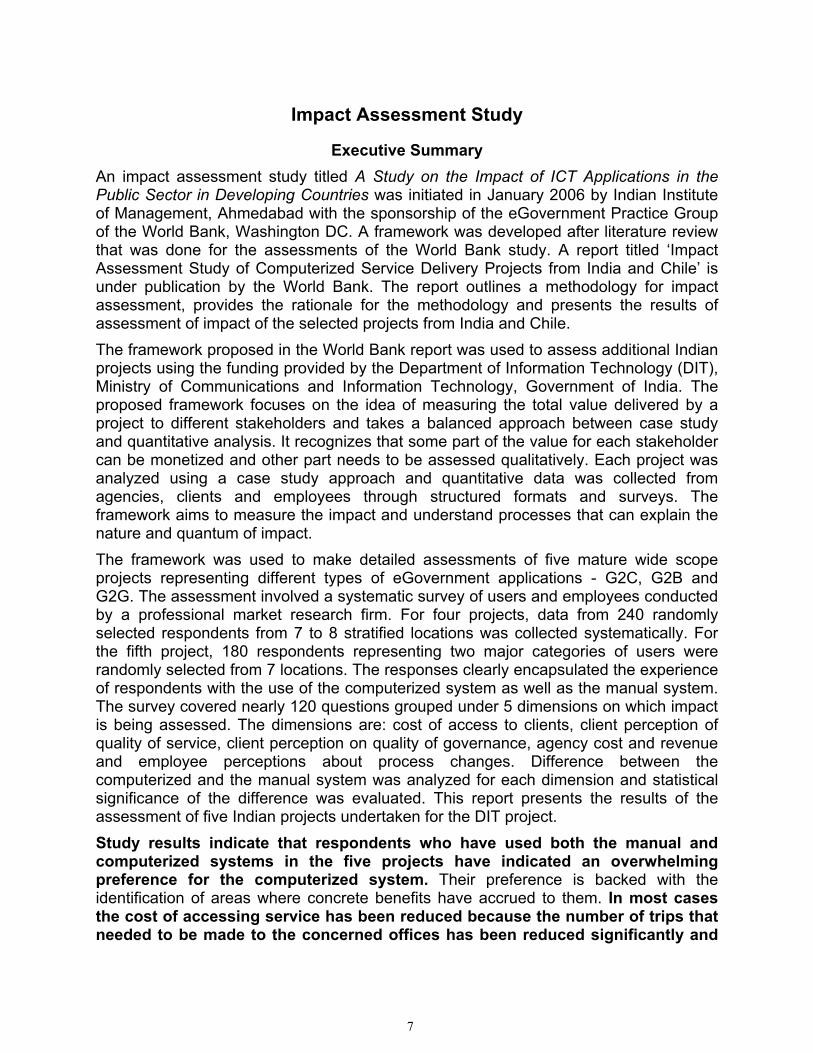
Executive Summary An impact assessment study titled A Study on the Impact of ICT Applications in the Public Sector in Developing Countries was initiated in January 2006 by Indian Institute of Management, Ahmedabad with the sponsorship of the eGovernment Practice Group of the World Bank, Washington DC. A framework was developed after literature review that was done for the assessments of the World Bank study. A report titled ‘Impact Assessment Study of Computerized Service Delivery Projects from India and Chile’ is under publication by the World Bank. The report outlines a methodology for impact assessment, provides the rationale for the methodology and presents the results of assessment of impact of the selected projects from India and Chile. The framework proposed in the World Bank report was used to assess additional Indian projects using the funding provided by the Department of Information Technology (DIT), Ministry of Communications and Information Technology, Government of India. The proposed framework focuses on the idea of measuring the total value delivered by a project to different stakeholders and takes a balanced approach between case study and quantitative analysis. It recognizes that some part of the value for each stakeholder can be monetized and other part needs to be assessed qualitatively. Each project was analyzed using a case study approach and quantitative data was collected from agencies, clients and employees through structured formats and surveys. The framework aims to measure the impact and understand processes that can explain the nature and quantum of impact. The framework was used to make detailed assessments of five mature wide scope projects representing different types of eGovernment applications - G2C, G2B and G2G. The assessment involved a systematic survey of users and employees conducted by a professional market research firm. For four projects, data from 240 randomly selected respondents from 7 to 8 stratified locations was collected systematically. For the fifth project, 180 respondents representing two major categories of users were randomly selected from 7 locations. The responses clearly encapsulated the experience of respondents with the use of the computerized system as well as the manual system. The survey covered nearly 120 questions grouped under 5 dimensions on which impact is being assessed. The dimensions are: cost of access to clients, client perception of quality of service, client perception on quality of governance, agency cost and revenue and employee perceptions about process changes. Difference between the computerized and the manual system was analyzed for each dimension and statistical significance of the difference was evaluated. This report presents the results of the assessment of five Indian projects undertaken for the DIT project. Study results indicate that respondents who have used both the manual and computerized systems in the five projects have indicated an overwhelming preference for the computerized system. Their preference is backed with the identification of areas where concrete benefits have accrued to them. In most cases the cost of accessing service has been reduced because the number of trips that needed to be made to the concerned offices has been reduced significantly and
8
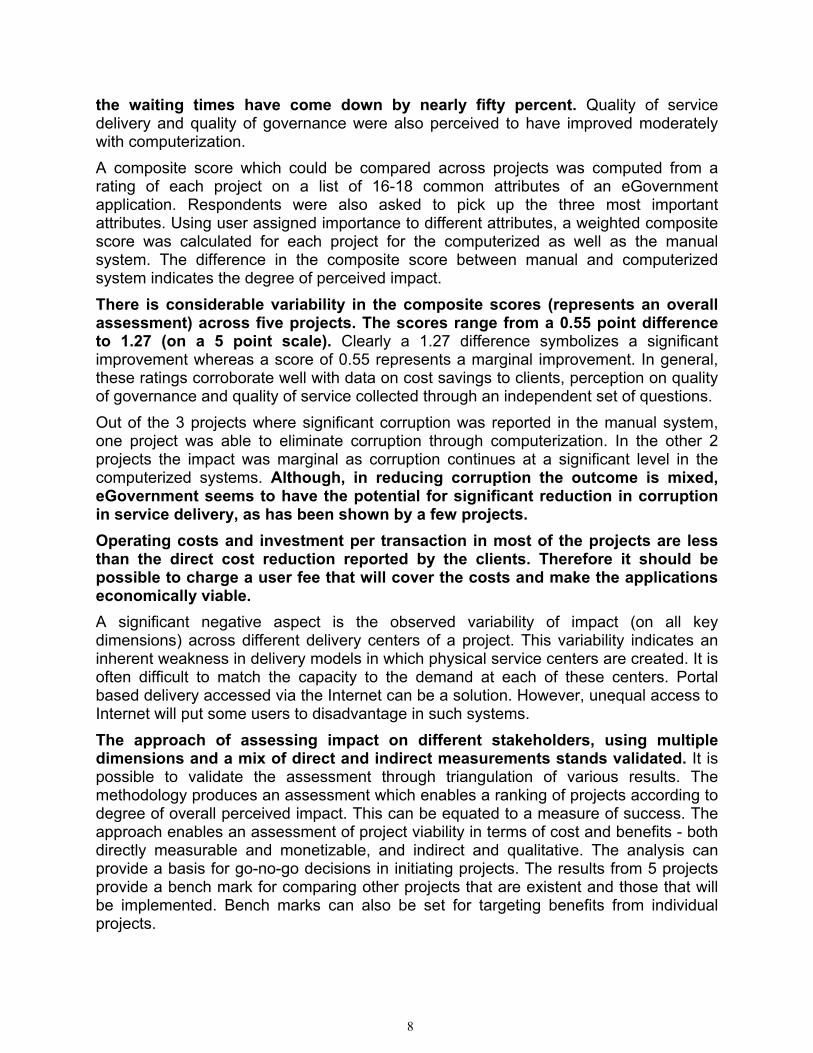
the waiting times have come down by nearly fifty percent. Quality of service delivery and quality of governance were also perceived to have improved moderately with computerization. A composite score which could be compared across projects was computed from a rating of each project on a list of 16-18 common attributes of an eGovernment application. Respondents were also asked to pick up the three most important attributes. Using user assigned importance to different attributes, a weighted composite score was calculated for each project for the computerized as well as the manual system. The difference in the composite score between manual and computerized system indicates the degree of perceived impact. There is considerable variability in the composite scores (represents an overall assessment) across five projects. The scores range from a 0.55 point difference to 1.27 (on a 5 point scale). Clearly a 1.27 difference symbolizes a significant improvement whereas a score of 0.55 represents a marginal improvement. In general, these ratings corroborate well with data on cost savings to clients, perception on quality of governance and quality of service collected through an independent set of questions. Out of the 3 projects where significant corruption was reported in the manual system, one project was able to eliminate corruption through computerization. In the other 2 projects the impact was marginal as corruption continues at a significant level in the computerized systems. Although, in reducing corruption the outcome is mixed, eGovernment seems to have the potential for significant reduction in corruption in service delivery, as has been shown by a few projects. Operating costs and investment per transaction in most of the projects are less than the direct cost reduction reported by the clients. Therefore it should be possible to charge a user fee that will cover the costs and make the applications economically viable. A significant negative aspect is the observed variability of impact (on all key dimensions) across different delivery centers of a project. This variability indicates an inherent weakness in delivery models in which physical service centers are created. It is often difficult to match the capacity to the demand at each of these centers. Portal based delivery accessed via the Internet can be a solution. However, unequal access to Internet will put some users to disadvantage in such systems. The approach of assessing impact on different stakeholders, using multiple dimensions and a mix of direct and indirect measurements stands validated. It is possible to validate the assessment through triangulation of various results. The methodology produces an assessment which enables a ranking of projects according to degree of overall perceived impact. This can be equated to a measure of success. The approach enables an assessment of project viability in terms of cost and benefits - both directly measurable and monetizable, and indirect and qualitative. The analysis can provide a basis for go-no-go decisions in initiating projects. The results from 5 projects provide a bench mark for comparing other projects that are existent and those that will be implemented. Bench marks can also be set for targeting benefits from individual projects.

9
It would be hasty to generalize the overall conclusions of positive impact and economic viability of electronic service delivery projects from this study to all eGovernment projects in India. Nearly all the projects are serving urban clients. Projects that serve rural clients could have a very different cost structure and demand pattern. More projects need to be evaluated from a larger sample to generalize the conclusions.
10
Impact Assessment Study
Organisation of the Report Section 1 presents the findings of the literature search carried out for the World Bank Report on existing frameworks and methodologies for impact assessment of e-government projects. Section 2 presents a brief description of the proposed framework and methodology that was used to assess impact of five projects. Section 3 outlines different types of analyses that were carried out on the survey data collected from users and agency staff for the five projects. Results from the analysis are presented in four sections that follow. Section 4 presents an assessment of overall impact on each project for all the key stakeholders. Section 5 presents a comparative analysis across five projects for specific dimensions. Section 6 presents the impact on agency and section 7 analyzes broader impact on society. Section 8 presents some learning for operationalizing the framework for other projects in the future. The final section summarizes the key findings on different types of impact that were analyzed.
1. Introduction A number of empirical studies suggest that ICT has had an impact in improving the performance of private sector organizations particularly in developed countries. However, as for ICT investments by the public sector in developing countries, many researchers have noted that past evaluation studies have not used a common framework or methodology and that rates of success/failure have been declared based on purposive samples1. Evaluative studies had been done to serve a variety of purposes. Some studies looked at implementation success - were the systems functioning as they were designed to, or the degree to which the specified outcomes were achieved. Some studies looked at long term sustainability and replicability of the project2. Some studies measured the benefits that were delivered to agencies3. Few studies have focused on the benefits to the clients4. There was hardly any comprehensive study that assessed the impact on all the stake holders and covered both short term and long term direct and indirect impacts. There were a few studies that had carried out a cost/benefit analysis. Following observations can be made on the current status of impact assessment practice. • A variety of approaches had been used for evaluation. These included surveys,
expert opinion, ethnographic studies and internal assessments produced by lending 1 Rob M. Peters, Marijn Janssen, Tom M. van Engers, Measuring e-Government Impact: Existing practices and shortcomings, Proceedings of the 7th International Conference on Electronic Commerce, ICEC05, Aug 2004 2 Government of India, Ministry of IT has commissioned quick assessment of 39 projects. These summary assessments are available on the website of Department of IT at http://www.mit.gov.in/SA/index.asp 3 Korea’s eProcurement agency has evaluated the impact on different Government agencies using the system (Public Procurement Service, Measurement Framework - Measured Indicators: Republic of Korea, 2006). 4 Global Knowledge Sharing Program got 4 Indian projects evaluated where clients were surveyed. These assessment reports are available at: http://unpan1.un.org/intradoc/groups/public/documents/apcity/unpan015131.pdf; http://unpan1.un.org/intradoc/groups/public/documents/apcity/unpan015133.pdf;http://unpan1.un.org/intradoc/groups/public/documents/apcity/unpan015135.pdf; http://unpan1.un.org/intradoc/groups/public/documents/apcity/unpan015140.pdf
11
agencies. • Often evaluation studies had been done by agencies that may be seen as having an
interest in showing a positive outcome. • Different studies of the same project showed very different outcomes, thus indicating
a lack of credibility of results5. • Part of the reason for different outcomes was the use of very small samples and a
lack of rigor in sampling in collecting data from clients of the systems. The results could therefore not be easily generalized over the entire population of clients.
• The studies evaluated the functioning of the computerized system but were not able to assess the difference made by ICT use, as the need for counterfactuals (evaluation of systems as they worked before computerization) was ignored. Often the impact of ICT use was not separated from other interventions that were made simultaneously with the computerization effort.
• Finally, since different studies did not use a standard methodology, it was difficult to compare the outcome for a project with other projects.
A framework was developed after literature review that was done for the assessments of the World Bank study. The same framework has been used to assess additional Indian projects using the MCIT funding. The proposed framework focuses on the idea of measuring the total value delivered by a project to different stakeholders and takes a balanced approach between case study and quantitative analysis. It recognizes that some part of the value for each stakeholder can be monetized and other part needs to be assessed qualitatively. Each project was analyzed using a case study approach and quantitative data was collected from agencies, clients and employees through structured formats and surveys. The framework aims to measure the impact and understand processes that can explain the nature and quantum of impact. The detailed dimensions of impact and specific indicators that will be measured include direct economic costs, quality of service, and quality of governance, based on suggestions made by various frameworks that were reviewed.
MEASUREMENT FRAMEWORK AND DATA ANALYSIS
2. Measurement Framework and Methodology for Impact Assessment In the context of eGovernment projects ICT is introduced primarily to improve efficiency, effectiveness, and transparency of governments. Therefore, a crucial first stage in the evaluation process is to ascertain the extent to which these intended outcomes have been achieved. Thus, the proposed research will assess to what extent e-government
5 For example, the Bhoomi project of issuing copies of land title has been evaluated by Public Affairs council reporting a significant positive outcomes including reduction in bribes (Lobo, Albert & Balakrishnan, Suresh, Report Card on Service of Bhoomi Kiosks: An assessment of benefits by users of the computerized land records system in Karnataka, November 2002). Recent studies by a team from MIT and IIIT Bangalore found that corruption had not declined and major benefits were derived by land sharks. The final and draft versions of the report are available at http://www.iiitb.ac.in/ICTforD/ict4d.htm.
12
(primarily e-service) projects have resulted in: (i) direct and indirect economic value for clients and agencies that implement systems (ii) organizational value for the agencies (iii) social and political value for the Government and the broader society. The proposed measurement framework is shown in Annexure-IV. An eService delivery project impacts three groups of stakeholders: clients receiving the service, agency (including several partners) that delivers the service and the larger society consisting of citizens, businesses, government as a whole and civil society. The impact can be assessed in terms of a variety of outcomes experienced by each type of stake holder. The table below lists key dimensions of outcomes for each type of stake holder.
Stakeholders Key Dimension of Impact
Client • Economic (Direct & Indirect) • Governance (Corruption, Accountability, Transparency, Participation) • Quality of Service (Decency, Fairness, Convenience, etc.)
Agency (Including Partners in Implementation)
• Economic (Direct & Indirect) • Governance (Corruption, Accountability, Transparency, Participation) • Performance on Key Non-economic Objectives • Process Improvements
Society (Government as a whole and Civil Society)
• Economic (Direct & Indirect) • Governance (Corruption, Accountability, Transparency, Participation,
Responsiveness) • Development Goals • Attitude to computerization of Government agencies for service delivery
2.1. Applying the measurement framework to selected projects • A sample of five mature, wide scope/scale projects (see table below) was selected
from India, representing different types of eGovernment applications - G2C, G2B and G2G.
Project Application Type
Service Delivery Launch Date
Karnataka Valuation and E-Registration (KAVERI) - Computerization of sub registrar offices in Karnataka G2C December 2003
Khajane - Computerization of treasuries in Karnataka G2G November 2002
eProcurement - Online tendering in Andhra Pradesh G2B January 2003
eSeva - One stop shop for many services in Andhra Pradesh G2C August 2003
Computerised interstate check posts in Gujarat G2B March 2000
• For each project, the measurement framework was converted into a set of data collection instruments: a. A profile of the project identifying services, clients and other stake holders. b. Agency level data on activity levels, investments and operating costs c. A client survey questionnaire covering direct cost of access, quality of service,
13
quality of governance, overall satisfaction and perception of eGovernment based on exposure to different eGovernment applications.
d. An employee survey for perceived impact on work, efficiency, effectiveness. • A Market Research Agency was hired to collect the data on Indian projects.
Measurement instruments were translated into local languages of the regions where the projects have been implemented. An illustrative client questionnaire for KAVERI in Karnataka is shown in Annexure-V. The original questionnaire used for the survey has been revised on the basis of learning acquired during the process of impact assessment. Investigators were trained to understand the nature of projects, focus of the study and an interpretation of individual items in the instrument. Questionnaires were the field tested.
• A representative sample of 30 respondents was drawn from 7 to 8 locations (in case of common service centers) stratified according to activity levels and poor/developed regions of a state for each project.
• The measurements were based on counterfactuals. Both the manual system and the computerized system that replaced the manual system were assessed on all the indicators. An analysis of the differences between the old and the new system will provide a measure of impact.
3. Nature of Data Analysis Performed on Data from Surveys of Clients/Users and Agencies
The study is exploratory in nature. It tries to understand the nature (which dimensions) and degree of impact of computerization of 5 projects in which the manual system was replaced. Its aim was to produce a credible assessment of impact of each project on 5 key dimensions: cost of access to clients, client perception of quality of service, client perception on quality of governance, agency cost and revenue and employee perceptions about process changes.
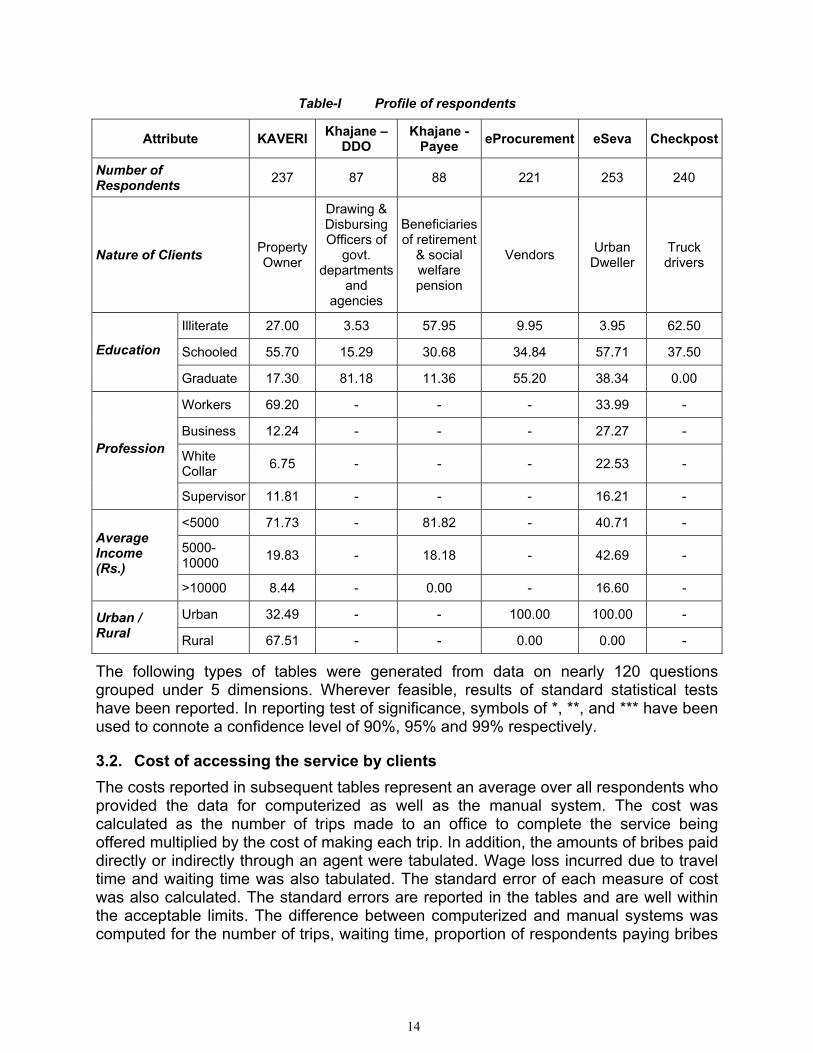
3.1. Impact on clients An attempt was made to quantify the direct costs of accessing the service. The results that are reported are based on survey data, triangulated with field observations, and perceptions of employees. The study attempts to explain the nature and degree of impact through contextual factors observed through qualitative case study of the project. The responses from 240 clients for each project clearly encapsulated the experience of clients with the use of the computerized delivery system as well as the manual system. The profile of respondents for each project is presented in Table-I. The sample for KAVERI is biased towards property owners in smaller towns and rural areas. The respondents in eSeva are entirely urban, educated, employed or business people. Although no data is available for the population of users of these applications, agency managers felt that the profile of respondents mirrors the profile of users of these systems. Respondents for eProcurement are largely urban and educated vendors. The respondents in Checkpost are entirely less literate / illiterate truck drivers. Respondents for Khajane are largely educated government employees or beneficiaries of retirement and social welfare pension.
14
Table-I Profile of respondents
Attribute KAVERI Khajane – DDO
Khajane - Payee eProcurement eSeva Checkpost
Number of Respondents 237 87 88 221 253 240
Nature of Clients Property Owner
Drawing & Disbursing Officers of
govt. departments
and agencies
Beneficiaries of retirement
& social welfare pension
Vendors Urban Dweller
Truck drivers
Illiterate 27.00 3.53 57.95 9.95 3.95 62.50
Schooled 55.70 15.29 30.68 34.84 57.71 37.50 Education
Graduate 17.30 81.18 11.36 55.20 38.34 0.00
Workers 69.20 - - - 33.99 -
Business 12.24 - - - 27.27 -
White Collar 6.75 - - - 22.53 -
Profession
Supervisor 11.81 - - - 16.21 -
<5000 71.73 - 81.82 - 40.71 -
5000-10000 19.83 - 18.18 - 42.69 -
Average Income (Rs.)
>10000 8.44 - 0.00 - 16.60 -
Urban 32.49 - - 100.00 100.00 - Urban / Rural Rural 67.51 - - 0.00 0.00 -
The following types of tables were generated from data on nearly 120 questions grouped under 5 dimensions. Wherever feasible, results of standard statistical tests have been reported. In reporting test of significance, symbols of *, **, and *** have been used to connote a confidence level of 90%, 95% and 99% respectively.
3.2. Cost of accessing the service by clients The costs reported in subsequent tables represent an average over all respondents who provided the data for computerized as well as the manual system. The cost was calculated as the number of trips made to an office to complete the service being offered multiplied by the cost of making each trip. In addition, the amounts of bribes paid directly or indirectly through an agent were tabulated. Wage loss incurred due to travel time and waiting time was also tabulated. The standard error of each measure of cost was also calculated. The standard errors are reported in the tables and are well within the acceptable limits. The difference between computerized and manual systems was computed for the number of trips, waiting time, proportion of respondents paying bribes
15
and amount of bribes paid. Whether the difference was statistically significant was tested. A column in the tables reports the level of significance. Difference in all the cost elements is seen to be statistically significant.
3.3. Quality of service The quality of service was assessed on different attributes of quality such as responsiveness of staff, convenience of location of office and work timings, and facilities at the service center. In addition the overall quality was also assessed through a single question. Respondents rated the manual and computerized systems on each question on a 5 point scale. Since the scale is an interval scale, in addition to plotting the frequency distribution of responses for the qualitative assessment associated with each point (1-5) on the scale an average score was computed for all respondents using the numeric values of 1-5. Assuming equal weights for each question, an average score was computed over all the questions. The tables report these average scores lying between 1 and 5 for computerized and manual systems. Standard errors are also reported. The difference between computerized and manual system is also reported with the associated level of statistical significance for the difference.
3.4. Quality of governance The quality of governance was assessed on different attributes such as transparency, reduced corruption, fairness of treatment, quality of feedback and level of accountability. In addition the overall quality of governance was also assessed through a single question. Respondents rated the manual and computerized systems on each question on a 5 point scale. Since the scale is an interval scale, in addition to plotting the frequency distribution of responses for the qualitative assessment associated with each point (1-5) on the scale, an average score was computed for all respondents using the numeric values of 1-5. Assuming equal weightings for each question, an average score was computed over all the questions. The tables report these average sores lying between 1 and 5 for computerized and manual systems. Standard errors are also reported. The difference between computerized and manual system is also reported with the associated level of statistical significance for the difference.
3.5. Composite score Respondents were asked to rate the manual and computerized systems on a common set of about 18 attributes covering cost of access, convenience, quality of delivery, and quality of governance. For each project the respondents were also asked to pick up the three most desirable attributes. Based on the responses on desirability, a weighting scheme was generated for each of the attributes reflecting the importance of the attribute. Using the weighting scheme and the responses on a five point scale, a single composite score was generated for the manual and computerized version of each project. The difference between the composite score on the manual and computerized system is reported with an assessment of the statistical significance of the difference.
3.6. Analysis of data collected from agencies Data on transaction volumes, operating costs, investments, tax collection (if applicable),
16
and revenues from transaction fees was to be collected for three years prior to the introduction of computerized system and for the entire period after computerization. Unfortunately, it was very difficult to collect accurate data for pre computerization as often agencies did not have an MIS that was reporting such data. However, post computerization data on transactions and revenues was easier to collect as it was at least recorded in individual agencies. The cost data is not completely accurate because many costs are joint - being incurred to support many activities. Data was analyzed to determine if the computerization process had impacted revenue/tax collection of the agency. Data on investments, costs and additional revenues has been used to work out economic viability of the applications. Table representing cumulative investments for four years (assuming a life of four years for investments) and yearly operating cost per transaction provides an idea of break even fee structure for user fee. Data from employees on perceptions about impact on work load, managerial processes, and participation in design has been analyzed to understand the underlying reasons for the degree of impact.
ASSESSMENT RESULTS
4. Assessment of Individual Projects for all Stakeholders Detailed fact sheets of each project are included in Annexure-III. A summary of the individual project assessments is given below.
4.1. KAVERI - Computerization of sub registrar’s offices in Karnataka KAVERI has been operational since 2003. In 2006, 201 Sub Registrar’s offices were delivering three key services: on line registration of property sale/purchase deeds; issue of non-encumbrance certificate and issue of copies of a previously registered deed. There has been a considerable growth of transaction volumes in last 5 years in the time when the system was computerized. In 2000-01 when the system was manual, 0.63 million properties were registered. In 2005-06, 1.02 million properties were registered representing an annual growth of 10.27%. Requests for non-encumbrance grew at 12.21% and copies of registration at 2.25%. The total investment over the last three years is Rs 400.0 million in hardware, data entry and furniture. The yearly operating expense for the year 2005 was Rs.111.13 million. Entire investment in technology has come from the private partner. KAVERI earned revenue of Rs 2626.95 million from the transaction fee that was charged from the users in 2005. Of this amount, Rs 159.7 million was paid to the private operators. Thus the private operators earned a contribution of Rs. 48.57 million a year to pay for the investments made by them. For the private partner the payback is over 8-9 years at current levels of user fee. For the Government, KAVERI has generated a revenue share of 2467.3 million from fees. In addition the tax revenue collected from stamp duty has gone up by 112% in 3 years after computerization. The growth in stamp duty of 28.67 % over 3 years has outstripped the 11.59% growth in transactions. The manpower and other costs incurred by the Government have remained within a narrow range for the manual and computerized systems. However, after computerization the total cost as a percentage of revenue from fee has declined from 6.48% to 4.23% in 2 years. This 19%
17
reduction in cost per transaction can be attributed to computerization. KAVERI has lowered the travel costs significantly by Rs 116.684 per transaction. Waiting time in KAVERI offices has been halved from the 162 minutes in the manual system and the total elapsed time for registrations has come down significantly from 11.3 days to 5.2 days. Compared to the promise of registration in half a day, the performance of computerized system is poor. There has been some improvement in service quality. However, there has only been hardly any improvement in the quality of governance. The proportion of transactions in which a bribe was paid in the manual system was 34.32%. Though the proportion of bribe payers came down, it continues to be high at 21.61% in the computerized system. A detailed study of one of the centers indicated that any type of system break down leads to corruption. The break down can be on account of an overload of demand in comparison to the capacity of the system to process registrations. Agents play a key role in promoting corruption. Private operators also exhibit rent seeking behavior given an opportunity. Systematizing queues by appointments helps prevent break down. Overall, users of KAVERI have reported a marginal improvement over the manual system. The improvement in composite score from 3.35 (slightly better than satisfactory) to 3.90 (just approaching good) of 0.5 on a 5 point scale can be considered marginal. In spite of the marginal overall improvement, nearly 98% of respondents preferred the computerized system over the manual system because the time cost of getting the service for clients has come down significantly.
4.2. Khajane - Computerization of treasuries in Karnataka Khajane has been operational since 2003. In 2006, 31 district treasuries and 184 sub treasuries were delivering three key services: processing of bills presented by Drawing and Disbursing Officers (DDO); processing of pension bills; and payments to vendors and contractors. In the last three years there has been a steady increase in the volume of transactions. In 2003-04, 3.27 million bills were processed at the treasuries for processing whereas in 2005-06, 3.53 million bills were processed thereby representing an annual growth of 3.86%. The growth in the DDO bills was 3.63% and for the pension bills it was 5%. There has been a considerable reduction in the cases of errors in the bills presented at the treasury. In 2003-04, 6410 cases of error corrections were reported while in 2005-06, 922 cases were reported representing a reduction of 62.07%. There has also been an increase in the detection of cases of excess payments of family pension. In the year 2002-03, 581 cases of excess payments were reported. In the year 2003-04, 701 cases of excess payments were reported representing an increase of 20%. The total investment in hardware, communication infrastructure, civil works and software over the last three years is Rs. 337.9 million. The operating expenses for the year 2005-06 are Rs. 64.9 million. The users of Khajane – the DDOs and the recipients of retirement and social welfare pensions – have reported a marked improvement over the manual system. There has been a significant improvement in the quality of governance. The DDOs reported an improvement of 0.7 while the payees reported an improvement of 0.61 on a 5 point
18
scale. For the service quality, the improvements were 0.4 and 0.55 for the DDOs and Payees respectively. There has been a significant decline in the waiting time for availing the services at the computerized treasury. For the DDOs the waiting time has reduced from 63 minutes in the manual system to 22 minutes for the computerized system. For the payees the waiting time has reduced from 60 minutes in the manual system to 25 minutes in the computerized system. Overall, the DDOs reported a mean composite score of 4.43 for the computerized system, which is significantly higher than the mean composite score of 3.24 for the manual system. For the payees the mean composite score of the computerized system was found to be 4.19, which is significantly higher than that of the manual system (3.08).
4.3. eProcurement - Online tendering in Andhra Pradesh The first online tender was enabled in 2003 but the automatic tender evaluation functionality was introduced only in March 2005. The eProcurement portal facilitates: online aggregation of indents raised by various government departments, agencies and municipalities; publication of tender notices; vendor registration; submission of Expression of Interest and bid by vendor in response to a published tender; automatic evaluation of bids; publishing of the status of the tender; release of purchase order/letter of award to the selected bidder; and online payment of bid processing fee by the vendor. From only about 20% of the total government procurement in 2003-04, the eProcurement platform now facilitates almost 90% of the total procurement of the Government of Andhra Pradesh6. The number of tenders processed and published on the eProcurement platform in 2005-06 is 8677, which is almost double the number in the previous year. The number of bids received in 2005 has grown by 94.41% over the number received in the previous year. The average number of bids received per tender is about 3. A consortium lead by M/s C1 India Private Limited, was selected as the private partner to invest in setting up the exchange and to operate it thereafter. It is estimated that the private partner has invested a capital expenditure of Rs. 50.4 milion on software and hardware and incurred an operational expenditure of Rs. 24.3 million per annum on the eProcurement platform. The revenue earned by the private partner on account of the bid processing fee paid by vendors is estimated to be around Rs. 383.47 million in 2005. The eProcurement exchange earns a contribution of Rs. 360 million a year to pay for the investments. It is an economically viable project with a one-year payback period at current levels of bid processing fee. Users of the eProcurement portal have reported a significant improvement over the manual system. The composite score has moved from 3.22 (satisfactory) to 4.26 (good). Travel costs incurred by the vendor have been lowered significantly by as much as Rs. 1444.55 per bid submitted. This is largely due to the reduction in the number of trips that the vendor is required to make to the department offices. Download of tender documents as well as submission of the bid is now done through the portal. Consequently, there has been a significant reduction of about 115 minutes in the 6 Bikshapathi, K, Rama Raju, P & Bhatnagar, Subhash (2006). eProcurement in Government of Andhra Pradesh, India. http://siteresources.worldbank.org/INTEGOVERNMENT/Resources/APeProcurement.doc
19
waiting time spent by vendors to obtain the tender document. There has been a marginal improvement of 0.38 points on a 5 point scale in the quality of governance. However, the proportion of transactions in which a bribe was paid in the manual system was 14.48% as compared to only 2.71% in the computerized system. There has been a very marginal improvement of 0.27 points on a 5 point scale in the service quality. On the whole, 83.71% of the respondents preferred the eProcurement platform to the manual system of tendering
4.4. eSeva - One stop shop for many services ESeva centers in Andhra Pradesh have been operational for three years. 45 eSeva Centers in the capital city of Hyderabad have been operational since September 2002. These centers are delivering 135 services from central, state, local Governments and public utilities. The important services relate to payment of electricity and water bill and issue of birth and death certificates. There has been a growth of 87.74% in transaction volumes in last 3 years since the system was computerized. In 2005 the number of transactions was 37.02 million. The total investment in hardware, data communication, interiors and software for the first two phases is Rs 600.0 million. Nearly 50% of this amount was on building and interiors. The other 50% was borne by the private sector partners. The yearly operating expense for the year 2005 was estimated to be Rs. 168.9 million. The revenue from transaction fee has grown by 120.15% to 203.59 million in 2005-06. Economic viability will need to be assessed separately for Phase-I (Hyderabad) and Phase-II (expansion to 220 municipal towns) as it depends on the number of transactions processed per month per center. Phase II activity is still growing. For the first phase covering the city of Hyderabad so far 70 million transactions of all types have been processed cumulatively generating revenue of nearly Rs 250 million for the partner. Partner’s investment in Hyderabad is approximately Rs. 80 million and their annual operating expenses are in the range of Rs. 30 million for peak transaction volumes. On the basis of these gross calculations, private partners have recovered their investments and operating expenses in five years from the inception of the project. In addition, the private partners own the application software that can be used in other geographies7. Users of eSeva have reported a significant improvement over the manual system of dealing with individual agencies. The composite score has moved from 3.39 (slightly better than satisfactory) to 4.66 (close to very good). eSeva has lowered the travel costs by Rs 9.3 per transaction for its users who are all urban. Waiting time in eSeva Centers has been halved in comparison to agency counters from 32.9 minutes to 14.6 minutes. There has been a significant improvement of 0.79 points on a 5 point scale in the quality of governance. There has been a significant improvement of 0.94 points in service quality on a 5 point scale. 96.84% of respondents preferred the eSeva system over the departmental systems.
7 Government is a joint owner with a small share of the intellectual property.
20
4.5. Computerised interstate check posts in Gujarat Computerised interstate check posts in Gujarat have been operational since 2000. Implementation at the first check post was completed in March 2000 while the remaining 9 check posts were commissioned later the same year. The operators at the check posts essentially perform these activities: levying of penalty for overloaded or over-dimensioned commercial vehicles passing through the check post; verification of essential documents like the Vehicle Registration Book, Driver's license, Permit to enter the state or the National Permit, Pollution Under Control Certificate, insurance documents and delivery documents; inspection of the vehicle to check for broken or damaged headlights, non-standard license plates, etc.; and collection of tax dues, if any. The number of commercial vehicles passing through the check posts is estimated to be more than 16 million annually8. During the period 2000-01 to 2004-05, there has been a growth of 26% in the number of violations being detected and a corresponding growth of 21% in the penalty collected. The revenue earned from tax dues collected at the check posts grew by 13% in the last year. The total investment on the automation of ten check posts was Rs. 625.2 million, which included Rs. 185.2 for electronic weigh bridges, full system automation of lanes, PCs and servers, routers, video equipment and other automation devices; and about Rs. 440 million for civil works like widening of the highway. The operating expense for the last three years is about Rs. 18-20 million per annum. In 2004-05 the penalty collected on account of violations of transport norms by commercial vehicles was Rs. 2872.59 million. Thus the state government earns a contribution of Rs. 2850 million a year indicating that the revenue earned by just one year of operation was sufficient to pay for the investment. Drivers of trucks crossing the computerized check posts of Gujarat have reported a reasonable improvement over the manual system. The composite score has moved from 3.48 (satisfactory) to 4.32 (good). Time spent waiting at the check post has reduced from 29.66 minutes to 20.73 minutes. The proportion of truck drivers who had paid a bribe at a manual check post during the current trip was 20.42%. This proportion was somewhat less at 14.17% at the computerized check post. There has been a perceptible improvement of 0.88 points on a 5 point scale in the quality of governance. There has been an improvement of 0.57 points in service quality on a 5 point scale. 91.25% of respondents preferred the computerized system over the manual system.
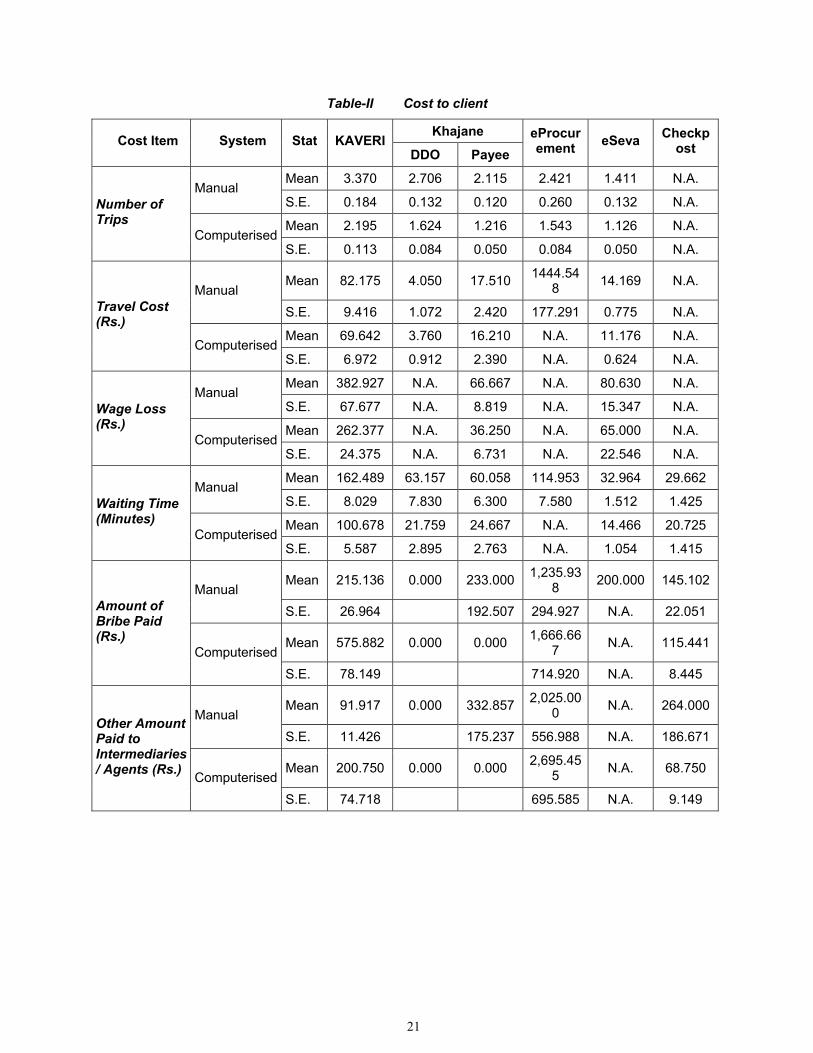
5. A Comparative Analysis of Projects from Client Perspective Table-II and Table-III present a comparative analysis of the impact on clients (users) on the three key dimensions of cost, service quality, quality of governance and an overall preference. The data reports average over all respondents for the manual and computerized system. Standard errors are also reported and seem to be small. The difference indicates the level of improvement.
8 About 30,000 vehicles enter the state every day, of which 80% are commercial transport vehicles. Gujarat has about 637,292 commercial transport vehicles (by March 2004) which cross the state border at least once a month.
21
Table-II Cost to client
Khajane Cost Item System Stat KAVERI
DDO Payee eProcurement eSeva Checkp
ost
Mean 3.370 2.706 2.115 2.421 1.411 N.A. Manual
S.E. 0.184 0.132 0.120 0.260 0.132 N.A. Mean 2.195 1.624 1.216 1.543 1.126 N.A.
Number of Trips
Computerised S.E. 0.113 0.084 0.050 0.084 0.050 N.A.
Mean 82.175 4.050 17.510 1444.548 14.169 N.A.
Manual S.E. 9.416 1.072 2.420 177.291 0.775 N.A. Mean 69.642 3.760 16.210 N.A. 11.176 N.A.
Travel Cost (Rs.)
Computerised S.E. 6.972 0.912 2.390 N.A. 0.624 N.A. Mean 382.927 N.A. 66.667 N.A. 80.630 N.A.
Manual S.E. 67.677 N.A. 8.819 N.A. 15.347 N.A. Mean 262.377 N.A. 36.250 N.A. 65.000 N.A.
Wage Loss (Rs.)
Computerised S.E. 24.375 N.A. 6.731 N.A. 22.546 N.A. Mean 162.489 63.157 60.058 114.953 32.964 29.662
Manual S.E. 8.029 7.830 6.300 7.580 1.512 1.425
Mean 100.678 21.759 24.667 N.A. 14.466 20.725 Waiting Time (Minutes)
Computerised S.E. 5.587 2.895 2.763 N.A. 1.054 1.415
Mean 215.136 0.000 233.000 1,235.938 200.000 145.102
Manual S.E. 26.964 192.507 294.927 N.A. 22.051
Mean 575.882 0.000 0.000 1,666.667 N.A. 115.441
Amount of Bribe Paid (Rs.)
Computerised S.E. 78.149 714.920 N.A. 8.445
Mean 91.917 0.000 332.857 2,025.000 N.A. 264.000
Manual S.E. 11.426 175.237 556.988 N.A. 186.671
Mean 200.750 0.000 0.000 2,695.455 N.A. 68.750
Other Amount Paid to Intermediaries / Agents (Rs.) Computerised
S.E. 74.718 695.585 N.A. 9.149
22
Table-III Impact on clients (users)
Khajane Project => KAVERI
DDO Payee eProcurement eSeva Checkp
ost
Mean 1.200 1.082 0.897 0.857 0.285 N.A.
S.E. 0.119 0.095 0.099 0.258 0.089 N.A. Number of Trips Saved
Significance9 *** *** *** *** *** N.A.
Mean 116.684 2.615 11.212 1444.548 9.342 N.A. Travel Cost Saved (Rs.)
S.E. 18.103 0.783 2.464 177.291 2.228 N.A.
Mean 62.915 41.398 35.400 114.953 18.498 8.873
S.E. 7.003 6.521 4.441 7.580 1.642 1.817
Cost
Waiting Time Saved (Minutes) Significance *** *** *** N.A. *** ***
Mean 0.316 0.398 0.554 0.272 0.947 0.567
S.E. 0.037 0.066 0.072 0.050 0.044 0.045
Difference in Overall Score (5-point scale) Significance *** *** *** *** *** ***
Manual 11.81 12.79 14.94 N.A. 3.56 N.A.
Service Quality
Error Rate (%) Computerised 8.02 3.49 1.14 N.A. 1.98 N.A.
Mean 0.190 0.697 0.611 0.382 0.794 0.880
S.E. 0.045 0.057 0.058 0.043 0.041 0.055
Difference in Overall Score (5-point scale) Significance *** *** *** *** *** ***
Manual 34.32 0.00 5.68 14.48 0.40 20.42
Governance
Proportion paying Bribes (%)
Computerized 21.61 0.00 0.00 2.71 0.00 14.17
Preference for Computerization Percent (%) 98.31 N.A. N.A. 83.71 96.84 91.25
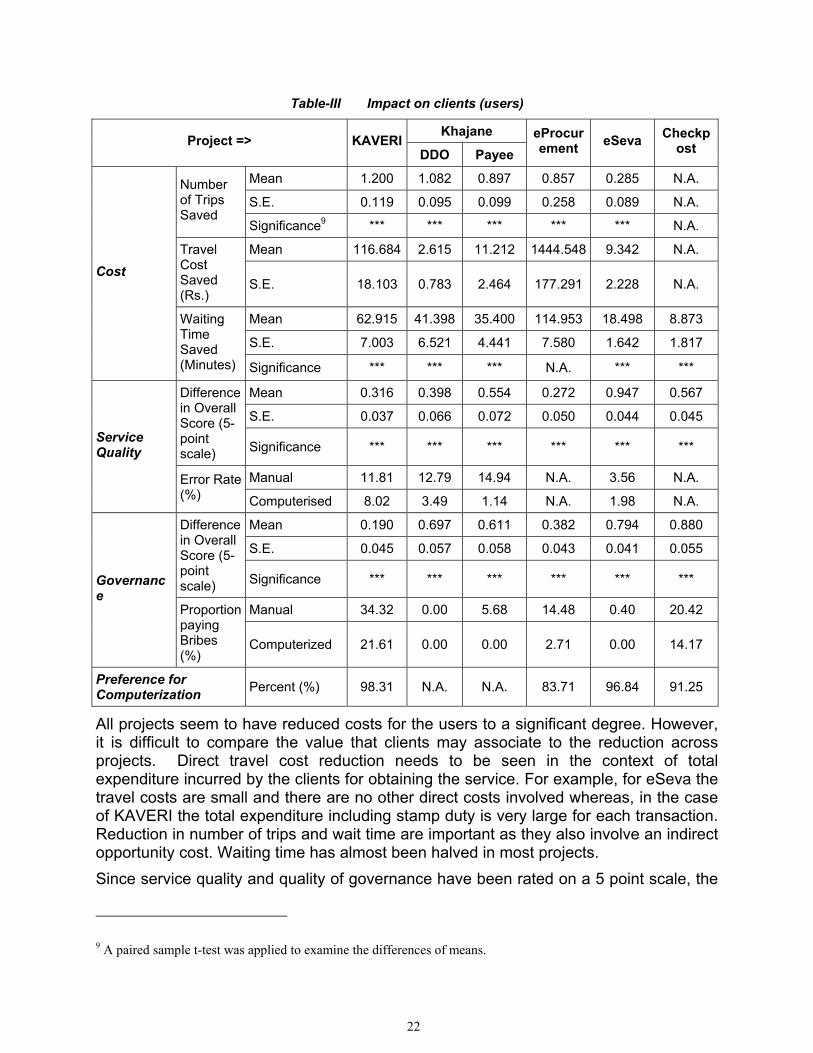
All projects seem to have reduced costs for the users to a significant degree. However, it is difficult to compare the value that clients may associate to the reduction across projects. Direct travel cost reduction needs to be seen in the context of total expenditure incurred by the clients for obtaining the service. For example, for eSeva the travel costs are small and there are no other direct costs involved whereas, in the case of KAVERI the total expenditure including stamp duty is very large for each transaction. Reduction in number of trips and wait time are important as they also involve an indirect opportunity cost. Waiting time has almost been halved in most projects. Since service quality and quality of governance have been rated on a 5 point scale, the
9 A paired sample t-test was applied to examine the differences of means.
23
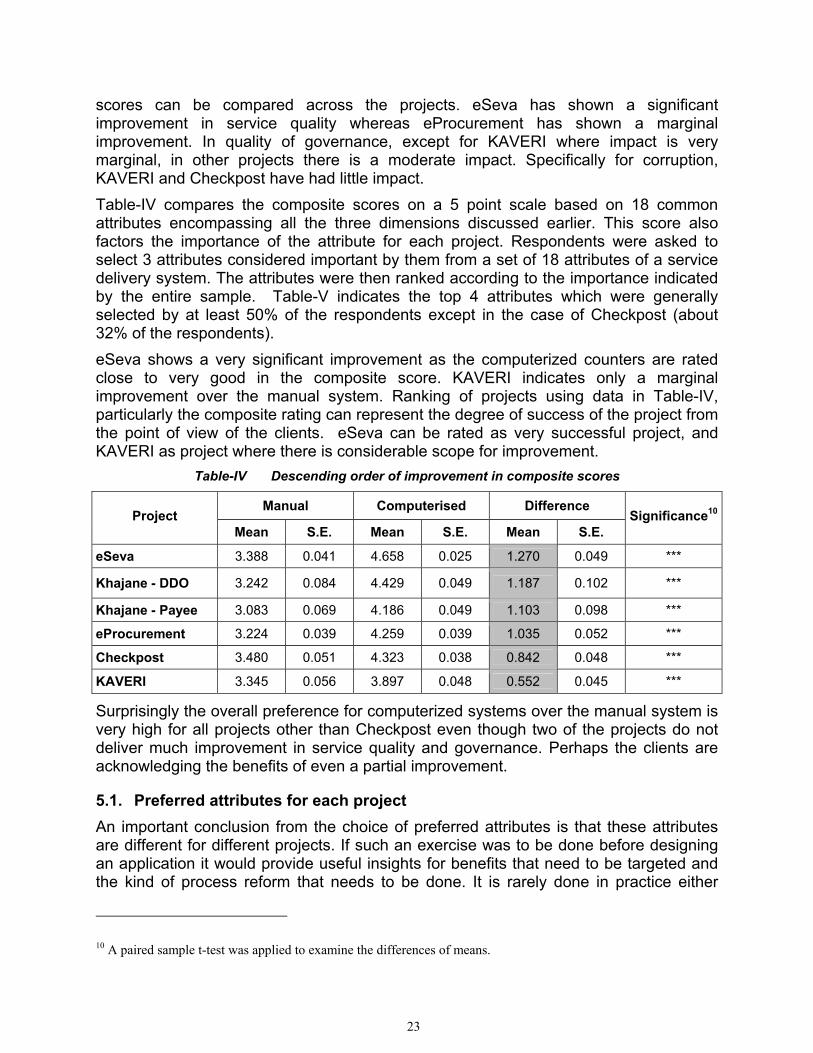
scores can be compared across the projects. eSeva has shown a significant improvement in service quality whereas eProcurement has shown a marginal improvement. In quality of governance, except for KAVERI where impact is very marginal, in other projects there is a moderate impact. Specifically for corruption, KAVERI and Checkpost have had little impact. Table-IV compares the composite scores on a 5 point scale based on 18 common attributes encompassing all the three dimensions discussed earlier. This score also factors the importance of the attribute for each project. Respondents were asked to select 3 attributes considered important by them from a set of 18 attributes of a service delivery system. The attributes were then ranked according to the importance indicated by the entire sample. Table-V indicates the top 4 attributes which were generally selected by at least 50% of the respondents except in the case of Checkpost (about 32% of the respondents). eSeva shows a very significant improvement as the computerized counters are rated close to very good in the composite score. KAVERI indicates only a marginal improvement over the manual system. Ranking of projects using data in Table-IV, particularly the composite rating can represent the degree of success of the project from the point of view of the clients. eSeva can be rated as very successful project, and KAVERI as project where there is considerable scope for improvement.
Table-IV Descending order of improvement in composite scores
Manual Computerised Difference Project
Mean S.E. Mean S.E. Mean S.E. Significance10
eSeva 3.388 0.041 4.658 0.025 1.270 0.049 ***
Khajane - DDO 3.242 0.084 4.429 0.049 1.187 0.102 ***
Khajane - Payee 3.083 0.069 4.186 0.049 1.103 0.098 *** eProcurement 3.224 0.039 4.259 0.039 1.035 0.052 *** Checkpost 3.480 0.051 4.323 0.038 0.842 0.048 *** KAVERI 3.345 0.056 3.897 0.048 0.552 0.045 ***
Surprisingly the overall preference for computerized systems over the manual system is very high for all projects other than Checkpost even though two of the projects do not deliver much improvement in service quality and governance. Perhaps the clients are acknowledging the benefits of even a partial improvement.
5.1. Preferred attributes for each project An important conclusion from the choice of preferred attributes is that these attributes are different for different projects. If such an exercise was to be done before designing an application it would provide useful insights for benefits that need to be targeted and the kind of process reform that needs to be done. It is rarely done in practice either
10 A paired sample t-test was applied to examine the differences of means.
24
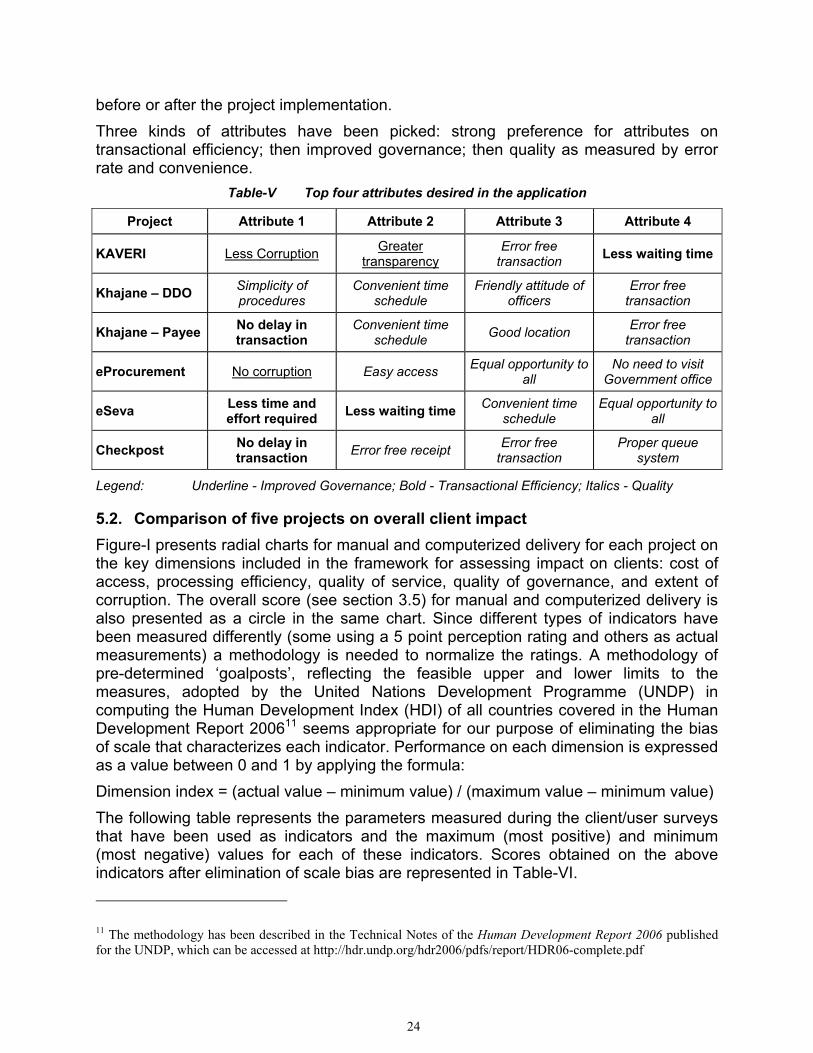
before or after the project implementation. Three kinds of attributes have been picked: strong preference for attributes on transactional efficiency; then improved governance; then quality as measured by error rate and convenience.
Table-V Top four attributes desired in the application
Project Attribute 1 Attribute 2 Attribute 3 Attribute 4
KAVERI Less Corruption Greater transparency
Error free transaction Less waiting time
Khajane – DDO Simplicity of procedures
Convenient time schedule
Friendly attitude of officers
Error free transaction
Khajane – Payee No delay in transaction
Convenient time schedule Good location Error free
transaction
eProcurement No corruption Easy access Equal opportunity to all
No need to visit Government office
eSeva Less time and effort required Less waiting time Convenient time
schedule Equal opportunity to
all
Checkpost No delay in transaction Error free receipt Error free
transaction Proper queue
system
Legend: Underline - Improved Governance; Bold - Transactional Efficiency; Italics - Quality
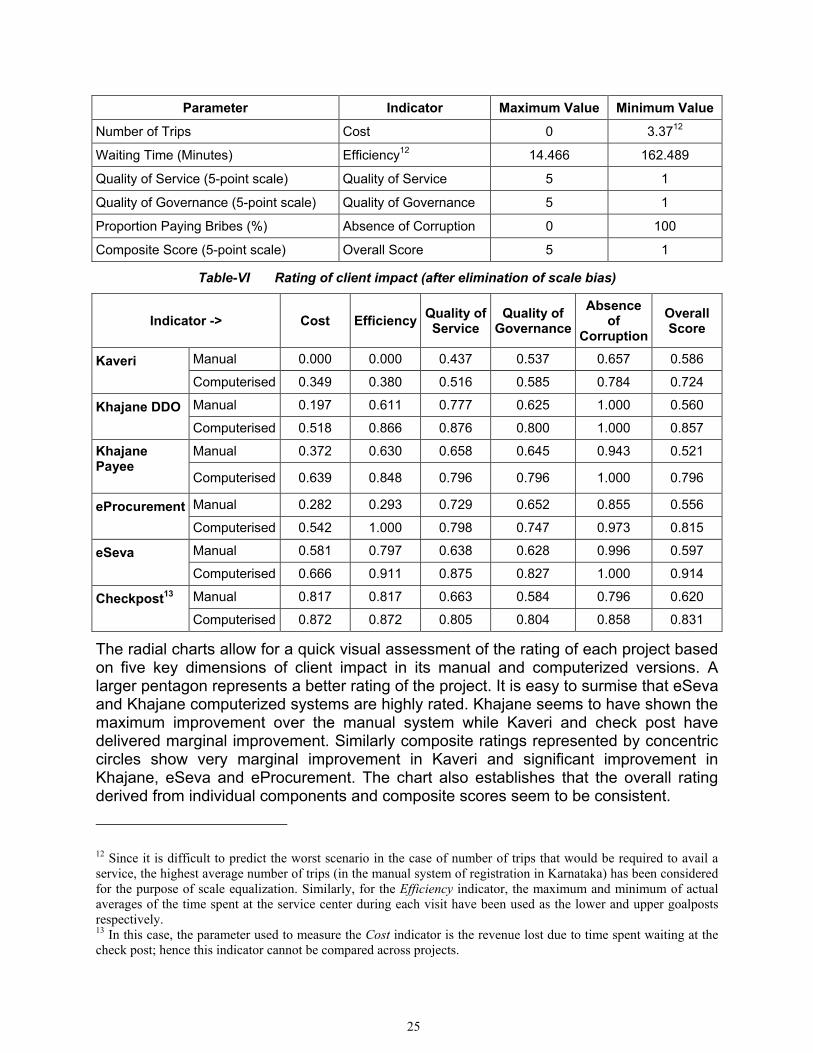
5.2. Comparison of five projects on overall client impact Figure-I presents radial charts for manual and computerized delivery for each project on the key dimensions included in the framework for assessing impact on clients: cost of access, processing efficiency, quality of service, quality of governance, and extent of corruption. The overall score (see section 3.5) for manual and computerized delivery is also presented as a circle in the same chart. Since different types of indicators have been measured differently (some using a 5 point perception rating and others as actual measurements) a methodology is needed to normalize the ratings. A methodology of pre-determined ‘goalposts’, reflecting the feasible upper and lower limits to the measures, adopted by the United Nations Development Programme (UNDP) in computing the Human Development Index (HDI) of all countries covered in the Human Development Report 200611 seems appropriate for our purpose of eliminating the bias of scale that characterizes each indicator. Performance on each dimension is expressed as a value between 0 and 1 by applying the formula: Dimension index = (actual value – minimum value) / (maximum value – minimum value) The following table represents the parameters measured during the client/user surveys that have been used as indicators and the maximum (most positive) and minimum (most negative) values for each of these indicators. Scores obtained on the above indicators after elimination of scale bias are represented in Table-VI.
11 The methodology has been described in the Technical Notes of the Human Development Report 2006 published for the UNDP, which can be accessed at http://hdr.undp.org/hdr2006/pdfs/report/HDR06-complete.pdf
25
Parameter Indicator Maximum Value Minimum Value
Number of Trips Cost 0 3.3712
Waiting Time (Minutes) Efficiency12 14.466 162.489
Quality of Service (5-point scale) Quality of Service 5 1
Quality of Governance (5-point scale) Quality of Governance 5 1
Proportion Paying Bribes (%) Absence of Corruption 0 100
Composite Score (5-point scale) Overall Score 5 1
Table-VI Rating of client impact (after elimination of scale bias)
Indicator -> Cost Efficiency Quality of Service
Quality of Governance
Absence of
Corruption Overall Score
Manual 0.000 0.000 0.437 0.537 0.657 0.586 Kaveri Computerised 0.349 0.380 0.516 0.585 0.784 0.724
Manual 0.197 0.611 0.777 0.625 1.000 0.560 Khajane DDO Computerised 0.518 0.866 0.876 0.800 1.000 0.857
Manual 0.372 0.630 0.658 0.645 0.943 0.521 Khajane Payee Computerised 0.639 0.848 0.796 0.796 1.000 0.796
Manual 0.282 0.293 0.729 0.652 0.855 0.556 eProcurement Computerised 0.542 1.000 0.798 0.747 0.973 0.815
Manual 0.581 0.797 0.638 0.628 0.996 0.597 eSeva Computerised 0.666 0.911 0.875 0.827 1.000 0.914
Manual 0.817 0.817 0.663 0.584 0.796 0.620 Checkpost13 Computerised 0.872 0.872 0.805 0.804 0.858 0.831
The radial charts allow for a quick visual assessment of the rating of each project based on five key dimensions of client impact in its manual and computerized versions. A larger pentagon represents a better rating of the project. It is easy to surmise that eSeva and Khajane computerized systems are highly rated. Khajane seems to have shown the maximum improvement over the manual system while Kaveri and check post have delivered marginal improvement. Similarly composite ratings represented by concentric circles show very marginal improvement in Kaveri and significant improvement in Khajane, eSeva and eProcurement. The chart also establishes that the overall rating derived from individual components and composite scores seem to be consistent.
12 Since it is difficult to predict the worst scenario in the case of number of trips that would be required to avail a service, the highest average number of trips (in the manual system of registration in Karnataka) has been considered for the purpose of scale equalization. Similarly, for the Efficiency indicator, the maximum and minimum of actual averages of the time spent at the service center during each visit have been used as the lower and upper goalposts respectively. 13 In this case, the parameter used to measure the Cost indicator is the revenue lost due to time spent waiting at the check post; hence this indicator cannot be compared across projects.
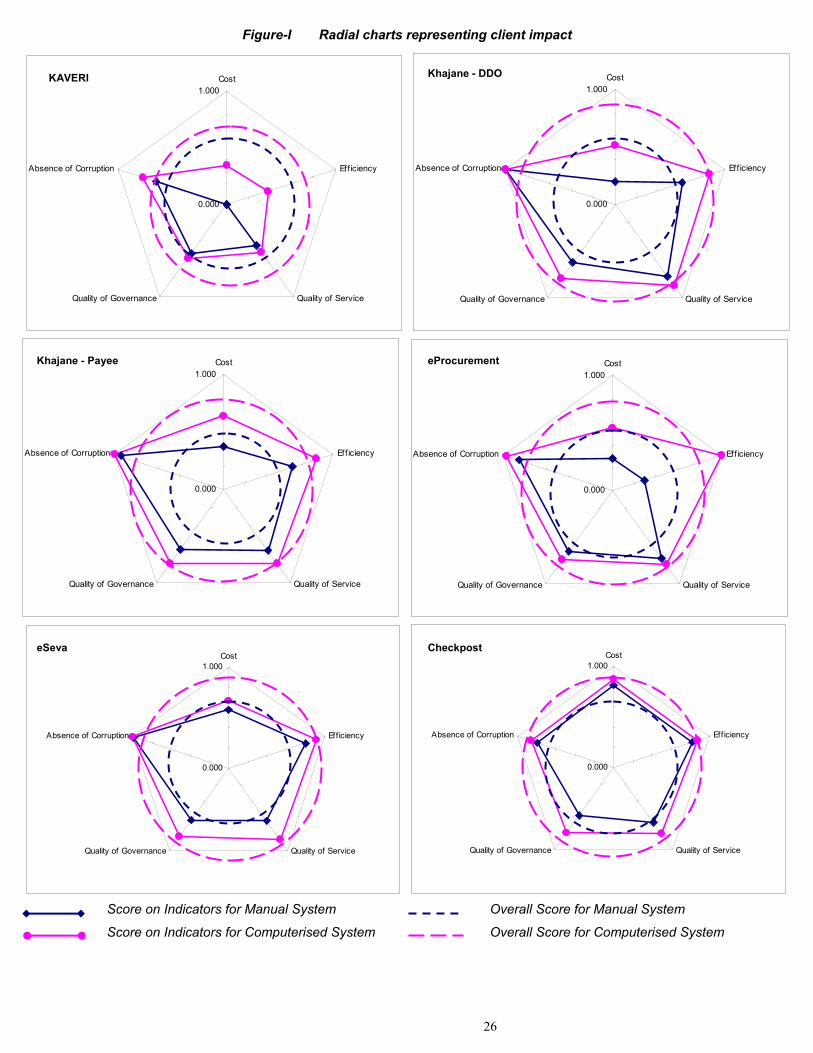
26
Figure-I Radial charts representing client impact
0.000
1.000Cost
Eff iciency
Quality of ServiceQuality of Governance
Absence of Corruption
0.000
1.000Cost
Eff iciency
Quality of ServiceQuality of Governance
Absence of Corruption
0.000
1.000Cost
Eff iciency
Quality of ServiceQuality of Governance
Absence of Corruption
0.000
1.000Cost
Eff iciency
Quality of ServiceQuality of Governance
Absence of Corruption
0.000
1.000Cost
Efficiency
Quality of ServiceQuality of Governance
Absence of Corruption
0.000
1.000Cost
Eff iciency
Quality of ServiceQuality of Governance
Absence of Corruption
Score on Indicators for Manual System Overall Score for Manual System
Score on Indicators for Computerised System Overall Score for Computerised System
KAVERI Khajane - DDO
Khajane - Payee eProcurement
eSeva Checkpost
27
5.3. Variability of client impact across different delivery centers of a project Earlier analysis of client impact was based on the total number of respondents, typically surveyed in 8 different locations. Data was analyzed to understand if there were location differences for a project. Annexure-I analyzes differences by location of service facility on a few key dimensions across all projects. The mean for each location is tested against the total sample mean for statistically significant difference. On improvements in composite scores which is an overall evaluation, there is significant variation in KAVERI, Khajane and Checkpost. The variation is small only in eSeva. In eSeva the overall improvement is significant but the variation is small. It is interesting that eSeva is the only application where capacity of the service center is designed to match the activity levels.
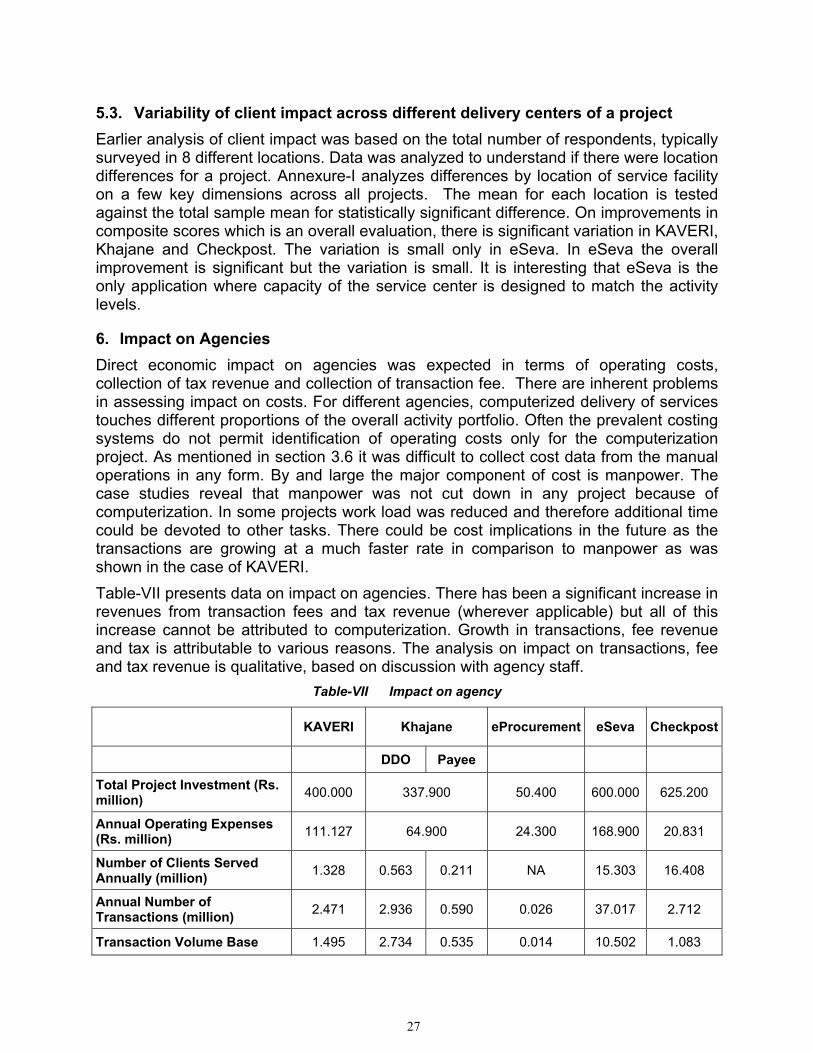
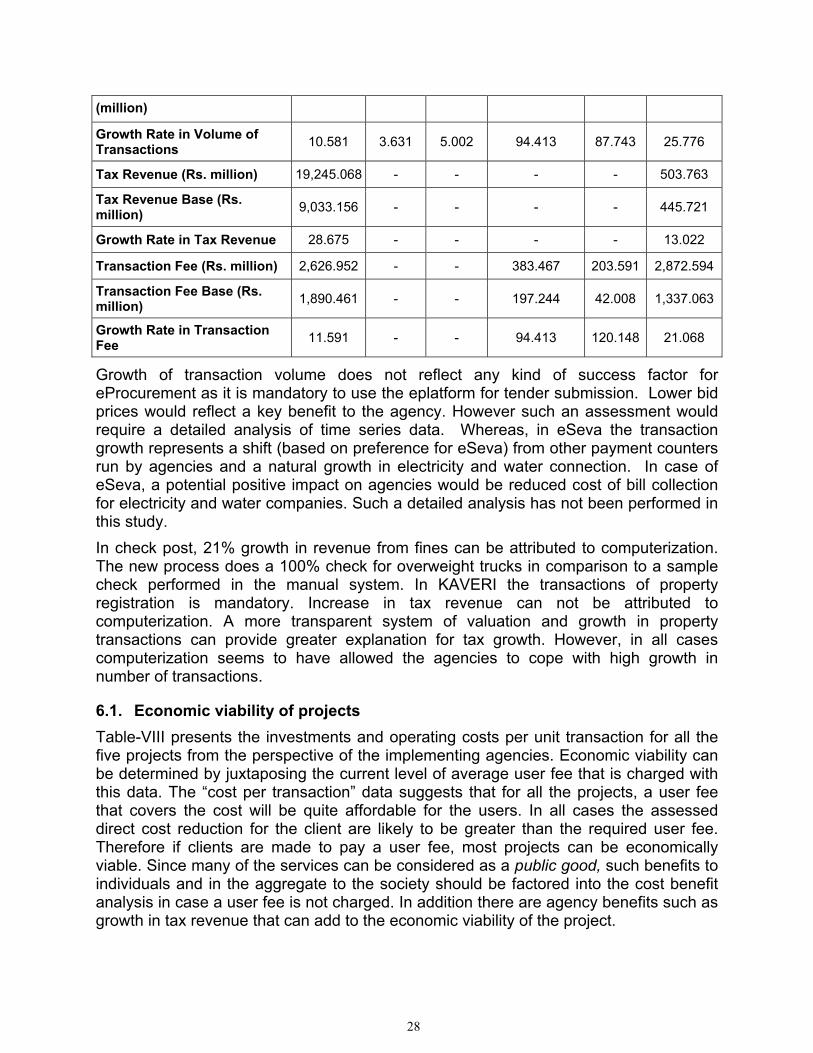
6. Impact on Agencies Direct economic impact on agencies was expected in terms of operating costs, collection of tax revenue and collection of transaction fee. There are inherent problems in assessing impact on costs. For different agencies, computerized delivery of services touches different proportions of the overall activity portfolio. Often the prevalent costing systems do not permit identification of operating costs only for the computerization project. As mentioned in section 3.6 it was difficult to collect cost data from the manual operations in any form. By and large the major component of cost is manpower. The case studies reveal that manpower was not cut down in any project because of computerization. In some projects work load was reduced and therefore additional time could be devoted to other tasks. There could be cost implications in the future as the transactions are growing at a much faster rate in comparison to manpower as was shown in the case of KAVERI. Table-VII presents data on impact on agencies. There has been a significant increase in revenues from transaction fees and tax revenue (wherever applicable) but all of this increase cannot be attributed to computerization. Growth in transactions, fee revenue and tax is attributable to various reasons. The analysis on impact on transactions, fee and tax revenue is qualitative, based on discussion with agency staff.
Table-VII Impact on agency
KAVERI Khajane eProcurement eSeva Checkpost
DDO Payee
Total Project Investment (Rs. million) 400.000 337.900 50.400 600.000 625.200
Annual Operating Expenses (Rs. million) 111.127 64.900 24.300 168.900 20.831
Number of Clients Served Annually (million) 1.328 0.563 0.211 NA 15.303 16.408
Annual Number of Transactions (million) 2.471 2.936 0.590 0.026 37.017 2.712
Transaction Volume Base 1.495 2.734 0.535 0.014 10.502 1.083
28
(million)
Growth Rate in Volume of Transactions 10.581 3.631 5.002 94.413 87.743 25.776
Tax Revenue (Rs. million) 19,245.068 - - - - 503.763
Tax Revenue Base (Rs. million) 9,033.156 - - - - 445.721
Growth Rate in Tax Revenue 28.675 - - - - 13.022
Transaction Fee (Rs. million) 2,626.952 - - 383.467 203.591 2,872.594
Transaction Fee Base (Rs. million) 1,890.461 - - 197.244 42.008 1,337.063
Growth Rate in Transaction Fee 11.591 - - 94.413 120.148 21.068
Growth of transaction volume does not reflect any kind of success factor for eProcurement as it is mandatory to use the eplatform for tender submission. Lower bid prices would reflect a key benefit to the agency. However such an assessment would require a detailed analysis of time series data. Whereas, in eSeva the transaction growth represents a shift (based on preference for eSeva) from other payment counters run by agencies and a natural growth in electricity and water connection. In case of eSeva, a potential positive impact on agencies would be reduced cost of bill collection for electricity and water companies. Such a detailed analysis has not been performed in this study. In check post, 21% growth in revenue from fines can be attributed to computerization. The new process does a 100% check for overweight trucks in comparison to a sample check performed in the manual system. In KAVERI the transactions of property registration is mandatory. Increase in tax revenue can not be attributed to computerization. A more transparent system of valuation and growth in property transactions can provide greater explanation for tax growth. However, in all cases computerization seems to have allowed the agencies to cope with high growth in number of transactions.
6.1. Economic viability of projects Table-VIII presents the investments and operating costs per unit transaction for all the five projects from the perspective of the implementing agencies. Economic viability can be determined by juxtaposing the current level of average user fee that is charged with this data. The “cost per transaction” data suggests that for all the projects, a user fee that covers the cost will be quite affordable for the users. In all cases the assessed direct cost reduction for the client are likely to be greater than the required user fee. Therefore if clients are made to pay a user fee, most projects can be economically viable. Since many of the services can be considered as a public good, such benefits to individuals and in the aggregate to the society should be factored into the cost benefit analysis in case a user fee is not charged. In addition there are agency benefits such as growth in tax revenue that can add to the economic viability of the project.
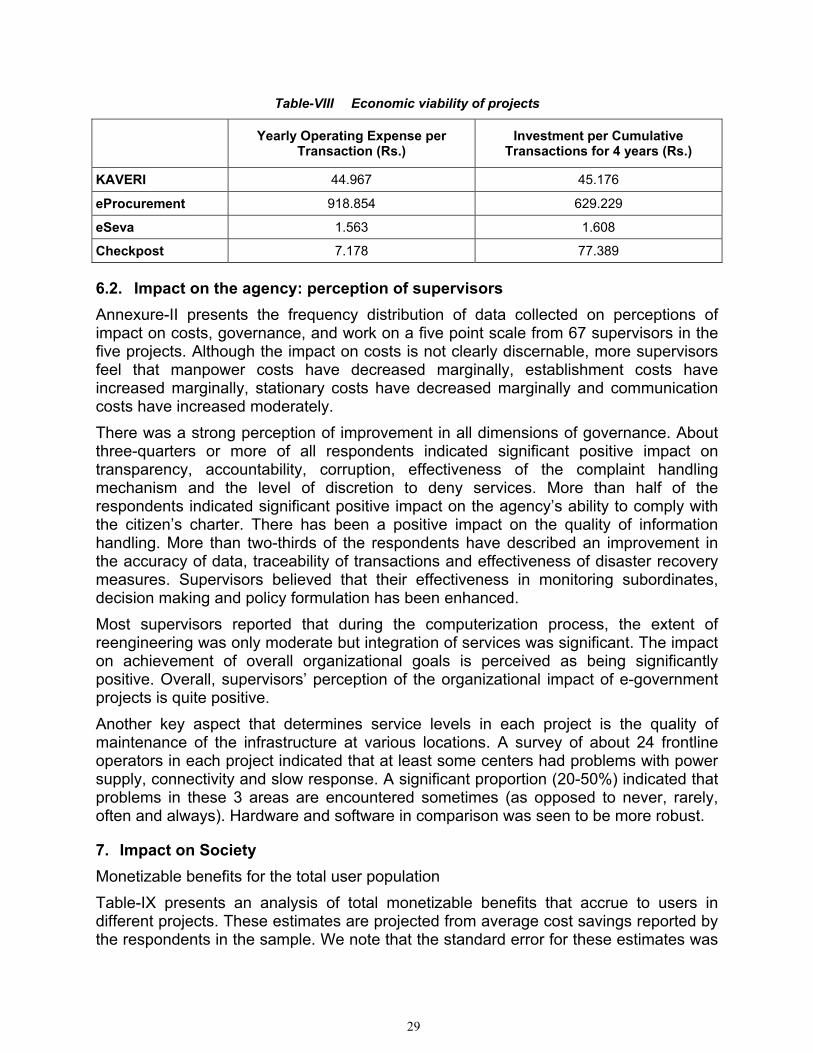
29
Table-VIII Economic viability of projects
Yearly Operating Expense per Transaction (Rs.)
Investment per Cumulative Transactions for 4 years (Rs.)
KAVERI 44.967 45.176
eProcurement 918.854 629.229
eSeva 1.563 1.608
Checkpost 7.178 77.389
6.2. Impact on the agency: perception of supervisors Annexure-II presents the frequency distribution of data collected on perceptions of impact on costs, governance, and work on a five point scale from 67 supervisors in the five projects. Although the impact on costs is not clearly discernable, more supervisors feel that manpower costs have decreased marginally, establishment costs have increased marginally, stationary costs have decreased marginally and communication costs have increased moderately. There was a strong perception of improvement in all dimensions of governance. About three-quarters or more of all respondents indicated significant positive impact on transparency, accountability, corruption, effectiveness of the complaint handling mechanism and the level of discretion to deny services. More than half of the respondents indicated significant positive impact on the agency’s ability to comply with the citizen’s charter. There has been a positive impact on the quality of information handling. More than two-thirds of the respondents have described an improvement in the accuracy of data, traceability of transactions and effectiveness of disaster recovery measures. Supervisors believed that their effectiveness in monitoring subordinates, decision making and policy formulation has been enhanced. Most supervisors reported that during the computerization process, the extent of reengineering was only moderate but integration of services was significant. The impact on achievement of overall organizational goals is perceived as being significantly positive. Overall, supervisors’ perception of the organizational impact of e-government projects is quite positive. Another key aspect that determines service levels in each project is the quality of maintenance of the infrastructure at various locations. A survey of about 24 frontline operators in each project indicated that at least some centers had problems with power supply, connectivity and slow response. A significant proportion (20-50%) indicated that problems in these 3 areas are encountered sometimes (as opposed to never, rarely, often and always). Hardware and software in comparison was seen to be more robust.
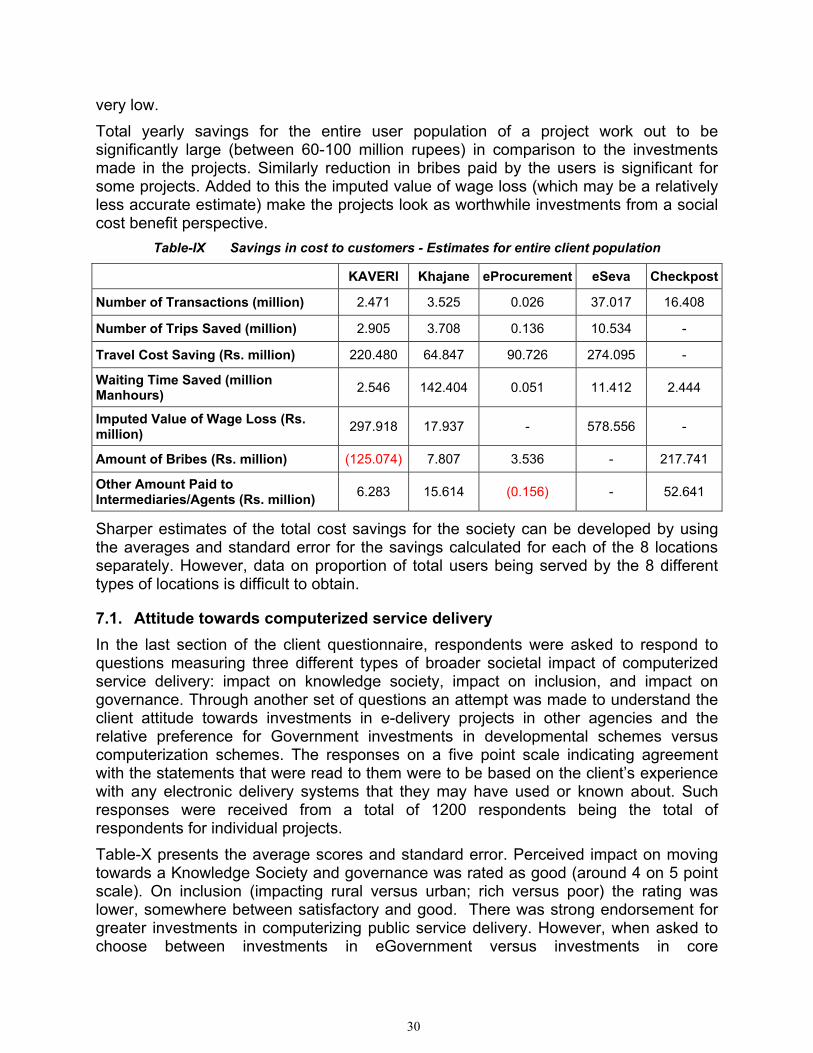
7. Impact on Society Monetizable benefits for the total user population Table-IX presents an analysis of total monetizable benefits that accrue to users in different projects. These estimates are projected from average cost savings reported by the respondents in the sample. We note that the standard error for these estimates was
30
very low. Total yearly savings for the entire user population of a project work out to be significantly large (between 60-100 million rupees) in comparison to the investments made in the projects. Similarly reduction in bribes paid by the users is significant for some projects. Added to this the imputed value of wage loss (which may be a relatively less accurate estimate) make the projects look as worthwhile investments from a social cost benefit perspective.
Table-IX Savings in cost to customers - Estimates for entire client population
KAVERI Khajane eProcurement eSeva Checkpost
Number of Transactions (million) 2.471 3.525 0.026 37.017 16.408
Number of Trips Saved (million) 2.905 3.708 0.136 10.534 -
Travel Cost Saving (Rs. million) 220.480 64.847 90.726 274.095 -
Waiting Time Saved (million Manhours) 2.546 142.404 0.051 11.412 2.444
Imputed Value of Wage Loss (Rs. million) 297.918 17.937 - 578.556 -
Amount of Bribes (Rs. million) (125.074) 7.807 3.536 - 217.741
Other Amount Paid to Intermediaries/Agents (Rs. million) 6.283 15.614 (0.156) - 52.641
Sharper estimates of the total cost savings for the society can be developed by using the averages and standard error for the savings calculated for each of the 8 locations separately. However, data on proportion of total users being served by the 8 different types of locations is difficult to obtain.
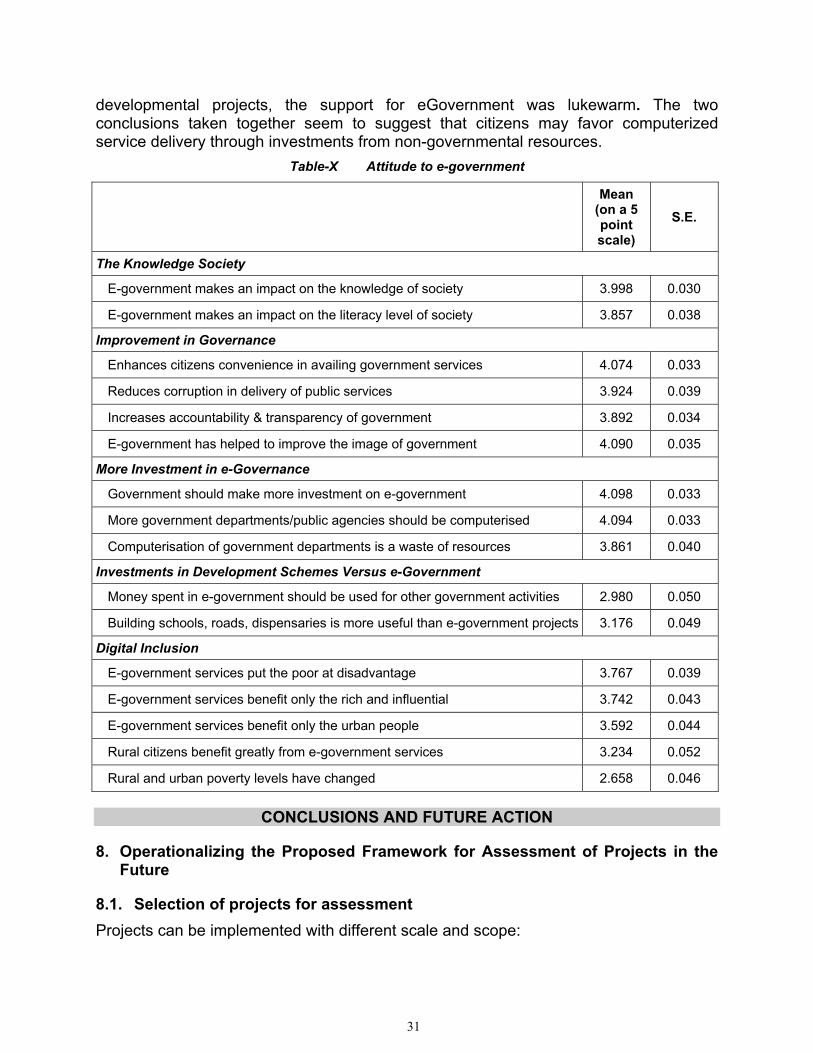
7.1. Attitude towards computerized service delivery In the last section of the client questionnaire, respondents were asked to respond to questions measuring three different types of broader societal impact of computerized service delivery: impact on knowledge society, impact on inclusion, and impact on governance. Through another set of questions an attempt was made to understand the client attitude towards investments in e-delivery projects in other agencies and the relative preference for Government investments in developmental schemes versus computerization schemes. The responses on a five point scale indicating agreement with the statements that were read to them were to be based on the client’s experience with any electronic delivery systems that they may have used or known about. Such responses were received from a total of 1200 respondents being the total of respondents for individual projects. Table-X presents the average scores and standard error. Perceived impact on moving towards a Knowledge Society and governance was rated as good (around 4 on 5 point scale). On inclusion (impacting rural versus urban; rich versus poor) the rating was lower, somewhere between satisfactory and good. There was strong endorsement for greater investments in computerizing public service delivery. However, when asked to choose between investments in eGovernment versus investments in core
31
developmental projects, the support for eGovernment was lukewarm. The two conclusions taken together seem to suggest that citizens may favor computerized service delivery through investments from non-governmental resources.
Table-X Attitude to e-government
Mean (on a 5 point scale)
S.E.
The Knowledge Society
E-government makes an impact on the knowledge of society 3.998 0.030
E-government makes an impact on the literacy level of society 3.857 0.038
Improvement in Governance
Enhances citizens convenience in availing government services 4.074 0.033
Reduces corruption in delivery of public services 3.924 0.039
Increases accountability & transparency of government 3.892 0.034
E-government has helped to improve the image of government 4.090 0.035
More Investment in e-Governance
Government should make more investment on e-government 4.098 0.033
More government departments/public agencies should be computerised 4.094 0.033
Computerisation of government departments is a waste of resources 3.861 0.040
Investments in Development Schemes Versus e-Government
Money spent in e-government should be used for other government activities 2.980 0.050
Building schools, roads, dispensaries is more useful than e-government projects 3.176 0.049
Digital Inclusion
E-government services put the poor at disadvantage 3.767 0.039
E-government services benefit only the rich and influential 3.742 0.043
E-government services benefit only the urban people 3.592 0.044
Rural citizens benefit greatly from e-government services 3.234 0.052
Rural and urban poverty levels have changed 2.658 0.046
CONCLUSIONS AND FUTURE ACTION
8. Operationalizing the Proposed Framework for Assessment of Projects in the Future
8.1. Selection of projects for assessment Projects can be implemented with different scale and scope:
32
1. Country wide by national level agencies such as Income Tax, Excise and Customs, and Department of Company affairs.
2. Statewide by agencies such as Transport Department, Commercial tax department, Registration department,
3. At local level by a district or municipality. Services could be offered to different client segments such as citizens, businesses or intermediaries (chartered accountants, cargo handling agents). The scope of the service could be wide scope or limited such as in filing an online application or may cover the complete process of delivering a service as in processing a bill of entry, ePayment of duty and clearance of goods. An assessment exercise can be useful if the project is stable (i.e. one phase of implementation is complete and operational for a continuous period of time) and has been used for a minimum period of 1-2 years to generate sufficient user experience which can be captured and analyzed. A written document to explain the purpose of the assessment, methodology that will be used and the nature of data to be collected may be required to get the concurrence of the agency to conduct the study. Even though the study may be funded from independent sources, data would need to be collected from the agency. If the agency does not cooperate it will be difficult to assess agency level impact.
8.2. Constructing a project profile Data would need to be collected on project context basic information on the type of clients (users), types of services delivered; mode of delivery; scale of operation; years of operation at current scale, coverage. Study the delivery of services and collect data on number of different types of transactions handled. Identify the key services (based on volume or contribution to fee revenue or taxes) based on inputs from agencies. Identify different stake holders that could be impacted (see section 2) In addition other stake holders could exist.
8.3. Design of data collection instrument There are three basic ways of collecting data from clients: in face to face interviews conducted by trained investigators; surveys conducted over the Internet and focus groups conducted by trained researchers. Choose the modes of data collection depending on access to funds and research assistance. Use professional market research agencies with trained investigators for face to face interviews. Its cost will depend on the time it will take to survey a client, number of locations at which clients have to be surveyed and the number of respondents to be surveyed. The costs could vary between Rs 150 to 500 per respondent depending on the nature of location of respondents and the size and complexity of the instrument. Use the framework to develop a questionnaire for the clients. Customize survey instrument to each project and the specific services being studied. It is meaningful to measure costs in the context of a specific service. Adapt the questionnaire in the local language using colloquial terms. A sample questionnaire is presented in Annexure-V.
33
Following are some useful tips for questionnaire design: • Design the analytical reports prior to the survey. Often key variables can be missed
if the nature of analysis in not thought through prior to the study. • Pre code as many items in the questionnaire as possible. • Use consistent coding for scales - representing high versus low or positive versus
negative perceptions. • Use differently worded questions to measure some key items/ perceptions. • Wording of questions should be appropriate to skill level of interviewer and
educational level of respondent. • There are many ways to elicit responses on perceptions measured on a scale.
Scales can be read out or symbols associated with each point on the scale can be displayed for semi literate users.
8.4. Selection and training of investigators Select a team of investigators. Investigators need to have a higher qualification and experience then is usually required for a social sector survey. Investigators would need to understand the basic steps through which e-delivery of service takes place and also understand terms that are used in measuring governance. It is necessary for the investigators to observe the process of service delivery by visiting a delivery center. The team would usually undergo a training program. Study team should participate in the training of investigators. Unless investigators have clarity on what is being measured through each question, the quality of data would be poor. Many examples would have to be provided to explain meaning of terms such as travel cost, transparency, accountability etc. Pretest the questionnaire with actual users. Feedback from pre-testing of questionnaire should be discussed between study team and investigators. The feedback may include: the length of questionnaire, interpretation of each question and degree of difficulty in collecting sensitive data. Assessing the quality of investigators is a good idea. Training and feedback session can be used to weed out investigators.
8.5. Determining the sample size Develop a sampling frame for data collection through structured survey for clients, employees and supervisors. A stratified sample for sub regions of the total coverage is useful in maintaining precision of estimates. In case of service centers, activity levels (number of users) can influence many parameters of assessment of service quality significantly. Normally, geographical spread of the catchment area, population of the users, and profile of the users would influence cost of access by users. For client surveys, select locations from which sample would be drawn. Stratify the number of service centers according to the above dimensions and select an adequately large number. Determine sample size so that results can be extrapolated to the entire population with a given level of accuracy and degree of confidence. Table-XI provides a rough estimate of sample sizes for different accuracy and level of confidence. Generally a sample of 500-1000 clients may be adequate for assessing impact of a state wide
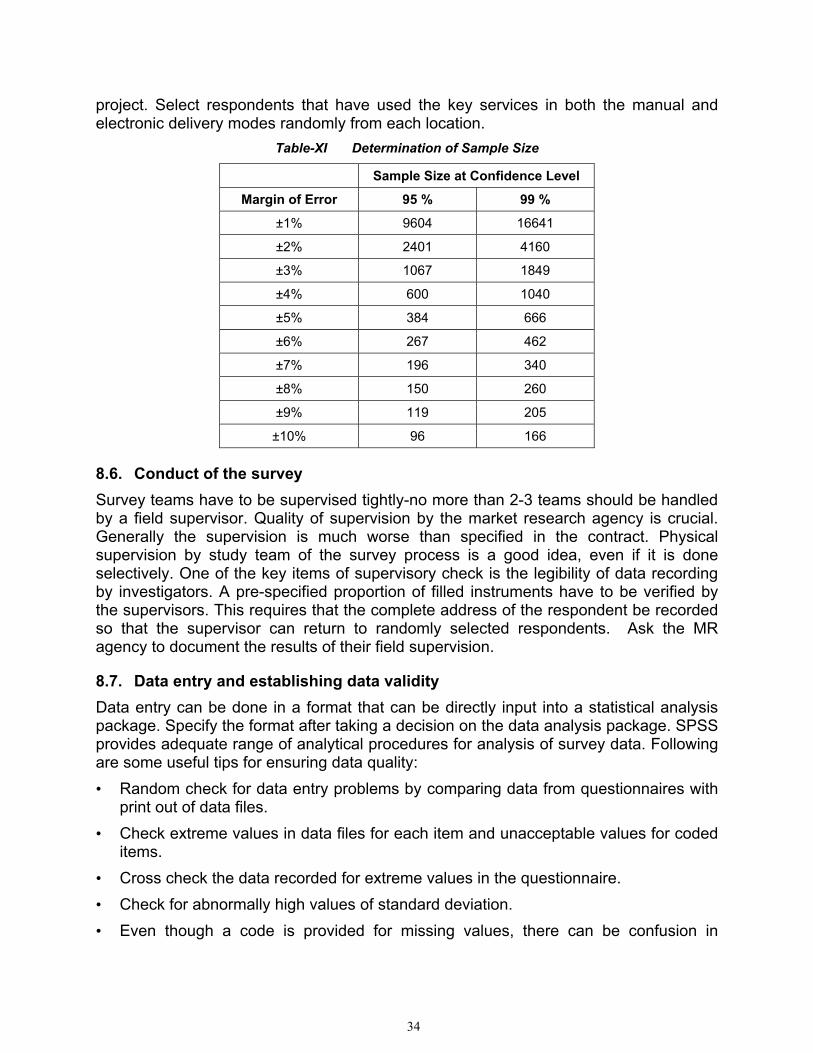
34
project. Select respondents that have used the key services in both the manual and electronic delivery modes randomly from each location.
Table-XI Determination of Sample Size
Sample Size at Confidence Level
Margin of Error 95 % 99 %
±1% 9604 16641
±2% 2401 4160
±3% 1067 1849
±4% 600 1040
±5% 384 666
±6% 267 462
±7% 196 340
±8% 150 260
±9% 119 205
±10% 96 166
8.6. Conduct of the survey Survey teams have to be supervised tightly-no more than 2-3 teams should be handled by a field supervisor. Quality of supervision by the market research agency is crucial. Generally the supervision is much worse than specified in the contract. Physical supervision by study team of the survey process is a good idea, even if it is done selectively. One of the key items of supervisory check is the legibility of data recording by investigators. A pre-specified proportion of filled instruments have to be verified by the supervisors. This requires that the complete address of the respondent be recorded so that the supervisor can return to randomly selected respondents. Ask the MR agency to document the results of their field supervision.
8.7. Data entry and establishing data validity Data entry can be done in a format that can be directly input into a statistical analysis package. Specify the format after taking a decision on the data analysis package. SPSS provides adequate range of analytical procedures for analysis of survey data. Following are some useful tips for ensuring data quality: • Random check for data entry problems by comparing data from questionnaires with
print out of data files. • Check extreme values in data files for each item and unacceptable values for coded
items. • Cross check the data recorded for extreme values in the questionnaire. • Check for abnormally high values of standard deviation. • Even though a code is provided for missing values, there can be confusion in
35
missing values and a legitimate value of zero. • Look for logical connections between variables such as travel mode and travel time;
bribe paid and corruption. • Poor data quality can often be traced to specific investigators or locations. • Complete data validity checks before embarking on analysis
8.8. Challenges that were faced in data collection and analysis • For the assessment of manual system, respondents need to rely on memory. In
case of systems that have been operational for a large number of years, such recall can introduce an error. There has been no benchmarking of the service delivery in a manual system prior to implementing a new computerized system-something that needs to be done for new projects that are taken up in the future.
• The fact that there are no established reporting standards for public agencies to put out even basic operating data in the public domain makes it difficult to collect operational data. Also public agencies are wary of evaluation and therefore it is difficult to gather data.
• Different bench marks can be used for evaluation-improvement over manual system, absolute rating of computerized system (can be a moving target), or potential impact that could have been delivered.
• The effort required for assessment of a project tends to be under estimated. There are many issues in measuring what we purport to measure: design of questions, training, pre testing, field checks, and data triangulation.
9. Summary of Key Findings on Impact of Projects for E-delivery of Services to Citizens
Respondents who have used both the manual and computerized systems in the five agencies where impact was assessed have indicated an overwhelming preference for the computerized service delivery. Their preference is backed with specific areas where concrete benefits have accrued to them. In most cases the cost of accessing service has been reduced because the number of trips that needed to be made to the concerned offices has been reduced significantly and the waiting times have come down by nearly fifty percent. Quality of service delivery and quality of governance were also perceived to have improved with computerization. Although, in reducing corruption the outcome is mixed, eGovernment seems to have the potential for significant reduction in corruption in service delivery, as has been shown by a few projects. Citizens strongly support the idea that more agencies to be computerized but not necessarily through Government investments. When asked to choose between investments in eGovernment versus investments in core developmental projects, the support was very lukewarm. Operating costs and investment per transaction in most of the projects are less than the direct cost reduction reported by the clients. Therefore it should be possible to charge a user fee that will cover the costs and make the applications economically viable. Given the fact that many
36
projects can become self sustaining through revenues from user fee indicates that private sector investment can be tapped. Four of the five projects have private partners and the expansion of one of the four in rural areas is also being planned through private partnership. A significant negative aspect is the observed variability of impact across different service centers of a project. This variability is a cause of concern for delivery models in which physical service centers are created. It is often difficult to match the capacity to the demand at each of these centers. Portal based delivery accessed via the Internet can be a solution. However, unequal access to Internet will put some users to disadvantage in such systems. In terms of the impact on agencies, in all cases the ability to cope with growth in transactions was enhanced. In some cases, computerization helped in the growth of transactions. Computerization was partially responsible for improved tax collections by some agencies. The staff in these agencies did not perceive that cost had been reduced. However, the staff felt that on quality of governance there was a significant positive impact. Small improvements in efficiency can trigger major positive change in perception about overall quality of service delivery systems. The approach of assessing impact on different stakeholders, using multiple dimensions and a mix of direct and indirect measurements stands validated. Projects do well on some dimensions and poorly on others. It is possible to validate the assessment through triangulation of various results. The methodology produces an assessment which enables a ranking of projects according to degree of overall perceived impact. This can be equated to a measure of success. The approach enables an assessment of project viability in terms of cost and benefits - both directly measurable and monetizable, and indirect and qualitative. The analysis can provide a basis for go-no-go decisions in initiating projects. The results from 5 projects provide a bench mark for comparing other projects that are existent and those that will be implemented. Bench marks can also be set for targeting benefits from individual projects.
10. Limitations of the Study The study was exploratory in nature. It was carried out with very limited resources. The study used a sample size that was considered relatively small (and barely adequate) at the stage of planning the field work. While the difference between manual and computerized systems on all the performance indicators are found to be statistically significant (in most cases at a confidence level of 99 percent), the accuracy of the actual estimate of the difference in direct costs could be improved by the use of larger samples. A larger sample size in subsequent studies would also permit analysis of disaggregated data at the level of each service location or for different types of clients. The conclusions on impact on agency are not as robust as those for impact on citizens because time series data on different types of costs and revenue streams related to the service being investigated could not be collected for sufficient time periods for most of the projects. The overall positive assessment of projects should be seen in the context of the five
37
projects that were selected for assessment. These were mature projects, with wide reach and scope of activity. The fact that these projects have operated for at least three or more years implies successful implementation. Nearly all the projects are serving urban clients. Projects that serve rural clients could have a very different cost structure and demand pattern. It would be hasty to generalize the overall conclusions of positive impact and economic viability of electronic service delivery projects from this study to all eGovernment projects in India. More projects need to be evaluated from a larger sample to generalize the conclusions. The primary objective of this study was to measure the impact of computerization in selected service delivery projects. Further studies need to be undertaken to explain the variation in impact on various dimensions; difference across projects; and difference across locations for a project. Studies could also be undertaken to understand the effectiveness of different delivery models and implementation modalities such as the use of public private partnerships. More data (quantitative as well as qualitative) will need to be collected from the agencies to undertake such studies. All the projects had discontinued manual delivery of service and had mandated the use of the computerized systems for the citizens. For the assessment of manual system, respondents needed to rely on memory. In case of systems that have been operational for a large number of years, such recall can introduce an error. There has been no benchmarking of the service delivery in a manual system prior to implementing a new computerized system-something that needs to be done for new projects that are taken up in the future. Other forms of counterfactuals such as a user group from an adjoining state could be used to avoid the problem of recall. However, use of a different context could result in other types of biases.
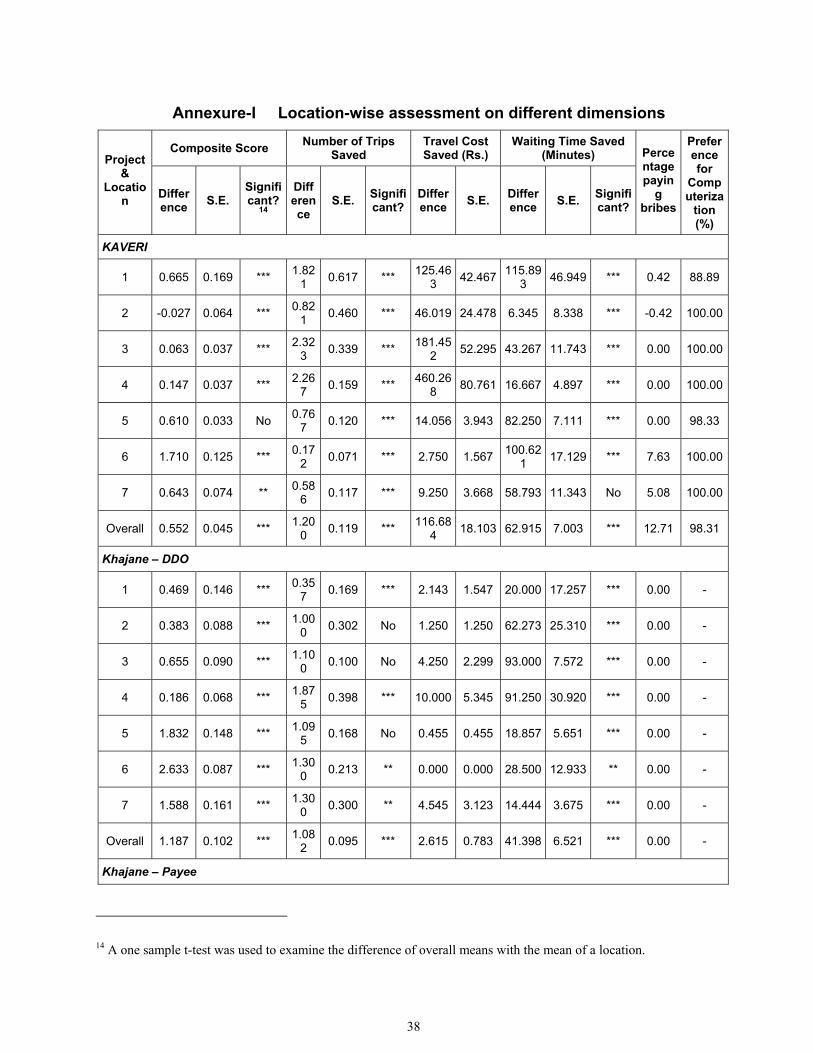
38
Annexure-I Location-wise assessment on different dimensions
Composite Score Number of Trips Saved
Travel Cost Saved (Rs.)
Waiting Time Saved (Minutes) Project
& Locatio
n Difference S.E.
Significant?
14
Difference
S.E. Significant?
Difference S.E. Differ
ence S.E. Significant?
Percentage payin
g bribes
Preference for
Computeriza
tion (%)
KAVERI
1 0.665 0.169 *** 1.821 0.617 *** 125.46
3 42.467 115.893 46.949 *** 0.42 88.89
2 -0.027 0.064 *** 0.821 0.460 *** 46.019 24.478 6.345 8.338 *** -0.42 100.00
3 0.063 0.037 *** 2.323 0.339 *** 181.45
2 52.295 43.267 11.743 *** 0.00 100.00
4 0.147 0.037 *** 2.267 0.159 *** 460.26
8 80.761 16.667 4.897 *** 0.00 100.00
5 0.610 0.033 No 0.767 0.120 *** 14.056 3.943 82.250 7.111 *** 0.00 98.33
6 1.710 0.125 *** 0.172 0.071 *** 2.750 1.567 100.62
1 17.129 *** 7.63 100.00
7 0.643 0.074 ** 0.586 0.117 *** 9.250 3.668 58.793 11.343 No 5.08 100.00
Overall 0.552 0.045 *** 1.200 0.119 *** 116.68
4 18.103 62.915 7.003 *** 12.71 98.31
Khajane – DDO
1 0.469 0.146 *** 0.357 0.169 *** 2.143 1.547 20.000 17.257 *** 0.00 -
2 0.383 0.088 *** 1.000 0.302 No 1.250 1.250 62.273 25.310 *** 0.00 -
3 0.655 0.090 *** 1.100 0.100 No 4.250 2.299 93.000 7.572 *** 0.00 -
4 0.186 0.068 *** 1.875 0.398 *** 10.000 5.345 91.250 30.920 *** 0.00 -
5 1.832 0.148 *** 1.095 0.168 No 0.455 0.455 18.857 5.651 *** 0.00 -
6 2.633 0.087 *** 1.300 0.213 ** 0.000 0.000 28.500 12.933 ** 0.00 -
7 1.588 0.161 *** 1.300 0.300 ** 4.545 3.123 14.444 3.675 *** 0.00 -
Overall 1.187 0.102 *** 1.082 0.095 *** 2.615 0.783 41.398 6.521 *** 0.00 -
Khajane – Payee
14 A one sample t-test was used to examine the difference of overall means with the mean of a location.
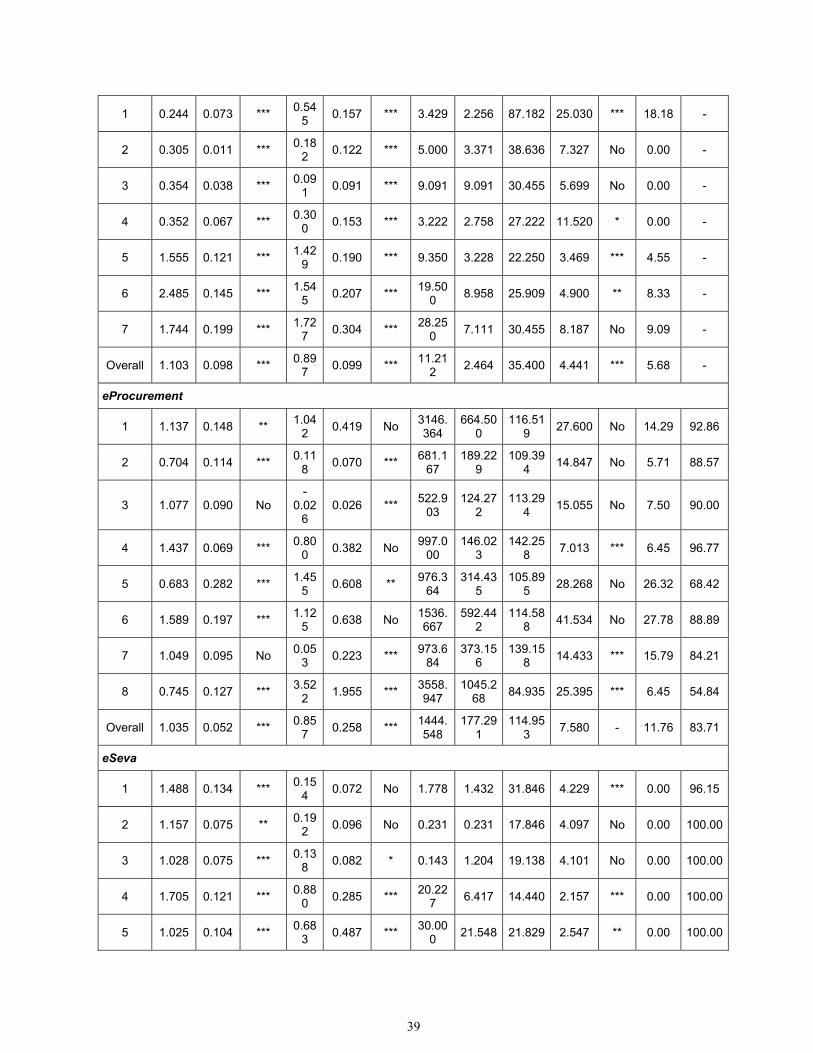
39
1 0.244 0.073 *** 0.545 0.157 *** 3.429 2.256 87.182 25.030 *** 18.18 -
2 0.305 0.011 *** 0.182 0.122 *** 5.000 3.371 38.636 7.327 No 0.00 -
3 0.354 0.038 *** 0.091 0.091 *** 9.091 9.091 30.455 5.699 No 0.00 -
4 0.352 0.067 *** 0.300 0.153 *** 3.222 2.758 27.222 11.520 * 0.00 -
5 1.555 0.121 *** 1.429 0.190 *** 9.350 3.228 22.250 3.469 *** 4.55 -
6 2.485 0.145 *** 1.545 0.207 *** 19.50
0 8.958 25.909 4.900 ** 8.33 -
7 1.744 0.199 *** 1.727 0.304 *** 28.25
0 7.111 30.455 8.187 No 9.09 -
Overall 1.103 0.098 *** 0.897 0.099 *** 11.21
2 2.464 35.400 4.441 *** 5.68 -
eProcurement
1 1.137 0.148 ** 1.042 0.419 No 3146.
364 664.50
0 116.51
9 27.600 No 14.29 92.86
2 0.704 0.114 *** 0.118 0.070 *** 681.1
67 189.22
9 109.39
4 14.847 No 5.71 88.57
3 1.077 0.090 No -
0.026
0.026 *** 522.903
124.272
113.294 15.055 No 7.50 90.00
4 1.437 0.069 *** 0.800 0.382 No 997.0
00 146.02
3 142.25
8 7.013 *** 6.45 96.77
5 0.683 0.282 *** 1.455 0.608 ** 976.3
64 314.43
5 105.89
5 28.268 No 26.32 68.42
6 1.589 0.197 *** 1.125 0.638 No 1536.
667 592.44
2 114.58
8 41.534 No 27.78 88.89
7 1.049 0.095 No 0.053 0.223 *** 973.6
84 373.15
6 139.15
8 14.433 *** 15.79 84.21
8 0.745 0.127 *** 3.522 1.955 *** 3558.
947 1045.2
68 84.935 25.395 *** 6.45 54.84
Overall 1.035 0.052 *** 0.857 0.258 *** 1444.
548 177.29
1 114.95
3 7.580 - 11.76 83.71
eSeva
1 1.488 0.134 *** 0.154 0.072 No 1.778 1.432 31.846 4.229 *** 0.00 96.15
2 1.157 0.075 ** 0.192 0.096 No 0.231 0.231 17.846 4.097 No 0.00 100.00
3 1.028 0.075 *** 0.138 0.082 * 0.143 1.204 19.138 4.101 No 0.00 100.00
4 1.705 0.121 *** 0.880 0.285 *** 20.22
7 6.417 14.440 2.157 *** 0.00 100.00
5 1.025 0.104 *** 0.683 0.487 *** 30.00
0 21.548 21.829 2.547 ** 0.00 100.00
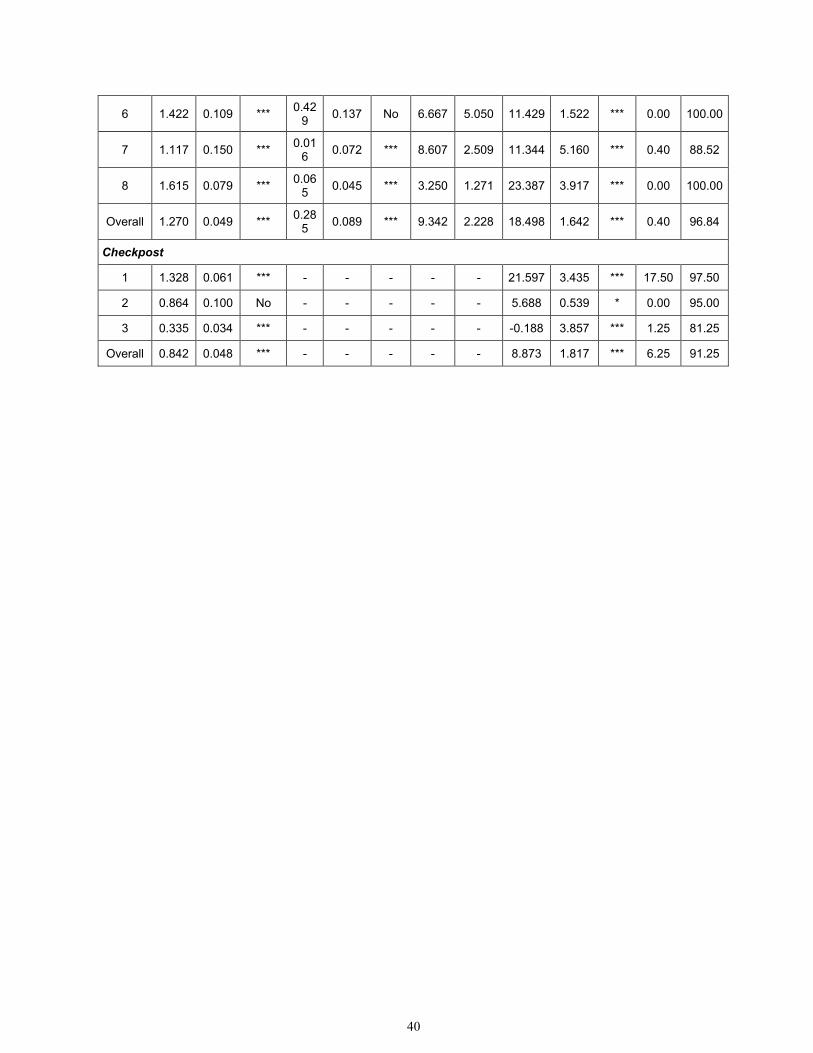
40
6 1.422 0.109 *** 0.429 0.137 No 6.667 5.050 11.429 1.522 *** 0.00 100.00
7 1.117 0.150 *** 0.016 0.072 *** 8.607 2.509 11.344 5.160 *** 0.40 88.52
8 1.615 0.079 *** 0.065 0.045 *** 3.250 1.271 23.387 3.917 *** 0.00 100.00
Overall 1.270 0.049 *** 0.285 0.089 *** 9.342 2.228 18.498 1.642 *** 0.40 96.84
Checkpost
1 1.328 0.061 *** - - - - - 21.597 3.435 *** 17.50 97.50
2 0.864 0.100 No - - - - - 5.688 0.539 * 0.00 95.00
3 0.335 0.034 *** - - - - - -0.188 3.857 *** 1.25 81.25
Overall 0.842 0.048 *** - - - - - 8.873 1.817 *** 6.25 91.25
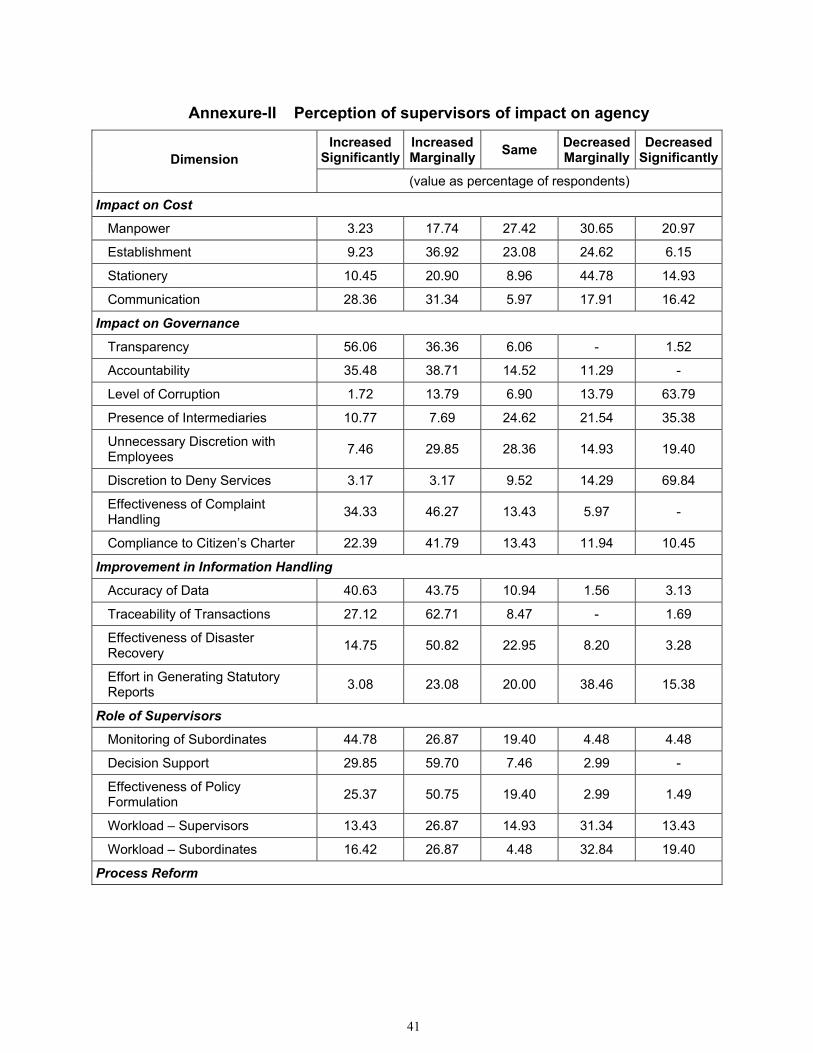
41
Annexure-II Perception of supervisors of impact on agency
Increased Significantly
Increased Marginally Same Decreased
Marginally Decreased
SignificantlyDimension (value as percentage of respondents)
Impact on Cost
Manpower 3.23 17.74 27.42 30.65 20.97
Establishment 9.23 36.92 23.08 24.62 6.15
Stationery 10.45 20.90 8.96 44.78 14.93
Communication 28.36 31.34 5.97 17.91 16.42
Impact on Governance
Transparency 56.06 36.36 6.06 - 1.52
Accountability 35.48 38.71 14.52 11.29 -
Level of Corruption 1.72 13.79 6.90 13.79 63.79
Presence of Intermediaries 10.77 7.69 24.62 21.54 35.38
Unnecessary Discretion with Employees 7.46 29.85 28.36 14.93 19.40
Discretion to Deny Services 3.17 3.17 9.52 14.29 69.84
Effectiveness of Complaint Handling 34.33 46.27 13.43 5.97 -
Compliance to Citizen’s Charter 22.39 41.79 13.43 11.94 10.45
Improvement in Information Handling
Accuracy of Data 40.63 43.75 10.94 1.56 3.13
Traceability of Transactions 27.12 62.71 8.47 - 1.69
Effectiveness of Disaster Recovery 14.75 50.82 22.95 8.20 3.28
Effort in Generating Statutory Reports 3.08 23.08 20.00 38.46 15.38
Role of Supervisors
Monitoring of Subordinates 44.78 26.87 19.40 4.48 4.48
Decision Support 29.85 59.70 7.46 2.99 -
Effectiveness of Policy Formulation 25.37 50.75 19.40 2.99 1.49
Workload – Supervisors 13.43 26.87 14.93 31.34 13.43
Workload – Subordinates 16.42 26.87 4.48 32.84 19.40
Process Reform
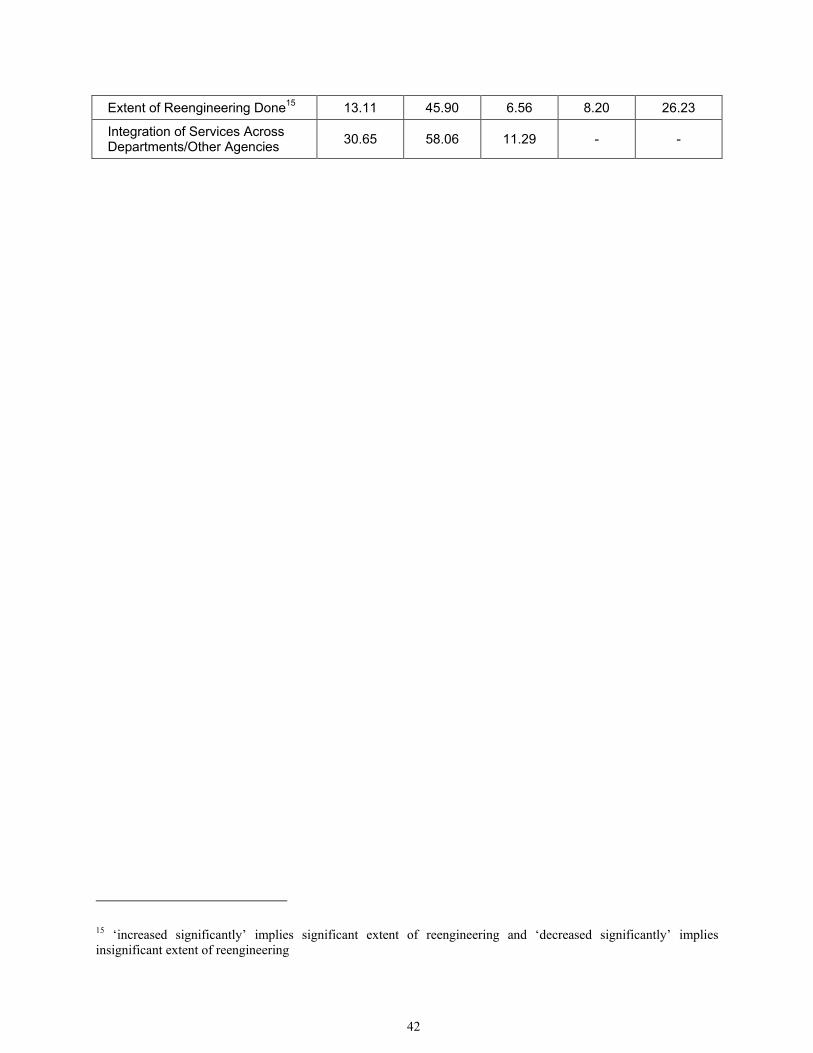
42
Extent of Reengineering Done15 13.11 45.90 6.56 8.20 26.23
Integration of Services Across Departments/Other Agencies 30.65 58.06 11.29 - -
15 ‘increased significantly’ implies significant extent of reengineering and ‘decreased significantly’ implies insignificant extent of reengineering
43
Annexure-III Fact sheets on projects This Annexure contains fact sheets on each of the 5 projects for which a detailed study has been done. Each fact sheet provides details of the following: I. Sector II. Targeted beneficiaries III. Project implementation start date IV. Electronic service delivery launch date V. Duration for which project has been delivering services VI. Major services offered through the project VII. Different channels through which service is delivered VIII. Service usage pattern of clients IX. Impact on client X. Data collected from agencies
X.1. Total investment in project X.2. Sources of funds X.3. Annual operating expenses
XI. Impact on agency XI.1. Economic viability of project XI.2. Frequency of system breakdown and duration for recovery
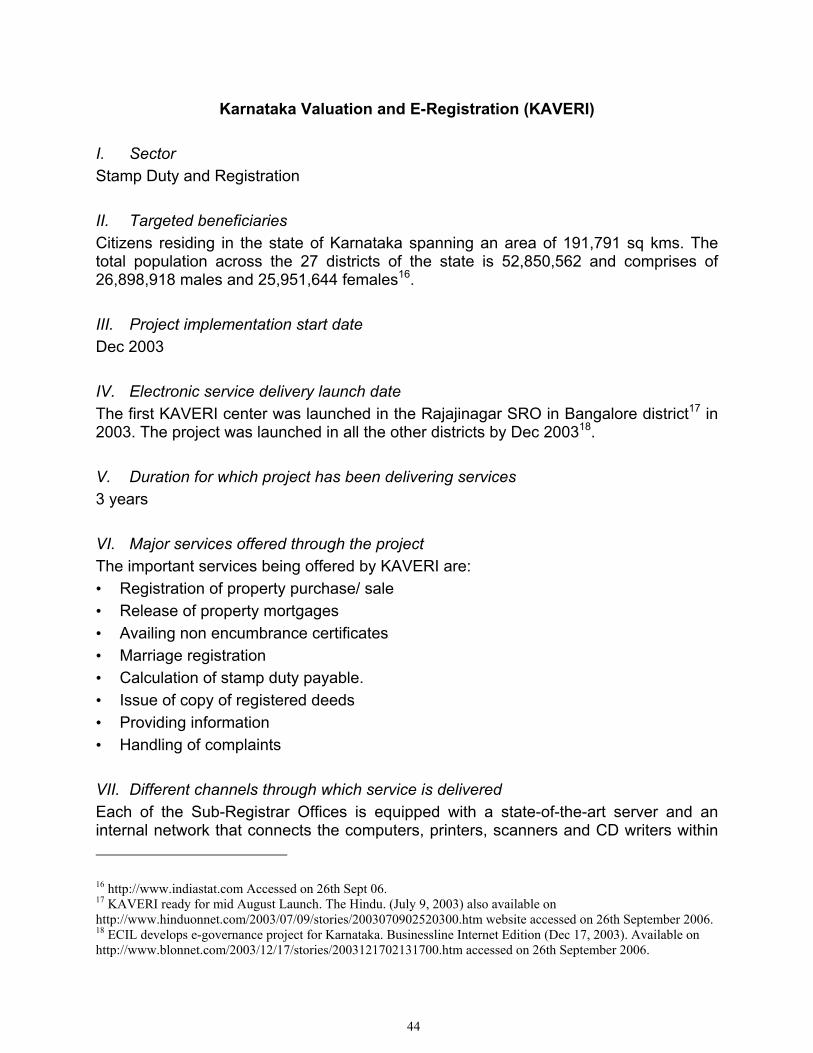
44
Karnataka Valuation and E-Registration (KAVERI) I. Sector Stamp Duty and Registration II. Targeted beneficiaries Citizens residing in the state of Karnataka spanning an area of 191,791 sq kms. The total population across the 27 districts of the state is 52,850,562 and comprises of 26,898,918 males and 25,951,644 females16. III. Project implementation start date Dec 2003 IV. Electronic service delivery launch date The first KAVERI center was launched in the Rajajinagar SRO in Bangalore district17 in 2003. The project was launched in all the other districts by Dec 200318. V. Duration for which project has been delivering services 3 years VI. Major services offered through the project The important services being offered by KAVERI are: • Registration of property purchase/ sale • Release of property mortgages • Availing non encumbrance certificates • Marriage registration • Calculation of stamp duty payable. • Issue of copy of registered deeds • Providing information • Handling of complaints VII. Different channels through which service is delivered Each of the Sub-Registrar Offices is equipped with a state-of-the-art server and an internal network that connects the computers, printers, scanners and CD writers within 16 http://www.indiastat.com Accessed on 26th Sept 06. 17 KAVERI ready for mid August Launch. The Hindu. (July 9, 2003) also available on http://www.hinduonnet.com/2003/07/09/stories/2003070902520300.htm website accessed on 26th September 2006. 18 ECIL develops e-governance project for Karnataka. Businessline Internet Edition (Dec 17, 2003). Available on http://www.blonnet.com/2003/12/17/stories/2003121702131700.htm accessed on 26th September 2006.
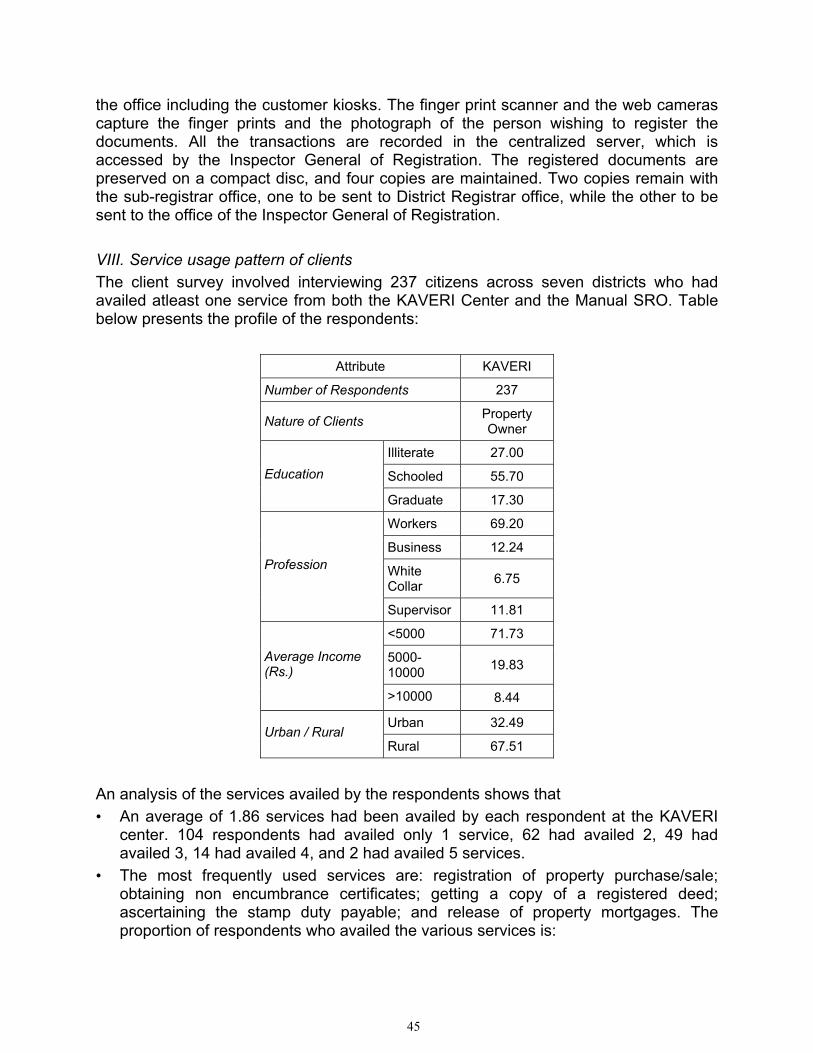
45
the office including the customer kiosks. The finger print scanner and the web cameras capture the finger prints and the photograph of the person wishing to register the documents. All the transactions are recorded in the centralized server, which is accessed by the Inspector General of Registration. The registered documents are preserved on a compact disc, and four copies are maintained. Two copies remain with the sub-registrar office, one to be sent to District Registrar office, while the other to be sent to the office of the Inspector General of Registration. VIII. Service usage pattern of clients The client survey involved interviewing 237 citizens across seven districts who had availed atleast one service from both the KAVERI Center and the Manual SRO. Table below presents the profile of the respondents:
Attribute KAVERI
Number of Respondents 237
Nature of Clients Property Owner
Illiterate 27.00
Schooled 55.70 Education
Graduate 17.30
Workers 69.20
Business 12.24
White Collar 6.75
Profession
Supervisor 11.81
<5000 71.73
5000-10000 19.83 Average Income
(Rs.)
>10000 8.44
Urban 32.49 Urban / Rural
Rural 67.51
An analysis of the services availed by the respondents shows that • An average of 1.86 services had been availed by each respondent at the KAVERI
center. 104 respondents had availed only 1 service, 62 had availed 2, 49 had availed 3, 14 had availed 4, and 2 had availed 5 services.
• The most frequently used services are: registration of property purchase/sale; obtaining non encumbrance certificates; getting a copy of a registered deed; ascertaining the stamp duty payable; and release of property mortgages. The proportion of respondents who availed the various services is:
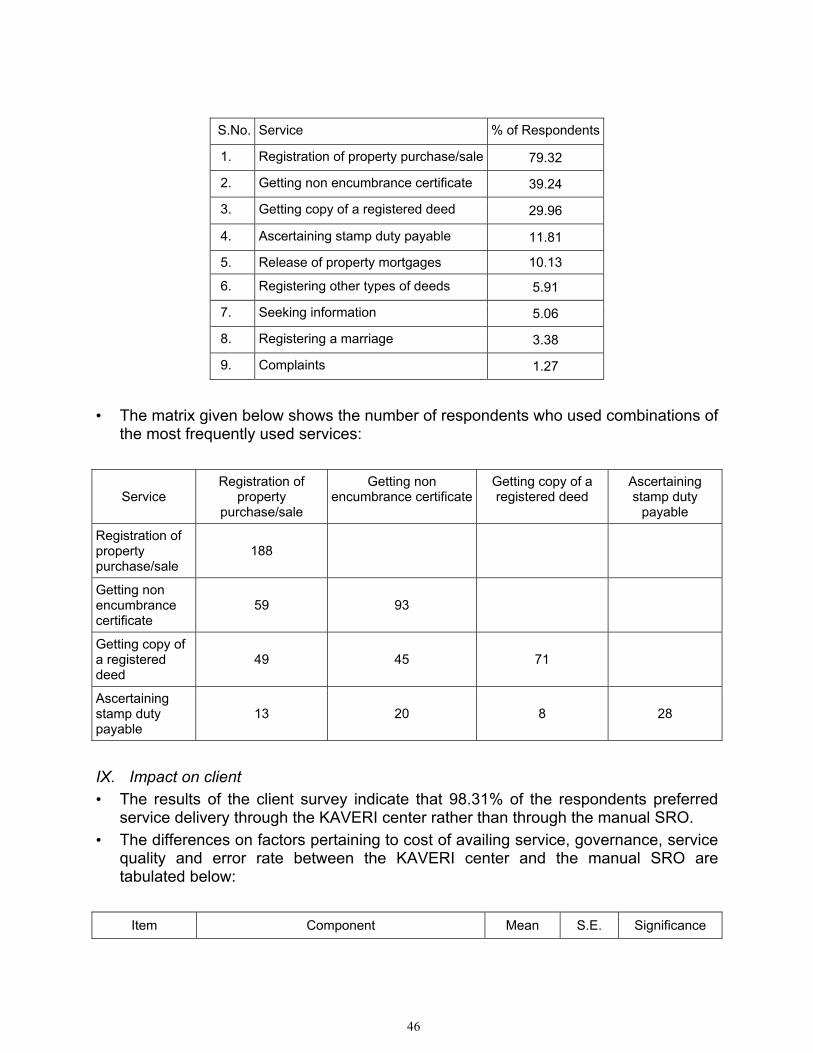
46
S.No. Service % of Respondents
1. Registration of property purchase/sale 79.32
2. Getting non encumbrance certificate 39.24
3. Getting copy of a registered deed 29.96
4. Ascertaining stamp duty payable 11.81
5. Release of property mortgages 10.13
6. Registering other types of deeds 5.91
7. Seeking information 5.06
8. Registering a marriage 3.38
9. Complaints 1.27
• The matrix given below shows the number of respondents who used combinations of
the most frequently used services:
Service Registration of
property purchase/sale
Getting non encumbrance certificate
Getting copy of a registered deed
Ascertaining stamp duty
payable
Registration of property purchase/sale
188
Getting non encumbrance certificate
59 93
Getting copy of a registered deed
49 45 71
Ascertaining stamp duty payable
13 20 8 28
IX. Impact on client • The results of the client survey indicate that 98.31% of the respondents preferred
service delivery through the KAVERI center rather than through the manual SRO. • The differences on factors pertaining to cost of availing service, governance, service
quality and error rate between the KAVERI center and the manual SRO are tabulated below:
Item Component Mean S.E. Significance
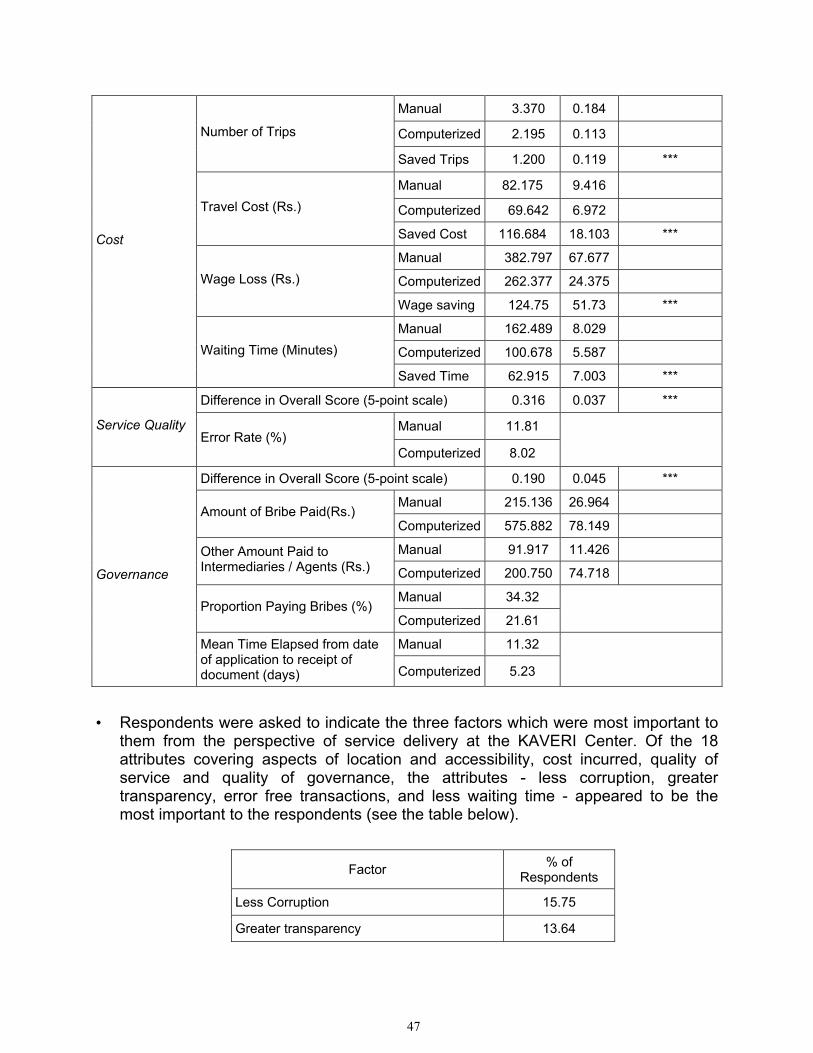
47
Manual 3.370 0.184
Computerized 2.195 0.113 Number of Trips
Saved Trips 1.200 0.119 ***
Manual 82.175 9.416
Computerized 69.642 6.972 Travel Cost (Rs.)
Saved Cost 116.684 18.103 ***
Manual 382.797 67.677
Computerized 262.377 24.375 Wage Loss (Rs.)
Wage saving 124.75 51.73 ***
Manual 162.489 8.029
Computerized 100.678 5.587
Cost
Waiting Time (Minutes)
Saved Time 62.915 7.003 ***
Difference in Overall Score (5-point scale) 0.316 0.037 ***
Manual 11.81 Service Quality Error Rate (%)
Computerized 8.02
Difference in Overall Score (5-point scale) 0.190 0.045 ***
Manual 215.136 26.964 Amount of Bribe Paid(Rs.)
Computerized 575.882 78.149
Manual 91.917 11.426 Other Amount Paid to Intermediaries / Agents (Rs.) Computerized 200.750 74.718
Manual 34.32 Proportion Paying Bribes (%)
Computerized 21.61
Manual 11.32
Governance
Mean Time Elapsed from date of application to receipt of document (days) Computerized 5.23
• Respondents were asked to indicate the three factors which were most important to
them from the perspective of service delivery at the KAVERI Center. Of the 18 attributes covering aspects of location and accessibility, cost incurred, quality of service and quality of governance, the attributes - less corruption, greater transparency, error free transactions, and less waiting time - appeared to be the most important to the respondents (see the table below).
Factor % of Respondents
Less Corruption 15.75
Greater transparency 13.64
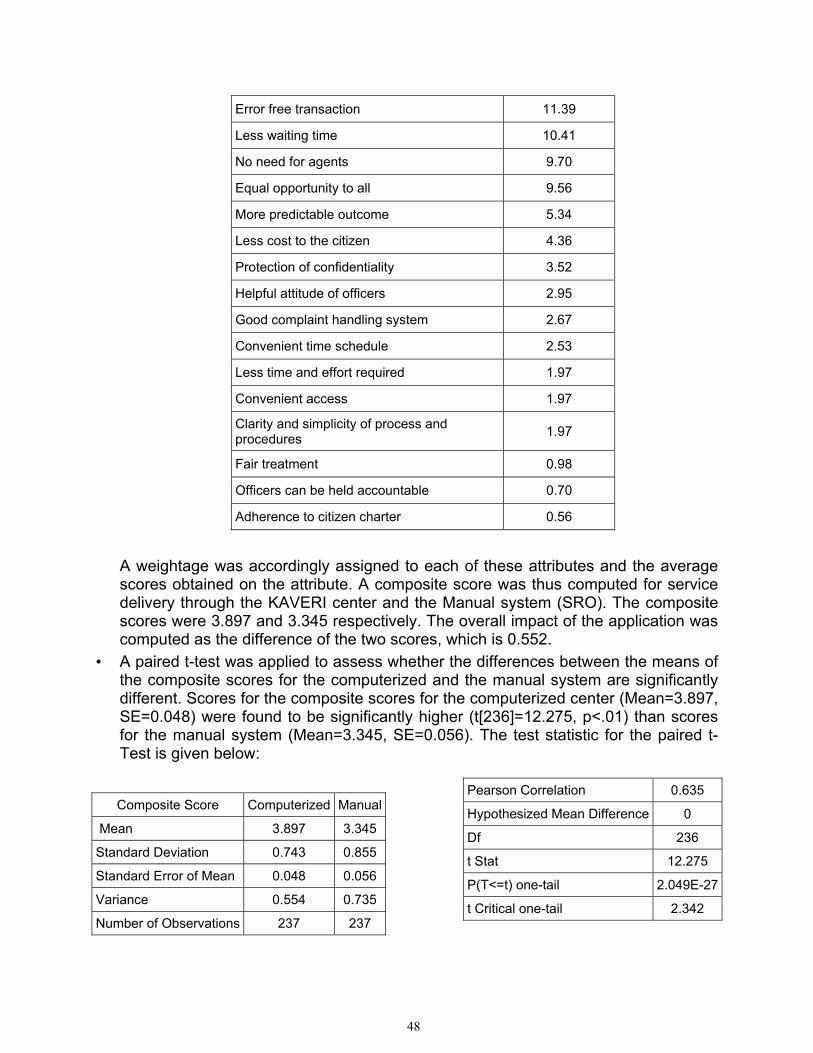
48
Error free transaction 11.39
Less waiting time 10.41
No need for agents 9.70
Equal opportunity to all 9.56
More predictable outcome 5.34
Less cost to the citizen 4.36
Protection of confidentiality 3.52
Helpful attitude of officers 2.95
Good complaint handling system 2.67
Convenient time schedule 2.53
Less time and effort required 1.97
Convenient access 1.97
Clarity and simplicity of process and procedures 1.97
Fair treatment 0.98
Officers can be held accountable 0.70
Adherence to citizen charter 0.56
A weightage was accordingly assigned to each of these attributes and the average scores obtained on the attribute. A composite score was thus computed for service delivery through the KAVERI center and the Manual system (SRO). The composite scores were 3.897 and 3.345 respectively. The overall impact of the application was computed as the difference of the two scores, which is 0.552.
• A paired t-test was applied to assess whether the differences between the means of the composite scores for the computerized and the manual system are significantly different. Scores for the composite scores for the computerized center (Mean=3.897, SE=0.048) were found to be significantly higher (t[236]=12.275, p<.01) than scores for the manual system (Mean=3.345, SE=0.056). The test statistic for the paired t-Test is given below:
Composite Score Computerized Manual
Mean 3.897 3.345
Standard Deviation 0.743 0.855
Standard Error of Mean 0.048 0.056
Variance 0.554 0.735
Number of Observations 237 237
Pearson Correlation 0.635
Hypothesized Mean Difference 0
Df 236
t Stat 12.275
P(T<=t) one-tail 2.049E-27
t Critical one-tail 2.342
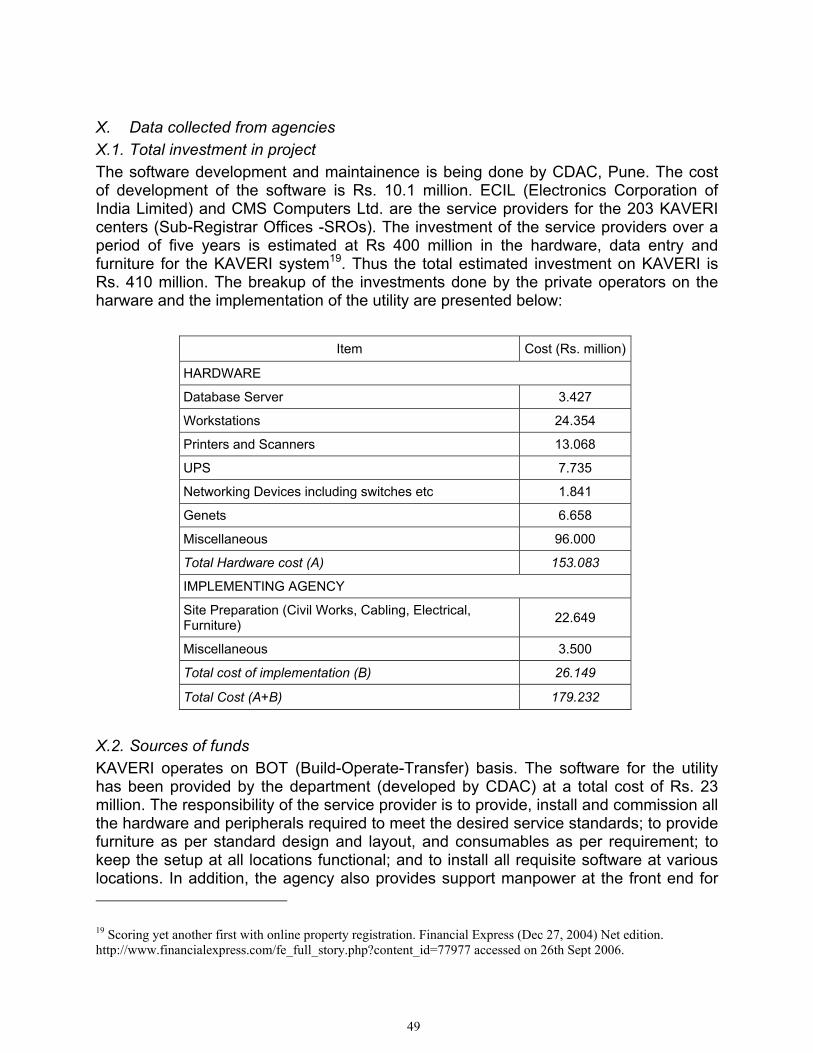
49
X. Data collected from agencies X.1. Total investment in project The software development and maintainence is being done by CDAC, Pune. The cost of development of the software is Rs. 10.1 million. ECIL (Electronics Corporation of India Limited) and CMS Computers Ltd. are the service providers for the 203 KAVERI centers (Sub-Registrar Offices -SROs). The investment of the service providers over a period of five years is estimated at Rs 400 million in the hardware, data entry and furniture for the KAVERI system19. Thus the total estimated investment on KAVERI is Rs. 410 million. The breakup of the investments done by the private operators on the harware and the implementation of the utility are presented below:
Item Cost (Rs. million)
HARDWARE
Database Server 3.427
Workstations 24.354
Printers and Scanners 13.068
UPS 7.735
Networking Devices including switches etc 1.841
Genets 6.658
Miscellaneous 96.000
Total Hardware cost (A) 153.083
IMPLEMENTING AGENCY
Site Preparation (Civil Works, Cabling, Electrical, Furniture) 22.649
Miscellaneous 3.500
Total cost of implementation (B) 26.149
Total Cost (A+B) 179.232
X.2. Sources of funds KAVERI operates on BOT (Build-Operate-Transfer) basis. The software for the utility has been provided by the department (developed by CDAC) at a total cost of Rs. 23 million. The responsibility of the service provider is to provide, install and commission all the hardware and peripherals required to meet the desired service standards; to provide furniture as per standard design and layout, and consumables as per requirement; to keep the setup at all locations functional; and to install all requisite software at various locations. In addition, the agency also provides support manpower at the front end for 19 Scoring yet another first with online property registration. Financial Express (Dec 27, 2004) Net edition. http://www.financialexpress.com/fe_full_story.php?content_id=77977 accessed on 26th Sept 2006.
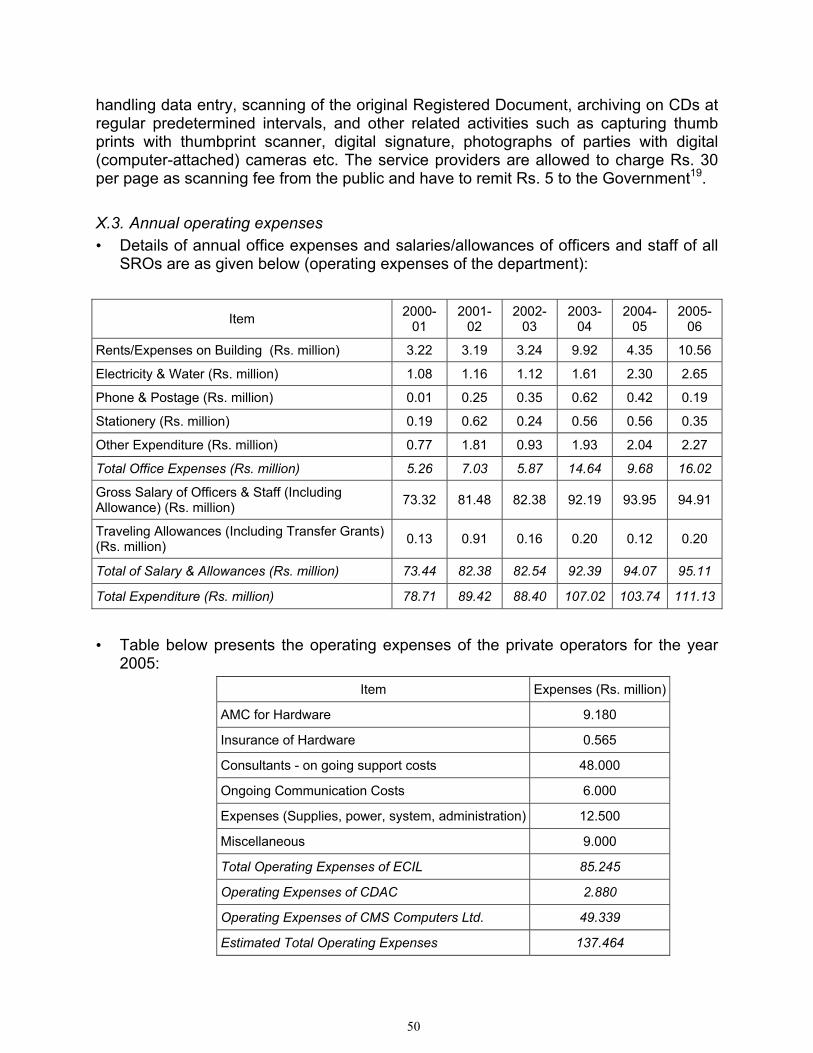
50
handling data entry, scanning of the original Registered Document, archiving on CDs at regular predetermined intervals, and other related activities such as capturing thumb prints with thumbprint scanner, digital signature, photographs of parties with digital (computer-attached) cameras etc. The service providers are allowed to charge Rs. 30 per page as scanning fee from the public and have to remit Rs. 5 to the Government19. X.3. Annual operating expenses • Details of annual office expenses and salaries/allowances of officers and staff of all
SROs are as given below (operating expenses of the department):
Item 2000-01
2001-02
2002-03
2003-04
2004-05
2005-06
Rents/Expenses on Building (Rs. million) 3.22 3.19 3.24 9.92 4.35 10.56
Electricity & Water (Rs. million) 1.08 1.16 1.12 1.61 2.30 2.65
Phone & Postage (Rs. million) 0.01 0.25 0.35 0.62 0.42 0.19
Stationery (Rs. million) 0.19 0.62 0.24 0.56 0.56 0.35
Other Expenditure (Rs. million) 0.77 1.81 0.93 1.93 2.04 2.27
Total Office Expenses (Rs. million) 5.26 7.03 5.87 14.64 9.68 16.02
Gross Salary of Officers & Staff (Including Allowance) (Rs. million) 73.32 81.48 82.38 92.19 93.95 94.91
Traveling Allowances (Including Transfer Grants) (Rs. million) 0.13 0.91 0.16 0.20 0.12 0.20
Total of Salary & Allowances (Rs. million) 73.44 82.38 82.54 92.39 94.07 95.11
Total Expenditure (Rs. million) 78.71 89.42 88.40 107.02 103.74 111.13
• Table below presents the operating expenses of the private operators for the year
2005: Item Expenses (Rs. million)
AMC for Hardware 9.180
Insurance of Hardware 0.565
Consultants - on going support costs 48.000
Ongoing Communication Costs 6.000
Expenses (Supplies, power, system, administration) 12.500
Miscellaneous 9.000
Total Operating Expenses of ECIL 85.245
Operating Expenses of CDAC 2.880
Operating Expenses of CMS Computers Ltd. 49.339
Estimated Total Operating Expenses 137.464
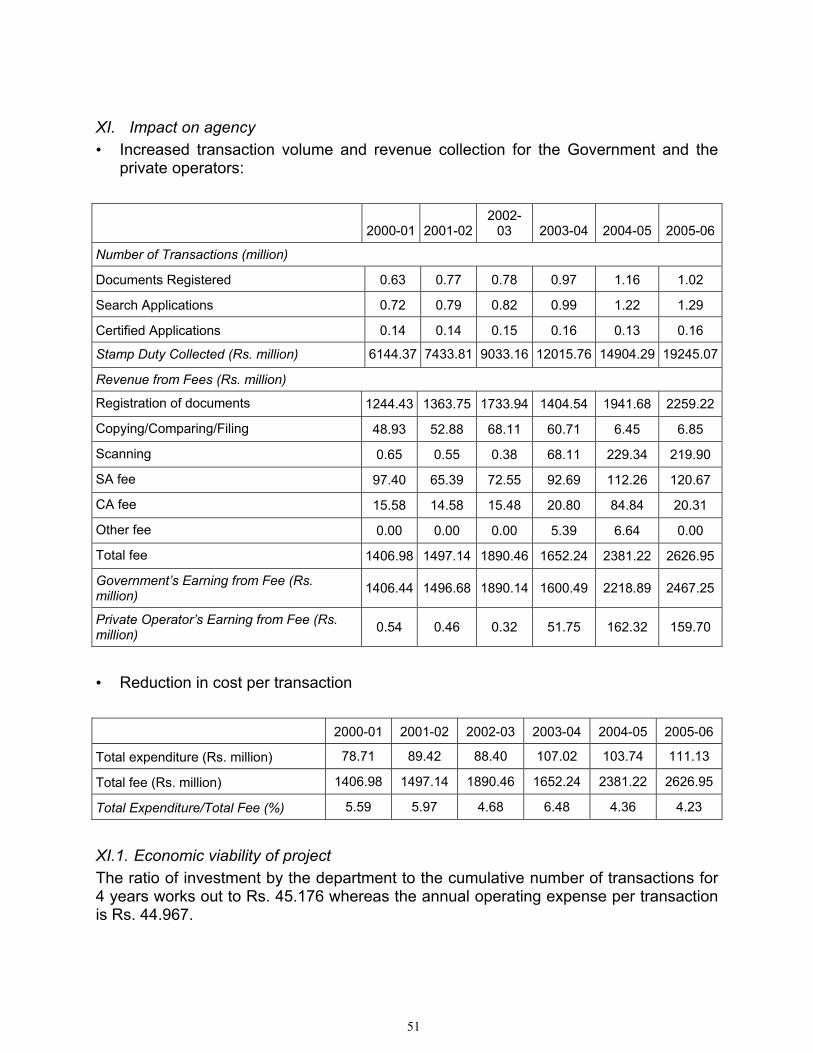
51
XI. Impact on agency • Increased transaction volume and revenue collection for the Government and the
private operators:
2000-01 2001-022002-
03 2003-04 2004-05 2005-06
Number of Transactions (million)
Documents Registered 0.63 0.77 0.78 0.97 1.16 1.02
Search Applications 0.72 0.79 0.82 0.99 1.22 1.29
Certified Applications 0.14 0.14 0.15 0.16 0.13 0.16
Stamp Duty Collected (Rs. million) 6144.37 7433.81 9033.16 12015.76 14904.29 19245.07
Revenue from Fees (Rs. million)
Registration of documents 1244.43 1363.75 1733.94 1404.54 1941.68 2259.22
Copying/Comparing/Filing 48.93 52.88 68.11 60.71 6.45 6.85
Scanning 0.65 0.55 0.38 68.11 229.34 219.90
SA fee 97.40 65.39 72.55 92.69 112.26 120.67
CA fee 15.58 14.58 15.48 20.80 84.84 20.31
Other fee 0.00 0.00 0.00 5.39 6.64 0.00
Total fee 1406.98 1497.14 1890.46 1652.24 2381.22 2626.95
Government’s Earning from Fee (Rs. million) 1406.44 1496.68 1890.14 1600.49 2218.89 2467.25
Private Operator’s Earning from Fee (Rs. million) 0.54 0.46 0.32 51.75 162.32 159.70
• Reduction in cost per transaction 2000-01 2001-02 2002-03 2003-04 2004-05 2005-06
Total expenditure (Rs. million) 78.71 89.42 88.40 107.02 103.74 111.13
Total fee (Rs. million) 1406.98 1497.14 1890.46 1652.24 2381.22 2626.95
Total Expenditure/Total Fee (%) 5.59 5.97 4.68 6.48 4.36 4.23
XI.1. Economic viability of project The ratio of investment by the department to the cumulative number of transactions for 4 years works out to Rs. 45.176 whereas the annual operating expense per transaction is Rs. 44.967.
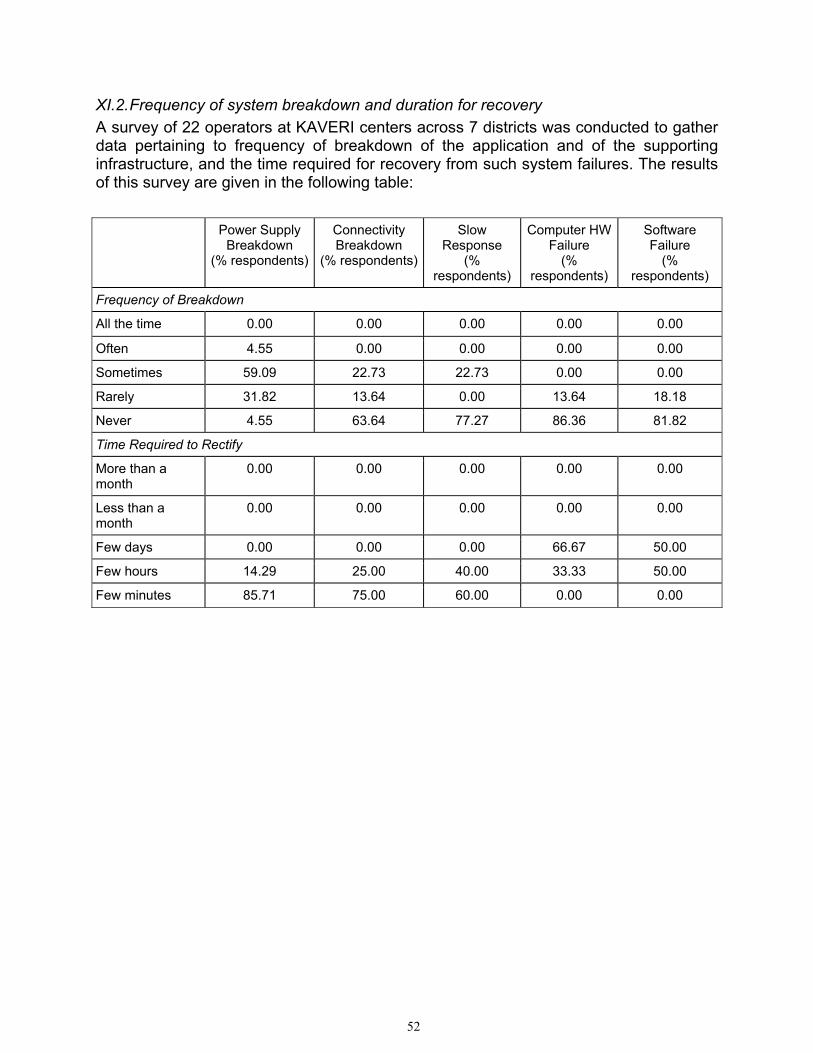
52
XI.2. Frequency of system breakdown and duration for recovery A survey of 22 operators at KAVERI centers across 7 districts was conducted to gather data pertaining to frequency of breakdown of the application and of the supporting infrastructure, and the time required for recovery from such system failures. The results of this survey are given in the following table:
Power Supply Breakdown
(% respondents)
Connectivity Breakdown
(% respondents)
Slow Response
(% respondents)
Computer HW Failure
(% respondents)
Software Failure
(% respondents)
Frequency of Breakdown
All the time 0.00 0.00 0.00 0.00 0.00
Often 4.55 0.00 0.00 0.00 0.00
Sometimes 59.09 22.73 22.73 0.00 0.00
Rarely 31.82 13.64 0.00 13.64 18.18
Never 4.55 63.64 77.27 86.36 81.82
Time Required to Rectify
More than a month
0.00 0.00 0.00 0.00 0.00
Less than a month
0.00 0.00 0.00 0.00 0.00
Few days 0.00 0.00 0.00 66.67 50.00
Few hours 14.29 25.00 40.00 33.33 50.00
Few minutes 85.71 75.00 60.00 0.00 0.00
53
Computerization of Treasuries of Karnataka (KHAJANE) I. Sector Treasury II. Targeted beneficiaries The main beneficiaries of this application are employees of Karnataka State Government departments, District Treasuries and sub-treasuries; and recipients of retirement and social pension. The state’s expenditure covers the budgets for more than 100 departments. It is estimated that there are more than 300,000 state employees in Karnataka20 who draw their salaries from the treasuries. An estimted 400,000 employees of the grant-in-aid institutions also draw their salaries from the treasuries21. There are more than 1 million widows, disabled people and retirees. The treasury offices also serve as bankers to the state’s 4500 village administrators known as panchayats20. An estimated 21,274 drawing and disbursing officers (DDO) of various departments21 also access treasuries for bill payments, and other services. III. Project implementation start date The agreement to set up a statewide money control network was signed with CMC Ltd. and Software Technology Parks of India (STPI) in 2001. The first version of the application software for the network was developed by CMC and was ready by November 2001. From December that year, a pilot project was started at Tumkur, Hubli, Shigaon in the Haveri and Bangalore Urban district. The pilot project continued till June 2002. The first edition of the application software was up and running in October-November 2002. IV. Electronic service delivery launch date The Khajane project connecting 31 District treasuries and 184 sub-treasuries was launched on 18th August 200322. V. Duration for which project has been delivering services More than 3 years. VI. Major services offered through the project
20 Karnataka state government streamlines treasury operations and improves transparency. Oracle e-Governance
news and views. Downloaded from http://www.cmcltd.com/case_studies/downloads/oracle%20online%20ISSUE%205a.pdf accessed on 26th Sep 2006
21 Menon, R (2006). Follow The Money appeared on CIO INDIA website http://www.cio.in/govern/viewArticle/ARTICLEID=2043 accessed on 26th Sep 2006.
22 http://www.itforchange.net/ict4d/display/96 accessed on 26th Sept 2006.
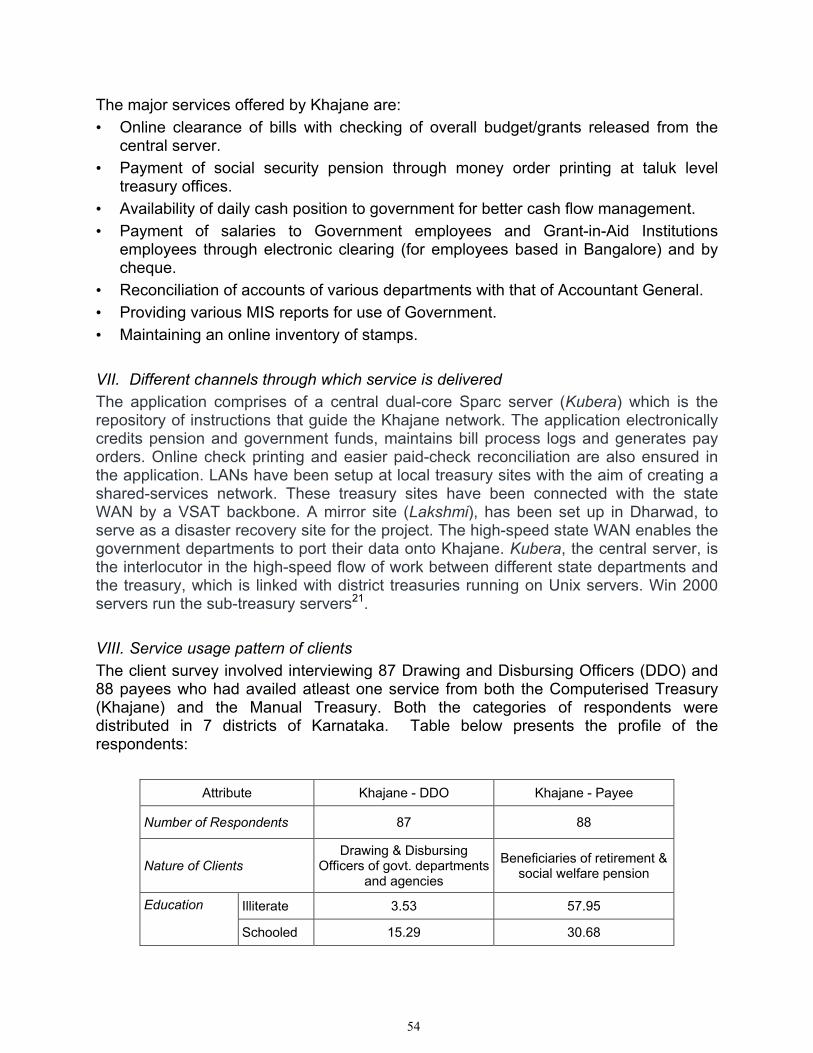
54
The major services offered by Khajane are: • Online clearance of bills with checking of overall budget/grants released from the
central server. • Payment of social security pension through money order printing at taluk level
treasury offices. • Availability of daily cash position to government for better cash flow management. • Payment of salaries to Government employees and Grant-in-Aid Institutions
employees through electronic clearing (for employees based in Bangalore) and by cheque.
• Reconciliation of accounts of various departments with that of Accountant General. • Providing various MIS reports for use of Government. • Maintaining an online inventory of stamps. VII. Different channels through which service is delivered The application comprises of a central dual-core Sparc server (Kubera) which is the repository of instructions that guide the Khajane network. The application electronically credits pension and government funds, maintains bill process logs and generates pay orders. Online check printing and easier paid-check reconciliation are also ensured in the application. LANs have been setup at local treasury sites with the aim of creating a shared-services network. These treasury sites have been connected with the state WAN by a VSAT backbone. A mirror site (Lakshmi), has been set up in Dharwad, to serve as a disaster recovery site for the project. The high-speed state WAN enables the government departments to port their data onto Khajane. Kubera, the central server, is the interlocutor in the high-speed flow of work between different state departments and the treasury, which is linked with district treasuries running on Unix servers. Win 2000 servers run the sub-treasury servers21. VIII. Service usage pattern of clients The client survey involved interviewing 87 Drawing and Disbursing Officers (DDO) and 88 payees who had availed atleast one service from both the Computerised Treasury (Khajane) and the Manual Treasury. Both the categories of respondents were distributed in 7 districts of Karnataka. Table below presents the profile of the respondents:
Attribute Khajane - DDO Khajane - Payee
Number of Respondents 87 88
Nature of Clients Drawing & Disbursing
Officers of govt. departments and agencies
Beneficiaries of retirement & social welfare pension
Illiterate 3.53 57.95 Education
Schooled 15.29 30.68
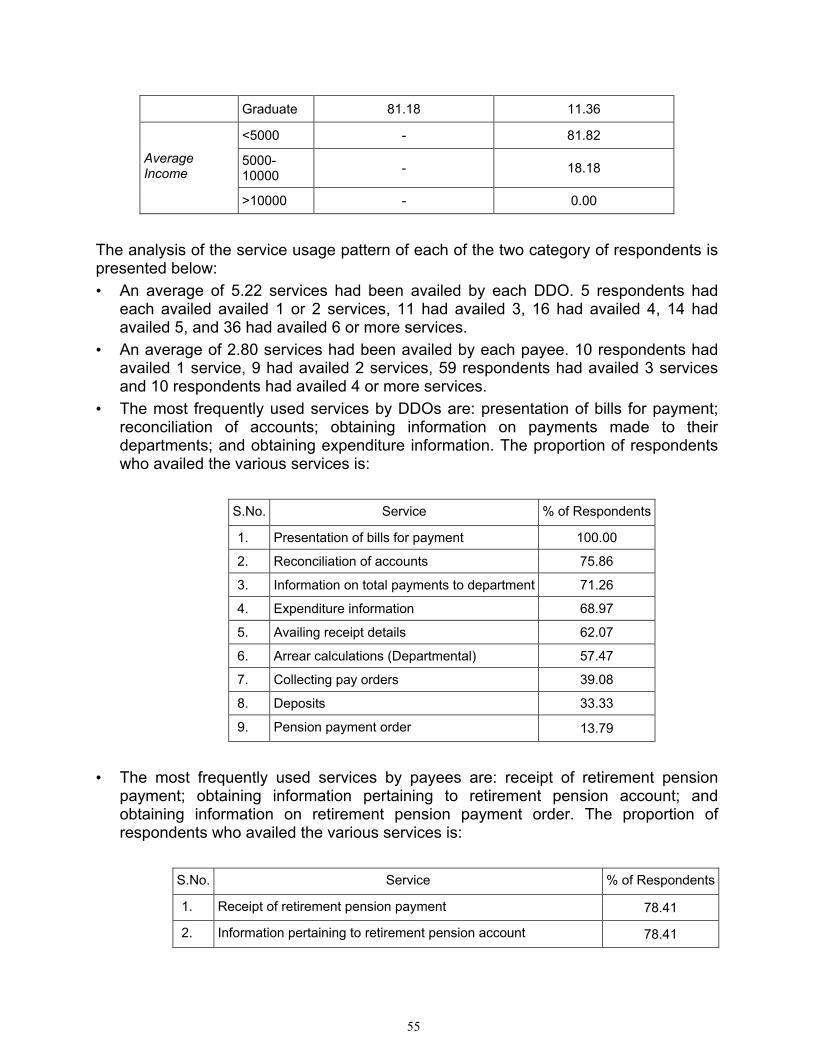
55
Graduate 81.18 11.36
<5000 - 81.82
5000-10000 - 18.18
Average Income
>10000 - 0.00
The analysis of the service usage pattern of each of the two category of respondents is presented below: • An average of 5.22 services had been availed by each DDO. 5 respondents had
each availed availed 1 or 2 services, 11 had availed 3, 16 had availed 4, 14 had availed 5, and 36 had availed 6 or more services.
• An average of 2.80 services had been availed by each payee. 10 respondents had availed 1 service, 9 had availed 2 services, 59 respondents had availed 3 services and 10 respondents had availed 4 or more services.
• The most frequently used services by DDOs are: presentation of bills for payment; reconciliation of accounts; obtaining information on payments made to their departments; and obtaining expenditure information. The proportion of respondents who availed the various services is:
S.No. Service % of Respondents
1. Presentation of bills for payment 100.00
2. Reconciliation of accounts 75.86
3. Information on total payments to department 71.26
4. Expenditure information 68.97
5. Availing receipt details 62.07
6. Arrear calculations (Departmental) 57.47
7. Collecting pay orders 39.08
8. Deposits 33.33
9. Pension payment order 13.79
• The most frequently used services by payees are: receipt of retirement pension
payment; obtaining information pertaining to retirement pension account; and obtaining information on retirement pension payment order. The proportion of respondents who availed the various services is:
S.No. Service % of Respondents
1. Receipt of retirement pension payment 78.41
2. Information pertaining to retirement pension account 78.41
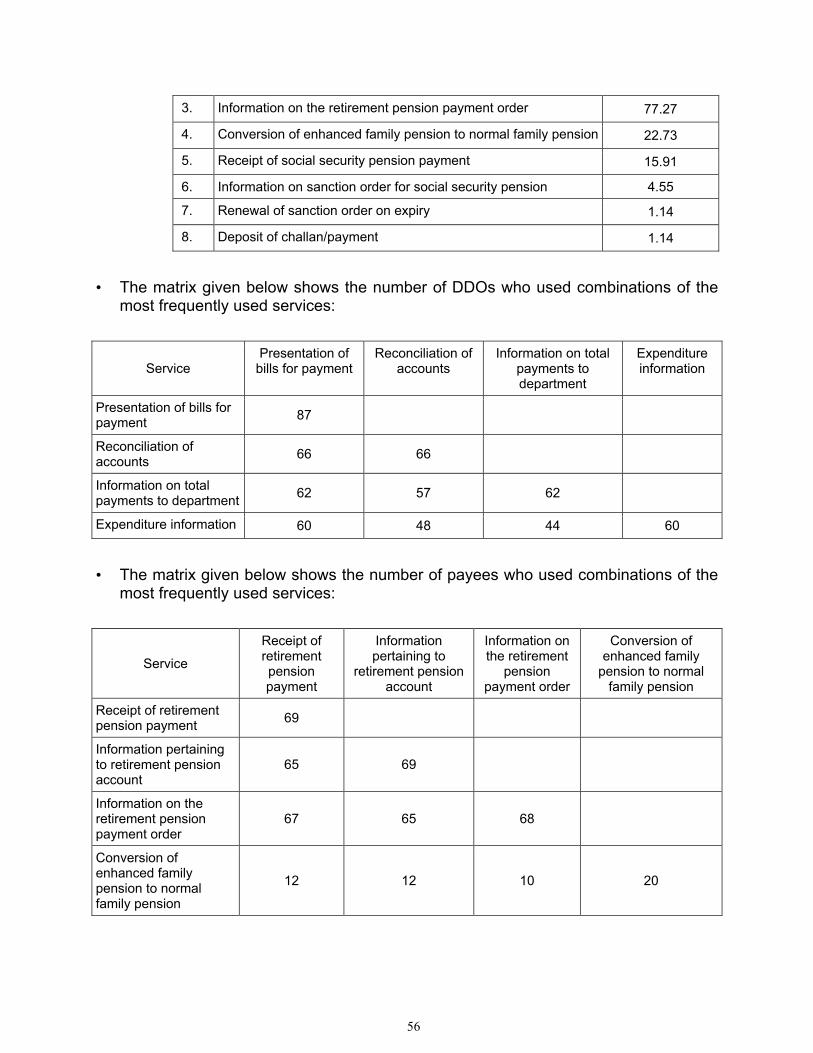
56
3. Information on the retirement pension payment order 77.27
4. Conversion of enhanced family pension to normal family pension 22.73
5. Receipt of social security pension payment 15.91
6. Information on sanction order for social security pension 4.55
7. Renewal of sanction order on expiry 1.14
8. Deposit of challan/payment 1.14
• The matrix given below shows the number of DDOs who used combinations of the
most frequently used services:
Service Presentation of
bills for payment Reconciliation of
accounts Information on total
payments to department
Expenditure information
Presentation of bills for payment 87
Reconciliation of accounts 66 66
Information on total payments to department 62 57 62
Expenditure information 60 48 44 60
• The matrix given below shows the number of payees who used combinations of the
most frequently used services:
Service
Receipt of retirement pension payment
Information pertaining to
retirement pension account
Information on the retirement
pension payment order
Conversion of enhanced family
pension to normal family pension
Receipt of retirement pension payment 69
Information pertaining to retirement pension account
65 69
Information on the retirement pension payment order
67 65 68
Conversion of enhanced family pension to normal family pension
12 12 10 20
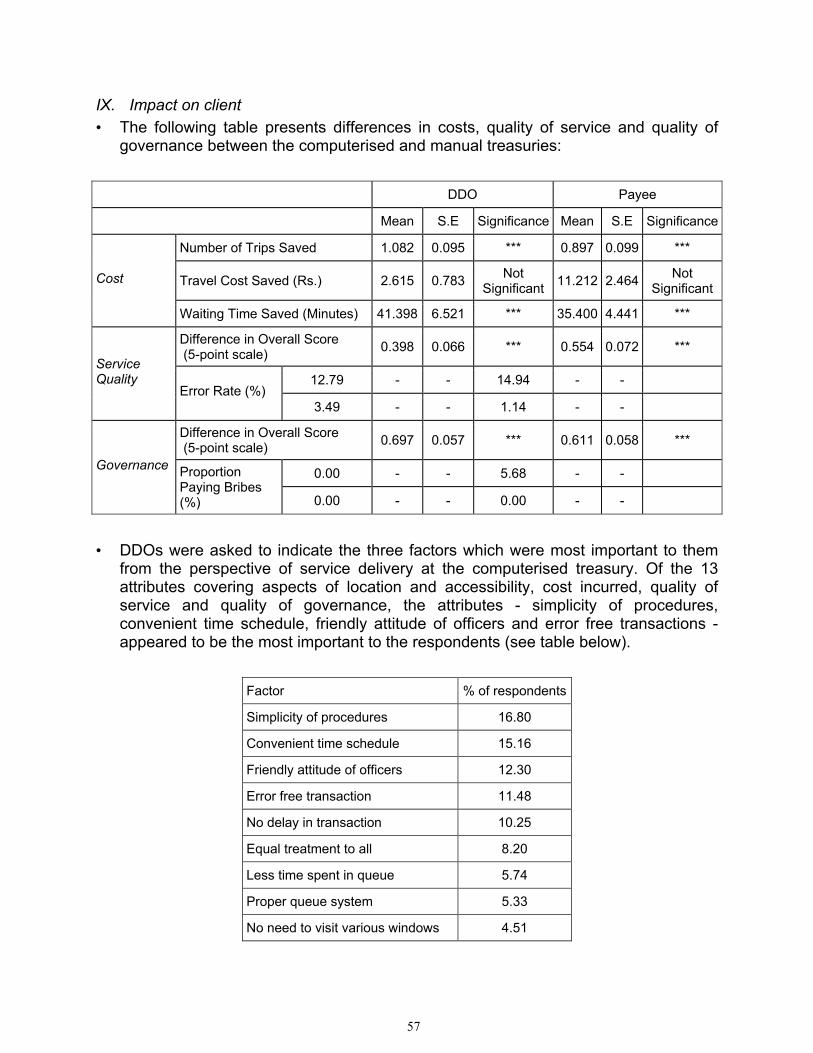
57
IX. Impact on client • The following table presents differences in costs, quality of service and quality of
governance between the computerised and manual treasuries: DDO Payee
Mean S.E Significance Mean S.E Significance
Number of Trips Saved 1.082 0.095 *** 0.897 0.099 ***
Travel Cost Saved (Rs.) 2.615 0.783 Not Significant 11.212 2.464 Not
Significant Cost
Waiting Time Saved (Minutes) 41.398 6.521 *** 35.400 4.441 ***
Difference in Overall Score (5-point scale) 0.398 0.066 *** 0.554 0.072 ***
12.79 - - 14.94 - - Service Quality
Error Rate (%) 3.49 - - 1.14 - -
Difference in Overall Score (5-point scale) 0.697 0.057 *** 0.611 0.058 ***
0.00 - - 5.68 - - Governance Proportion Paying Bribes (%) 0.00 - - 0.00 - -
• DDOs were asked to indicate the three factors which were most important to them
from the perspective of service delivery at the computerised treasury. Of the 13 attributes covering aspects of location and accessibility, cost incurred, quality of service and quality of governance, the attributes - simplicity of procedures, convenient time schedule, friendly attitude of officers and error free transactions - appeared to be the most important to the respondents (see table below).
Factor % of respondents
Simplicity of procedures 16.80
Convenient time schedule 15.16
Friendly attitude of officers 12.30
Error free transaction 11.48
No delay in transaction 10.25
Equal treatment to all 8.20
Less time spent in queue 5.74
Proper queue system 5.33
No need to visit various windows 4.51
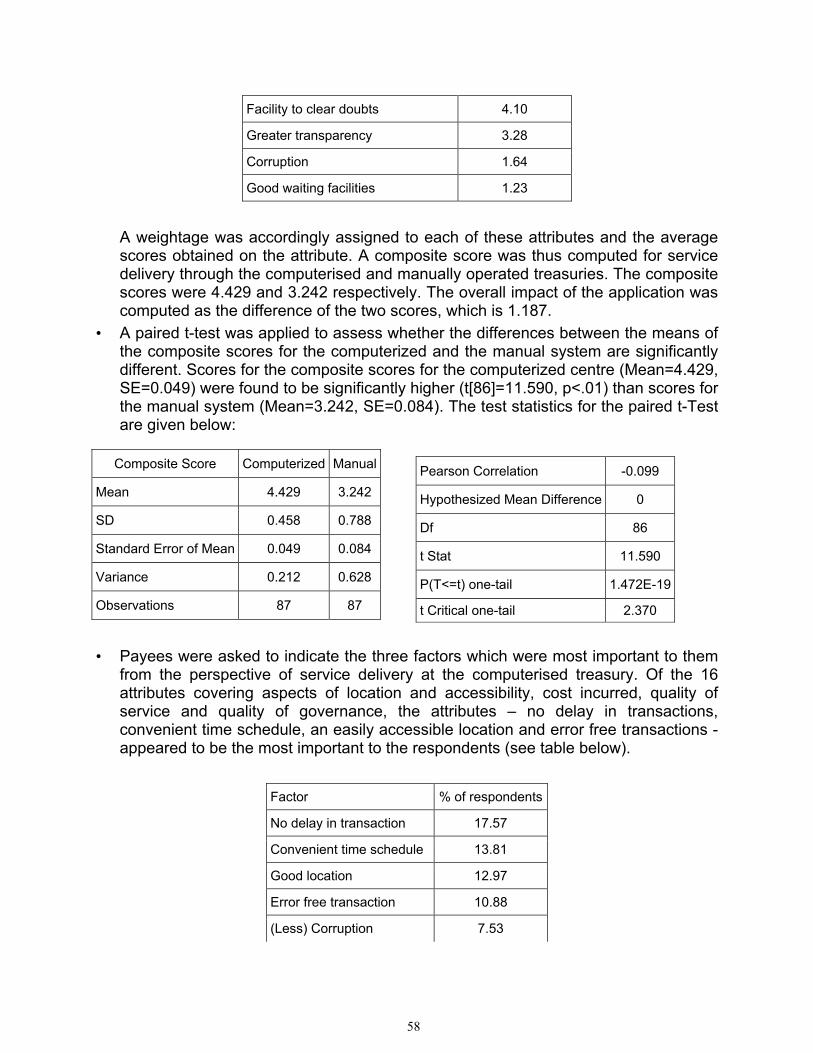
58
Facility to clear doubts 4.10
Greater transparency 3.28
Corruption 1.64
Good waiting facilities 1.23
A weightage was accordingly assigned to each of these attributes and the average scores obtained on the attribute. A composite score was thus computed for service delivery through the computerised and manually operated treasuries. The composite scores were 4.429 and 3.242 respectively. The overall impact of the application was computed as the difference of the two scores, which is 1.187.
• A paired t-test was applied to assess whether the differences between the means of the composite scores for the computerized and the manual system are significantly different. Scores for the composite scores for the computerized centre (Mean=4.429, SE=0.049) were found to be significantly higher (t[86]=11.590, p<.01) than scores for the manual system (Mean=3.242, SE=0.084). The test statistics for the paired t-Test are given below:
• Payees were asked to indicate the three factors which were most important to them
from the perspective of service delivery at the computerised treasury. Of the 16 attributes covering aspects of location and accessibility, cost incurred, quality of service and quality of governance, the attributes – no delay in transactions, convenient time schedule, an easily accessible location and error free transactions - appeared to be the most important to the respondents (see table below).
Factor % of respondents
No delay in transaction 17.57
Convenient time schedule 13.81
Good location 12.97
Error free transaction 10.88
(Less) Corruption 7.53
Composite Score Computerized Manual
Mean 4.429 3.242
SD 0.458 0.788
Standard Error of Mean 0.049 0.084
Variance 0.212 0.628
Observations 87 87
Pearson Correlation -0.099
Hypothesized Mean Difference 0
Df 86
t Stat 11.590
P(T<=t) one-tail 1.472E-19
t Critical one-tail 2.370
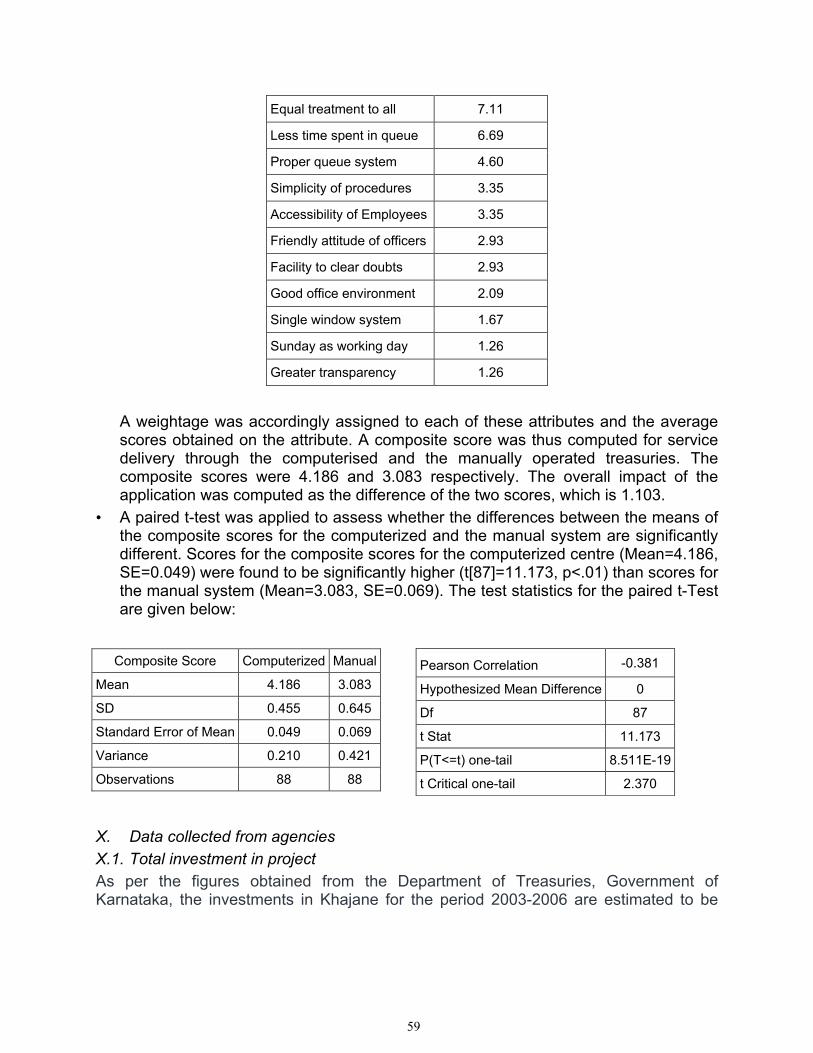
59
Equal treatment to all 7.11
Less time spent in queue 6.69
Proper queue system 4.60
Simplicity of procedures 3.35
Accessibility of Employees 3.35
Friendly attitude of officers 2.93
Facility to clear doubts 2.93
Good office environment 2.09
Single window system 1.67
Sunday as working day 1.26
Greater transparency 1.26
A weightage was accordingly assigned to each of these attributes and the average scores obtained on the attribute. A composite score was thus computed for service delivery through the computerised and the manually operated treasuries. The composite scores were 4.186 and 3.083 respectively. The overall impact of the application was computed as the difference of the two scores, which is 1.103.
• A paired t-test was applied to assess whether the differences between the means of the composite scores for the computerized and the manual system are significantly different. Scores for the composite scores for the computerized centre (Mean=4.186, SE=0.049) were found to be significantly higher (t[87]=11.173, p<.01) than scores for the manual system (Mean=3.083, SE=0.069). The test statistics for the paired t-Test are given below:
X. Data collected from agencies X.1. Total investment in project As per the figures obtained from the Department of Treasuries, Government of Karnataka, the investments in Khajane for the period 2003-2006 are estimated to be
Pearson Correlation -0.381
Hypothesized Mean Difference 0
Df 87
t Stat 11.173
P(T<=t) one-tail 8.511E-19
t Critical one-tail 2.370
Composite Score Computerized Manual
Mean 4.186 3.083
SD 0.455 0.645
Standard Error of Mean 0.049 0.069
Variance 0.210 0.421
Observations 88 88
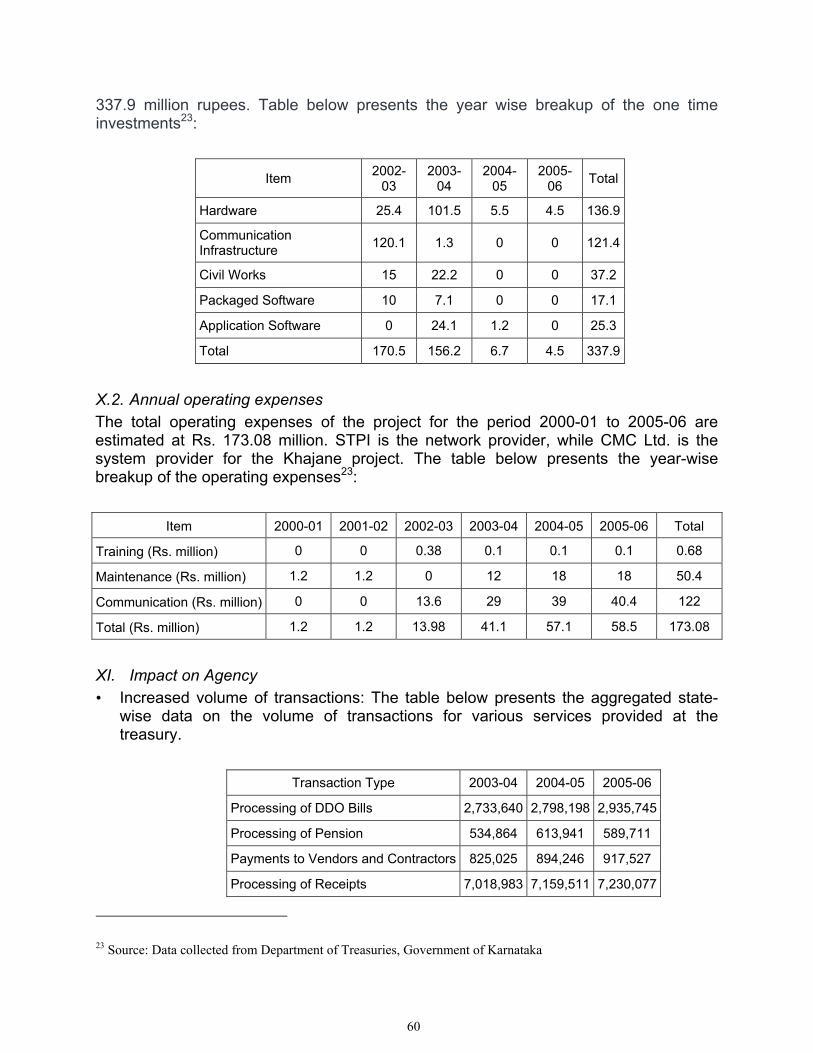
60
337.9 million rupees. Table below presents the year wise breakup of the one time investments23:
Item 2002-03
2003-04
2004-05
2005-06 Total
Hardware 25.4 101.5 5.5 4.5 136.9
Communication Infrastructure 120.1 1.3 0 0 121.4
Civil Works 15 22.2 0 0 37.2
Packaged Software 10 7.1 0 0 17.1
Application Software 0 24.1 1.2 0 25.3
Total 170.5 156.2 6.7 4.5 337.9
X.2. Annual operating expenses The total operating expenses of the project for the period 2000-01 to 2005-06 are estimated at Rs. 173.08 million. STPI is the network provider, while CMC Ltd. is the system provider for the Khajane project. The table below presents the year-wise breakup of the operating expenses23:
Item 2000-01 2001-02 2002-03 2003-04 2004-05 2005-06 Total
Training (Rs. million) 0 0 0.38 0.1 0.1 0.1 0.68
Maintenance (Rs. million) 1.2 1.2 0 12 18 18 50.4
Communication (Rs. million) 0 0 13.6 29 39 40.4 122
Total (Rs. million) 1.2 1.2 13.98 41.1 57.1 58.5 173.08
XI. Impact on Agency • Increased volume of transactions: The table below presents the aggregated state-
wise data on the volume of transactions for various services provided at the treasury.
Transaction Type 2003-04 2004-05 2005-06
Processing of DDO Bills 2,733,640 2,798,198 2,935,745
Processing of Pension 534,864 613,941 589,711
Payments to Vendors and Contractors 825,025 894,246 917,527
Processing of Receipts 7,018,983 7,159,511 7,230,077
23 Source: Data collected from Department of Treasuries, Government of Karnataka
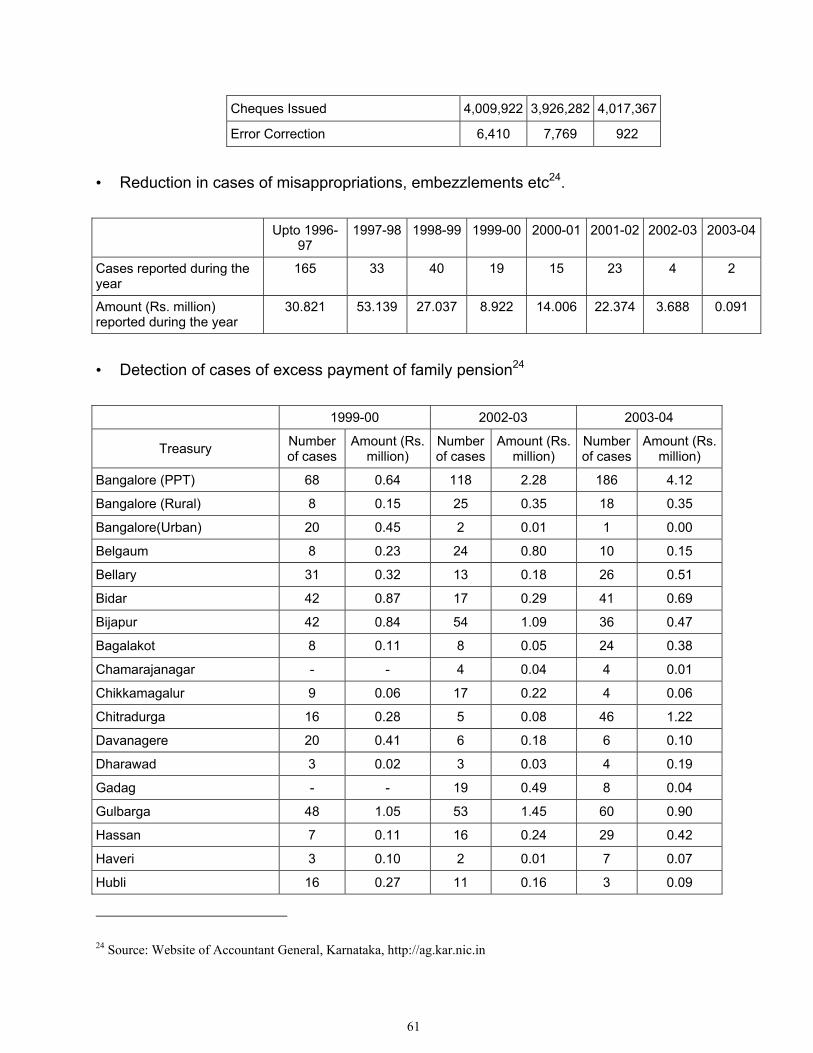
61
Cheques Issued 4,009,922 3,926,282 4,017,367
Error Correction 6,410 7,769 922
• Reduction in cases of misappropriations, embezzlements etc24.
Upto 1996-97
1997-98 1998-99 1999-00 2000-01 2001-02 2002-03 2003-04
Cases reported during the year
165 33 40 19 15 23 4 2
Amount (Rs. million) reported during the year
30.821 53.139 27.037 8.922 14.006 22.374 3.688 0.091
• Detection of cases of excess payment of family pension24 1999-00 2002-03 2003-04
Treasury Number of cases
Amount (Rs. million)
Number of cases
Amount (Rs. million)
Number of cases
Amount (Rs. million)
Bangalore (PPT) 68 0.64 118 2.28 186 4.12
Bangalore (Rural) 8 0.15 25 0.35 18 0.35
Bangalore(Urban) 20 0.45 2 0.01 1 0.00
Belgaum 8 0.23 24 0.80 10 0.15
Bellary 31 0.32 13 0.18 26 0.51
Bidar 42 0.87 17 0.29 41 0.69
Bijapur 42 0.84 54 1.09 36 0.47
Bagalakot 8 0.11 8 0.05 24 0.38
Chamarajanagar - - 4 0.04 4 0.01
Chikkamagalur 9 0.06 17 0.22 4 0.06
Chitradurga 16 0.28 5 0.08 46 1.22
Davanagere 20 0.41 6 0.18 6 0.10
Dharawad 3 0.02 3 0.03 4 0.19
Gadag - - 19 0.49 8 0.04
Gulbarga 48 1.05 53 1.45 60 0.90
Hassan 7 0.11 16 0.24 29 0.42
Haveri 3 0.10 2 0.01 7 0.07
Hubli 16 0.27 11 0.16 3 0.09
24 Source: Website of Accountant General, Karnataka, http://ag.kar.nic.in
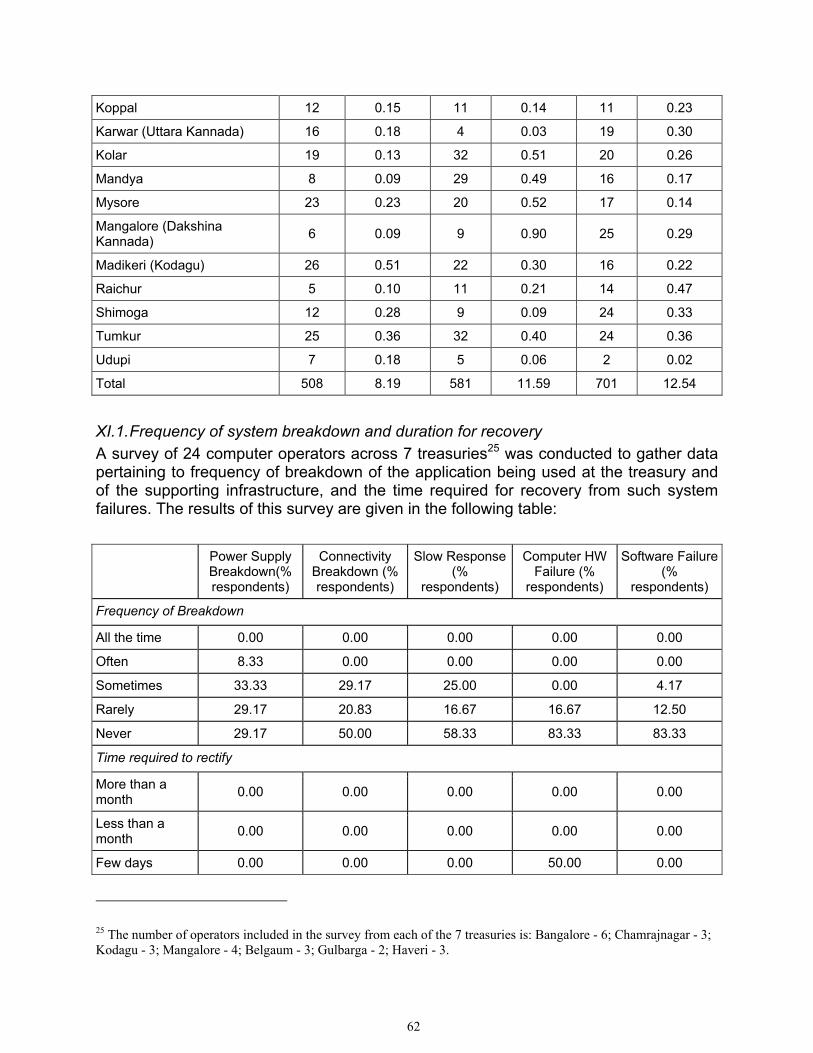
62
Koppal 12 0.15 11 0.14 11 0.23
Karwar (Uttara Kannada) 16 0.18 4 0.03 19 0.30
Kolar 19 0.13 32 0.51 20 0.26
Mandya 8 0.09 29 0.49 16 0.17
Mysore 23 0.23 20 0.52 17 0.14
Mangalore (Dakshina Kannada) 6 0.09 9 0.90 25 0.29
Madikeri (Kodagu) 26 0.51 22 0.30 16 0.22
Raichur 5 0.10 11 0.21 14 0.47
Shimoga 12 0.28 9 0.09 24 0.33
Tumkur 25 0.36 32 0.40 24 0.36
Udupi 7 0.18 5 0.06 2 0.02
Total 508 8.19 581 11.59 701 12.54
XI.1. Frequency of system breakdown and duration for recovery A survey of 24 computer operators across 7 treasuries25 was conducted to gather data pertaining to frequency of breakdown of the application being used at the treasury and of the supporting infrastructure, and the time required for recovery from such system failures. The results of this survey are given in the following table:
Power Supply Breakdown(% respondents)
Connectivity Breakdown (% respondents)
Slow Response (%
respondents)
Computer HW Failure (%
respondents)
Software Failure (%
respondents)
Frequency of Breakdown
All the time 0.00 0.00 0.00 0.00 0.00
Often 8.33 0.00 0.00 0.00 0.00
Sometimes 33.33 29.17 25.00 0.00 4.17
Rarely 29.17 20.83 16.67 16.67 12.50
Never 29.17 50.00 58.33 83.33 83.33
Time required to rectify
More than a month 0.00 0.00 0.00 0.00 0.00
Less than a month 0.00 0.00 0.00 0.00 0.00
Few days 0.00 0.00 0.00 50.00 0.00
25 The number of operators included in the survey from each of the 7 treasuries is: Bangalore - 6; Chamrajnagar - 3; Kodagu - 3; Mangalore - 4; Belgaum - 3; Gulbarga - 2; Haveri - 3.
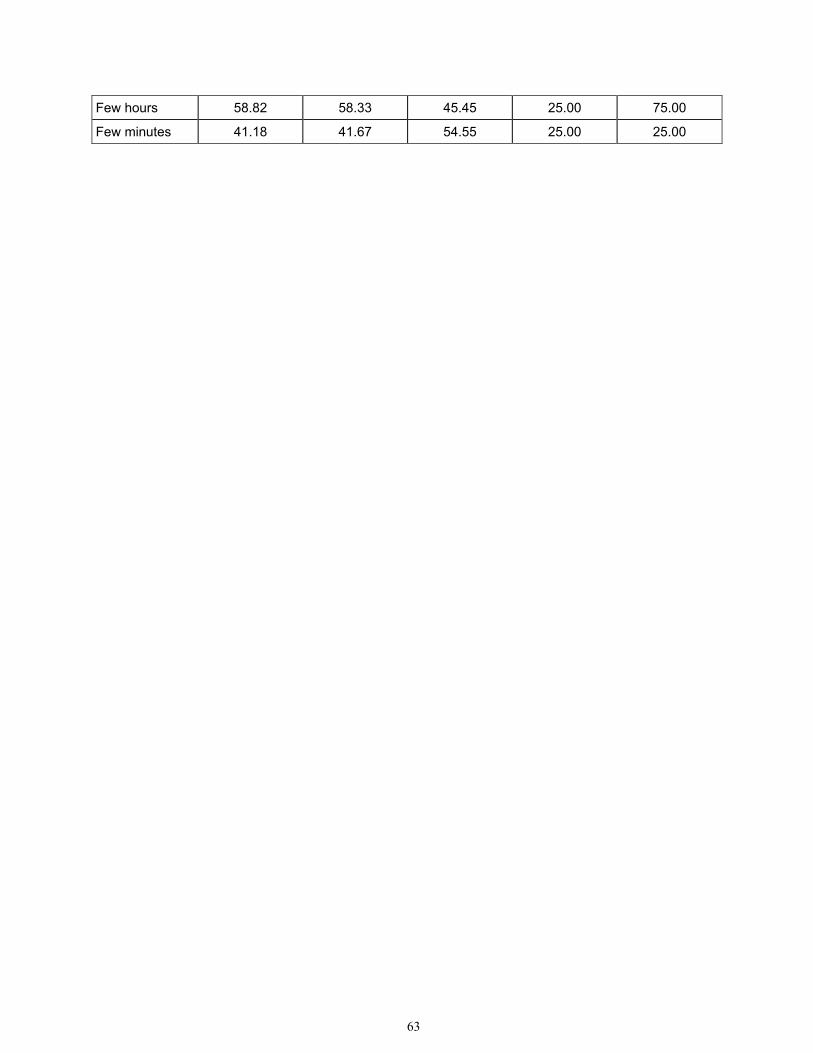
63
Few hours 58.82 58.33 45.45 25.00 75.00
Few minutes 41.18 41.67 54.55 25.00 25.00
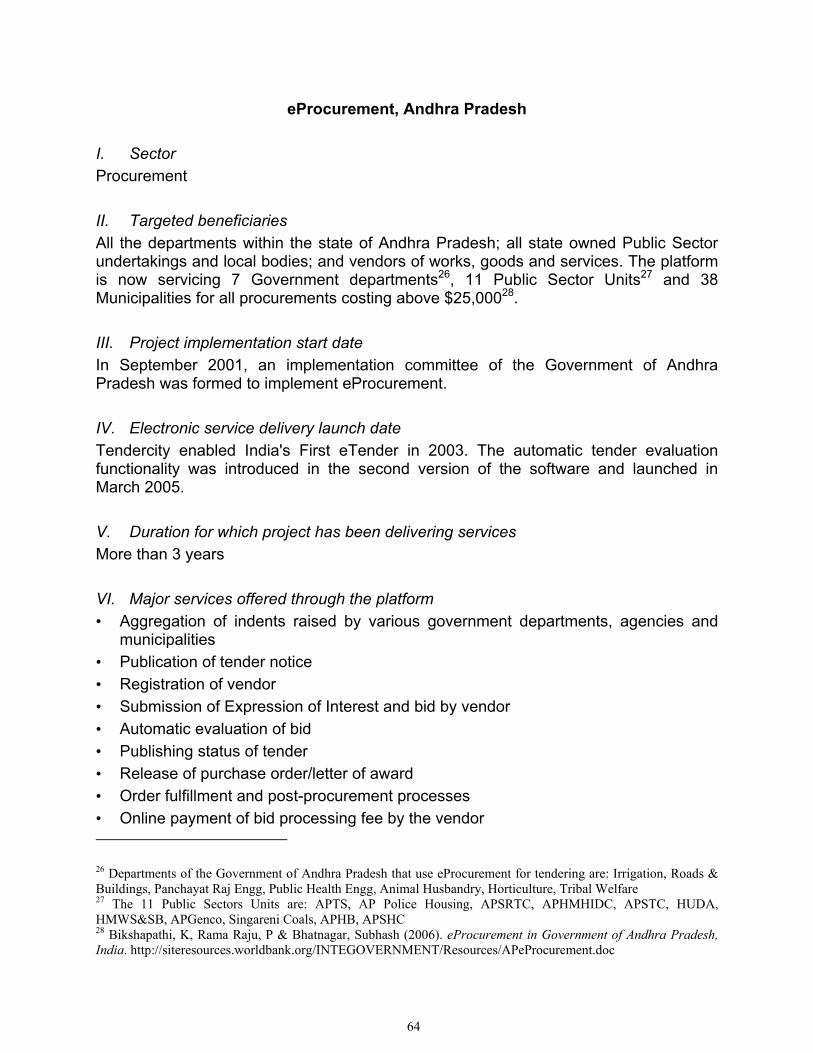
64
eProcurement, Andhra Pradesh I. Sector Procurement II. Targeted beneficiaries All the departments within the state of Andhra Pradesh; all state owned Public Sector undertakings and local bodies; and vendors of works, goods and services. The platform is now servicing 7 Government departments26, 11 Public Sector Units27 and 38 Municipalities for all procurements costing above $25,00028. III. Project implementation start date In September 2001, an implementation committee of the Government of Andhra Pradesh was formed to implement eProcurement. IV. Electronic service delivery launch date Tendercity enabled India's First eTender in 2003. The automatic tender evaluation functionality was introduced in the second version of the software and launched in March 2005. V. Duration for which project has been delivering services More than 3 years VI. Major services offered through the platform • Aggregation of indents raised by various government departments, agencies and
municipalities • Publication of tender notice • Registration of vendor • Submission of Expression of Interest and bid by vendor • Automatic evaluation of bid • Publishing status of tender • Release of purchase order/letter of award • Order fulfillment and post-procurement processes • Online payment of bid processing fee by the vendor 26 Departments of the Government of Andhra Pradesh that use eProcurement for tendering are: Irrigation, Roads & Buildings, Panchayat Raj Engg, Public Health Engg, Animal Husbandry, Horticulture, Tribal Welfare 27 The 11 Public Sectors Units are: APTS, AP Police Housing, APSRTC, APHMHIDC, APSTC, HUDA, HMWS&SB, APGenco, Singareni Coals, APHB, APSHC 28 Bikshapathi, K, Rama Raju, P & Bhatnagar, Subhash (2006). eProcurement in Government of Andhra Pradesh, India. http://siteresources.worldbank.org/INTEGOVERNMENT/Resources/APeProcurement.doc
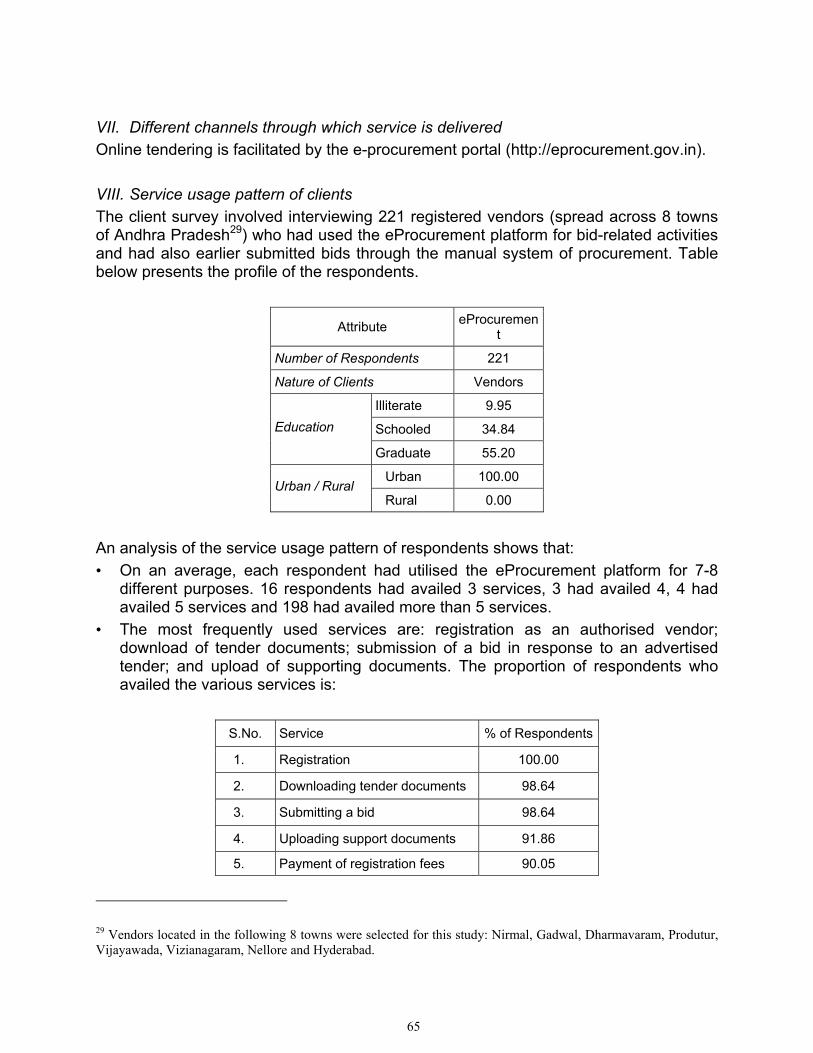
65
VII. Different channels through which service is delivered Online tendering is facilitated by the e-procurement portal (http://eprocurement.gov.in). VIII. Service usage pattern of clients The client survey involved interviewing 221 registered vendors (spread across 8 towns of Andhra Pradesh29) who had used the eProcurement platform for bid-related activities and had also earlier submitted bids through the manual system of procurement. Table below presents the profile of the respondents.
Attribute eProcurement
Number of Respondents 221
Nature of Clients Vendors
Illiterate 9.95
Schooled 34.84 Education
Graduate 55.20
Urban 100.00 Urban / Rural
Rural 0.00
An analysis of the service usage pattern of respondents shows that: • On an average, each respondent had utilised the eProcurement platform for 7-8
different purposes. 16 respondents had availed 3 services, 3 had availed 4, 4 had availed 5 services and 198 had availed more than 5 services.
• The most frequently used services are: registration as an authorised vendor; download of tender documents; submission of a bid in response to an advertised tender; and upload of supporting documents. The proportion of respondents who availed the various services is:
S.No. Service % of Respondents
1. Registration 100.00
2. Downloading tender documents 98.64
3. Submitting a bid 98.64
4. Uploading support documents 91.86
5. Payment of registration fees 90.05
29 Vendors located in the following 8 towns were selected for this study: Nirmal, Gadwal, Dharmavaram, Produtur, Vijayawada, Vizianagaram, Nellore and Hyderabad.
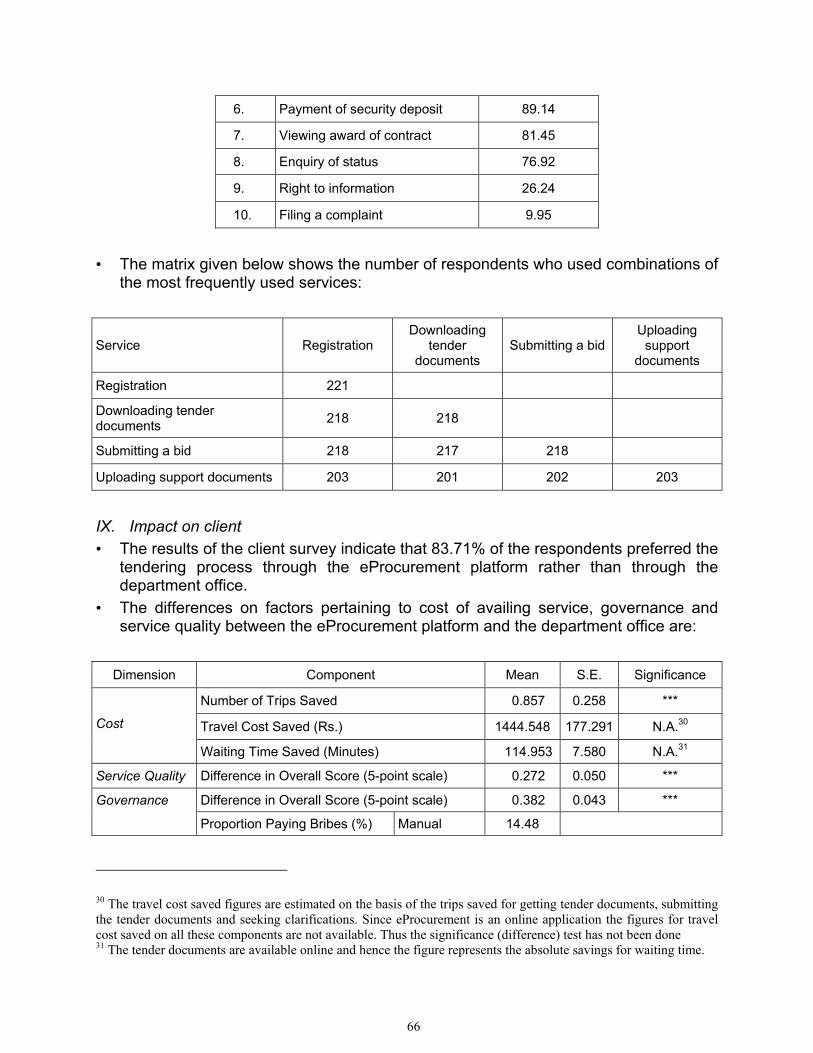
66
6. Payment of security deposit 89.14
7. Viewing award of contract 81.45
8. Enquiry of status 76.92
9. Right to information 26.24
10. Filing a complaint 9.95
• The matrix given below shows the number of respondents who used combinations of
the most frequently used services:
Service Registration Downloading
tender documents
Submitting a bid Uploading
support documents
Registration 221
Downloading tender documents 218 218
Submitting a bid 218 217 218
Uploading support documents 203 201 202 203
IX. Impact on client • The results of the client survey indicate that 83.71% of the respondents preferred the
tendering process through the eProcurement platform rather than through the department office.
• The differences on factors pertaining to cost of availing service, governance and service quality between the eProcurement platform and the department office are:
Dimension Component Mean S.E. Significance
Number of Trips Saved 0.857 0.258 ***
Travel Cost Saved (Rs.) 1444.548 177.291 N.A.30 Cost
Waiting Time Saved (Minutes) 114.953 7.580 N.A.31
Service Quality Difference in Overall Score (5-point scale) 0.272 0.050 *** Difference in Overall Score (5-point scale) 0.382 0.043 *** Governance
Proportion Paying Bribes (%) Manual 14.48
30 The travel cost saved figures are estimated on the basis of the trips saved for getting tender documents, submitting the tender documents and seeking clarifications. Since eProcurement is an online application the figures for travel cost saved on all these components are not available. Thus the significance (difference) test has not been done 31 The tender documents are available online and hence the figure represents the absolute savings for waiting time.
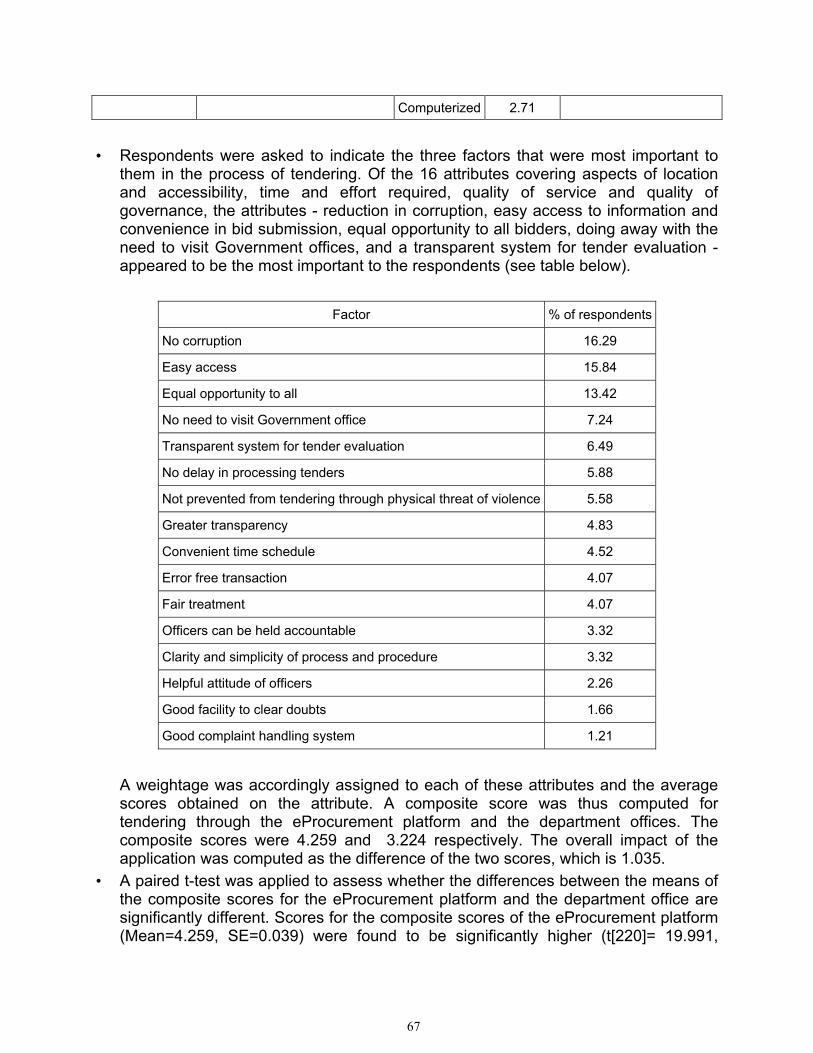
67
Computerized 2.71
• Respondents were asked to indicate the three factors that were most important to
them in the process of tendering. Of the 16 attributes covering aspects of location and accessibility, time and effort required, quality of service and quality of governance, the attributes - reduction in corruption, easy access to information and convenience in bid submission, equal opportunity to all bidders, doing away with the need to visit Government offices, and a transparent system for tender evaluation - appeared to be the most important to the respondents (see table below).
Factor % of respondents
No corruption 16.29
Easy access 15.84
Equal opportunity to all 13.42
No need to visit Government office 7.24
Transparent system for tender evaluation 6.49
No delay in processing tenders 5.88
Not prevented from tendering through physical threat of violence 5.58
Greater transparency 4.83
Convenient time schedule 4.52
Error free transaction 4.07
Fair treatment 4.07
Officers can be held accountable 3.32
Clarity and simplicity of process and procedure 3.32
Helpful attitude of officers 2.26
Good facility to clear doubts 1.66
Good complaint handling system 1.21
A weightage was accordingly assigned to each of these attributes and the average scores obtained on the attribute. A composite score was thus computed for tendering through the eProcurement platform and the department offices. The composite scores were 4.259 and 3.224 respectively. The overall impact of the application was computed as the difference of the two scores, which is 1.035.
• A paired t-test was applied to assess whether the differences between the means of the composite scores for the eProcurement platform and the department office are significantly different. Scores for the composite scores of the eProcurement platform (Mean=4.259, SE=0.039) were found to be significantly higher (t[220]= 19.991,
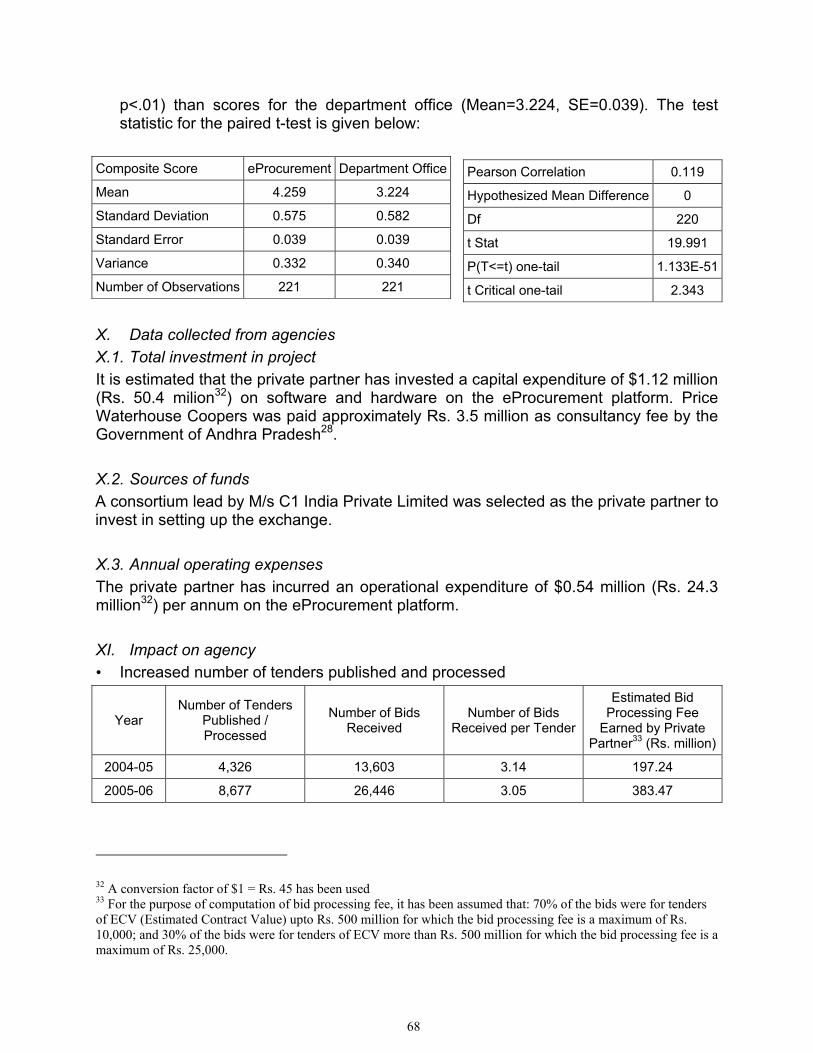
68
p<.01) than scores for the department office (Mean=3.224, SE=0.039). The test statistic for the paired t-test is given below:
X. Data collected from agencies X.1. Total investment in project It is estimated that the private partner has invested a capital expenditure of $1.12 million (Rs. 50.4 milion32) on software and hardware on the eProcurement platform. Price Waterhouse Coopers was paid approximately Rs. 3.5 million as consultancy fee by the Government of Andhra Pradesh28. X.2. Sources of funds A consortium lead by M/s C1 India Private Limited was selected as the private partner to invest in setting up the exchange. X.3. Annual operating expenses The private partner has incurred an operational expenditure of $0.54 million (Rs. 24.3 million32) per annum on the eProcurement platform. XI. Impact on agency • Increased number of tenders published and processed
Year Number of Tenders
Published / Processed
Number of Bids Received
Number of Bids Received per Tender
Estimated Bid Processing Fee
Earned by Private Partner33 (Rs. million)
2004-05 4,326 13,603 3.14 197.24
2005-06 8,677 26,446 3.05 383.47
32 A conversion factor of $1 = Rs. 45 has been used 33 For the purpose of computation of bid processing fee, it has been assumed that: 70% of the bids were for tenders of ECV (Estimated Contract Value) upto Rs. 500 million for which the bid processing fee is a maximum of Rs. 10,000; and 30% of the bids were for tenders of ECV more than Rs. 500 million for which the bid processing fee is a maximum of Rs. 25,000.
Composite Score eProcurement Department Office
Mean 4.259 3.224
Standard Deviation 0.575 0.582
Standard Error 0.039 0.039
Variance 0.332 0.340
Number of Observations 221 221
Pearson Correlation 0.119
Hypothesized Mean Difference 0
Df 220
t Stat 19.991
P(T<=t) one-tail 1.133E-51
t Critical one-tail 2.343
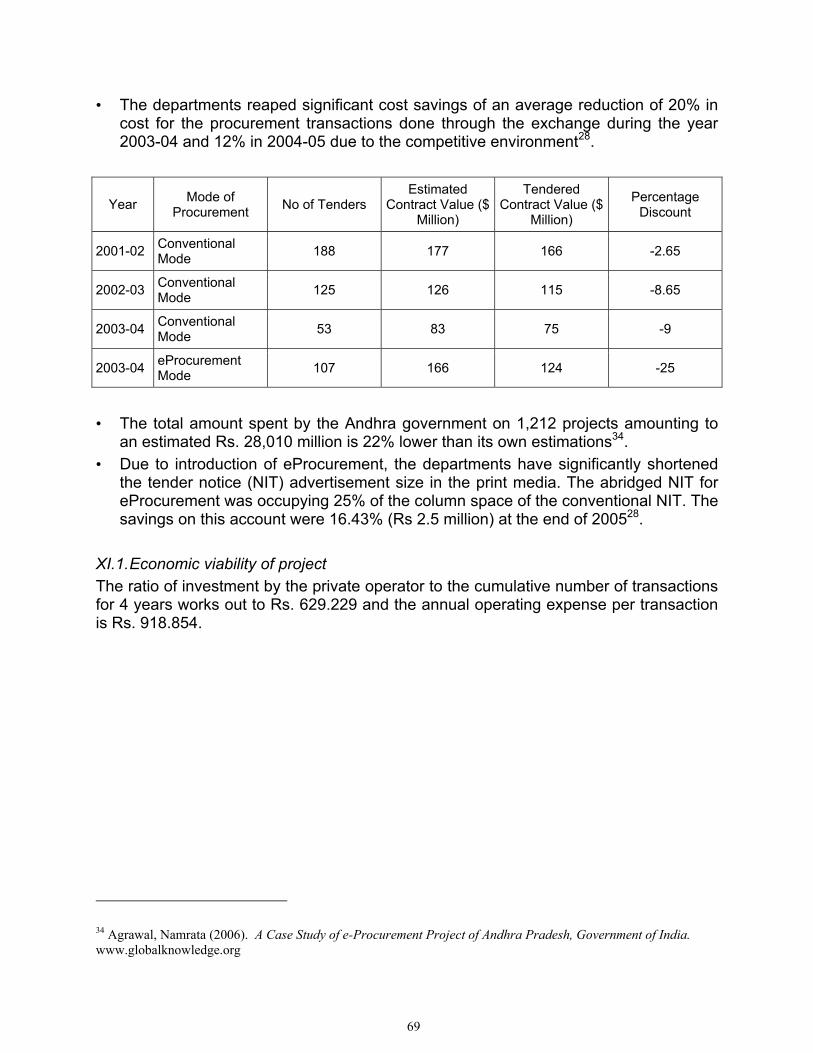
69
• The departments reaped significant cost savings of an average reduction of 20% in cost for the procurement transactions done through the exchange during the year 2003-04 and 12% in 2004-05 due to the competitive environment28.
Year Mode of Procurement No of Tenders
Estimated Contract Value ($
Million)
Tendered Contract Value ($
Million)
Percentage Discount
2001-02 Conventional Mode 188 177 166 -2.65
2002-03 Conventional Mode 125 126 115 -8.65
2003-04 Conventional Mode 53 83 75 -9
2003-04 eProcurement Mode 107 166 124 -25
• The total amount spent by the Andhra government on 1,212 projects amounting to
an estimated Rs. 28,010 million is 22% lower than its own estimations34. • Due to introduction of eProcurement, the departments have significantly shortened
the tender notice (NIT) advertisement size in the print media. The abridged NIT for eProcurement was occupying 25% of the column space of the conventional NIT. The savings on this account were 16.43% (Rs 2.5 million) at the end of 200528.
XI.1. Economic viability of project The ratio of investment by the private operator to the cumulative number of transactions for 4 years works out to Rs. 629.229 and the annual operating expense per transaction is Rs. 918.854.
34 Agrawal, Namrata (2006). A Case Study of e-Procurement Project of Andhra Pradesh, Government of India. www.globalknowledge.org
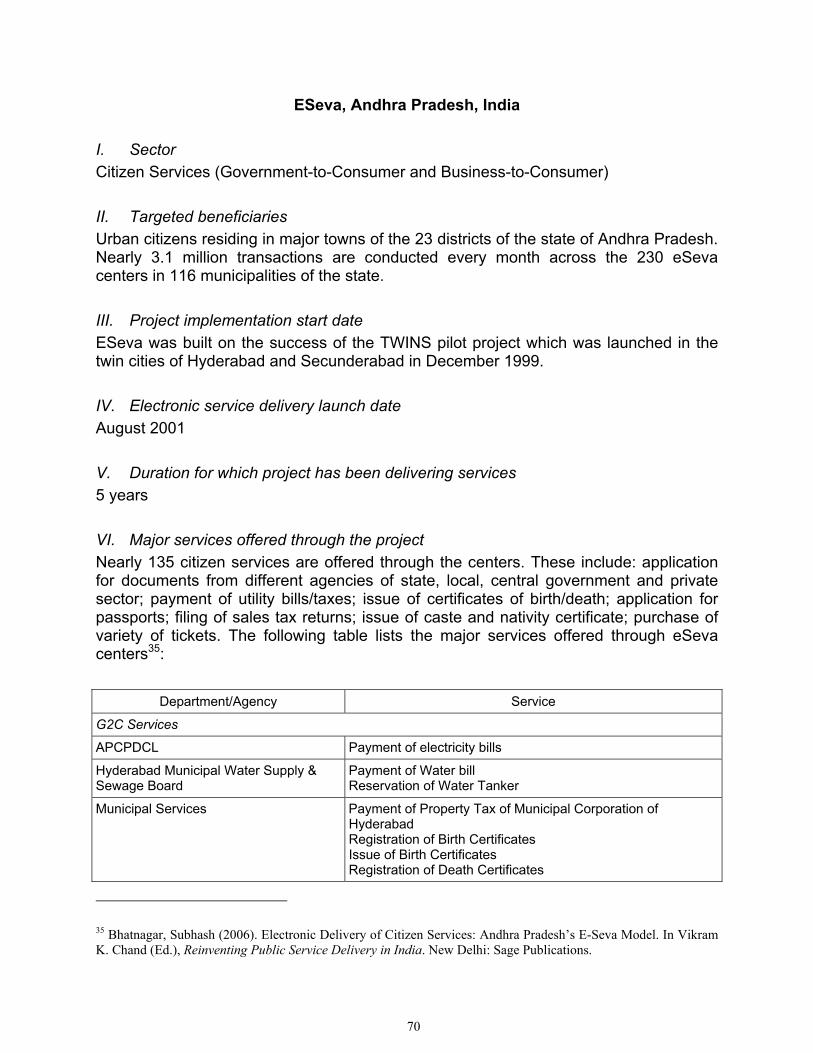
70
ESeva, Andhra Pradesh, India I. Sector Citizen Services (Government-to-Consumer and Business-to-Consumer) II. Targeted beneficiaries Urban citizens residing in major towns of the 23 districts of the state of Andhra Pradesh. Nearly 3.1 million transactions are conducted every month across the 230 eSeva centers in 116 municipalities of the state. III. Project implementation start date ESeva was built on the success of the TWINS pilot project which was launched in the twin cities of Hyderabad and Secunderabad in December 1999. IV. Electronic service delivery launch date August 2001 V. Duration for which project has been delivering services 5 years VI. Major services offered through the project Nearly 135 citizen services are offered through the centers. These include: application for documents from different agencies of state, local, central government and private sector; payment of utility bills/taxes; issue of certificates of birth/death; application for passports; filing of sales tax returns; issue of caste and nativity certificate; purchase of variety of tickets. The following table lists the major services offered through eSeva centers35:
Department/Agency Service
G2C Services
APCPDCL Payment of electricity bills
Hyderabad Municipal Water Supply & Sewage Board
Payment of Water bill Reservation of Water Tanker
Municipal Services Payment of Property Tax of Municipal Corporation of Hyderabad Registration of Birth Certificates Issue of Birth Certificates Registration of Death Certificates
35 Bhatnagar, Subhash (2006). Electronic Delivery of Citizen Services: Andhra Pradesh’s E-Seva Model. In Vikram K. Chand (Ed.), Reinventing Public Service Delivery in India. New Delhi: Sage Publications.
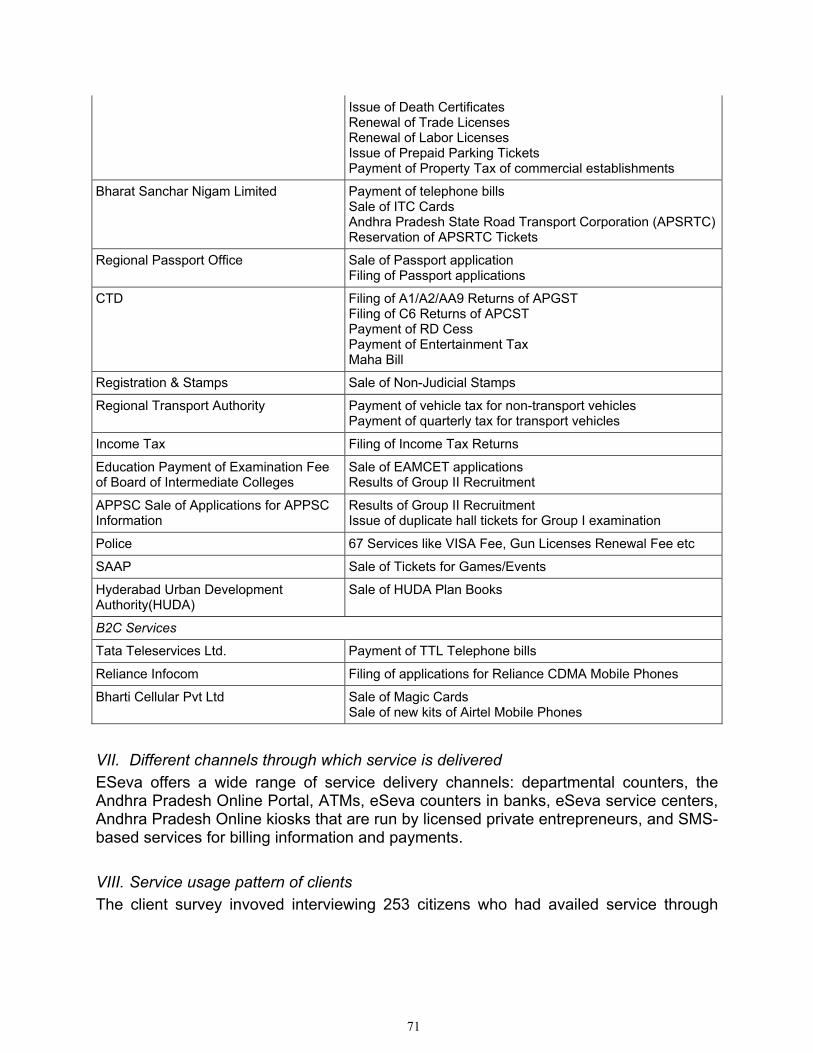
71
Issue of Death Certificates Renewal of Trade Licenses Renewal of Labor Licenses Issue of Prepaid Parking Tickets Payment of Property Tax of commercial establishments
Bharat Sanchar Nigam Limited Payment of telephone bills Sale of ITC Cards Andhra Pradesh State Road Transport Corporation (APSRTC)Reservation of APSRTC Tickets
Regional Passport Office Sale of Passport application Filing of Passport applications
CTD Filing of A1/A2/AA9 Returns of APGST Filing of C6 Returns of APCST Payment of RD Cess Payment of Entertainment Tax Maha Bill
Registration & Stamps Sale of Non-Judicial Stamps
Regional Transport Authority Payment of vehicle tax for non-transport vehicles Payment of quarterly tax for transport vehicles
Income Tax Filing of Income Tax Returns
Education Payment of Examination Fee of Board of Intermediate Colleges
Sale of EAMCET applications Results of Group II Recruitment
APPSC Sale of Applications for APPSC Information
Results of Group II Recruitment Issue of duplicate hall tickets for Group I examination
Police 67 Services like VISA Fee, Gun Licenses Renewal Fee etc
SAAP Sale of Tickets for Games/Events
Hyderabad Urban Development Authority(HUDA)
Sale of HUDA Plan Books
B2C Services
Tata Teleservices Ltd. Payment of TTL Telephone bills
Reliance Infocom Filing of applications for Reliance CDMA Mobile Phones
Bharti Cellular Pvt Ltd Sale of Magic Cards Sale of new kits of Airtel Mobile Phones
VII. Different channels through which service is delivered ESeva offers a wide range of service delivery channels: departmental counters, the Andhra Pradesh Online Portal, ATMs, eSeva counters in banks, eSeva service centers, Andhra Pradesh Online kiosks that are run by licensed private entrepreneurs, and SMS-based services for billing information and payments. VIII. Service usage pattern of clients The client survey invoved interviewing 253 citizens who had availed service through
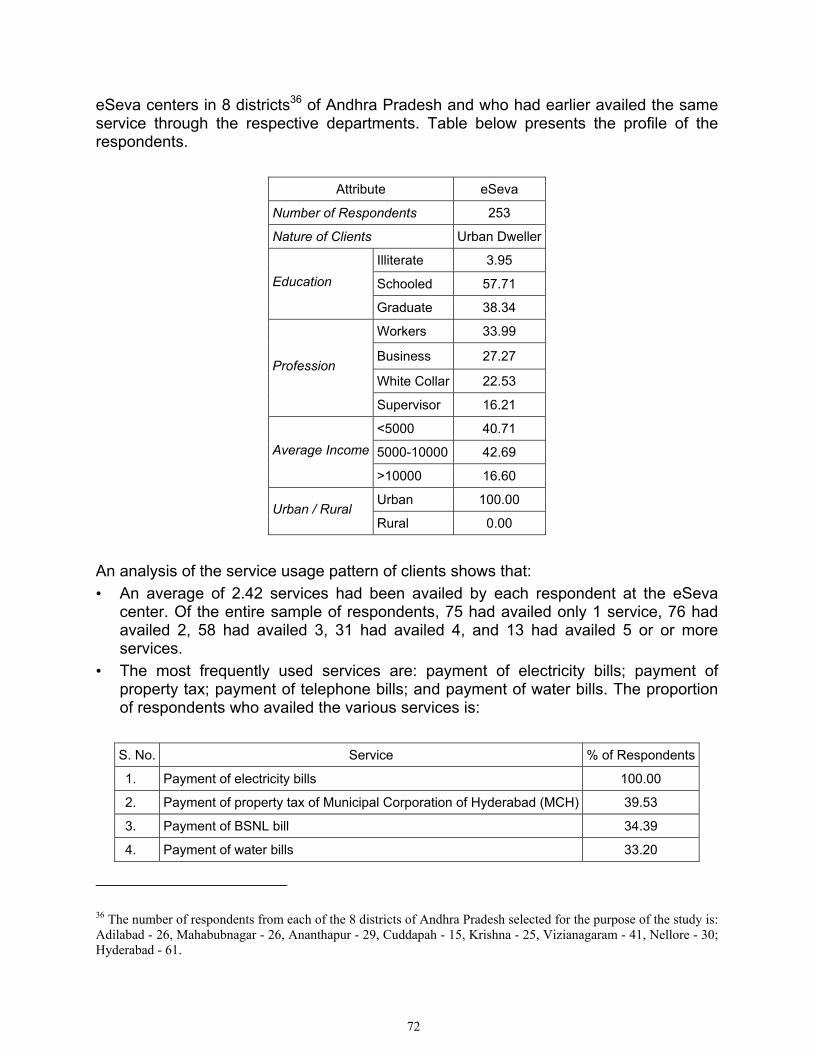
72
eSeva centers in 8 districts36 of Andhra Pradesh and who had earlier availed the same service through the respective departments. Table below presents the profile of the respondents.
Attribute eSeva
Number of Respondents 253
Nature of Clients Urban Dweller
Illiterate 3.95
Schooled 57.71 Education
Graduate 38.34
Workers 33.99
Business 27.27
White Collar 22.53 Profession
Supervisor 16.21
<5000 40.71
5000-10000 42.69 Average Income
>10000 16.60
Urban 100.00 Urban / Rural
Rural 0.00
An analysis of the service usage pattern of clients shows that: • An average of 2.42 services had been availed by each respondent at the eSeva
center. Of the entire sample of respondents, 75 had availed only 1 service, 76 had availed 2, 58 had availed 3, 31 had availed 4, and 13 had availed 5 or or more services.
• The most frequently used services are: payment of electricity bills; payment of property tax; payment of telephone bills; and payment of water bills. The proportion of respondents who availed the various services is:
S. No. Service % of Respondents
1. Payment of electricity bills 100.00
2. Payment of property tax of Municipal Corporation of Hyderabad (MCH) 39.53
3. Payment of BSNL bill 34.39
4. Payment of water bills 33.20
36 The number of respondents from each of the 8 districts of Andhra Pradesh selected for the purpose of the study is: Adilabad - 26, Mahabubnagar - 26, Ananthapur - 29, Cuddapah - 15, Krishna - 25, Vizianagaram - 41, Nellore - 30; Hyderabad - 61.
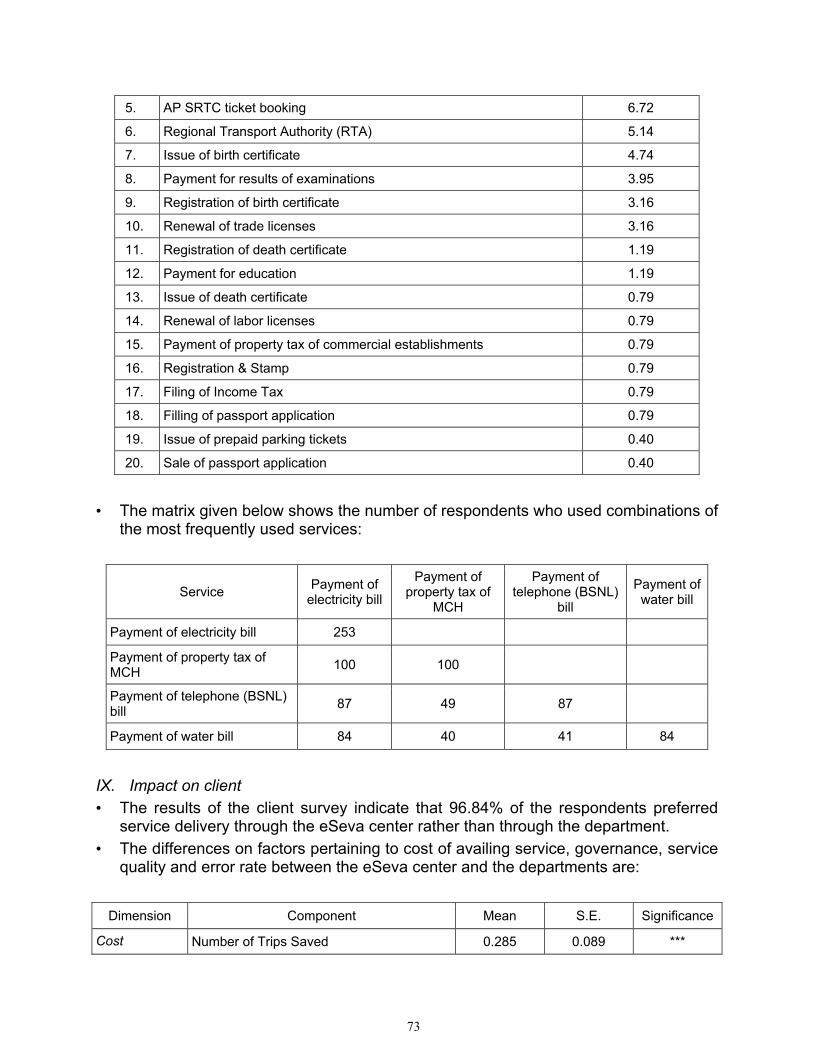
73
5. AP SRTC ticket booking 6.72
6. Regional Transport Authority (RTA) 5.14
7. Issue of birth certificate 4.74
8. Payment for results of examinations 3.95
9. Registration of birth certificate 3.16
10. Renewal of trade licenses 3.16
11. Registration of death certificate 1.19
12. Payment for education 1.19
13. Issue of death certificate 0.79
14. Renewal of labor licenses 0.79
15. Payment of property tax of commercial establishments 0.79
16. Registration & Stamp 0.79
17. Filing of Income Tax 0.79
18. Filling of passport application 0.79
19. Issue of prepaid parking tickets 0.40
20. Sale of passport application 0.40
• The matrix given below shows the number of respondents who used combinations of
the most frequently used services:
Service Payment of electricity bill
Payment of property tax of
MCH
Payment of telephone (BSNL)
bill
Payment of water bill
Payment of electricity bill 253
Payment of property tax of MCH 100 100
Payment of telephone (BSNL) bill 87 49 87
Payment of water bill 84 40 41 84
IX. Impact on client • The results of the client survey indicate that 96.84% of the respondents preferred
service delivery through the eSeva center rather than through the department. • The differences on factors pertaining to cost of availing service, governance, service
quality and error rate between the eSeva center and the departments are:
Dimension Component Mean S.E. Significance
Cost Number of Trips Saved 0.285 0.089 ***
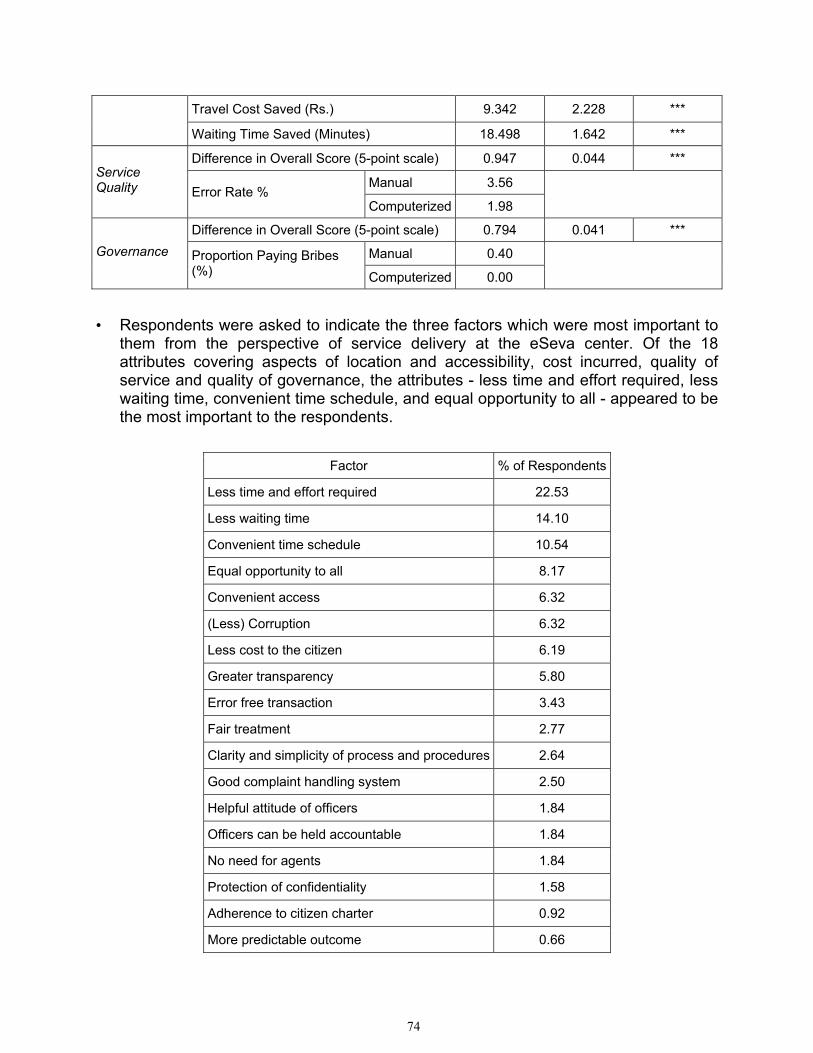
74
Travel Cost Saved (Rs.) 9.342 2.228 *** Waiting Time Saved (Minutes) 18.498 1.642 *** Difference in Overall Score (5-point scale) 0.947 0.044 ***
Manual 3.56 Service Quality Error Rate %
Computerized 1.98
Difference in Overall Score (5-point scale) 0.794 0.041 ***
Manual 0.40 Governance Proportion Paying Bribes (%) Computerized 0.00
• Respondents were asked to indicate the three factors which were most important to
them from the perspective of service delivery at the eSeva center. Of the 18 attributes covering aspects of location and accessibility, cost incurred, quality of service and quality of governance, the attributes - less time and effort required, less waiting time, convenient time schedule, and equal opportunity to all - appeared to be the most important to the respondents.
Factor % of Respondents
Less time and effort required 22.53
Less waiting time 14.10
Convenient time schedule 10.54
Equal opportunity to all 8.17
Convenient access 6.32
(Less) Corruption 6.32
Less cost to the citizen 6.19
Greater transparency 5.80
Error free transaction 3.43
Fair treatment 2.77
Clarity and simplicity of process and procedures 2.64
Good complaint handling system 2.50
Helpful attitude of officers 1.84
Officers can be held accountable 1.84
No need for agents 1.84
Protection of confidentiality 1.58
Adherence to citizen charter 0.92
More predictable outcome 0.66
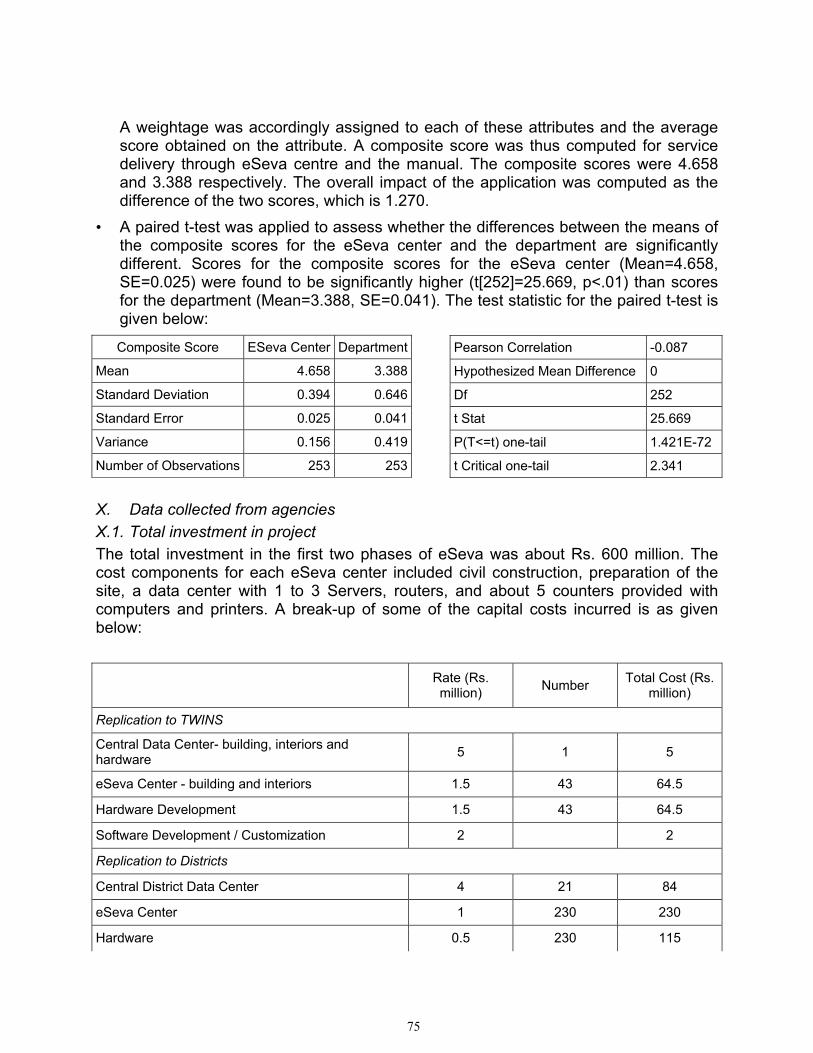
75
A weightage was accordingly assigned to each of these attributes and the average score obtained on the attribute. A composite score was thus computed for service delivery through eSeva centre and the manual. The composite scores were 4.658 and 3.388 respectively. The overall impact of the application was computed as the difference of the two scores, which is 1.270.
• A paired t-test was applied to assess whether the differences between the means of the composite scores for the eSeva center and the department are significantly different. Scores for the composite scores for the eSeva center (Mean=4.658, SE=0.025) were found to be significantly higher (t[252]=25.669, p<.01) than scores for the department (Mean=3.388, SE=0.041). The test statistic for the paired t-test is given below:
X. Data collected from agencies X.1. Total investment in project The total investment in the first two phases of eSeva was about Rs. 600 million. The cost components for each eSeva center included civil construction, preparation of the site, a data center with 1 to 3 Servers, routers, and about 5 counters provided with computers and printers. A break-up of some of the capital costs incurred is as given below:
Rate (Rs. million) Number Total Cost (Rs.
million)
Replication to TWINS
Central Data Center- building, interiors and hardware 5 1 5
eSeva Center - building and interiors 1.5 43 64.5
Hardware Development 1.5 43 64.5
Software Development / Customization 2 2
Replication to Districts
Central District Data Center 4 21 84
eSeva Center 1 230 230
Hardware 0.5 230 115
Composite Score ESeva Center Department
Mean 4.658 3.388
Standard Deviation 0.394 0.646
Standard Error 0.025 0.041
Variance 0.156 0.419
Number of Observations 253 253
Pearson Correlation -0.087
Hypothesized Mean Difference 0
Df 252
t Stat 25.669
P(T<=t) one-tail 1.421E-72
t Critical one-tail 2.341
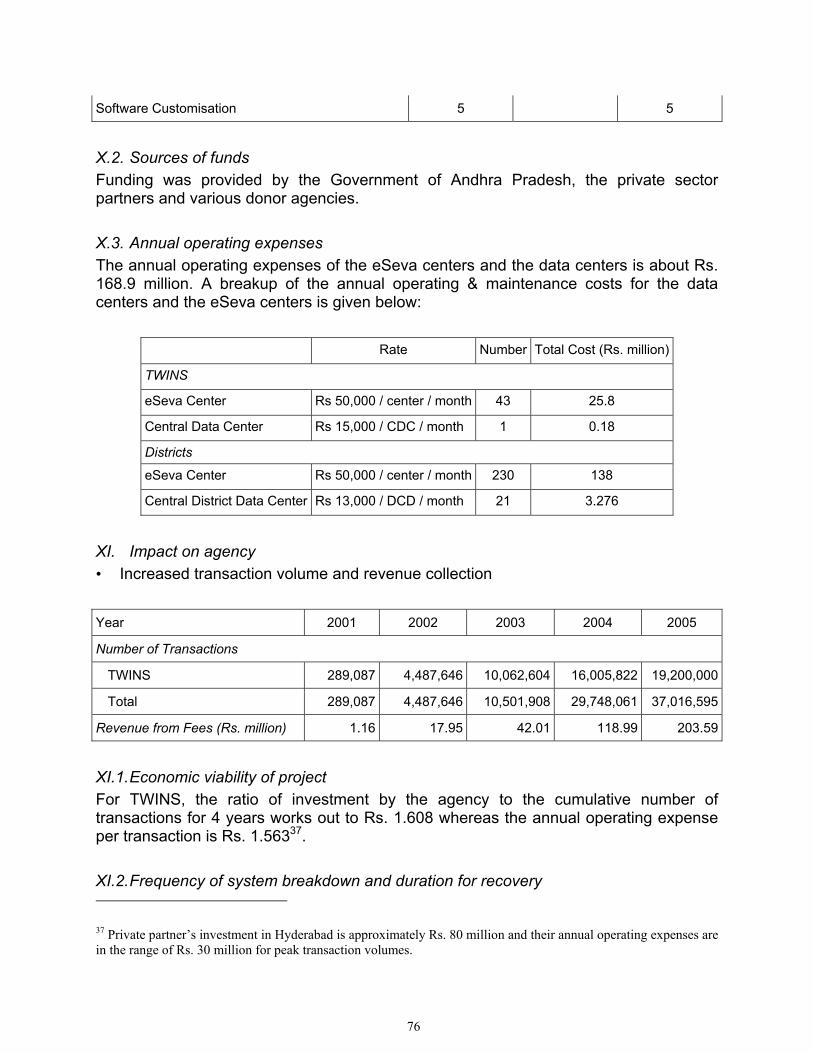
76
Software Customisation 5 5
X.2. Sources of funds Funding was provided by the Government of Andhra Pradesh, the private sector partners and various donor agencies. X.3. Annual operating expenses The annual operating expenses of the eSeva centers and the data centers is about Rs. 168.9 million. A breakup of the annual operating & maintenance costs for the data centers and the eSeva centers is given below:
Rate Number Total Cost (Rs. million)
TWINS
eSeva Center Rs 50,000 / center / month 43 25.8
Central Data Center Rs 15,000 / CDC / month 1 0.18
Districts
eSeva Center Rs 50,000 / center / month 230 138
Central District Data Center Rs 13,000 / DCD / month 21 3.276
XI. Impact on agency • Increased transaction volume and revenue collection Year 2001 2002 2003 2004 2005
Number of Transactions
TWINS 289,087 4,487,646 10,062,604 16,005,822 19,200,000
Total 289,087 4,487,646 10,501,908 29,748,061 37,016,595
Revenue from Fees (Rs. million) 1.16 17.95 42.01 118.99 203.59
XI.1. Economic viability of project For TWINS, the ratio of investment by the agency to the cumulative number of transactions for 4 years works out to Rs. 1.608 whereas the annual operating expense per transaction is Rs. 1.56337. XI.2. Frequency of system breakdown and duration for recovery 37 Private partner’s investment in Hyderabad is approximately Rs. 80 million and their annual operating expenses are in the range of Rs. 30 million for peak transaction volumes.
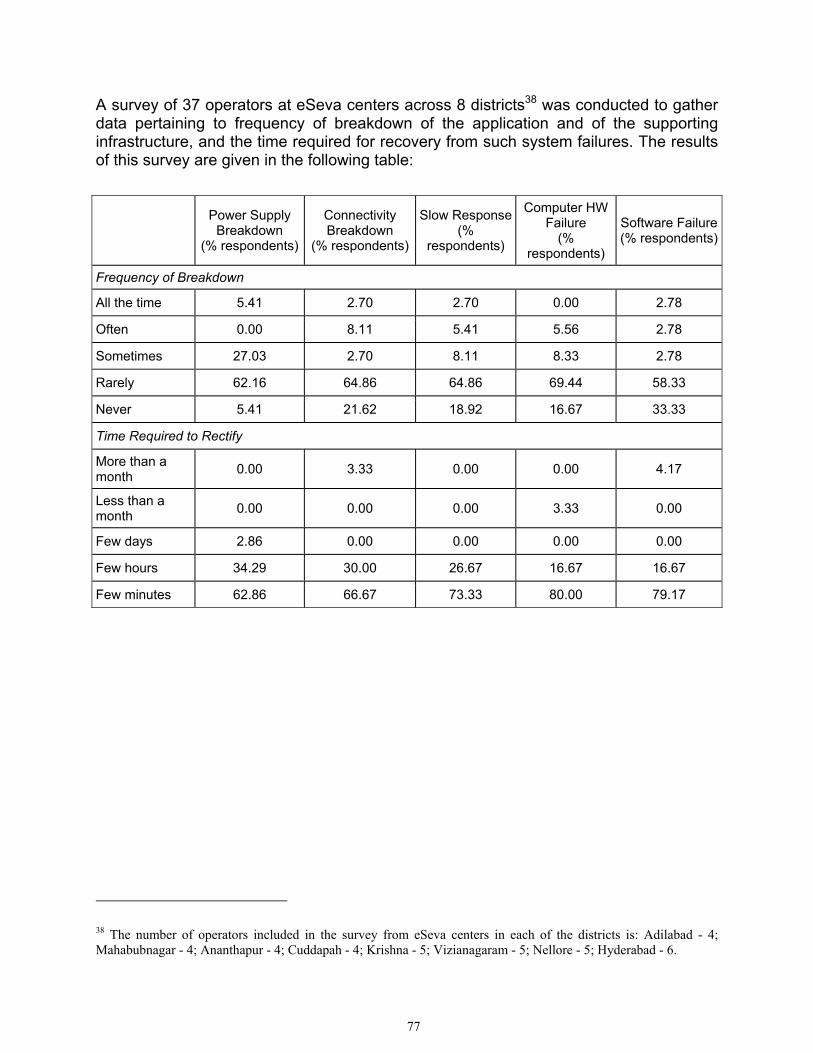
77
A survey of 37 operators at eSeva centers across 8 districts38 was conducted to gather data pertaining to frequency of breakdown of the application and of the supporting infrastructure, and the time required for recovery from such system failures. The results of this survey are given in the following table:
Power Supply
Breakdown (% respondents)
Connectivity Breakdown
(% respondents)
Slow Response(%
respondents)
Computer HW Failure
(% respondents)
Software Failure(% respondents)
Frequency of Breakdown
All the time 5.41 2.70 2.70 0.00 2.78
Often 0.00 8.11 5.41 5.56 2.78
Sometimes 27.03 2.70 8.11 8.33 2.78
Rarely 62.16 64.86 64.86 69.44 58.33
Never 5.41 21.62 18.92 16.67 33.33
Time Required to Rectify
More than a month 0.00 3.33 0.00 0.00 4.17
Less than a month 0.00 0.00 0.00 3.33 0.00
Few days 2.86 0.00 0.00 0.00 0.00
Few hours 34.29 30.00 26.67 16.67 16.67
Few minutes 62.86 66.67 73.33 80.00 79.17
38 The number of operators included in the survey from eSeva centers in each of the districts is: Adilabad - 4; Mahabubnagar - 4; Ananthapur - 4; Cuddapah - 4; Krishna - 5; Vizianagaram - 5; Nellore - 5; Hyderabad - 6.
78
Computerized Interstate Check Posts, Gujarat I. Sector Transport II. Targeted beneficiaries Drivers of commercial vehicles crossing the inter-state check posts, trucking companies or transporters who ferry goods for their clients, and the organizations (manufacturing, trading, etc.) whose goods are transported. III. Project implementation start date The total solution provider (TSP), M/s Design Solutions (P) Limited, started development of the system in September 1999. The work entailed seamless integration of the various technology components at all the 10 check posts and development of the software application for the computers at the check post and the Central Monitoring Centre at Ahmedabad39. IV. Electronic service delivery launch date Implementation at the first check post was completed in March 2000 and by July 2000 the remaining 9 check posts were commissioned39. V. Duration for which project has been delivering services More than 6 years VI. Major activities undertaken at the check post • Levying of penalty for overloading and over-dimensioning if the vehicle passing
through the check post violates the acceptable loading and dimensioning norms. • Verification of essential documents like the Vehicle Registration Book, Driver's
license, Permit to enter the state or the National Permit, Pollution Under Control Certificate, insurance documents and delivery documents.
• Inspection of the vehicle to check for broken or damaged headlights, non-standard license plates, etc.
• Collection of road tax dues, if any. VII. Service usage pattern of clients The client survey involved interviewing 240 drivers of trucks which had crossed any of
39 Centre for Electronic Governance, IIMA (2002). Computerized Interstate Check Posts of Gujarat State, India: A Cost Benefit Evaluation Study. http://www.iimahd.ernet.in/egov/
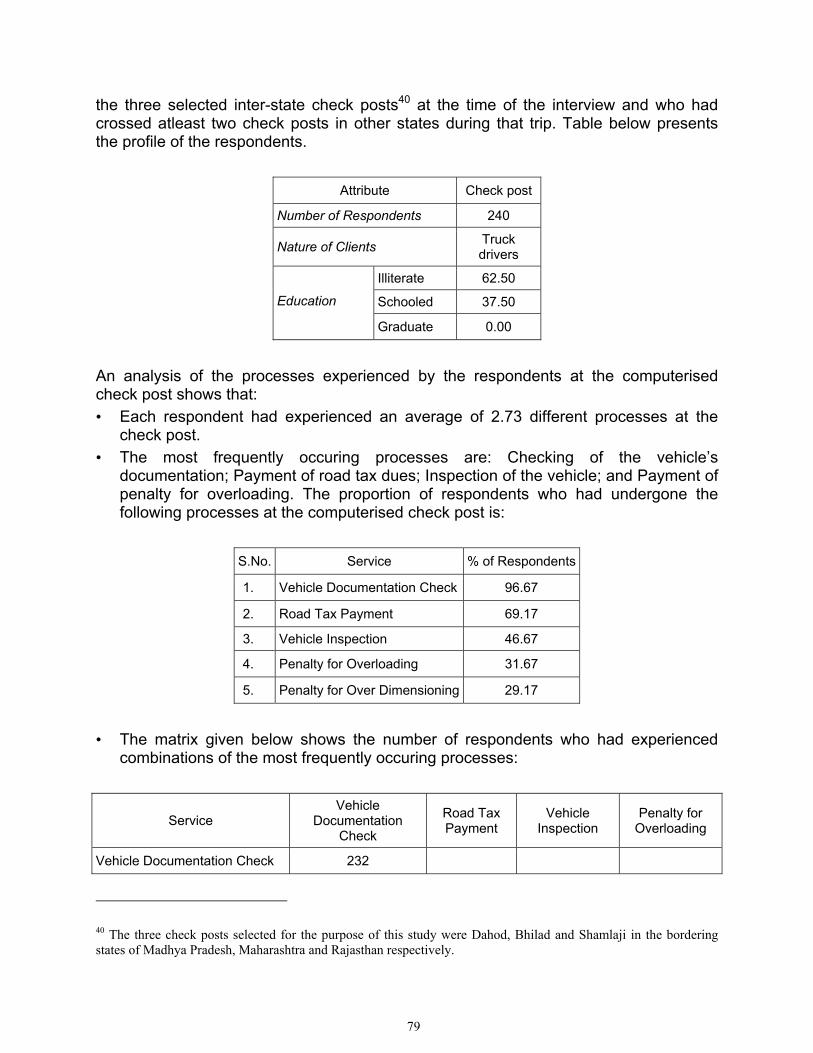
79
the three selected inter-state check posts40 at the time of the interview and who had crossed atleast two check posts in other states during that trip. Table below presents the profile of the respondents.
Attribute Check post
Number of Respondents 240
Nature of Clients Truck drivers
Illiterate 62.50
Schooled 37.50 Education
Graduate 0.00
An analysis of the processes experienced by the respondents at the computerised check post shows that: • Each respondent had experienced an average of 2.73 different processes at the
check post. • The most frequently occuring processes are: Checking of the vehicle’s
documentation; Payment of road tax dues; Inspection of the vehicle; and Payment of penalty for overloading. The proportion of respondents who had undergone the following processes at the computerised check post is:
S.No. Service % of Respondents
1. Vehicle Documentation Check 96.67
2. Road Tax Payment 69.17
3. Vehicle Inspection 46.67
4. Penalty for Overloading 31.67
5. Penalty for Over Dimensioning 29.17
• The matrix given below shows the number of respondents who had experienced
combinations of the most frequently occuring processes:
Service Vehicle
Documentation Check
Road Tax Payment
Vehicle Inspection
Penalty for Overloading
Vehicle Documentation Check 232
40 The three check posts selected for the purpose of this study were Dahod, Bhilad and Shamlaji in the bordering states of Madhya Pradesh, Maharashtra and Rajasthan respectively.
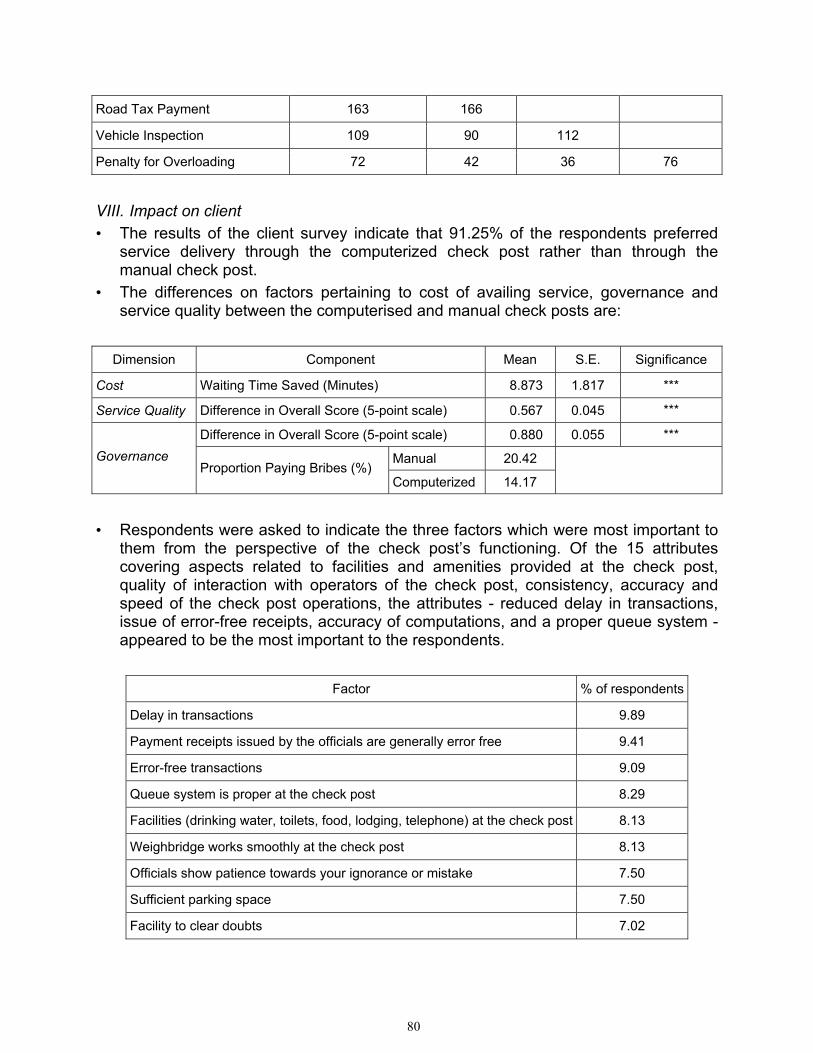
80
Road Tax Payment 163 166
Vehicle Inspection 109 90 112
Penalty for Overloading 72 42 36 76
VIII. Impact on client • The results of the client survey indicate that 91.25% of the respondents preferred
service delivery through the computerized check post rather than through the manual check post.
• The differences on factors pertaining to cost of availing service, governance and service quality between the computerised and manual check posts are:
Dimension Component Mean S.E. Significance
Cost Waiting Time Saved (Minutes) 8.873 1.817 ***
Service Quality Difference in Overall Score (5-point scale) 0.567 0.045 *** Difference in Overall Score (5-point scale) 0.880 0.055 ***
Manual 20.42 Governance Proportion Paying Bribes (%)
Computerized 14.17
• Respondents were asked to indicate the three factors which were most important to
them from the perspective of the check post’s functioning. Of the 15 attributes covering aspects related to facilities and amenities provided at the check post, quality of interaction with operators of the check post, consistency, accuracy and speed of the check post operations, the attributes - reduced delay in transactions, issue of error-free receipts, accuracy of computations, and a proper queue system - appeared to be the most important to the respondents.
Factor % of respondents
Delay in transactions 9.89
Payment receipts issued by the officials are generally error free 9.41
Error-free transactions 9.09
Queue system is proper at the check post 8.29
Facilities (drinking water, toilets, food, lodging, telephone) at the check post 8.13
Weighbridge works smoothly at the check post 8.13
Officials show patience towards your ignorance or mistake 7.50
Sufficient parking space 7.50
Facility to clear doubts 7.02
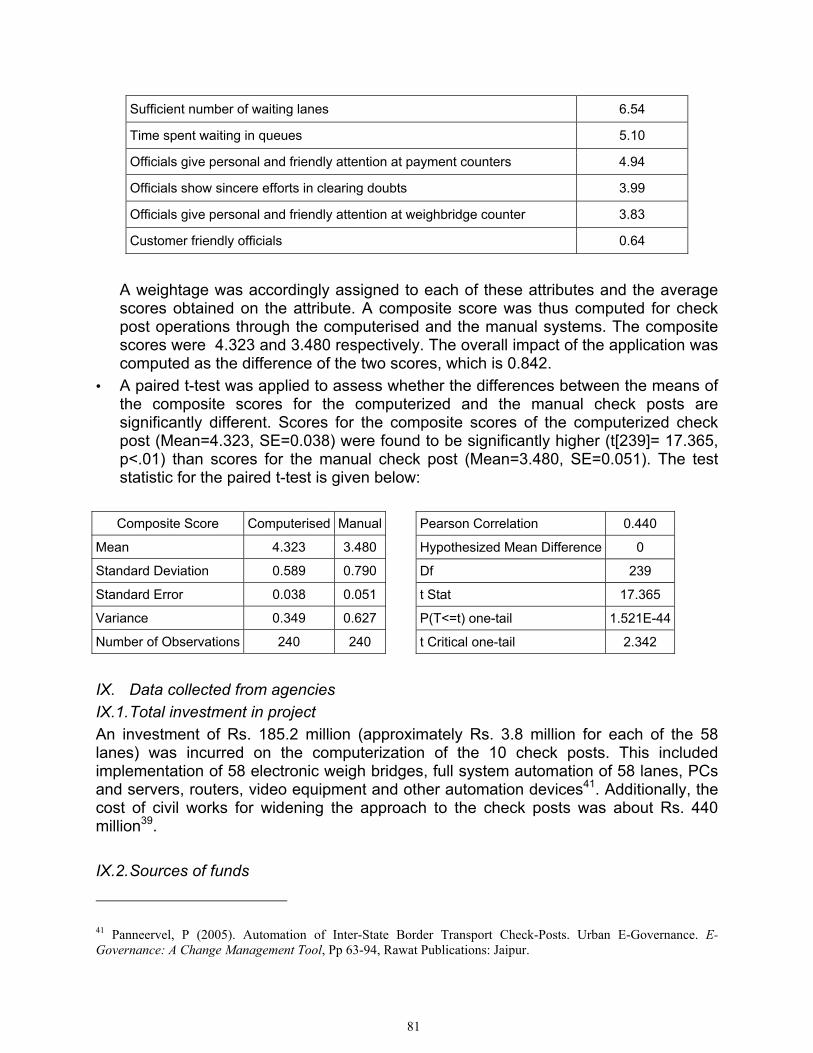
81
Sufficient number of waiting lanes 6.54
Time spent waiting in queues 5.10
Officials give personal and friendly attention at payment counters 4.94
Officials show sincere efforts in clearing doubts 3.99
Officials give personal and friendly attention at weighbridge counter 3.83
Customer friendly officials 0.64
A weightage was accordingly assigned to each of these attributes and the average scores obtained on the attribute. A composite score was thus computed for check post operations through the computerised and the manual systems. The composite scores were 4.323 and 3.480 respectively. The overall impact of the application was computed as the difference of the two scores, which is 0.842.
• A paired t-test was applied to assess whether the differences between the means of the composite scores for the computerized and the manual check posts are significantly different. Scores for the composite scores of the computerized check post (Mean=4.323, SE=0.038) were found to be significantly higher (t[239]= 17.365, p<.01) than scores for the manual check post (Mean=3.480, SE=0.051). The test statistic for the paired t-test is given below:
Composite Score Computerised Manual
Mean 4.323 3.480
Standard Deviation 0.589 0.790
Standard Error 0.038 0.051
Variance 0.349 0.627
Number of Observations 240 240
IX. Data collected from agencies IX.1. Total investment in project An investment of Rs. 185.2 million (approximately Rs. 3.8 million for each of the 58 lanes) was incurred on the computerization of the 10 check posts. This included implementation of 58 electronic weigh bridges, full system automation of 58 lanes, PCs and servers, routers, video equipment and other automation devices41. Additionally, the cost of civil works for widening the approach to the check posts was about Rs. 440 million39. IX.2. Sources of funds
41 Panneervel, P (2005). Automation of Inter-State Border Transport Check-Posts. Urban E-Governance. E-Governance: A Change Management Tool, Pp 63-94, Rawat Publications: Jaipur.
Pearson Correlation 0.440
Hypothesized Mean Difference 0
Df 239
t Stat 17.365
P(T<=t) one-tail 1.521E-44
t Critical one-tail 2.342
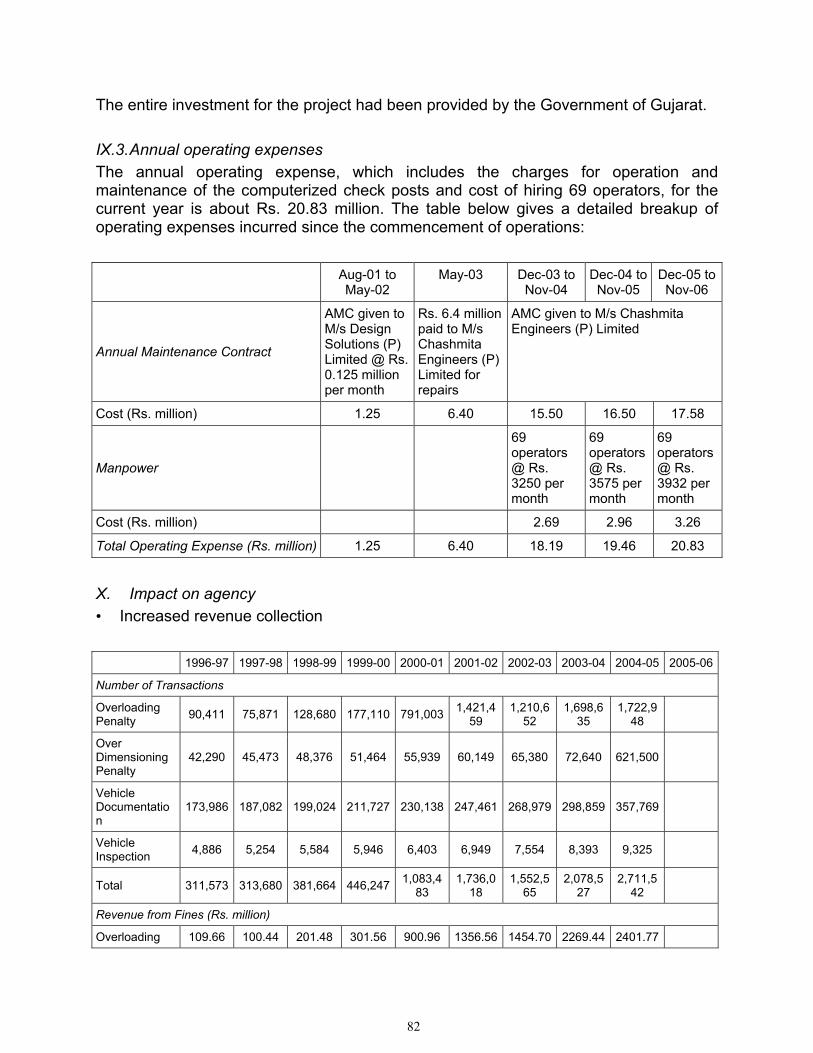
82
The entire investment for the project had been provided by the Government of Gujarat. IX.3. Annual operating expenses The annual operating expense, which includes the charges for operation and maintenance of the computerized check posts and cost of hiring 69 operators, for the current year is about Rs. 20.83 million. The table below gives a detailed breakup of operating expenses incurred since the commencement of operations: Aug-01 to
May-02 May-03 Dec-03 to
Nov-04 Dec-04 to
Nov-05 Dec-05 to
Nov-06
Annual Maintenance Contract
AMC given to M/s Design Solutions (P) Limited @ Rs. 0.125 million per month
Rs. 6.4 million paid to M/s Chashmita Engineers (P) Limited for repairs
AMC given to M/s Chashmita Engineers (P) Limited
Cost (Rs. million) 1.25 6.40 15.50 16.50 17.58
Manpower
69 operators @ Rs. 3250 per month
69 operators @ Rs. 3575 per month
69 operators @ Rs. 3932 per month
Cost (Rs. million) 2.69 2.96 3.26
Total Operating Expense (Rs. million) 1.25 6.40 18.19 19.46 20.83
X. Impact on agency • Increased revenue collection 1996-97 1997-98 1998-99 1999-00 2000-01 2001-02 2002-03 2003-04 2004-05 2005-06
Number of Transactions
Overloading Penalty 90,411 75,871 128,680 177,110 791,003 1,421,4
59 1,210,6
52 1,698,6
35 1,722,9
48
Over Dimensioning Penalty
42,290 45,473 48,376 51,464 55,939 60,149 65,380 72,640 621,500
Vehicle Documentation
173,986 187,082 199,024 211,727 230,138 247,461 268,979 298,859 357,769
Vehicle Inspection 4,886 5,254 5,584 5,946 6,403 6,949 7,554 8,393 9,325
Total 311,573 313,680 381,664 446,247 1,083,483
1,736,018
1,552,565
2,078,527
2,711,542
Revenue from Fines (Rs. million)
Overloading 109.66 100.44 201.48 301.56 900.96 1356.56 1454.70 2269.44 2401.77
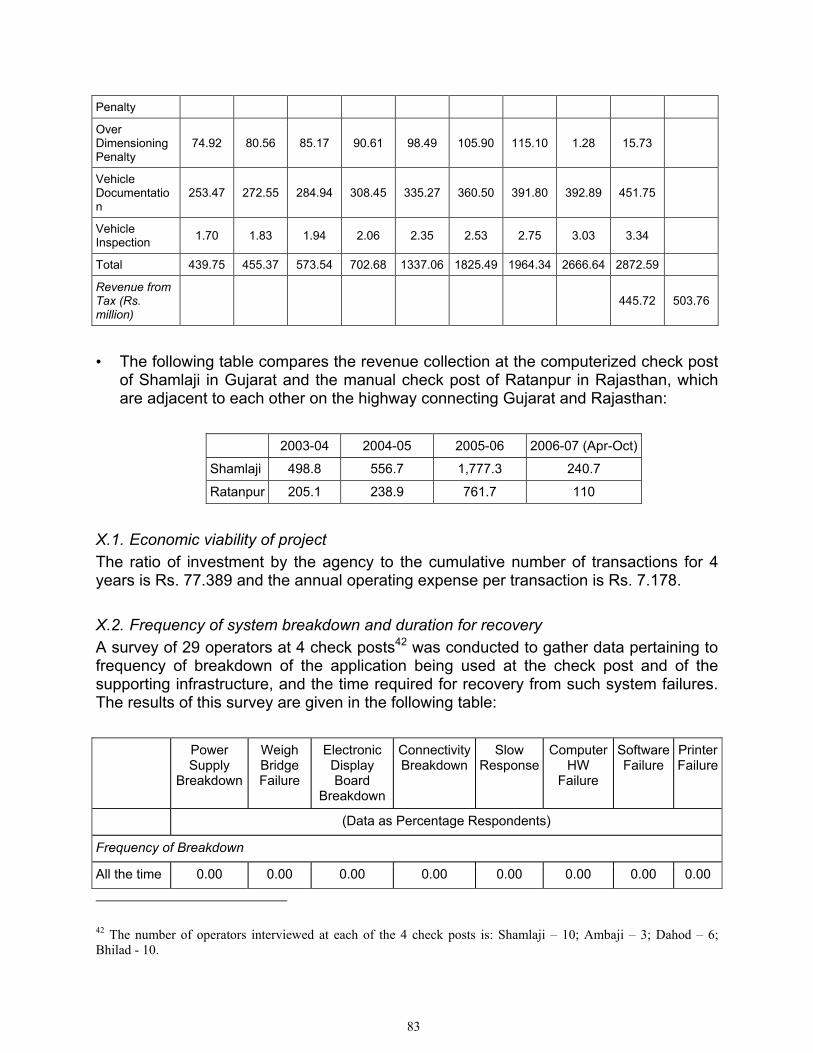
83
Penalty
Over Dimensioning Penalty
74.92 80.56 85.17 90.61 98.49 105.90 115.10 1.28 15.73
Vehicle Documentation
253.47 272.55 284.94 308.45 335.27 360.50 391.80 392.89 451.75
Vehicle Inspection 1.70 1.83 1.94 2.06 2.35 2.53 2.75 3.03 3.34
Total 439.75 455.37 573.54 702.68 1337.06 1825.49 1964.34 2666.64 2872.59
Revenue from Tax (Rs. million)
445.72 503.76
• The following table compares the revenue collection at the computerized check post
of Shamlaji in Gujarat and the manual check post of Ratanpur in Rajasthan, which are adjacent to each other on the highway connecting Gujarat and Rajasthan:
2003-04 2004-05 2005-06 2006-07 (Apr-Oct)
Shamlaji 498.8 556.7 1,777.3 240.7
Ratanpur 205.1 238.9 761.7 110
X.1. Economic viability of project The ratio of investment by the agency to the cumulative number of transactions for 4 years is Rs. 77.389 and the annual operating expense per transaction is Rs. 7.178. X.2. Frequency of system breakdown and duration for recovery A survey of 29 operators at 4 check posts42 was conducted to gather data pertaining to frequency of breakdown of the application being used at the check post and of the supporting infrastructure, and the time required for recovery from such system failures. The results of this survey are given in the following table:
Power Supply
Breakdown
Weigh Bridge Failure
Electronic Display Board
Breakdown
Connectivity Breakdown
Slow Response
Computer HW
Failure
Software Failure
Printer Failure
(Data as Percentage Respondents)
Frequency of Breakdown
All the time 0.00 0.00 0.00 0.00 0.00 0.00 0.00 0.00
42 The number of operators interviewed at each of the 4 check posts is: Shamlaji – 10; Ambaji – 3; Dahod – 6; Bhilad - 10.
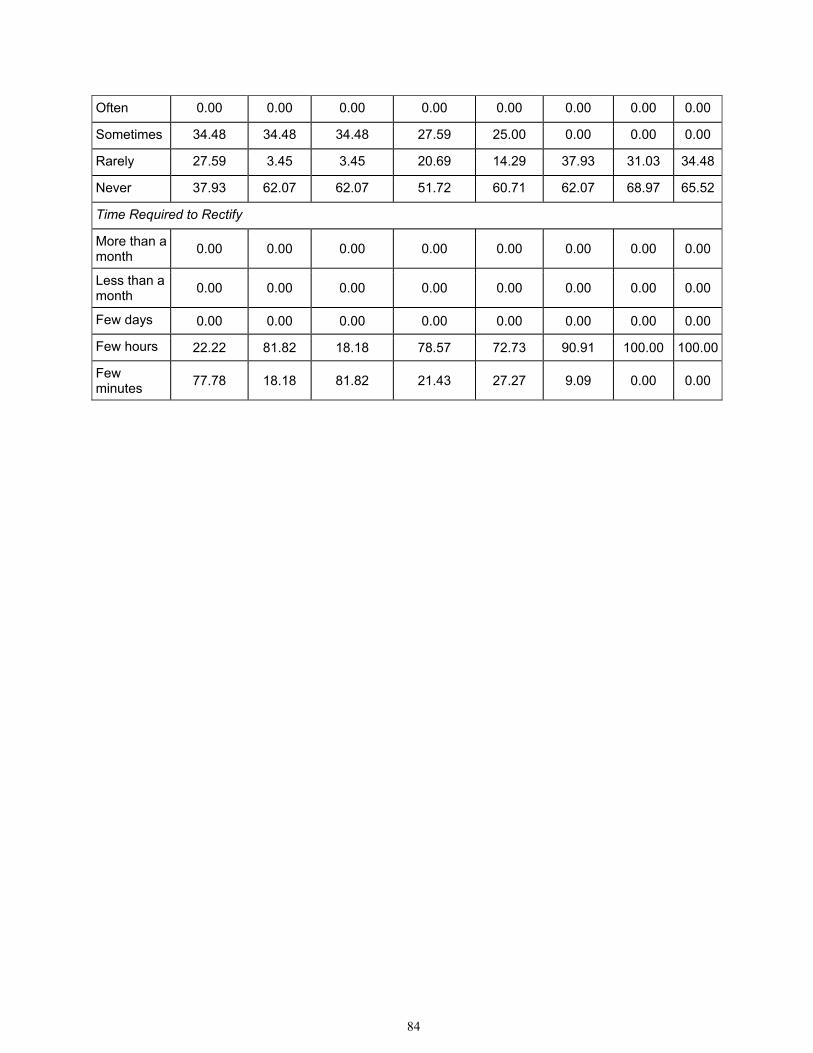
84
Often 0.00 0.00 0.00 0.00 0.00 0.00 0.00 0.00
Sometimes 34.48 34.48 34.48 27.59 25.00 0.00 0.00 0.00
Rarely 27.59 3.45 3.45 20.69 14.29 37.93 31.03 34.48
Never 37.93 62.07 62.07 51.72 60.71 62.07 68.97 65.52
Time Required to Rectify
More than a month 0.00 0.00 0.00 0.00 0.00 0.00 0.00 0.00
Less than a month 0.00 0.00 0.00 0.00 0.00 0.00 0.00 0.00
Few days 0.00 0.00 0.00 0.00 0.00 0.00 0.00 0.00
Few hours 22.22 81.82 18.18 78.57 72.73 90.91 100.00 100.00
Few minutes 77.78 18.18 81.82 21.43 27.27 9.09 0.00 0.00
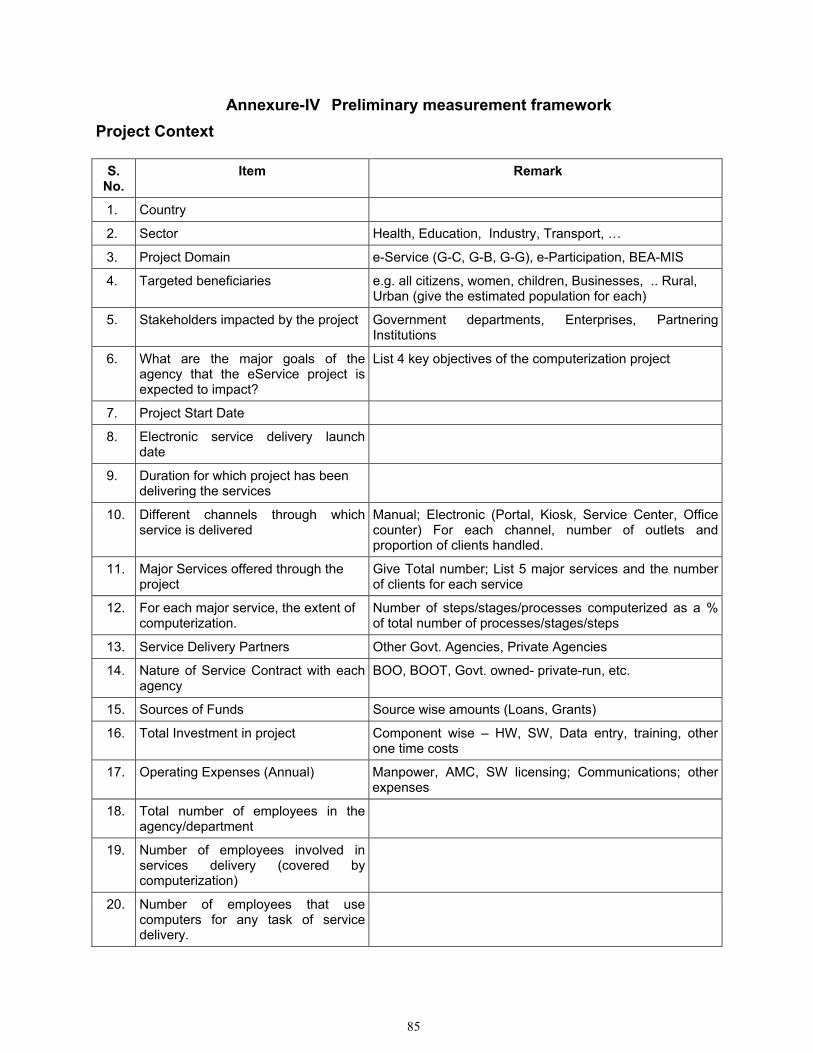
85
Annexure-IV Preliminary measurement framework Project Context
S. No.
Item Remark
1. Country
2. Sector Health, Education, Industry, Transport, …
3. Project Domain e-Service (G-C, G-B, G-G), e-Participation, BEA-MIS
4. Targeted beneficiaries e.g. all citizens, women, children, Businesses, .. Rural, Urban (give the estimated population for each)
5. Stakeholders impacted by the project Government departments, Enterprises, Partnering Institutions
6. What are the major goals of the agency that the eService project is expected to impact?
List 4 key objectives of the computerization project
7. Project Start Date
8. Electronic service delivery launch date
9. Duration for which project has been delivering the services
10. Different channels through which service is delivered
Manual; Electronic (Portal, Kiosk, Service Center, Office counter) For each channel, number of outlets and proportion of clients handled.
11. Major Services offered through the project
Give Total number; List 5 major services and the number of clients for each service
12. For each major service, the extent of computerization.
Number of steps/stages/processes computerized as a % of total number of processes/stages/steps
13. Service Delivery Partners Other Govt. Agencies, Private Agencies
14. Nature of Service Contract with each agency
BOO, BOOT, Govt. owned- private-run, etc.
15. Sources of Funds Source wise amounts (Loans, Grants)
16. Total Investment in project Component wise – HW, SW, Data entry, training, other one time costs
17. Operating Expenses (Annual) Manpower, AMC, SW licensing; Communications; other expenses
18. Total number of employees in the agency/department
19. Number of employees involved in services delivery (covered by computerization)
20. Number of employees that use computers for any task of service delivery.
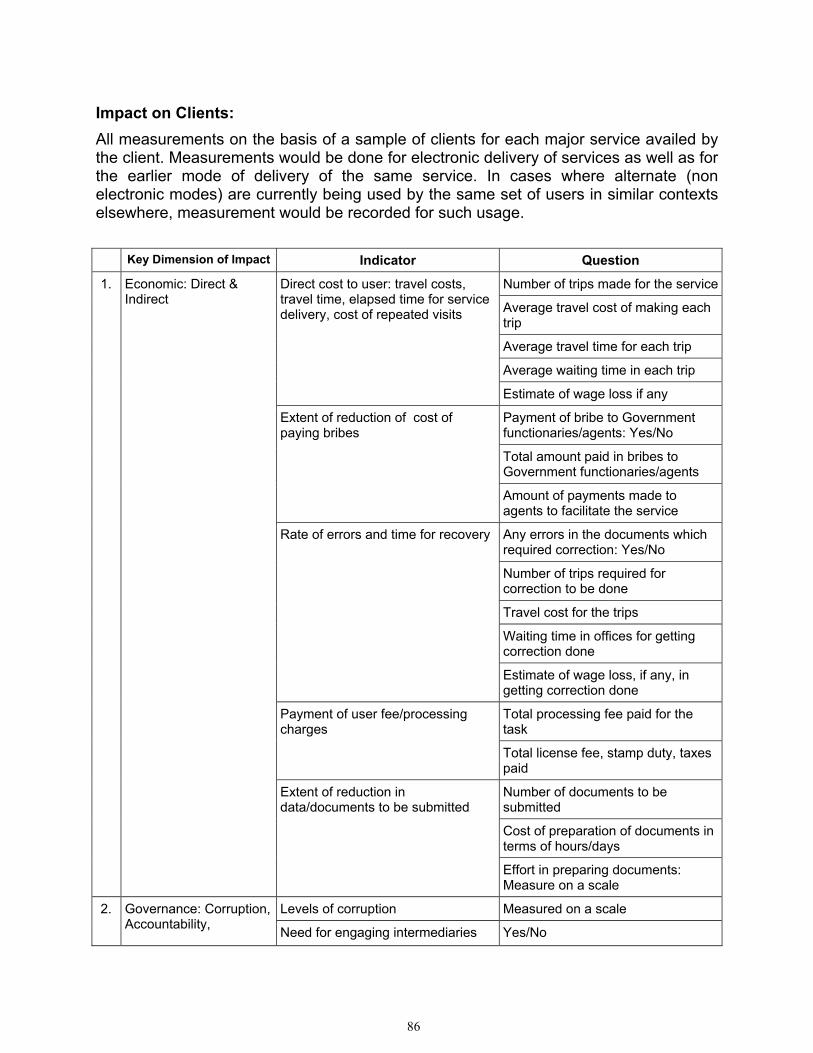
86
Impact on Clients: All measurements on the basis of a sample of clients for each major service availed by the client. Measurements would be done for electronic delivery of services as well as for the earlier mode of delivery of the same service. In cases where alternate (non electronic modes) are currently being used by the same set of users in similar contexts elsewhere, measurement would be recorded for such usage. Key Dimension of Impact Indicator Question
Number of trips made for the service
Average travel cost of making each trip
Average travel time for each trip
Average waiting time in each trip
Direct cost to user: travel costs, travel time, elapsed time for service delivery, cost of repeated visits
Estimate of wage loss if any
Payment of bribe to Government functionaries/agents: Yes/No
Total amount paid in bribes to Government functionaries/agents
Extent of reduction of cost of paying bribes
Amount of payments made to agents to facilitate the service
Any errors in the documents which required correction: Yes/No
Number of trips required for correction to be done
Travel cost for the trips
Waiting time in offices for getting correction done
Rate of errors and time for recovery
Estimate of wage loss, if any, in getting correction done
Total processing fee paid for the task
Payment of user fee/processing charges
Total license fee, stamp duty, taxes paid
Number of documents to be submitted
Cost of preparation of documents in terms of hours/days
1. Economic: Direct & Indirect
Extent of reduction in data/documents to be submitted
Effort in preparing documents: Measure on a scale
Levels of corruption Measured on a scale 2. Governance: Corruption, Accountability, Need for engaging intermediaries Yes/No
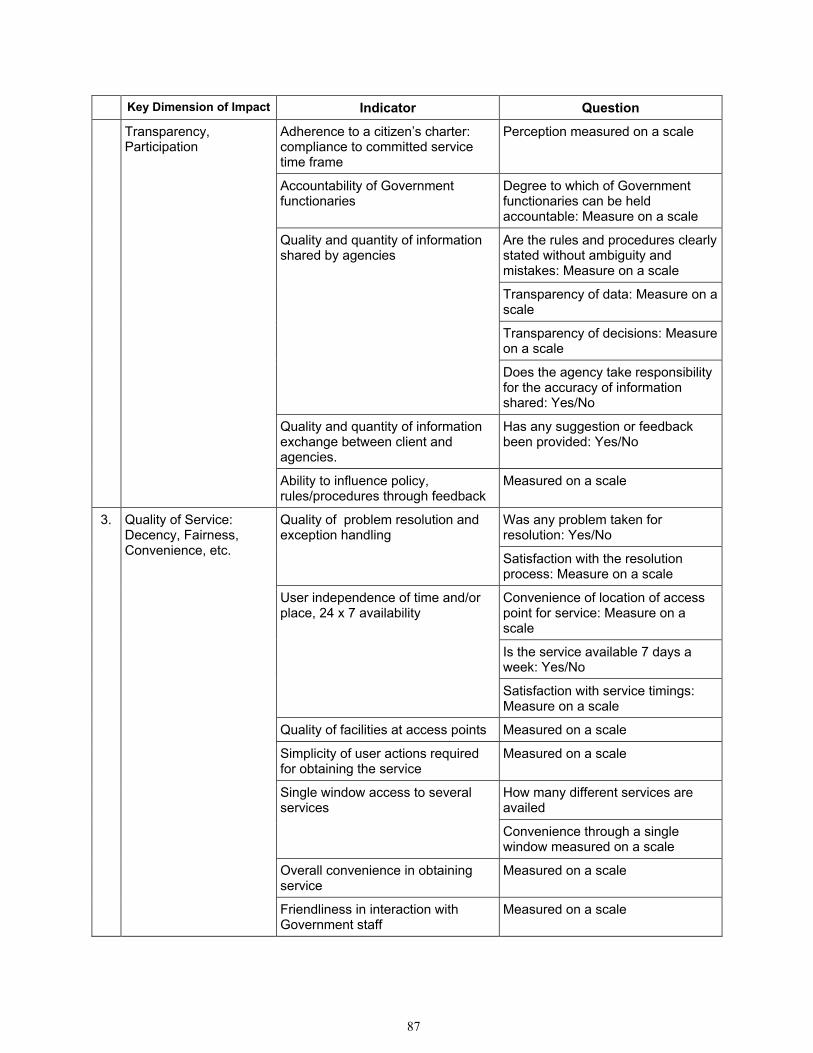
87
Key Dimension of Impact Indicator Question
Adherence to a citizen’s charter: compliance to committed service time frame
Perception measured on a scale
Accountability of Government functionaries
Degree to which of Government functionaries can be held accountable: Measure on a scale
Are the rules and procedures clearly stated without ambiguity and mistakes: Measure on a scale
Transparency of data: Measure on a scale
Transparency of decisions: Measure on a scale
Quality and quantity of information shared by agencies
Does the agency take responsibility for the accuracy of information shared: Yes/No
Quality and quantity of information exchange between client and agencies.
Has any suggestion or feedback been provided: Yes/No
Transparency, Participation
Ability to influence policy, rules/procedures through feedback
Measured on a scale
Was any problem taken for resolution: Yes/No
Quality of problem resolution and exception handling
Satisfaction with the resolution process: Measure on a scale
Convenience of location of access point for service: Measure on a scale
Is the service available 7 days a week: Yes/No
User independence of time and/or place, 24 x 7 availability
Satisfaction with service timings: Measure on a scale
Quality of facilities at access points Measured on a scale
Simplicity of user actions required for obtaining the service
Measured on a scale
How many different services are availed
Single window access to several services
Convenience through a single window measured on a scale
Overall convenience in obtaining service
Measured on a scale
3. Quality of Service: Decency, Fairness, Convenience, etc.
Friendliness in interaction with Government staff
Measured on a scale
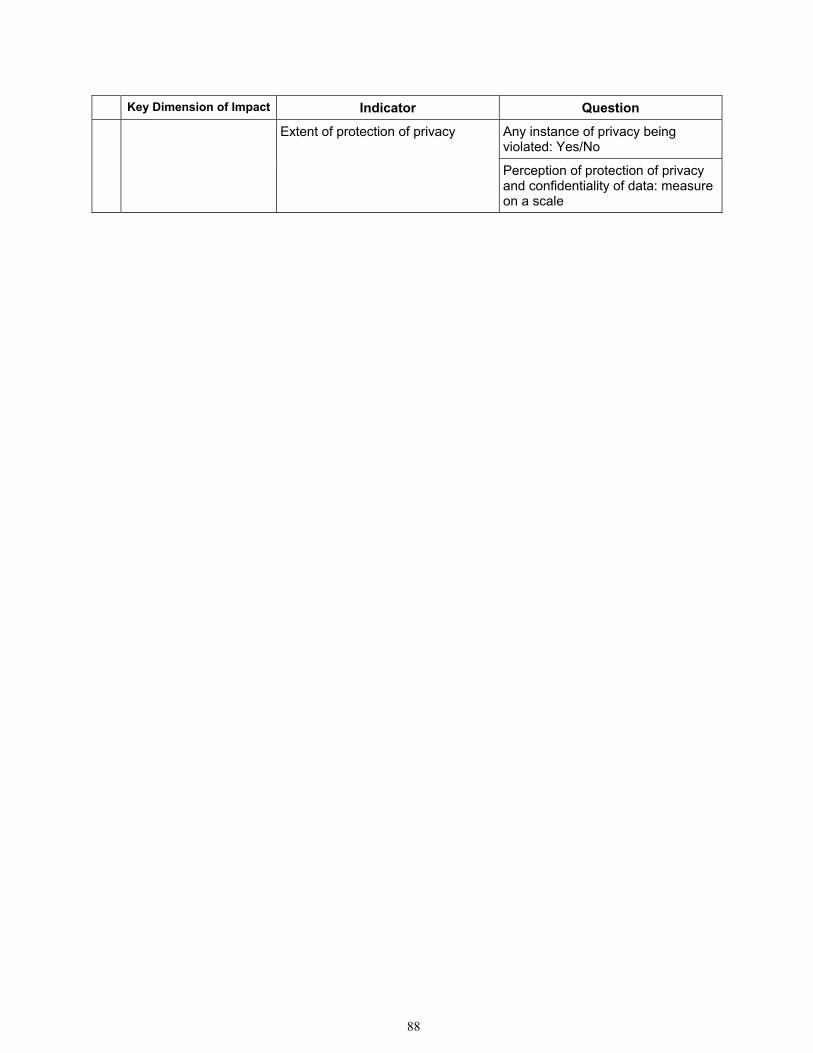
88
Key Dimension of Impact Indicator Question
Any instance of privacy being violated: Yes/No
Extent of protection of privacy
Perception of protection of privacy and confidentiality of data: measure on a scale
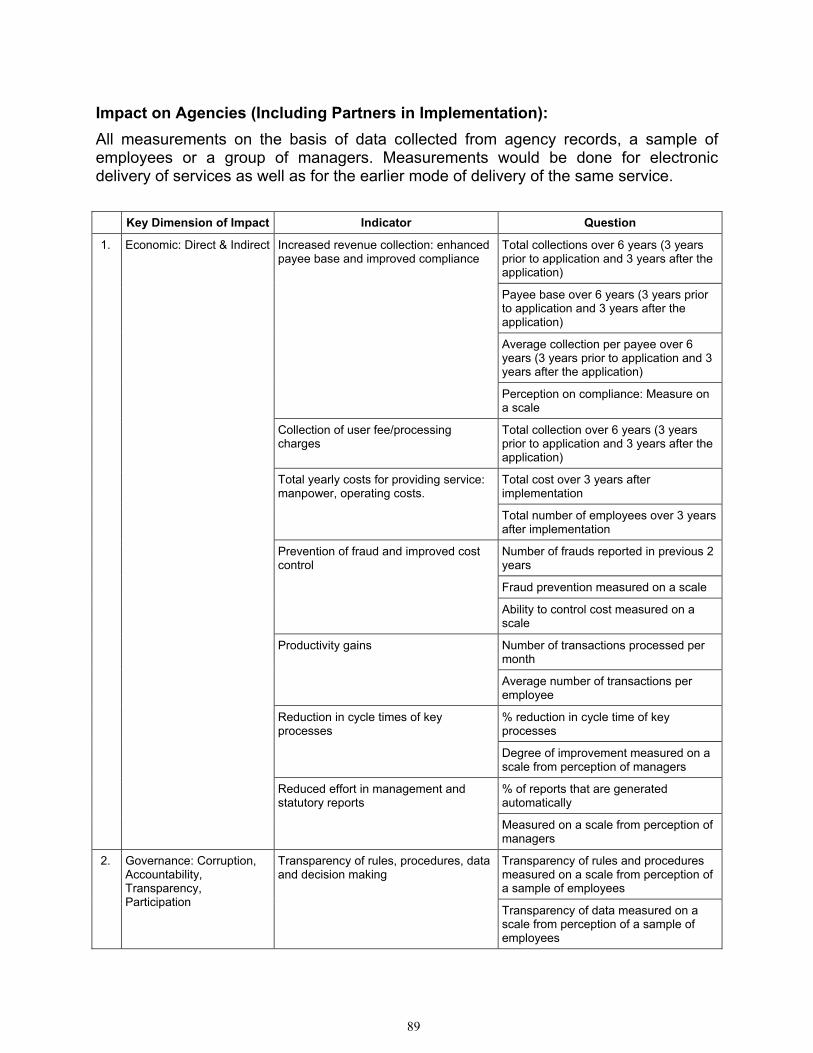
89
Impact on Agencies (Including Partners in Implementation): All measurements on the basis of data collected from agency records, a sample of employees or a group of managers. Measurements would be done for electronic delivery of services as well as for the earlier mode of delivery of the same service. Key Dimension of Impact Indicator Question
Total collections over 6 years (3 years prior to application and 3 years after the application)
Payee base over 6 years (3 years prior to application and 3 years after the application)
Average collection per payee over 6 years (3 years prior to application and 3 years after the application)
Increased revenue collection: enhanced payee base and improved compliance
Perception on compliance: Measure on a scale
Collection of user fee/processing charges
Total collection over 6 years (3 years prior to application and 3 years after the application)
Total cost over 3 years after implementation
Total yearly costs for providing service: manpower, operating costs.
Total number of employees over 3 years after implementation
Number of frauds reported in previous 2 years
Fraud prevention measured on a scale
Prevention of fraud and improved cost control
Ability to control cost measured on a scale
Number of transactions processed per month
Productivity gains
Average number of transactions per employee
% reduction in cycle time of key processes
Reduction in cycle times of key processes
Degree of improvement measured on a scale from perception of managers
% of reports that are generated automatically
1. Economic: Direct & Indirect
Reduced effort in management and statutory reports
Measured on a scale from perception of managers
Transparency of rules and procedures measured on a scale from perception of a sample of employees
2. Governance: Corruption, Accountability, Transparency, Participation
Transparency of rules, procedures, data and decision making
Transparency of data measured on a scale from perception of a sample of employees
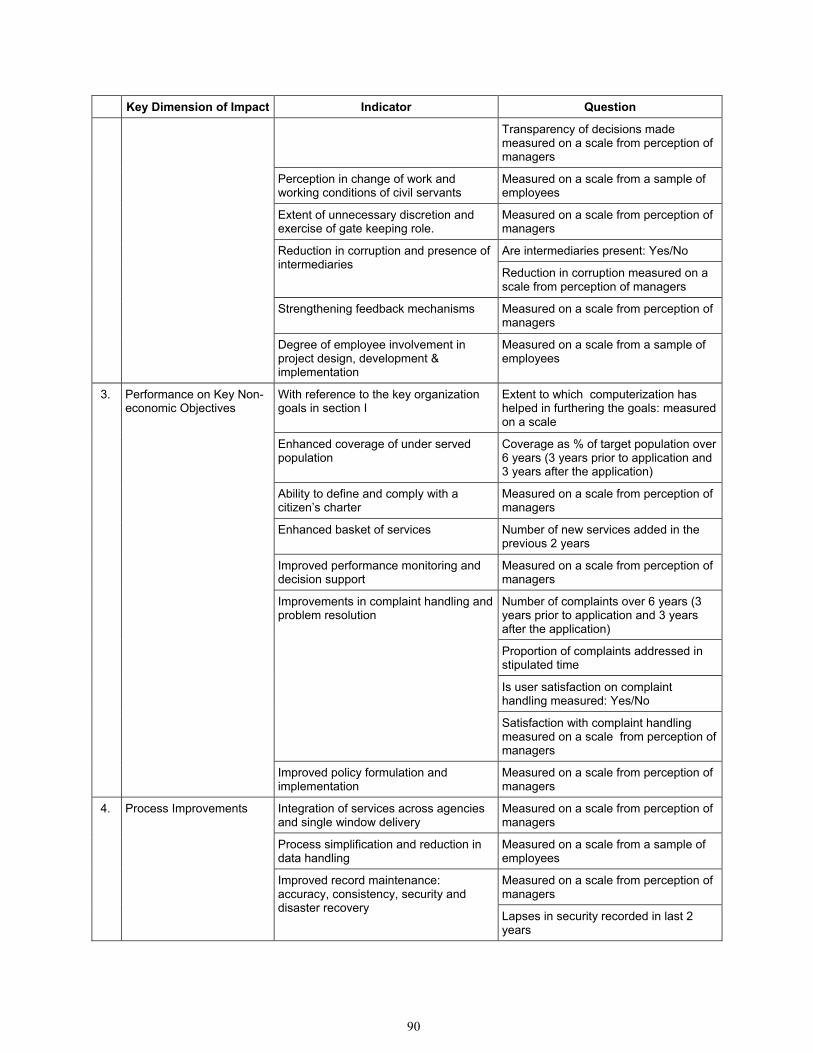
90
Key Dimension of Impact Indicator Question
Transparency of decisions made measured on a scale from perception of managers
Perception in change of work and working conditions of civil servants
Measured on a scale from a sample of employees
Extent of unnecessary discretion and exercise of gate keeping role.
Measured on a scale from perception of managers
Are intermediaries present: Yes/No Reduction in corruption and presence of intermediaries
Reduction in corruption measured on a scale from perception of managers
Strengthening feedback mechanisms Measured on a scale from perception of managers
Degree of employee involvement in project design, development & implementation
Measured on a scale from a sample of employees
With reference to the key organization goals in section I
Extent to which computerization has helped in furthering the goals: measured on a scale
Enhanced coverage of under served population
Coverage as % of target population over 6 years (3 years prior to application and 3 years after the application)
Ability to define and comply with a citizen’s charter
Measured on a scale from perception of managers
Enhanced basket of services Number of new services added in the previous 2 years
Improved performance monitoring and decision support
Measured on a scale from perception of managers
Number of complaints over 6 years (3 years prior to application and 3 years after the application)
Proportion of complaints addressed in stipulated time
Is user satisfaction on complaint handling measured: Yes/No
Improvements in complaint handling and problem resolution
Satisfaction with complaint handling measured on a scale from perception of managers
3. Performance on Key Non-economic Objectives
Improved policy formulation and implementation
Measured on a scale from perception of managers
Integration of services across agencies and single window delivery
Measured on a scale from perception of managers
Process simplification and reduction in data handling
Measured on a scale from a sample of employees
Measured on a scale from perception of managers
4. Process Improvements
Improved record maintenance: accuracy, consistency, security and disaster recovery
Lapses in security recorded in last 2 years
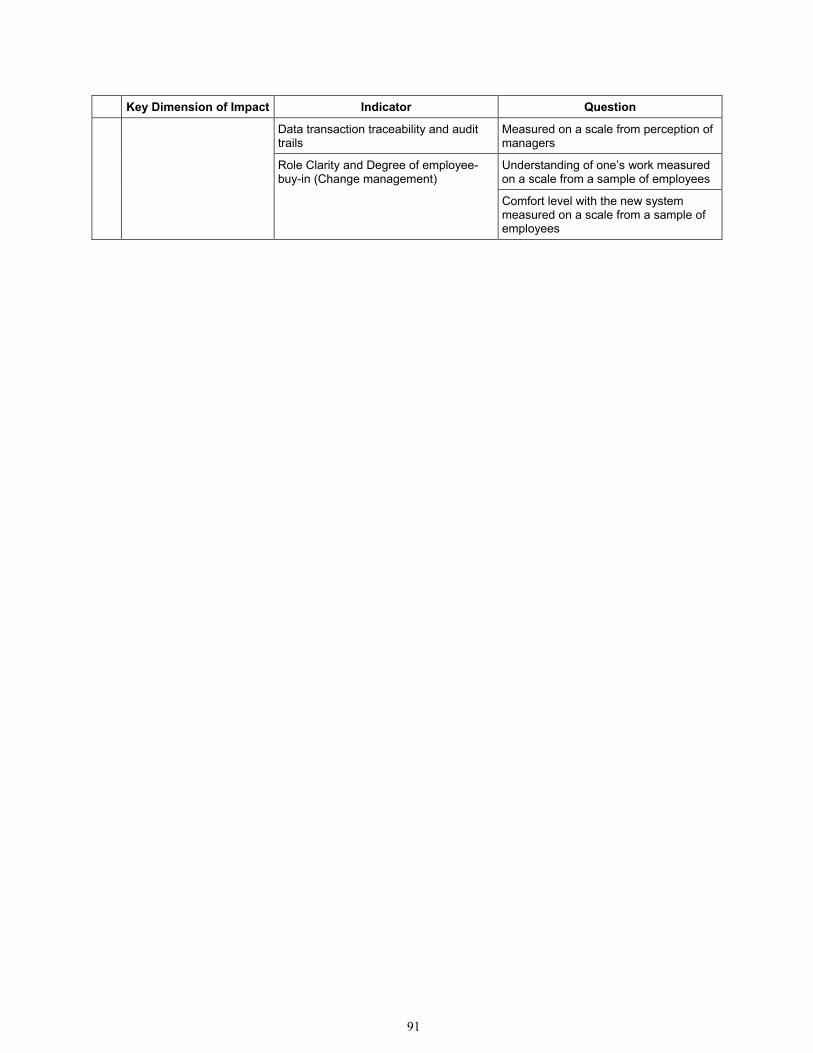
91
Key Dimension of Impact Indicator Question
Data transaction traceability and audit trails
Measured on a scale from perception of managers
Understanding of one’s work measured on a scale from a sample of employees
Role Clarity and Degree of employee-buy-in (Change management)
Comfort level with the new system measured on a scale from a sample of employees
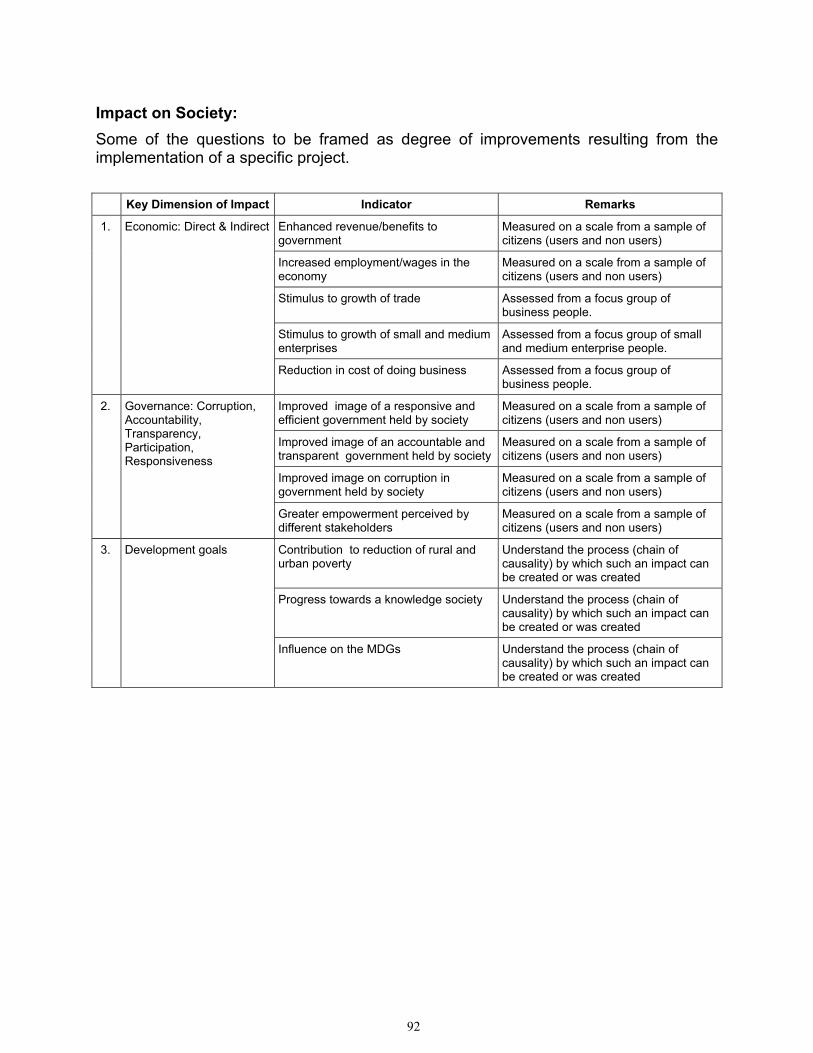
92
Impact on Society: Some of the questions to be framed as degree of improvements resulting from the implementation of a specific project. Key Dimension of Impact Indicator Remarks
Enhanced revenue/benefits to government
Measured on a scale from a sample of citizens (users and non users)
Increased employment/wages in the economy
Measured on a scale from a sample of citizens (users and non users)
Stimulus to growth of trade Assessed from a focus group of business people.
Stimulus to growth of small and medium enterprises
Assessed from a focus group of small and medium enterprise people.
1. Economic: Direct & Indirect
Reduction in cost of doing business Assessed from a focus group of business people.
Improved image of a responsive and efficient government held by society
Measured on a scale from a sample of citizens (users and non users)
Improved image of an accountable and transparent government held by society
Measured on a scale from a sample of citizens (users and non users)
Improved image on corruption in government held by society
Measured on a scale from a sample of citizens (users and non users)
2. Governance: Corruption, Accountability, Transparency, Participation, Responsiveness
Greater empowerment perceived by different stakeholders
Measured on a scale from a sample of citizens (users and non users)
Contribution to reduction of rural and urban poverty
Understand the process (chain of causality) by which such an impact can be created or was created
Progress towards a knowledge society Understand the process (chain of causality) by which such an impact can be created or was created
3. Development goals
Influence on the MDGs Understand the process (chain of causality) by which such an impact can be created or was created
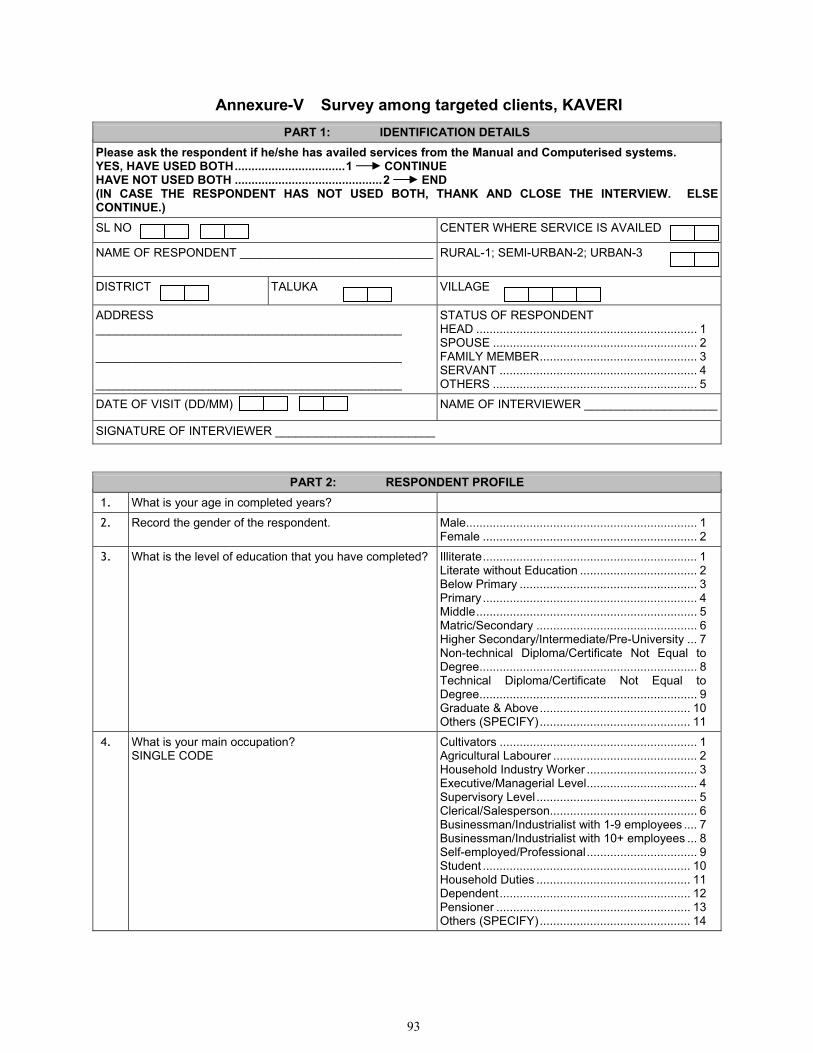
93
Annexure-V Survey among targeted clients, KAVERI PART 1: IDENTIFICATION DETAILS
Please ask the respondent if he/she has availed services from the Manual and Computerised systems. YES, HAVE USED BOTH.................................1 CONTINUE HAVE NOT USED BOTH ............................................2 END (IN CASE THE RESPONDENT HAS NOT USED BOTH, THANK AND CLOSE THE INTERVIEW. ELSE CONTINUE.) SL NO CENTER WHERE SERVICE IS AVAILED
NAME OF RESPONDENT _____________________________ RURAL-1; SEMI-URBAN-2; URBAN-3
DISTRICT TALUKA VILLAGE
ADDRESS ______________________________________________ ______________________________________________ ______________________________________________
STATUS OF RESPONDENT HEAD .................................................................. 1 SPOUSE ............................................................. 2 FAMILY MEMBER............................................... 3 SERVANT ........................................................... 4 OTHERS ............................................................. 5
DATE OF VISIT (DD/MM) NAME OF INTERVIEWER ____________________
SIGNATURE OF INTERVIEWER ________________________
PART 2: RESPONDENT PROFILE 1. What is your age in completed years?
2. Record the gender of the respondent.
Male..................................................................... 1 Female ................................................................ 2
3. What is the level of education that you have completed? Illiterate................................................................ 1 Literate without Education ................................... 2 Below Primary ..................................................... 3 Primary ................................................................ 4 Middle.................................................................. 5 Matric/Secondary ................................................ 6 Higher Secondary/Intermediate/Pre-University ... 7 Non-technical Diploma/Certificate Not Equal to Degree................................................................. 8 Technical Diploma/Certificate Not Equal to Degree................................................................. 9 Graduate & Above............................................. 10 Others (SPECIFY)............................................. 11
4. What is your main occupation? SINGLE CODE
Cultivators ........................................................... 1 Agricultural Labourer ........................................... 2 Household Industry Worker ................................. 3 Executive/Managerial Level................................. 4 Supervisory Level ................................................ 5 Clerical/Salesperson............................................ 6 Businessman/Industrialist with 1-9 employees .... 7 Businessman/Industrialist with 10+ employees ... 8 Self-employed/Professional................................. 9 Student .............................................................. 10 Household Duties .............................................. 11 Dependent......................................................... 12 Pensioner .......................................................... 13 Others (SPECIFY)............................................. 14
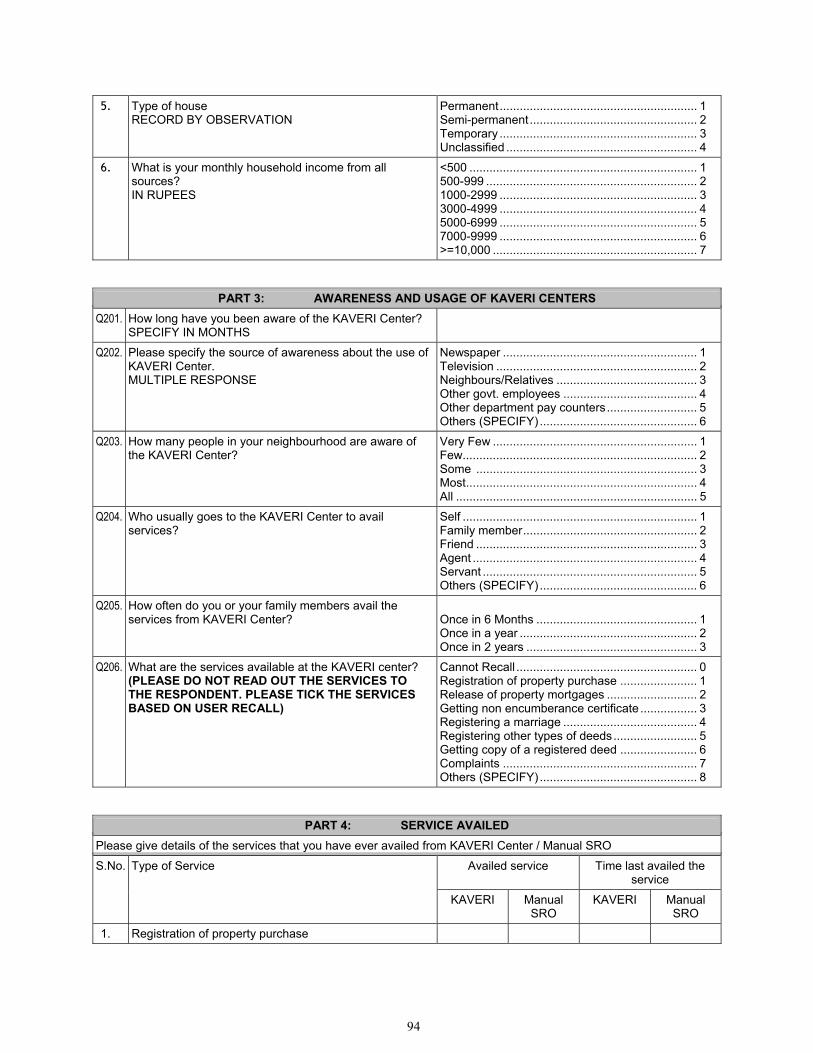
94
5. Type of house RECORD BY OBSERVATION
Permanent........................................................... 1 Semi-permanent.................................................. 2 Temporary ........................................................... 3 Unclassified ......................................................... 4
6. What is your monthly household income from all sources? IN RUPEES
<500 .................................................................... 1 500-999 ............................................................... 2 1000-2999 ........................................................... 3 3000-4999 ........................................................... 4 5000-6999 ........................................................... 5 7000-9999 ........................................................... 6 >=10,000 ............................................................. 7
PART 3: AWARENESS AND USAGE OF KAVERI CENTERS Q201. How long have you been aware of the KAVERI Center?
SPECIFY IN MONTHS
Q202. Please specify the source of awareness about the use of KAVERI Center. MULTIPLE RESPONSE
Newspaper .......................................................... 1 Television ............................................................ 2 Neighbours/Relatives .......................................... 3 Other govt. employees ........................................ 4 Other department pay counters........................... 5 Others (SPECIFY) ............................................... 6
Q203. How many people in your neighbourhood are aware of the KAVERI Center?
Very Few ............................................................. 1 Few...................................................................... 2 Some .................................................................. 3 Most..................................................................... 4 All ........................................................................ 5
Q204. Who usually goes to the KAVERI Center to avail services?
Self ...................................................................... 1 Family member.................................................... 2 Friend .................................................................. 3 Agent ................................................................... 4 Servant ................................................................ 5 Others (SPECIFY) ............................................... 6
Q205. How often do you or your family members avail the services from KAVERI Center?
Once in 6 Months ................................................ 1 Once in a year ..................................................... 2 Once in 2 years ................................................... 3
Q206. What are the services available at the KAVERI center? (PLEASE DO NOT READ OUT THE SERVICES TO THE RESPONDENT. PLEASE TICK THE SERVICES BASED ON USER RECALL)
Cannot Recall ...................................................... 0 Registration of property purchase ....................... 1 Release of property mortgages ........................... 2 Getting non encumberance certificate ................. 3 Registering a marriage ........................................ 4 Registering other types of deeds......................... 5 Getting copy of a registered deed ....................... 6 Complaints .......................................................... 7 Others (SPECIFY) ............................................... 8
PART 4: SERVICE AVAILED Please give details of the services that you have ever availed from KAVERI Center / Manual SRO
Availed service Time last availed the service
S.No. Type of Service
KAVERI Manual SRO
KAVERI Manual SRO
1. Registration of property purchase
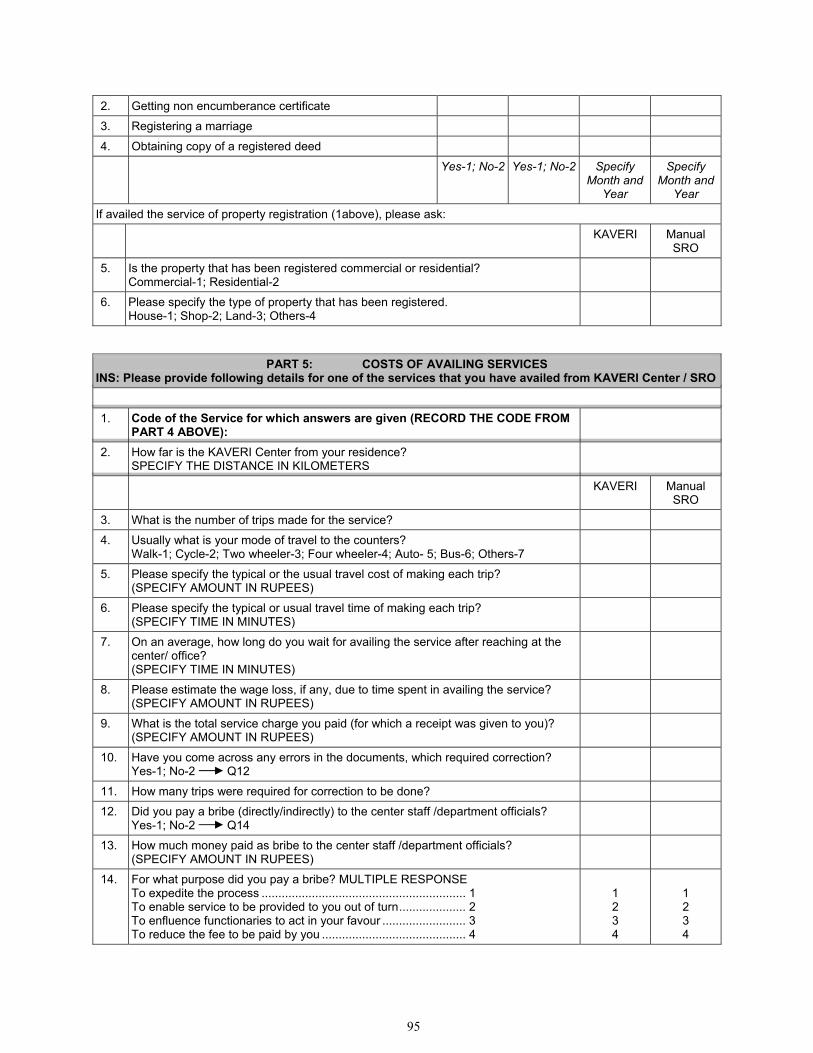
95
2. Getting non encumberance certificate
3. Registering a marriage
4. Obtaining copy of a registered deed
Yes-1; No-2 Yes-1; No-2 Specify Month and
Year
Specify Month and
Year
If availed the service of property registration (1above), please ask:
KAVERI Manual SRO
5. Is the property that has been registered commercial or residential? Commercial-1; Residential-2
6. Please specify the type of property that has been registered. House-1; Shop-2; Land-3; Others-4
PART 5: COSTS OF AVAILING SERVICES INS: Please provide following details for one of the services that you have availed from KAVERI Center / SRO 1. Code of the Service for which answers are given (RECORD THE CODE FROM
PART 4 ABOVE):
2. How far is the KAVERI Center from your residence? SPECIFY THE DISTANCE IN KILOMETERS
KAVERI Manual SRO
3. What is the number of trips made for the service?
4. Usually what is your mode of travel to the counters? Walk-1; Cycle-2; Two wheeler-3; Four wheeler-4; Auto- 5; Bus-6; Others-7
5. Please specify the typical or the usual travel cost of making each trip? (SPECIFY AMOUNT IN RUPEES)
6. Please specify the typical or usual travel time of making each trip? (SPECIFY TIME IN MINUTES)
7. On an average, how long do you wait for availing the service after reaching at the center/ office? (SPECIFY TIME IN MINUTES)
8. Please estimate the wage loss, if any, due to time spent in availing the service? (SPECIFY AMOUNT IN RUPEES)
9. What is the total service charge you paid (for which a receipt was given to you)? (SPECIFY AMOUNT IN RUPEES)
10. Have you come across any errors in the documents, which required correction? Yes-1; No-2 Q12
11. How many trips were required for correction to be done?
12. Did you pay a bribe (directly/indirectly) to the center staff /department officials? Yes-1; No-2 Q14
13. How much money paid as bribe to the center staff /department officials? (SPECIFY AMOUNT IN RUPEES)
14. For what purpose did you pay a bribe? MULTIPLE RESPONSE To expedite the process ............................................................. 1 To enable service to be provided to you out of turn.................... 2 To enfluence functionaries to act in your favour ......................... 3 To reduce the fee to be paid by you ........................................... 4
1 2 3 4
1 2 3 4
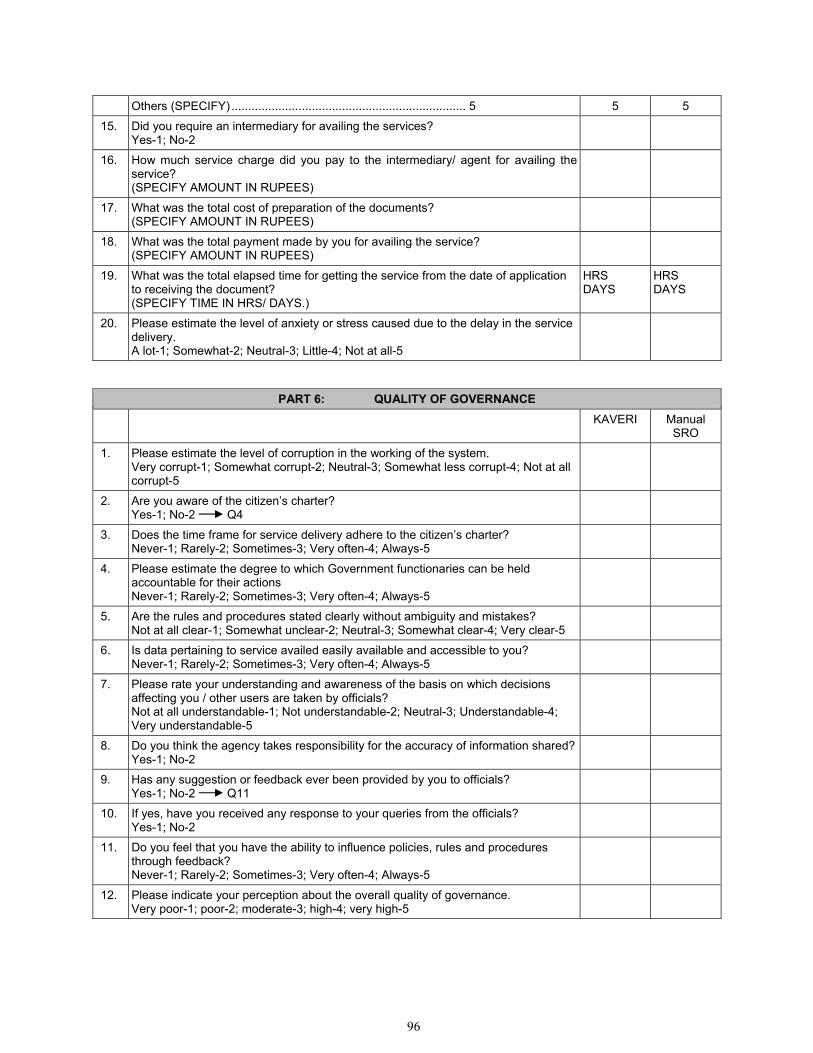
96
Others (SPECIFY) ...................................................................... 5 5 5
15. Did you require an intermediary for availing the services? Yes-1; No-2
16. How much service charge did you pay to the intermediary/ agent for availing the service? (SPECIFY AMOUNT IN RUPEES)
17. What was the total cost of preparation of the documents? (SPECIFY AMOUNT IN RUPEES)
18. What was the total payment made by you for availing the service? (SPECIFY AMOUNT IN RUPEES)
19. What was the total elapsed time for getting the service from the date of application to receiving the document? (SPECIFY TIME IN HRS/ DAYS.)
HRS DAYS
HRS DAYS
20. Please estimate the level of anxiety or stress caused due to the delay in the service delivery. A lot-1; Somewhat-2; Neutral-3; Little-4; Not at all-5
PART 6: QUALITY OF GOVERNANCE KAVERI Manual
SRO
1. Please estimate the level of corruption in the working of the system. Very corrupt-1; Somewhat corrupt-2; Neutral-3; Somewhat less corrupt-4; Not at all corrupt-5
2. Are you aware of the citizen’s charter? Yes-1; No-2 Q4
3. Does the time frame for service delivery adhere to the citizen’s charter? Never-1; Rarely-2; Sometimes-3; Very often-4; Always-5
4. Please estimate the degree to which Government functionaries can be held accountable for their actions Never-1; Rarely-2; Sometimes-3; Very often-4; Always-5
5. Are the rules and procedures stated clearly without ambiguity and mistakes? Not at all clear-1; Somewhat unclear-2; Neutral-3; Somewhat clear-4; Very clear-5
6. Is data pertaining to service availed easily available and accessible to you? Never-1; Rarely-2; Sometimes-3; Very often-4; Always-5
7. Please rate your understanding and awareness of the basis on which decisions affecting you / other users are taken by officials? Not at all understandable-1; Not understandable-2; Neutral-3; Understandable-4; Very understandable-5
8. Do you think the agency takes responsibility for the accuracy of information shared? Yes-1; No-2
9. Has any suggestion or feedback ever been provided by you to officials? Yes-1; No-2 Q11
10. If yes, have you received any response to your queries from the officials? Yes-1; No-2
11. Do you feel that you have the ability to influence policies, rules and procedures through feedback? Never-1; Rarely-2; Sometimes-3; Very often-4; Always-5
12. Please indicate your perception about the overall quality of governance. Very poor-1; poor-2; moderate-3; high-4; very high-5
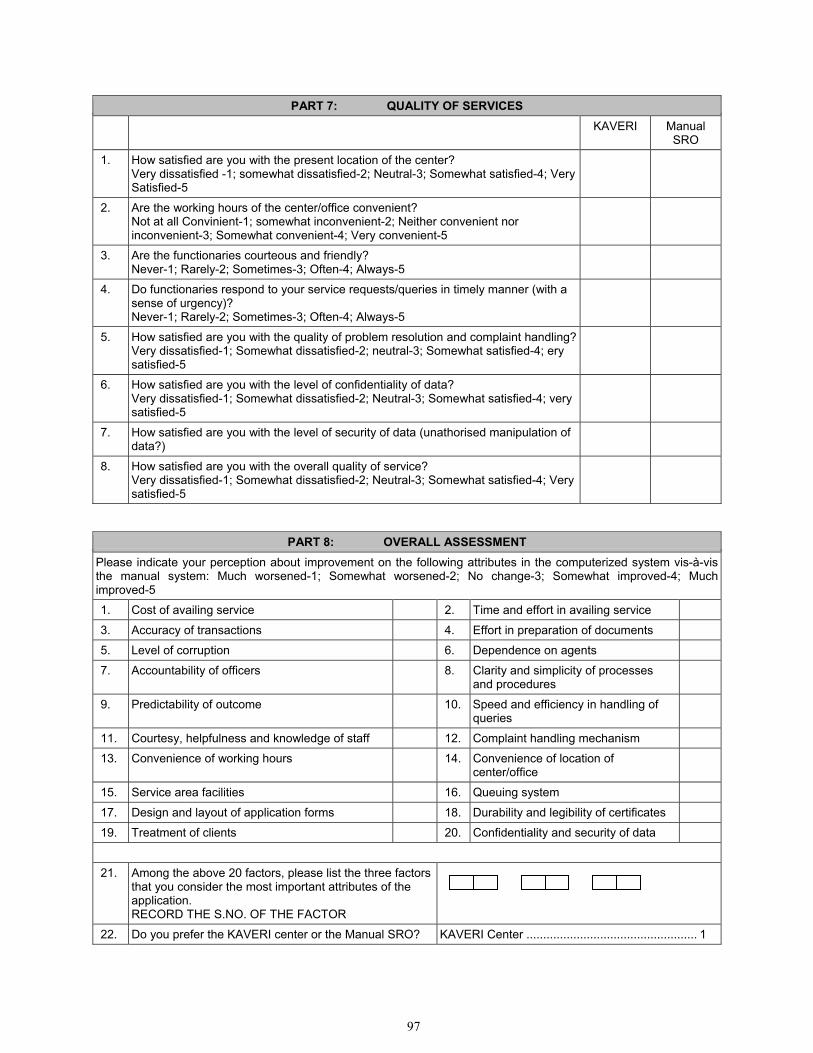
97
PART 7: QUALITY OF SERVICES KAVERI Manual
SRO
1. How satisfied are you with the present location of the center? Very dissatisfied -1; somewhat dissatisfied-2; Neutral-3; Somewhat satisfied-4; Very Satisfied-5
2. Are the working hours of the center/office convenient? Not at all Convinient-1; somewhat inconvenient-2; Neither convenient nor inconvenient-3; Somewhat convenient-4; Very convenient-5
3. Are the functionaries courteous and friendly? Never-1; Rarely-2; Sometimes-3; Often-4; Always-5
4. Do functionaries respond to your service requests/queries in timely manner (with a sense of urgency)? Never-1; Rarely-2; Sometimes-3; Often-4; Always-5
5. How satisfied are you with the quality of problem resolution and complaint handling? Very dissatisfied-1; Somewhat dissatisfied-2; neutral-3; Somewhat satisfied-4; ery satisfied-5
6. How satisfied are you with the level of confidentiality of data? Very dissatisfied-1; Somewhat dissatisfied-2; Neutral-3; Somewhat satisfied-4; very satisfied-5
7. How satisfied are you with the level of security of data (unathorised manipulation of data?)
8. How satisfied are you with the overall quality of service? Very dissatisfied-1; Somewhat dissatisfied-2; Neutral-3; Somewhat satisfied-4; Very satisfied-5
PART 8: OVERALL ASSESSMENT Please indicate your perception about improvement on the following attributes in the computerized system vis-à-vis the manual system: Much worsened-1; Somewhat worsened-2; No change-3; Somewhat improved-4; Much improved-5
1. Cost of availing service 2. Time and effort in availing service 3. Accuracy of transactions 4. Effort in preparation of documents 5. Level of corruption 6. Dependence on agents 7. Accountability of officers 8. Clarity and simplicity of processes
and procedures
9. Predictability of outcome 10. Speed and efficiency in handling of queries
11. Courtesy, helpfulness and knowledge of staff 12. Complaint handling mechanism 13. Convenience of working hours 14. Convenience of location of
center/office
15. Service area facilities 16. Queuing system 17. Design and layout of application forms 18. Durability and legibility of certificates 19. Treatment of clients 20. Confidentiality and security of data
21. Among the above 20 factors, please list the three factors
that you consider the most important attributes of the application. RECORD THE S.NO. OF THE FACTOR
22. Do you prefer the KAVERI center or the Manual SRO? KAVERI Center ................................................... 1
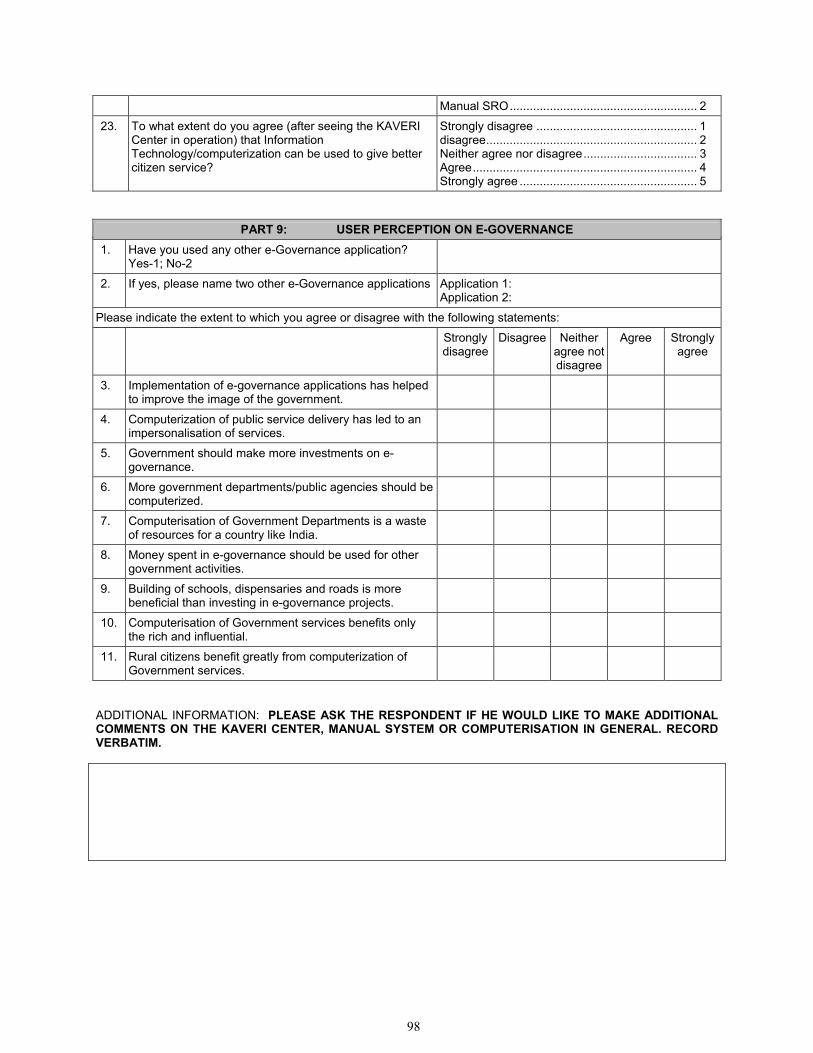
98
Manual SRO........................................................ 2
23. To what extent do you agree (after seeing the KAVERI Center in operation) that Information Technology/computerization can be used to give better citizen service?
Strongly disagree ................................................ 1 disagree............................................................... 2 Neither agree nor disagree.................................. 3 Agree................................................................... 4 Strongly agree ..................................................... 5
PART 9: USER PERCEPTION ON E-GOVERNANCE 1. Have you used any other e-Governance application?
Yes-1; No-2
2. If yes, please name two other e-Governance applications Application 1: Application 2:
Please indicate the extent to which you agree or disagree with the following statements:
Strongly disagree
Disagree Neither agree not disagree
Agree Strongly agree
3. Implementation of e-governance applications has helped to improve the image of the government.
4. Computerization of public service delivery has led to an impersonalisation of services.
5. Government should make more investments on e-governance.
6. More government departments/public agencies should be computerized.
7. Computerisation of Government Departments is a waste of resources for a country like India.
8. Money spent in e-governance should be used for other government activities.
9. Building of schools, dispensaries and roads is more beneficial than investing in e-governance projects.
10. Computerisation of Government services benefits only the rich and influential.
11. Rural citizens benefit greatly from computerization of Government services.
ADDITIONAL INFORMATION: PLEASE ASK THE RESPONDENT IF HE WOULD LIKE TO MAKE ADDITIONAL COMMENTS ON THE KAVERI CENTER, MANUAL SYSTEM OR COMPUTERISATION IN GENERAL. RECORD VERBATIM.