Embed Size (px)
Citation preview

Immune Changes in Tumor-Draining Lymph Nodes as
Novel Biomarkers
Peter P. Lee, M.D.Dept. of Medicine (Hem)
Stanford University

• Tumor invasion of TDLNs is a key determinant of clinical outcome in breast and other cancers
• Lymph nodes are immune organs!
• Are immune cell populations (T cells, B cells, and dendritic cells) altered in sentinel and axillary lymph nodes?
• If so, do immune changes in a LN reflect tumor invasion?
• Do immune changes predict clinical outcome?
TDLNs in Breast Cancer

Integrated image analysis approachMulticolor staining of tissue sections
High-res spectral imaging & automated scanning of the whole tissue section
Machine-learning-based cell identification by GemIdent→ number of cells and Cartesian coordinates
Quantitative and spatial statistical analyses

Multicolor staining
Tumors
T cellsDCs Other cells
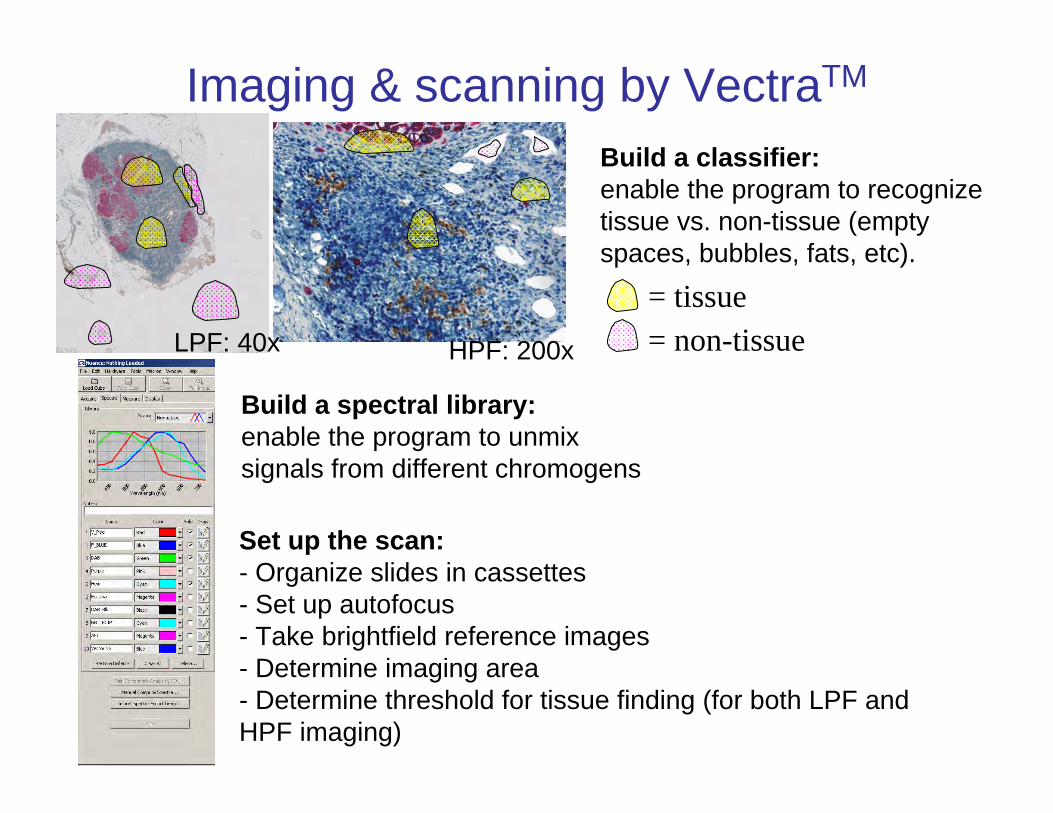
Imaging & scanning by VectraTM
Build a classifier:enable the program to recognize tissue vs. non-tissue (empty spaces, bubbles, fats, etc).
Build a spectral library:enable the program to unmix signals from different chromogens
Set up the scan:- Organize slides in cassettes- Set up autofocus- Take brightfield reference images- Determine imaging area- Determine threshold for tissue finding (for both LPF and HPF imaging)
= tissue= non-tissueHPF: 200xLPF: 40x

Original image
Unmixed images
Re-constructed composite image
Chromogen unmixing and image reconstruction by VectraTM

GemIdent analysis
Whole image overview

Maps of each cell typeTumors DCs
T cells Other cells
Tumors
T cells
Other cellsDCs
5mm
8mm

Analysis of Results
• Number and proportion of each cell type• Spatial statistics: architectural pattern analysis of
immune cells and tumor cells
Relationship with >5-year clinical outcome & parameters

– Total 77 stage IIA, IIB,IIIA breast cancer patients analyzed
– All patients had positive SLN biopsy and thus had ALN dissection
– Significant numbers of recurrences within 5 years allowing correlation with clinical outcome
– 10 non-cancer LNs analyzed as controls
Proof of Concept: Breast Cancer
Kohrt et al, PLoS Med 2005

IHC analysis of TDLN in breast CA
Breast cancer cells: AE1/AE3
SLN – CD8 ALN – CD8 Control – CD8
25 μm
Immune cells:– CD4 ‘helper’ T cells– CD8 ‘cytotoxic’ T cells– CD1a dendritic cells - ‘antigen
presentation’
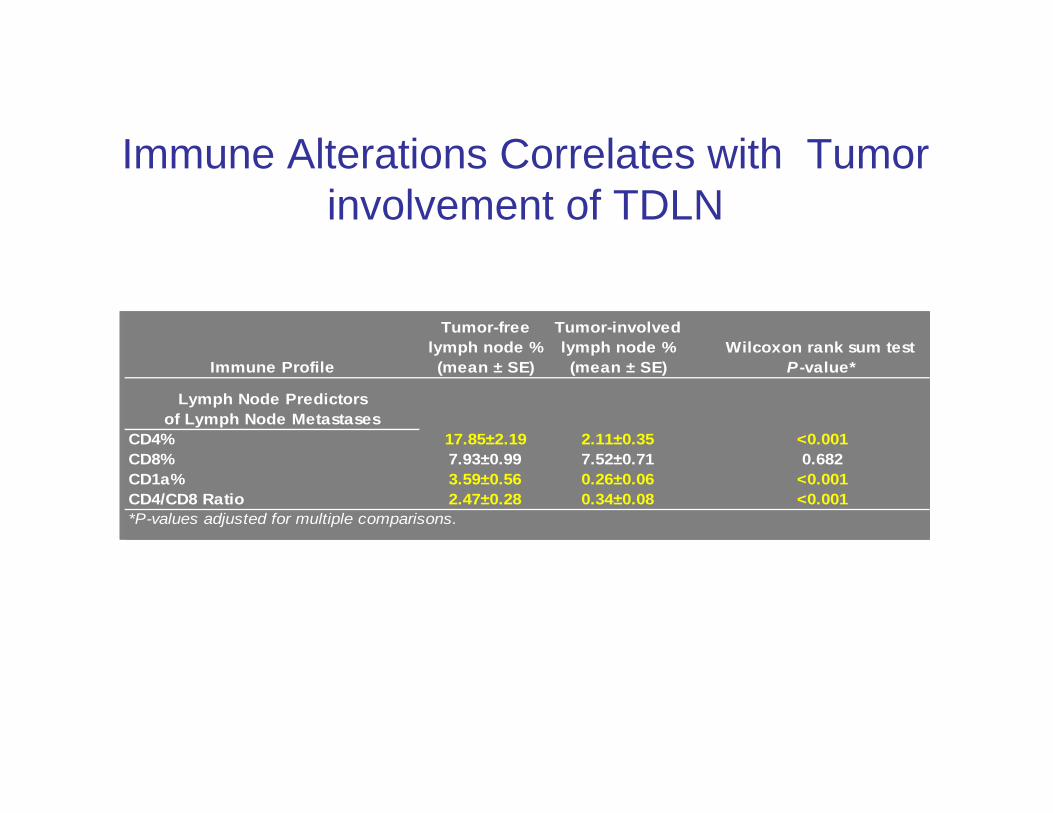
Immune Alterations Correlates with Tumor involvement of TDLN
Immune Profile
Tumor-free lymph node % (mean ± SE)
Tumor-involved lymph node % (mean ± SE)
Wilcoxon rank sum testP -value*
Lymph Node Predictors of Lymph Node Metastases
CD4% 17.85±2.19 2.11±0.35 <0.001CD8% 7.93±0.99 7.52±0.71 0.682CD1a% 3.59±0.56 0.26±0.06 <0.001CD4/CD8 Ratio 2.47±0.28 0.34±0.08 <0.001*P-values adjusted for multiple comparisons.

TDLN Immune Status Correlates with DFS
P<0.001 P<0.001
43 --34 29m395
49 --28 30m404P<0.001 P<0.001
43 --34 29m395
49 --28 30m404
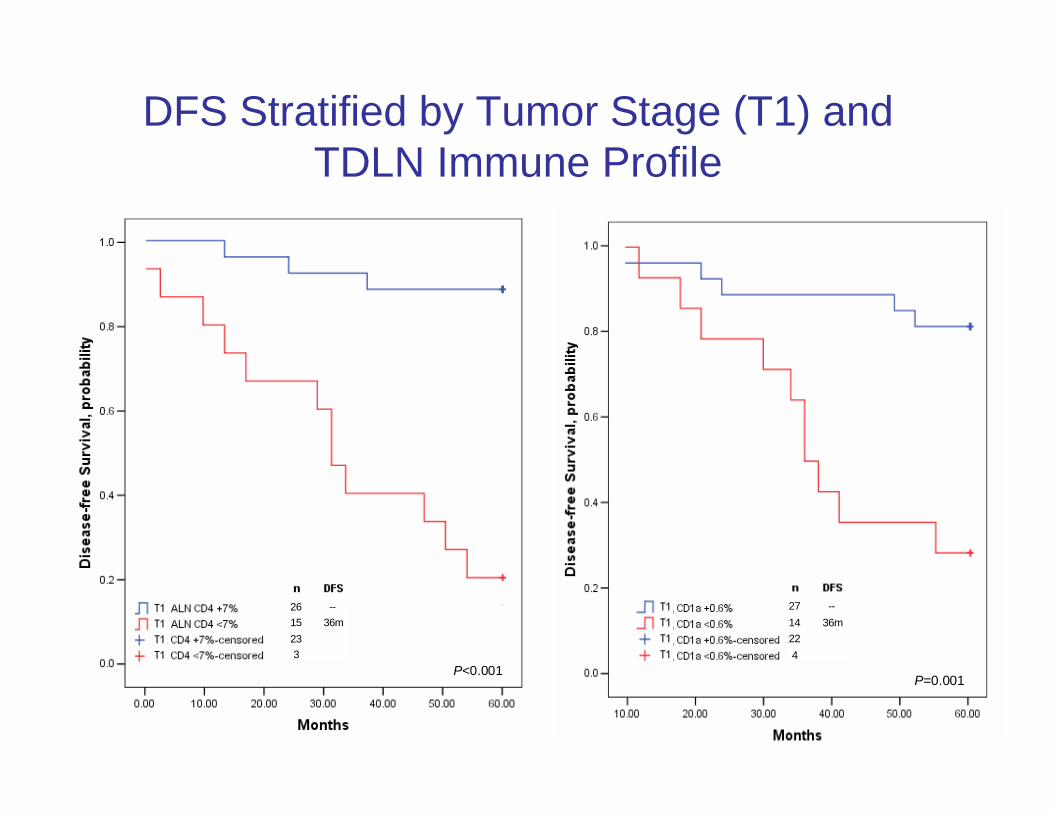
DFS Stratified by Tumor Stage (T1) and TDLN Immune Profile
P<0.001
26 --15 36m233
P<0.001
26 --15 36m233
P=0.001
27 --14 36m224
P=0.001
27 --14 36m224

DFS Stratified by Tumor Stage (T2) and TDLN Immune Profile
P<0.001
17 --16 24m162 P<0.001
17 --16 24m162 P<0.001
21 --12 24m180
P<0.001
21 --12 24m180

• Different cell phenotypes constitute a “marked point process”
• Goal: to quantify spatial characteristics in order to understand cellular interaction
• Preliminary Findings: T and B cells from TDLN and healthy LN have different spatial distribution patterns [PLoS ONE 5(8):e12420, 2010]
Beyond numbers: spatial patterns
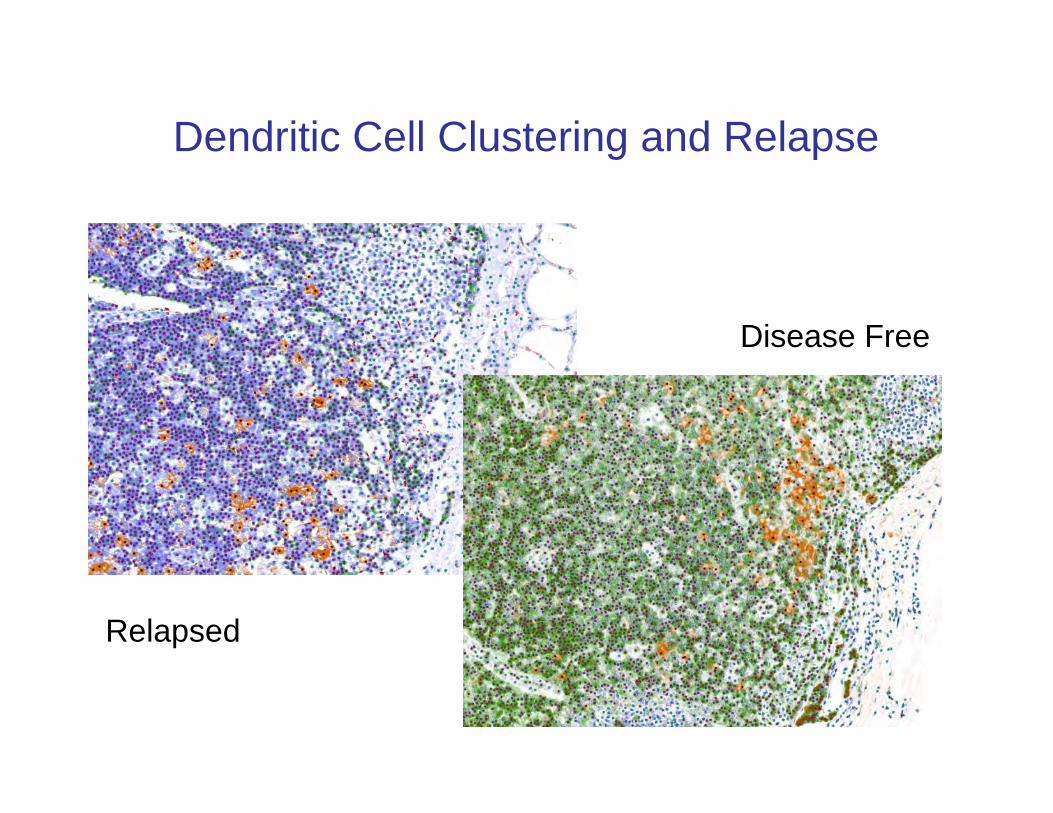
Dendritic Cell Clustering and Relapse
Relapsed
Disease Free

Summary• Numerical and spatial changes arise in
immune cells in TDLNs• Some of these changes appear to
predict clinical outcome• Quantitative, spatial analysis tools for
histology have been developed for high throughput analysis
• Immune cells in TDLNs provide novel biomarkers for cancer
• Proof-of-concept in breast cancer –extend to melanoma, GI cancer

Ackowledgments
Fred Dirbas, MD (Surg Onc)Erich Schwartz (Pathology)
Susan Holmes, PhD (Statistics)
Notre DameDanny Chen, PhD (Computer Science)
Mark Alber, PhD (Math)
Holbrook Kohrt, MDFrancesca Setiadi, PhD
Valeria Carcamo-CavazosAdam KapelnerAndrew Chang
20
<YOUR NAME HERE>
The following relationships exist related to this presentation:None
< ENTER EITHER>
<No Relationships to Disclose>
<OR>
<COMPANY X, Received, Role (i.e. BMS, Honorarium, Speaker)><COMPANY Y, Received, Role (i.e. Pfizer, Salary, Employee)>