Embed Size (px)
Citation preview
DI
SC
US
SI
ON
P
AP
ER
S
ER
IE
S
Forschungsinstitut zur Zukunft der ArbeitInstitute for the Study of Labor
Immigration and Economic Growth in theOECD Countries, 1986-2006
IZA DP No. 8681
November 2014
Ekrame BoubtaneJean-Christophe DumontChristophe Rault
Immigration and Economic Growth in the
OECD Countries, 1986-2006
Ekrame Boubtane CERDI, University of Auvergne and CES, University of Paris 1
Jean-Christophe Dumont
OECD
Christophe Rault LEO, University of Orléans (CNRS UMR 7322)
and IZA
Discussion Paper No. 8681 November 2014
IZA
P.O. Box 7240 53072 Bonn
Germany
Phone: +49-228-3894-0 Fax: +49-228-3894-180
E-mail: [email protected]
Any opinions expressed here are those of the author(s) and not those of IZA. Research published in this series may include views on policy, but the institute itself takes no institutional policy positions. The IZA research network is committed to the IZA Guiding Principles of Research Integrity. The Institute for the Study of Labor (IZA) in Bonn is a local and virtual international research center and a place of communication between science, politics and business. IZA is an independent nonprofit organization supported by Deutsche Post Foundation. The center is associated with the University of Bonn and offers a stimulating research environment through its international network, workshops and conferences, data service, project support, research visits and doctoral program. IZA engages in (i) original and internationally competitive research in all fields of labor economics, (ii) development of policy concepts, and (iii) dissemination of research results and concepts to the interested public. IZA Discussion Papers often represent preliminary work and are circulated to encourage discussion. Citation of such a paper should account for its provisional character. A revised version may be available directly from the author.
IZA Discussion Paper No. 8681 November 2014
ABSTRACT
Immigration and Economic Growth in the OECD Countries, 1986-2006*
This paper offers a reappraisal of the impact of migration on economic growth for 22 OECD countries between 1986-2006 and relies on a unique data set we compiled that allows us to distinguish net migration of the native-born and foreign-born by skill level. Specifically, after introducing migration in an augmented Solow-Swan model, we estimate a dynamic panel model using a system of generalized method of moments (SYS-GMM) to deal with the risk of an endogeneity bias of the migration variables. Two important findings emerge from our analysis. First, there exists a positive impact of migrants’ human capital on economic growth. And second, the contribution of immigrants to human capital accumulation tends to dominate the mechanical dilution effect while the net effect is fairly small. This conclusion holds even in countries with highly selective migration policies. JEL Classification: C23, F22, J24, J61, O41, O47 Keywords: immigration, growth, human capital, generalized methods of moments Corresponding author: Christophe Rault LEO, Université d’Orléans, CNRS UMR 7322 Faculté de Droit, d’Economie et de Gestion Rue de Blois - B.P. 26739 45067 Orléans Cedex 2 France E-mail: [email protected]
* We are very grateful to two anonymous referees for their useful comments and suggestions. We would like to thank Fréderic Docquier, Raquel Carrasco, John Martin, Stefano Scarpetta, Gilles Spielvogel, and Bertrand Wigniolle for discussion and helpful comments on earlier drafts. We would also like to thank participants at the European Economic Association (EEA) 2010 Congress in Glasgow, European Society for Population Economics (ESPE) 2011 Conference in Hangzhou, and the International Workshop on Immigration and Economic Growth 2011 in Amsterdam for helpful comments. E. Boubtane acknowledges financial support from the Agence Nationale de la Recherche of the French government through the program Investissements d’avenir ANR-10-LABX-14-01. The usual disclaimer applies.
1 Introduction
International migration to OECD countries, notably labour migration, has increasedsignificantly over the past decades. Between 1997 and 2007, in most southern Euro-pean countries, the United Kingdom, the United States, and several Nordic countries,immigrants contributed to more than 40% of net job creation. In 2007, the share ofimmigrants in employment reached 12% on average in OECD countries (OECD, 2009).In many developed countries the first effects of population aging can already be feltin the working age population as baby boomers begin to retire in large numbers whileyounger cohorts are too small to replace them. In this context, labour migration willcontinue to play a significant role in the medium and long term. Specifically, interna-tional migration is expected to account for all labour force growth between 2005 and2020 in the OECD area as a whole.
At the same time, many countries have recently adapted their migration system tomake it more selective vis-a-vis skills and education. Traditional settlement countries(Australia, Canada, New Zealand, and the United States) have implemented skills-basedmigration programmes for a long time which now serve as models to other countries.The United Kingdom, Denmark, and the Netherlands have recently reformed their mi-gration system to give more priority to highly educated migrants through a point-basedmigration system. Furthermore, the European Union has adopted a new directive, theEuropean Blue Card, to attract highly qualified migrants to the European labour mar-ket. This Directive does not prevent EU Member States from having their own systemof national residence permits for highly skilled migrants, but such national permits can-not grant the right of residence in other EU Member States that is guaranteed underthe Blue Card Directive. Accordingly, most European countries have also implementedspecific migration programmes to attract highly skilled foreign workers. For instance,Austria adopted a point-based immigration scheme-Red-White-Red Card in July 2011.This system aims to attract highly qualified persons and skilled workers in shortageoccupations who wish to settle, with their families, permanently in Austria. Also, theUnited Kingdom changed its point system in 2011 towards greater selectivity. TheHighly skilled migrant programme has been replaced by an ‘Exceptional Talent’ visa forapplicants who are ‘internationally recognised leader or emerging leader’ in their field.This trend is most likely to continue, and could even be reinforced, in the future.
These changes in migration trends and policies prompted us to reconsider the eco-nomic impact of migration. Empirical economic analyses have been flourishing in recentyears in two key areas likely to influence public opinion on migration, namely the labourmarket impact of immigrants (Borjas, 2003, 2009; Angrist and Kugler, 2003; Lubotsky,2007; Ottaviano and Peri, 2008)1 and the fiscal impact of immigration (Auerbach andOreopoulos, 1999; Storesletten, 2000, 2003; Hansen and Lofstrom, 2003).2 However, thedebate is relatively quiet on a third major area of interest: the impact of migration oneconomic growth. This is precisely the question addressed by this paper.
1See, for instance, Longhi et al. (2005, 2008) for recent meta-analyses.2See, for instance, Rowthorn (2008) or Leibfritz et al. (2003) for a review.
2
Though there are few doubts about the impact of a labour shock due to migrationon aggregate GDP growth, the effect is not so obvious with regard to per capita GDPgrowth. Indeed, in the standard augmented neoclassical growth model developed byMankiw et al. (1992), an increase in permanent migration flows has a negative impacton long-term economic growth because of capital dilution, which might be compensatedby a positive contribution of new migrants to human capital accumulation (Dolado etal., 1994 ; Barro and Sala-i-Martin, 1995). Consequently, in this framework, whether ornot migration positively effects per capita GDP growth crucially depends on the scopeof migration and its demographic and educational structures.
Due to a lack of harmonized international data on migration, few empirical studieshave tried to estimate the impact of permanent immigrant flows on economic growthwhile accounting for educational attainment. The closest related paper is Dolado etal. (1994). They estimate—as we do herein—a structural model including immigrants’human capital. However, they do not observe migrants’ education level and use educa-tional attainment of the population in the country of origin as a proxy. Moreover, theiranalysis covers the period from 1960–1985, which was characterized (until the secondoil shock at the end of the 1970s) by low-skilled migration concentrated in the manu-facturing sector. In the past two decades the characteristics of international migrationhas evolved considerably and its impact therefore needs to be reconsidered. This is thepurpose of this paper.
This paper is also related to the recent studies that analyse the effects of economicopenness and diversity on GDP per capita. Felbermayr et al. (2010) estimate the ef-fect of the stock of migrants on per capita income using cross-sectional country data.Andersen and Dalgaard (2011) consider temporary cross-border flows of people as ameasure of global integration and evaluate the effect of the intensity of travel on GDPper capita. Ortega and Peri (2014) estimate the effect of economic openness, jointlyconsidering migration and trade on income per person. In line with studies on birth-place diversity and economic development, they take into account diversity by countryof origin within the stock of immigrants. Alesina et al. (2013) estimate the effect ofdiversity of migrant birthplaces on growth. They build diversity indicators from dataon immigration population by country of birth and education.
This paper departs from existing studies by considering the effect of permanent flowsof immigrants by country of birth and skill level on productivity growth. We focus onpermanent migration—movements that the receiving country considers are for the longterm. We exclude temporary visitors (i.e. tourists and businessmen) because we aremainly interested in the economic consequences of long-term immigrants. Moreover, wefocus on newly arrived immigrants rather than the immigrant population as a whole.Indeed, the socioeconomic characteristics of immigrants has changed over time and flowsbetter reflect these changes than the stock of immigrants. We also independently iden-tify the effect of net migration of the foreign- and native-born by skill level.
3

Specifically, we contribute to the existing literature in two ways. First, we compilea unique data set on net migration that includes data on country of birth and skill levelfrom various data sources for 22 OECD countries between 1986–2006. Moreover, spe-cific attention is devoted to producing robust measures of the educational attainment ofrecent immigrants as well as native-born expatriates who return to their home country.Second, our estimations are based on the SYS-GMM for dynamic panel data modelsdeveloped by Arellano and Bover (1995) and Blundell and Bond (1998) that permitone to deal with the (potential) endogeneity of migration variables. However, the con-sistency of the SYS-GMM crucially depends on the validity of the instruments used.Therefore, in contrast to previous studies, we carefully follow some of the recommenda-tions of Roodman (2009) and Bazzi and Clement (2013), introducing both internal andexternal instruments in our estimation. We think that this way of proceeding is a usefulcomplement to standard specification tests for getting valid instruments and obtainingrobust econometric results.
Our econometric investigation provides evidence showing that, over the period con-sidered, the impact of migration on productivity growth via human capital accumulationand capital dilution is significant with the expected signs (i.e. respectively positive andnegative). Furthermore, in almost all OECD countries, the former dominates the latter.Therefore migration flows tend to have a positive (though small) impact on economicgrowth, even in countries which have highly selective migration policies. Moreover,simulations based on these results indicate that, all else equal, a one percentage-pointincrease in foreign-born net migration would have increased productivity growth bythree-tenths of a percentage-point per year on average for the 22 OECD countries con-sidered.
The remainder of the paper is organised as follows. Section 2 provides a shortreview of the literature. Section 3 outlines the theoretical model. Section 4 describesthe econometric strategy and the data, and presents the empirical results. Section5 discusses the implications of the results. Finally, Section 6 offers some concludingremarks. Technical details of the theoretical model and data sources are contained inthe appendix.
2 Direct and indirect effects of migration on economicgrowth: an overview of the literature
International migration potentially has direct and indirect effects on economic growth.Firstly, migration can be viewed as a demographic shock. Indeed, in the textbook Solow-Swan growth model, an increase in migration has a negative impact on the transitionalpath to the long-term steady state where all per capita variables are nonetheless stable.Even in this framework however, migration affects the age structure of the populationof the destination country because migrants tend to be more concentrated in active agegroups compared to natives. Consequently migration reduces dependency ratios and
4
potentially has a positive impact on aggregate savings,3 which finally could result inhigher total factor productivity (TFP) growth.4 Yet, this transmission channel has notbeen directly considered in the literature.
Secondly, migrants arrive with their skills and abilities, which supplement the stockof human capital in the host country. To our knowledge, Dolado et al. (1994) were thefirst to introduce migration into the Solow-Swan model augmented by human capital. Inthis framework the contribution of immigrants to human capital accumulation compen-sates (at least partially) the negative capital dilution effect associated with populationgrowth. The authors estimate their model for 23 OECD countries between 1960 and1985.
More recently, several authors have included migration in endogenous economicgrowth models. This literature considers the impact immigrants have on technologicalprogress, notably their contribution to innovation.5 Walz (1995), for instance, intro-duces migration in a two country endogenous growth model based on Lucas (1998).He finds that the sign of the growth rate effect depends on the initial specializationof the two countries and that migration is selective towards high skilled individuals.Robertson (2002) also analyses the impact of migration in an Uzawa-Lucas model withunskilled labour and shows that an inflow of relatively unskilled immigrants results inlower transitional growth.
Lundborg and Segerstrom (2000, 2002) include migration in a quality ladders growthmodel developed by Grossman and Helpman (1991). They find that free migration wouldstimulate growth, especially if it responds to differences in labour force endowments.Similarly, in an expansion-in-variety framework, Bretschger (2001) shows that skilledmigration can promote growth by decreasing the costs of research and development andalso by raising the market share of certain types of goods.
Most of the previous studies are theoretical and there exist very few empirical as-sessments of the impact of migration on economic growth. Furthermore, when suchanalyses exist they are not based on structural models and are often hampered by dataconstraints. For instance, Ortega and Peri (2009) analyse the effects of immigrationflows on total employment, physical capital accumulation and TFP in 14 OECD coun-tries between 1980 and 2005. They find that migration increases employment and capitalstocks but doesn’t have a significant effect on TFP. Since immigration shocks lead toan increase in total employment and a proportional response in production, output percapita is not effected by inflows of migrants. However, this study does not take into
3This effect may be partially offset by remittances sent by migrants to their country of origin.4There is increasing evidence of the impact of changes in age structure of the population on produc-
tivity (Sarel, 1995; Lindh and Malmberg, 1999; Kogel, 2005; Feyrer, 2007).5Hunt and Gauthier-Loiselle (2008) provide recent evidence on the impact of highly skilled migration
in the United States on innovation. They find that a one percentage-point rise in the share of immigrantcollege graduates in the population increases patents per capita by 6%.
5
account the human capital of migrants,6 or their diversity by country of origin. Morerecently, Felbermayr et al. (2010) and Ortega and Peri (2014) use bilateral migrationstocks around the year 2000 to estimate a positive relationship between the immigrantshare of the population and GDP per capita in the host country. Moreover, Ortega andPeri (2014) find that this positive relationship is magnified when diversity by countryof origin within the immigrant population is taken into account. These results are inline with the findings from studies on birthplace diversity and economic development.For example, Alesina et al. (2013) find a positive effect of diversity of immigration pop-ulation by country of birth and education on growth.
Another approach is to use time-series analysis. Morley (2006), for instance, analy-ses the causality between migration and economic growth on data for Australia, Canada,and the United States between 1930 and 2002. He finds evidence of long-run causalityrunning from per capita GDP to immigration but not the reverse. In another suchexample, Boubtane et al. (2013) find a positive bidirectional relationship between im-migration and GDP per capita for 22 OECD countries from 1987–2009. Note that dueto the lack of harmonised data on characteristics of migration flows, time-series studiesdo not take into account the educational attainment of immigrants.
The main contribution of this paper is to provide robust estimates of the impactof net migration flows on productivity growth, controlling for the skill composition ofrecent immigrants, through a clear theoretical framework which is presented in the nextsection.
3 The theoretical model
As in Dolado et al. (1994), migration is introduced in a standard augmented neoclassi-cal Solow-Swan model where aggregate output is produced from physical capital (K),human capital (H) and labour (L) using a Cobb-Douglas function with constant returnsto scale:
Y = KαHβ (A L)1−α−β α+ β < 1 (1)
where A is the labour-augmenting (or Harrod-neutral) technological progress. It is aproductivity parameter that grows at the constant exponential rate gA.
The first channel through which migration affects the economy of the host countryis essentially demographic as new inflows of foreign workers fuel labour force growth.This impact can be decomposed between net migration of foreign-born workers (M) andnet migration (net return) of native-born workers (E). As we shall see in Section 4.2,it is necessary to make this distinction because the dynamics and the skill compositionof these two migration streams are quite dissimilar. Note that net migration is the
6Orefice (2010) estimates the impact of migration on economic growth in a gravity model using OECDdata on gross migration flows for 24 countries between 1998 and 2007 and uses a proxy for educationbased on migrant stocks in 2000. The author finds a negative impact of migration on economic growth.
6
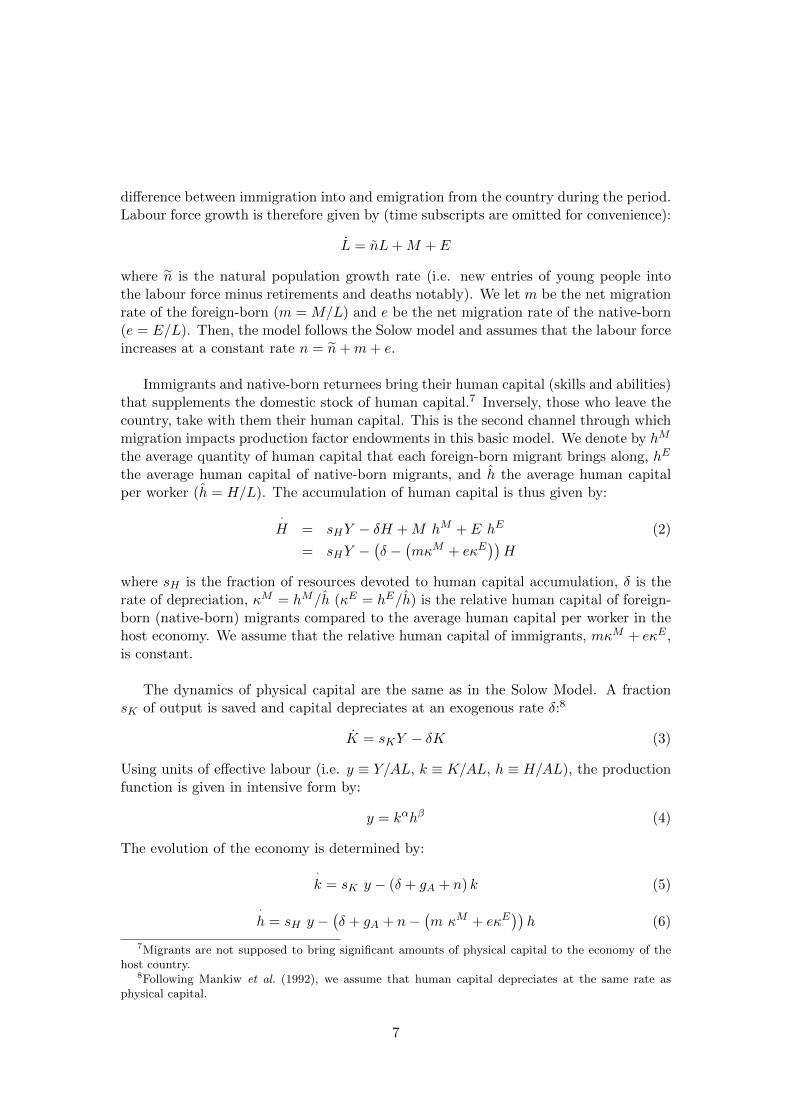
difference between immigration into and emigration from the country during the period.Labour force growth is therefore given by (time subscripts are omitted for convenience):
L = nL+M + E
where n is the natural population growth rate (i.e. new entries of young people intothe labour force minus retirements and deaths notably). We let m be the net migrationrate of the foreign-born (m = M/L) and e be the net migration rate of the native-born(e = E/L). Then, the model follows the Solow model and assumes that the labour forceincreases at a constant rate n = n+m+ e.
Immigrants and native-born returnees bring their human capital (skills and abilities)that supplements the domestic stock of human capital.7 Inversely, those who leave thecountry, take with them their human capital. This is the second channel through whichmigration impacts production factor endowments in this basic model. We denote by hM
the average quantity of human capital that each foreign-born migrant brings along, hE
the average human capital of native-born migrants, and h the average human capitalper worker (h = H/L). The accumulation of human capital is thus given by:
·H = sHY − δH +M hM + E hE (2)
= sHY −(δ −
(mκM + eκE
))H
where sH is the fraction of resources devoted to human capital accumulation, δ is therate of depreciation, κM = hM/h (κE = hE/h) is the relative human capital of foreign-born (native-born) migrants compared to the average human capital per worker in thehost economy. We assume that the relative human capital of immigrants, mκM + eκE ,is constant.
The dynamics of physical capital are the same as in the Solow Model. A fractionsK of output is saved and capital depreciates at an exogenous rate δ:8
K = sKY − δK (3)
Using units of effective labour (i.e. y ≡ Y/AL, k ≡ K/AL, h ≡ H/AL), the productionfunction is given in intensive form by:
y = kαhβ (4)
The evolution of the economy is determined by:
·k = sK y − (δ + gA + n) k (5)
·h = sH y −
(δ + gA + n−
(m κM + eκE
))h (6)
7Migrants are not supposed to bring significant amounts of physical capital to the economy of thehost country.
8Following Mankiw et al. (1992), we assume that human capital depreciates at the same rate asphysical capital.
7

The economy converges to a steady state defined by:
k∗ =
(sK
δ + gA + n
) 1−β1−α−β
(sH
δ + gA + n− (mκM + eκE)
) β1−α−β
(7)
h∗ =
(sK
δ + gA + n
) α1−α−β
(sH
δ + gA + n− (mκM + eκE)
) 1−α1−α−β
(8)
Substituting (7) and (8) into the production function and taking logarithms, the steadystate income per effective worker is:
ln y∗ =α
1− α− βln sK +
β
1− α− βln sH (9)
− α
1− α− βln (δ + gA + n)
− β
1− α− βln(δ + gA + n−
(mκM + eκE
))Assuming that all countries are in their steady state, this equation could be used for em-pirical analysis. Rather, we suppose that countries are growing near their steady state.The rate of growth as the economy converges to the steady state can be approximatedby:
·y
y=∂ ln y
∂t' −λ (ln y (t)− ln y∗) (10)
where λ = (1− α− β) (gA + δ + n) (Cf. appendix A.1). This yields:
ln y (t)− ln y∗ ∼= e−λt (ln y (0)− ln y∗) (11)
where y (0) is income per effective worker at some initial date. Note that, assuming aconstant rate of convergence λ over time, Equation (11) also holds between dates t andt− 1:
ln y (t)− ln y∗ ∼= e−λ (ln y (t− 1)− ln y∗)
For estimation purposes, we need an expression in terms of income per worker, y,rather than income per effective worker, y. Since y can be expressed in term of y(y ≡ Y/L), ln y (t) = ln y(t) − lnA(0) − gAt and, using Equation (9), we finally obtainthe productivity growth rate:
ln y(t)− ln y (t− 1) ∼= gA
(t− e−λ(t− 1)
)+ (1− e−λ) lnA(0) (12)
−(1− e−λ) ln y (t− 1)
+(1− e−λ)α
1− α− β(ln sK − ln (δ + gA + n))
+(1− e−λ)β
1− α− βln sH
−(1− e−λ)β
1− α− βln(gA + δ + n−
(mκM + eκE
))8

Equation (12) shows that for a given α, β, δ, λ, and gA, the rate of growth of productiv-ity is negatively related to the net migration rate because of the capital dilution effectassociated with labour force growth, n. However, this effect is counterbalanced by thepositive impact of the human capital content of migration flows
(mκM + eκE
). The net
effect of migration on productivity growth is therefore ambiguous and depends on therelative human capital contribution of foreign- and native-born migrants (κM and κE),on the net migration rates (m and e) and on the parameters of the production function(α and β).
In this framework, ceteris paribus, the inflow of foreign workers will have a posi-tive impact on productivity growth only if new migrants are more qualified than theresident population (κM > 1) on average. However, this is not a sufficient conditionas the human capital brought by migrants should also offset the capital dilution effect.Indeed, appendix B.1 shows that, provided there is not a net outflow of human cap-ital associated with total net migration (i.e. mκM + eκE ≥ 0), κM ≥ (α+ β) /β isa sufficient condition for migration to have a positive impact on productivity growth.Below that threshold the impact will however depend on other parameters of the model.
The fact that migration has a positive impact on productivity growth if and only ifits contribution to human capital accumulation more than compensates for the effecton capital dilution is a direct consequence of the augmented Solow-Swan theoreticalframework. This would not have necessarily been the case in an endogenous growthframework or in a framework in which one considers the imperfect substitution of nativesand immigrants in production (Manacorda et al., 2012; Ottaviano and Peri, 2012).
4 Econometric analysis
4.1 Empirical Model Specification
Equation (12) suggests a useful specification for the model that can be used to evaluatethe impact of immigration on economic growth in receiving countries. Note that:
ln(gA + δ + n−
(mκM + eκE
))= ln
((gA + δ + n) (1− mκM + eκE
gA + δ + n)
)= ln (gA + δ + n) + ln(1− mκM + eκE
gA + δ + n)
(13)
One can expect that mκM+eκE
gA+δ+nis small.9 Using the approximation ln (1− x) ∼= −x
yields the following equation for the growth rate per worker:
9The relative human capital content of migration flows is small compared to the sum of the rateof technical progress, the depreciation rate, and the overall labour force growth rate. The data set,
presented in the next section, indicates that mκM+eκE
gA+δ+nhas a mean value of 0.095 and a standard error
of 0.14.
9
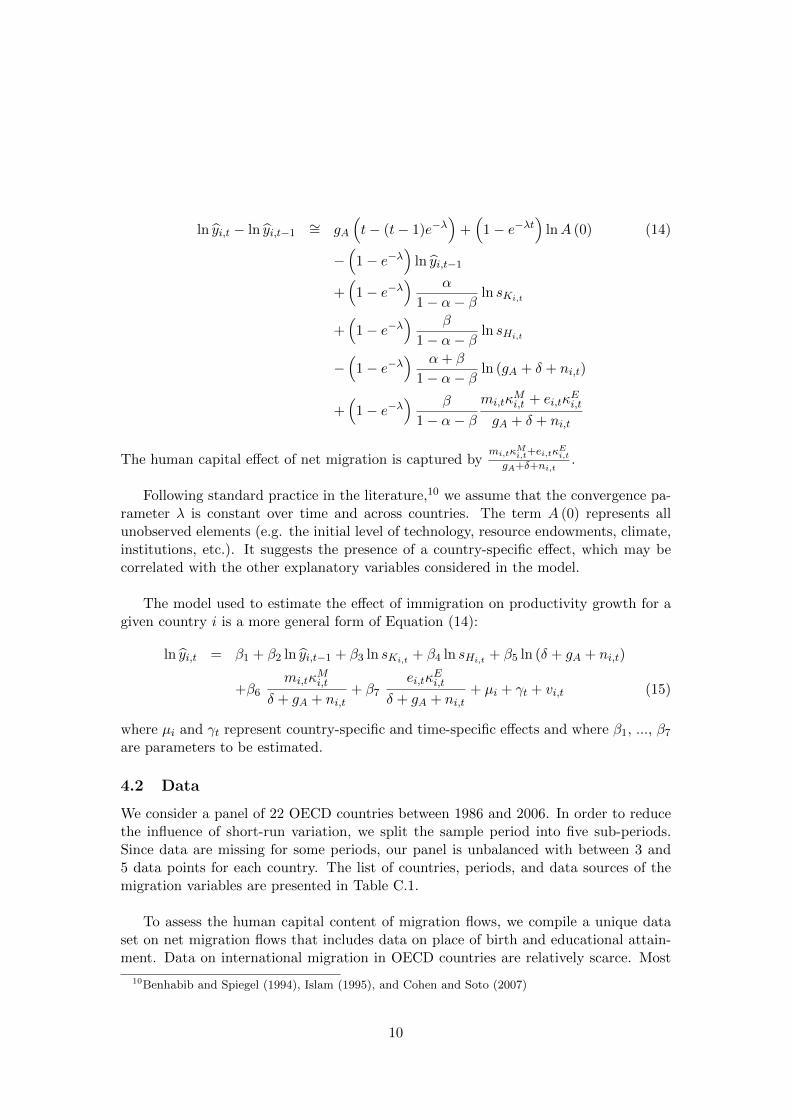
ln yi,t − ln yi,t−1∼= gA
(t− (t− 1)e−λ
)+(
1− e−λt)
lnA (0) (14)
−(
1− e−λ)
ln yi,t−1
+(
1− e−λ) α
1− α− βln sKi,t
+(
1− e−λ) β
1− α− βln sHi,t
−(
1− e−λ) α+ β
1− α− βln (gA + δ + ni,t)
+(
1− e−λ) β
1− α− βmi,tκ
Mi,t + ei,tκ
Ei,t
gA + δ + ni,t
The human capital effect of net migration is captured bymi,tκ
Mi,t+ei,tκ
Ei,t
gA+δ+ni,t.
Following standard practice in the literature,10 we assume that the convergence pa-rameter λ is constant over time and across countries. The term A (0) represents allunobserved elements (e.g. the initial level of technology, resource endowments, climate,institutions, etc.). It suggests the presence of a country-specific effect, which may becorrelated with the other explanatory variables considered in the model.
The model used to estimate the effect of immigration on productivity growth for agiven country i is a more general form of Equation (14):
ln yi,t = β1 + β2 ln yi,t−1 + β3 ln sKi,t + β4 ln sHi,t + β5 ln (δ + gA + ni,t)
+β6mi,tκ
Mi,t
δ + gA + ni,t+ β7
ei,tκEi,t
δ + gA + ni,t+ µi + γt + vi,t (15)
where µi and γt represent country-specific and time-specific effects and where β1, ..., β7are parameters to be estimated.
4.2 Data
We consider a panel of 22 OECD countries between 1986 and 2006. In order to reducethe influence of short-run variation, we split the sample period into five sub-periods.Since data are missing for some periods, our panel is unbalanced with between 3 and5 data points for each country. The list of countries, periods, and data sources of themigration variables are presented in Table C.1.
To assess the human capital content of migration flows, we compile a unique dataset on net migration flows that includes data on place of birth and educational attain-ment. Data on international migration in OECD countries are relatively scarce. Most
10Benhabib and Spiegel (1994), Islam (1995), and Cohen and Soto (2007)
10
available data are related to the characteristics of the stock of immigrants whereas weneed data on the characteristics of immigrant flows to estimate equation (15). Indeed,the main source of data on international migration is the population census, which pro-vides comparable migration stock data for recent census years. Artuc et al. (2013), thelast update of the Docquier and Marfouk (2006), data provide information on gender,country of origin, and educational level of the foreign-born population in 1990 and 2000.These data were extended by Brucker et al. (2013) for 20 OECD countries to two addi-tional census years, 1980 and 2010. Moreover, they impute missing information in orderto compile data on the foreign-born population from 1980 to 2010 at 5 year intervals.Furthermore, the OECD (2008) database on immigrants (DIOC) includes additionalinformation on labour market outcomes and the duration of stay of immigrants livingin OECD countries using the 2000 round of population censuses. Note that these datado not show where the tertiary diploma was obtained nor do they account for differencesin skills, including language proficiency.
An additional source of information on immigrants is data on migration flows avail-able from the OECD International Migration Database and the UN International Migra-tion Flows Database. However, these data are not harmonised and are not comparableacross countries. Moreover, outflows are generally unregulated and pose more measure-ment problems than inflows. Therefore, it is not possible to reconstruct comparablemeasures of net migration flows. Furthermore, data on immigrant flows concern onlynon-nationals (foreigners) while migration also involves nationals (citizens). Note that,unlike country of birth, citizenship changes over time with naturalization which maycompromise the comparison across countries at different time periods. Finally, statisticsavailable on migration flows are usually not broken down by education level.
Consequently, an important part of the background work for this study has beento gather and produce comparable data on net migration by country of birth and byeducational attainment.
Data on net migration flows by place of birth are directly available from borderstatistics for Australia, New Zealand, and the United Kingdom, and from populationregisters for Germany, the Netherlands, and Switzerland. For the 16 other countries,net migration flows of the native-born (E) are computed as a residual using the ba-sic demographic equation (Appendix C).11 Data on the native-born population aremainly collected from population censuses (see Table C.1 for details on data sources).We impute missing information on the native-born population between census yearsfollowing the United Nations (2009) methodology. Data on births, deaths and total netmigration flows come from the OECD Population and Vital Statistics Data set. Notethat net migration data (for both nationals and non-nationals) has fewer problems ofcomparability than the available data on inflows and outflows of foreign citizens citedabove. Finally, foreign-born net migration (M) is given by the difference between total
11For the countries where data on native-born net migration are directly available, there is a strongcorrelation between data computed from population censuses and published data on native-born netmigration.
11
net migration from the OECD database and native-born net migration, computed fromthe native population.
Though data on the educational attainment of the immigrant population in OECDcountries are accessible, for example from Brucker et al. (2013), to the best of ourknowledge no data on the education level of immigrant flows are available. Since theeducation or skill level of immigrants regardless of their date of arrival does not ac-count for the changes in their education and skill level over time, we compile data onthe educational attainment of recent immigrants. More precisely, we use the share ofrecent foreign-born migrants (i.e. those who have been in the host country for less than5 years) who have completed their tertiary education12 as a measure of the (average)human capital that each foreign-born immigrant brings to the host country (hM ). Thisshare is then compared to the corresponding figure for the total resident population atthe beginning of the period to compute κM . The data come from labour force surveydata for European countries and the United States and from population censuses forother OECD countries. Note that these data provide information only on immigrantswho still reside in the host country at the end of the observation period. No data areavailable on the skill composition of immigrants who left the host country during theperiod.
To calculate κE , we take advantage of the Database on Immigrants in OECD Coun-tries (DIOC) which provides data for people born in the OECD and living in anothercountry circa 2000 on educational attainment, age, and duration of stay. The educationstructure of native-born expatriates is directly observed from this data source for thosewho emigrated between 1990–1994 and 1998–2002. The former is approximated by look-ing at OECD expatriates with 5 to 10 years of residence in 2000 and the later by lookingat those OECD expatriates with less than 5 years of residence in 2000. Data are then lin-early extrapolated for other periods (1986–1990, 1994–1998, and 2002–2006). Note thatdata on the education structure of the resident population come from Lutz et al. (2007).
The data clearly show that net migration of the native-born tends to be negative inmost OECD countries over the period considered while the reverse is true for the foreign-born (Table C.2). Furthermore, net migration of the native-born is non-negligible andOECD expatriates are, on average, significantly more qualified than both foreign-bornmigrants (Table C.3) and the resident population. The capacity to distinguish betweennet migration of the foreign-born and that of the native-born is therefore essential forestimating the full impact of migration on host countries. Note that recent immigrantsto OECD countries are, on average, better educated than the resident population (TableC.4), which is in line with the findings of Manacorda et al. (2012) and Dustmann etal. (2012) on migrant stocks. The notable exception is the United States where recentimmigrants are slightly less educated, on average, than the resident population.
Data on GDP and the working age population (foreign- and native-born) come
12People who have completed 5 to 6 ISCED education levels.
12
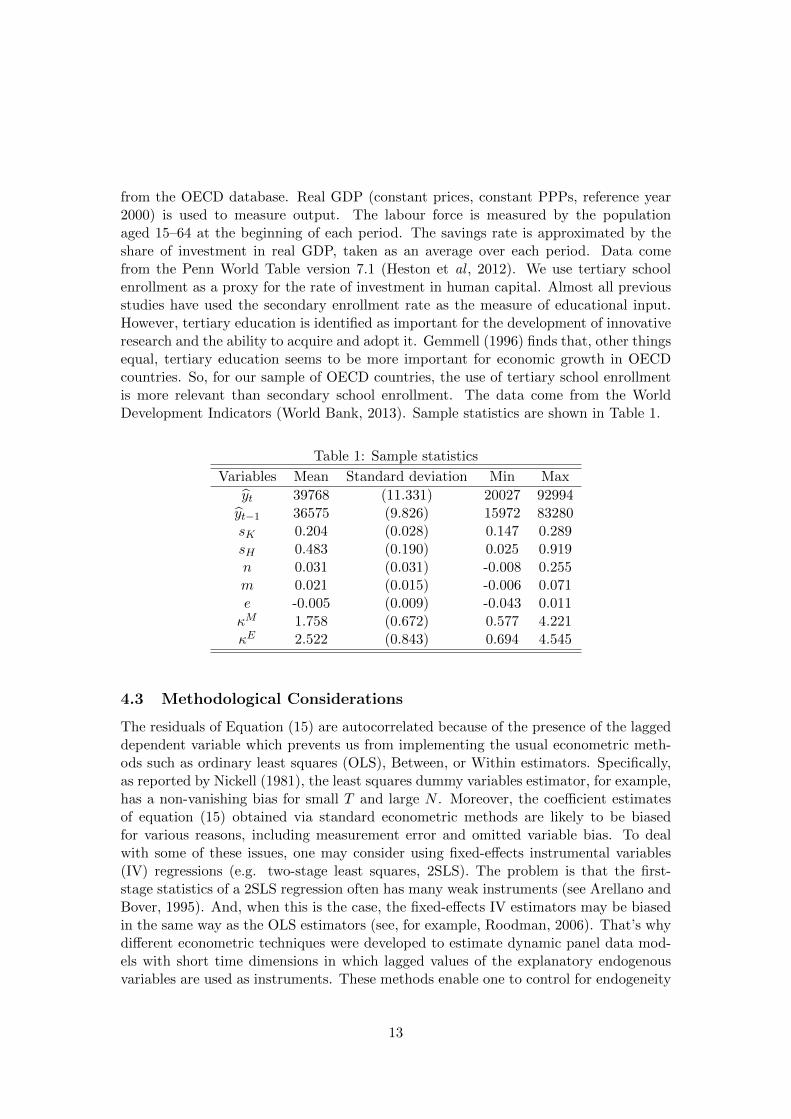
from the OECD database. Real GDP (constant prices, constant PPPs, reference year2000) is used to measure output. The labour force is measured by the populationaged 15–64 at the beginning of each period. The savings rate is approximated by theshare of investment in real GDP, taken as an average over each period. Data comefrom the Penn World Table version 7.1 (Heston et al , 2012). We use tertiary schoolenrollment as a proxy for the rate of investment in human capital. Almost all previousstudies have used the secondary enrollment rate as the measure of educational input.However, tertiary education is identified as important for the development of innovativeresearch and the ability to acquire and adopt it. Gemmell (1996) finds that, other thingsequal, tertiary education seems to be more important for economic growth in OECDcountries. So, for our sample of OECD countries, the use of tertiary school enrollmentis more relevant than secondary school enrollment. The data come from the WorldDevelopment Indicators (World Bank, 2013). Sample statistics are shown in Table 1.
Table 1: Sample statistics
Variables Mean Standard deviation Min Max
yt 39768 (11.331) 20027 92994yt−1 36575 (9.826) 15972 83280sK 0.204 (0.028) 0.147 0.289sH 0.483 (0.190) 0.025 0.919n 0.031 (0.031) -0.008 0.255m 0.021 (0.015) -0.006 0.071e -0.005 (0.009) -0.043 0.011κM 1.758 (0.672) 0.577 4.221κE 2.522 (0.843) 0.694 4.545
4.3 Methodological Considerations
The residuals of Equation (15) are autocorrelated because of the presence of the laggeddependent variable which prevents us from implementing the usual econometric meth-ods such as ordinary least squares (OLS), Between, or Within estimators. Specifically,as reported by Nickell (1981), the least squares dummy variables estimator, for example,has a non-vanishing bias for small T and large N . Moreover, the coefficient estimatesof equation (15) obtained via standard econometric methods are likely to be biasedfor various reasons, including measurement error and omitted variable bias. To dealwith some of these issues, one may consider using fixed-effects instrumental variables(IV) regressions (e.g. two-stage least squares, 2SLS). The problem is that the first-stage statistics of a 2SLS regression often has many weak instruments (see Arellano andBover, 1995). And, when this is the case, the fixed-effects IV estimators may be biasedin the same way as the OLS estimators (see, for example, Roodman, 2006). That’s whydifferent econometric techniques were developed to estimate dynamic panel data mod-els with short time dimensions in which lagged values of the explanatory endogenousvariables are used as instruments. These methods enable one to control for endogeneity
13
and measurement error for the lag of yt and other explanatory variables.
In our study, we use SYS-GMM as proposed by Arellano and Bover (1995), whichcombines a regression in differences with one in levels. Blundell and Bond (1998) reportMonte Carlo evidence showing that the inclusion of a level regression in the estimationleads to a reduction of the potential bias in small samples and asymptotic inaccuracy inthe difference estimator.13 The consistency of the GMM estimator relies on the validityof the instruments introduced in the model and the assumption that the error terms areuncorrelated. To obtain valid instruments, we followed some of the recommendationsgiven by Roodman (2009) and Bazzi and Clement (2013), the former addressing theproblem of too many instruments,14 and the latter the fact that common instrumentalvariable approaches can lead to opaquely weak or opaquely invalid instruments. Oneof them is limiting the lag depth, the other one is ‘collapsing’ the instrument set (seeRoodman, 2009). The former implies a selection of lags to be included in the instru-ment set, making the instrument count linear in T . The latter embodies a differentbelief about the orthogonality condition: it no longer needs to be valid for any onetime period but still for each lag, again making the instrument count linear in T . Acombination of both techniques makes the instrument count invariant to T . In our case,we use the collapsed two-period lags from all variables included in the estimation asthe (internal) instrument sets.15 Moreover, following Bazzi and Clement (2013), sinceinternal instruments may not be sufficient in dynamic models estimated by SYS-GMMtechniques, we also include an external instrument16 which has already been used inother published works (Altonji and Card, 1991; Card, 2001; Dustmann et al., 2005).This procedure is typically implemented by using the share of immigrants in the popu-lation at the beginning of the period as an instrumental variable for immigrant inflowsduring the period. Indeed, immigrants tend to settle where there are existing networks(Bartel, 1989; Jaeger, 2007) and past immigration concentrations are unlikely to berelated to current economic shocks.
Finally, we consider three specification tests to deal with the consistency of the SYS-GMM estimator. The first one is a serial correlation test, which tests the null hypothesisof no first-order serial correlation and no second-order serial correlation in the residuals
13The first-differenced GMM estimator is based on the idea of writing the equation at hand as adynamic panel data model, taking first-differences to remove the unobserved time-invariant country-specific effects and then instrumenting the right-hand-side variables in the first-differenced equationsusing levels of the series lagged two periods or more. This is done under the assumption that thetime-varying disturbances in the original level equations are not serially correlated.
14The main small-sample problem associated with numerous instruments is that a large instrumentcollection overfits endogenous variables even as it weakens the Hansen test of the instruments’ jointvalidity. Specifically, as Roodman (2009) states, “if for instance T = 3, the SYS-GMM generates onlytwo instruments per instrumenting variable. But as T rises, the instrument count can easily growlargely relative to the sample size, making some asymptotic results about the estimators and relatedspecification tests misleading.” See the paper for a more complete discussion of this issue.
15Note that similar results are obtained with the collapsed three-period lags from all variables includedin the estimation as the instruments sets.
16We also use the collapsed two-period lags from past immigrant concentrations as external instrumentsets. Similar results are obtained with the collapsed three-period lags.
14

of the first-differenced equation. The second one is a Sargan test of overidentifyingrestrictions, which examines the overall validity of the instruments by comparing themoment conditions to their sample analogue. A finite sample correction is made tothe two-step covariance matrix using Windmeijer’s (2005) method. The third one is adifference Sargan test, denoted by Diff-Sargan, proposed by Blundell and Bond (1998),which examines the null hypothesis of mean stationarity for the SYS-GMM estimator.These statistics, called incremental Sargan test statistics, are the difference betweenthe Sargan statistics for first-differenced GMM and SYS-GMM. It is asymptotically χ2
distributed with k degrees of freedom, where k is the number of additional momentconditions.
4.4 Econometric Results
Before moving to regression equations, we first consider the pooling restrictions im-plicit in equation (15) and test whether key parameters are equal across countries (i.e.βij = βi,∀i = [1, 7], j = [1, 22]), which would imply that pooling time series and cross-sectional data is valid in our growth regression context. Specifically, we employ a multi-step procedure to test pooling restrictions in our system of 22 OECD members wherehypotheses of interest are tested by means of a likelihood-ratio statistic. This procedureis in the same spirit as the approach of Hsiao (1986). Our results (available upon request)provide evidence showing that common coefficients can be assumed across countries andconsequently pooling time series and cross sectional data seems to be reasonable in thiscontext. However, the additional restriction that µj = µ, ∀j = [1, 22] was stronglyrejected by the data, implying that equation (15) includes individual country effects.What is more, the fixed effect specification turns out to be the more appropriate in ourgrowth equation framework.
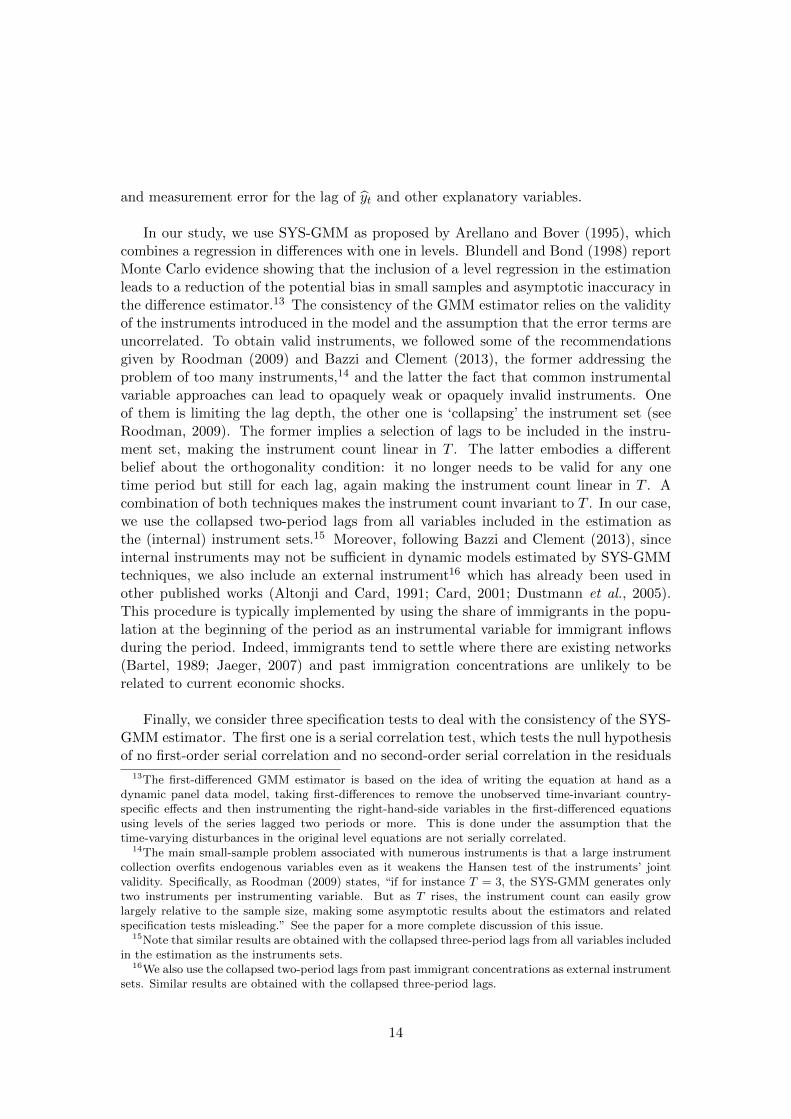
We then estimate equation (15) on data for 22 OECD countries from 1986–2006.The results for the SYS-GMM estimation are reported in Table 2. Two types of specifi-cations are considered. The first is the standard augmented Solow model, which servesas a benchmark. Results for this specification are presented in column 1. The second isthe human capital content of net migration in the augmented Solow model as specifiedin equation (15). Results are presented in the second column.
Before commenting on our results, it is important to point out that our GMMmodel specification passes all the standard diagnostic tests, the p-values of which aregiven in the last three lines of Table 2. In particular, there is no evidence of residualfirst- or second-order autocorrelation, and the validity of the instruments is confirmedby Hansen-Sargan’s test. The results from Table 2 show that most estimated coeffi-cients have a sign that accords with what is predicted by the empirical and theoreticalliterature. This is true for all specifications considered. The only exceptions are theestimated coefficients of the rate of human capital accumulation, which are statisticallyinsignificant.17 Estimation of the benchmark model in column 1 shows a highly signifi-
17This result is identical to that reported by many authors (Benhabib and Spiegel, 1994; Islam, 1995,Bond et al., 2001).
15
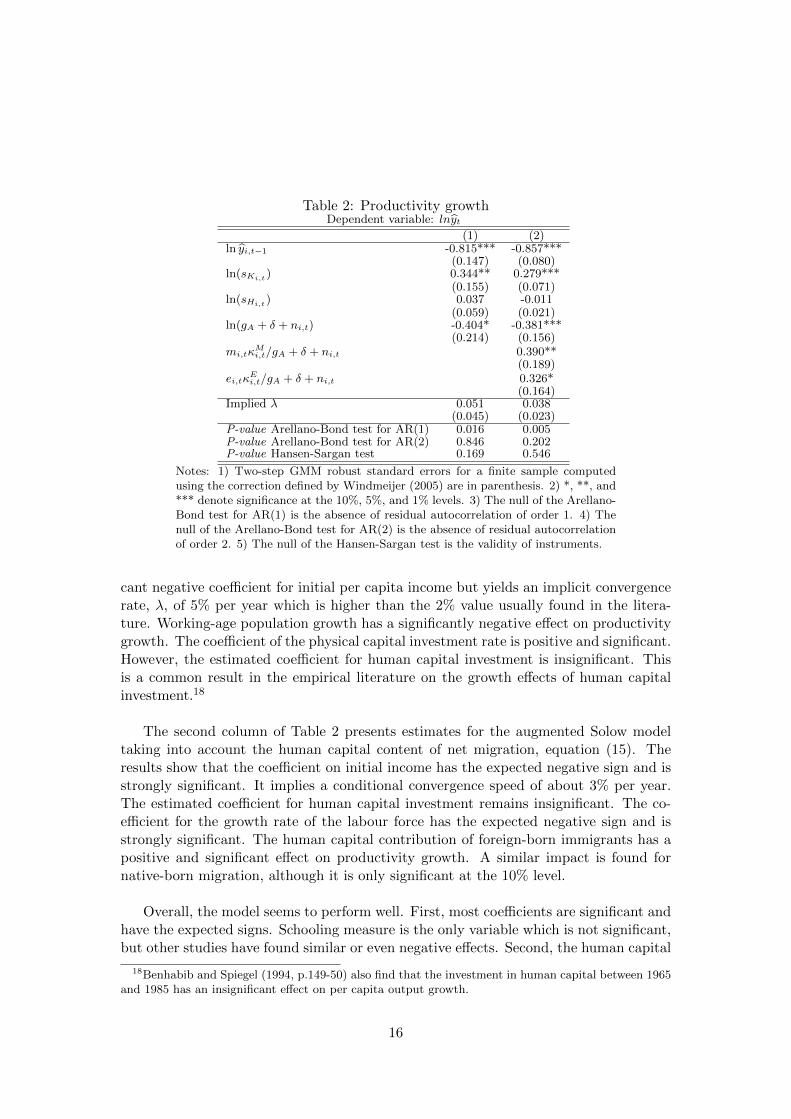
Table 2: Productivity growthDependent variable: lnyt
(1) (2)ln yi,t−1 -0.815*** -0.857***
(0.147) (0.080)ln(sKi,t) 0.344** 0.279***
(0.155) (0.071)ln(sHi,t) 0.037 -0.011
(0.059) (0.021)ln(gA + δ + ni,t) -0.404* -0.381***
(0.214) (0.156)mi,tκ
Mi,t/gA + δ + ni,t 0.390**
(0.189)ei,tκ
Ei,t/gA + δ + ni,t 0.326*
(0.164)Implied λ 0.051 0.038
(0.045) (0.023)P-value Arellano-Bond test for AR(1) 0.016 0.005P-value Arellano-Bond test for AR(2) 0.846 0.202P-value Hansen-Sargan test 0.169 0.546
Notes: 1) Two-step GMM robust standard errors for a finite sample computedusing the correction defined by Windmeijer (2005) are in parenthesis. 2) *, **, and*** denote significance at the 10%, 5%, and 1% levels. 3) The null of the Arellano-Bond test for AR(1) is the absence of residual autocorrelation of order 1. 4) Thenull of the Arellano-Bond test for AR(2) is the absence of residual autocorrelationof order 2. 5) The null of the Hansen-Sargan test is the validity of instruments.
cant negative coefficient for initial per capita income but yields an implicit convergencerate, λ, of 5% per year which is higher than the 2% value usually found in the litera-ture. Working-age population growth has a significantly negative effect on productivitygrowth. The coefficient of the physical capital investment rate is positive and significant.However, the estimated coefficient for human capital investment is insignificant. Thisis a common result in the empirical literature on the growth effects of human capitalinvestment.18
The second column of Table 2 presents estimates for the augmented Solow modeltaking into account the human capital content of net migration, equation (15). Theresults show that the coefficient on initial income has the expected negative sign and isstrongly significant. It implies a conditional convergence speed of about 3% per year.The estimated coefficient for human capital investment remains insignificant. The co-efficient for the growth rate of the labour force has the expected negative sign and isstrongly significant. The human capital contribution of foreign-born immigrants has apositive and significant effect on productivity growth. A similar impact is found fornative-born migration, although it is only significant at the 10% level.
Overall, the model seems to perform well. First, most coefficients are significant andhave the expected signs. Schooling measure is the only variable which is not significant,but other studies have found similar or even negative effects. Second, the human capital
18Benhabib and Spiegel (1994, p.149-50) also find that the investment in human capital between 1965and 1985 has an insignificant effect on per capita output growth.
16
content of the net migration coefficients is positive and strongly significant, which showsthe importance of the role played by the skills of immigrants on the growth of OECDcountries.
5 The impact of immigration on productivity growth
The theoretical model described in Section 3 suggests that the impact of migrationon productivity growth is ambiguous and depends on (i) foreign-born and native-bornmigrants’ relative human capital endowments, (ii) the scope of migration, and (iii)production parameters. The results of the econometric investigation of Section 4 allowus to assess the overall effect of foreign-born immigrants on GDP growth per worker.
Based on the estimation results for outlined in Table 2 and applying the averagevariables for the total period 1986-2006, we estimate the effect of an increase in the netmigration rate of the foreign-born on productivity growth for each country included inour sample. We do the same for an increase in the skill composition of net migrationflows (Cf. Appendix B.2). Results are reported in the Table 3.
Table 3: Impacts of increases in net migrationKey structural variables Impact on productivity growth in % per year
Country m hM κM +1 % point in m 50% increase in m 10% in κM
Austria 0.47 18.9 2.20 0.47 0.45 0.18Australia 0.56 36.6 1.73 0.23 0.26 0.14Belgium 0.44 33.6 1.77 0.30 0.26 0.13Canada 0.76 49.5 1.67 0.19 0.29 0.19Switzerland 0.97 34.2 1.87 0.29 0.56 0.29Germany 0.58 20.3 1.12 0.02 0.03 0.09Denmark 0.33 28.4 1.33 0.14 0.09 0.08Spain 0.56 24.1 1.52 0.14 0.16 0.13Finland 0.17 24.0 1.39 0.17 0.06 0.04France 0.32 27.8 1.91 0.37 0.23 0.10Greece 0.32 13.5 1.01 -0.05 -0.03 0.05Ireland 0.81 43.6 2.87 0.60 0.96 0.32Iceland 0.55 34.7 2.26 0.56 0.62 0.21Italy 0.29 10.9 1.77 0.34 0.20 0.09Luxembourg 1.24 35.5 2.07 0.28 0.70 0.39Netherlands 0.35 22.8 1.33 0.13 0.09 0.08Norway 0.36 29.4 1.33 0.12 0.08 0.08New Zealand 0.79 35.2 1.85 0.27 0.43 0.21Portugal 0.09 18.3 2.51 0.62 0.11 0.04Sweden 0.50 36.6 1.63 0.22 0.22 0.13United Kingdom 0.37 39.6 2.08 0.44 0.32 0.13United States 0.51 26.7 0.97 -0.03 -0.04 0.07
OECD 22 0.52 29.3 1.75 0.27 0.28 0.14
Note: m is the average annual net migration rate %, hM is the share of tertiary educatedamong recent foreign-born migrants %, average over the 1986-2006 period. κM is the relativehuman capital of foreign-born migrants compared to the average human capital per workerin the host economy, average over the 1986-2006 period.
Results show that in most OECD countries, taking into account the skill compositionof foreign-born migrants, increasing permanent migration of foreign-born workers by 1
17
percentage-point would increase productivity growth by between one- and six-tenths ofa percentage-point per year (Column 4, Table 3). Practically no effect is observed forGermany, Greece, and the United States. In these countries recent immigrants are asskilled as the resident population so the human capital they contribute is almost enoughto offset the capital dilution effect. Note that the very small negative effect of foreign-born migration on productivity growth in Greece and the United States represents onlyone-tenth of the negative impact of a comparable increase in the natural populationgrowth rate, n.
A one percentage-point increase in net migration is not necessarily comparable acrosscountries as it represents quite distinct shocks on migration. If we consider a 50% in-crease in the net migration rate of the foreign-born, everything else being equal, wefind in all but two countries that the change in productivity growth is positive (column5, Table 3). Still, the migration growth effect is small for all countries except Ireland,Iceland, and Luxembourg where the increase in productivity growth is more than six-tenths of a percentage-point per year.In order to compare our results with regard to recent empirical literature, we shouldlook at -in addition to the effect on GDP per worker outlined in Table 3- the effect onthe demographic ratio of working age to total population (Appendix D). Foreign-bornmigration flows improved this ratio in all OECD countries. In Greece and the UnitedStates, the positive demographic effect compensates the small negative effect on produc-tivity growth. Thus, foreign-born permanent migration flows increase GDP per capitain all OECD countries considered (Table D.1). These results are in line with the findingsof recent empirical studies based on migration stock data, although the positive effectof foreign-born migration we find seems smaller in magnitude. For instance, the resultsof Felbermayr et al. (2010) indicate that a 10% increase in the migration stock leads toa per capita income gain of 2.2%. Ortega and Peri (2014) find ”‘a qualitatively largeeffect: a 10 percentage-point difference in the share of foreign born in the population”’seems to be ”‘associated with differences in income per person by a factor close to 2”’.
Moreover, in this framework, adopting more selective migration policies has a sys-tematically positive impact on productivity growth (Cf. Appendix B.2). Column 6shows that a 10% increase in the relative share of tertiary-educated immigrants com-pared to the resident population adds between one- and four-tenths of a percentage-pointto the productivity growth rate. It is also worth noting that raising the education levelof new immigrants will have a positive impact on productivity growth in countries suchas Germany, Greece, and the United States where foreign-born immigrants are as ed-ucated as the resident population. For the remaining countries, immigrants are highlyeducated compared to the resident population and, given the skill level of recent immi-grants, increasing net migration seems to have a more sizable impact on productivitygrowth than adopting a more selective policy.
18
6 Conclusion
By estimating a structural model, this paper has sought to provide a new look at theeffect of permanent migration flows by country of origin and skill level on economicgrowth. To this end, we have first compiled an original data set on the net migration ofthe native- and foreign-born containing educational attainment information from var-ious data sources for 22 OECD countries between 1986 and 2006. Moreover, in thetheoretical model, on which our econometric investigation is based, we account for theimpact of migration on capital dilution and human capital accumulation. Dependingon the relative skill endowment of migrants compared to the resident population, thepermanent migration flow may positively impact productivity growth.
In contrast to previous studies and following the recommendations of both Rood-man (2009) and Bazzi and Clement (2013), we deal with the potential endogeneity ofthe migration variables by choosing appropriate (internal and external) instruments,estimating our model using SYS-GMM. The results support the theoretical model anddemonstrate a positive impact of the human capital brought by migrants on economicgrowth. The contribution of immigrants to human capital accumulation tends to dom-inate the mechanical dilution effect. The net effect is fairly small, even in countriesthat have highly selective migration policies. A 50% increase in net migration of theforeign-born generates, on average, an increase of three-tenths of a percentage-point inproductivity growth per year in OECD countries. Increasing the selectivity of migrationpolicies does not appear to have a more marked effect on productivity growth, exceptperhaps in countries where recent immigrants are somewhat less educated than residentpopulation.
Obviously one could argue that our model only partially captures the effects of mi-gration on economic growth. For example, migration changes the domestic age structureof host countries as migrants tend to be concentrated in the more active age groups com-pared to natives and thereby reduce dependency ratios. There is also some evidence thatimmigrants tend to be complementary to natives as they may free some native workersto devote time to more productive jobs. Further, immigrants may bring some assetswith them, thereby contributing to physical capital accumulation in the host country.Moreover, skilled immigrants may contribute to research and could boost innovation andtechnological progress. Therefore, further research is needed to account for these effectsbefore one can definitively state the full impact of migration on economic growth. Thatsaid, our results provide evidence that one should not expect large gains (or significantloses) in terms of productivity from migration.
19

References
Alesina, A., Harnoss, J., Rapoport, H. (2013) Birthplace Diversity and Economic Pros-perity,. Working Paper 18699. National Bureau of Economic Research.
Altonji, J. G., and Card, D. (1991) The Effects of Immigration on the Labor MarketOutcomes of Less skilled Natives, ch. 7 in J. M. Abowd and R. B. Freeman (eds),Immigration, Trade, and the Labor Market, Chicago, IL, University of Chicago Press,20134.
Andersen, T. and Dalgaard, C. J.(2011) Flows of people, flows of ideas, and the inequal-ity of nations, Journal of Economic Growth, 16, 1-32.
Angrist J. D. and Kugler A. D. (2003) Protective or Counter-Productive? LabourMarket Institutions and the Effect of Immigration on EU Natives, Economic Journal,113, F302-F331.
Arellano, M. and Bover.O. (1995) Another Look at the Instrumental Variable Estima-tion of Error-Components Models, Journal of Econometrics, 68, 29-52.
Artuc, E., Docquier, F.,Ozden, C. and Ch. Parsons (2013) A global asessment of humancapital mobility: the role of non-OECD destinations
Auerbach A. and P. Oreopoulos (1999) Analysing the Fiscal Impact of US Immigration,American Economic Review, 89, 176-80.
Barro, R. and X. Sala-i-Martin (1995) Economic Growth, McGraw-Hill, New York.
Bartel, A. P.(1989) Where Do the New US Immigrants Live?, Journal of Labor Eco-nomics, 7, 371 91.
Benhabib, J.and Spiegel, M.M. (1994) The role of human capital in economic develop-ment: Evidence from aggregate cross-country data, Journal of Monetary Economics,34, 14373.
Blundell, R. and S. Bond. (1998) Initial Conditions and Moment Restrictions in Dy-namic Panel Data Models, Journal of Econometrics, 87, 115-43.
Bond, S., Hoeffler, A. and J. Temple. (2001) GMM Estimation of Empirical GrowthModels, CEPR discussion paper no. 3048 .
Borjas G.J. (2003) The Labor Demand Curve is Downward Sloping: Reexamining theImpact of Immigration on the Labor Market, Quarterly Journal of Economics, 118,1335-74.
Borjas G.J., (2009) The Analytics of the Wage Effect of Immigration NBER WorkingPapers 14796.
Bazzi, S. and Clement M. A (2013) Blunt instruments: avoiding common pitfalls inidentifying the causes of economic growth, American Economic Journal: Macroeco-nomics, 5, 15286.
Boubtane, E., Coulibaly, D. and Rault, C. (2013) Immigration, Growth, and Unem-ployment: Panel VAR Evidence from OECD Countries, Review of Labour Economicsand Industrial Relations, 27, 399-420.
Bretschger, L. (2001) Labor supply, Migration, and Long-term development, Openeconomies review, 12, 5-27.
20

Brucker H., Capuano, S. and Marfouk, A. (2013) Education, gender and internationalmigration: insights from a panel-dataset 1980-2010, mimeo.
Card, D. (2001) Immigrant Inflows, Native Outflows, and the Local Labor MarketImpacts of Higher Immigration, Journal of Labor Economics, 19, 2264.
Cohen, D. and Soto,M. (2007) Growth and human capital: good data, good results,Journal of Economic Growth,12, 51-76.
Docquier, F. and A. Marfouk (2006)International migration by educational attainment(1990-2000), in C. Ozden and M. Schiff (eds). International Migration, Remittancesand Development, Palgrave Macmillan: New York.
Dolado, J., A. Goria, and A. Ichino, (1994) Immigration, Human Capital and Growthin the Host Country: Evidence from Pooled Country Data, Journal of PopulationEconomics, 7, 193-215.
Dumont, J-C and G. Lemaıtre, (2005) Counting immigrants and expatriates in OECDcountries: A new perspective, OECD Social Employment and Migration WorkingPapers, No. 25, OECD, Paris.
Dumont, J.C. and Spielvogel, G.(2008). Return migration: A new perspective, in OECD:International Migration Outlook 2008, Paris: OECD.
Felbermayr, G., S. Hiller, and D. Sala.(2010) Does Immigration Boost Per Capita In-come?, Economics Letters, 107, 177-79.
Feyrer J., (2007) Demographics and Productivity, The Review of Economics and Statis-tics, MIT Press, 89, 100-09.
Dustmann, C., Fabbri, F., and Preston, I. (2005), The Impact of Immigration on theBritish Labour Market, The Economic Journal, 115, F32441.
Dustmann, C., Frattini, T., and Lanzara, G. (2012) Educational achievement of second-generation immigrants: an international comparison, Economic Policy, 27, 143-85.
Gemmell, N. (1996). Evaluating the Impacts of Human Capital Stocks and Accumula-tion on Economic Growth: Some New Evidence, Oxford Bulletin of Economics andStatistics,58, 9-28.
Grossman, G.M., and Helpman, E., (1991) Innovation and Growth in the Global Econ-omy. MIT Press, Cambridge, MA.
Hansen J. and Lofstrom M. (2003) Immigrant assimilation and welfare participation:Do immigrants assimilate into or out-of welfare, Journal of Human Resources,38,74-98.
Heston A., Summers R. and Aten B. (2012) Penn World Table Version 7.1, Centerfor International Comparisons of Production, Income and Prices at the University ofPennsylvania.
Hsiao, C.(1986) Analysis of Panel Data, Cambridge University Press, Cambridge, MA.
Hunt J. and M. Gauthier-Loiselle, (2008). How Much Does Immigration Boost Innova-tion?, NBER Working Papers 14312.
Islam, N. (1995) Growth Empirics: A Panel Data Approach, The Quarterly Journal ofEconomics, 110, 1127-70.
21
Jaeger, D. (2007) Green Cards and the Location Choices of Immigrants in the UnitedStates, 19712000, Research in Labor Economics, 27, 13183.
Kogel T., (2005) Youth dependency and total factor productivity, Journal of Develop-ment Economics, 76, 147-73.
Leibfritz W., P. OBrien and JC. Dumont ( 2003) Effects of Immigration on LabourMarkets and Government Budgets: An Overview, CESIFO WP 874
Lindh T.and Malmberg,B. (1999) Age structure effects and growth in the OECD, 1950−1990, Journal of Population Economics, 12, 431-49.
Longhi, S., Nijkamp, P. and Poot, J. (2005) A Meta-Analytic Assessment of the Effectof Immigration on Wages, Journal of Economic Surveys, 19, 451-77.
Longhi, S., Nijkamp, P. and Poot, J. (2008) Meta-analysis of Empirical Evidence on theLabor Market Impacts of Immigration, IZA Discussion Paper no. 3418.
Lubotsky D. (2007) Chutes or Ladders? A Longitudinal Analysis of Immigrant Earn-ings, Journal of Political Economy,115(5), 820-67.
Lucas, R., (1998) On the mechanics of economic development, Journal of MonetaryEconomics, 22, 3-42.
Lundborg, P. and Segerstrom, P. (2000) International Migration and Growth in Devel-oped Countries: A theoretical analysis, Economica, 67, 579-604.
Lundberg, P.and Segerstrom, P. (2002) The growth and welfare effects of internationalmass migration. Journal of International Economics,56, 177-204
Lutz, W., Goujon, A., Samir, K. and Sanderson, W. (2007) Reconstruction of popula-tions by age, sex and level of educational attainment for 120 countries for 1970-2000,Vienna Yearbook of Population Research 2007, 193-235.
Marco Manacorda, M., Alan Manning, A. and Jonathan Wadsworth, J. (2012) TheImpact Of Immigration On The Structure Of Wages: Theory And Evidence FromBritain, Journal of the European Economic Association, 10, 120-51.
Mankiw, G., D. Romer and D. Weil (1992) A Contribution to the Empirics of EconomicGrowth, Quarterly Journal of Economics, 107, pp. 407-437.
Morley, B. (2006). Causality between economic growth and immigration: An ARDLbounds testing approach, Economics Letters, 90, 72-6.
Nickell, S. (1981) Biases in dynamic models with fixed effects, Econometrica, 49, 1417-26.
OECD(2008) A Profile of Immigrant Populations in the 21st Century: Data from OECDCountries, Paris.
OECD (2009) Recent Trends in International Migration, International Migration Out-look, Paris.
Orefice, G. (2010) Skilled Migration and Economic Performances: evidence from OECDcountries, Swiss Journal of Economics and Statistics, 146,.781-820.
Ortega F. and Peri, G. (2009) The causes and Effects of International Migration: evi-dence from OECD countries 1980-2005, NBER Working Papers 14833.
Ortega F. and Peri G. (2014) Migration, Trade and Income, Journal of International
22
Economics, 92, 231-51.
Ottaviano G. and G. Peri (2008) Immigration and National Wages: Clarifying theTheory and the Empirics, NBER Working Papers 14188.
Ottaviano, G., I.,P. and Peri, G. (2012) Rethinking The Effect Of Immigration OnWages, Journal of the European Economic Association, 10, 152-97.
Robertson, P.E.(2002). Demographic shocks and human capital accumulation in theUzawa-Lucas model, Economics Letters, Elsevier, 74, pages 151-6.
Roodman, D. (2006) How to do xtabond2: An introduction to ‘Difference’ and ‘System’GMM in Stata, Center for Global development Working Paper 103.
Roodman, D. (2009) A note on the theme of too many instruments,Oxford Bulletin ofEconomics and Statistics, 71, 135-58.
Rowthorn, R. (2008) The Fiscal Impact of Immigration on the AdvancedEconomies.Oxford Review of Economic Policy, 24, 560-80.
Sarel M. (1995). Demographic Dynamics and the Empirics of Economic Growth , IMFStaff Papers, 42, 398-410.
Storesletten, K. (2000) Sustaining Fiscal Policy through Immigration, Journal of Polit-ical Economy, 108, 300-23.
Storesletten, K. (2003) Fiscal implications of immigration .a net present value approach,Scandinavian Journal of Economics, 105, 487-506.
United Nations Department of Economic and Social Affairs, Population Division (2009).Trends in International Migrant Stock: The 2008 Revision (United Nations database,POP/DB/MIG/Stock/Rev.2008).
Walz, U. (1995) Growth (Rate) Effects of Migration, Zeitschrift fur Wirtschafts- undSozialwissenschaften, 115, 199-221.
Windmeijer, F. (2005) A finite sample correction for the variance of linear efficienttwo-step GMM estimators, Journal of Econometrics, 126, 25-51.
World Bank (2013) World Development Indicators, Washington, DC.
23
Appendix A The speed of convergence
From the intensive form production function given by equation (4), the rate of growthof income per effective worker is given by:
·y
y= α
·k
k+ β
·h
h. (A.1)
We substitute (5) and (6) into (A.1) to get:
·y
y= α
(sK
y
k− (δ + gA + n)
)+β(sH
y
h−(δ + gA + n−
(m κM − e κE
))). (A.2)
Note that at the steady state, using (7) and (8), we have:
sKy∗k∗
= (δ + gA + n)
sHy∗h∗
= δ + gA + n−(m κM − eκE
).
(A.3)
Substituting (A.3) into (A.2) results in:
·y
y= α
(sK
y
k− sK
y∗k∗
)+ β
(sH
y
h− sH
y∗h∗
).
Therefore:
·y
y= αsK
y∗k∗
((k
k∗
)α−1( h
h∗
)β− 1
)
+βsHy∗h∗
((k
k∗
)α( h
h∗
)β−1
− 1
). (A.4)
Note that:(k
k∗
)α−1( h
h∗
)β− 1 = exp
((α− 1) ln
(k
k∗
)+ β ln
(h
h∗
))− 1.
Around the steady state (α− 1) ln(kk∗)+β ln
(hh∗)
is small, so we can use the exponentialapproximation ex = 1 + x to obtain:(
k
k∗
)α−1( h
h∗
)β− 1 = (α− 1) ln
(k
k∗
)+ β ln
(h
h∗
)(k
k∗
)α( h
h∗
)β−1
− 1 = α ln
(k
k∗
)+ (β − 1) ln
(h
h∗
).
(A.5)
24
Substituting (A.3) and (A.5) into (A.4), we have:
·y
y= α (δ + gA + n)
((α− 1) ln
(k
k∗
)+ β ln
(h
h∗
))+β(δ + gA + n−
(m κM − e κE
))(α ln
(k
k∗
)+ (β − 1) ln
(h
h∗
)).
Then:
·y
y= − (δ + gA + n)
[(1− α− β)ln
(y
y∗
)+ β
m κM − e κE
δ + gA + n
(ln
(y
y∗
)− ln
(h
h∗
))].
For small m κM−e κEδ+gA+n
, βm κM−e κEδ+gA+n
(ln(yy∗
)− ln
(hh∗))
can be neglected. So, the growth
rate as the economy converges to the steady state is:
·y
y= − (δ + gA + n) (1− α− β) ln
y
y∗= − (δ + gA + n) (1− α− β) (ln y − ln y∗)= −λ (ln y − ln y∗) ,
(A.6)
and thus the rate of convergence is given by:
λ = (1− α− β) (δ + gA + n) .
This leads to:ln y (t)− ln y∗ = e−λt (ln y (0)− ln y∗) . (A.7)
Appendix B The growth effect of migration
Appendix B.1 The theoretical model
The annual growth rate of output per worker, gy, is given by Equation (12):
tgy ≡ ln y (t)− ln y (0) = gAt+(
1− e−λt)
(lnA (0)− ln y (0) + ln y∗) .
Foreign-born migrants’ impact on growth is given by:
t∂gy∂m
=∂ (ln y (t)− ln y (0))
∂m
=∂(1− e−λt
)∂m
(lnA (0)− ln y (0)− ln y∗) +(
1− e−λt) ∂ ln y∗
∂m.
Countries are assumed to be growing near their steady state so we can neglect the effectof m on the convergence rate. The impact on growth of foreign-born immigrants is
25

determined by the partial derivative of ln y∗ given by Equation (9) with respect to theforeign-born immigration rate, m:
∂gy∂m
=(
1− e−λt) ∂ ln y∗
∂m
=
(1− e−λt
) (βκM − (α+ β)
)(gA + δ + n) + α
(mκM + eκE
)(1− α− β) (gA + δ + n) (gA + δ + n− (mκM + eκE))
.
Note that (1− α− β) (gA + δ + n)(gA + δ + n−
(m κM + e κE
))≥ 0. Provided there
is not a net outflow of human capital (i.e. mκM + eκE ≥ 0), an increase in the inflowof foreign workers has a positive impact on productivity growth if κM ≥ (α+ β) /β.
The increase in the skill composition of foreign born immigrants, κM , always has apositive impact on productivity growth:
t∂gy∂κM
=∂ (ln y (t)− ln y (0))
∂κM
=(
1− e−λt) ∂ ln y∗
∂κM
=
(1− e−λt
)β m
(1− α− β) (gA + δ + n− (m κM − e κE)).
Appendix B.2 Empirical analysis
The impact on growth due to foreign-born migrants given in Table 3 is evaluated fromthe estimation of the econometric model, given by equation (15):
ln yi,t = β1 + β2 ln yi,t−1 + β3 ln sKi,t + β4 ln sHi,t
+β5 ln (δ + gA + ni,t) + β6mi,tκ
Mi,t
δ + gA + ni,t+ β7
ei,tκEi,t
δ + gA + ni,t,
where ni,t = ni,t +mi,t + ei,t.
The effect of increasing net migration of the foreign-born by 1 percentage-point is
approximated, for each country, by∂gy∂m :
t∂gy∂m
= β5∂ ln (δ + gA + n)
∂m+ β6
∂(mκM/δ + gA + n
)∂m
+ β7∂(eκE/δ + gA + n
)∂m
=
(β5 + β6κ
M)
(δ + gA + n)− β6mκM − β7eκE
(δ + gA + n)2. (B.1)
We use the estimated coefficients provided in Table (3) and apply the time-averagedmeasures for each country. Note that we consider four year time intervals so t = 4.The growth impact of the immigrants’ skill composition, κM , can be assessed by:
t∂gy∂κM
= β6m
δ + gA + n. (B.2)
We use estimated coefficients (3) and time-averaged measures for each country.
26

Appendix C Data
Appendix C.1 Estimation of net migration by country of birth
This section presents the methodology used to estimate net migration by country ofbirth. The data mainly come from national population censuses held between 1980 and2006, population registers, and the European Labour Force Survey. Table C.1 summa-rizes data sources for each country. Data on deaths, births, and net migration are fromthe OECD database. Deaths by age group come from the World Health OrganisationMortality Database (WHO).
According to the basic demographic equation, the native-born population (NBP )19
at any point in time is equal to the native population at the previous point in time plusthe net migration of the native-born (NBM) and the natural increase in the population(number of births, B, in the country minus deaths of the native-born, NBD):
NBPt+1 = NBPt +Bt−t+1 −NBDt−t+1 +NBMt−t+1.
Note that all births are by definition native, but deaths also include the foreign-born.In order to calculate the deaths of the native-born, we use the share of native-born inthe total population, corrected their age structure and mortality rates by age.
Native-born net migration is then given by:
NBMt−t+1 = NBPt+1 −NBPt − (Bt−t+1 −NBDt−t+1) .
Foreign-born net migration is given by the difference between total net migration andthe net migration of the native-born as estimated above. When census data are used,the statistical adjustment was added to net migration of the foreign-born, except forFrance between 1990 and 1999 (to the native-born) and Italy (not included). Note thatthe majority of immigrants are of working age. We assume that 80% of the estimatednet migration as working age immigrants for the foreign- and native-born.
19In order to evaluate the stock of the native-born between census dates, we use an interpolationtechnique. This methodology is used by the United Nation Population Division to estimate the migrantstock in the Global Migration Database United Nations (2009).
27
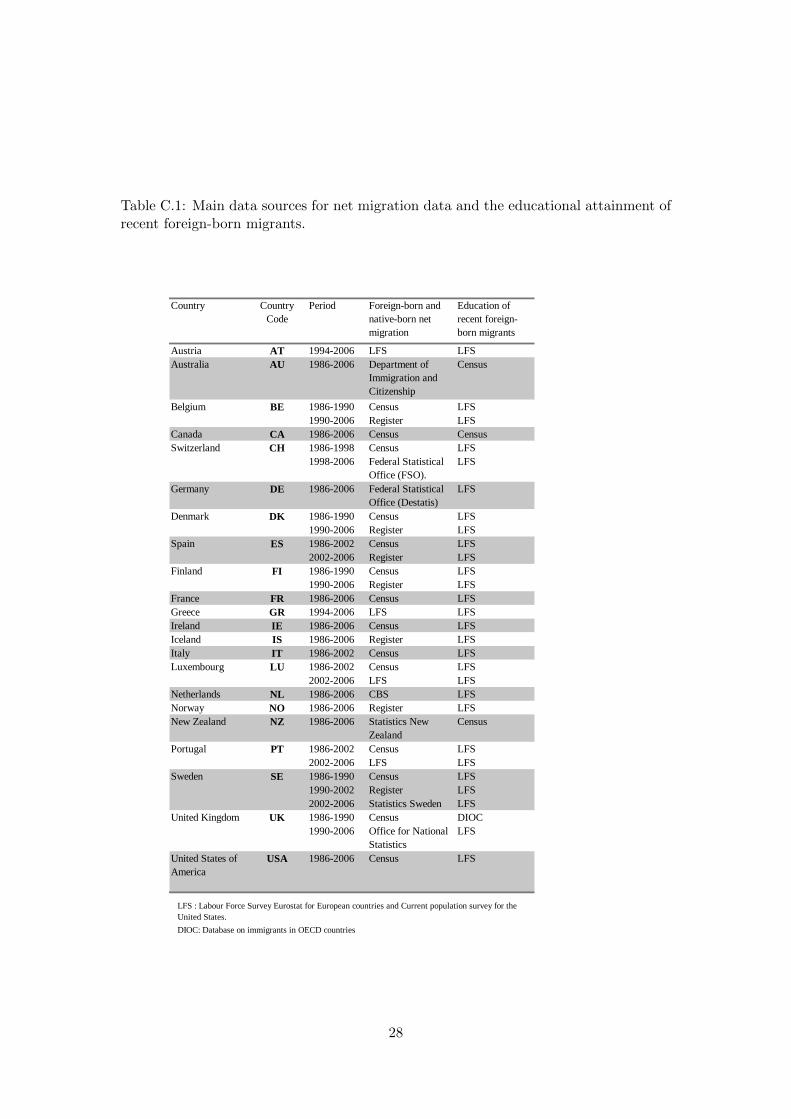
Table C.1: Main data sources for net migration data and the educational attainment ofrecent foreign-born migrants.
Austria AT 1994-2006 LFS LFSAustralia AU 1986-2006 Department of
Immigration and Citizenship
Census
Belgium 1986-1990 Census LFS1990-2006 Register LFS
Canada CA 1986-2006 Census CensusSwitzerland 1986-1998 Census LFS
1998-2006 Federal Statistical Office (FSO).
LFS
Germany DE 1986-2006 Federal Statistical Office (Destatis)
LFS
Denmark 1986-1990 Census LFS1990-2006 Register LFS
Spain 1986-2002 Census LFS2002-2006 Register LFS
Finland 1986-1990 Census LFS1990-2006 Register LFS
France FR 1986-2006 Census LFSGreece GR 1994-2006 LFS LFSIreland IE 1986-2006 Census LFSIceland IS 1986-2006 Register LFSItaly IT 1986-2002 Census LFSLuxembourg 1986-2002 Census LFS
2002-2006 LFS LFSNetherlands NL 1986-2006 CBS LFSNorway NO 1986-2006 Register LFSNew Zealand NZ 1986-2006 Statistics New
Zealand Census
Portugal 1986-2002 Census LFS2002-2006 LFS LFS
Sweden 1986-1990 Census LFS1990-2002 Register LFS2002-2006 Statistics Sweden LFS
United Kingdom 1986-1990 Census DIOC1990-2006 Office for National
StatisticsLFS
DIOC: Database on immigrants in OECD countries
SE
BE
LFS : Labour Force Survey Eurostat for European countries and Current population survey for the United States.
CH
DK
ES
FI
LU
PT
UK
United States of America
USA 1986-2006 Census LFS
Country Period Foreign-born and native-born net migration
Education of recent foreign-born migrants
Country Code
28
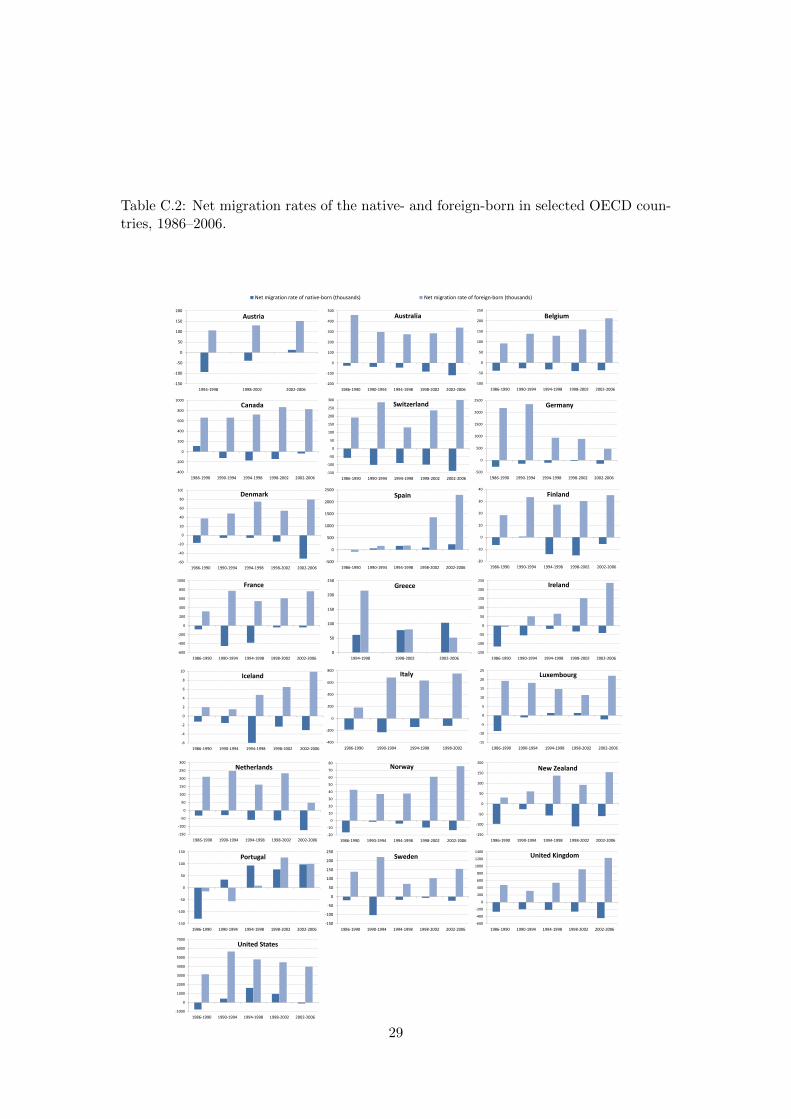
Table C.2: Net migration rates of the native- and foreign-born in selected OECD coun-tries, 1986–2006.
-150
-100
-50
0
50
100
150
200
1994-1998 1998-2002 2002-2006
Austria
-200
-100
0
100
200
300
400
500
1986-1990 1990-1994 1994-1998 1998-2002 2002-2006
Australia
-100
-50
0
50
100
150
200
250
1986-1990 1990-1994 1994-1998 1998-2002 2002-2006
Belgium
-400
-200
0
200
400
600
800
1000
1986-1990 1990-1994 1994-1998 1998-2002 2002-2006
Canada
-150
-100
-50
0
50
100
150
200
250
300
1986-1990 1990-1994 1994-1998 1998-2002 2002-2006
Switzerland
-500
0
500
1000
1500
2000
2500
1986-1990 1990-1994 1994-1998 1998-2002 2002-2006
Germany
-60
-40
-20
0
20
40
60
80
100
1986-1990 1990-1994 1994-1998 1998-2002 2002-2006
Denmark
-500
0
500
1000
1500
2000
2500
1986-1990 1990-1994 1994-1998 1998-2002 2002-2006
Spain
-20
-10
0
10
20
30
40
1986-1990 1990-1994 1994-1998 1998-2002 2002-2006
Finland
-600
-400
-200
0
200
400
600
800
1000
1986-1990 1990-1994 1994-1998 1998-2002 2002-2006
France
0
50
100
150
200
250
1994-1998 1998-2002 2002-2006
Greece
-150
-100
-50
0
50
100
150
200
250
1986-1990 1990-1994 1994-1998 1998-2002 2002-2006
Ireland
-6
-4
-2
0
2
4
6
8
10
1986-1990 1990-1994 1994-1998 1998-2002 2002-2006
Iceland
-400
-200
0
200
400
600
800
1986-1990 1990-1994 1994-1998 1998-2002
Italy
-15
-10
-5
0
5
10
15
20
25
1986-1990 1990-1994 1994-1998 1998-2002 2002-2006
Luxembourg
-150
-100
-50
0
50
100
150
200
250
300
1986-1990 1990-1994 1994-1998 1998-2002 2002-2006
Netherlands
-20
-10
0
10
20
30
40
50
60
70
80
1986-1990 1990-1994 1994-1998 1998-2002 2002-2006
Norway
-150
-100
-50
0
50
100
150
200
1986-1990 1990-1994 1994-1998 1998-2002 2002-2006
New Zealand
-150
-100
-50
0
50
100
150
1986-1990 1990-1994 1994-1998 1998-2002 2002-2006
Portugal
-150
-100
-50
0
50
100
150
200
250
1986-1990 1990-1994 1994-1998 1998-2002 2002-2006
Sweden
-600
-400
-200
0
200
400
600
800
1000
1200
1400
1986-1990 1990-1994 1994-1998 1998-2002 2002-2006
United Kingdom
-1000
0
1000
2000
3000
4000
5000
6000
7000
1986-1990 1990-1994 1994-1998 1998-2002 2002-2006
United States
0
2
Net migration rate of native-born (thousands) Net migration rate of foreign-born (thousands)
29

Table C.3: Share of native-born emigrants and recent foreign-born migrants that hascompleted tertiary education in selected OECD countries, 1986–2006.
0
0.1
0.2
0.3
0.4
0.5
0.6
1994-1998 1998-2002 2002-2006
Austria
0
0.1
0.2
0.3
0.4
0.5
0.6
0.7
1986-1990 1990-1994 1994-1998 1998-2002 2002-2006
Australia
0
0.1
0.2
0.3
0.4
0.5
0.6
1986-1990 1990-1994 1994-1998 1998-2002 2002-2006
Belgium
0
0.1
0.2
0.3
0.4
0.5
0.6
0.7
1986-1990 1990-1994 1994-1998 1998-2002 2002-2006
Canada
0
0.05
0.1
0.15
0.2
0.25
0.3
0.35
0.4
0.45
0.5
1986-1990 1990-1994 1994-1998 1998-2002 2002-2006
Switzerland
0
0.1
0.2
0.3
0.4
0.5
0.6
1986-1990 1990-1994 1994-1998 1998-2002 2002-2006
Germany
0
0.1
0.2
0.3
0.4
0.5
0.6
1986-1990 1990-1994 1994-1998 1998-2002 2002-2006
Denmark
0
0.1
0.2
0.3
0.4
0.5
0.6
0.7
1986-1990 1990-1994 1994-1998 1998-2002 2002-2006
Spain
0
0.1
0.2
0.3
0.4
0.5
0.6
1986-1990 1990-1994 1994-1998 1998-2002 2002-2006
Finland
0
0.1
0.2
0.3
0.4
0.5
0.6
0.7
0.8
1986-1990 1990-1994 1994-1998 1998-2002 2002-2006
France
0
0.1
0.2
0.3
0.4
0.5
0.6
1994-1998 1998-2002 2002-2006
Greece
0
0.1
0.2
0.3
0.4
0.5
0.6
1986-1990 1990-1994 1994-1998 1998-2002 2002-2006
Ireland
0
0.1
0.2
0.3
0.4
0.5
0.6
1986-1990 1990-1994 1994-1998 1998-2002 2002-2006
Iceland
0
0.05
0.1
0.15
0.2
0.25
0.3
0.35
0.4
0.45
1986-1990 1990-1994 1994-1998 1998-2002
Italy
0
0.05
0.1
0.15
0.2
0.25
0.3
0.35
0.4
0.45
0.5
1986-1990 1990-1994 1994-1998 1998-2002 2002-2006
Luxembourg
0
0.1
0.2
0.3
0.4
0.5
0.6
1986-1990 1990-1994 1994-1998 1998-2002 2002-2006
Netherlands
0
0.1
0.2
0.3
0.4
0.5
0.6
1986-1990 1990-1994 1994-1998 1998-2002 2002-2006
Norway
0
0.05
0.1
0.15
0.2
0.25
0.3
0.35
0.4
0.45
1986-1990 1990-1994 1994-1998 1998-2002 2002-2006
New Zealand
0
0.05
0.1
0.15
0.2
0.25
0.3
1986-1990 1990-1994 1994-1998 1998-2002 2002-2006
Portugal
0
0.05
0.1
0.15
0.2
0.25
0.3
0.35
0.4
0.45
0.5
1986-1990 1990-1994 1994-1998 1998-2002 2002-2006
Sweden
0
0.1
0.2
0.3
0.4
0.5
0.6
1986-1990 1990-1994 1994-1998 1998-2002 2002-2006
United Kingdom
0
0.1
0.2
0.3
0.4
0.5
0.6
0.7
1986-1990 1990-1994 1994-1998 1998-2002 2002-2006
United States
0
2share of tertiary educated among native born emigrants to other OECD countries (percentage) share of teriary educated among immigrants (percentage)
30

Table C.4: Share of recent foreign-born migrants and host country resident populationthat has completed tertiary education in selected OECD countries, 1986–2006.
0
0.05
0.1
0.15
0.2
0.25
1994-1998 1998-2002 2002-2006
Austria
0
0.1
0.2
0.3
0.4
0.5
0.6
1986-1990 1990-1994 1994-1998 1998-2002 2002-2006
Australia
0
0.05
0.1
0.15
0.2
0.25
0.3
0.35
0.4
1986-1990 1990-1994 1994-1998 1998-2002 2002-2006
Belgium
0
0.1
0.2
0.3
0.4
0.5
0.6
0.7
1986-1990 1990-1994 1994-1998 1998-2002 2002-2006
Canada
0
0.05
0.1
0.15
0.2
0.25
0.3
0.35
0.4
0.45
0.5
1986-1990 1990-1994 1994-1998 1998-2002 2002-2006
Switzerland
0
0.05
0.1
0.15
0.2
0.25
0.3
1986-1990 1990-1994 1994-1998 1998-2002 2002-2006
Germany
0
0.05
0.1
0.15
0.2
0.25
0.3
0.35
0.4
0.45
0.5
1986-1990 1990-1994 1994-1998 1998-2002 2002-2006
Denmark
0
0.05
0.1
0.15
0.2
0.25
0.3
1986-1990 1990-1994 1994-1998 1998-2002 2002-2006
Spain
0
0.05
0.1
0.15
0.2
0.25
0.3
0.35
1986-1990 1990-1994 1994-1998 1998-2002 2002-2006
Finland
0
0.05
0.1
0.15
0.2
0.25
0.3
0.35
1986-1990 1990-1994 1994-1998 1998-2002 2002-2006
France
0
0.02
0.04
0.06
0.08
0.1
0.12
0.14
0.16
1994-1998 1998-2002 2002-2006
Greece
0
0.1
0.2
0.3
0.4
0.5
0.6
1986-1990 1990-1994 1994-1998 1998-2002 2002-2006
Ireland
0
0.1
0.2
0.3
0.4
0.5
0.6
1986-1990 1990-1994 1994-1998 1998-2002 2002-2006
Iceland
0
0.02
0.04
0.06
0.08
0.1
0.12
0.14
0.16
1986-1990 1990-1994 1994-1998 1998-2002
Italy
0
0.05
0.1
0.15
0.2
0.25
0.3
0.35
0.4
0.45
0.5
1986-1990 1990-1994 1994-1998 1998-2002 2002-2006
Luxembourg
0
0.05
0.1
0.15
0.2
0.25
0.3
0.35
1986-1990 1990-1994 1994-1998 1998-2002 2002-2006
Netherlands
0
0.05
0.1
0.15
0.2
0.25
0.3
0.35
0.4
0.45
1986-1990 1990-1994 1994-1998 1998-2002 2002-2006
Norway
0
0.05
0.1
0.15
0.2
0.25
0.3
0.35
0.4
0.45
1986-1990 1990-1994 1994-1998 1998-2002 2002-2006
New Zealand
0
0.05
0.1
0.15
0.2
0.25
0.3
1986-1990 1990-1994 1994-1998 1998-2002 2002-2006
Portugal
0
0.05
0.1
0.15
0.2
0.25
0.3
0.35
0.4
0.45
0.5
1986-1990 1990-1994 1994-1998 1998-2002 2002-2006
Sweden
0
0.05
0.1
0.15
0.2
0.25
0.3
0.35
0.4
0.45
1986-1990 1990-1994 1994-1998 1998-2002 2002-2006
United Kingdom
0
0.05
0.1
0.15
0.2
0.25
0.3
0.35
1986-1990 1990-1994 1994-1998 1998-2002 2002-2006
United States
0
2
share of tertiary educated among foreign born immigrants (percentage) share of teriary educated among resident population (percentage)
31
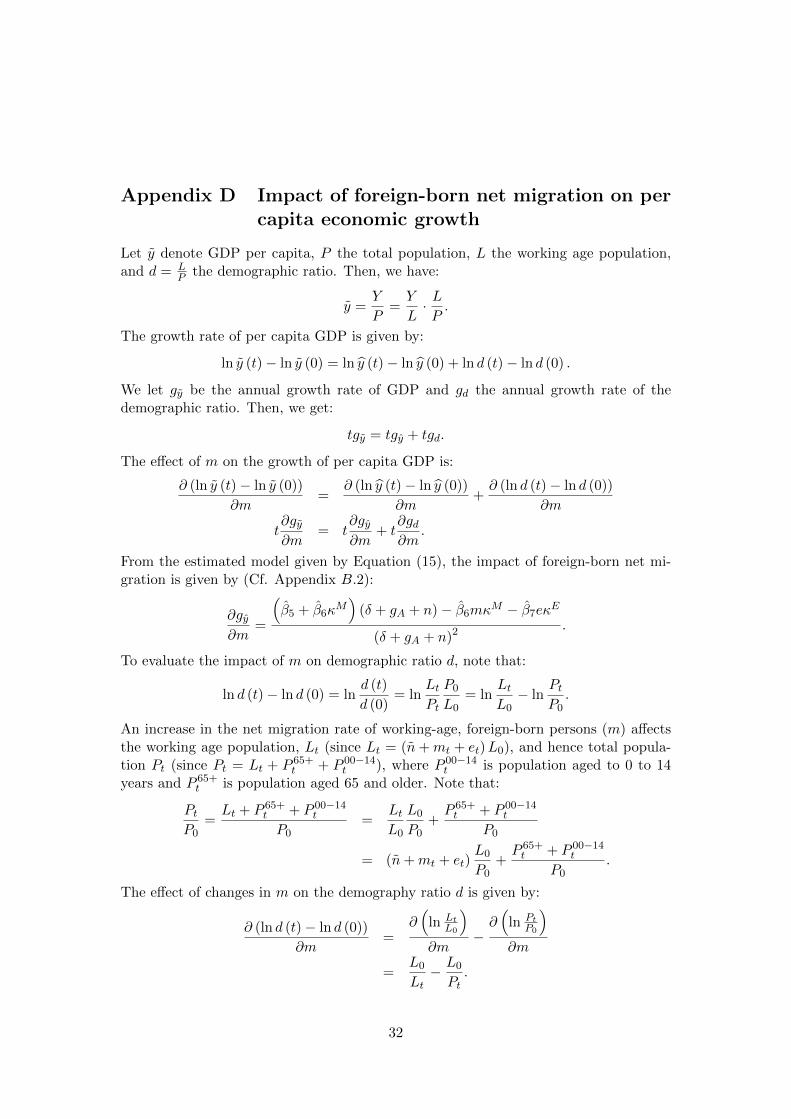
Appendix D Impact of foreign-born net migration on percapita economic growth
Let y denote GDP per capita, P the total population, L the working age population,and d = L
P the demographic ratio. Then, we have:
y =Y
P=Y
L· LP.
The growth rate of per capita GDP is given by:
ln y (t)− ln y (0) = ln y (t)− ln y (0) + ln d (t)− ln d (0) .
We let gy be the annual growth rate of GDP and gd the annual growth rate of thedemographic ratio. Then, we get:
tgy = tgy + tgd.
The effect of m on the growth of per capita GDP is:
∂ (ln y (t)− ln y (0))
∂m=
∂ (ln y (t)− ln y (0))
∂m+∂ (ln d (t)− ln d (0))
∂m
t∂gy∂m
= t∂gy∂m
+ t∂gd∂m
.
From the estimated model given by Equation (15), the impact of foreign-born net mi-gration is given by (Cf. Appendix B.2):
∂gy∂m
=
(β5 + β6κ
M)
(δ + gA + n)− β6mκM − β7eκE
(δ + gA + n)2.
To evaluate the impact of m on demographic ratio d, note that:
ln d (t)− ln d (0) = lnd (t)
d (0)= ln
LtPt
P0
L0= ln
LtL0− ln
PtP0.
An increase in the net migration rate of working-age, foreign-born persons (m) affectsthe working age population, Lt (since Lt = (n+mt + et)L0), and hence total popula-tion Pt (since Pt = Lt + P 65+
t + P 00−14t ), where P 00−14
t is population aged to 0 to 14years and P 65+
t is population aged 65 and older. Note that:
PtP0
=Lt + P 65+
t + P 00−14t
P0=
LtL0
L0
P0+P 65+t + P 00−14
t
P0
= (n+mt + et)L0
P0+P 65+t + P 00−14
t
P0.
The effect of changes in m on the demography ratio d is given by:
∂ (ln d (t)− ln d (0))
∂m=
∂(
ln LtL0
)∂m
−∂(
ln PtP0
)∂m
=L0
Lt− L0
Pt.
32

Table D.1: Impacts of increases in net migrationImpact on productivity growth in % per year Impact on per capita growth in % per year
Country +1 % point in m 50% increase in m +1 % point in m 50% increase in mAustria 0.47 0.45 0.55 0.52Australia 0.23 0.26 0.31 0.35Belgium 0.30 0.26 0.39 0.34Canada 0.19 0.29 0.27 0.41Switzerland 0.29 0.56 0.37 0.72Germany 0.02 0.03 0.10 0.12Denmark 0.14 0.09 0.22 0.15Spain 0.14 0.16 0.22 0.25Finland 0.17 0.06 0.25 0.08France 0.37 0.23 0.46 0.29Greece -0.05 -0.03 0.03 0.02Ireland 0.60 0.96 0.68 1.10Iceland 0.56 0.62 0.64 0.71Italy 0.34 0.20 0.42 0.25Luxembourg 0.28 0.70 0.36 0.89Netherlands 0.13 0.09 0.21 0.15Norway 0.12 0.08 0.20 0.15New Zealand 0.62 0.43 0.35 0.55Portugal 0.22 0.11 0.70 0.13Sweden 0.44 0.22 0.31 0.31United Kingdom -0.04 0.32 0.52 0.38United States 0.51 -0.04 0.05 0.05
OECD 22 0.27 0.28 0.35 0.08
33