Embed Size (px)
Citation preview
Please cite this paper as:
Spielvogel, G. and M. Meghnagi (2018), “The contribution ofmigration to the dynamics of the labour force in OECDcountries: 2005-2015”, OECD Social, Employment andMigration Working Papers, No. 203, OECD Publishing, Paris.http://dx.doi.org/10.1787/a301bef8-en
OECD Social, Employment and MigrationWorking Papers No. 203
The contribution ofmigration to the dynamics ofthe labour force in OECDcountries
2005-2015
Gilles Spielvogel, Michela Meghnagi
JEL Classification: F22, J11, J61
Organisation for Economic Co-operation and Development
DELSA/ELSA/WD/SEM(2018)4
For Official Use English - Or. English
1 January 1990
DIRECTORATE FOR EMPLOYMENT, LABOUR AND SOCIAL AFFAIRS
EMPLOYMENT, LABOUR AND SOCIAL AFFAIRS COMMITTEE
The contribution of migration to the dynamics of the labour force in OECD
countries: 2005-2015
JEL Classification:
F22, J11, J61
Keywords:
Migration, Working-age population, Labour force, Education, Occupations
Authorised for publication by Stefano Scarpetta, Director, Directorate for Employment, Labour
and Social Affairs
Gilles Spielvogel [email protected]
Michela Meghnagi [email protected]
www.oecd.org/els/workingpapers
This document, as well as any data and map included herein, are without prejudice to the status of or sovereignty over any territory, to the
delimitation of international frontiers and boundaries and to the name of any territory, city or area.
2 │ DELSA/ELSA/WD/SEM(2018)4
For Official Use
OECD Social, Employment and Migration Working Papers
www.oecd.org/els/workingpapers
OECD Working Papers should not be reported as representing the official views of the
OECD or of its member countries. The opinions expressed and arguments employed are those
of the author(s).
Working Papers describe preliminary results or research in progress by the author(s) and are
published to stimulate discussion on a broad range of issues on which the OECD works.
Comments on Working Papers are welcomed, and may be sent to [email protected].
This series is designed to make available to a wider readership selected labour market, social
policy and migration studies prepared for use within the OECD. Authorship is usually
collective, but principal writers are named. The papers are generally available only in their
original language – English or French – with a summary in the other.
This document and any map included herein are without prejudice to the status of or
sovereignty over any territory, to the delimitation of international frontiers and boundaries
and to the name of any territory, city or area.
© OECD 2018
You can copy, download or print OECD content for your own use, and you can include excerpts from OECD
publications, databases and multimedia products in your own documents, presentations, blogs, websites and
teaching materials, provided that suitable acknowledgment of OECD as source and copyright owner is given.
All requests for commercial use and translation rights should be submitted to [email protected].
DELSA/ELSA/WD/SEM(2018)4 │ 3
For Official Use
Acknowledgements
This paper has been drafted by Michela Meghnagi and Gilles Spielvogel. This paper should
not be reported as representing the official views of the OECD or of its member countries.
The opinions expressed and arguments employed are those of the authors. The opinions
expressed and arguments employed herein do not necessarily reflect the official views of the
OECD member countries or of the European Union. This document and any map included
herein are without prejudice to the status of or sovereignty over any territory, to the
delimitation of international frontiers and boundaries and to the name of any territory, city or
area.
This document was produced with the financial assistance of the European Union Programme
for Employment and Social Innovation “EaSI” (2014-2020).
4 │ DELSA/ELSA/WD/SEM(2018)4
For Official Use
Abstract
This paper presents the methodology as well as the results of the joint OECD-EC project
Migration-Demography Database: A monitoring system of the demographic impact of
migration and mobility. The objective of the project is to evaluate the contribution of
migration to past and future labour market dynamics across OECD countries. After assessing
the role of migration over the last five to 10 years in shaping the occupational and educational
composition of the labour force, this project looks at the potential contribution of migration to
the labour force in a range of alternative scenarios. This paper presents the results from the
first part of the project: it focuses on the changes that have taken place in the last 10 years and
studies how migration flows have contributed to the dynamics of the labour force, in
particular in comparison to other labour market entries. It also analyses the contribution of
migration in specific skills categories and in specific occupations.
DELSA/ELSA/WD/SEM(2018)4 │ 5
For Official Use
Résumé
Ce papier présente la méthodologie ainsi que les résultats du projet commun OCDE-
Commission européenne Migration-Demography Database: Un système de suivi de l'impact
démographique de la migration et de la mobilité. L'objectif de ce projet est d'évaluer la
contribution de la migration aux dynamiques passées et futures du marché du travail dans les
pays de l'UE et de l'OCDE. Après avoir évalué le rôle de la migration au cours des cinq à dix
dernières années dans l’évolution de la structure professionnelle et éducative de la population
active, ce projet examine la contribution potentielle de la migration à la population active
dans divers scénarios alternatifs. Cet article présente les résultats de la première partie du
projet: il se concentre sur les changements qui ont eu lieu au cours des 10 dernières années et
étudie comment les flux migratoires ont contribué à la dynamique de la population active, en
particulier par rapport aux autres entrées sur le marché du travail. Il analyse également la
contribution de la migration dans les différentes catégories de qualification et dans des
professions spécifiques.
6 │ DELSA/ELSA/WD/SEM(2018)4
For Official Use
Table of contents
OECD Social, Employment and Migration Working Papers ....................................................................... 2
Acknowledgements ........................................................................................................................................... 3
Abstract ............................................................................................................................................................. 4
Résumé .............................................................................................................................................................. 5
The contribution of migration to the dynamics of the labour force in OECD countries: 2005-2015 ....... 8
Introduction ..................................................................................................................................................... 8 Labour market trends .................................................................................................................................... 11 The demography of education ...................................................................................................................... 14 The evolution of occupations ........................................................................................................................ 20 Conclusion .................................................................................................................................................... 29 References ..................................................................................................................................................... 31 Appendix 1: Methodology ............................................................................................................................ 33 Appendix 2: Tables ....................................................................................................................................... 42
Tables
Table 1. Total growth of the labour force from 2005 to 2015, and contributions to labour force growth by
demographic group (in % of the 2005 labour force) ................................................................................ 14 Table 2. Total growth of the labour force with higher education from 2005 to 2015, and contributions by
demographic group (in % of the 2005 labour force) ................................................................................ 16 Table 3. Average annual growth of employment by occupation and ratio of employment shares of different
groups compared to the total labour force, European countries, 2011-2015 ............................................ 24 Table 4. Average annual growth of employment by occupation and ratio of employment shares of different
groups compared to the total labour force, United States, 2010-2015 ..................................................... 28
Figures
Figure 1. Educational attainment of recent EU and non-EU immigrants and the total labour force, selected
European countries, 2015 ......................................................................................................................... 17 Figure 2. Total growth of the labour force from 2005 to 2015 by education level (%) and contribution of the
different demographic groups (thousands) in selected EU countries ....................................................... 18 Figure 3. Total growth of the labour force from 2005 to 2015 by education level (%) and contribution of the
different demographic groups (thousands) in Australia and the United States ........................................ 19 Figure 4. Demographic components of net occupational change across quintiles of growth, EU-27 countries,
2011-2015 ................................................................................................................................................. 21 Figure 5. Demographic components of net occupational change across quintiles of growth, United States,
2010-2015 ................................................................................................................................................. 22
DELSA/ELSA/WD/SEM(2018)4 │ 7
For Official Use
Figure 6. Share of employment by skills level of the occupation for recent immigrants, young entrants and
the labour force, EU-27, 2015 .................................................................................................................. 23 Figure 7. Contribution of recent immigrants and young entrants to net employment change by occupation
(%), European countries, 2011-2015 ........................................................................................................ 25 Figure 8. Total growth of the labour force by skill level of the occupations (%), and contribution of the
different demographic groups (thousands) in selected EU countries ....................................................... 26 Figure 9. Contribution of recent immigrants and young entrants to labour force growth by occupation (%),
United States, 2010-2015 ......................................................................................................................... 29
8 │ DELSA/ELSA/WD/SEM(2018)4
For Official Use
The contribution of migration to the dynamics of the labour force in OECD
countries: 2005-2015
Introduction
EU countries are currently undergoing major demographic changes, as is also the case for
most non-European OECD countries. Because of its numerous social and economic
implications, population ageing is one the most significant long-term challenges for many
European and non-European OECD countries (European Commission, 2015[1]; OECD,
2006[2]; United Nations, 2015[3]). The median age of the population of the EU has increased
from 34 in 1985 to almost 43 in 2015, with differences existing across member countries. A
number of non-European OECD countries are also affected by this trend. For example, Japan
has experienced very rapid ageing, with a median age that increased from 35 in 1985 to
almost 47 in 2015. Although somewhat younger than the European population, Northern
American countries are also getting older: in 2015, the median age was 38 in the United
States and 41 in Canada, up from 31 in both countries in 1985. A similar trend is observed in
Australia and New Zealand.
Countries which have started their demographic transition later remain significantly younger,
but are also ageing and will reach the same situation as Europe in the coming decades. This is
for example the case of Mexico, which had a median age of 27 in 2015, or Turkey, with a
median age of 30 in 2015.
Population ageing in OECD countries is mostly driven by fertility decline and increasing
longevity. In most cases, the latter component is predominant. For EU countries as a whole,
the population aged 65 and over has increased by about 60% between 1985 and 2015, while
the population aged 0-4 has decreased by 15%. In addition, some EU countries have not
experienced any significant fertility decline in the recent decades, while the increase of
longevity is observed everywhere. In the United States, Canada, Australia and New Zealand,
fertility remains quite dynamic, but the 65+ population is increasing more and more rapidly.
Among OECD countries, Japan and Korea have experienced especially radical change in
their demographic structure: between 1985 and 2015, the population aged 0-4 has declined by
30% in Japan and 40% in Korea, while the 65+ population has increased, respectively, by
170% and 280%. Although the ageing process might start to slow down in the “oldest”
countries, it is expected that these trends will continue in the coming decades.
These demographic transformations stem from both economic and social progress. Better
than ever, populations in OECD countries are protected against a wide range of deadly
diseases and are able to enjoy longer and healthier lives. Individuals are also better able to
choose how many children they will have, and when to have them. However, these changes
also generate new economic and social challenges that have been extensively documented
(Bloom, Canning and Fink, 2010[4]; Harper, 2014[5]).
A direct implication of the change in the age structure of the population is the increase in
public expenditures on pensions, social security and health care, including services dedicated
DELSA/ELSA/WD/SEM(2018)4 │ 9
For Official Use
to the elderly population (Colombo et al., 2011[6]). This means that fewer resources are
available for other social protection needs. In addition, rising dependency ratios imply that
repartition pension systems are under increasing stress, which has led several OECD and EU
countries to put in place new pension reforms such as increasing retirement age or mandatory
contributions, reducing pensions, or implementing a combination of those options (OECD,
2016[7]). Due to the changes in the distribution of economic and political resources between
generations, intergenerational conflicts are also likely to be more prevalent (Busemeyer,
Goerres and Weschle, 2009[8]; European Commission, 2015[1]; European Commission,
2015[9]; European Commission, 2017[10]).
In addition to these fiscal and intergenerational implications, ageing population has an impact
on the size of the working age population (in relative and absolute terms) and consequently
on the functioning of the labour market (Borsch-Supan, 2003[11]; European Commission,
2017[10]). In particular, labour shortages may emerge in specific regions, sectors or
occupations, at different skill levels. The risk of shortages is especially acute in occupations
where labour demand is bound to increase because of ageing itself, such as healthcare or
domestic services, or as a consequence of ongoing technological changes.
This structural evolution of the labour market is currently combined with two major, more
temporary, phenomena. First, a number of EU and OECD countries still suffer from relatively
low employment rates in the wake of the Great Recession and the austerity policies that have
been implemented to cope with rising public debts (OECD, 2016[12]; European Commission,
2016[13]). Second, large cohorts of baby-boomers are exiting the labour force, which may
generate tensions in some segments of the labour market. Both issues tend to obscure the
long-term outlook of the labour market in EU and OECD countries, and make the policy
discussion about potential solutions more polarised.
Another key contextual element that is particularly relevant for current and future evolutions
is the rising participation of women to the labour market, which shows an increase of around
3 and 4 percentage points in the OECD area and the EU27 respectively between 2005 and
2015. Women are now also more likely to enter both fast growing and highly-skilled
occupations than men (OECD/EU, 2014[14]), positively contributing to the overall upskilling
of the labour force.
Moreover, in the last decade, many OECD countries have experienced an increase in
migration inflows, sometimes associated with outward mobility of natives. Compared to
births and deaths, migration is still a relatively small demographic component in absolute
terms, but it may become pivotal as countries experience near-zero rates of natural increase.
With respect to increasing mobility, EU countries deserve special attention, due to the
migration opportunities opened by the freedom of movement of workers in the area. In 2015,
around 11.4 million of citizens aged 20-64 from the EU28 and the EFTA countries resided in
a country different from their country of birth. This figure represents an increase of 5.3%
compared to 2014 (European Commission, 2017[15]).
In this context, the potential contribution of international migration to the mitigation of the
economic challenges raised by ageing has been widely discussed (United Nations, 2000[16];
Coleman, 2008[17]; European Commission, 2016[18]). Migration has sometimes been
advocated as a “solution” to those problems. Since migrants from less developed countries
are on average younger than the population in OECD destination countries, they can help
offset issues related to population ageing. In addition, upon arrival, migrants may also tend to
have higher fertility norms than host populations, which can slow down the fertility decline.
These effects are real, but they are only temporary. The overarching consensus is that
international migration cannot offset the negative effects of population and labour force
10 │ DELSA/ELSA/WD/SEM(2018)4
For Official Use
ageing in the long-term. Migrants themselves get old, and additional migration inflows can
only have a temporary effect on the age structure. The impact on fertility is also transitory,
since migrants progressively change their fertility behaviours as they integrate into more
affluent host societies.
The role of migration can be assessed by looking at the population projections elaborated by
the Population Division of the United Nations. Data shows that the working-age population
(15-64) of EU countries is expected to decrease by 15% between 2015 and 2050 under the
medium-variant scenario, which assumes that net migration towards EU countries is on
average 750 thousands per year. In the scenario with zero net migration, a 23% decline of the
working-age population is projected. This implies that merely stabilising the size of the
working-age population of EU countries until 2050 would require more than doubling net
migration compared to its current level; this is not only unrealistic, but would provide only a
temporary slow-down in the ageing of the population.
Although the long-term demographic impact of immigration towards OECD countries is now
well understood to be limited, its impact on the dynamics of the labour market is more
complex and varies across countries. In addition to age structure, there are indeed key
differences between natives and immigrants, as well as between different groups of foreign-
born, which have implications on labour market structure and composition.
The skill structure of the working-age native and migrant populations is the first important
dimension to consider, especially in the context of exit of the post-war cohorts from the
labour force. Although these retiring workers are much better educated than the previous
generations, the cohorts coming after them in most OECD and EU countries have reached, on
average, even higher levels of education. However, since the new entrants belong to smaller
cohorts, there might be a potential need for skills at both ends of the educational distribution.
This trend is reinforced by current changes in labour demand, which is particularly dynamic
for both low-skilled and high-skilled workers in the services sector (Autor and Dorn, 2013[19];
Goos, Manning and Salomons, 2009[20]), a situation which is likely to continue (Cedefop,
2016[21]).
Migrants towards OECD countries come from a broad range of countries and have diverse
backgrounds in terms of formal and professional qualifications. There is, however, a bimodal
pattern in the education distribution of immigrants in a number of EU and OECD countries:
migrants are often overrepresented among both the low and the highly educated (Arslan et al.,
2015[22]). This can be partly explained by the mix of motives for which migrants come to live
and work in their respective host countries: some come for family or humanitarian reasons,
which rarely involve education-related selection, while others come to study or to work, in
which case they are more likely to be – or become – highly-educated.
Beyond skills, the second important differentiating factor to consider when looking at the
potential implications of immigration on the dynamics of the labour market is participation.
On the one hand, labour market participation of some categories of migrants, especially low-
educated women, tends to be below average, sometimes because of insufficient language
proficiency. On the other hand, highly-educated labour migrants typically have participation
and employment rates than can be higher than those of natives. In the EU context, there is
often a contrast in terms of participation between migrants from other EU countries and
migrants from third countries: the former generally have participation rates that are as high as
natives, or even higher, while the latter may have less favourable labour market outcomes
(European Commission, 2016[18]; OECD/EU, 2015[23]).
DELSA/ELSA/WD/SEM(2018)4 │ 11
For Official Use
In order to better understand the role of migration in the current and future labour market
dynamics it is fundamental to take into consideration country-specific differences in the
education structure and participation rates, between immigrants and natives, as well as
between different groups of foreign-born. This last point is particularly crucial for EU
countries, not only because of the similarity between natives and migrants from other EU
countries, but also because the latter benefit from freedom of movement within the EU,
which is not the case for third country nationals.
Building on the work carried out jointly by the OECD and the European Commission in the
framework of the project on “Matching economic migration with labour market needs”
(OECD/EU, 2014[14]), the objective of this OECD-EC project on “Migration-Demography
Database: A monitoring system of the demographic impact of migration and mobility” is to
create a database that will update, expand and streamline the analysis of the demographic
impact of immigration on the size and composition of the labour force. This project includes
both a retrospective analysis over the last 10 years, and projections over the next 15 years.
This paper focuses on the changes that have taken place in the last 10 years and aims at
answering the following questions: To what extent have migration flows contributed to the
dynamics of the labour market, in particular in comparison to other labour market entries?
Has this contribution of migration been concentrated in specific skills categories, or in
specific occupations? The analysis complemented with a detailed presentation of the
methodology used to produce the backward analysis and the projections (Annex 1).
This analysis examines changes in the labour force in the last decade by looking at the
contribution of four different demographic groups: (i) young entrants (i.e. people who have
finished their studies in the last 10 years and have entered the labour force1, (ii) recent retirees
(i.e. people who have left the labour force in the last 10 years to retire), (iii) recent
immigrants (i.e. foreign-born who have been living in the country for less than 10 years), and
(iv) ‘prime-age’ individuals, who account for all other changes occurring in the work force
(hence including also emigrants and long-standing immigrants). This decomposition is used
to explore how each of these groups has impacted the evolution of the labour market in terms
of both occupations and education. This analysis covers 25 EU countries2, three EFTA
countries (Iceland, Norway and Switzerland), Australia and the United States.
Labour market trends
The progressive enlargement of the EU over the past 15 years has influenced the dynamics of
the labour force3for both receiving and sending countries. In 2015, across EU-27 countries,
immigrants4 represented around 13% of the labour force, an increase of more than three
percentage points compared to 2005. The distribution of migrants is uneven across countries:
the highest shares of immigrants in the labour force were registered in Luxembourg (55%),
1 This means that they either start working or searching for a job.
2 Austria, Belgium, Bulgaria, Czech Republic, Denmark, Estonia, Finland, France, Germany, Greece,
Hungary, Ireland, Italy, Latvia, Lithuania, Luxembourg, Netherlands, Poland, Portugal, Romania,
Slovak Republic, Slovenia, Spain, Sweden, United Kingdom.
3 In this paper the labour force includes people aged 15-74.
4 'Immigrants' in the context of this study include also mobile EU citizens, i.e., people moving from
one EU country to another.
12 │ DELSA/ELSA/WD/SEM(2018)4
For Official Use
Switzerland (31%), Ireland (21%), Austria (20%), Sweden (19%), Belgium and the United
Kingdom (both 17%).
In the same year, recent immigrants (i.e. those arrived in the last 10 years) represented 4% of
the overall labour force in Europe. Luxembourg had the highest share of new immigrants,
being more than a quarter of the labour force, followed by Switzerland and Ireland at 13%
and 12% respectively.
In Europe, recent flows of immigrants from the EU and from third countries are unevenly
distributed across countries. For example, in Austria, Iceland, Ireland, Luxembourg and
Switzerland, more than 60% of recent immigrants are from the rest of the European Union;
on the contrary, Greece, Latvia, Lithuania, Portugal and Slovenia have more than two thirds
of migrants coming from non-EU countries. Belgium, Bulgaria, the Czech Republic,
Denmark, and the United Kingdom have a similar proportion of new immigrants coming
from the EU and third countries,
For European countries, the overall growth of the labour force was 4.5% for the period 2005-
2015. In most of them, especially those that were more impacted by the crisis, the years
between 2005 and 2010 had seen a higher growth than the following five years. The United
States show a slightly higher growth (6.6%), while Australia has seen faster growth, at
10.5%. This last figure can be explained by two main trends that occurred in recent years: the
increase in part-time employment that has characterised the Australian labour market (OECD,
2017) and the increase in the number of women participating in the labour market (Australian
Government, 2016).
Table 1 below shows the growth of the labour force across Europe, the United States and
Australia from 2005 to 2015 as well as the contribution of each demographic group to these
changes. For European countries a distinction is made between European vs. third country
migrants. In European countries, Australia and the United States, immigration has played an
important role to maintain the growth of the labour force between 2005 and 2015. For
European countries, overall labour force growth during this period has been 4.5%, with
positive contributions of young entrants (16.8% of the 2005 labour force) and new
immigrants (4.1% of the 2005 labour force). Although the replacement surplus (i.e. the
difference between the number of young entrants and the number of recent retirees) remains
positive, changes in participation among prime-age workers (which includes, among other
movements, emigration) is negative and practically offsets the replacement surplus. As a
result, recent immigrants provide a key contribution to the growth of the labour force.
A similar pattern holds for Australia, although with a higher level of immigration (recent
migrants represent 9.5% of the 2005 labour force), and a higher growth of the labour force
(10.7%). In the case of the United States, the replacement surplus is lower than in European
countries (2.5%), but there is no loss of labour force due to prime age workers.
Compared to the results of the previous OECD/EC project looking at the 2000-2010 period,
labour force growth in European countries is significantly lower (8% in 2000-2010 vs 4.5%
in 2005-2015), while the migration component is only marginally smaller (5% in 2000-2010
vs. 4.1% in 2005-2015). The contribution of immigration to the growth of the labour force
has therefore increased in the recent period.
The age structure of each country affects the contribution of each demographic group to
overall labour force growth. As shown in Table 1, different patterns exist across countries.
For example, in countries with low shares of young people entering the labour force, like
Spain and Italy, immigration has contributed to maintaining a positive growth of the labour
force. On the contrary, in countries with low immigration, like Poland, the Slovak Republic
DELSA/ELSA/WD/SEM(2018)4 │ 13
For Official Use
or the Czech Republic, the growth of the labour force relies mostly on the contribution of
young entrants which during the period considered has still been positive5.
The replacement of the old generations leaving the labour market by young entrants is around
4% across Europe, 2% in the United States and 5% in Australia. This value is always positive
except in Czech Republic and in Spain and is close to zero in Italy. Replacement is
significantly higher in Iceland and Poland highlighting that new entrants exceeded
significantly the exit of older workers in the labour market. This result might be surprising
considering relatively old population and high levels of emigration from Poland but can be
partially explained by the fact that the participation rate of people above 50 is very low. This
means that not all recent retirees are captured in this analysis which only looks at people aged
60 to 74. Hence, those people dropping out of the labour market before aged 60 contribute
negatively to the balance of prime-age workers.
5 Strongly declining number of births will in many countries translate in young entrants' contribution to
drastically decline during the next 20 years.
14 │ DELSA/ELSA/WD/SEM(2018)4
For Official Use
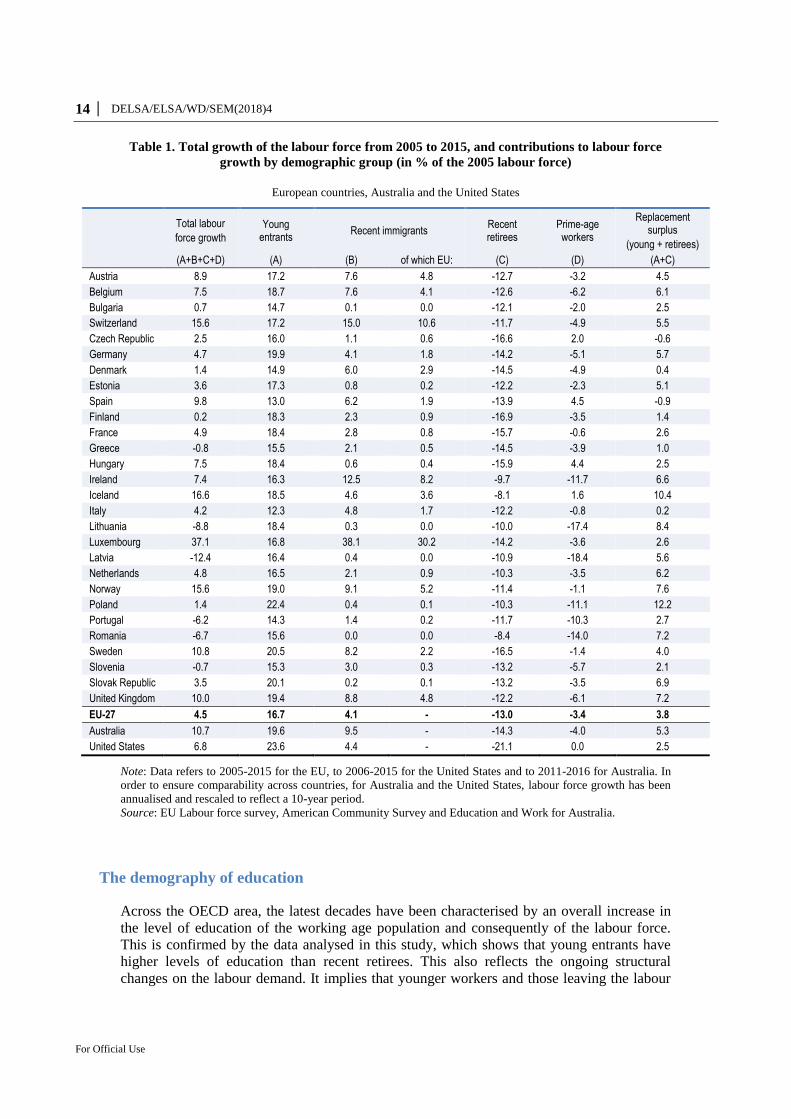
Table 1. Total growth of the labour force from 2005 to 2015, and contributions to labour force
growth by demographic group (in % of the 2005 labour force)
European countries, Australia and the United States
Total labour
force growth
Young entrants
Recent immigrants Recent retirees
Prime-age workers
Replacement surplus
(young + retirees)
(A+B+C+D) (A) (B) of which EU: (C) (D) (A+C)
Austria 8.9 17.2 7.6 4.8 -12.7 -3.2 4.5
Belgium 7.5 18.7 7.6 4.1 -12.6 -6.2 6.1
Bulgaria 0.7 14.7 0.1 0.0 -12.1 -2.0 2.5
Switzerland 15.6 17.2 15.0 10.6 -11.7 -4.9 5.5
Czech Republic 2.5 16.0 1.1 0.6 -16.6 2.0 -0.6
Germany 4.7 19.9 4.1 1.8 -14.2 -5.1 5.7
Denmark 1.4 14.9 6.0 2.9 -14.5 -4.9 0.4
Estonia 3.6 17.3 0.8 0.2 -12.2 -2.3 5.1
Spain 9.8 13.0 6.2 1.9 -13.9 4.5 -0.9
Finland 0.2 18.3 2.3 0.9 -16.9 -3.5 1.4
France 4.9 18.4 2.8 0.8 -15.7 -0.6 2.6
Greece -0.8 15.5 2.1 0.5 -14.5 -3.9 1.0
Hungary 7.5 18.4 0.6 0.4 -15.9 4.4 2.5
Ireland 7.4 16.3 12.5 8.2 -9.7 -11.7 6.6
Iceland 16.6 18.5 4.6 3.6 -8.1 1.6 10.4
Italy 4.2 12.3 4.8 1.7 -12.2 -0.8 0.2
Lithuania -8.8 18.4 0.3 0.0 -10.0 -17.4 8.4
Luxembourg 37.1 16.8 38.1 30.2 -14.2 -3.6 2.6
Latvia -12.4 16.4 0.4 0.0 -10.9 -18.4 5.6
Netherlands 4.8 16.5 2.1 0.9 -10.3 -3.5 6.2
Norway 15.6 19.0 9.1 5.2 -11.4 -1.1 7.6
Poland 1.4 22.4 0.4 0.1 -10.3 -11.1 12.2
Portugal -6.2 14.3 1.4 0.2 -11.7 -10.3 2.7
Romania -6.7 15.6 0.0 0.0 -8.4 -14.0 7.2
Sweden 10.8 20.5 8.2 2.2 -16.5 -1.4 4.0
Slovenia -0.7 15.3 3.0 0.3 -13.2 -5.7 2.1
Slovak Republic 3.5 20.1 0.2 0.1 -13.2 -3.5 6.9
United Kingdom 10.0 19.4 8.8 4.8 -12.2 -6.1 7.2
EU-27 4.5 16.7 4.1 - -13.0 -3.4 3.8
Australia 10.7 19.6 9.5 - -14.3 -4.0 5.3
United States 6.8 23.6 4.4 - -21.1 0.0 2.5
Note: Data refers to 2005-2015 for the EU, to 2006-2015 for the United States and to 2011-2016 for Australia. In
order to ensure comparability across countries, for Australia and the United States, labour force growth has been
annualised and rescaled to reflect a 10-year period.
Source: EU Labour force survey, American Community Survey and Education and Work for Australia.
The demography of education
Across the OECD area, the latest decades have been characterised by an overall increase in
the level of education of the working age population and consequently of the labour force.
This is confirmed by the data analysed in this study, which shows that young entrants have
higher levels of education than recent retirees. This also reflects the ongoing structural
changes on the labour demand. It implies that younger workers and those leaving the labour
DELSA/ELSA/WD/SEM(2018)4 │ 15
For Official Use
force cannot replace each another as they have different skills, as broadly demonstrated in the
literature (Eichhorst et al., 2014[24]).
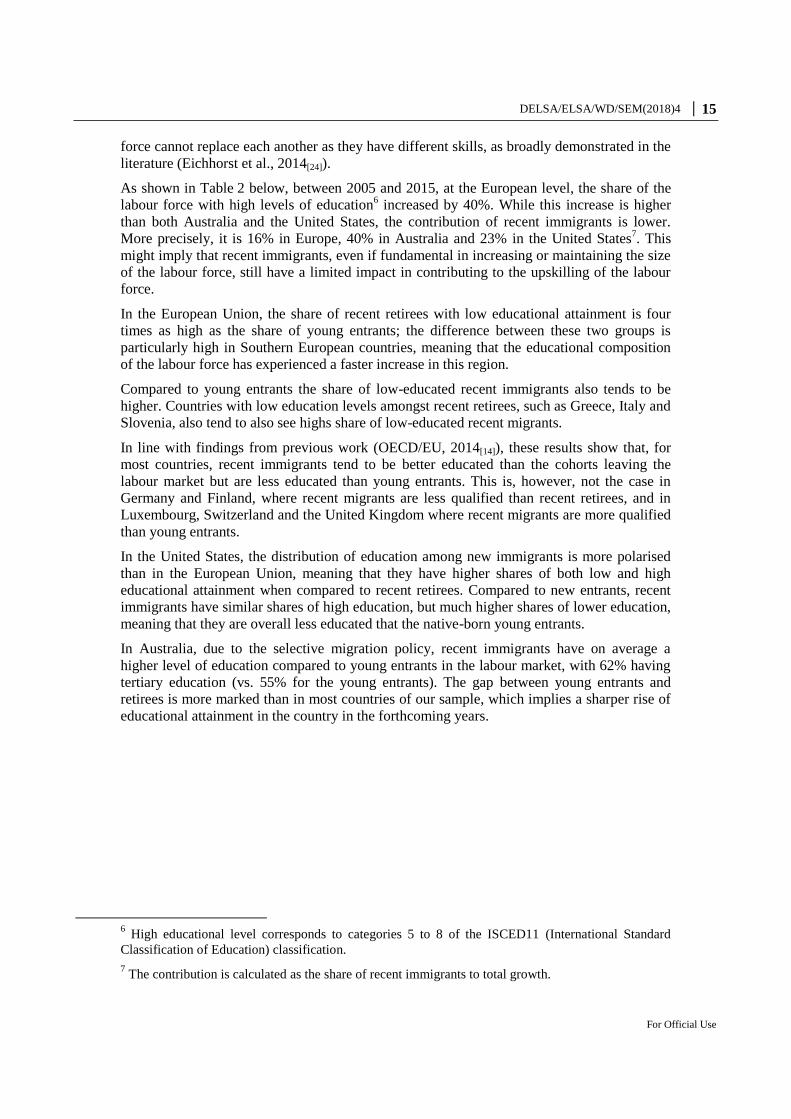
As shown in Table 2 below, between 2005 and 2015, at the European level, the share of the
labour force with high levels of education6 increased by 40%. While this increase is higher
than both Australia and the United States, the contribution of recent immigrants is lower.
More precisely, it is 16% in Europe, 40% in Australia and 23% in the United States7. This
might imply that recent immigrants, even if fundamental in increasing or maintaining the size
of the labour force, still have a limited impact in contributing to the upskilling of the labour
force.
In the European Union, the share of recent retirees with low educational attainment is four
times as high as the share of young entrants; the difference between these two groups is
particularly high in Southern European countries, meaning that the educational composition
of the labour force has experienced a faster increase in this region.
Compared to young entrants the share of low-educated recent immigrants also tends to be
higher. Countries with low education levels amongst recent retirees, such as Greece, Italy and
Slovenia, also tend to also see highs share of low-educated recent migrants.
In line with findings from previous work (OECD/EU, 2014[14]), these results show that, for
most countries, recent immigrants tend to be better educated than the cohorts leaving the
labour market but are less educated than young entrants. This is, however, not the case in
Germany and Finland, where recent migrants are less qualified than recent retirees, and in
Luxembourg, Switzerland and the United Kingdom where recent migrants are more qualified
than young entrants.
In the United States, the distribution of education among new immigrants is more polarised
than in the European Union, meaning that they have higher shares of both low and high
educational attainment when compared to recent retirees. Compared to new entrants, recent
immigrants have similar shares of high education, but much higher shares of lower education,
meaning that they are overall less educated that the native-born young entrants.
In Australia, due to the selective migration policy, recent immigrants have on average a
higher level of education compared to young entrants in the labour market, with 62% having
tertiary education (vs. 55% for the young entrants). The gap between young entrants and
retirees is more marked than in most countries of our sample, which implies a sharper rise of
educational attainment in the country in the forthcoming years.
6 High educational level corresponds to categories 5 to 8 of the ISCED11 (International Standard
Classification of Education) classification.
7 The contribution is calculated as the share of recent immigrants to total growth.
16 │ DELSA/ELSA/WD/SEM(2018)4
For Official Use
Table 2. Total growth of the labour force with higher education from 2005 to 2015, and
contributions by demographic group (in % of the 2005 labour force)
Selected European countries, Australia and the United States
Total labour force growth
Young entrants
Recent immigrants
Recent retirees
Prime-age workers
(A+B+C+D) (A) (B) (C) (D)
Austria 31.9 24.7 14.9 -9.7 1.9
Belgium 26.3 27.7 8.3 -10.1 0.3
Denmark 10.5 19.4 8.5 -11.5 -5.8
France 40.8 33.5 4.0 -11.4 14.6
Germany 19.9 22.2 4.9 -12.3 5.1
Greece 35.7 37.0 1.2 -12.3 9.8
Ireland 55.2 30.4 20.3 -8.3 12.8
Italy 44.3 30.2 4.5 -10.4 20.1
Netherlands 23.7 26.5 2.6 -10.0 4.7
Norway 47.0 30.3 11.9 -9.8 14.7
Spain 35.6 23.3 5.9 -9.3 15.6
Sweden 47.3 31.4 12.5 -15.6 19.0
Switzerland 62.0 27.5 28.7 -11.7 17.6
United Kingdom 51.3 31.1 14.9 -9.8 15.1
EU-27 39.7 31.1 6.4 -10.9 13.1
Australia 36.8 27.7 15.0 -22.1 16.1
United States 20.9 26.4 4.9 -17.1 6.8
Note: Data refers to 2005-2015 for the EU, to 2006-2015 for the United States and to 2011-2016 for Australia. In
order to ensure comparability across countries, for Australia and the United States, labour force growth has been
annualised and rescaled to reflect a 10-year period.
Source: EU Labour force survey, American Community Survey and Education and Work for Australia.
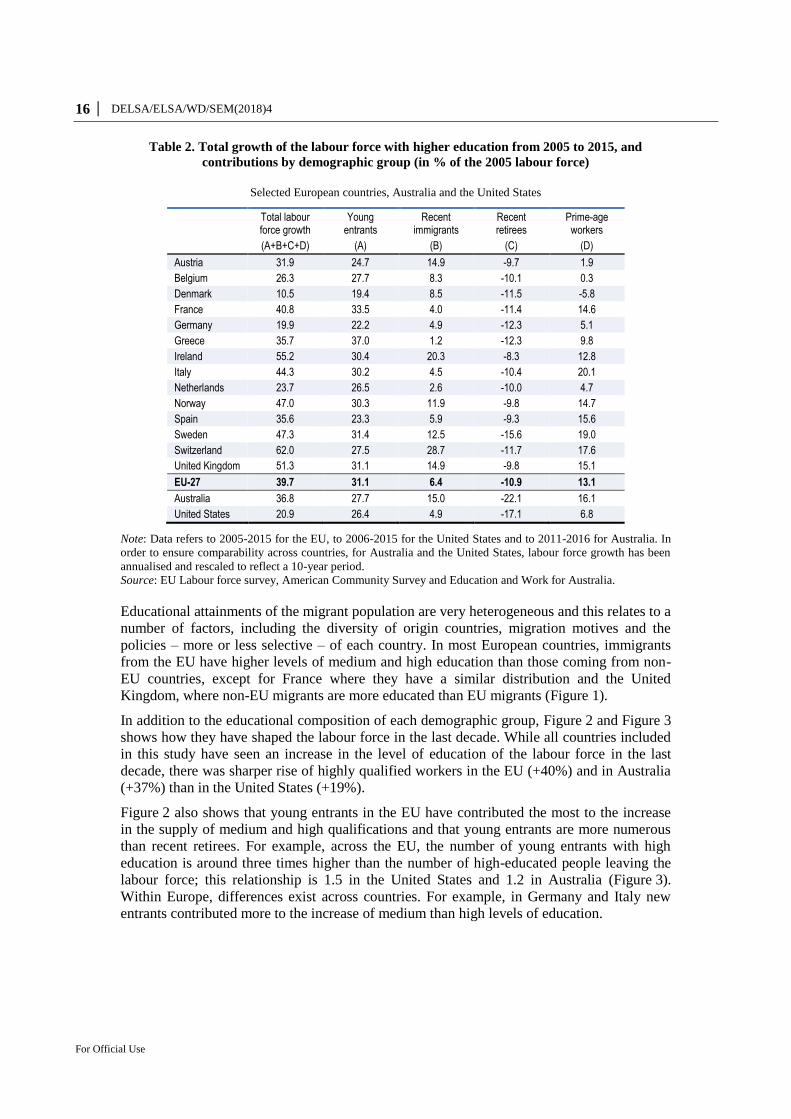
Educational attainments of the migrant population are very heterogeneous and this relates to a
number of factors, including the diversity of origin countries, migration motives and the
policies – more or less selective – of each country. In most European countries, immigrants
from the EU have higher levels of medium and high education than those coming from non-
EU countries, except for France where they have a similar distribution and the United
Kingdom, where non-EU migrants are more educated than EU migrants (Figure 1).
In addition to the educational composition of each demographic group, Figure 2 and Figure 3
shows how they have shaped the labour force in the last decade. While all countries included
in this study have seen an increase in the level of education of the labour force in the last
decade, there was sharper rise of highly qualified workers in the EU (+40%) and in Australia
(+37%) than in the United States (+19%).
Figure 2 also shows that young entrants in the EU have contributed the most to the increase
in the supply of medium and high qualifications and that young entrants are more numerous
than recent retirees. For example, across the EU, the number of young entrants with high
education is around three times higher than the number of high-educated people leaving the
labour force; this relationship is 1.5 in the United States and 1.2 in Australia (Figure 3).
Within Europe, differences exist across countries. For example, in Germany and Italy new
entrants contributed more to the increase of medium than high levels of education.
DELSA/ELSA/WD/SEM(2018)4 │ 17
For Official Use
Figure 1. Educational attainment of recent EU and non-EU immigrants and the total labour
force, selected European countries, 2015
Austria Belgium France
Germany Greece Italy
Spain Sweden United Kingdom
Source: EU Labour Force Survey.
0% 20% 40% 60% 80% 100%
EU
Non-EU
Labour force
Low Medium High
0% 20% 40% 60% 80% 100%
EU
Non-EU
Labour force
Low Medium High
0% 20% 40% 60% 80% 100%
EU
Non-EU
Labour force
Low Medium High
0% 20% 40% 60% 80% 100%
EU
Non-EU
Labour force
Low Medium High
0% 20% 40% 60% 80% 100%
EU
Non-EU
Labour force
Low Medium High
0% 20% 40% 60% 80% 100%
EU
Non-EU
Labour force
Low Medium High
0% 20% 40% 60% 80% 100%
EU
Non-EU
Labour force
Low Medium High
18 │ DELSA/ELSA/WD/SEM(2018)4
For Official Use
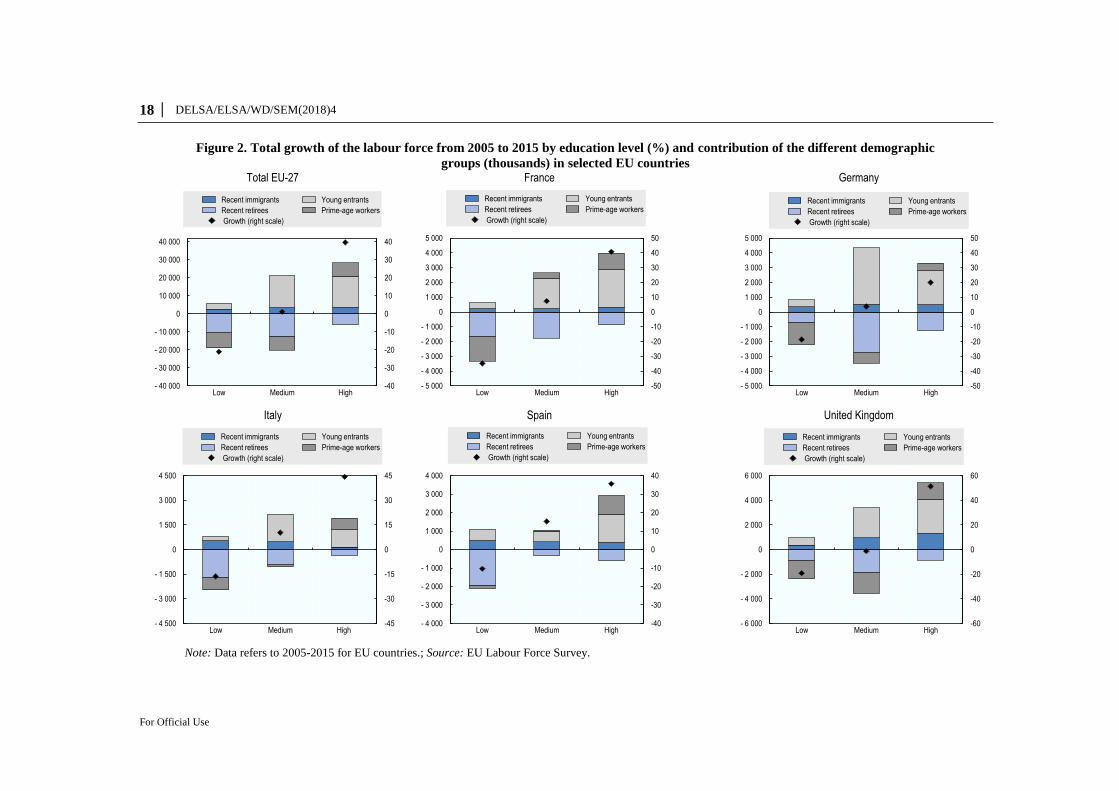
Figure 2. Total growth of the labour force from 2005 to 2015 by education level (%) and contribution of the different demographic
groups (thousands) in selected EU countries Total EU-27 France Germany
Italy Spain United Kingdom
Note: Data refers to 2005-2015 for EU countries.; Source: EU Labour Force Survey.
-40
-30
-20
-10
0
10
20
30
40
- 40 000
- 30 000
- 20 000
- 10 000
0
10 000
20 000
30 000
40 000
Low Medium High
Recent immigrants Young entrants
Recent retirees Prime-age workers
Growth (right scale)
-50
-40
-30
-20
-10
0
10
20
30
40
50
- 5 000
- 4 000
- 3 000
- 2 000
- 1 000
0
1 000
2 000
3 000
4 000
5 000
Low Medium High
Recent immigrants Young entrants
Recent retirees Prime-age workers
Growth (right scale)
-50
-40
-30
-20
-10
0
10
20
30
40
50
- 5 000
- 4 000
- 3 000
- 2 000
- 1 000
0
1 000
2 000
3 000
4 000
5 000
Low Medium High
Recent immigrants Young entrants
Recent retirees Prime-age workers
Growth (right scale)
-45
-30
-15
0
15
30
45
- 4 500
- 3 000
- 1 500
0
1 500
3 000
4 500
Low Medium High
Recent immigrants Young entrants
Recent retirees Prime-age workers
Growth (right scale)
-40
-30
-20
-10
0
10
20
30
40
- 4 000
- 3 000
- 2 000
- 1 000
0
1 000
2 000
3 000
4 000
Low Medium High
Recent immigrants Young entrants
Recent retirees Prime-age workers
Growth (right scale)
-60
-40
-20
0
20
40
60
- 6 000
- 4 000
- 2 000
0
2 000
4 000
6 000
Low Medium High
Recent immigrants Young entrants
Recent retirees Prime-age workers
Growth (right scale)
DELSA/ELSA/WD/SEM(2018)4 │ 19
For Official Use
Concerning recent immigrants, the breakdown by country sheds light on their different
contribution to educational changes of the labour force. While in France and in the United
Kingdom, recent immigrants were mainly highly educated, in Spain and Italy they were more
often on the other end of the education spectrum. This is probably due to the inflows of low-
educated migrant workers that have occurred in these countries in the last decade in response
to the demand for low-educated workers. In both Australia and the United States, similarly to
the EU average, recent immigrants were mainly medium and highly educated. Especially for
Australia, this is the effect of the selective immigration policy which has favoured the
entrance of highly educated migrants.
For recent retirees the picture is mixed. For the EU as a whole, France and the United
Kingdom they seem to have equally contributed to the decrease of both low and medium
education groups. While in Germany and in the United States the decrease is much stronger
for medium levels of education, in Australia, Spain and Italy recent retirees have left mainly
occupations requiring low levels of education.
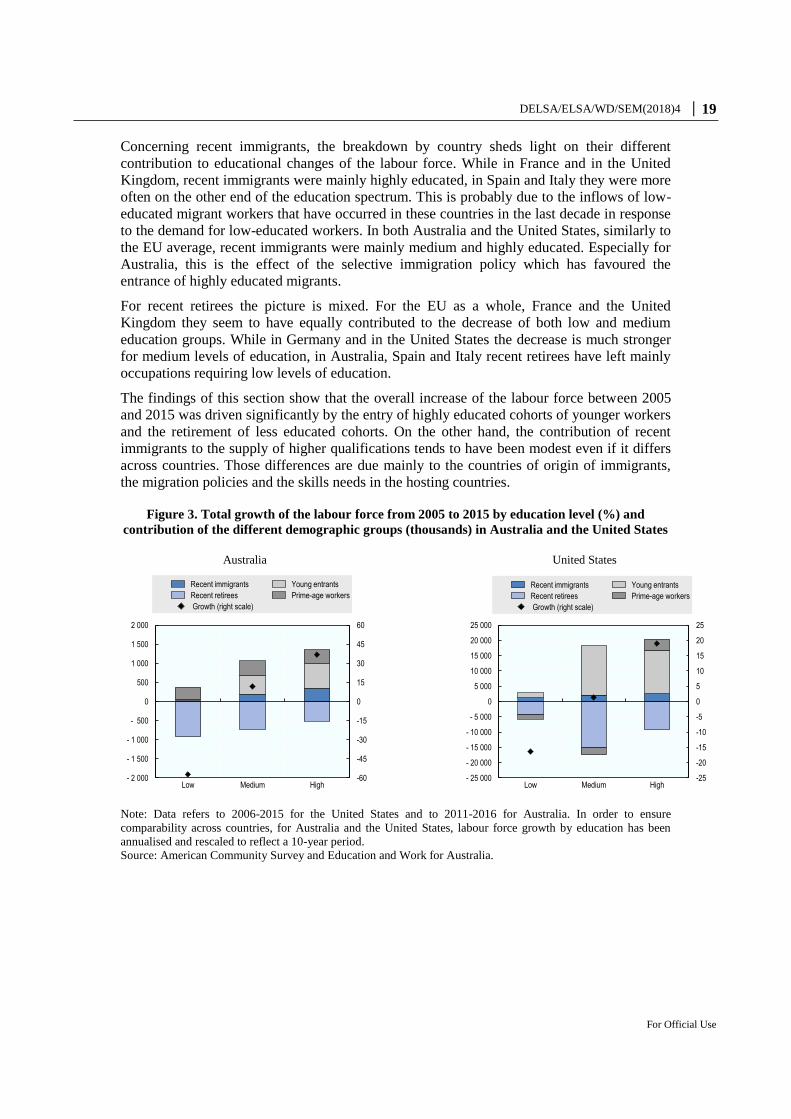
The findings of this section show that the overall increase of the labour force between 2005
and 2015 was driven significantly by the entry of highly educated cohorts of younger workers
and the retirement of less educated cohorts. On the other hand, the contribution of recent
immigrants to the supply of higher qualifications tends to have been modest even if it differs
across countries. Those differences are due mainly to the countries of origin of immigrants,
the migration policies and the skills needs in the hosting countries.
Figure 3. Total growth of the labour force from 2005 to 2015 by education level (%) and
contribution of the different demographic groups (thousands) in Australia and the United States
Australia United States
Note: Data refers to 2006-2015 for the United States and to 2011-2016 for Australia. In order to ensure
comparability across countries, for Australia and the United States, labour force growth by education has been
annualised and rescaled to reflect a 10-year period.
Source: American Community Survey and Education and Work for Australia.
-60
-45
-30
-15
0
15
30
45
60
- 2 000
- 1 500
- 1 000
- 500
0
500
1 000
1 500
2 000
Low Medium High
Recent immigrants Young entrants
Recent retirees Prime-age workers
Growth (right scale)
-25
-20
-15
-10
-5
0
5
10
15
20
25
- 25 000
- 20 000
- 15 000
- 10 000
- 5 000
0
5 000
10 000
15 000
20 000
25 000
Low Medium High
Recent immigrants Young entrants
Recent retirees Prime-age workers
Growth (right scale)
20 │ DELSA/ELSA/WD/SEM(2018)4
For Official Use
The evolution of occupations8
In the last decades, OECD countries have been also characterised by significant changes in
terms of the occupational composition of the labour market. Most countries have seen a
progressive polarisation of the labour force with medium skilled jobs stagnating while high
and low-skilled jobs growing at a faster pace. This also corresponds to a greater increase of
both high and low paid occupations. While this trend is clear in countries like Canada and the
United States, different patterns exist within Europe (Institute for Public Policy Research,
2014[25]).
The evolution of the occupational structure can be explained by a number of factors and can
be analysed from two different perspectives; either from the demand side which corresponds
to the skills needed by employers or by the supply side which indicates the skills owned by
the labour force.
This analysis focuses on the latter and highlights changes based on the characteristics of
people entering and exiting the labour force. In this framework, young entrants and recent
migrants provide a positive contribution to growth while recent retirees induce a negative
one. This translates into either the creation of new jobs or the replacement of retirees by other
people in the labour force.
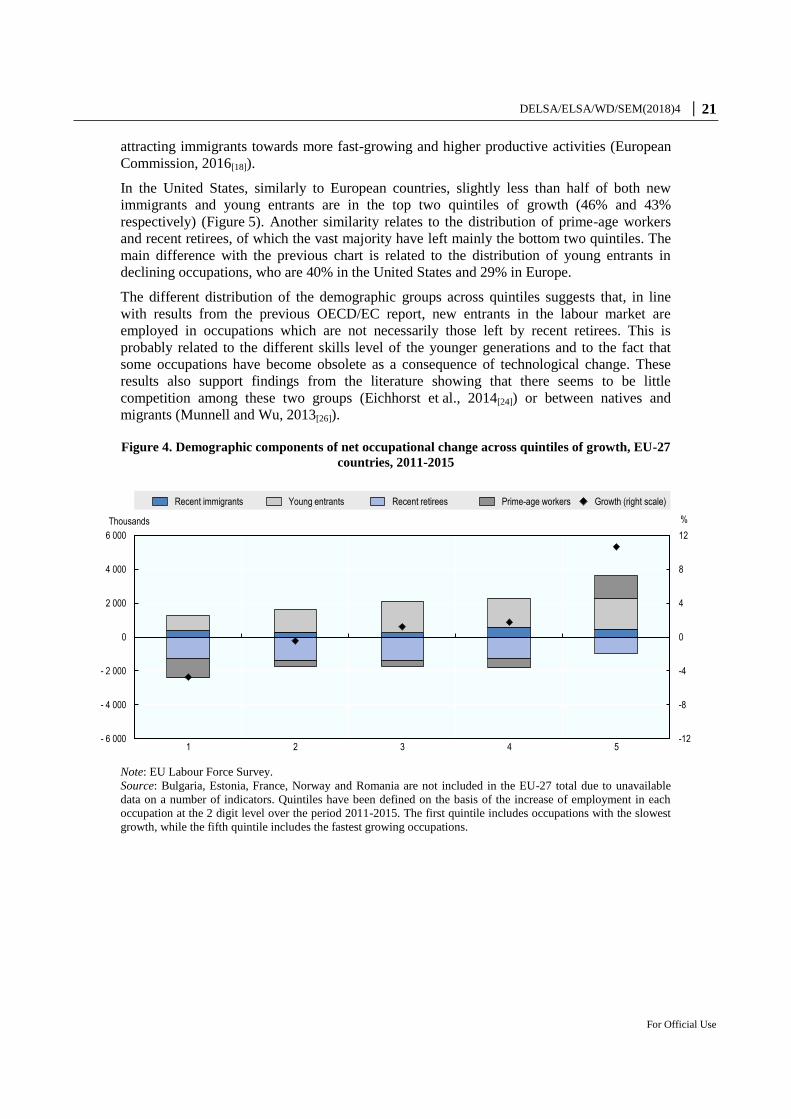
Figure 4 shows how each demographic group has contributed to net employment changes in
five quintiles of growth in European countries9. Interesting findings emerge when comparing
the contribution of young entrants and recent immigrants at the top and bottom quintiles in
Europe (Figure 4) and the United States (Figure 5). While recent immigrants in Europe and in
the Unites States have a similar distribution in the fastest growing occupations (top quintile),
where they represent respectively 20% and 15% of entries (including both young entrants and
recent immigrants), recent immigrants are many more in the strongest declining occupations
(bottom quintile) in Europe than in the United States (30% and 9% of entries respectively).
In Europe, when looking at the distribution of the different demographic groups across
quintiles, new entrants are more concentrated in growing occupations, with 47% being in the
fastest growing occupations (fourth and fifth quintiles). Recent retirees show a distribution
opposite to that of young entrants with more than 40% of them being in the two bottom
quantiles and around a third in the top two quintiles of growth.
More than half of recent immigrants have entered fast growing occupations (fourth and fifth
quintile) and around a third entered declining occupations. While this result confirms their
contribution to employment growth, it is worth highlighting that the occupations included in
the top two quintiles, as well as in the other quintiles, are a mix of high and low qualified,
paid and productive occupations. This means that the allocation of immigrants across
occupations is not always effective, meaning that the potential contribution of immigrants to
economic growth is not fully achieved. Similar results also emerge when looking at the
employment distribution of immigrants across industrial sectors in Europe. A recent analysis
conducted by the European Commission highlights that there is room for improvement in
8 Due to limited data availability, Germany and Australia are not included in the analysis of
occupations.
9 The analysis included in this section focuses on the 2011-2015 period. Following a change in the
ISCO classification in 2011, trends in the employment by occupation cannot be analysed for previous
years for European countries. In order to ensure some comparability across countries, a similar period
of time has been analysed also for the United States and Australia.
DELSA/ELSA/WD/SEM(2018)4 │ 21
For Official Use
attracting immigrants towards more fast-growing and higher productive activities (European
Commission, 2016[18]).
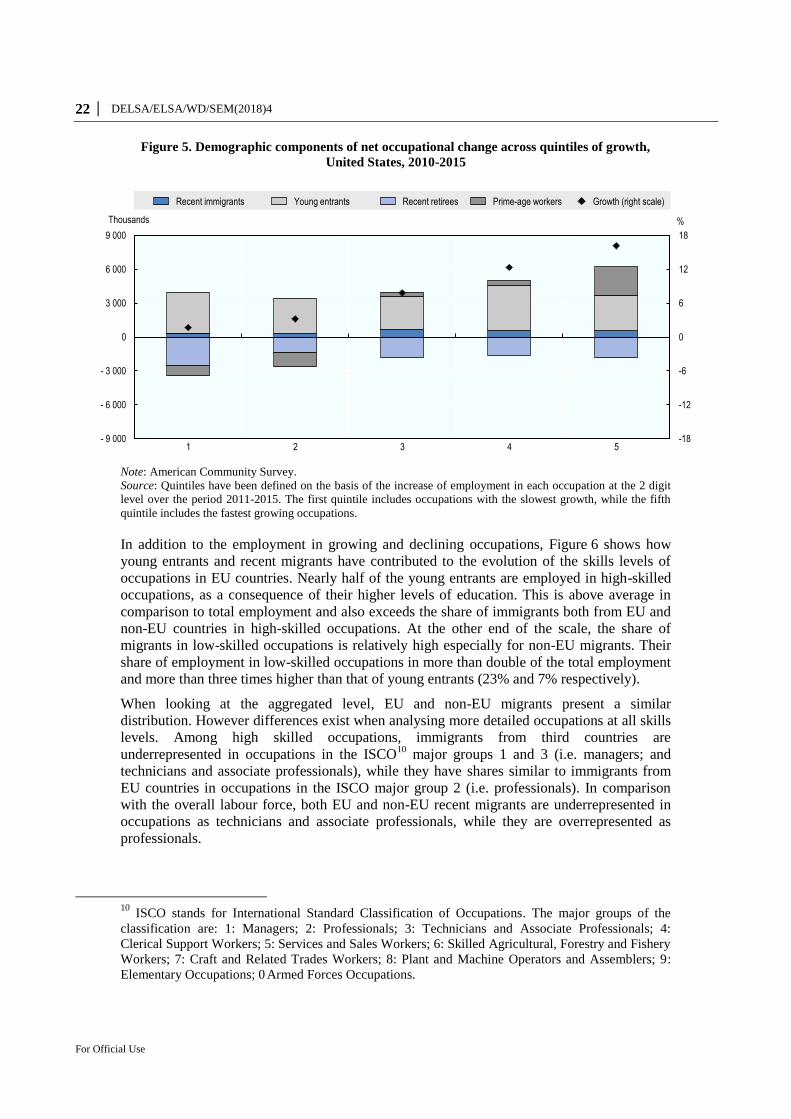
In the United States, similarly to European countries, slightly less than half of both new
immigrants and young entrants are in the top two quintiles of growth (46% and 43%
respectively) (Figure 5). Another similarity relates to the distribution of prime-age workers
and recent retirees, of which the vast majority have left mainly the bottom two quintiles. The
main difference with the previous chart is related to the distribution of young entrants in
declining occupations, who are 40% in the United States and 29% in Europe.
The different distribution of the demographic groups across quintiles suggests that, in line
with results from the previous OECD/EC report, new entrants in the labour market are
employed in occupations which are not necessarily those left by recent retirees. This is
probably related to the different skills level of the younger generations and to the fact that
some occupations have become obsolete as a consequence of technological change. These
results also support findings from the literature showing that there seems to be little
competition among these two groups (Eichhorst et al., 2014[24]) or between natives and
migrants (Munnell and Wu, 2013[26]).
Figure 4. Demographic components of net occupational change across quintiles of growth, EU-27
countries, 2011-2015
Note: EU Labour Force Survey.
Source: Bulgaria, Estonia, France, Norway and Romania are not included in the EU-27 total due to unavailable
data on a number of indicators. Quintiles have been defined on the basis of the increase of employment in each
occupation at the 2 digit level over the period 2011-2015. The first quintile includes occupations with the slowest
growth, while the fifth quintile includes the fastest growing occupations.
-12
-8
-4
0
4
8
12
- 6 000
- 4 000
- 2 000
0
2 000
4 000
6 000
1 2 3 4 5
Thousands %
Recent immigrants Young entrants Recent retirees Prime-age workers Growth (right scale)
22 │ DELSA/ELSA/WD/SEM(2018)4
For Official Use
Figure 5. Demographic components of net occupational change across quintiles of growth,
United States, 2010-2015
Note: American Community Survey.
Source: Quintiles have been defined on the basis of the increase of employment in each occupation at the 2 digit
level over the period 2011-2015. The first quintile includes occupations with the slowest growth, while the fifth
quintile includes the fastest growing occupations.
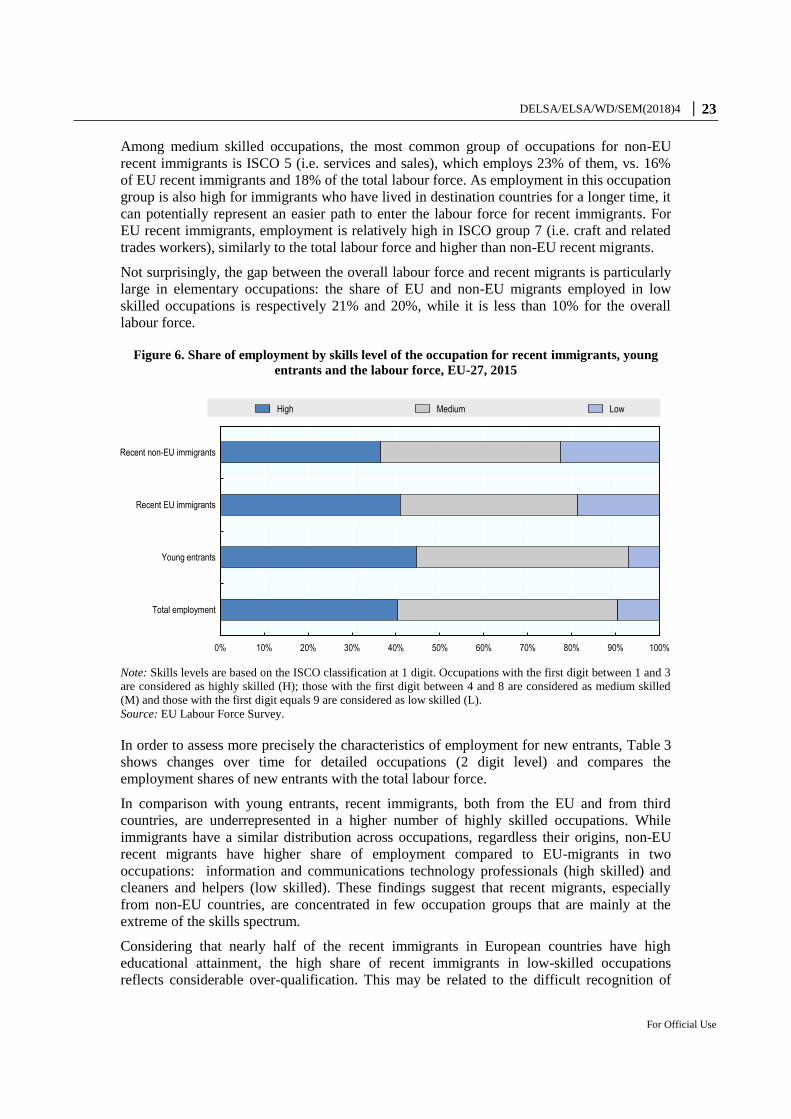
In addition to the employment in growing and declining occupations, Figure 6 shows how
young entrants and recent migrants have contributed to the evolution of the skills levels of
occupations in EU countries. Nearly half of the young entrants are employed in high-skilled
occupations, as a consequence of their higher levels of education. This is above average in
comparison to total employment and also exceeds the share of immigrants both from EU and
non-EU countries in high-skilled occupations. At the other end of the scale, the share of
migrants in low-skilled occupations is relatively high especially for non-EU migrants. Their
share of employment in low-skilled occupations in more than double of the total employment
and more than three times higher than that of young entrants (23% and 7% respectively).
When looking at the aggregated level, EU and non-EU migrants present a similar
distribution. However differences exist when analysing more detailed occupations at all skills
levels. Among high skilled occupations, immigrants from third countries are
underrepresented in occupations in the ISCO10
major groups 1 and 3 (i.e. managers; and
technicians and associate professionals), while they have shares similar to immigrants from
EU countries in occupations in the ISCO major group 2 (i.e. professionals). In comparison
with the overall labour force, both EU and non-EU recent migrants are underrepresented in
occupations as technicians and associate professionals, while they are overrepresented as
professionals.
10
ISCO stands for International Standard Classification of Occupations. The major groups of the
classification are: 1: Managers; 2: Professionals; 3: Technicians and Associate Professionals; 4:
Clerical Support Workers; 5: Services and Sales Workers; 6: Skilled Agricultural, Forestry and Fishery
Workers; 7: Craft and Related Trades Workers; 8: Plant and Machine Operators and Assemblers; 9:
Elementary Occupations; 0 Armed Forces Occupations.
-18
-12
-6
0
6
12
18
- 9 000
- 6 000
- 3 000
0
3 000
6 000
9 000
1 2 3 4 5
Thousands %
Recent immigrants Young entrants Recent retirees Prime-age workers Growth (right scale)
DELSA/ELSA/WD/SEM(2018)4 │ 23
For Official Use
Among medium skilled occupations, the most common group of occupations for non-EU
recent immigrants is ISCO 5 (i.e. services and sales), which employs 23% of them, vs. 16%
of EU recent immigrants and 18% of the total labour force. As employment in this occupation
group is also high for immigrants who have lived in destination countries for a longer time, it
can potentially represent an easier path to enter the labour force for recent immigrants. For
EU recent immigrants, employment is relatively high in ISCO group 7 (i.e. craft and related
trades workers), similarly to the total labour force and higher than non-EU recent migrants.
Not surprisingly, the gap between the overall labour force and recent migrants is particularly
large in elementary occupations: the share of EU and non-EU migrants employed in low
skilled occupations is respectively 21% and 20%, while it is less than 10% for the overall
labour force.
Figure 6. Share of employment by skills level of the occupation for recent immigrants, young
entrants and the labour force, EU-27, 2015
Note: Skills levels are based on the ISCO classification at 1 digit. Occupations with the first digit between 1 and 3
are considered as highly skilled (H); those with the first digit between 4 and 8 are considered as medium skilled
(M) and those with the first digit equals 9 are considered as low skilled (L).
Source: EU Labour Force Survey.
In order to assess more precisely the characteristics of employment for new entrants, Table 3
shows changes over time for detailed occupations (2 digit level) and compares the
employment shares of new entrants with the total labour force.
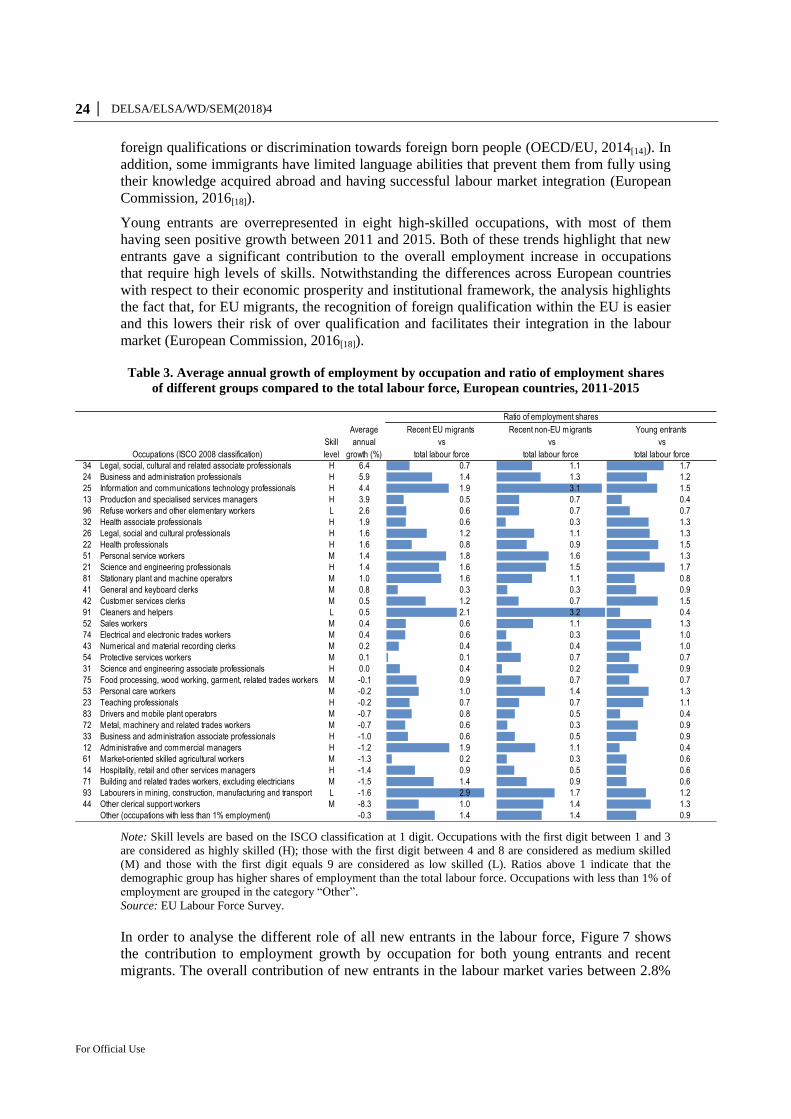
In comparison with young entrants, recent immigrants, both from the EU and from third
countries, are underrepresented in a higher number of highly skilled occupations. While
immigrants have a similar distribution across occupations, regardless their origins, non-EU
recent migrants have higher share of employment compared to EU-migrants in two
occupations: information and communications technology professionals (high skilled) and
cleaners and helpers (low skilled). These findings suggest that recent migrants, especially
from non-EU countries, are concentrated in few occupation groups that are mainly at the
extreme of the skills spectrum.
Considering that nearly half of the recent immigrants in European countries have high
educational attainment, the high share of recent immigrants in low-skilled occupations
reflects considerable over-qualification. This may be related to the difficult recognition of
0% 10% 20% 30% 40% 50% 60% 70% 80% 90% 100%
Total employment
Young entrants
Recent EU immigrants
Recent non-EU immigrants
High Medium Low
24 │ DELSA/ELSA/WD/SEM(2018)4
For Official Use
foreign qualifications or discrimination towards foreign born people (OECD/EU, 2014[14]). In
addition, some immigrants have limited language abilities that prevent them from fully using
their knowledge acquired abroad and having successful labour market integration (European
Commission, 2016[18]).
Young entrants are overrepresented in eight high-skilled occupations, with most of them
having seen positive growth between 2011 and 2015. Both of these trends highlight that new
entrants gave a significant contribution to the overall employment increase in occupations
that require high levels of skills. Notwithstanding the differences across European countries
with respect to their economic prosperity and institutional framework, the analysis highlights
the fact that, for EU migrants, the recognition of foreign qualification within the EU is easier
and this lowers their risk of over qualification and facilitates their integration in the labour
market (European Commission, 2016[18]).
Table 3. Average annual growth of employment by occupation and ratio of employment shares
of different groups compared to the total labour force, European countries, 2011-2015
Note: Skill levels are based on the ISCO classification at 1 digit. Occupations with the first digit between 1 and 3
are considered as highly skilled (H); those with the first digit between 4 and 8 are considered as medium skilled
(M) and those with the first digit equals 9 are considered as low skilled (L). Ratios above 1 indicate that the
demographic group has higher shares of employment than the total labour force. Occupations with less than 1% of
employment are grouped in the category “Other”.
Source: EU Labour Force Survey.
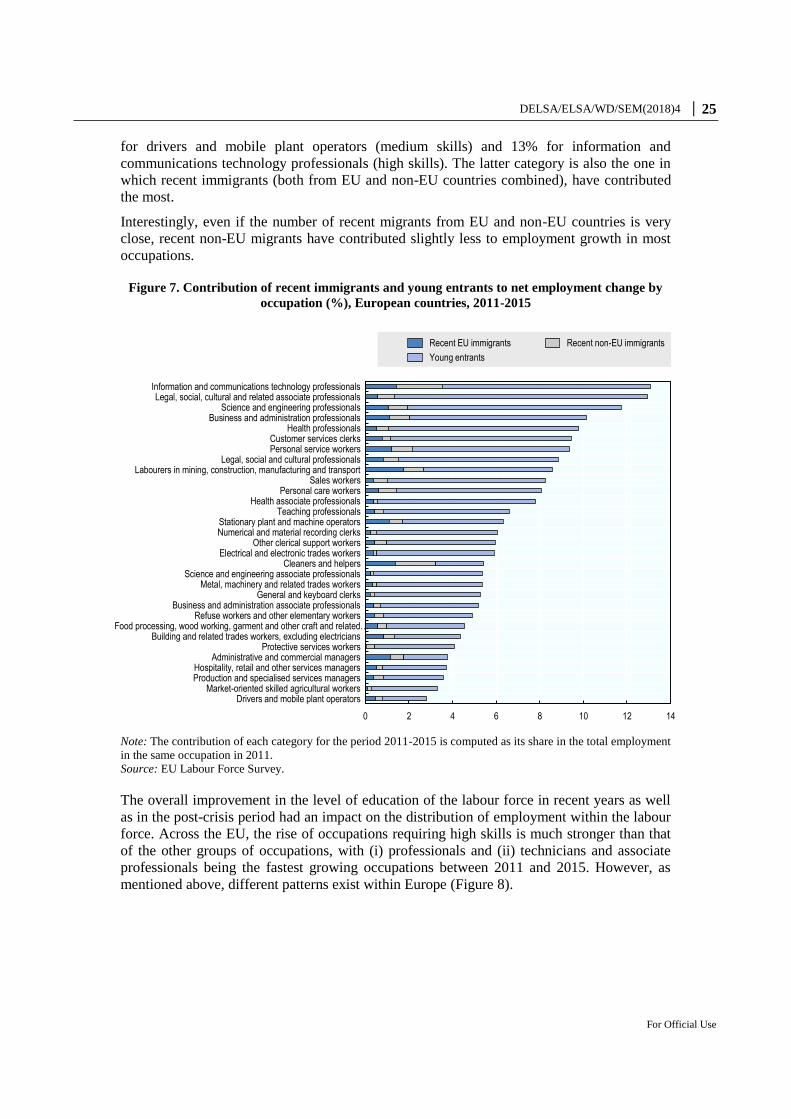
In order to analyse the different role of all new entrants in the labour force, Figure 7 shows
the contribution to employment growth by occupation for both young entrants and recent
migrants. The overall contribution of new entrants in the labour market varies between 2.8%
Recent EU migrants
vs
total labour force
Recent non-EU migrants
vs
total labour force
Young entrants
vs
total labour force
34 Legal, social, cultural and related associate professionals H 6.4 0.7 1.1 1.7
24 Business and administration professionals H 5.9 1.4 1.3 1.2
25 Information and communications technology professionals H 4.4 1.9 3.1 1.5
13 Production and specialised services managers H 3.9 0.5 0.7 0.4
96 Refuse workers and other elementary workers L 2.6 0.6 0.7 0.7
32 Health associate professionals H 1.9 0.6 0.3 1.3
26 Legal, social and cultural professionals H 1.6 1.2 1.1 1.3
22 Health professionals H 1.6 0.8 0.9 1.5
51 Personal service workers M 1.4 1.8 1.6 1.3
21 Science and engineering professionals H 1.4 1.6 1.5 1.7
81 Stationary plant and machine operators M 1.0 1.6 1.1 0.8
41 General and keyboard clerks M 0.8 0.3 0.3 0.9
42 Customer services clerks M 0.5 1.2 0.7 1.5
91 Cleaners and helpers L 0.5 2.1 3.2 0.4
52 Sales workers M 0.4 0.6 1.1 1.3
74 Electrical and electronic trades workers M 0.4 0.6 0.3 1.0
43 Numerical and material recording clerks M 0.2 0.4 0.4 1.0
54 Protective services workers M 0.1 0.1 0.7 0.7
31 Science and engineering associate professionals H 0.0 0.4 0.2 0.9
75 Food processing, wood working, garment, related trades workers M -0.1 0.9 0.7 0.7
53 Personal care workers M -0.2 1.0 1.4 1.3
23 Teaching professionals H -0.2 0.7 0.7 1.1
83 Drivers and mobile plant operators M -0.7 0.8 0.5 0.4
72 Metal, machinery and related trades workers M -0.7 0.6 0.3 0.9
33 Business and administration associate professionals H -1.0 0.6 0.5 0.9
12 Administrative and commercial managers H -1.2 1.9 1.1 0.4
61 Market-oriented skilled agricultural workers M -1.3 0.2 0.3 0.6
14 Hospitality, retail and other services managers H -1.4 0.9 0.5 0.6
71 Building and related trades workers, excluding electricians M -1.5 1.4 0.9 0.6
93 Labourers in mining, construction, manufacturing and transport L -1.6 2.9 1.7 1.2
44 Other clerical support workers M -8.3 1.0 1.4 1.3
Other (occupations with less than 1% employment) -0.3 1.4 1.4 0.9
Skill
level
Average
annual
growth (%)
Ratio of employment shares
Occupations (ISCO 2008 classification)
DELSA/ELSA/WD/SEM(2018)4 │ 25
For Official Use
for drivers and mobile plant operators (medium skills) and 13% for information and
communications technology professionals (high skills). The latter category is also the one in
which recent immigrants (both from EU and non-EU countries combined), have contributed
the most.
Interestingly, even if the number of recent migrants from EU and non-EU countries is very
close, recent non-EU migrants have contributed slightly less to employment growth in most
occupations.
Figure 7. Contribution of recent immigrants and young entrants to net employment change by
occupation (%), European countries, 2011-2015
Note: The contribution of each category for the period 2011-2015 is computed as its share in the total employment
in the same occupation in 2011.
Source: EU Labour Force Survey.
The overall improvement in the level of education of the labour force in recent years as well
as in the post-crisis period had an impact on the distribution of employment within the labour
force. Across the EU, the rise of occupations requiring high skills is much stronger than that
of the other groups of occupations, with (i) professionals and (ii) technicians and associate
professionals being the fastest growing occupations between 2011 and 2015. However, as
mentioned above, different patterns exist within Europe (Figure 8).
0 2 4 6 8 10 12 14
Drivers and mobile plant operatorsMarket-oriented skilled agricultural workers
Production and specialised services managersHospitality, retail and other services managers
Administrative and commercial managersProtective services workers
Building and related trades workers, excluding electriciansFood processing, wood working, garment and other craft and related…
Refuse workers and other elementary workersBusiness and administration associate professionals
General and keyboard clerksMetal, machinery and related trades workers
Science and engineering associate professionalsCleaners and helpers
Electrical and electronic trades workersOther clerical support workers
Numerical and material recording clerksStationary plant and machine operators
Teaching professionalsHealth associate professionals
Personal care workersSales workers
Labourers in mining, construction, manufacturing and transportLegal, social and cultural professionals
Personal service workersCustomer services clerks
Health professionalsBusiness and administration professionals
Science and engineering professionalsLegal, social, cultural and related associate professionals
Information and communications technology professionals
Recent EU immigrants Recent non-EU immigrants
Young entrants
26 │ DELSA/ELSA/WD/SEM(2018)4
For Official Use
Figure 8. Total growth of the labour force by skill level of the occupations (%), and contribution of the different demographic groups
(thousands) in selected EU countries Total EU-27 France Italy
Spain Sweden United Kingdom
Note: Skill levels are based on the ISCO classification at 1 digit. Occupations with the first digit between 1 and 3 are considered as highly skilled (H); those with the first digit between 4 and 8 are considered as
medium skilled (M) and those with the first digit equals 9 are considered as low skilled (L). Source: EU Labour Force Survey.
-6
-4
-2
0
2
4
6
- 9 000
- 6 000
- 3 000
0
3 000
6 000
9 000
Low Medium High
Recent immigrants Young entrants
Recent etirees Prime-age workers
Growth (right scale)
-6
-4
-2
0
2
4
6
- 1 500
- 1 000
- 500
0
500
1 000
1 500
Low Medium High
Recent immigrants Young entrants
Recent retirees Prime-age workers
Growth (right scale)
-15
-10
-5
0
5
10
15
- 1 200
- 800
- 400
0
400
800
1 200
Low Medium High
Recent immigrants Young entrants
Recent retirees Prime-age workers
Growth (right scale)
-6
-4
-2
0
2
4
6
- 900
- 600
- 300
0
300
600
900
Low Medium High
Recent immigrants Young entrants
Recent retirees Prime-age workers
Growth (right scale)
-15
-10
-5
0
5
10
15
- 600
- 400
- 200
0
200
400
600
Low Medium High
Recent immigrants Young entrants
Recent retirees Prime-age workers
Growth (right scale)
-8
-6
-4
-2
0
2
4
6
8
- 2 000
- 1 500
- 1 000
- 500
0
500
1 000
1 500
2 000
Low Medium High
Recent immigrants Young entrants
Recent retirees Prime-age workers
Growth (right scale)
DELSA/ELSA/WD/SEM(2018)4 │ 27
For Official Use
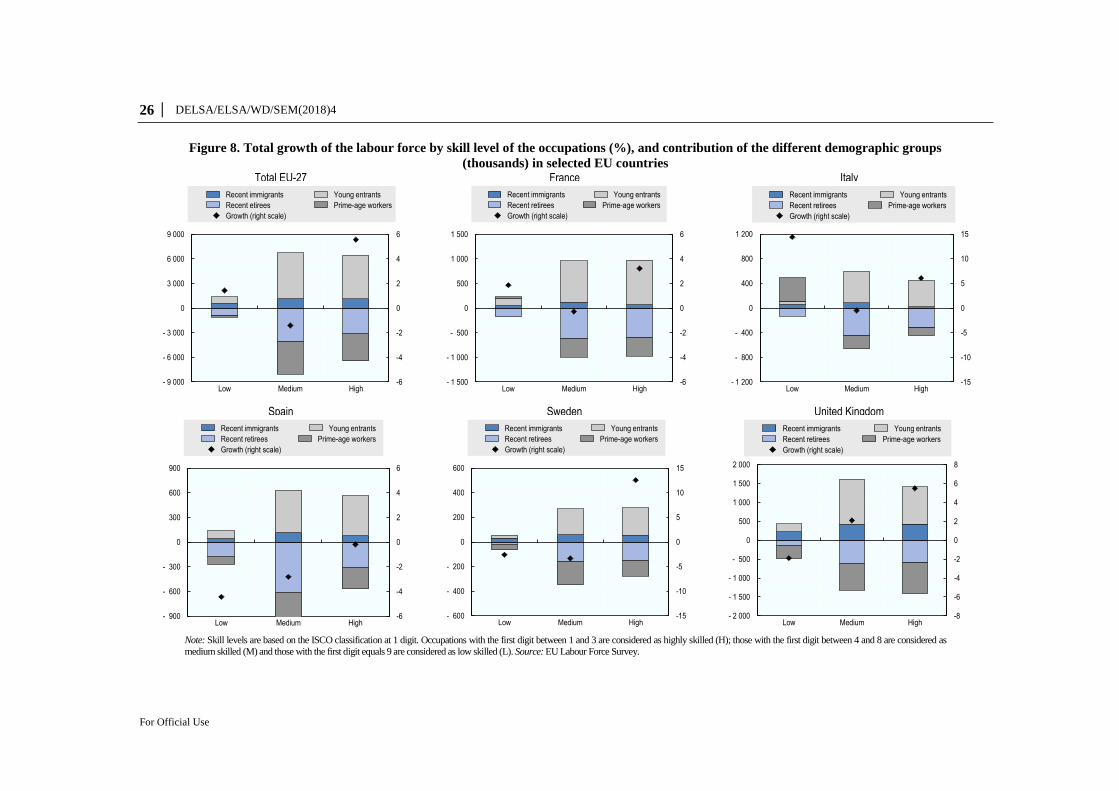
In France and Italy, similarly to the aggregate pattern observed for European countries,
changes in the employment composition have a U-shape: employment growth is positive
for low-skilled and highly skilled occupations, but is close to zero for medium-skilled
ones. In the case of Spain, as a consequence of the overall decline of the labour force in
the wake of the economic crisis, employment growth is negative for all categories of
occupations. The strong labour market segmentation in Spain is also documented by the
more severe decline in low-skilled occupations than in highly-skilled ones. In the United
Kingdom, where overall employment growth has been positive, the highly-skilled
occupations are the ones which have grown the most, a result also observed in Sweden.
Regardless of the evolution of the occupational structure, young entrants in all EU
countries have contributed to a greater extent to the growth of both high and medium
skilled occupations than to low-skilled ones. Although recent migrants have generally
contributed more in absolute terms to highly-skilled occupations than to low-skilled ones,
their relative contribution is higher in low-skilled occupations because much fewer young
workers choose these jobs. This is for example the case in the United Kingdom where
recent migrants outnumber young entrants in low-skilled jobs (even though recent
migrants are much more numerous in highly-skilled occupations than in low-skilled
ones).
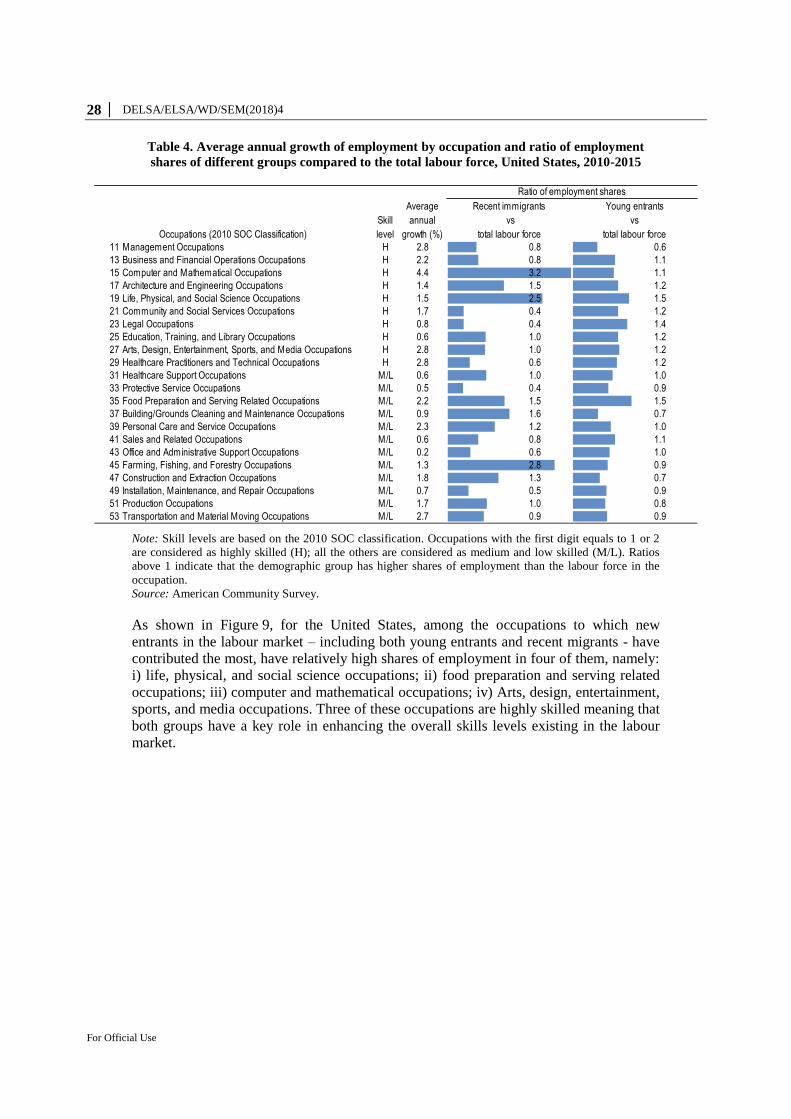
In the United States, between 2010 and 2015 the employed labour force grew by 8.1%.
Data shows that growth has been positive in all occupations, with the four occupations at
the top being high skilled and having an average annual growth above 2% (Table 4). On
the contrary, occupations with the lowest growth are mainly medium or low skilled. In
comparison to the total labour force, young entrants have higher shares of employment in
all high skilled occupations, except for management occupations, meaning that their skills
are well matched with their jobs.
Recent immigrants in the US are equally distributed across highly and medium/low
skilled occupations, showing a more heterogeneous distribution across skill levels. At the
same time, recent immigrants are significantly over-represented in three specific
occupations: computer and mathematical occupations; and life, physical, and social
science occupations - which are both highly skilled - and farming occupations which are
medium/low skilled.
In the case of the United States, in comparison to young entrants are less represented in
occupations which had a slow growth in the analysed period. This result is different from
the one obtained for European countries, where recent migrants, especially from EU
countries, tend to be more represented in declining occupations than young entrants.
28 │ DELSA/ELSA/WD/SEM(2018)4
For Official Use
Table 4. Average annual growth of employment by occupation and ratio of employment
shares of different groups compared to the total labour force, United States, 2010-2015
Note: Skill levels are based on the 2010 SOC classification. Occupations with the first digit equals to 1 or 2
are considered as highly skilled (H); all the others are considered as medium and low skilled (M/L). Ratios
above 1 indicate that the demographic group has higher shares of employment than the labour force in the
occupation.
Source: American Community Survey.
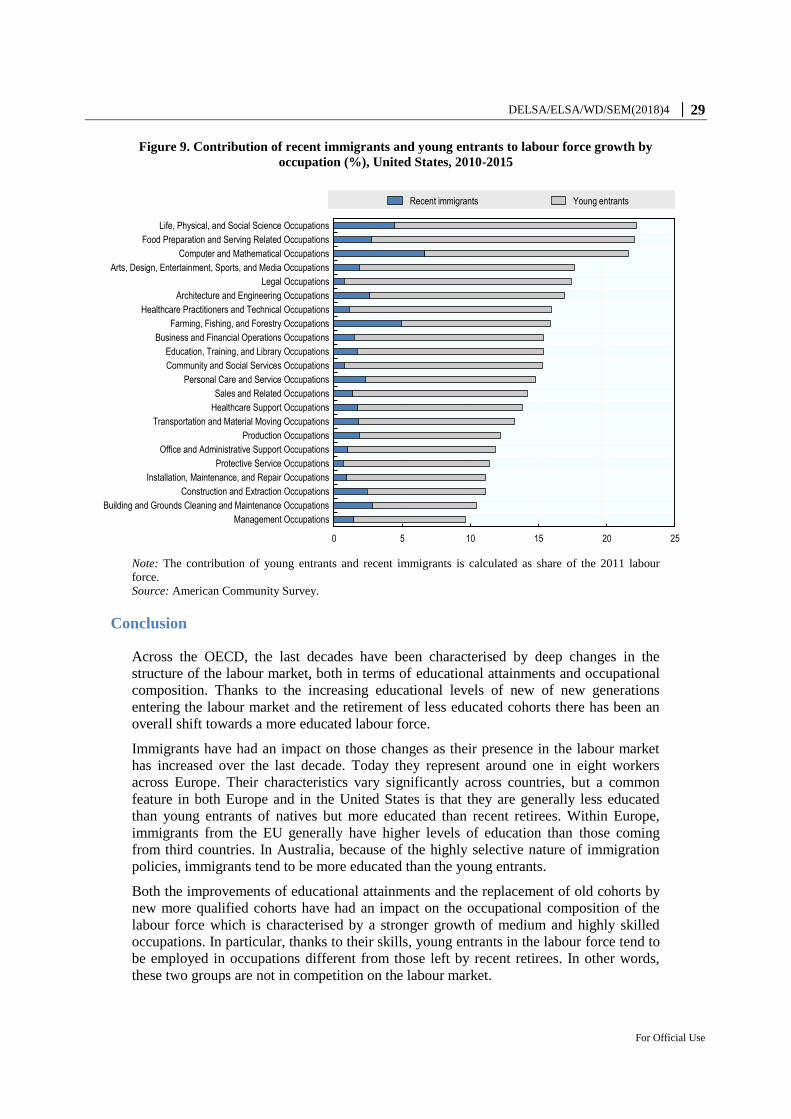
As shown in Figure 9, for the United States, among the occupations to which new
entrants in the labour market – including both young entrants and recent migrants - have
contributed the most, have relatively high shares of employment in four of them, namely:
i) life, physical, and social science occupations; ii) food preparation and serving related
occupations; iii) computer and mathematical occupations; iv) Arts, design, entertainment,
sports, and media occupations. Three of these occupations are highly skilled meaning that
both groups have a key role in enhancing the overall skills levels existing in the labour
market.
Skill
level
Recent immigrants
vs
total labour force
Young entrants
vs
total labour force
11 Management Occupations H 2.8 0.8 0.6
13 Business and Financial Operations Occupations H 2.2 0.8 1.1
15 Computer and Mathematical Occupations H 4.4 3.2 1.1
17 Architecture and Engineering Occupations H 1.4 1.5 1.2
19 Life, Physical, and Social Science Occupations H 1.5 2.5 1.5
21 Community and Social Services Occupations H 1.7 0.4 1.2
23 Legal Occupations H 0.8 0.4 1.4
25 Education, Training, and Library Occupations H 0.6 1.0 1.2
27 Arts, Design, Entertainment, Sports, and Media Occupations H 2.8 1.0 1.2
29 Healthcare Practitioners and Technical Occupations H 2.8 0.6 1.2
31 Healthcare Support Occupations M/L 0.6 1.0 1.0
33 Protective Service Occupations M/L 0.5 0.4 0.9
35 Food Preparation and Serving Related Occupations M/L 2.2 1.5 1.5
37 Building/Grounds Cleaning and Maintenance Occupations M/L 0.9 1.6 0.7
39 Personal Care and Service Occupations M/L 2.3 1.2 1.0
41 Sales and Related Occupations M/L 0.6 0.8 1.1
43 Office and Administrative Support Occupations M/L 0.2 0.6 1.0
45 Farming, Fishing, and Forestry Occupations M/L 1.3 2.8 0.9
47 Construction and Extraction Occupations M/L 1.8 1.3 0.7
49 Installation, Maintenance, and Repair Occupations M/L 0.7 0.5 0.9
51 Production Occupations M/L 1.7 1.0 0.8
53 Transportation and Material Moving Occupations M/L 2.7 0.9 0.9
Occupations (2010 SOC Classification)
Ratio of employment shares
Average
annual
growth (%)
DELSA/ELSA/WD/SEM(2018)4 │ 29
For Official Use
Figure 9. Contribution of recent immigrants and young entrants to labour force growth by
occupation (%), United States, 2010-2015
Note: The contribution of young entrants and recent immigrants is calculated as share of the 2011 labour
force.
Source: American Community Survey.
Conclusion
Across the OECD, the last decades have been characterised by deep changes in the
structure of the labour market, both in terms of educational attainments and occupational
composition. Thanks to the increasing educational levels of new of new generations
entering the labour market and the retirement of less educated cohorts there has been an
overall shift towards a more educated labour force.
Immigrants have had an impact on those changes as their presence in the labour market
has increased over the last decade. Today they represent around one in eight workers
across Europe. Their characteristics vary significantly across countries, but a common
feature in both Europe and in the United States is that they are generally less educated
than young entrants of natives but more educated than recent retirees. Within Europe,
immigrants from the EU generally have higher levels of education than those coming
from third countries. In Australia, because of the highly selective nature of immigration
policies, immigrants tend to be more educated than the young entrants.
Both the improvements of educational attainments and the replacement of old cohorts by
new more qualified cohorts have had an impact on the occupational composition of the
labour force which is characterised by a stronger growth of medium and highly skilled
occupations. In particular, thanks to their skills, young entrants in the labour force tend to
be employed in occupations different from those left by recent retirees. In other words,
these two groups are not in competition on the labour market.
0 5 10 15 20 25
Management Occupations
Building and Grounds Cleaning and Maintenance Occupations
Construction and Extraction Occupations
Installation, Maintenance, and Repair Occupations
Protective Service Occupations
Office and Administrative Support Occupations
Production Occupations
Transportation and Material Moving Occupations
Healthcare Support Occupations
Sales and Related Occupations
Personal Care and Service Occupations
Community and Social Services Occupations
Education, Training, and Library Occupations
Business and Financial Operations Occupations
Farming, Fishing, and Forestry Occupations
Healthcare Practitioners and Technical Occupations
Architecture and Engineering Occupations
Legal Occupations
Arts, Design, Entertainment, Sports, and Media Occupations
Computer and Mathematical Occupations
Food Preparation and Serving Related Occupations
Life, Physical, and Social Science Occupations
Recent immigrants Young entrants
30 │ DELSA/ELSA/WD/SEM(2018)4
For Official Use
When compared to the overall labour force, recent migrants tend to be overrepresented in
a number of low skilled occupations where they often work below their qualifications.
More attention should therefore be given to reducing skills mismatch for immigrants,
especially those coming from non-EU countries. The situation is different in the United
States, where both young entrants and recent migrants are well represented in three
important high-skilled occupations (Computer and mathematical occupations; life,
physical, and social Science occupations; architecture and engineering occupations)
meaning that both groups play a key role in enhancing the skills levels of the workforce.
While new entrants in the labour force – both young entrants and recent migrants from
the EU and from third countries – see a similar share of employment in fast growing
occupations, recent migrants have higher shares of employment in declining occupations.
In addition, the contribution to labour force growth varies across groups of migrants, with
EU migrants having contributed most that non-EU migrants to employment growth in
most occupations. This is probably related to their more heterogeneous composition,
which is influenced by a number of factors including countries of origin, migration
motives and host country policies. In the case of the United States, in comparison to
young entrants, new migrants have lower shares of employment in both declining and
growing occupations.
DELSA/ELSA/WD/SEM(2018)4 │ 31
For Official Use
References
Arslan, C. et al. (2015), “A New Profile of Migrants in the Aftermath of the Recent Economic
Crisis”, OECD Social, Employment and Migration Working Papers, No. 160, OECD
Publishing, Paris, http://dx.doi.org/10.1787/5jxt2t3nnjr5-en.
[22]
Autor, D. and D. Dorn (2013), “The growth of low-skill service jobs and the polarization of the
US labor market”, American Economic Review, Vol. 103/5, pp. 1553-1597,
http://dx.doi.org/10.1257/aer.103.5.1553.
[19]
Bloom, D., D. Canning and G. Fink (2010), “Implications of population ageing for economic
growth”, Oxford Review of Economic Policy, Vol. 26/4, pp. 583-612,
http://dx.doi.org/10.1093/oxrep/grq038.
[4]
Borsch-Supan, A. (2003), “Labor market effects of population aging”, Labour, Vol. 17, pp. 5-
44, http://dx.doi.org/10.1111/1467-9914.17.specialissue.2.
[11]
Busemeyer, M., A. Goerres and S. Weschle (2009), “Attitudes towards redistributive spending
in an era of demographic ageing: the rival pressures from age and income in 14 OECD
countries”, Journal of European Social Policy, Vol. 19/3, pp. 195-212,
http://dx.doi.org/10.1177/0958928709104736.
[8]
Cedefop (2016), “Future skill needs in Europe: Critical labour force trends”, Cedefop research
paper, No. 59, Cedefop.
[21]
Coleman, D. (2008), “The demographic effects of international migration in Europe”, Oxford
Review of Economic Policy, Vol. 24/3, pp. 452-476, http://dx.doi.org/10.1093/oxrep/grn027.
[17]
Colombo, F. et al. (2011), Help Wanted?: Providing and Paying for Long-Term Care, OECD
Publishing, Paris, http://dx.doi.org/10.1787/9789264097759-en.
[6]
Eichhorst, W. et al. (2014), “How to combine the entry of young people in the labour market
with the retention of older workers?”, IZA Journal of European Labor Studies, Vol. 3/1,
p. 19, http://dx.doi.org/10.1186/2193-9012-3-19.
[24]
European Commission (2017), 2016 Annual Report on Intra-EU Labour Mobility, Directorate-
General for Employment, Social Affairs and Inclusion.
[15]
European Commission (2017), Employment and Social Developments in Europe 2017,
Directorate-General for Employment, Social Affairs and Inclusion.
[10]
European Commission (2016), Employment and Social Developments in Europe 2015,
Directorate-General for Employment, Social Affairs and Inclusion.
[18]
European Commission (2016), European Economic Forecast: Autumn 2016, Directorate-
General for Economic and Financial Affairs.
[13]
European Commission (2015), The 2015 Ageing Report: Economic and budgetary projections
for the 28 EU Member States (2013-2060), Directorate-General for Economic and Financial
Affairs.
[1]
European Commission (2015), The 2015 Pension Adequacy Report: Current and future income
adequacy in old age in the EU, Directorate-General for Employment, Social Affairs and
Inclusion.
[9]
32 │ DELSA/ELSA/WD/SEM(2018)4
For Official Use
Goos, M., A. Manning and A. Salomons (2009), “Job polarization in Europe”, American
Economic Review, Vol. 99/2, pp. 58-63, http://dx.doi.org/10.1257/aer.99.2.58.
[20]
Harper, S. (2014), “Economic and social implications of aging societies.”, Science,
Vol. 346/6209, pp. 587-91, http://dx.doi.org/10.1126/science.1254405.
[5]
Institute for Public Policy Research (2014), European jobs and skills: A comprehensive review,
2014.
[25]
Munnell, A. and A. Wu (2013), “Do older workers squeeze out younger workers?”, Working
Paper, No. 13-011, SIEPR.
[26]
OECD (2016), OECD Employment Outlook 2016, OECD Publishing, Paris,
http://dx.doi.org/10.1787/empl_outlook-2016-en.
[12]
OECD (2016), OECD Pensions Outlook 2016, OECD Publishing, Paris,
http://dx.doi.org/10.1787/pens_outlook-2016-en.
[7]
OECD (2006), Live Longer, Work Longer, OECD Publishing, Paris,
http://dx.doi.org/10.1787/9789264035881-en.
[2]
OECD/EU (2015), Indicators of Immigrant Integration 2015: Settling In, OECD Publishing,
Paris, http://dx.doi.org/10.1787/9789264234024-en.
[23]
OECD/EU (2014), Matching Economic Migration with Labour Market Needs, OECD
Publishing, Paris, http://dx.doi.org/10.1787/9789264216501-en.
[14]
United Nations (2015), World Population Ageing 2015, Department of Economic and Social
Affairs, Population Division.
[3]
United Nations (2000), Replacement Migration: Is It a Solution to Declining and Ageing
Populations?, Department of Economic and Social Affairs, Population Division.
[16]
DELSA/ELSA/WD/SEM(2018)4 │ 33
For Official Use
Appendix 1: Methodology
Over the last decades, the labour market structure of OECD countries has seen significant
changes, not only in terms of its size but also in its composition. With the retirement of
the baby-boom generation and the entrance of new more educated cohorts into the labour
force, there was an overall increase of the educational attainment and consequently a fast
growth of skilled occupations and a sharp decline of a number of low skilled occupations.
In addition to the young and old generations, recent migration flows played a role in
shaping the labour force with significant differences existing across countries.
The main objective of the Migration-Demography (Mig-Dem) project is to evaluate the
contribution of migration to the dynamics of the labour market in EU and OECD
countries by analysing both the historical role of migration and to project its role forward
for the next five to ten years.
Structure of the project
The development of the Mig-Dem database consists of two phases:
(1) In the first phase, the project examines how the labour force has evolved over the
past ten years. Changes in the labour force can come from the entry of young workers, the
retirement of old workers, the arrival of recent immigrants, and various changes in status
of those in the ‘prime working-age’ group. Our analysis decomposes changes into these
four groups. This exercise represents both an update and an improvement of previous
OECD-EU work (OECD/EU, 2014). For European countries, the project investigates
differences in labour force dynamics between immigrants from EU vs. third countries,
when data is available.
(2) In the second phase, the project looks at labour force dynamics in the future. This
examines the labour supply by presenting a range of alternative scenarios for future
migration flows by age, sex and education level.
A specific investigation into how immigrants have affected the labour market underlies
the Mig-Dem project. Questions that the database will help answer include, among
others:
How do migrants affect the size and composition of the labour force?
Does migration help counterbalance demographic change?
Do migrants enter jobs that native-born leave or do they also enter growing
occupations?
Country coverage and data sources
This analysis is performed for 25 EU countries11
as well as Iceland, Norway, and
Switzerland (EFTA countries) and selected other OECD countries (Australia and the
United States) for which sufficient data is available. Data for the EU and EFTA countries
come from the European Union Labour Force Survey (EU-LFS); Australian data come
from the Work and Education Survey (WES); and data for the United States come from
the American Community Survey (ACS).
11
Austria, Belgium, Bulgaria, Czech Republic, Denmark, Estonia, Finland, France, Germany,
Greece, Hungary, Ireland, Italy, Latvia, Lithuania, Luxembourg, Netherlands, Poland, Portugal,
Romania, Slovak Republic, Slovenia, Spain, Sweden, United Kingdom.
34 │ DELSA/ELSA/WD/SEM(2018)4
For Official Use
In order to avoid issues related to the different incidence of missing data across countries
in the EU LFS and to calculate the demographic groups in a more robust way, data
imputation was conducted for some variables, including migration status, duration of
stay, current education status, year of education completion, year of exit from the labour
force and highest educational attainment. Imputations are carried out for a limited number
of observations, less than 1% in most cases. Imputation models are based on observed
individual characteristics - such as gender, age and education – as well as their
interactions to estimate values for missing observations.
Due to data limitations with small sample sizes not exceeding reporting thresholds,
certain analyses cannot be performed for every individual country within the EU and
must be undertaken at the EU-wide level. This clearly hides differences between
countries. For example, there are clear differences in migration patterns across countries,
with Western and Northern European countries generally being net recipients of
immigrants while Eastern European countries being net senders of emigrants.
In addition, when sample sizes allow it, a distinction is made for European Union
countries between immigrants born in the EU and those born outside the EU.
Age is presented as a disaggregated variable in some data sources, while in others –
notably the EU-LFS – it is aggregated into 5-year groups. This will not be problematic in
most cases except in some methods of identifying retirees, where knowing an individual’s
exact age in relation to the official or average retirement age is important for accuracy.
Education is also classified differently across the different surveys. For consistency, we
consider three educational levels: the low-educated (with less than upper secondary
attainment, corresponding to ISCED levels 0, 1, and 2), the medium-educated (with upper
secondary attainment but not tertiary attainment, corresponding to ISCED levels 3 and 4);
and the highly-educated (with tertiary attainment, corresponding to ISCED levels 5, 6, 7,
and 8).
On the other hand, the classification of occupations has not been standardised across
surveys due to a lack of exact correspondences. Separate tables and charts are therefore
presented for the EU and the other countries analysed in this project.
Finally, several countries have recently changed how they report their data. Between the
2010 and the 2011 survey, the coding of occupations in the EU-LFS was changed from
ISCO-88 to the more recent ISCO-08. Since the correspondence between the two
classifications is not feasible for all occupations, recent data on occupations cannot be
compared to those prior to 2011.
The contribution of migration to past labour market dynamics
For each country, changes in the labour force over time can be decomposed into the
following components, each of which will be described in further detail below:
Recent immigrants who have entered the labour force,
Young entrants who have just entered the labour force,
Recent retirees who have left the labour force,
Other residual changes among the rest of the population, the so-called ‘prime age’
labour force, which may include death, emigration and return migration,
temporary exits, and returns to the labour force.
These four components can be related to the overall change by the following equation:
DELSA/ELSA/WD/SEM(2018)4 │ 35
For Official Use
Change in the labour force = recent immigrants + young entrants – recent retirees +
(net) changes in the prime-age group
Moreover, this equation can also be applied to any subset of the labour force, such as the
high-educated or those who work in any specific occupation or sector.
The Mig-Dem database examines the role of each of these components to the evolution of
the labour force between 2005 and 2015. Different options exist to compute these
components using available data, each having specific advantages and drawbacks. These
alternatives are considered in the next sections, with detailed explanations on the choices
made for this study.
Recent immigrants
Recent immigrants are those who have entered the country between 2005 and 2015. More
precisely, they are identified as those:
who were not born in the host country, and
whose most recent continuous stay in the host country is less than 10 years long.
As this database specifically investigates the demographics of the labour force, only new
immigrants in the labour force (either employed or unemployed) are included12
.
Moreover, as this database also investigates the dynamics of the labour force, only the
flow of immigrants is relevant, not the stock of immigrants present in the country. In
other words, this work examines the impact of the process of immigration on the
dynamics of the labour force, not the impact of migrants as a whole. Long-standing
migrants with over ten years of residency in the host country are considered as part of the
long-standing workforce. Indeed, they are included in the other three components of the
above equation – either as new entrants, recent retirees, or as residual changes in the
prime-age group.
As indicated above, immigrants who arrived before 2005 are not included as they do not
represent a change in the population – they were already present in the host country.
However, immigrants might require some time to establish themselves in their host
country and only first enter the labour force several years after they arrive. In this
situation, where an immigrant arriving before 2005 first enters the labour force after
2005, he would not be included in the “new immigrants” group but rather included in the
“other changes/prime-age group.”
Note also that in most cases, immigrants who arrived as children will never be classified
as ‘new immigrants’ as they will not start to work until more than 10 years after their
arrival. In particular, those who arrive between the ages of 0 and 4 will never be
considered ‘new’ because the labour force only potentially includes those aged 15 and
older. This is not problematic when one remembers that it is not the effect of all
immigration on the demographics of the labour force that is investigated here but only the
effect of recent immigration. In order not to double count recent immigrants and to
highlight the role of migration in labour market dynamics, being a recent immigrant takes
priority over being a new entrant.
12
This definition also includes immigrants who may have arrived before 2005, returned to their
home country or moved somewhere else also before 2005, and then returned again after 2005 –
while these may conceptually not be ‘new’ immigrants, they are ‘new’ when compared to the
population in 2005.
36 │ DELSA/ELSA/WD/SEM(2018)4
For Official Use
Another way to count the number of new immigrants is through entry permits. This
method, though, does not provide additional micro-level information on immigrants, such
as their educational background and more importantly, whether they are actually in the
labour force. Furthermore, most immigrants do not arrive as labour migrants but through
family reunification or refugee channels, and a large share of these immigrants enters
later the labour force. As a result, the use of population surveys to identify those who are
indeed in the labour force is preferred.
Young entrants
Young entrants are young people who are entering the labour force for the first time in the
period of analysis. In this project new entrants are defined as those who, in 2015:
are aged between 15 and 34,
have obtained their highest degree in the last ten years,
are in the labour force,
are no longer studying, and
are not recent immigrants.
The definition of new entrants does not capture the generally lower-skilled and part-time
jobs held by the young who are still in education. The omission of such jobs is preferable
to their inclusion as they are temporary by nature and do not reflect the actual entry of
graduates into the labour force. In most cases, graduates will enter jobs that better reflect
the occupation for which they have studied, which will also be at a higher level to their
student jobs. Indeed, including student jobs among new entrants would understate the
number of tertiary graduates and overstate the number of entrants with only secondary
education, leading to a level of ‘upskilling’ in younger generations that is biased
downwards.
Apprentices and interns are treated in the same manner as students even though they may
be working full-time when the survey is conducted. These jobs are more likely to be
aligned with participants’ future jobs than part-time jobs, and such students will generally
graduate and enter similar jobs in the near future. However, since they have not graduated
yet, they are not counted as ‘new entrants’.
Before choosing this approach to define new entrants, a number of tests have been
conducted; a short explanation is presented below:
1. In previous OECD-EU work, they were identified as all individuals between 15
and 24 years of age, since they could not have been part of the labour force 10
years before. However, many individuals in this age group have not yet completed
their education and not yet joined the labour force. Moreover, those who work in
conjunction with their studies often do so in temporary jobs that do not reflect the
jobs they will hold after graduating.
2. A similar approach defines new entrants by age, including those from 15 to 24
who are no longer in education. As mentioned above, the majority of youth in the
OECD area have not yet completed their education by this age. Also, most of the
15 to 24 cohort would not have their education levels correctly captured by this
purely age-based definition and a large proportion would not have begun to work
yet and would not be included in the labour force. The size of the entering cohort
would be underestimated.
3. The last approach compares the cohort of individuals aged 15-29 who are not
recent immigrants and who are in the labour force in 2015 and the 15-19 cohort
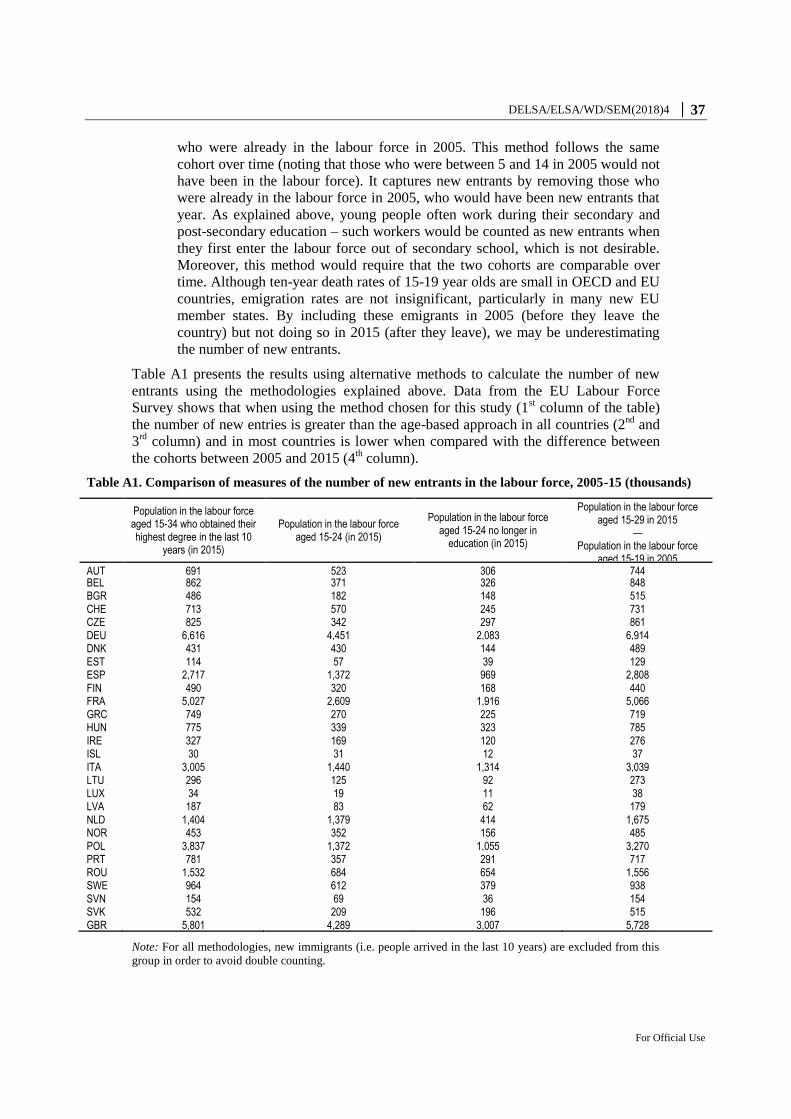
DELSA/ELSA/WD/SEM(2018)4 │ 37
For Official Use
who were already in the labour force in 2005. This method follows the same
cohort over time (noting that those who were between 5 and 14 in 2005 would not
have been in the labour force). It captures new entrants by removing those who
were already in the labour force in 2005, who would have been new entrants that
year. As explained above, young people often work during their secondary and
post-secondary education – such workers would be counted as new entrants when
they first enter the labour force out of secondary school, which is not desirable.
Moreover, this method would require that the two cohorts are comparable over
time. Although ten-year death rates of 15-19 year olds are small in OECD and EU
countries, emigration rates are not insignificant, particularly in many new EU
member states. By including these emigrants in 2005 (before they leave the
country) but not doing so in 2015 (after they leave), we may be underestimating
the number of new entrants.
Table A1 presents the results using alternative methods to calculate the number of new
entrants using the methodologies explained above. Data from the EU Labour Force
Survey shows that when using the method chosen for this study (1st column of the table)
the number of new entries is greater than the age-based approach in all countries (2nd
and
3rd
column) and in most countries is lower when compared with the difference between
the cohorts between 2005 and 2015 (4th column).
Table A1. Comparison of measures of the number of new entrants in the labour force, 2005-15 (thousands)
Population in the labour force aged 15-34 who obtained their highest degree in the last 10
years (in 2015)
Population in the labour force aged 15-24 (in 2015)
Population in the labour force aged 15-24 no longer in
education (in 2015)
Population in the labour force aged 15-29 in 2015
— Population in the labour force
aged 15-19 in 2005 AUT 691 523 306 744 BEL 862 371 326 848 BGR 486 182 148 515 CHE 713 570 245 731 CZE 825 342 297 861 DEU 6,616 4,451 2,083 6,914 DNK 431 430 144 489 EST 114 57 39 129 ESP 2,717 1,372 969 2,808 FIN 490 320 168 440 FRA 5,027 2,609 1,916 5,066 GRC 749 270 225 719 HUN 775 339 323 785 IRE 327 169 120 276 ISL 30 31 12 37 ITA 3,005 1,440 1,314 3,039 LTU 296 125 92 273 LUX 34 19 11 38 LVA 187 83 62 179 NLD 1,404 1,379 414 1,675 NOR 453 352 156 485 POL 3,837 1,372 1,055 3,270 PRT 781 357 291 717 ROU 1,532 684 654 1,556 SWE 964 612 379 938 SVN 154 69 36 154 SVK 532 209 196 515 GBR 5,801 4,289 3,007 5,728
Note: For all methodologies, new immigrants (i.e. people arrived in the last 10 years) are excluded from this
group in order to avoid double counting.
38 │ DELSA/ELSA/WD/SEM(2018)4
For Official Use
Recent retirees
Retirees are those older people who have left the labour force and will not return in the
future. According to data availability, in this study two different ways of identifying
recent retirees have been used. For European countries and the United States they are
defined as people who, in 2015:
are aged between 60 and 74,
are no longer in the labour force,
have worked in the past ten years.
For Australia the definition of recent retirees is only based on the first two variables as no
information was available about the year of exit from the labour force.
Before choosing this approach for measuring recent retirees, several tests have been
conducted. They will be detailed below highlighting their pros and cons.
4. Past OECD-EU work identified recent retirees as the labour force cohort that was
aged between 55 and 64 in 2005 and is aged between 65 and 74 in 2015. Recent
OECD data shows that across OECD and EU countries people do not exactly
retire at 65. Tables A3 and A4 in Annex 2 show the effective retirement age.
These ages have often decreased over time (but are likely to increase in the future
in many countries due to longer life expectancies and smaller working-age
cohorts) and differ markedly between men and women. Moreover, the effective
retirement age is also affected by the type of occupation the workers have (e.g.
strenuous and dangerous jobs). This method identifies as retired those who are
still working, ignores those who retired before the age of 65, and does not take
country and gender differences in retirement age into account. Moreover, it
includes people as ‘new retirees’ who are, for instance, 71 now but retired at the
age of 60, more than ten years ago. It is not clear whether these effects mitigate
each other.
5. A second approach is based on the definition of new retirees as those who self-
declare as being retired (i.e. not those who are still working past 65) but this
definition does not assess whether the person was in the labour force before and
hence may overestimate the retiring cohort.
6. One can also take the difference between the retired population aged 65-74 in
2015 and the population aged 55-64 who were already retired in 2005. This
method follows the same age cohort over time and extracts the number of ‘new’
retirees. It also does not take national and gender differences in retirement age
into account. For instance, this method would show that apparently no people
retired in a country where everyone retired before the age of 65 and undercount
the number of new retirees in a country where the average retirement age is less
than 65.
7. Another approach considers the average retirement age for each country and each
gender. For example, if the average retirement age in a country is 60 for men and
58 for women, new retirees will be men aged 60-69 and women aged 58-67 who
have retired since 2005. This method, using ‘refined’ ages, still ignores individual
variation in retirement age. Being an average, a non-negligible portion of the
retiring population will retire before this age and thus not be counted among new
retirees. However, in practice, using refined ages might not differ from using the
standard age of 65 as ages are reported in the EU Labour Force Survey in five-
year intervals.
DELSA/ELSA/WD/SEM(2018)4 │ 39
For Official Use
8. A similar approach looks at those who self-declare as being retired and are aged
between the average retirement age and the average retirement age plus 9.
9. Similarly to the approach proposed to calculate new entrants, to account for
individual variation in retirement ages, one can subtract the retired population
over 55 years of age in 2005 from the retired population over 65 years of age in
2015. This would follow the same cohort over time and show the number of
‘new’ retirees in the ten year period of interest. Mortality rates must be taken into
account and are particularly important as they are non-negligible for the older
population (compared to the working-age or entering cohorts). Mathematically,
this corresponds to the following equation:
New retirees in 2015 aged 65 and above = Retirees in 2015 aged 65 and above –
(Retirees in 2005 aged 55 and above × 10-year survival rate for each age group above 55)
Table A2 shows the number of recent retirees from the labour force in EU countries, as
measured by the alternative methods described above.
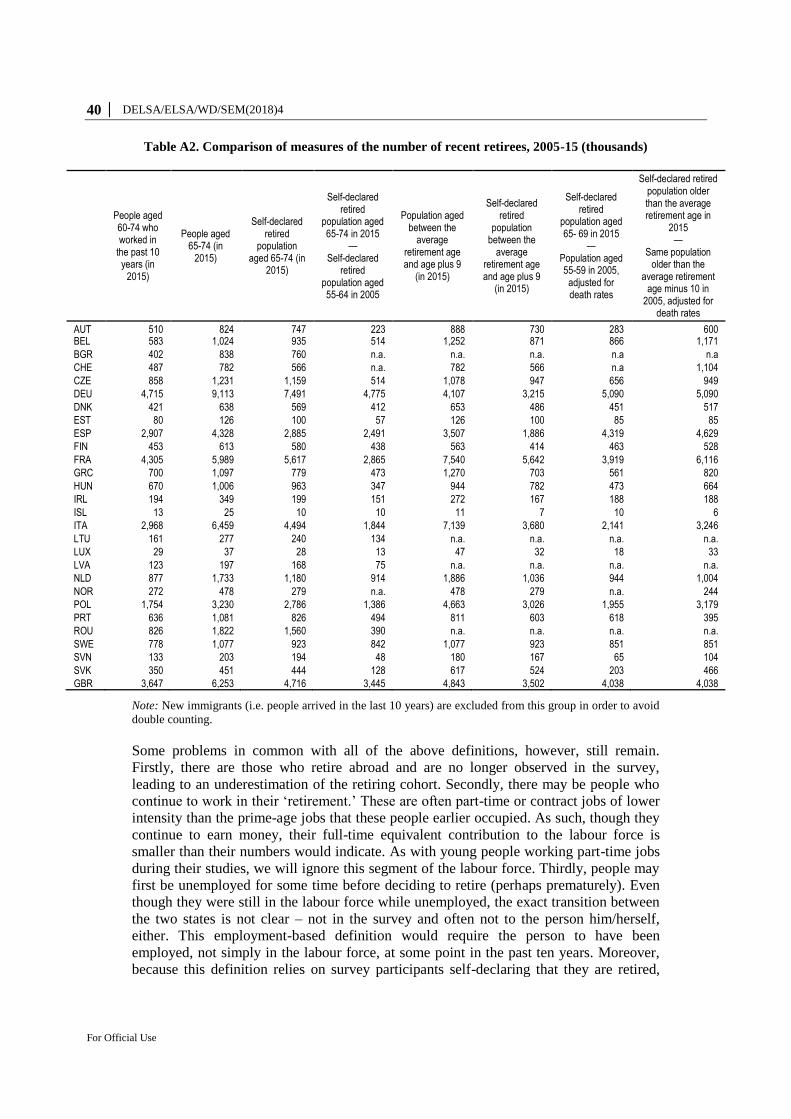
40 │ DELSA/ELSA/WD/SEM(2018)4
For Official Use
Table A2. Comparison of measures of the number of recent retirees, 2005-15 (thousands)
People aged 60-74 who worked in
the past 10 years (in
2015)
People aged 65-74 (in
2015)
Self-declared retired
population aged 65-74 (in
2015)
Self-declared retired
population aged 65-74 in 2015
— Self-declared
retired population aged 55-64 in 2005
Population aged between the
average retirement age and age plus 9
(in 2015)
Self-declared retired
population between the
average retirement age and age plus 9
(in 2015)
Self-declared retired
population aged 65- 69 in 2015
— Population aged 55-59 in 2005,
adjusted for death rates
Self-declared retired population older than the average retirement age in
2015 —
Same population older than the
average retirement age minus 10 in
2005, adjusted for death rates
AUT 510 824 747 223 888 730 283 600 BEL 583 1,024 935 514 1,252 871 866 1,171
BGR 402 838 760 n.a. n.a. n.a. n.a n.a
CHE 487 782 566 n.a. 782 566 n.a 1,104
CZE 858 1,231 1,159 514 1,078 947 656 949
DEU 4,715 9,113 7,491 4,775 4,107 3,215 5,090 5,090
DNK 421 638 569 412 653 486 451 517
EST 80 126 100 57 126 100 85 85
ESP 2,907 4,328 2,885 2,491 3,507 1,886 4,319 4,629
FIN 453 613 580 438 563 414 463 528
FRA 4,305 5,989 5,617 2,865 7,540 5,642 3,919 6,116
GRC 700 1,097 779 473 1,270 703 561 820
HUN 670 1,006 963 347 944 782 473 664
IRL 194 349 199 151 272 167 188 188
ISL 13 25 10 10 11 7 10 6
ITA 2,968 6,459 4,494 1,844 7,139 3,680 2,141 3,246
LTU 161 277 240 134 n.a. n.a. n.a. n.a.
LUX 29 37 28 13 47 32 18 33
LVA 123 197 168 75 n.a. n.a. n.a. n.a.
NLD 877 1,733 1,180 914 1,886 1,036 944 1,004
NOR 272 478 279 n.a. 478 279 n.a. 244
POL 1,754 3,230 2,786 1,386 4,663 3,026 1,955 3,179
PRT 636 1,081 826 494 811 603 618 395
ROU 826 1,822 1,560 390 n.a. n.a. n.a. n.a.
SWE 778 1,077 923 842 1,077 923 851 851
SVN 133 203 194 48 180 167 65 104
SVK 350 451 444 128 617 524 203 466
GBR 3,647 6,253 4,716 3,445 4,843 3,502 4,038 4,038
Note: New immigrants (i.e. people arrived in the last 10 years) are excluded from this group in order to avoid
double counting.
Some problems in common with all of the above definitions, however, still remain.
Firstly, there are those who retire abroad and are no longer observed in the survey,
leading to an underestimation of the retiring cohort. Secondly, there may be people who
continue to work in their ‘retirement.’ These are often part-time or contract jobs of lower
intensity than the prime-age jobs that these people earlier occupied. As such, though they
continue to earn money, their full-time equivalent contribution to the labour force is
smaller than their numbers would indicate. As with young people working part-time jobs
during their studies, we will ignore this segment of the labour force. Thirdly, people may
first be unemployed for some time before deciding to retire (perhaps prematurely). Even
though they were still in the labour force while unemployed, the exact transition between
the two states is not clear – not in the survey and often not to the person him/herself,
either. This employment-based definition would require the person to have been
employed, not simply in the labour force, at some point in the past ten years. Moreover,
because this definition relies on survey participants self-declaring that they are retired,
DELSA/ELSA/WD/SEM(2018)4 │ 41
For Official Use
one who was unemployed in 2005 and only considered himself retired sometime after that
would never be counted as a ‘new retiree’ and new retirees would be underestimated. On
the other hand, those who leave the labour force temporarily intending to return later (and
doing so) are, correctly, not included among new retirees until their last and final exit
from the labour force.
Recent immigrants who have retired are not included at all in this analysis. Indeed, they
do not represent a change between 2005 and 2015, as they were not present in the country
in 2005 and are no longer in the workforce in 2015.
Prime age population
Finally, changes in the prime age group are the last component of changes in the labour
force. This can be calculated as a residual through the equation presented above. This
means that defining and measuring recent immigrants, new entrants, and recent retirees
will affect the residual prime-age changes. In addition, this residual will include death,
emigration, return migration, and certain irregular work/education and work/retirement
transitions, in addition to what it is conceptually intended to measure.
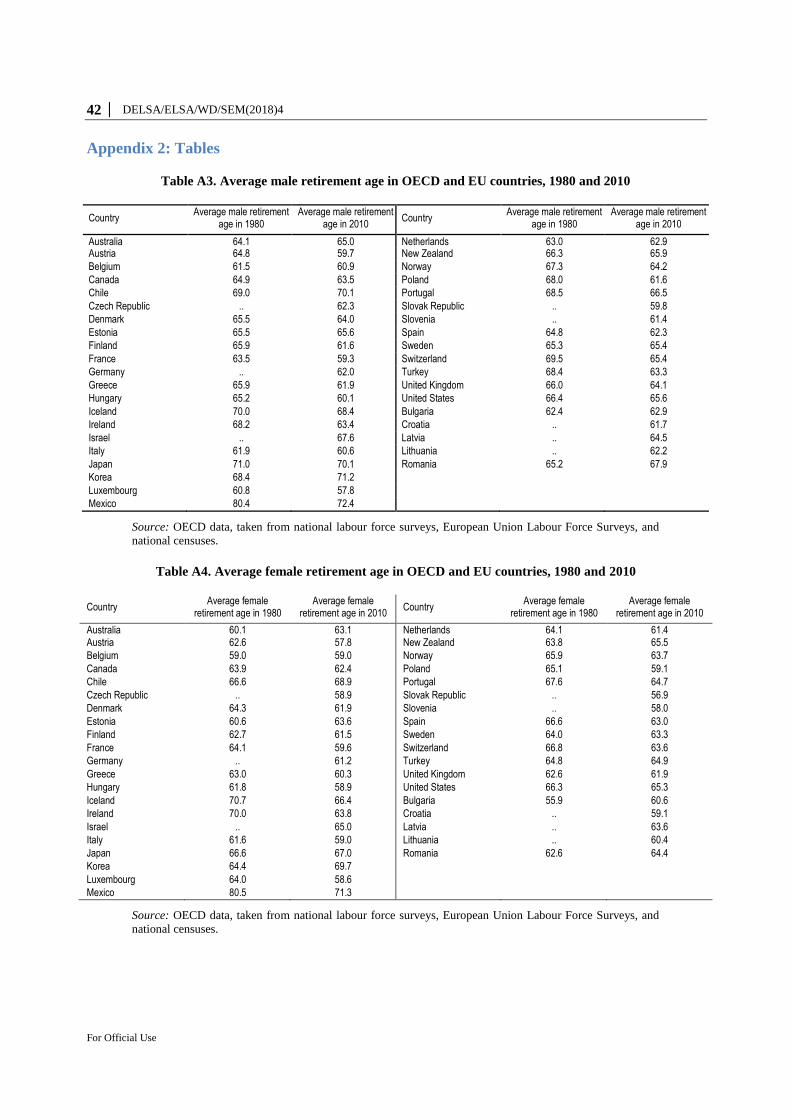
42 │ DELSA/ELSA/WD/SEM(2018)4
For Official Use
Appendix 2: Tables
Table A3. Average male retirement age in OECD and EU countries, 1980 and 2010
Country Average male retirement
age in 1980 Average male retirement
age in 2010 Country
Average male retirement age in 1980
Average male retirement age in 2010
Australia 64.1 65.0 Netherlands 63.0 62.9 Austria 64.8 59.7 New Zealand 66.3 65.9
Belgium 61.5 60.9 Norway 67.3 64.2
Canada 64.9 63.5 Poland 68.0 61.6
Chile 69.0 70.1 Portugal 68.5 66.5
Czech Republic .. 62.3 Slovak Republic .. 59.8
Denmark 65.5 64.0 Slovenia .. 61.4
Estonia 65.5 65.6 Spain 64.8 62.3
Finland 65.9 61.6 Sweden 65.3 65.4
France 63.5 59.3 Switzerland 69.5 65.4
Germany .. 62.0 Turkey 68.4 63.3
Greece 65.9 61.9 United Kingdom 66.0 64.1
Hungary 65.2 60.1 United States 66.4 65.6
Iceland 70.0 68.4 Bulgaria 62.4 62.9
Ireland 68.2 63.4 Croatia .. 61.7
Israel .. 67.6 Latvia .. 64.5
Italy 61.9 60.6 Lithuania .. 62.2
Japan 71.0 70.1 Romania 65.2 67.9
Korea 68.4 71.2
Luxembourg 60.8 57.8
Mexico 80.4 72.4
Source: OECD data, taken from national labour force surveys, European Union Labour Force Surveys, and
national censuses.
Table A4. Average female retirement age in OECD and EU countries, 1980 and 2010
Country Average female
retirement age in 1980 Average female
retirement age in 2010 Country
Average female retirement age in 1980
Average female retirement age in 2010
Australia 60.1 63.1 Netherlands 64.1 61.4 Austria 62.6 57.8 New Zealand 63.8 65.5
Belgium 59.0 59.0 Norway 65.9 63.7
Canada 63.9 62.4 Poland 65.1 59.1
Chile 66.6 68.9 Portugal 67.6 64.7
Czech Republic .. 58.9 Slovak Republic .. 56.9
Denmark 64.3 61.9 Slovenia .. 58.0
Estonia 60.6 63.6 Spain 66.6 63.0
Finland 62.7 61.5 Sweden 64.0 63.3
France 64.1 59.6 Switzerland 66.8 63.6
Germany .. 61.2 Turkey 64.8 64.9
Greece 63.0 60.3 United Kingdom 62.6 61.9
Hungary 61.8 58.9 United States 66.3 65.3
Iceland 70.7 66.4 Bulgaria 55.9 60.6
Ireland 70.0 63.8 Croatia .. 59.1
Israel .. 65.0 Latvia .. 63.6
Italy 61.6 59.0 Lithuania .. 60.4
Japan 66.6 67.0 Romania 62.6 64.4
Korea 64.4 69.7
Luxembourg 64.0 58.6
Mexico 80.5 71.3
Source: OECD data, taken from national labour force surveys, European Union Labour Force Surveys, and
national censuses.