Embed Size (px)
Citation preview

Township of Langley Immigrant Demographics I Page 1
ImmIgranTDemograPhIcs
TOWNSHIP OF LANGLEY, B.C.
- 2018 -
ImmIgranT DemograPhIcs
Township of Langley Immigrant Demographics I Page 2
GLOSSARY OF TERMS:
Census refers to the population Census of Canada, which is taken at five-year intervals and counts
persons and households and a wide variety of characteristics to provide a statistical portrait of the
country.
ToTal populaTion refers to the total population counts in private households of a specific
geographic area, regardless of immigration status.
immigranTs includes persons who are, or who have ever been, landed immigrants or permanent
residents. In the 2016 Census of Population, ‘Immigrants’ includes immigrants who landed in Canada
on or prior to May 10, 2016.
reCenT immigranTs are immigrants who arrived in Canada between January 1, 2011 and May 10,
2016.
meTro VanCouVer comprises 21 municipalities, one electoral district and one First Nation located
in the southwest corner of British Columbia’s mainland. It is bordered by the Strait of Georgia to
the west, the U.S. border to the south, Abbotsford and Mission to the east, and unincorporated
mountainous areas to the north.
noTes:
■ Total population data in each chart or table may vary slightly due to different data sources, i.e.
Census 2016 100% data and 25% sample data; Census 2011 and NHS 2011.
■ Totals in each chart or table may vary slightly due to rounding.
■ Data sources: the following profile has been developed with data and statistics from Stats
Canada Census 2016, Census 2011 and National Household Survey (NHS) 2011, and Census 2006
Profiles.
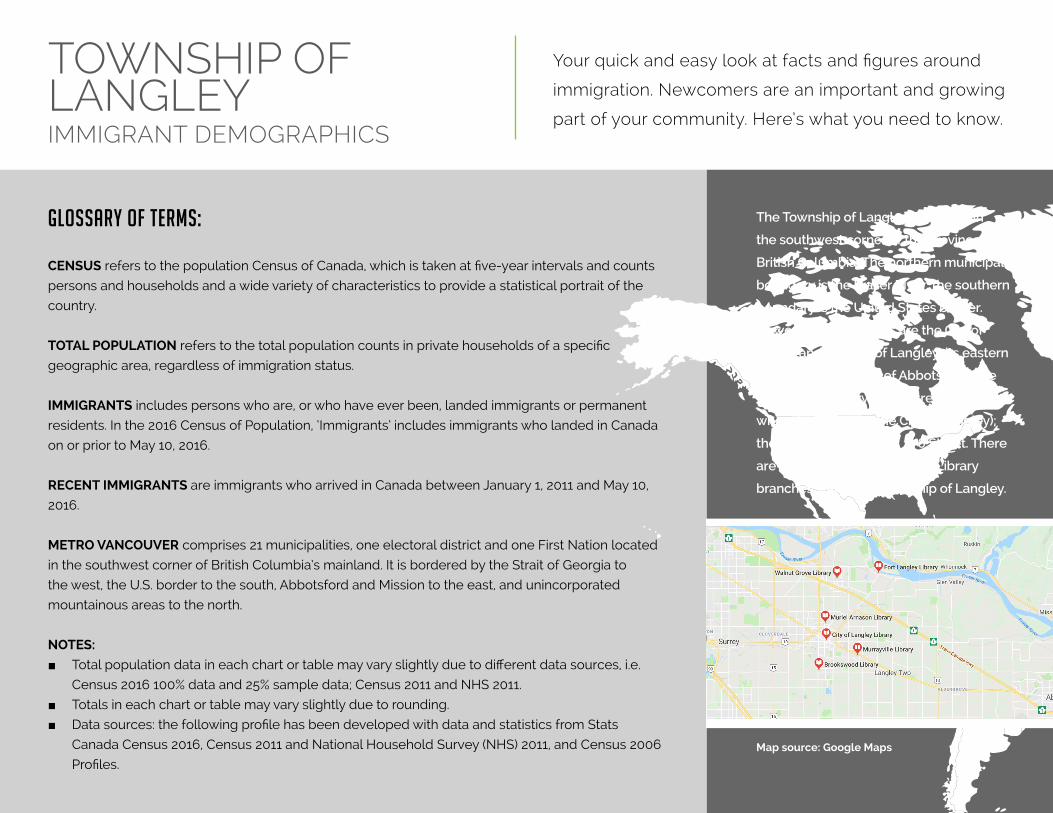
The Township of Langley is located in
the southwest corner of the province of
British Columbia. The northern municipal
boundary is the Fraser River; the southern
boundary is the United States border.
Its western neighbours are the City of
Surrey and the City of Langley; its eastern
neighbour is the City of Abbotsford. The
western boundary is 196 Street (except
where bordered by the City of Langley);
the eastern boundary is 276 Street. There
are six Fraser Valley Regional Library
branches within the Township of Langley.
map source: google maps
Your quick and easy look at facts and figures around
immigration. newcomers are an important and growing
part of your community. here’s what you need to know.
ToWnshIP oFLangLeYImmIgranT DemograPhIcs
Township of Langley Immigrant Demographics I Page 3
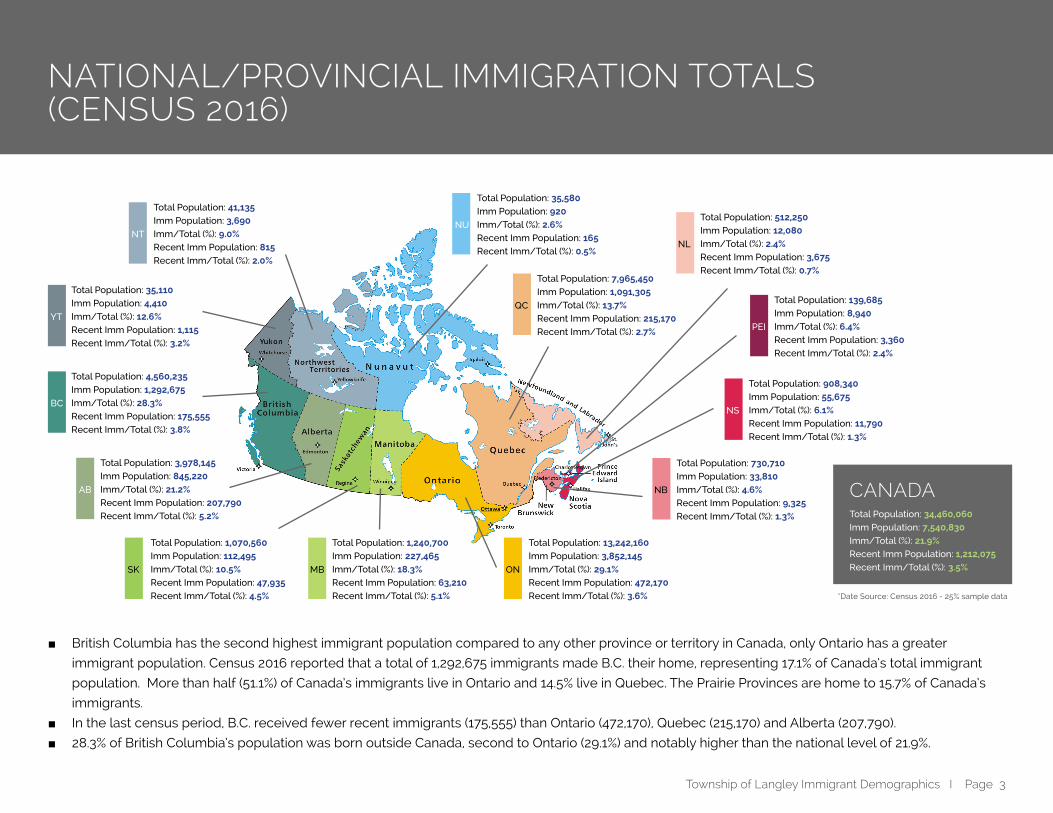
■ British Columbia has the second highest immigrant population compared to any other province or territory in Canada, only Ontario has a greater
immigrant population. Census 2016 reported that a total of 1,292,675 immigrants made B.C. their home, representing 17.1% of Canada’s total immigrant
population. More than half (51.1%) of Canada’s immigrants live in Ontario and 14.5% live in Quebec. The Prairie Provinces are home to 15.7% of Canada’s
immigrants.
■ In the last census period, B.C. received fewer recent immigrants (175,555) than Ontario (472,170), Quebec (215,170) and Alberta (207,790).
■ 28.3% of British Columbia’s population was born outside Canada, second to Ontario (29.1%) and notably higher than the national level of 21.9%.
naTIonaL/ProvIncIaL ImmIgraTIon ToTaLs(census 2016)
Total Population: 4,560,235Imm Population: 1,292,675Imm/Total (%): 28.3%Recent Imm Population: 175,555Recent Imm/Total (%): 3.8%
Total Population: 35,110Imm Population: 4,410Imm/Total (%): 12.6%Recent Imm Population: 1,115Recent Imm/Total (%): 3.2%
Total Population: 3,978,145Imm Population: 845,220Imm/Total (%): 21.2%Recent Imm Population: 207,790Recent Imm/Total (%): 5.2%
Total Population: 1,070,560Imm Population: 112,495Imm/Total (%): 10.5%Recent Imm Population: 47,935Recent Imm/Total (%): 4.5%
BC
AB
SK
Total Population: 1,240,700Imm Population: 227,465Imm/Total (%): 18.3%Recent Imm Population: 63,210Recent Imm/Total (%): 5.1%
MB
YT
Total Population: 41,135Imm Population: 3,690Imm/Total (%): 9.0%Recent Imm Population: 815Recent Imm/Total (%): 2.0%
NT
Total Population: 35,580Imm Population: 920Imm/Total (%): 2.6%Recent Imm Population: 165Recent Imm/Total (%): 0.5%
NU
Total Population: 730,710Imm Population: 33,810Imm/Total (%): 4.6%Recent Imm Population: 9,325Recent Imm/Total (%): 1.3%
NB
Total Population: 7,965,450Imm Population: 1,091,305Imm/Total (%): 13.7%Recent Imm Population: 215,170Recent Imm/Total (%): 2.7%
QC
Total Population: 512,250Imm Population: 12,080Imm/Total (%): 2.4%Recent Imm Population: 3,675Recent Imm/Total (%): 0.7%
NL
Total Population: 139,685Imm Population: 8,940Imm/Total (%): 6.4%Recent Imm Population: 3,360Recent Imm/Total (%): 2.4%
PEI
Total Population: 908,340Imm Population: 55,675Imm/Total (%): 6.1%Recent Imm Population: 11,790Recent Imm/Total (%): 1.3%
NS
Total Population: 13,242,160Imm Population: 3,852,145Imm/Total (%): 29.1%Recent Imm Population: 472,170Recent Imm/Total (%): 3.6%
ON
Total Population: 34,460,060Imm Population: 7,540,830Imm/Total (%): 21.9%Recent Imm Population: 1,212,075Recent Imm/Total (%): 3.5%
canaDa
*Date Source: Census 2016 - 25% sample data
Township of Langley Immigrant Demographics I Page 4
Note: Table ordered by number of total immigrants.
* Data Source: Census 2016 - 25% sample data; NHS 2011
PoPuLaTIon anD ImmIgraTIon – maInLanD / souThWesT Bc (census 2016 anD nhs 2011)
CommuniTY ToTal populaTion2016
ToTal pop. groWTH (%) 2011-2016
immpopulaTion2016
imm/ToTal (%) 2016
reCenT imm populaTion 2016
reCenT imm / ToTal (%) 2016
imm pop groWTH (#) 2011 - 2016
imm pop groWTH (%) 2011 - 2016
British Columbia 4,560,235 5.6% 1,292,675 28.3% 175,555 3.8% 100,800 8.5%
Metro Vancouver 2,426,235 6.5% 989,540 40.8% 142,530 5.9% 76,230 8.3%
Vancouver 618,210 4.6% 262,770 42.5% 37,330 6.0% 4,020 1.6%
Surrey 511,545 10.6% 220,155 43.0% 36,335 7.1% 32,310 17.2%
Richmond 196,665 4.1% 118,305 60.2% 15,245 7.8% 5,430 4.8%
Burnaby 230,080 4.3% 115,145 50.0% 16,065 7.0% 3,970 3.6%
Coquitlam 138,090 9.8% 61,060 44.2% 9,530 6.9% 8,980 17.2%
Abbotsford 138,555 5.9% 38,225 27.6% 5,440 3.9% 4,290 12.6%
Delta 100,840 2.4% 31,240 31.0% 3,355 3.3% 2,720 9.5%
North Vancouver, District 84,875 1.8% 26,505 31.2% 3,240 3.8% 1,535 6.1%
New Westminster 69,905 7.6% 24,375 34.9% 3,500 5.0% 2,635 12.1%
langley Township 115,835 12.6% 22,495 19.4% 2,615 2.3% 3,980 21.5%
North Vancouver, City 52,185 9.8% 19,930 38.2% 3,740 7.2% 2,170 12.2%
West Vancouver, District 41,680 -0.5% 18,615 44.7% 2,940 7.1% 1,485 8.7%
Port Coquitlam 57,900 4.7% 18,430 31.8% 1,940 3.4% 2,050 12.5%
Maple Ridge 80,975 8.2% 15,460 19.1% 1,520 1.9% 2,530 19.6%
Chilliwack 82,210 7.5% 10,985 13.4% 1,070 1.3% 1,335 13.8%
Port Moody 33,450 1.6% 10,755 32.2% 1,220 3.6% 365 3.5%
Langley, City 25,315 3.2% 4,395 17.4% 525 2.0% 590 15.5%
White Rock 19,120 3.2% 4,895 25.6% 535 2.7% 360 7.9%
Pitt Meadows 18,425 4.7% 3,955 21.5% 385 2.1% -35 -0.9%
Township of Langley Immigrant Demographics I Page 5
■ The Township of Langley is one of the most populous municipalities in the Metro Vancouver Region. In 2016, the Township of Langley had 115,835
residents, representing 4.8% of Metro Vancouver’s total population.
■ The Township had a relatively small share of Metro Vancouver’s immigrant population. In 2016, 19.4% (22,495) of the Township’s residents were
born outside Canada, significantly smaller than the 40.8% foreign-born population for the Metro Vancouver region. It made the Township one of
only three municipalities where less than 20% of their residents were born outside Canada. The other two were Maple Ridge (19.1%) and the City of
Langley (17.4%).
■ The Township of Langley and the City of Langley combined had 141,150 residents and 26,890 immigrants, representing 5.8% and 2.7% of Metro
Vancouver’s total and immigrant populations respectively.
■ 81.2% of B.C.’s recent immigrants lived in the Metro Vancouver region. Of which 80% resided in the five most populous municipalities: Vancouver
(26.2%), Surrey (25.5%), Burnaby (11.3%), Richmond (10.7%) and Coquitlam (6.7%). The Township was home to 1.8% (2,615) of Metro Vancouver’s
recent immigrants. Recent immigrants accounted for 65.7% of the Township’s net increase (3,980) in its total immigrant population between 2011
and 2016.
PoPuLaTIon anD ImmIgraTIon – maInLanD / souThWesT Bc (census 2016 anD nhs 2011)
2.7% of Metro Vancouver’s
recent immigrants
live in the Langley
Between 2011 - 2016, the Township of Langley received
reCenTimmigranTs2,615
Township of Langley Immigrant Demographics I Page 6
langley, Township metro Vancouver
immigrants** immigrants
Total population* number % of Total population Total population* number % of Total population
2016 117,285 22,495 19.4% 2,463,431 989,540 40.8%
2011 104,177 18,520 18.0% 2,313,328 913,310 40.0%
2006 93,726 15,880 16.9% 2,116,581 831,265 39.6%
2001 86,896 13,340 15.4% 1,986,965 738,555 37.5%
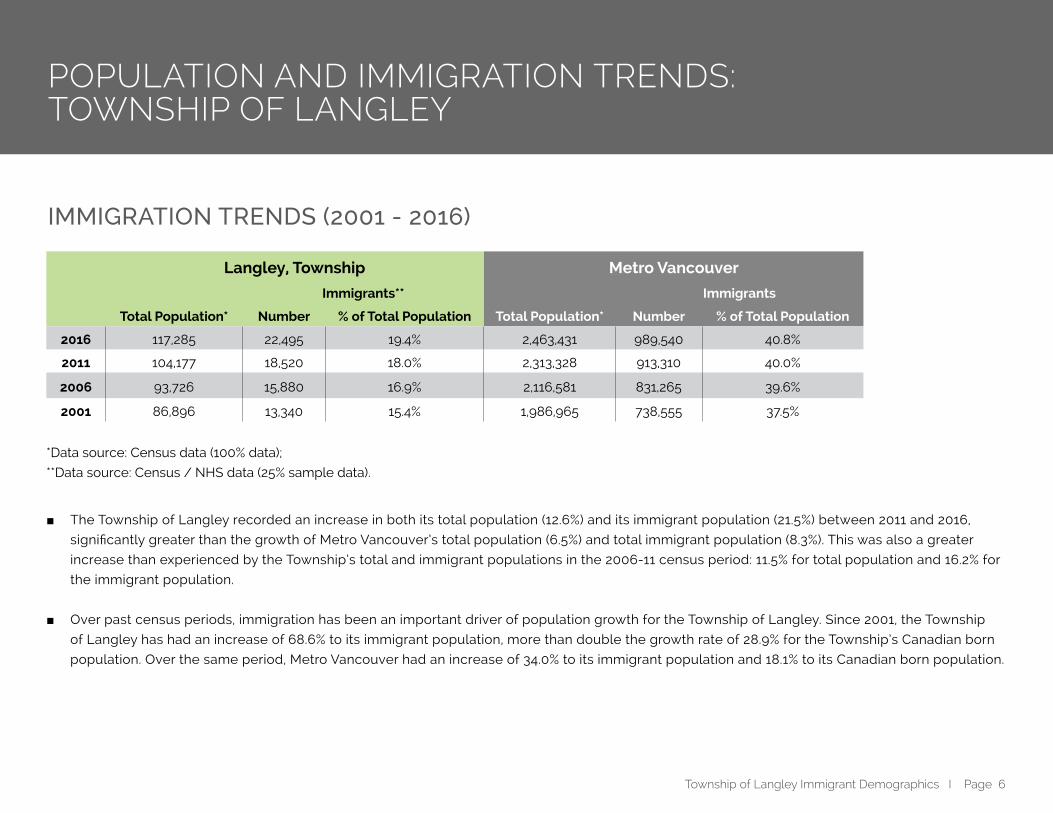
IMMIgRATION TRENDS (2001 - 2016)
■ The Township of Langley recorded an increase in both its total population (12.6%) and its immigrant population (21.5%) between 2011 and 2016,
significantly greater than the growth of Metro Vancouver’s total population (6.5%) and total immigrant population (8.3%). This was also a greater
increase than experienced by the Township’s total and immigrant populations in the 2006-11 census period: 11.5% for total population and 16.2% for
the immigrant population.
■ Over past census periods, immigration has been an important driver of population growth for the Township of Langley. Since 2001, the Township
of Langley has had an increase of 68.6% to its immigrant population, more than double the growth rate of 28.9% for the Township’s Canadian born
population. Over the same period, Metro Vancouver had an increase of 34.0% to its immigrant population and 18.1% to its Canadian born population.
*Data source: Census data (100% data);
**Data source: Census / NHS data (25% sample data).
PoPuLaTIon anD ImmIgraTIon TrenDs: ToWnshIP oF LangLeY
Township of Langley Immigrant Demographics I Page 7
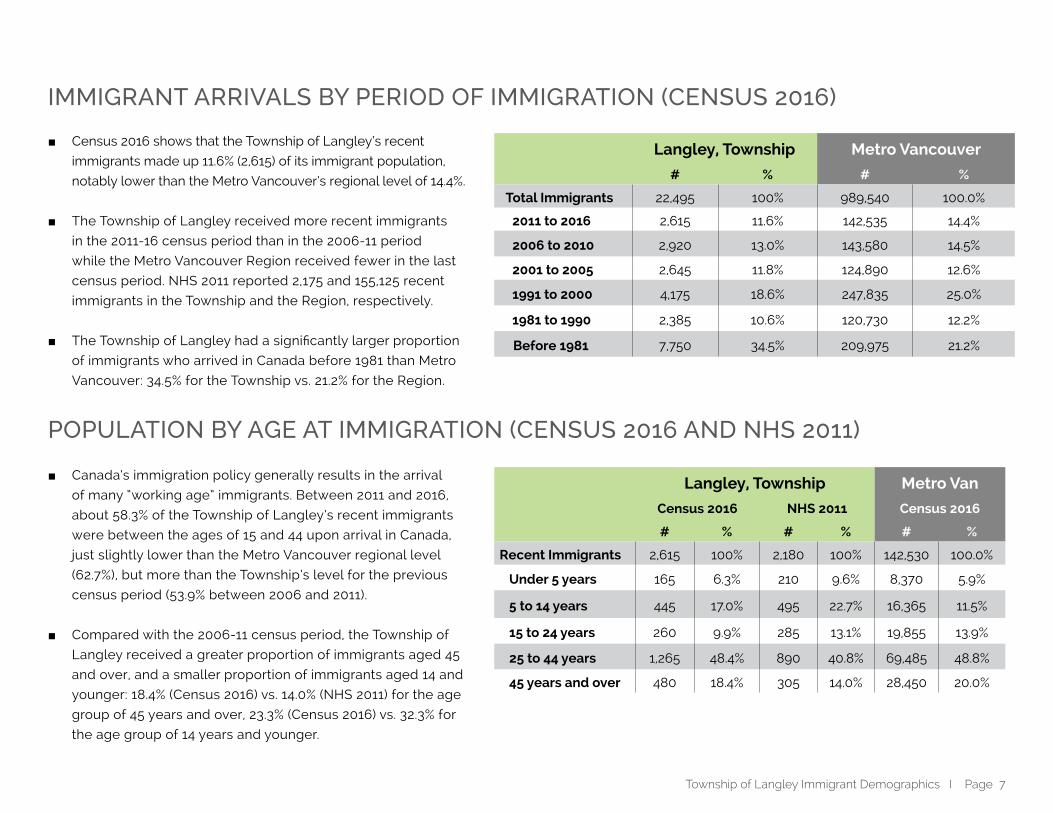
langley, Township metro Vancouver
# % # %
Total immigrants 22,495 100% 989,540 100.0%
2011 to 2016 2,615 11.6% 142,535 14.4%
2006 to 2010 2,920 13.0% 143,580 14.5%
2001 to 2005 2,645 11.8% 124,890 12.6%
1991 to 2000 4,175 18.6% 247,835 25.0%
1981 to 1990 2,385 10.6% 120,730 12.2%
Before 1981 7,750 34.5% 209,975 21.2%
IMMIgRANT ARRIVALS BY PERIOD Of IMMIgRATION (CENSUS 2016)
■ Census 2016 shows that the Township of Langley’s recent
immigrants made up 11.6% (2,615) of its immigrant population,
notably lower than the Metro Vancouver’s regional level of 14.4%.
■ The Township of Langley received more recent immigrants
in the 2011-16 census period than in the 2006-11 period
while the Metro Vancouver Region received fewer in the last
census period. NHS 2011 reported 2,175 and 155,125 recent
immigrants in the Township and the Region, respectively.
■ The Township of Langley had a significantly larger proportion
of immigrants who arrived in Canada before 1981 than Metro
Vancouver: 34.5% for the Township vs. 21.2% for the Region.
POPULATION BY AgE AT IMMIgRATION (CENSUS 2016 AND NHS 2011)
■ Canada’s immigration policy generally results in the arrival
of many “working age” immigrants. Between 2011 and 2016,
about 58.3% of the Township of Langley’s recent immigrants
were between the ages of 15 and 44 upon arrival in Canada,
just slightly lower than the Metro Vancouver regional level
(62.7%), but more than the Township’s level for the previous
census period (53.9% between 2006 and 2011).
■ Compared with the 2006-11 census period, the Township of
Langley received a greater proportion of immigrants aged 45
and over, and a smaller proportion of immigrants aged 14 and
younger: 18.4% (Census 2016) vs. 14.0% (NHS 2011) for the age
group of 45 years and over, 23.3% (Census 2016) vs. 32.3% for
the age group of 14 years and younger.
langley, Township metro Van
Census 2016 nHs 2011 Census 2016
# % # % # %
recent immigrants 2,615 100% 2,180 100% 142,530 100.0%
under 5 years 165 6.3% 210 9.6% 8,370 5.9%
5 to 14 years 445 17.0% 495 22.7% 16,365 11.5%
15 to 24 years 260 9.9% 285 13.1% 19,855 13.9%
25 to 44 years 1,265 48.4% 890 40.8% 69,485 48.8%
45 years and over 480 18.4% 305 14.0% 28,450 20.0%
Township of Langley Immigrant Demographics I Page 8
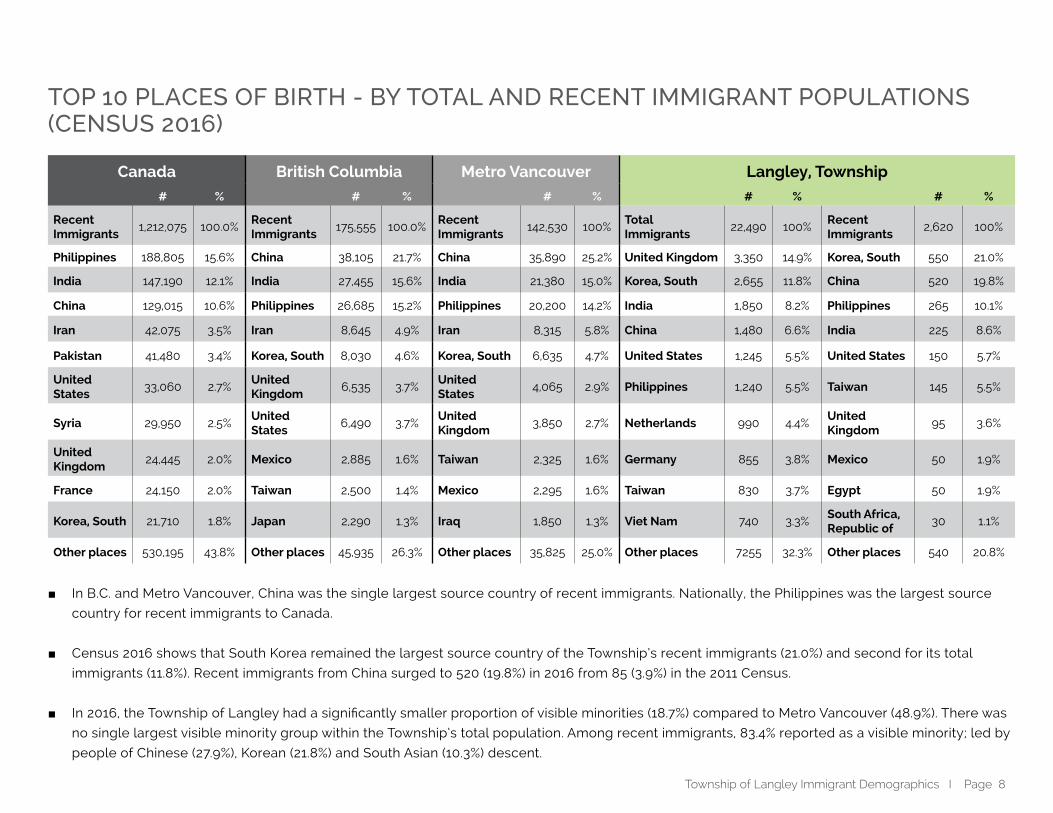
Canada British Columbia metro Vancouver langley, Township
# % # % # % # % # %
recent immigrants
1,212,075 100.0%recent immigrants
175,555 100.0%recent immigrants
142,530 100%Total immigrants
22,490 100%recent immigrants
2,620 100%
philippines 188,805 15.6% China 38,105 21.7% China 35,890 25.2% united Kingdom 3,350 14.9% Korea, south 550 21.0%
india 147,190 12.1% india 27,455 15.6% india 21,380 15.0% Korea, south 2,655 11.8% China 520 19.8%
China 129,015 10.6% philippines 26,685 15.2% philippines 20,200 14.2% india 1,850 8.2% philippines 265 10.1%
iran 42,075 3.5% iran 8,645 4.9% iran 8,315 5.8% China 1,480 6.6% india 225 8.6%
pakistan 41,480 3.4% Korea, south 8,030 4.6% Korea, south 6,635 4.7% united states 1,245 5.5% united states 150 5.7%
united states
33,060 2.7%united Kingdom
6,535 3.7%united states
4,065 2.9% philippines 1,240 5.5% Taiwan 145 5.5%
syria 29,950 2.5%united states
6,490 3.7%united Kingdom
3,850 2.7% netherlands 990 4.4%united Kingdom
95 3.6%
united Kingdom
24,445 2.0% mexico 2,885 1.6% Taiwan 2,325 1.6% germany 855 3.8% mexico 50 1.9%
France 24,150 2.0% Taiwan 2,500 1.4% mexico 2,295 1.6% Taiwan 830 3.7% egypt 50 1.9%
Korea, south 21,710 1.8% Japan 2,290 1.3% iraq 1,850 1.3% Viet nam 740 3.3%south africa, republic of
30 1.1%
other places 530,195 43.8% other places 45,935 26.3% other places 35,825 25.0% other places 7,255 32.3% other places 540 20.8%
TOP 10 PLACES Of BIRTH - BY TOTAL AND RECENT IMMIgRANT POPULATIONS (CENSUS 2016)
■ In B.C. and Metro Vancouver, China was the single largest source country of recent immigrants. Nationally, the Philippines was the largest source
country for recent immigrants to Canada.
■ Census 2016 shows that South Korea remained the largest source country of the Township’s recent immigrants (21.0%) and second for its total
immigrants (11.8%). Recent immigrants from China surged to 520 (19.8%) in 2016 from 85 (3.9%) in the 2011 Census.
■ In 2016, the Township of Langley had a significantly smaller proportion of visible minorities (18.7%) compared to Metro Vancouver (48.9%). There was
no single largest visible minority group within the Township’s total population. Among recent immigrants, 83.4% reported as a visible minority; led by
people of Chinese (27.9%), Korean (21.8%) and South Asian (10.3%) descent.
Township of Langley Immigrant Demographics I Page 9
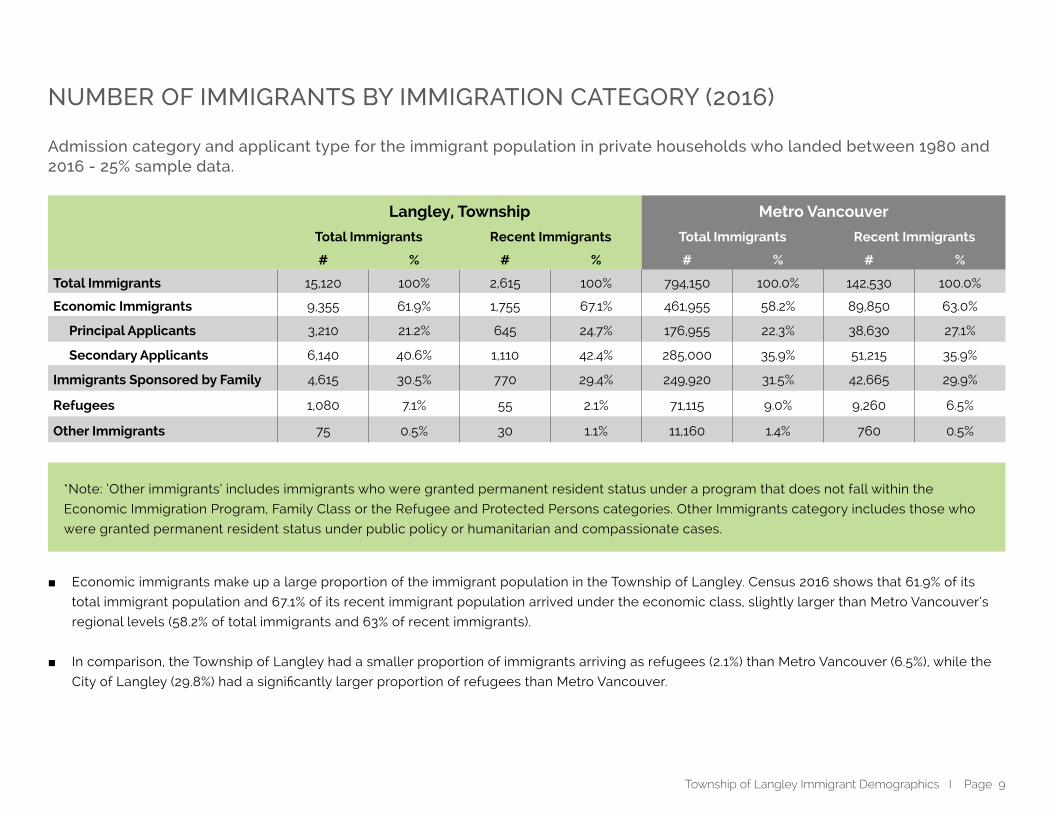
langley, Township metro Vancouver
Total immigrants recent immigrants Total immigrants recent immigrants
# % # % # % # %
Total immigrants 15,120 100% 2,615 100% 794,150 100.0% 142,530 100.0%
economic immigrants 9,355 61.9% 1,755 67.1% 461,955 58.2% 89,850 63.0%
principal applicants 3,210 21.2% 645 24.7% 176,955 22.3% 38,630 27.1%
secondary applicants 6,140 40.6% 1,110 42.4% 285,000 35.9% 51,215 35.9%
immigrants sponsored by Family 4,615 30.5% 770 29.4% 249,920 31.5% 42,665 29.9%
refugees 1,080 7.1% 55 2.1% 71,115 9.0% 9,260 6.5%
other immigrants 75 0.5% 30 1.1% 11,160 1.4% 760 0.5%
NUMBER Of IMMIgRANTS BY IMMIgRATION CATEgORY (2016)
Admission category and applicant type for the immigrant population in private households who landed between 1980 and 2016 - 25% sample data.
■ Economic immigrants make up a large proportion of the immigrant population in the Township of Langley. Census 2016 shows that 61.9% of its
total immigrant population and 67.1% of its recent immigrant population arrived under the economic class, slightly larger than Metro Vancouver’s
regional levels (58.2% of total immigrants and 63% of recent immigrants).
■ In comparison, the Township of Langley had a smaller proportion of immigrants arriving as refugees (2.1%) than Metro Vancouver (6.5%), while the
City of Langley (29.8%) had a significantly larger proportion of refugees than Metro Vancouver.
*Note: ‘Other immigrants’ includes immigrants who were granted permanent resident status under a program that does not fall within the
Economic Immigration Program, Family Class or the Refugee and Protected Persons categories. Other Immigrants category includes those who
were granted permanent resident status under public policy or humanitarian and compassionate cases.
Township of Langley Immigrant Demographics I Page 10
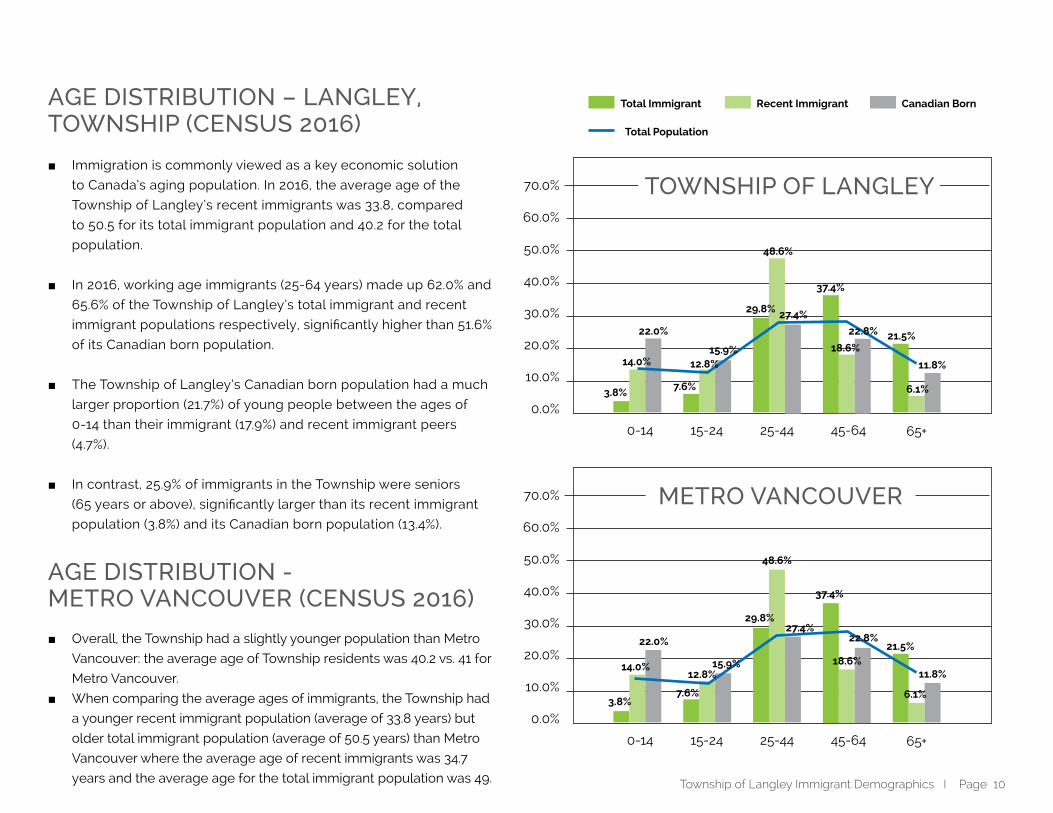
AgE DISTRIBUTION – LANgLEY, TOwNSHIP (CENSUS 2016)
■ Immigration is commonly viewed as a key economic solution
to Canada’s aging population. In 2016, the average age of the
Township of Langley’s recent immigrants was 33.8, compared
to 50.5 for its total immigrant population and 40.2 for the total
population.
■ In 2016, working age immigrants (25-64 years) made up 62.0% and
65.6% of the Township of Langley’s total immigrant and recent
immigrant populations respectively, significantly higher than 51.6%
of its Canadian born population.
■ The Township of Langley’s Canadian born population had a much
larger proportion (21.7%) of young people between the ages of
0-14 than their immigrant (17.9%) and recent immigrant peers
(4.7%).
■ In contrast, 25.9% of immigrants in the Township were seniors
(65 years or above), significantly larger than its recent immigrant
population (3.8%) and its Canadian born population (13.4%).
AgE DISTRIBUTION - METRO VANCOUVER (CENSUS 2016)
■ Overall, the Township had a slightly younger population than Metro
Vancouver: the average age of Township residents was 40.2 vs. 41 for
Metro Vancouver.
■ When comparing the average ages of immigrants, the Township had
a younger recent immigrant population (average of 33.8 years) but
older total immigrant population (average of 50.5 years) than Metro
Vancouver where the average age of recent immigrants was 34.7
years and the average age for the total immigrant population was 49.
70.0%
60.0%
50.0%
40.0%
30.0%
20.0%
10.0%
0.0%
0-14 15-24 25-44 45-64 65+
Total immigrant recent immigrant Canadian Born
Total population
70.0%
60.0%
50.0%
40.0%
30.0%
20.0%
10.0%
0.0%
0-14 15-24 25-44 45-64 65+
3.8%
14.0%
22.0%
7.6%
12.8%15.9%
29.8%
48.6%
27.4%
37.4%
18.6%
22.8% 21.5%
6.1%
11.8%
TOwNSHIP Of LANgLEY
METRO VANCOUVER
3.8%
14.0%
22.0%
7.6%
12.8%15.9%
29.8%
48.6%
27.4%
37.4%
18.6%
22.8%21.5%
6.1%
11.8%
Township of Langley Immigrant Demographics I Page 11
langley, Township metro Vancouver
# % # % # %
Total immigrants 22,490 100% recent immigrants 2,615 100% recent immigrants 142,535 100.0%
non-official languages 7,530 33.5% non-official languages 1,500 57.4% non-official languages 88,570 62.1%
Korean 2,030 9.0% mandarin 480 18.4% mandarin 26,905 18.9%
mandarin 1,435 6.4% Korean 420 16.1% punjabi (panjabi) 12,940 9.1%
punjabi (panjabi) 940 4.2% punjabi (panjabi) 120 4.6% Tagalog (pilipino, Filipino) 7,790 5.5%
Vietnamese 505 2.2% Tagalog (pilipino, Filipino) 95 3.6% persian (Farsi) 7,055 4.9%
slavic languages 495 2.2% spanish 80 3.1% Cantonese 6,095 4.3%
other non-official languages 2,125 9.5% other non-official languages 305 11.6% other non-official languages 27,785 19.4%
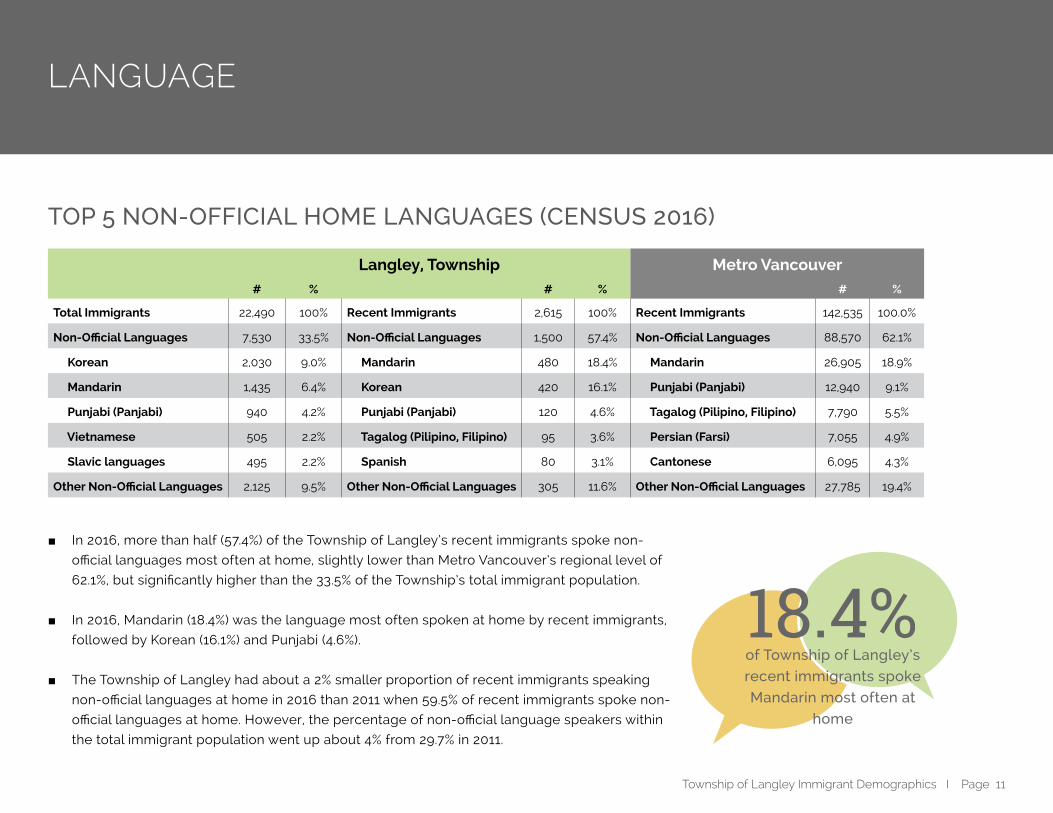
TOP 5 NON-OffICIAL HOME LANgUAgES (CENSUS 2016)
Language
■ In 2016, more than half (57.4%) of the Township of Langley’s recent immigrants spoke non-
official languages most often at home, slightly lower than Metro Vancouver’s regional level of
62.1%, but significantly higher than the 33.5% of the Township’s total immigrant population.
■ In 2016, Mandarin (18.4%) was the language most often spoken at home by recent immigrants,
followed by Korean (16.1%) and Punjabi (4.6%).
■ The Township of Langley had about a 2% smaller proportion of recent immigrants speaking
non-official languages at home in 2016 than 2011 when 59.5% of recent immigrants spoke non-
official languages at home. However, the percentage of non-official language speakers within
the total immigrant population went up about 4% from 29.7% in 2011.
18.4%of Township of Langley’s
recent immigrants spoke
Mandarin most often at
home
Township of Langley Immigrant Demographics I Page 12
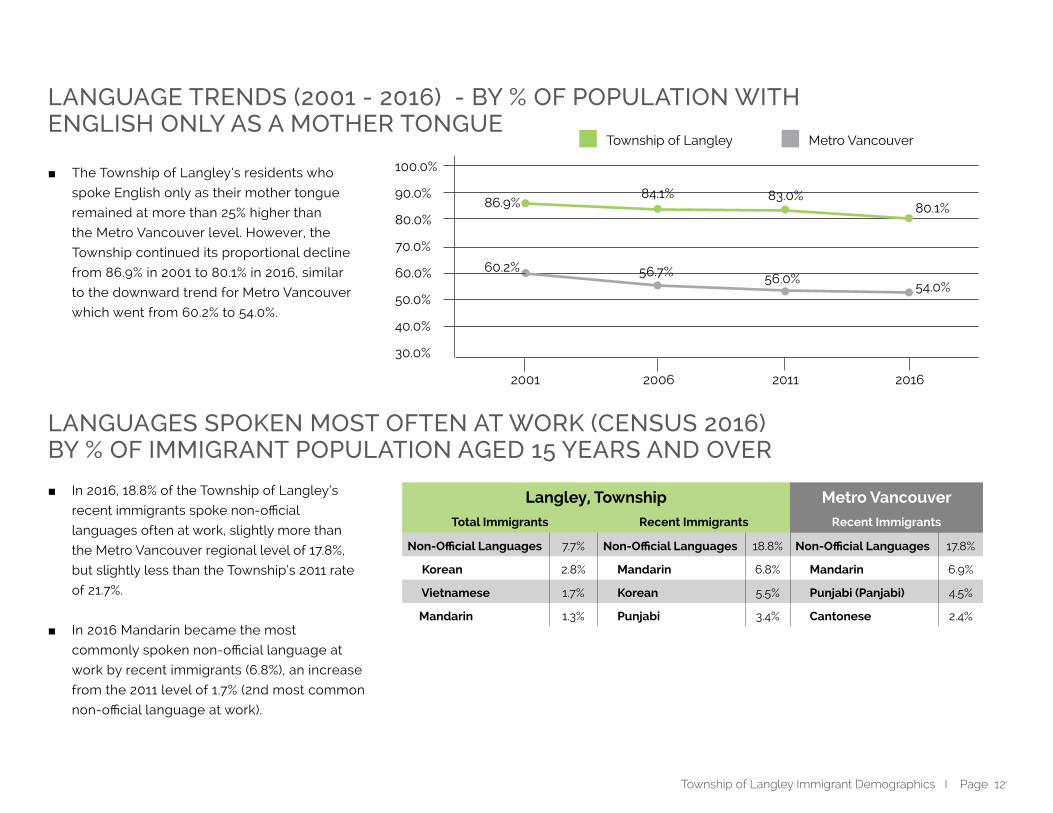
■ The Township of Langley’s residents who
spoke English only as their mother tongue
remained at more than 25% higher than
the Metro Vancouver level. However, the
Township continued its proportional decline
from 86.9% in 2001 to 80.1% in 2016, similar
to the downward trend for Metro Vancouver
which went from 60.2% to 54.0%.
LANgUAgE TRENDS (2001 - 2016) - BY % Of POPULATION wITH ENgLISH ONLY AS A MOTHER TONgUE
Township of Langley Metro Vancouver
100.0%
90.0%
80.0%
70.0%
60.0%
50.0%
40.0%
30.0%
2001 2006 2011
56.7% 56.0%
2016
54.0%
60.2%
83.0%86.9%84.1%
80.1%
LANgUAgES SPOKEN MOST OfTEN AT wORK (CENSUS 2016) BY % Of IMMIgRANT POPULATION AgED 15 YEARS AND OVER
■ In 2016, 18.8% of the Township of Langley’s
recent immigrants spoke non-official
languages often at work, slightly more than
the Metro Vancouver regional level of 17.8%,
but slightly less than the Township’s 2011 rate
of 21.7%.
■ In 2016 Mandarin became the most
commonly spoken non-official language at
work by recent immigrants (6.8%), an increase
from the 2011 level of 1.7% (2nd most common
non-official language at work).
langley, Township metro Vancouver
Total immigrants recent immigrants recent immigrants
non-official languages 7.7% non-official languages 18.8% non-official languages 17.8%
Korean 2.8% mandarin 6.8% mandarin 6.9%
Vietnamese 1.7% Korean 5.5% punjabi (panjabi) 4.5%
mandarin 1.3% punjabi 3.4% Cantonese 2.4%
Township of Langley Immigrant Demographics I Page 13
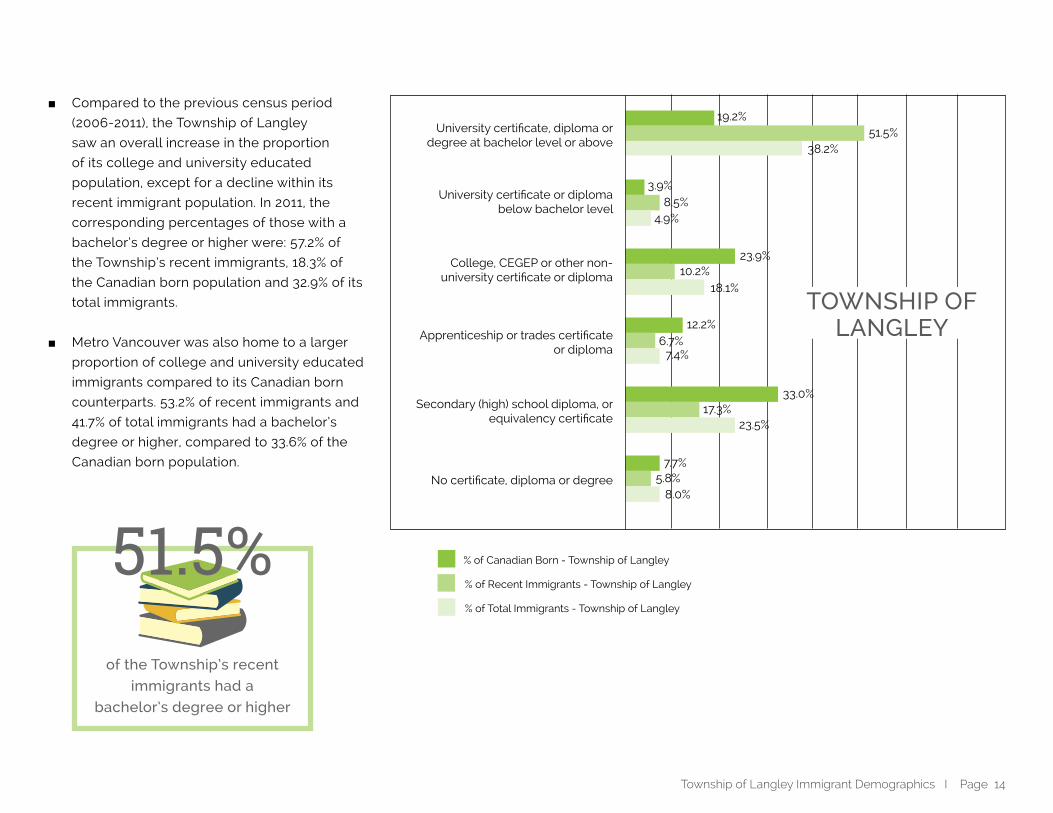
HIgHEST LEVEL Of EDUCATION - BY % Of POPULATION AgED 25 TO 64 YEARS
eDucaTIon LeveL (census 2016)
■ The Township of Langley’s Canadian
born population reported higher levels of
educational attainment in apprenticeship
and trades as well as in high school or
equivalency categories. While immigrants
and recent immigrants reported higher levels
of educational attainment in college and
university certificates, diplomas or degrees.
■ In 2016, 51.5% of the Township of Langley’s
recent immigrants between the ages of 25
to 64 had a bachelor’s degree or higher,
significantly higher than the proportion of
their Canadian born counterparts (19.2%) and
the total immigrant population (38.2%), but
slightly lower than Metro Vancouver’s recent
immigrant population (53.2%).
University certificate, diploma or degree at bachelor level or above
33.6%
University certificate or diploma below bachelor level
College, CEGEP or other non-university certificate or diploma
Apprenticeship or trades certificate or diploma
Secondary (high) school diploma, or equivalency certificate
No certificate, diploma or degree
53.2%41.7%
3.5%6.2%
5.0%
22.4%11.2%
15.7%
8.3%3.4%
5.0%
25.8%17.4%
22.8%
6.3%
9.9%8.6%
% of Canadian Born - Metro Vancouver
% of Recent Immigrants - Metro Vancouver
% of Total Immigrants - Metro Vancouver
METROVANCOUVER
Township of Langley Immigrant Demographics I Page 14
■ Compared to the previous census period
(2006-2011), the Township of Langley
saw an overall increase in the proportion
of its college and university educated
population, except for a decline within its
recent immigrant population. In 2011, the
corresponding percentages of those with a
bachelor’s degree or higher were: 57.2% of
the Township’s recent immigrants, 18.3% of
the Canadian born population and 32.9% of its
total immigrants.
■ Metro Vancouver was also home to a larger
proportion of college and university educated
immigrants compared to its Canadian born
counterparts. 53.2% of recent immigrants and
41.7% of total immigrants had a bachelor’s
degree or higher, compared to 33.6% of the
Canadian born population.
% of Canadian Born - Township of Langley
% of Recent Immigrants - Township of Langley
% of Total Immigrants - Township of Langley
University certificate, diploma or degree at bachelor level or above
19.2%
University certificate or diploma below bachelor level
College, CEGEP or other non-university certificate or diploma
Apprenticeship or trades certificate or diploma
Secondary (high) school diploma, or equivalency certificate
No certificate, diploma or degree
51.5%38.2%
3.9%8.5%
4.9%
23.9%10.2%
18.1%
12.2%6.7%
7.4%
33.0%17.3%
23.5%
7.7%
8.0%5.8%
TOwNSHIP OfLANgLEY
51.5%of the Township’s recent
immigrants had a
bachelor’s degree or higher
Township of Langley Immigrant Demographics I Page 15
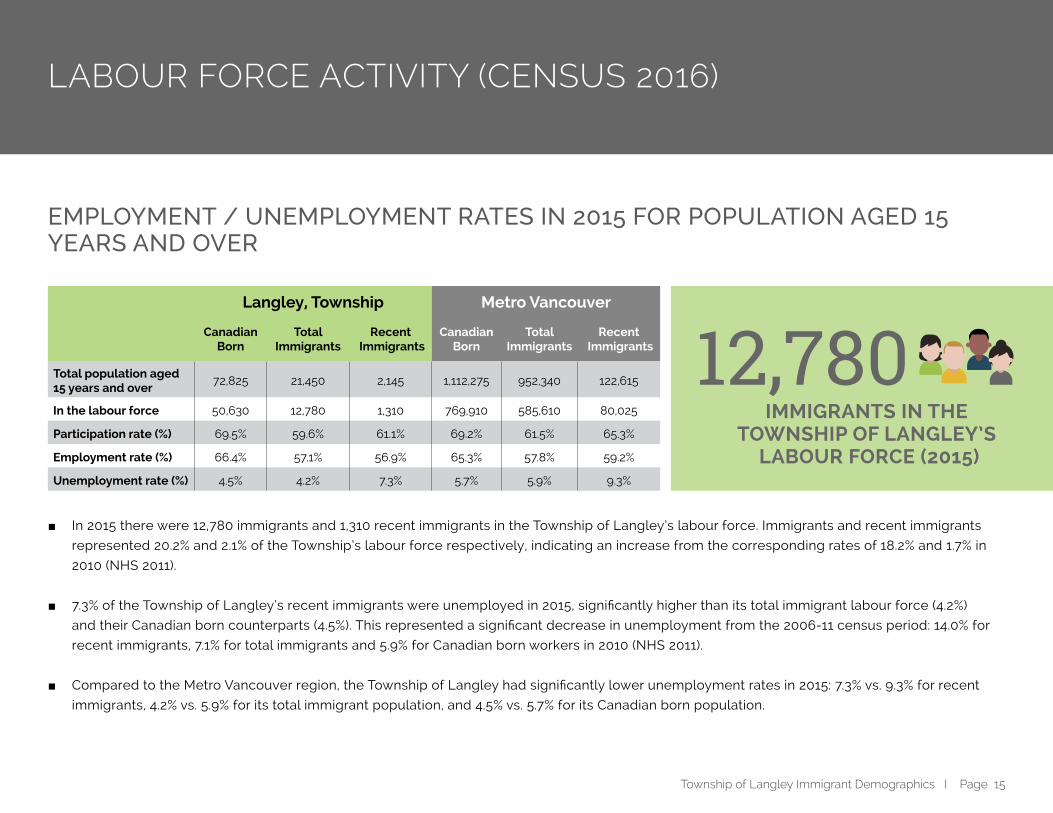
EMPLOYMENT / UNEMPLOYMENT RATES IN 2015 fOR POPULATION AgED 15 YEARS AND OVER
LaBour Force acTIvITY (census 2016)
■ In 2015 there were 12,780 immigrants and 1,310 recent immigrants in the Township of Langley’s labour force. Immigrants and recent immigrants
represented 20.2% and 2.1% of the Township’s labour force respectively, indicating an increase from the corresponding rates of 18.2% and 1.7% in
2010 (NHS 2011).
■ 7.3% of the Township of Langley’s recent immigrants were unemployed in 2015, significantly higher than its total immigrant labour force (4.2%)
and their Canadian born counterparts (4.5%). This represented a significant decrease in unemployment from the 2006-11 census period: 14.0% for
recent immigrants, 7.1% for total immigrants and 5.9% for Canadian born workers in 2010 (NHS 2011).
■ Compared to the Metro Vancouver region, the Township of Langley had significantly lower unemployment rates in 2015: 7.3% vs. 9.3% for recent
immigrants, 4.2% vs. 5.9% for its total immigrant population, and 4.5% vs. 5.7% for its Canadian born population.
langley, Township metro Vancouver
Canadian Born
Total immigrants
recent immigrants
Canadian Born
Total immigrants
recent immigrants
Total population aged 15 years and over
72,825 21,450 2,145 1,112,275 952,340 122,615
in the labour force 50,630 12,780 1,310 769,910 585,610 80,025
participation rate (%) 69.5% 59.6% 61.1% 69.2% 61.5% 65.3%
employment rate (%) 66.4% 57.1% 56.9% 65.3% 57.8% 59.2%
unemployment rate (%) 4.5% 4.2% 7.3% 5.7% 5.9% 9.3%
immigranTs in THe ToWnsHip oF langleY’s
laBour ForCe (2015)
12,780
Township of Langley Immigrant Demographics I Page 16
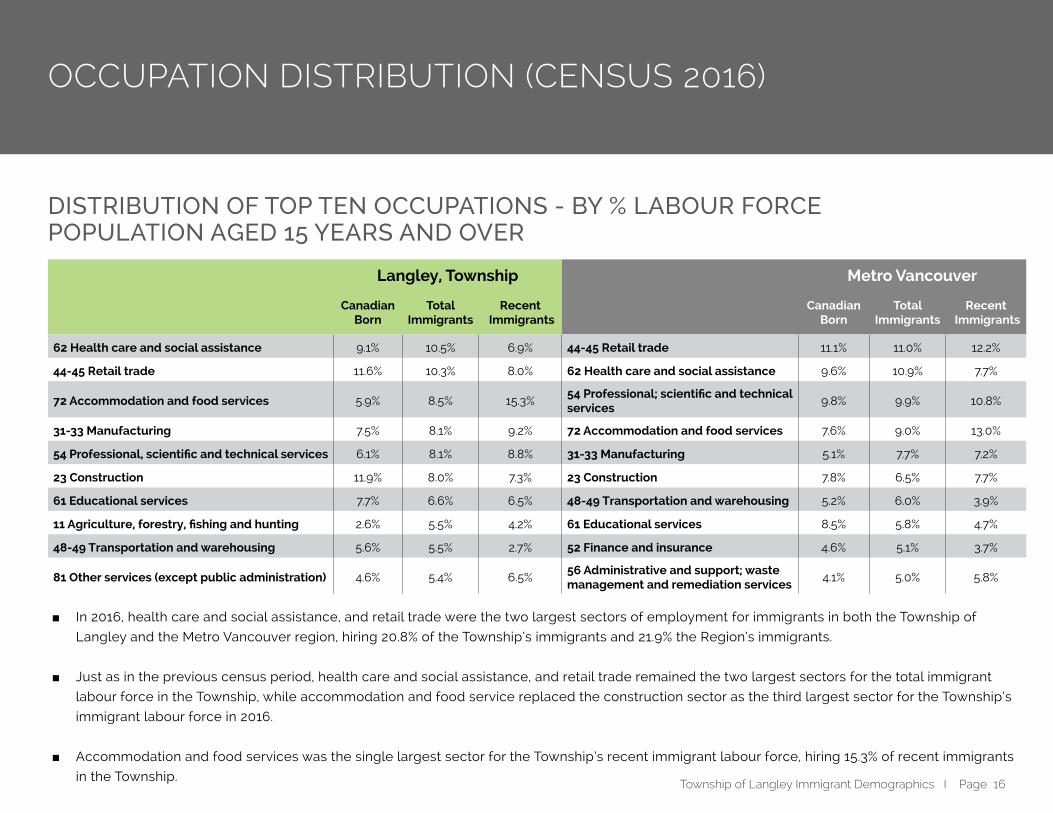
DISTRIBUTION Of TOP TEN OCCUPATIONS - BY % LABOUR fORCE POPULATION AgED 15 YEARS AND OVER
occuPaTIon DIsTrIBuTIon (census 2016)
langley, Township metro Vancouver
Canadian Born
Total immigrants
recent immigrants
Canadian Born
Total immigrants
recent immigrants
62 Health care and social assistance 9.1% 10.5% 6.9% 44-45 retail trade 11.1% 11.0% 12.2%
44-45 retail trade 11.6% 10.3% 8.0% 62 Health care and social assistance 9.6% 10.9% 7.7%
72 accommodation and food services 5.9% 8.5% 15.3%54 professional; scientific and technical services
9.8% 9.9% 10.8%
31-33 manufacturing 7.5% 8.1% 9.2% 72 accommodation and food services 7.6% 9.0% 13.0%
54 professional, scientific and technical services 6.1% 8.1% 8.8% 31-33 manufacturing 5.1% 7.7% 7.2%
23 Construction 11.9% 8.0% 7.3% 23 Construction 7.8% 6.5% 7.7%
61 educational services 7.7% 6.6% 6.5% 48-49 Transportation and warehousing 5.2% 6.0% 3.9%
11 agriculture, forestry, fishing and hunting 2.6% 5.5% 4.2% 61 educational services 8.5% 5.8% 4.7%
48-49 Transportation and warehousing 5.6% 5.5% 2.7% 52 Finance and insurance 4.6% 5.1% 3.7%
81 other services (except public administration) 4.6% 5.4% 6.5%56 administrative and support; waste management and remediation services
4.1% 5.0% 5.8%
■ In 2016, health care and social assistance, and retail trade were the two largest sectors of employment for immigrants in both the Township of
Langley and the Metro Vancouver region, hiring 20.8% of the Township’s immigrants and 21.9% the Region’s immigrants.
■ Just as in the previous census period, health care and social assistance, and retail trade remained the two largest sectors for the total immigrant
labour force in the Township, while accommodation and food service replaced the construction sector as the third largest sector for the Township’s
immigrant labour force in 2016.
■ Accommodation and food services was the single largest sector for the Township’s recent immigrant labour force, hiring 15.3% of recent immigrants
in the Township.
Township of Langley Immigrant Demographics I Page 17
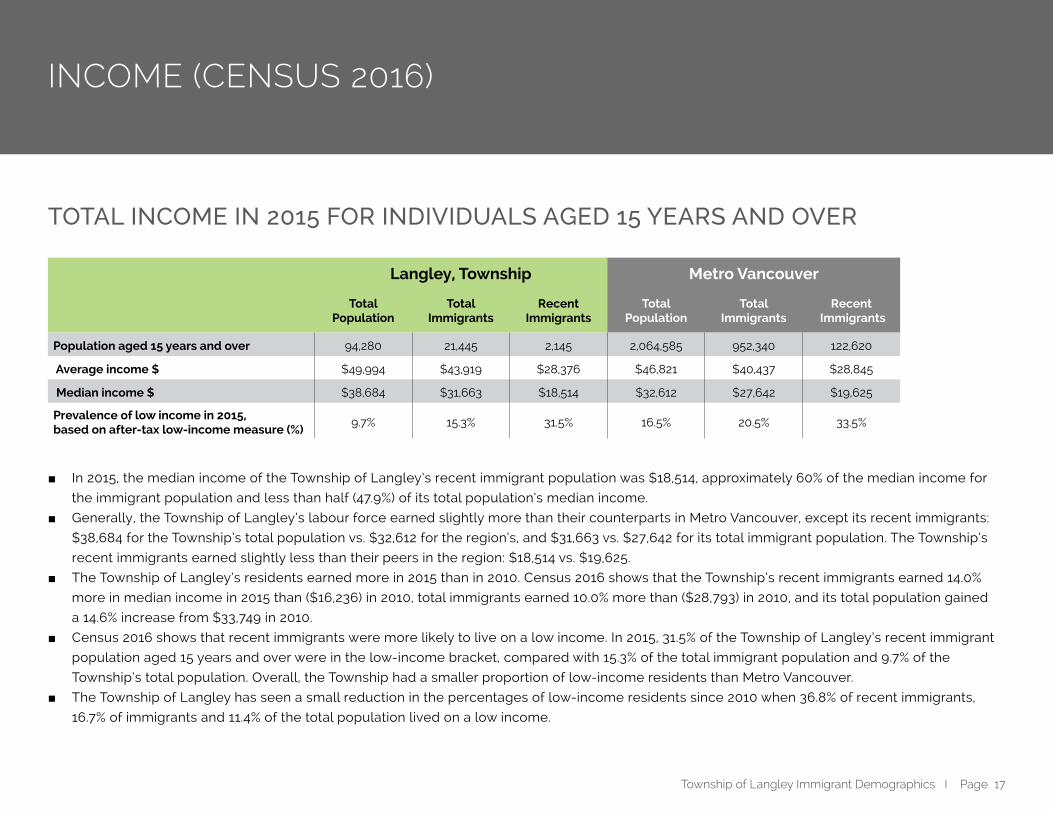
TOTAL INCOME IN 2015 fOR INDIVIDUALS AgED 15 YEARS AND OVER
Income (census 2016)
langley, Township metro Vancouver
Total population
Total immigrants
recent immigrants
Total population
Total immigrants
recent immigrants
population aged 15 years and over 94,280 21,445 2,145 2,064,585 952,340 122,620
average income $ $49,994 $43,919 $28,376 $46,821 $40,437 $28,845
median income $ $38,684 $31,663 $18,514 $32,612 $27,642 $19,625
prevalence of low income in 2015, based on after-tax low-income measure (%)
9.7% 15.3% 31.5% 16.5% 20.5% 33.5%
■ In 2015, the median income of the Township of Langley’s recent immigrant population was $18,514, approximately 60% of the median income for
the immigrant population and less than half (47.9%) of its total population’s median income.
■ Generally, the Township of Langley’s labour force earned slightly more than their counterparts in Metro Vancouver, except its recent immigrants:
$38,684 for the Township’s total population vs. $32,612 for the region’s, and $31,663 vs. $27,642 for its total immigrant population. The Township’s
recent immigrants earned slightly less than their peers in the region: $18,514 vs. $19,625.
■ The Township of Langley’s residents earned more in 2015 than in 2010. Census 2016 shows that the Township’s recent immigrants earned 14.0%
more in median income in 2015 than ($16,236) in 2010, total immigrants earned 10.0% more than ($28,793) in 2010, and its total population gained
a 14.6% increase from $33,749 in 2010.
■ Census 2016 shows that recent immigrants were more likely to live on a low income. In 2015, 31.5% of the Township of Langley’s recent immigrant
population aged 15 years and over were in the low-income bracket, compared with 15.3% of the total immigrant population and 9.7% of the
Township’s total population. Overall, the Township had a smaller proportion of low-income residents than Metro Vancouver.
■ The Township of Langley has seen a small reduction in the percentages of low-income residents since 2010 when 36.8% of recent immigrants,
16.7% of immigrants and 11.4% of the total population lived on a low income.
Township of Langley Immigrant Demographics I Page 18
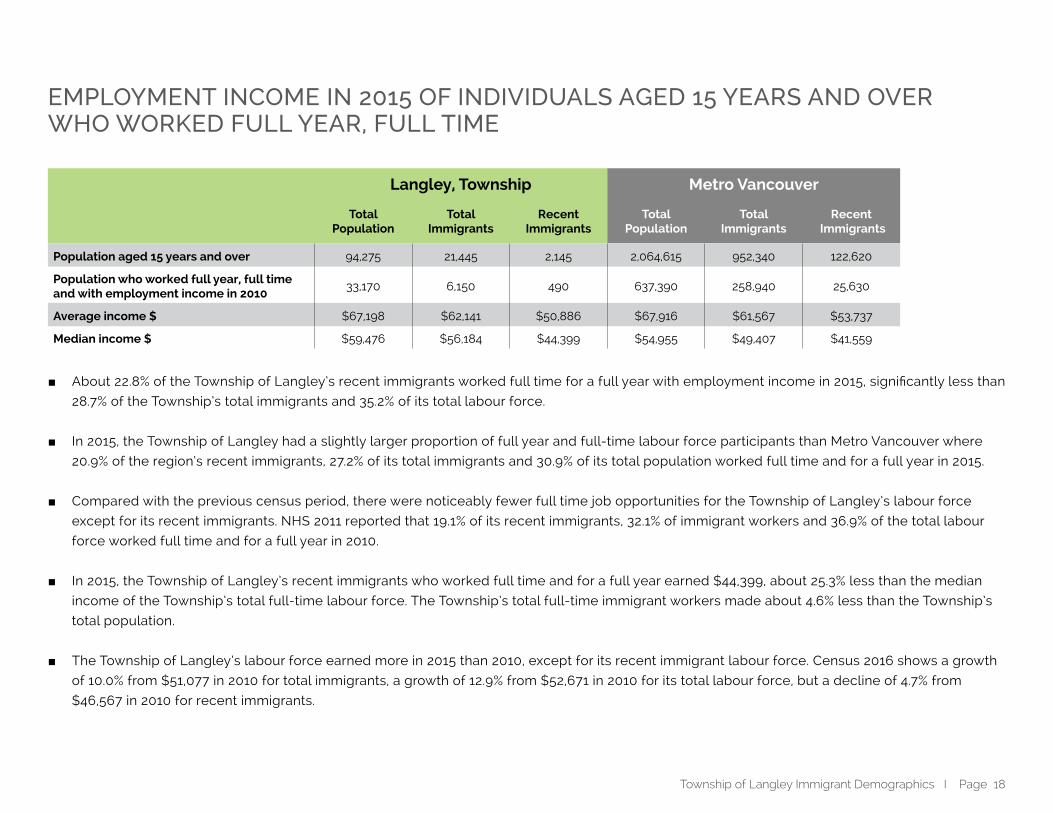
■ About 22.8% of the Township of Langley’s recent immigrants worked full time for a full year with employment income in 2015, significantly less than
28.7% of the Township’s total immigrants and 35.2% of its total labour force.
■ In 2015, the Township of Langley had a slightly larger proportion of full year and full-time labour force participants than Metro Vancouver where
20.9% of the region’s recent immigrants, 27.2% of its total immigrants and 30.9% of its total population worked full time and for a full year in 2015.
■ Compared with the previous census period, there were noticeably fewer full time job opportunities for the Township of Langley’s labour force
except for its recent immigrants. NHS 2011 reported that 19.1% of its recent immigrants, 32.1% of immigrant workers and 36.9% of the total labour
force worked full time and for a full year in 2010.
■ In 2015, the Township of Langley’s recent immigrants who worked full time and for a full year earned $44,399, about 25.3% less than the median
income of the Township’s total full-time labour force. The Township’s total full-time immigrant workers made about 4.6% less than the Township’s
total population.
■ The Township of Langley’s labour force earned more in 2015 than 2010, except for its recent immigrant labour force. Census 2016 shows a growth
of 10.0% from $51,077 in 2010 for total immigrants, a growth of 12.9% from $52,671 in 2010 for its total labour force, but a decline of 4.7% from
$46,567 in 2010 for recent immigrants.
EMPLOYMENT INCOME IN 2015 Of INDIVIDUALS AgED 15 YEARS AND OVER wHO wORKED fULL YEAR, fULL TIME
langley, Township metro Vancouver
Total population
Total immigrants
recent immigrants
Total population
Total immigrants
recent immigrants
population aged 15 years and over 94,275 21,445 2,145 2,064,615 952,340 122,620
population who worked full year, full time and with employment income in 2010
33,170 6,150 490 637,390 258,940 25,630
average income $ $67,198 $62,141 $50,886 $67,916 $61,567 $53,737
median income $ $59,476 $56,184 $44,399 $54,955 $49,407 $41,559
newToBC
NewToBC partners with libraries and community service providers to develop, deliver, and promote services and resources that support immigrant
settlement and integration in communities across the province. NewToBC uses innovative approaches and emerging technologies to deliver three key
activities.
1. NewToBC operates the library Champions project in communities across Metro Vancouver and the Fraser Valley.
2. NewToBC develops, updates and disseminates a variety of library and settlement information resources for new immigrants.
3. NewToBC uses social media platforms to share information about settlement resources, volunteer opportunities, and no cost workshops, training and
community events of interest to new immigrants in Southwest BC. Go to our Facebook, Twitter and linkedin feeds to find out more.
NewToBC is managed by public library interlinK. The project represents the eighteen public library systems in the Public Library InterLINK
federation. The project was established by the Government of British Columbia in 2012. NewToBC is currently funded through a Contribution
Agreement with immigration, refugees and Citizenship Canada (IRCC).
Copyright © 2018: NewToBC: The Library Link For Newcomers and Public Library InterLINK
aBouT neWToBc