Embed Size (px)
Citation preview

Reference Number: 800.510-32.2013
Township of Langley Summer 2010
Strengthening Farming Program
Sustainable Agriculture Management Branch
Ministry of Agriculture
August 20, 2013
Photo
cre
dit
s: A
. T
hro
pe,
2012
Township of Langley Land Use Inventory - Page i
AAcckknnoowwlleeddggmmeennttss
The Ministry of Agriculture would like to acknowledge and thank Greater Vancouver Regional District
(Metro Vancouver) for its support in this project. Metro Vancouver contributed the funds necessary to
hire a GIS Technician to prepare the field survey maps and to assist with the field survey.
The Ministry would like to thank Township of Langley for providing a vehicle for the 10 week duration
of the field survey. The Ministry would also like to thank Langley Environmental Partners Society for
providing a driver through the YMCA Eco-Internship Program for the duration of the field survey. The
driver proved to be a valuable member of the survey team by maintaining constant awareness of road
and traffic hazards.
Finally, the Ministry would like to acknowledge and thank the many farmers who stopped to talk to the
survey crew and answer questions about the parcels they farmed and irrigation use in Township of
Langley.
CCoonnttaacctt IInnffoorrmmaattiioonn
For further information on the content and development of this report please contact:
Ministry of Agriculture
Sustainable Resource Management Branch
1767 Angus Campbell Rd.
Abbotsford, BC V3G 2M3
(604) 556-3001 or 1-888-221-7141 (toll free)

Township of Langley Land Use Inventory - Page ii
TTaabbllee ooff CCoonntteennttss
Acknowledgments........................................................................................................................................ i
Contact Information ..................................................................................................................................... i
Table of Contents .........................................................................................................................................ii
List of Tables ............................................................................................................................................... iii
List of Figures .............................................................................................................................................. iv
List of Tables – Appendix A .......................................................................................................................... v
List of Figures – Appendix A ......................................................................................................................... v
List of Maps – Appendix B ........................................................................................................................... vi
Acronyms ................................................................................................................................................... vii
Definitions ................................................................................................................................................. viii
Executive Summary ..................................................................................................................................... 1
Agrologist Comments .................................................................................................................................. 4
General Community Information ................................................................................................................ 5 Agricultural Land Reserve ..............................................................................................................................6 Inventory Area ...............................................................................................................................................7
Agricultural Land Use Inventory ................................................................................................................. 8 Inventory Methodology .................................................................................................................................8 Description of the Data .................................................................................................................................9 Presentation of the Data ............................................................................................................................ 10 Determination of Parcels within the ALR ................................................................................................... 11
1. Land Cover and Farmed Area.............................................................................................................. 12
2. Land Use and Farm Use ...................................................................................................................... 15
3. Availability of Land for Farming .......................................................................................................... 18 Characteristics of Not Farmed but Available ALR Lands ............................................................................ 21
4. Farming Activities ................................................................................................................................ 24 Cultivated Field Crops ................................................................................................................................. 24 Greenhouses & Crop Barns ........................................................................................................................ 32 Irrigation ..................................................................................................................................................... 34 Livestock ..................................................................................................................................................... 36 On-Farm Value-Added ................................................................................................................................ 42
5. Condition of ALR Lands ....................................................................................................................... 44 Parcel Inclusion in the ALR ......................................................................................................................... 44 Parcel Size & Farming in the ALR ................................................................................................................ 45 Residential Use In the ALR .......................................................................................................................... 48
Appendix A ................................................................................................................................................ 53
Appendix B - Maps .................................................................................................................................... 69

Township of Langley Land Use Inventory - Page iii
LLiisstt ooff TTaabblleess
Table 1. Land cover and farmed area .................................................................................................................. 13 Table 2. Land use and farming use by parcel ...................................................................................................... 16 Table 3. Parcel use and land cover in the ALR ..................................................................................................... 17 Table 4. Status of the land base with respect to farming .................................................................................... 19 Table 5. Land use and cover on parcels “Used for farming” with land available for farming but not farmed ... 21 Table 6. Land use and cover on parcels “Not used for farming” with land available for farming ...................... 22 Table 7. Main field crop types by area ................................................................................................................ 24 Table 8. Forage & pasture crops by area ............................................................................................................. 27 Table 9. Vine & berry crops by area .................................................................................................................... 29 Table 10. Nursery & tree plantations by area ....................................................................................................... 30 Table 11. Top 20 crop types by area ...................................................................................................................... 31 Table 12. Greenhouses & crop barns by area ....................................................................................................... 32 Table 13. Main crop types and irrigation............................................................................................................... 34 Table 14. Top 20 field crop types and irrigation .................................................................................................... 35 Table 15. Livestock activities ................................................................................................................................. 37 Table 16. Number of farmed and not farmed parcels in the ALR ......................................................................... 46 Table 17. Farming and residences in the ALR ........................................................................................................ 49 Table 18. Farming and residence type in the ALR ................................................................................................. 49 Table 19. Main agriculture activity and largest residence on parcels "Used for farming" in the ALR .................. 51 Table 20. Main agriculture activity on "Used for farming” parcels with large or estate residences in the ALR ... 52

Township of Langley Land Use Inventory - Page iv
LLiisstt ooff FFiigguurreess
Figure 1. General location map ............................................................................................................................... 5 Figure 2. Agricultural Land Reserve location map .................................................................................................. 6 Figure 3. Inventory area and Agricultural Land Reserve location map................................................................... 7 Figure 4. Parcel inclusion in the ALR ..................................................................................................................... 11 Figure 5. Land cover and farmed area in the ALR ................................................................................................. 14 Figure 6. Availability and potential of ALR lands for farming ............................................................................... 20 Figure 7. Land cover available for farming but not farmed on ALR parcels “Used for farming” .......................... 22 Figure 8. Land cover available for farming but not farmed on ALR parcels “Not used for farming” ................... 23 Figure 9. Size of areas available for farming but not farmed on parcels “Not used for farming” ........................ 23 Figure 10. Main field crop types by percentage ..................................................................................................... 25 Figure 11. All cultivated crop fields by size ............................................................................................................. 25 Figure 12. Forage & pasture, vines & berries, nursery & tree plantations by size ................................................. 26 Figure 13. Forage & pasture fields by size .............................................................................................................. 27 Figure 14. Forage & pasture fields by size and type ............................................................................................... 28 Figure 15. Vine & berry fields by size ...................................................................................................................... 29 Figure 16. Blueberry, cranberry, and raspberry fields by size ................................................................................ 30 Figure 17. Nursery & tree plantations by size......................................................................................................... 30 Figure 18. Top 20 crop types by area ...................................................................................................................... 31 Figure 19. Distribution of greenhouses and crop barns by building type .............................................................. 33 Figure 20. Distribution of greenhouse and crop barn total area by building type ................................................. 33 Figure 21. Distribution of greenhouses and crop barns by crop type .................................................................... 33 Figure 22. Irrigation systems by percentage of cultivated land ............................................................................. 35 Figure 23. Livestock activities (excluding equine) by scale and type ...................................................................... 38 Figure 24. Livestock and equine activities by scale ................................................................................................ 38 Figure 25. Livestock activities (excluding equine) by parcel size and scale ............................................................ 38 Figure 26. Livestock activities (excluding equines) by parcel size and type ........................................................... 39 Figure 27. Livestock and equine activities by parcel size ........................................................................................ 39 Figure 28. Average area in forage, pasture and farm infrastructure on parcels with livestock activities (excluding
very small scale) ..................................................................................................................................... 40 Figure 29. Total area in forage, pasture, and farm infrastructure on parcels with livestock activities (excluding
very small scale) ..................................................................................................................................... 40 Figure 30. Percent of parcel area utilized for forage, pasture, and farm infrastructure on parcels with livestock
activities (excluding very small scale) .................................................................................................... 41 Figure 31. Land cover on parcels with livestock activities (excluding very small scale) ......................................... 41 Figure 32. Percentage of parcels “Used for farming” and with value-added activities .......................................... 43 Figure 33. Number of parcels with farming and value-added activities ................................................................. 43 Figure 34. Parcel inclusion in the ALR ..................................................................................................................... 44 Figure 35. Number of parcels in the ALR by parcel size .......................................................................................... 45 Figure 36. Total area in the ALR by parcel size ....................................................................................................... 45 Figure 37. Number of farmed and not farmed parcels in the ALR by parcel size ................................................... 46 Figure 38. Number of farmed and not farmed parcels in the ALR by parcel size (line chart) ................................ 46 Figure 39. Proportion of parcels farmed and not farmed by parcel size in the ALR ............................................... 47 Figure 40. Proportion of land cover by parcel size in the ALR ................................................................................ 47 Figure 41. Total area in residential footprint by parcel size ................................................................................... 49 Figure 42. Proportion of parcels with residences by parcel size ............................................................................ 50 Figure 43. Average percent of parcel area in residential footprint by parcel size.................................................. 50 Figure 44. Average total area in residential footprint by parcel size ...................................................................... 50 Figure 45. Total and potential area in residential footprint by parcel size ............................................................. 51

Township of Langley Land Use Inventory - Page v
LLiisstt ooff TTaabblleess –– AAppppeennddiixx AA
Table A1. Distribution of crop field sizes for all cultivated land .................................................................................... 53 Table A2. Distribution of forage & pasture fields .......................................................................................................... 53 Table A3. Distribution of vine & berry fields ................................................................................................................. 54 Table A4. Distribution of nursery & tree plantations .................................................................................................... 54 Table A5. Distribution of greenhouses and crop barns by building type ...................................................................... 55 Table A6. Distribution of greenhouses and crop barns by crop type ............................................................................ 55 Table A7. Distribution of livestock operations by type ................................................................................................. 56 Table A8. Beef activities ................................................................................................................................................ 56 Table A9. Distribution of beef activities by parcel size and scale ................................................................................. 57 Table A10. Dairy activities ............................................................................................................................................... 58 Table A11. Distribution of dairy activities by parcel size and scale ................................................................................. 58 Table A12. Poultry activities ............................................................................................................................................ 59 Table A13. Distribution of poultry activities by parcel size and scale ............................................................................. 60 Table A14. Sheep / lamb / goat activities ........................................................................................................................ 61 Table A15. Distribution of sheep / lamb / goat activities by parcel size and scale ......................................................... 61 Table A16. Equine activities ............................................................................................................................................ 62 Table A17. Distribution of equine activities by parcel size and scale .............................................................................. 63 Table A18. Value added activities ................................................................................................................................... 64 Table A19. Distribution of value added activities by parcel size ..................................................................................... 64 Table A20. Distribution of direct sales by parcel size and scale ...................................................................................... 65 Table A21. Distribution of agritourism events by parcel size and scale .......................................................................... 65 Table A22. Distribution of processing by parcel size and scale ....................................................................................... 66
LLiisstt ooff FFiigguurreess –– AAppppeennddiixx AA
Figure A1. Distribution of beef activities by parcel size and scale ................................................................................. 57 Figure A2. Land cover on parcels with beef activities .................................................................................................... 57 Figure A3. Distribution of dairy activities by parcel size and scale ................................................................................. 58 Figure A4. Land cover on parcels with dairy activities ................................................................................................... 59 Figure A5. Distribution of poultry activities by parcel size and scale ............................................................................. 60 Figure A6. Land cover on parcels with poultry activities ................................................................................................ 60 Figure A7. Distribution of sheep / lamb / goat activities by parcel size and scale ......................................................... 61 Figure A8. Land cover on parcels with sheep / lamb goat activities .............................................................................. 62 Figure A9. Distribution of equine activities by parcel size and scale .............................................................................. 63 Figure A10. Land cover on parcels with equine activities ................................................................................................ 63
Township of Langley Land Use Inventory - Page vi
LLiisstt ooff MMaappss –– AAppppeennddiixx BB
Map B1. Land cover and farmed area Map B2. Land cover and farmed area - detail Map B3. Land use and farming use by parcel Map B4. Land use and farming use by parcel - detail Map B5. Status of land base with respect to farming Map B6. Land not farmed but available and with potential for farming Map B7. Cultivated field crops Map B8. Forage & pasture crops Map B9. Vine & berry crops Map B10. Nursery & tree plantation crops Map B11. Greenhouses & crop barns Map B12. Irrigation Map B13. Livestock activities - all types including Equines Map B14. Livestock activities - beef Map B15. Livestock activities - dairy Map B16. Livestock activities - poultry Map B17. Equine activities Map B18. Parcel size in the ALR

Township of Langley Land Use Inventory - Page vii
AAccrroonnyymmss
AAC Agricultural Advisory Committee
AAP Agricultural Area Plan
AGRI BC Ministry of Agriculture
ALC Agricultural Land Commission
ALR Agricultural Land Reserve
ALUI Agricultural Land Use Inventory
GIS Geographic Information Systems
TOL Township of Langley
Township of Langley Land Use Inventory - Page viii
DDeeffiinniittiioonnss
General
Agricultural Land Reserve (ALR) – A provincial zone in which agriculture is recognized as the
priority use. Farming is encouraged and non-agricultural uses are controlled.
BC Assessment – The Crown corporation which produces annual, uniform property assessments that
are used to calculate local and provincial taxation. The database purchased from BC Assessment
contains information about property ownership, land use, and farm classification, which is useful for
land use surveys.
Cadastre – The GIS layer containing parcel boundaries, i.e. legal lot lines.
Crown ownership – Crown ownership includes parcels which are owned by municipal, provincial or
federal governments. Parcel ownership is determined by the Integrated Cadastre Fabric maintained by
the Parcel Fabric Section of the BC Government.
Farm classification for tax assessment – Applies to parcels producing the minimum dollar amount to
be classified as a farm by BC Assessment. Local governments apply a tax rate to farmland which is
usually lower than for other land. To receive and maintain the farm classification, the land must
generate annual income from agricultural production.
Farm Unit – An area of land used for a farm operation consisting of one or more contiguous or non-
contiguous parcels, that may be owned, rented or leased, which form and are managed as a single farm.
Land Cover
Anthropogenic – The term anthropogenic describes an effect or object resulting from human activity.
In this report, the term anthropogenic refers to land cover originating and maintained by human actions
but excludes farmed land cover; cultivated field crops, farm infrastructure, crop cover structures.
Anthropogenic – Built up - Other – Lands covered by various unused or unmaintained built objects
(structures) and associated yards that are not directly used for farming.
Anthropogenic – Managed vegetation – Lands seeded or planted for landscaping, dust or soil control
but not cultivated for harvest or pasture. Includes parklands, golf courses, landscaping, lawns, vegetated
enclosures, remediation areas.
Anthropogenic – Non Built or Bare – Human created bare areas such as extraction or disposal sites.
Includes piles, pits, fill dumps, dirt parking or storage areas.
Anthropogenic – Residential – Lands covered by built objects (structures) and their associated
auxiliary buildings, yards, roads, and parking. Includes single and multifamily dwellings, and mobile
homes.
Anthropogenic – Residential footprint – Includes the main residence plus its associated yard,
driveway, parking and any auxiliary buildings or structures. When two residences are on a property,
areas associated to both (e.g. shared driveways, parking or yard), are assigned to the closest residence.
Anthropogenic – Settlement – Lands covered by built objects (structures) and their associated yards,
roads and parking. Includes institutional, commercial, industrial, sports / recreation, military, non linear
utility areas and storage / parking.

Township of Langley Land Use Inventory - Page ix
Anthropogenic – The term anthropogenic describes an effect or object resulting from human activity.
In this report, the term anthropogenic refers to land cover originating and maintained by human actions
but excludes farmed land cover; cultivated field crops, farm infrastructure, crop cover structures.
Anthropogenic – Transportation – Lands covered by built objects (structures). Includes roads,
railways, and airports and associated buffers and yards.
Anthropogenic – Utilities – Lands covered by built objects (structures). Includes linear features such
as pipelines or transmission lines.
Anthropogenic Waterbodies – Areas covered by water, snow or ice due to human construction.
Includes reservoirs, canals, ditches, and artificial lakes - with or without non cultivated vegetation.
Crop cover structures – Land covered with built objects including permanent enclosed glass or poly
structures (greenhouses) with or without climate control facilities for growing plants and vegetation
under controlled environments, and barns used for growing crops such as mushrooms. Excludes non
permanent structures such as hoop or tunnel covers.
Cultivated field crops - Land under cultivation for harvest or pasture. Includes crop land, fallow
farmland, unused forage or pasture, un-housed container crops and crops under temporary covers.
Excludes natural pasture, rangeland, greenhouses, mushroom barns and other crop houses.
Farm infrastructure – Land covered by farm related built objects (structures) and their associated
yards, roads, parking. Includes barns, storage structures, paddocks, corrals, riding rings, farm equipment
storage, and specialized farm buildings such as hatcheries. Excludes greenhouses, mushroom barns and
other crop houses.
Natural and Semi-natural – Land cover which has not originated from human activities or is not being
maintained by human actions. Includes regenerating lands, and old farm fields.
Natural and Semi-natural – Grassland – Land cover dominated by herbaceous plants with long,
narrow leaves characterized by linear venation; including grasses, sedges, rushes, and other related
species.
Natural and Semi-natural – Herbaceous – Land cover dominated by native low, non woody plants
such as ferns, grasses, horsetails, closers and dwarf woody plants. If greater than 50% cover is grass, the
land is categorized as grassland.
Natural and Semi-natural – Natural bare areas – Includes bare rock areas, sands and deserts.
Natural and Semi-natural – Natural pasture – Smaller fenced areas usually on private land with
uncultivated (not sown) natural or semi-natural grasses, herbs or shrubs used for grazing domestic
livestock.
Natural and Semi-natural – Rangeland – Larger fenced areas usually on crown land with uncultivated
(not sown) natural or semi-natural grasses, herbs or shrubs used for grazing domestic livestock.
Natural and Semi-natural – Shrubland – Land where less than 10% crown cover is native trees and
at least 20% crown cover is multi-stemmed woody perennial plants, both evergreen and deciduous.
Natural and Semi-natural – Treed - closed – Land where between 60 and 100% of crown cover is
native trees.

Township of Langley Land Use Inventory - Page x
Natural and Semi-natural – Treed - open – Land where between 10 and 60% of crown cover is native
trees.
Natural pasture or rangeland – Land with uncultivated (not sown) natural or semi-natural grasses,
herbs or shrubs used for grazing domestic livestock. This land cover is considered “Used for grazing”
and “Not used for farming” although usually these areas are extensions of more intensive farming areas.
Unmaintained field crops – Land under cultivation for field crops which has not been maintained for
several years and probably would not warrant harvest.
Unmaintained forage or pasture – Land under cultivation for forage or pasture which has not been cut
or grazed during the current growing season and has not been maintained for several years.
Unused forage or pasture – Land under cultivation for forage or pasture which has not been cut or
grazed during the current growing season.
Unused greenhouse – Crop cover structure in good condition that is not currently used for farming
activities.
Livestock
Animal Unit Equivalent – A standard measurement used to compare different livestock types. One
animal unit equivalent is approximately equal to one adult cow or horse.
Scale of livestock operations – The scale system used in this report to describe livestock operations
includes 4 levels:
“Very Small Approximately 1 cow or horse or bison, 3 hogs, 5 goats or deer, 10 sheep, 50 turkeys, 100 chickens
(1 animal unit equivalent)
“Small” LESS THAN 25 cows or horses or bison, 75 hogs, 125 goats or deer, 250 sheep, 1250 turkeys, 2500
chickens (2 - 25 animal unit equivalents)
“Medium” LESS THAN 100 cows or horses or bison, 300 hogs, 500 goats or deer, 1000 sheep, 5,000 turkeys,
10,000 chickens (25 - 100 animal unit equivalents)
“Large” MORE THAN 100 cows or horses or bison, 300 hogs, 500 goats or deer, 1000 sheep, 5,000 turkeys,
10,000 chickens (over 100 animal unit equivalents)
Land Cover and Farming
Actively farmed – Land cover considered Farmed but excludes unused / unmaintained field crops, and
unmaintained greenhouses. Does not include natural pasture or rangeland.
Farmed – Land cover directly contributing to agricultural production (both actively farmed and
inactively farmed). Includes land in Cultivated field crops, Farm infrastructure and Crop cover
structures (see individual definitions). Does not include natural pasture or rangeland.
Inactively farmed. Land cover considered “Farmed” but is currently inactive. Includes unused /
unmaintained forage and pasture, unmaintained field crops, and unmaintained greenhouses. Does not
include natural pasture or rangeland.
Potential for farming – Land without significant topographical, physical or operational constraints to
farming such as steep terrain, land under water, or built structures. E.g., land with little slope, sufficient
soils and exhibiting a natural treed land cover would be considered as having potential for farming.

Township of Langley Land Use Inventory - Page xi
Land Use
No apparent use – Parcel with no apparent human use; natural area, long term fallow land, cleared land
not in production, abandoned or neglected land, abandoned or unused structures.
Resource protection & research – Government or private research activities (including agriculture).
Flood protection areas.
Water management – Areas used to actively or inactively manage water; reservoirs, dikes, ditches,
managed wetland.
Wildlife management – Areas used to actively manage wildlife; reserves, traplines, breeding areas, fish
ladders/ hatcheries, wild harvest
Land Use and Farming
Used for farming – Parcels where the majority of the parcel area is farmed OR parcels which exhibit
significant intensity of farming are considered “Used for farming”. Specifically, parcels that meet at
least one of the following criteria:
medium or large scale livestock, apiculture or aquaculture operations
at least 50% parcel area in cultivated field crops (excluding unused forage or pasture)
at least 50% parcel area built up with farm infrastructure
at least 25% parcel area built up with crop cover structures (excluding unmaintained structures)
at least 40% parcel area in cultivated field crops (excluding unused forage or pasture) or farm infrastructure and
small scale livestock, apiculture or aquaculture operations
at least 33% parcel area in cultivated field crops (excluding unused forage or pasture) and at least 55% parcel area in
cultivated field crops (excluding unused forage or pasture) or farm infrastructure
at least 10% parcel area in crop cover structures (excluding unmaintained structures) and at least 40% parcel area in
cultivated field crops (excluding unused forage or pasture) or farm infrastructure
at least 20% parcel area and at least 20 ha in cultivated field crops (excluding unused forage or pasture)
at least 25% parcel area and at least 10 ha in cultivated field crops (excluding unused forage or pasture)
at least 30% parcel area and at least 5 ha in cultivated field crops (excluding unused forage or pasture)
at least 10% parcel area and at least 2 ha built up with crop cover structures (excluding unmaintained structures)
at least 20% parcel area and at least 1 ha built up with crop cover structures (excluding unmaintained structures)
Not used for farming – Parcels that do not meet the “Used for farming” criteria presented above.
Used for grazing – Parcels “Not used for farming” with a significant portion of their area in natural
pasture or rangeland and evidence of active grazing domestic livestock.
Unavailable for farming – “Not used for farming” parcels where future agricultural development is
improbable because of a conflicting land use that utilizes the majority of the parcel area. For example,
most residential parcels are considered not available for farming if the parcel size is less than 0.4
hectares (approximately 1 acre) since most of the parcel is covered by built structures, pavement and
landscaping.
Available for farming – Parcels that can be used for agricultural purposes without displacing a current
use. Includes all parcels that do not meet the “Unavailable for farming” criteria.
Not used for farming but available – Parcels that do not meet the “Used for farming” criteria but can
be used for agricultural purposes without displacing a current use.

Township of Langley Land Use Inventory - Page 1
EExxeeccuuttiivvee SSuummmmaarryy
In the summer of 2010, the BC Ministry of Agriculture (AGRI) conducted an Agricultural Land Use
Inventory (ALUI) for the Township of Langley. The ALUI was funded in part by Metro Vancouver,
and was completed with in-kind support from the Township of Langley and Langley Environmental
Partners Society (LEPS).
ALUIs can be used to understand which agricultural activities are occurring in the surveyed area. The
data provides an estimate of the capacity for agricultural expansion, and the amount of land within the
Agricultural Land Reserve (ALR) that is not available for agriculture. The data can also be used to
estimate agricultural water demand with the use an irrigations water demand model.
The ALUI for Township of Langley was conducted using a drive-by inventory that recorded land cover
and land use on a per-parcel basis, as a “snapshot in time.” Four categories of parcels were included: i)
all parcels completely or partially in the ALR; ii) parcels zoned for Agriculture outside of the ALR; iii)
parcels outside of the ALR that were assessed as a farm by BC Assessment; and iv) parcels zoned as
Rural in the Metro Vancouver Regional Growth Strategy (which have agriculture as a permitted use).
The ALR in Langley consists of 23,406 ha. Ninety-five percent (95%) of this or 22,281 ha on 4,861
parcels was surveyed as part of this inventory. The remaining 5% or 1,125 ha of ALR was in road rights
of ways and parcels less than 100 square meters. An additional 1,630 ha of land was surveyed outside
the ALR, bringing the total survey area to 23,911 ha.
The data on each parcel was collected in two ways: land cover (the biophysical material at the surface
of the earth) and land use (how people utilize the land). A parcel could have numerous land covers, but
was assigned up to two land uses. These two methods of data collection allowed different forms of
analysis.
In terms of land cover in the ALR, a total area of 9,751 (42%) was farmed (both actively and inactively),
3,283 ha was anthropogenically modified (14%), and 9,247 ha was in a natural or semi-natural state
(39%). The remaining 1,125 ha (5%) was not surveyed, and was not available for farming. Farmed land
cover included cultivated field crops, farm buildings and structures, greenhouses and crop barns. It is
important to note that some of the anthropogenically modified land covers may support farming, e.g.
farm residences, vegetative buffers, and farm roads, but were not defined as ‘farmed’ land covers for the
purpose of this part of the analysis. An additional 650 ha outside of the ALR were farmed. See Table 1
and Map B1 for details.
In terms of land use, the entire parcel was examined, and a “Used for farming” definition was applied,
based on the percentage and/or scale of the parcel in cultivated crops, farm infrastructure, and/or certain
scales of livestock production. For a more detailed definition of “Used for farming” see the Definitions
section. In terms of land use in the ALR, 11,584 ha (49%) was defined as “Used for farming,” and
10,697 ha (46%) was defined as “Not used for farming”. In this analysis, farm residential uses and farm
roads, were included in the “Used for farming” subtotal (along with other mixed uses such as
commercial & service, protected areas/ parks, and institutional & community). As before, 1,125 ha (5%)
was not surveyed, and was not considered to be available for farming. See Table 2 and Maps B3 and B4
for details.
A third way to analyze the data is to analyze how much land is available for farming and how much of
that has the potential to be farmed. The characteristics of these two types of land are also examined.

Township of Langley Land Use Inventory - Page 2
This involved looking at both land covers and land use. Land may be unavailable for farming because
of existing land use (e.g. parks, golf courses), or may have limited potential for farming because of
physical limitations (e.g. steep slopes).
Of the 23,406 ha in Langley’s ALR, 1,125 ha (5%) was not surveyed, but would not be available to be
farmed or have the potential to be farmed (e.g. it was in road rights of way, etc.). A further 3,242 ha
(14%) was considered to be unavailable for farming due to existing land use or land cover (e.g. it was in
parks, golf courses, non-farm residential uses, etc.). Added to that was the 599 ha (2%) of the ALR that
is used in farm support (e.g. farmhouse residential footprint, artificial water bodies such as farm
reservoirs, and transportation such as farm roads). A further 1,123 ha (5%) was defined as having
limited potential for farming due to site limitations (e.g. drainage limitations, etc.). That left 9,314 ha
(40%) of the ALR that was actively farmed, and 8,003 ha (34%) of the ALR that was available for
farming. Of that 34%, 1,711 ha occurred on parcels that are already “Used for farming” and 6,292 ha
occurred on parcels not “Used for farming.” See Table 4, Figure 6 and Maps B5 and B6 for details.
On parcels “Used for farming” the largest gains for bringing more land into active agricultural
production would come from clearing natural and semi-natural vegetation (1,464 ha). See Figure 7 for
more details.
On parcels “Not used for farming” the largest gains for bringing more land into active agricultural
production would come from clearing land with natural and semi-natural vegetation (5,077 ha) and
converting land cover with “Anthropogenic managed vegetation” (e.g. lawns, gardens). See Figure 8 for
more details.
In terms of farming activities, two of the land covers were examined in detail: cultivated field crops and
greenhouses. The top three crops were forage & pasture at 6,822 ha (76% of all cultivated land)
followed by vines & berries at 1,378 ha (15%) and nursery & tree plantations at 467 ha (5%). Within
the berry category blueberries were the top crop in terms of area. Greenhouses and crop barns covered
148 ha of ALR land. See Table 7, Table 9, Table 12 and Maps B7 to B11 for more information.
Irrigation use was captured by crop type and irrigation system type, to aid in developing a water demand
model for agriculture in Metro Vancouver. Trickle systems were the most commonly used (839 ha) and
were found primarily on vines and berries. Sprinkler systems were the next most common (778 ha) and
were used on a broad range of crops. Giant gun systems were third (180 ha). See Table 13 and Map
B12 for more information.
Livestock activities were also recorded, but are very difficult to measure using a windshield survey
method. Livestock may be in barns, may be mobile, and may utilize more than one land parcel. The
inventory data does not identify animal movement between parcels that make up a farm unit, but reports
livestock at the parcel where the animals or related structures are observed. In Township of Langley,
equines were the most common type of livestock activity (with 950 out of 1,579 activities), followed by
poultry (200 out of 1,579 activities) and beef (199 out of 1,579 activities). There were 90 intensive
poultry activities in Langley and 110 non-intensive activities (e.g. backyard flocks). No actual livestock
numbers were obtainable through the survey, so the results were reported as a range in terms of animal
unit equivalents for each parcel. See the Definitions section for more information, as well as Table 15
and Maps B13 to B17.
In terms of condition of ALR lands, further analysis was conducted on 4,810 parcels with 22,264 ha or
95% of Langley’s ALR land. This additional analysis found that while 71% of ALR parcels are less
than 4 ha in size, they make up only 28% of the total area. The majority of these parcels are “Not used
Township of Langley Land Use Inventory - Page 3
for farming”. Over half (51%) of Langley’s ALR area is on parcels greater than 8 hectares. See Figures
35 to 37 for more information.
Residential uses occurred on 4,119 parcels, and 2,465 of those parcels were “Not used for farming”.
Houses greater than 3,500 sq. ft. in size were found on 671 parcels and nearly two-thirds of those houses
(64%) were on parcels “Not used for farming”. See Tables 17 and 18 for more information.
Summary
This report provides the necessary background to understand the current status of agriculture on the land
base and help make informed decision on how to best manage the agricultural land base in order to
support and strengthen farming in the future.
Township of Langley Land Use Inventory - Page 4
AAggrroollooggiisstt CCoommmmeennttss
The first farm in BC was established in the Township of Langley, and Langley has continued to be a
major agriculture community in BC. The Township has the third highest farm gates receipts in the
province and over the last census period (2006 – 2011) had the highest rate of growth in agriculture
output in the Fraser Valley. The information in this Land Use Inventory (LUI) points to some of the
reasons why this is happening.
The attached maps collectively show that Langley produces a wide variety of agriculture products from
horses to blueberries and from wine to forage. The main commodities are produced throughout the
Township and over the full range of lot sizes.
The ALR in Langley is characterized by having a high proportion of small lots relative to neighbouring
jurisdictions. Over 70% of the lots in the ALR in Langley are less than 10 acres and these small lots
represent almost 30% of the land base. The majority of these small lots were not “used for farming”.
This indicates why parcel subdivision in the ALR is generally not beneficial for agriculture.
The LUI found that just over 1/3 of the parcels in the ALR in Langley were being farmed and this
represented roughly half of the land available for farming. There are almost 1200 parcels between 5 and
20 acres in Langley that are not currently being farmed. Langley has land available in parcel sizes that
meet the needs of new or expanding farms that focus on intensive horticulture crops and intensive
livestock production.
Over 80% of the land available for farming, but not currently farmed, is in natural vegetation. A
growing agriculture sector in Langley will mean a changing landscape. While fish and wildlife needs
must be respected, land not currently farmed will need to be cleared for it to be actively farmed and for
the agriculture sector to expand.
The LUI survey team identified irrigation systems on almost 20% of the land being farmed. These were
on the more intensive crops such as berries, grapes, nurseries, and vegetables. As more farmland is
converted from lower revenue forage crops to higher revenue horticulture crops, the proportion of
farmland being irrigated will increase. A future challenge will be to determine the source for that
irrigation water in light of Langley’s “Water Management Plan” and potential restrictions on water use.
The LUI is a collection of maps and numbers that together paint a picture of the current state of
agriculture in the Township and identify areas of potential growth and change in the future. A large
number of medium sized unfarmed lots provide the basic resource for potential growth of intensive
horticulture and livestock production. As the growth occurs, there will be a loss of natural vegetation to
agriculture production and an increased use of irrigation.

Township of Langley Land Use Inventory - Page 5
GGeenneerraall CCoommmmuunniittyy IInnffoorrmmaattiioonn
The Township of Langley (TOL) is located east of Vancouver in southwestern British Columbia.
Township of Langley’s total area (including water) is 31,765 hectares1. The Township is bordered by
Surrey to the west, the Fraser River and Maple Ridge to the north, Abbotsford to the east, and the U.S.
border to the south. Township of Langley is part of the Greater Vancouver Regional District.
Figure 1. General location map
1 Government of British Columbia; Ministry of Community, Sport & Cultural Development, Local Government Statistics
http://www.cscd.gov.bc.ca/lgd/infra/library/regional_stats11_summary.pdf

Township of Langley Land Use Inventory - Page 6
AGRICULTURAL LAND RESERVE
The Agricultural Land Reserve (ALR) is a provincial land use zone that was designated in 1973 in
which agriculture is recognized as the priority use. Within the ALR, farming is encouraged and non-
agricultural uses are controlled.
There are 60,554 hectares2 of ALR land within the Greater Vancouver Regional District (shown in
Figure 2); 23,406 hectares3 or over 38% is within Township of Langley.
The land area of Township of Langley is 30,031 hectares4. With 23,406 hectares
3 in the ALR, 78% of
the Township’s land area is in the ALR. This area includes:
22,281 hectares in surveyed parcels
1,125 hectares outside surveyed parcels
1,123 hectares of designated rights-of-way
2 hectares of parcels less than 100 square meters
Figure 2. Agricultural Land Reserve location map
2 Provincial Agricultural Land Commission (ALC) Annual Report 2009/10 & 2010/11 Pg 39. http://www.alc.gov.bc.ca/publications/Annual_Report_2009-
10_and_2010-11.pdf. 3 Agricultural Land Commission, ALR mapping, Land and Resource Data Warehouse, 2010-01-31 (area calculated in GIS). 4 Calculated in GIS.

Township of Langley Land Use Inventory - Page 7
INVENTORY AREA
The total inventory area encompasses 6,188 parcels with a combined area of 23,911 hectares or almost
80% of the land area in Township of Langley. Included are all parcels:
completely or partially within the Agricultural Land Reserve
within Metro Vancouver’s Regional Growth Strategy “Agriculture” designation
within Metro Vancouver’s Regional Growth Strategy “Rural” designation and greater than 1 acre
classified by BC Assessment as having “Farm” status for property tax assessment
The amount of ALR land included in the inventory area is 22,281 hectares located on 4,861 parcels.
This area is over 95% of the ALR within Township of Langley. The remaining 5% of the ALR was
excluded from the inventory as it is in parcels less than 100 square metres or outside surveyed land
parcels in designated rights-of-way.
Figure 3. Inventory area and Agricultural Land Reserve location map

Township of Langley Land Use Inventory - Page 8
AAggrriiccuullttuurraall LLaanndd UUssee IInnvveennttoorryy
INVENTORY METHODOLOGY
AgFocus is an Agricultural Land Use Inventory System developed by BC Ministry of Agriculture’s
Strengthening Farming Program. AgFocus employs a “windshield” survey method designed to capture
a snapshot in time of land use and land cover on legal parcels. For more information on AgFocus,
please refer to these documents available from the Strengthening Farming Program:
AgFocus – A Surveyor’s Guide to Conducting an Agricultural Land Use Inventory
AgFocus – Field Guide to Conducting an Agricultural Land Use Inventory
AgFocus – A GIS Analyst’s Guide to Agricultural Land Use Inventory Data
The Township of Langley land use inventory was conducted in the
summer of 2010 by Langley Environmental Partners Society (LEPS).
The survey crew visited each property and observed land use, land
cover, and agriculture activity from the road. Where visibility was
limited, data was interpreted from aerial photography in combination
with local knowledge. A technician entered the survey data into a
database on a laptop computer.
Field survey maps provided the
basis for the survey and included:
The legal parcel boundaries (cadastre)5
Unique identifier for each legal parcel
The preliminary land cover polygon boundaries (digitized prior
to field survey using aerial photography)
Unique identifier for each preliminary land cover polygon
The boundary of the Agricultural Land Reserve (ALR)
Base features such as streets, street names, watercourses and
contours
Aerial photography
5 Cadastre mapping (2010) was provided by the Township of Langley through the Integrated Cadastral Information Society and compiled by Metro
Vancouver Regional District Staff.
Township of Langley Land Use Inventory - Page 9
DESCRIPTION OF THE DATA
For each property in the study area, data was collected on general land use and land cover. For
properties with agriculture present, data was collected on agricultural practices, irrigation, crop
production methods, livestock, agricultural support (storage, compost, waste), and activities which add
value to raw agricultural products.
Once acquired through the survey, the data was brought into a Geographic Information System (GIS) to
facilitate analysis and mapping. Digital data, in the form of a tabular database and GIS spatial layers
(for maps), may be available with certain restrictions through a terms of use agreement.
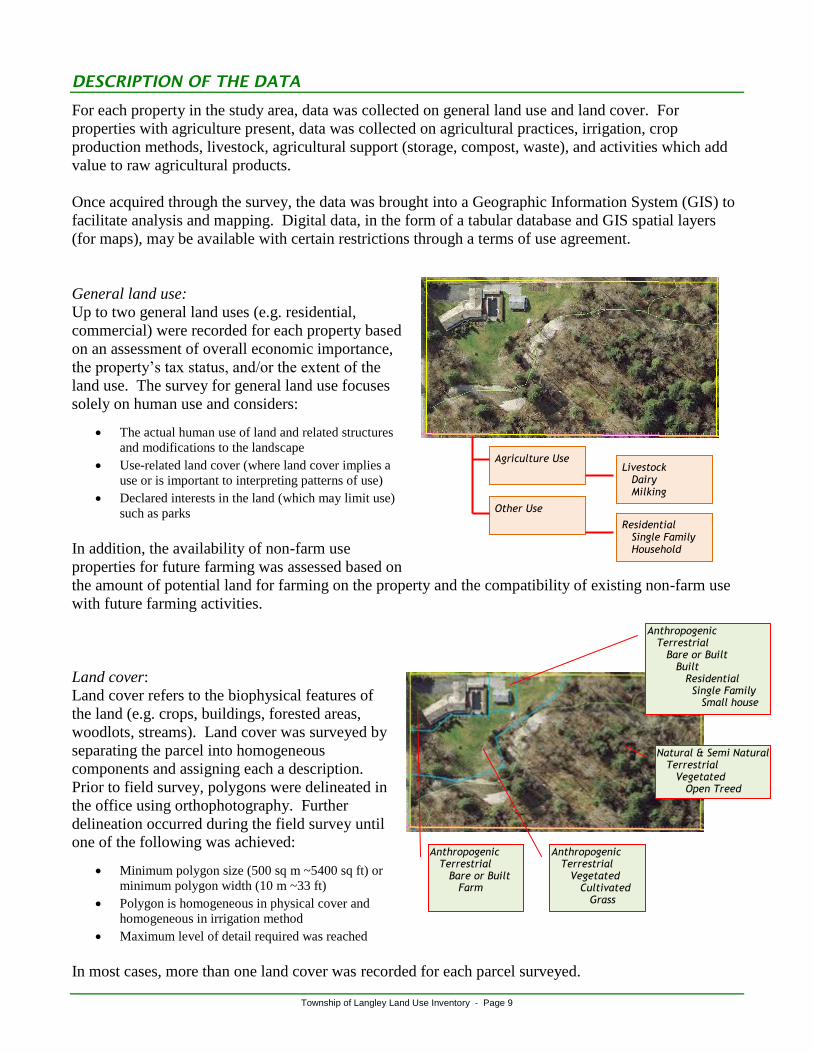
General land use:
Up to two general land uses (e.g. residential,
commercial) were recorded for each property based
on an assessment of overall economic importance,
the property’s tax status, and/or the extent of the
land use. The survey for general land use focuses
solely on human use and considers:
The actual human use of land and related structures
and modifications to the landscape
Use-related land cover (where land cover implies a
use or is important to interpreting patterns of use)
Declared interests in the land (which may limit use)
such as parks
In addition, the availability of non-farm use
properties for future farming was assessed based on
the amount of potential land for farming on the property and the compatibility of existing non-farm use
with future farming activities.
Land cover:
Land cover refers to the biophysical features of
the land (e.g. crops, buildings, forested areas,
woodlots, streams). Land cover was surveyed by
separating the parcel into homogeneous
components and assigning each a description.
Prior to field survey, polygons were delineated in
the office using orthophotography. Further
delineation occurred during the field survey until
one of the following was achieved:
Minimum polygon size (500 sq m ~5400 sq ft) or
minimum polygon width (10 m ~33 ft)
Polygon is homogeneous in physical cover and
homogeneous in irrigation method
Maximum level of detail required was reached
In most cases, more than one land cover was recorded for each parcel surveyed.
Agriculture Use Livestock Dairy Milking
Other Use
Residential Single Family Household
Anthropogenic Terrestrial Bare or Built Farm
Natural & Semi Natural Terrestrial Vegetated Open Treed
Anthropogenic Terrestrial Vegetated Cultivated Grass
Anthropogenic Terrestrial Bare or Built Built Residential Single Family Small house

Township of Langley Land Use Inventory - Page 10
Agricultural practices: Surveyors recorded agricultural practices associated with crops or livestock
activities. For example, if a forage crop was being harvested for hay, it was recorded. Irrigation was
also recorded, including the type of system used.
Agricultural crop production: Crop production and crop protection methods observed on the parcel
were recorded such as wildlife scare devices, temperature or light control, or organic production.
Organic production is not always visible and may have been recorded based on local knowledge or
farmer interviews.
Livestock: Livestock operations and confinement methods along with the scale of the activity were
estimated and recorded. Livestock not visible at the time of survey may have been inferred based on
grazed pastures, manure storage, size of barn and other evidence.
Agricultural support: Ancillary agricultural activities, such as storage, compost or waste, supporting the
production of a raw commodity on a farm unit were recorded.
Agricultural value added: Activities that add value to a raw commodity where at least 50% of the raw
commodity is produced on the farm unit were recorded. This value-added activity included processing,
direct sales and agri-tourism activities.
PRESENTATION OF THE DATA
The data is presented in the form of summarized tables and charts. Absolute data values are preserved
throughout the summarization process to maintain precision. Data values are rounded to the nearest
whole number during the final formatting of the summarized tables and charts. As a result, data
presented in the summarized tables and charts may not appear to add up correctly.

Township of Langley Land Use Inventory - Page 11
DETERMINATION OF PARCELS WITHIN THE ALR
Since much of the following analysis is parcel based, it is important to note that the ALR boundaries are
not always coincident with parcel boundaries. As a result, many parcels have only a portion of their area
in the ALR.
Figure 4 illustrates the frequent misalignment between parcel boundaries and the ALR boundary. Given
that the dark green line represents the ALR boundary, Lot A is completely in the ALR and Lots B and C
have a portion of their area in the ALR. Lot D is completely outside the ALR.
Many of the results presented in this report include 3 separate totals: the total parcel area, the portion of
the parcel inside the ALR, and the portion of the parcel outside the ALR.
Figure 4. Parcel inclusion in the ALR

Township of Langley Land Use Inventory - Page 12
11.. LLaanndd CCoovveerr aanndd FFaarrmmeedd AArreeaa
Land cover describes the biophysical material at the surface of the earth and is distinct from land use
which describes how people utilize the land.
Land use is surveyed by assigning the parcel up to two land uses. Some examples of land use are
Residential, Commercial and Industrial. Refer to Section 2 of this report for more information on land
use.
Land cover is surveyed by separating the parcel into homogeneous components and assigning each a
description such as landscape lawn, natural open treed, anthropogenic wetland, blueberries, road, or
small single family house. Most surveyed parcels have numerous different land cover types with each
describing a different area of the parcel. Land cover more closely approximates the actual area of land
in agricultural production or “Farmed” than land use.
Four land cover types are considered “Farmed”:
Cultivated field crops: vegetation under cultivation for harvest or pasture including land
temporarily set aside from farming and perennial crops that were not harvested or grazed in the
current growing season
Farm infrastructure: built structures associated with farming such as barns, stables, corrals,
riding rings, and their associated yards
Greenhouses: permanent enclosed glass or poly structures with or without climate control
facilities for growing plants and vegetation under controlled environments.
Crop barns: permanent enclosed structures with non-translucent wall for growing crops such as
mushrooms or bean sprouts
Forage and pasture field crops which have not been cut or grazed during the current growing season
(unused), unmaintained field crops, and unmaintained greenhouses are considered “Farmed” land covers
but are considered inactive.
Natural pasture and rangeland are fenced areas with uncultivated (not sown) natural or semi-natural
grasses, herbs or shrubs used for grazing domestic livestock. These areas are considered “Natural and
Semi-natural” and not “Farmed” although these areas are usually extensions of more intensive farming
areas.
Land cover types which may support farming, such as farm residences, vegetative buffers and farm road
access, are not considered “Farmed”.

Township of Langley Land Use Inventory - Page 13
Table 1. Land cover and farmed area
In ALR (ha) % of ALR
Cultivated field crops 8,354 36% 157 8,511 36%
Farm infrastructure 816 3% 42 858 4%
Greenhouses 124 < 1% <1 125 < 1%
Crop barns 19 < 1% <1 19 < 1%
Unused forage or pasture 401 2% 10 411 2%
Unmaintained field crops 32 < 1% <1 32 < 1%
Unmaintained greenhouses 2 < 1% <1 2 < 1%
Unused greenhouses <1 < 1% - <1 < 1%
Unmaintained crop barns 2 < 1% <1 2 < 1%
9,751 42% 210 9,961 42%
Managed vegetation 1,418 6% 232 1,650 7%
Non Built or Bare 145 < 1% 30 175 < 1%
Residential footprint 907 4% 379 1,285 5%
Settlement 397 2% 67 464 2%
Transportation 170 < 1% 38 208 < 1%
Utilities 37 < 1% 10 47 < 1%
Built up - Other 77 < 1% 5 81 < 1%
Waterbodies 133 < 1% 10 143 < 1%
3,283 14% 771 4,053 17%
Vegetated 8,613.54 37% 625 9,239 39%
Wetlands 358.22 1% 15 373 2%
Waterbodies 275.05 1% 10 285 1%
9,247 39% 650 9,897 41%
22,281 95% 1,630 23,911 100%
Rights-of-way 1,123 5%
Parcels < 100 m2 2 < 1%
1,125 5%
23,406 100%
Inactively Farmed
TOTAL
FARMED SUBTOTAL
SUBTOTAL
SUBTOTAL
TOTAL
SUBTOTAL
Not surveyed
Natural and
Semi-natural
Anthropogenic
(not farmed)
Actively farmed
Total area
(ha)
% of
inventory
area
Land cover
ALROutside
ALR (ha)
Table 1 shows the extent of different land cover types across the entire inventory area.
In Township of Langley, 9,961 hectares of land is in “Farmed” land cover although 448 of those hectares are “Inactively farmed” in unused forage or pasture, unmaintained field crops or unmaintained and unused greenhouses and crop barns.
Refer to Maps B1 and B2 in Appendix B for more information.

Township of Langley Land Use Inventory - Page 14
Figure 5. Land cover and farmed area in the ALR
Actively farmed-Cultivated field crops,
36%Actively farmed -Farm infrastructure,
3%
Actively farmed -Greenhouses, crop barns
<1%
Inactively farmed-Greenhouses, crop barns
<1%
Inactively farmed-Unused, unmaintained
fields, 2%
Not surveyed, right-of-way,parcels <100 sq m,
5%
Anthropogenic,14% Natural &
Semi-natural,39%
Figure 5 shows the proportions of the different land cover types across the ALR in Township of Langley (TOL).
Of TOL’s ALR land, 40% is “Actively Farmed” while 2% is in unused forage, unused pasture, unmaintained field crops, and unmaintained or unused greenhouses or crop barns (“Inactively Farmed”)
Land used in support of farming such as farm residences, vegetative buffers or roadways is not included as “Farmed”.
Township of Langley Land Use Inventory - Page 15
22.. LLaanndd UUssee aanndd FFaarrmm UUssee
Land use focuses solely on human use and describes the economic function or type of establishment
using the parcel. A parcel can have a variety of activities on the land, yet serve a single use. For
example, two parcels are said to be “Used for farming”, even if one is a dairy farm and the other is in
blueberries. If one parcel is a hotel and the other is a retail store, they are both considered as
“Commercial” land use.
Up to two general land uses (e.g. residential, commercial) are recorded for each parcel with each
considered an equally important function of the parcel. Evaluation of land uses are based on overall
economic importance, the property’s tax status, and/or the extent of the land use.
Parcels where the majority of the parcel area is utilized for farming or parcels which exhibit significant
evidence of intensive farming are considered “Used for farming”. For a complete definition of “Used
for farming”, refer to the Definitions section of this report.
Parcels considered “Not used for farming” with a significant portion of their area in natural pasture or
rangeland and evidence of active grazing domestic livestock are considered “Used for grazing”.
Many parcels “Used for farming” or “Used for grazing” are also used for other purposes such as
“Residential” or “Industrial”. This report does not attempt to determine which use is primary.

Township of Langley Land Use Inventory - Page 16
Table 2. Land use and farming use by parcel
In ALR
(ha)
% of ALR
area
1,528 7 % 33 1,562 7 % 198 3 % 8
Residential 9,483 41 % 197 9,680 40 % 1,765 29 % 5
Commercial & service 188 <1 % 1 189 <1 % 18 <1 % 10
Protected area / park / reserve 186 <1 % < 1 187 <1 % 11 <1 % 17
First Nations- Band Settlement 109 <1 % < 1 109 <1 % 1 <1 % 109
Recreation & leisure 33 <1 % 4 37 <1 % 2 <1 % 19
Institutional & community 26 <1 % - 26 <1 % 3 <1 % 9
Wildlife management 26 <1 % - 26 <1 % 1 <1 % 26
Utilities 5 <1 % < 1 5 <1 % 1 <1 % 5
11,584 49 % 236 11,820 49 % 2,000 32 %
Residential 6,944 30 % 1,013 7,958 33 % 3,540 57 % 2
No apparent use 1,583 7 % 188 1,770 7 % 342 6 % 5
Protected area / park / reserve 850 4 % 27 877 4 % 87 1 % 10
Military 362 2 % < 1 362 2 % 1 <1 % 362
Golf 357 2 % < 1 357 1 % 12 <1 % 30
Transportation 183 <1 % 14 197 <1 % 50 <1 % 4
Commercial & service 148 <1 % 20 167 <1 % 41 <1 % 4
Land in transition 59 <1 % < 1 59 <1 % 3 <1 % 20
Institutional & community 57 <1 % 17 73 <1 % 33 <1 % 2
Recreation & leisure 51 <1 % 16 67 <1 % 8 <1 % 8
First Nations 38 <1 % < 1 38 <1 % 1 <1 % 38
Industrial 35 <1 % 30 65 <1 % 31 <1 % 2
Water management 21 <1 % - 21 <1 % 19 <1 % 1
Utilities 11 <1 % 38 48 <1 % 12 <1 % 4
Communications < 1 <1 % 13 14 <1 % 1 <1 % 14
Gravel extraction < 1 <1 % 17 17 <1 % 7 <1 % 2
10,697 46 % 1,394 12,091 51 % 4,188 68 %
22,281 95 % 1,630 23,911 100 % 6,188 100 %
Rights-of-way 1,123 5 %
Parcels < 100 m2 2 <1 %
1,125 5 %
23,406 100 %
SUBTOTAL
TOTAL
Total
area (ha)
% of
parcels
NOT USED FOR FARMING SUBTOTAL
TOTAL
Not used for
farming
Not surveyed
Average
parcel
size (ha)
Used only for farming - no other use
% of
inventory
area
Number
of
parcels
USED FOR FARMING SUBTOTAL
Parcel land use
ALR
Outside
ALR (ha)
Used for
farming -
Mixed use
Table 2 shows that 11,584 hectares or 49% of TOL’s ALR is on parcels “Used for farming”.
Most “Used for farming” parcels are also used for other purposes with only 198 parcels or 7% of the ALR area used exclusively for farming.
Campbell Valley Regional Park contains 112 hectares of land that is mixed use “Protected area/ park/ reserve” and “Used for farming”. The park contains forage fields and a riding arena. Aldergrove and Derby Reach regional parks also contain lands with the mixed use “Protected area/ park/ reserve” and “Used for farming”
Refer to Maps B3 and B4 in Appendix B for more information.

Township of Langley Land Use Inventory - Page 17
Table 3. Parcel use and land cover in the ALR
In ALR
(ha)
% of ALR
area
In ALR
(ha)
% of ALR
area
In ALR
(ha)
% of ALR
area
In ALR
(ha)
% of ALR
area
1,298 6 % 62 <1 % 169 <1 % 1,528 7 %
Residential 7,002 30 % 789 3 % 1,692 7 % 9,483 41 %
Commercial & service 102 <1 % 28 <1 % 57 <1 % 188 <1 %
Protected area / park / reserve 112 <1 % 3 <1 % 71 <1 % 186 <1 %
First Nations- Band Settlement 19 <1 % 7 <1 % 84 <1 % 109 <1 %
Recreation & leisure 19 <1 % 11 <1 % 3 <1 % 33 <1 %
Institutional & community 20 <1 % 2 <1 % 4 <1 % 26 <1 %
Wildlife management 13 <1 % 3 <1 % 10 <1 % 26 <1 %
Utilities 4 <1 % < 1 <1 % < 1 <1 % 5 <1 %
8,589 37 % 905 4 % 2,090 9 % 11,584 49 %
1,161 5 % 2,379 10 % 7,157 31 % 10,697 46 %
9,750 42 % 3,284 14 % 9,247 40 % 22,281 95 %
1,123 5 %
2 <1 %
1,125 5 %
23,406 100 %
Land Cover Category
Anthropogenic
(not farmed)
Natural & Semi -
naturalFarmed *
Total
* Some parcels that are "Not used for farming" have "Farmed" land cover, however, the extent or intensity is insufficient for the parcel to be considered "Used
for farming". For a complete definition of “Used for farming”, refer to the Definition section of this report.
Not used for farming
Rights-of-way
Parcels < 100 m²
SUBTOTAL
TOTAL ALR
Not surveyed
SUBTOTAL
SUBTOTAL
Used only for farming - no other use
Parcel Land Use
Used for farming -
mixed use
Table 3 combines land use and land cover on ALR land in Township of Langley. For example, parcels with the mixed use “Used for farming” and “Residential” have a total of 7,002 hectares in “Farmed” land cover, 789 hectares in “Anthropogenic” (not farmed) land cover, and 1,692 hectares in “Natural & Semi-natural” land cover.
Although 11,584 hectares or 49% of TOL’s ALR is on parcels “Used for farming” (refer to Table 2), only 9,750 hectares or 42% of the ALR is actually in “Farmed” land cover as many “Used for farming” parcels are also used for other purposes. In fact, the majority of the “Farmed” land cover is on parcels also used for “Residential” purposes.

Township of Langley Land Use Inventory - Page 18
33.. AAvvaaiillaabbiilliittyy ooff LLaanndd ffoorr FFaarrmmiinngg
The demand for locally grown agricultural products is anticipated to grow as the population grows 6.
This demand along with a number of other factors, such as commodity types and farm management
requirements (nutrient management, bio-security), will influence agricultural land needs in the future.
Growth in extensive agriculture sectors such as dairy or berry will require large increases in land base
which may not be available. Future agriculture growth may come from new commodity types and
intensifying land use rather than finding new land for development.
The analysis of the availability of land for farming examines how much land is available for farming,
has the potential to be farmed, and the characteristics of this land.
Properties currently “Used for farming” or with some agriculture present are considered available for
farming regardless of any existing non-farm use. In addition, properties with an existing use compatible
with agriculture, such as Residential, are considered available for farming since the existing land use can
be maintained.
Properties not currently farmed with an established non-farm use
that is incompatible with agriculture are considered unavailable
for farming. These properties tend to have very high land values
making it unrealistic for a farmer to acquire and convert this land
to farmland.
Land is further assessed for its farming potential based on
physical and environmental characteristics. Only areas in natural
and semi-natural vegetation, areas in managed vegetation
(managed for landscaping, dust or soil control), and non-built or bare areas are considered to have
potential for farming. Areas covered with built structures, steep slopes or rocky soils and areas with
operational constraints such as very small size are considered to have limited potential for farming. For
this analysis, it is assumed that removing built structures and fill piles, filling in water bodies or
remediating slopes to create land with potential for farming would likely not occur.
6 In BC, the regulated marketing system requires that over 95% of our milk, eggs, chicken and turkey be produced in BC. The need to produce these
products increases in direct proportion to the population growth.
In Township of Langley, properties in the ALR and “Used for farming” have an average assessed value of $95,759 per hectare while properties in the ALR but unavailable for farming have an average assessed value of $1,030,085 per hectare.
(Calculated using 2011 BC Assessment database – total property value)

Township of Langley Land Use Inventory - Page 19
Table 4. Status of the land base with respect to farming
In ALR
(ha)
% ALR
Area
Cultivated field crops 8,354 36 % 157 8,511 36 %
Farm infrastructure 816 3 % 42 858 4 %
Greenhouses 124 <1 % < 1 125 <1 %
Crop barns 19 <1 % < 1 19 <1 %
9,314 40 % 199 9,513 40 %
Residential footprint 358 2 % 25 383 2 %
Built up - Other 139 <1 % 3 142 <1 %
Artificial Waterbodies 84 <1 % < 1 84 <1 %
Transportation 17 <1 % 1 18 <1 %
599 2 % 29 627 3 %
Protected area / park / reserve 756 3 % 17 773 3 %
Military 362 2 % < 1 362 2 %
Golf 357 2 % < 1 357 1 %
Residential 151 <1 % 283 434 2 %
Transportation 129 <1 % 12 141 <1 %
Land in transition 57 <1 % < 1 57 <1 %
Commercial & service 48 <1 % 18 65 <1 %
Recreation & leisure 32 <1 % 5 37 <1 %
Institutional & community 23 <1 % 11 34 <1 %
Industrial 13 <1 % 27 40 <1 %
Water management 9 <1 % < 1 9 <1 %
Utilities 2 <1 % 17 19 <1 %
Wetlands & waterbodies 543 2 % 30 573 2 %
Residential footprint 435 2 % 127 562 2 %
Built up - Other 280 1 % 25 305 1 %
Transportation 35 <1 % 22 57 <1 %
Utilities 10 <1 % 7 17 <1 %
3,242 14 % 599 3,841 16 %
Physical limitation (drainage, slope, soils) 965 4 % 124 1,089 5 %
Operational 158 <1 % 59 217 <1 %
1,123 5 % 182 1,306 5 %
Natural & Semi-natural - Vegetation 6,541 28 % 430 6,972 29 %
Anthropogenic - Managed vegetation 927 4 % 163 1,090 5 %
Unused forage or pasture 397 2 % 10 407 2 %
Anthropogenic - Non Built or Bare 101 <1 % 17 118 <1 %
Unmaintained field crops 32 <1 % < 1 32 <1 %
Unused/unmaintained greenhouses 3 <1 % < 1 3 <1 %
Unmaintained crop barns 2 <1 % < 1 2 <1 %
8,003 34 % 621 8,624 36 %
22,281 95 % 1,630 23,911 100 %
Rights-of-way 1,123 5 %
Parcel areas < 100 sq m 2 <1 %
1,125 5 %
23,406 100 %
SUPPORTING FARMING
Available & with
potential for farming
UNAVAILABLE FOR FARMING
AVAILABLE & WITH POTENTIAL FOR FARMING
LIMITED POTENTIAL FOR FARMING
Site limitations
Unavailable for
farming due to
existing land cover
Unavailable for
farming due to
existing land use
Actively farmed
Anthropogenic areas
supporting farming
%
inventory
area
Land status
ALR
ACTIVELY FARMED
Outside
ALR (ha)
Total area
(ha)
TOTAL
TOTAL
SUBTOTAL
Not surveyed
Table 4 shows that 2,900 hectares or 13% of the inventory area is not farmed but is available and is not limited by Table 4 shows that 8,624 hectares or 36% of the inventory area is not farmed, but is available for farming, and is not limited
by existing land cover, land use, or other site limitations. Almost all of this is ALR land, with only 621 hectares outside.
Refer to Map B5 in Appendix B for more information.

Township of Langley Land Use Inventory - Page 20
Figure 6. Availability and potential of ALR lands for farming
ALR 23,406 ha Non - ALR, 6,625 ha
0 ha 10,000 ha 20,000 ha 30,000 ha
Municipality 30
,03
1
22,281 ha or 95% of the ALR1,125
ha
0 ha 5,000 ha 10,000 ha 15,000 ha 20,000 ha
Areas not surveyed
23
,40
6
ALR Surveyed
Outside surveyed parcels (Rights-of-way and parcels < 100 sq m)
17,317 ha or 74% of the ALR1,123
ha
0 ha 5,000 ha 10,000 ha 15,000 ha 20,000 ha
23
,40
6
ALR Land Cover - Potential for farming
Limitations: slope, soils, drainage, size
Limited potential for farming
20,342 ha or 87% of the ALR
0 ha 5,000 ha 10,000 ha 15,000 ha 20,000 ha
23
,40
6
ALR Land Use - Availability for farmingProtected area / park / reserve
Military
Golf
Built up
Residential
Other
Not available for farming
8,003 ha or 34% of the ALR
Currently farmed 9,314 ha or 40% of the ALR
0 ha 5,000 ha 10,000 ha 15,000 ha 20,000 ha
23
,40
6
ALR - Farming status
Land not farmed but with potential
Land currently farmed
Farming status
Land not farmed but available & with potential for farming,
8,003 ha
1,711 ha
6,292 ha
On parcels "Used for farming"
On parcels "Not Used for farming"
Land not farmed but available & with potential for farming
18,440 ha or 79% of the ALR
0 ha 5,000 ha 10,000 ha 15,000 ha 20,000 ha
23
,40
6
ALR Land Cover - Availability for farming
Residential footprint
Built up (includes farm suppport)
Waterbodies
Wetlands
Not available for farming
Figure 6 demonstrates that 17,317 hectares or 74% of Township of Langley’s ALR is currently available for farming once road rights-of-way, protected areas, parks, golf courses, residential footprints, other land uses incompatible with agriculture, and physical limitations are taken into account.
Of those 17,317 hectares, 9,314 hectares are actively farmed and 8,003 hectares are available and have potential for farming.
Refer to Map B6 in Appendix B for more information.
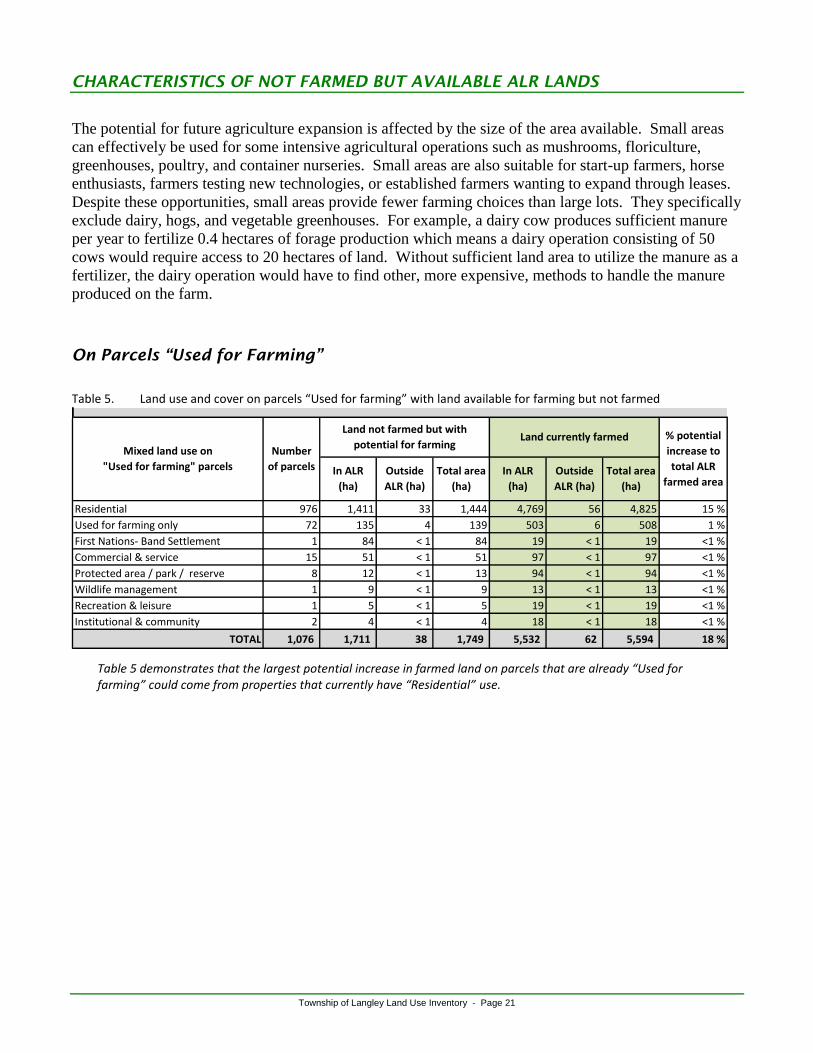
Township of Langley Land Use Inventory - Page 21
CHARACTERISTICS OF NOT FARMED BUT AVAILABLE ALR LANDS
The potential for future agriculture expansion is affected by the size of the area available. Small areas
can effectively be used for some intensive agricultural operations such as mushrooms, floriculture,
greenhouses, poultry, and container nurseries. Small areas are also suitable for start-up farmers, horse
enthusiasts, farmers testing new technologies, or established farmers wanting to expand through leases.
Despite these opportunities, small areas provide fewer farming choices than large lots. They specifically
exclude dairy, hogs, and vegetable greenhouses. For example, a dairy cow produces sufficient manure
per year to fertilize 0.4 hectares of forage production which means a dairy operation consisting of 50
cows would require access to 20 hectares of land. Without sufficient land area to utilize the manure as a
fertilizer, the dairy operation would have to find other, more expensive, methods to handle the manure
produced on the farm.
On Parcels “Used for Farming”
Table 5. Land use and cover on parcels “Used for farming” with land available for farming but not farmed
Residential 976 1,411 33 1,444 4,769 56 4,825 15 %
Used for farming only 72 135 4 139 503 6 508 1 %
First Nations- Band Settlement 1 84 < 1 84 19 < 1 19 <1 %
Commercial & service 15 51 < 1 51 97 < 1 97 <1 %
Protected area / park / reserve 8 12 < 1 13 94 < 1 94 <1 %
Wildlife management 1 9 < 1 9 13 < 1 13 <1 %
Recreation & leisure 1 5 < 1 5 19 < 1 19 <1 %
Institutional & community 2 4 < 1 4 18 < 1 18 <1 %
TOTAL 1,076 1,711 38 1,749 5,532 62 5,594 18 %
Mixed land use on
"Used for farming" parcels
Number
of parcels
Land not farmed but with
potential for farmingLand currently farmed % potential
increase to
total ALR
farmed areaIn ALR
(ha)
Outside
ALR (ha)
Total area
(ha)
In ALR
(ha)
Outside
ALR (ha)
Total area
(ha)
Table 5 demonstrates that the largest potential increase in farmed land on parcels that are already “Used for farming” could come from properties that currently have “Residential” use.

Township of Langley Land Use Inventory - Page 22
Figure 7. Land cover available for farming but not farmed on ALR parcels “Used for farming”
1,464
191
46
5
4
1
0 200 400 600 800 1000 1200 1400 1600
Natural & Semi-natural vegetation
AnthropogenicManaged vegetation
AnthropogenicNon built or bare
Unmaintainedfield crops
Unused forage or pasture
Unused/unmaintainedgreenhouses
ALR area (ha)
Cu
rre
nt l
and
co
ver
On Parcels “Not Used for Farming”
Table 6. Land use and cover on parcels “Not used for farming” with land available for farming
Residential 2322 4,682 389 5,071 50 %
No apparent use 257 1,353 125 1,478 15 %
Protected area / park / reserve 11 75 9 84 <1 %
Commercial & service 19 57 < 1 58 <1 %
First Nations 1 37 < 1 37 <1 %
Transportation 3 29 < 1 29 <1 %
Institutional & community 11 25 3 28 <1 %
Recreation & leisure 3 15 10 24 <1 %
Industrial 7 9 2 11 <1 %
Utilities 4 6 15 21 <1 %
Water management 1 2 - 2 <1 %
Land in transition 1 1 < 1 1 <1 %
Communications 1 < 1 13 14 <1 %
Gravel extraction 7 < 1 14 14 <1 %
2,648 6,292 583 6,875 68 %
Parcel Land use
TOTAL
% potential
increase to
total ALR
farmed area
Number of
parcels
Land not farmed but with
potential for farming
In ALR (ha)Outside
ALR (ha)
Total area
(ha)
Not used for
farming
Figure 7 indicates that clearing land covered with “Natural and Semi-natural” vegetation would offer the greatest gains in farmed land on parcels that are already “Used for Farming”.
“Anthropogenic managed vegetation” mainly consists of landscaping and lawns surrounding residential uses. Converting this to agricultural use may not be supported by the landowners.
Table 6 illustrates that for parcels currently “Not used for farming”, the greatest potential for increasing actively farmed land would come from parcels with “Residential” use and parcels with “No apparent use”.

Township of Langley Land Use Inventory - Page 23
Figure 8. Land cover available for farming but not farmed on ALR
parcels “Not used for farming”
5,077
736
392
56
27
4
0 1000 2000 3000 4000 5000 6000
Natural & Semi-naturalvegetation
AnthropogenicManaged vegetation
Unused forageor pasture
AnthropogenicNon built or bare
Unmaintainedfield crops
Unmaintained green-houses/ crop barns
ALR area (ha)
Curr
ent
land
cov
er
Figure 9. Size of areas available for farming but not farmed on parcels “Not used for farming”
2077
782
10
26
22
5
18
8
20
5
85
32
83 27
56
8
1,635
571
695
1,258
1,013
721
383
0
200
400
600
800
1000
1200
1400
1600
1800
0
200
400
600
800
1,000
1,200
< 0
.2
0.2
-0
.4
0.4
-1
1 -
2
2 -
3
3 -
4
4 -
8
8 -
16
16
-3
2
32
-6
4
>=
12
8
Total area (ha)N
um
be
r o
f a
rea
s
Area (ha)
Number of areas Total area (ha)
Figure 9 demonstrates that that majority of the areas available for farming (1929 of 2648 or 73%) are less than 2 hectares in size. These small areas have fewer options available to efficiently farm the land.
Larger areas provide a wider range of options to bring the land into farming production. The areas greater than 4 hectares and available for farming in Township of Langley, total 3,375 hectares or 49% of the 6,875 hectares available.
Figure 8 indicates that clearing land covered with “Natural and Semi-natural vegetation” would provide the greatest gains in farmed land on parcels currently “Not used for farming”. Bringing unused forage or pasture back into production would also increase the amount of farmed land.

Township of Langley Land Use Inventory - Page 24
44.. FFaarrmmiinngg AAccttiivviittiieess
CULTIVATED FIELD CROPS
Cultivated field crops are captured in a geographical information system at the field or land cover
polygon level by crop type (vegetables, forage or pasture, berries, etc.). Each crop type is then
summarized to total land area and evaluated for field size characteristics.
Included with cultivated field crops is fallow farmland, inactively farmed land (i.e. forage or pasture
crops which have not been harvested or grazed this season) and land temporarily set aside for wildlife or
other purposes. Also included is bare cultivated land or land under preparation for planting as it is
assumed these lands will be planted in the survey season. Excluded are crops grown in crop cover
structures such as greenhouses or mushroom barns.
Cultivated field crops in Township of Langley (TOL) are described by ten crop groupings:
Forage & pasture: grass, mixed grass/ legumes, forage corn
Vines & berries: blackberries, blueberries, cranberries, raspberries, strawberries, grapes
Nursery & tree plantations: ornamentals & shrubs, cedar hedging, Christmas trees, fibre/pulp/veneer trees
Vegetables: cole, mixed, sweet corn, pumpkins, cucurbits
Other: bare cultivated land, crop transition, fallow land
Turf
Nut trees
Tree fruits
Oats
Floriculture
Table 7. Main field crop types by area
In ALR (ha) % of ALR
Forage & pasture 6,680 29% 142 6,822 76%
Vines & berries 1,374 6% 3 1,378 15%
Nursery & tree plantations 453 2% 14 467 5%
Vegetables 131 < 1% 4 135 2%
Other* 55 < 1% < 1 55 < 1%
Turf 39 < 1% < 1 39 < 1%
Nut trees 29 < 1% 2 31 < 1%
Tree fruits 21 < 1% 2 23 < 1%
Oats 4 < 1% - 4 < 1%
Floriculture 1 < 1% < 1 1 < 1%
TOTAL 8,787 38% 167 8,954 100%
% of
cultivated
land
TypeTotal area
(ha)
ALROutside
ALR (ha)
* Other. Includes bare cultivated land, fallow land (cultivated land that has not been seeded or planted for one or more growing
season), and land in crop transition.
Table 7 shows the 10 main field crop types produced on the 8,954 hectares of cultivated land in Township of Langley (TOL).
“Forage & pasture” is the most common type of cultivated field crop accounting for 76% of all cultivated land and 29% of TOL’s ALR. “Vines & berries” are the second most common type of cultivated crop, accounting for 15% of all cultivated land and 6% of TOL’s ALR.
Refer to Map B7 in Appendix B for more information.

Township of Langley Land Use Inventory - Page 25
Figure 10. Main field crop types by percentage
Forage & pasture, 76%
Vines & berries,
15%
Nursery & tree plantations, 5%
Vegetables, 2%
Other, 1%
Turf, 1%
Nut trees, <1%
Tree fruits, <1%
Oats, <1%
Floriculture, <1%
Figure 11. All cultivated crop fields by size
0
100
200
300
400
500
600
700
800
900
1000
< 1
1 -
2
2 -
4
4 -
8
8 -
16
16
-3
2
32
-6
4
64
-1
28
>=
12
8
Nu
mb
er o
f cr
op
fie
lds
Field size (ha)
All cultivated field crops
Figure 10 shows the proportion of main field crop types across all cultivated land in Township of Langley.
“Forage & pasture” combined with “Vines & berries” comprise 91% of all cultivated land in Township of Langley.
Figure 11 illustrates the number and size distribution of fields used for cultivated field crops.
In Township of Langley, cultivated fields are most likely to be less than 2 hectares in size.
There are 2,833 individual crop fields with an average area of 3 hectares and median area of 1 hectare.
Cultivated crops occur on 2,692 parcels with an average parcel size of 6 hectares and a median size of 3 hectares.
Refer to Table A1 in Appendix A for more information.

Township of Langley Land Use Inventory - Page 26
Figure 12. Forage & pasture, vines & berries, nursery & tree plantations by size
0
100
200
300
400
500
600
700
800
< 1
1 -
2
2 -
4
4 -
8
8 -
16
16
-3
2
32
-6
4
64
-1
28
>=
12
8
Num
ber o
f cr
op f
ield
s
Field size (ha)
Forage & pasture
Vines & berries
Nursery & tree plantations
Forage & pasture crops
Forage is a cultivated crop that is cut and made into silage or hay for livestock feed. Three levels of
forage management are described:
Forage (intensively managed): Management includes weed control & fertilizer / manure applications and crop is
cut several times per year. Often there is no fencing and crop growth is vigorous, even, and thick.
Forage (managed): Management includes weed control & fertilizer / manure applications and crop is cut several
times per year. Often there is no fencing and crop growth is generally healthy and even.
Forage (unmanaged): Weed management & fertilizer / manure applications are minimal. Crop is cut only once
per year. Crop growth is uneven with weeds.
Pasture is a cultivated crop that is used for grazing only and is not cut. Two levels of management are
described:
Pasture (managed): Management includes weed control & fertilizer / manure applications. Usually fields are large
to accommodate equipment. Fencing is in good condition and crop growth is vigorous with few weeds.
Pasture (unmanaged): Weed management & fertilizer / manure applications are minimal. Fencing is in good
condition. Crop is varied (some weeds) and growth is uneven with signs of animal dung.
Some areas are used for both forage & pasture:
Forage & pasture (managed): Crop is cut 1 to 3 times per year and made into silage or haylage. Also used for
grazing for 1 to 3 months per season. Fencing is in good condition and crop growth is reasonably even with few
weeds. Usually associated with dairy operations.
Areas previously used for forage or pasture are considered inactively farmed:
Unused refers to forage or pasture which has not been cut or grazed during the current growing season.
Unmaintained refers to forage or pasture which has not been cut or grazed during the current growing season, has
not been maintained for several years, and probably would not warrant harvest.
Figure 12 compares the top three main crop types by field sizes.
“Forage & pasture” fields are the most numerous in all size categories less than 64 hectares. There is one “Vine & berry” crop (cranberry) that is 79 hectares in size.
Refer to Table A1 in Appendix A for more information.

Township of Langley Land Use Inventory - Page 27
Table 8. Forage & pasture crops by area
In ALR
(ha)% of ALR
Forage ^ Grass 5 < 1% < 1 5 < 1%
Forage ^ Mixed grass / legume 81 < 1% 2 82 < 1%
Forage (managed) Grass 533 2% 7 540 6%
Forage (managed) Mixed grass / legume 1,606 7% 16 1,622 18%
Forage (managed) Forage corn 242 1% 3 245 3%
Forage (unmanaged) Grass 146 < 1% 6 152 2%
Forage (unmanaged) Mixed grass / legume 651 3% 16 667 7%
Forage (intensively managed) Mixed grass / legume 4 < 1% < 1 4 < 1%
3,267 14% 50 3,318 37%
Pasture ^ Grass 1 < 1% 3 4 < 1%
Pasture ^ Mixed grass / legume 48 < 1% 6 55 < 1%
Pasture (managed) Grass 53 < 1% 1 54 < 1%
Pasture (managed) Mixed grass / legume 566 2% 11 577 6%
Pasture (unmanaged) Grass 108 < 1% 6 114 1%
Pasture (unmanaged) Mixed grass / legume 1,425 6% 43 1,468 16%
2,200 9% 71 2,271 25%
Forage & pasture (managed) Mixed grass / legume 777 3% 10 788 9%
Forage & pasture (managed) Grass 30 < 1% < 1 30 < 1%
807 3% 10 818 9%
Unused Grass 74 < 1% 1 75 < 1%
Unused Mixed grass / legume 327 1% 9 336 4%
Unmaintained Mixed grass / legume 4 < 1% 0 4 < 1%
405 2% 10 415 5%
6,680 29% 142 6,822 76%
^ Forage or pasture where the level of management could not be determined.
% of
cultivated
land
Total area
(ha)
TOTAL
ALROutside
ALR (ha)
Subtotal
Subtotal
Subtotal
Forage and pasture crops
Subtotal
Figure 13. Forage & pasture fields by size
0
100
200
300
400
500
600
700
800
< 1
1 -
2
2 -
4
4 -
8
8 -
16
16 -
32
32 -
64
64 -
128
>128
Nu
mb
er
of c
rop
fiel
ds
Field size (ha)
Forage & pasture
Figure 13 shows that “Forage & pasture” fields are most likely to be less than 2 hectares.
In Township of Langley, there are 2,420 individual “Forage & pasture” fields with an average area of 3 hectares and median area of 1 hectare.
The average parcel size where “Forage & pasture” occurs is 5 hectares.
Refer to Table A2 in Appendix A for more information.
Table 8 shows that there is more forage than pasture in Township of Langley. Mixed grass / legume is the main forage and pasture crop type.
Refer to Map B8 in Appendix B for more information.

Township of Langley Land Use Inventory - Page 28
Figure 14. Forage & pasture fields by size and type
0
100
200
300
400
500
600
< 1
1 -
2
2 -
4
4 -
8
8 -
16
16 -
32
32 -
64
64 -
128
>128
Nu
mb
er o
f cro
p fi
elds
Field size (ha)
Forage
Pasture
Forage and pasture
Unused or unmaintained
Vine & berry crops
Berry crops are primarily perennials. Perennial berry crops do not change frequently as they require
several years to mature and some crop types require extensive land preparation. Strawberries are a
perennial plant which is usually rotated or grown on different land each year to minimize build-up of
crop-specific pest and disease problems. Since this inventory is a snapshot in time, the strawberry crops
seen during the survey year may not be present in the same location the following year.
Two plant age categories are described: Young: Plants are young and have not reached peak production
Mature: Plants are mature and are capable of reaching peak production
Figure 14 illustrates the variation in field sizes between forage, pasture, and unused or unmaintained fields.
Forage fields have an average area of 5 hectares, a median area of 3 hectares, and an average parcel size of 9 hectares. In comparison, pasture fields have an average area of 2 hectares, a median area of 1 hectare, and an average parcel size of 4 hectares.
Forage fields are generally larger than pasture fields mainly due to harvesting equipment requirements and fencing costs.
Refer to Table A2 in Appendix A for more information.

Township of Langley Land Use Inventory - Page 29
Table 9. Vine & berry crops by area
In ALR (ha) % of ALR
Blueberries Mature 588 3% 2 590 7%
Blueberries Young 258 1% < 1 258 3%
Blueberries Unmaintained 23 < 1% < 1 23 < 1%
870 4% 2 872 10%
Cranberries Mature 228 < 1% < 1 228 3%
Cranberries Young 27 < 1% < 1 27 < 1%
255 1% < 1 255 3%
Raspberries Mature 130 < 1% < 1 130 1%
Raspberries Young 11 < 1% < 1 11 < 1%
141 < 1% < 1 141 2%
Strawberries Mature 30 < 1% < 1 30 < 1%
Strawberries Young 8 < 1% < 1 8 < 1%
37 < 1% < 1 37 < 1%
Berries - unknown type Mature 34 < 1% < 1 34 < 1%
34 < 1% < 1 34 < 1%
Grapes 36 < 1% < 1 37 < 1%
36 < 1% < 1 37 < 1%
Blackberries Mature 1 < 1% < 1 1 < 1%
1 < 1% < 1 1 < 1%
1,374 6% 3 1,378 15%
% of
cultivated
land
Vine & berry crops
ALROutside
ALR (ha)
Total area
(ha)
TOTAL
Subtotal
Subtotal
Subtotal
Subtotal
Subtotal
Subtotal
Subtotal
Figure 15. Vine & berry fields by size
0
10
20
30
40
50
60
70
< 1
1 -
2
2 -
4
4 -
8
8 -
16
16
-3
2
32
-6
4
64
-1
28
>1
28
Num
ber o
f cr
op f
ield
s
Field size (ha)
Vines & berries
Figure 15 shows that vine and berry fields occur on a variety of field sizes.
In Township of Langley, there are 224 individual vine and berry fields with an average area of 6 hectares and median area of 4 hectares.
The average parcel size where vine and berry crops occur is 10 hectares.
Refer to Table A3 in Appendix A for more information.
Table 9 shows that Township of Langley has a total of 1,378 hectares of vine and berry crops, of which nearly two-thirds (872 hectares) are blueberries.
Refer to Map B9 in Appendix B for more information.

Township of Langley Land Use Inventory - Page 30
Figure 16. Blueberry, cranberry, and raspberry fields by size
0
5
10
15
20
25
30
35
40
45
< 1
1 -
2
2 -
4
4 -
8
8 -
16
16
-3
2
32
-6
4
64
-1
28
>1
28
Nu
mb
er o
f cr
op
fie
lds
Field size (ha)
Blueberries
Cranberries
Raspberries
Nursery & Tree Plantations
Table 10. Nursery & tree plantations by area
In ALR (ha) % of ALR
Ornamentals and shrubs 165 < 1% 3 169 2%
Nursery - unknown type 56 < 1% 3 59 < 1%
Cedar hedging 43 < 1% 1 45 < 1%
265 1 8 272 3
Christmas trees 82 < 1% 3 85 < 1%
Tree plantation -unknown type 61 < 1% 2 63 < 1%
Fibre/pulp/veneer trees 45 < 1% 2 47 < 1%
188 < 1 6 195 2
453 2% 14 467 5%
% of
cultivated
land
ALROutside
ALR (ha)
Total area
(ha)
Nursery total
TOTAL
Tree plantation total
Tree
plantation
Nursery
Nursery and tree plantations
Figure 17. Nursery & tree plantations by size
0
10
20
30
40
50
60
70
80
90
< 1
1 -
2
2 -
4
4 -
8
8 -
16
16
-3
2
32
-6
4
64
-1
28
>=
12
8
Num
ber o
f cr
op f
ield
s
Field size (ha)
Nursery
Tree plantation
Figure 16 shows that blueberry, cranberry, and raspberry fields occur in all field size categories less than 16 hectares.
There are 138 blueberry fields with an average crop area of 6 hectares, median area of 5 hectares, and average parcel size of 10 hectares. By comparison, there are 19 cranberry fields with an average crop area of 13 hectares, median area of 7 hectares and average parcel size of 16 hectares.
Refer to Table A3 in Appendix A for more information.
Figure 17 shows that nursery crops are more numerous than tree plantations.
There are 163 nursery activities with an average area of 2 hectares, a median area of 1 hectare, and an average parcel size of 5 hectares.
In comparison, there are 81 tree plantations with an average area of 2 hectares, a median area of 1 hectare, and average parcel size of 6 hectares.
Refer to Table A4 in Appendix A for more information
Table 10 shows that Township of Langley has a total of 467 hectares in nursery and tree plantations.
Refer to Map B10 in Appendix B for more information.
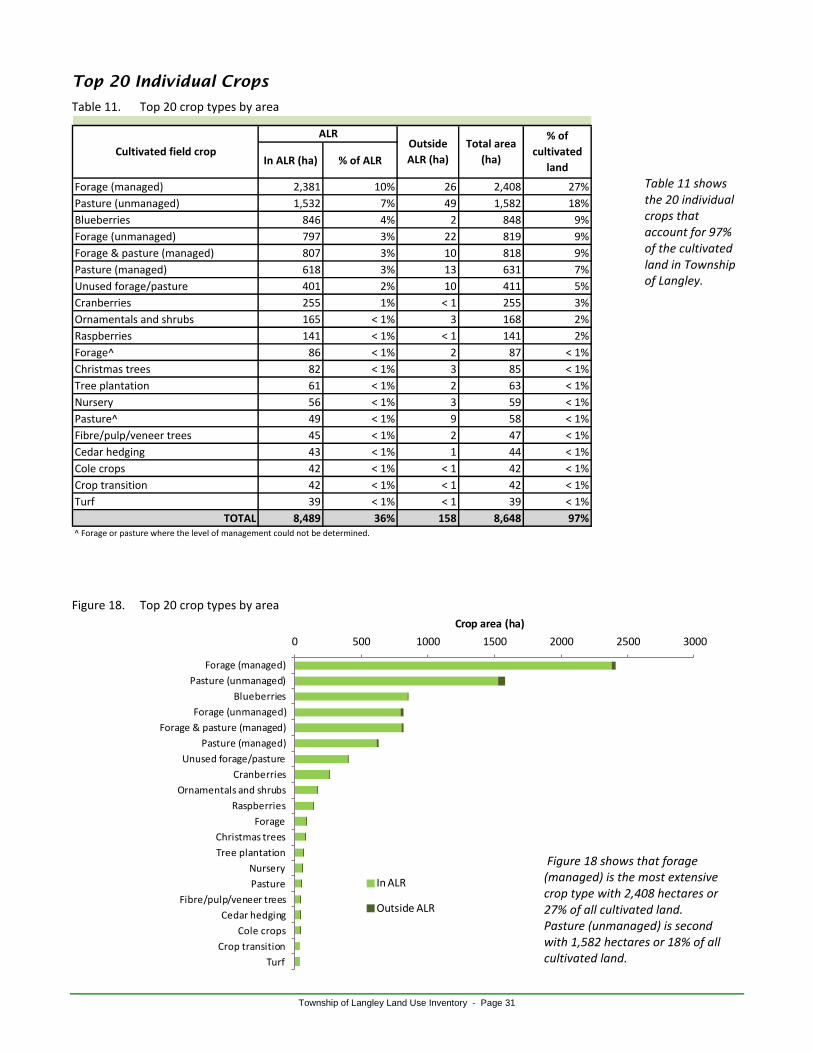
Township of Langley Land Use Inventory - Page 31
Top 20 Individual Crops
Table 11. Top 20 crop types by area
In ALR (ha) % of ALR
Forage (managed) 2,381 10% 26 2,408 27%
Pasture (unmanaged) 1,532 7% 49 1,582 18%
Blueberries 846 4% 2 848 9%
Forage (unmanaged) 797 3% 22 819 9%
Forage & pasture (managed) 807 3% 10 818 9%
Pasture (managed) 618 3% 13 631 7%
Unused forage/pasture 401 2% 10 411 5%
Cranberries 255 1% < 1 255 3%
Ornamentals and shrubs 165 < 1% 3 168 2%
Raspberries 141 < 1% < 1 141 2%
Forage^ 86 < 1% 2 87 < 1%
Christmas trees 82 < 1% 3 85 < 1%
Tree plantation 61 < 1% 2 63 < 1%
Nursery 56 < 1% 3 59 < 1%
Pasture^ 49 < 1% 9 58 < 1%
Fibre/pulp/veneer trees 45 < 1% 2 47 < 1%
Cedar hedging 43 < 1% 1 44 < 1%
Cole crops 42 < 1% < 1 42 < 1%
Crop transition 42 < 1% < 1 42 < 1%
Turf 39 < 1% < 1 39 < 1%
TOTAL 8,489 36% 158 8,648 97%
% of
cultivated
land
Cultivated field cropTotal area
(ha)
ALROutside
ALR (ha)
^ Forage or pasture where the level of management could not be determined.
Figure 18. Top 20 crop types by area
0 500 1000 1500 2000 2500 3000
Forage (managed)
Pasture (unmanaged)
Blueberries
Forage (unmanaged)
Forage & pasture (managed)
Pasture (managed)
Unused forage/pasture
Cranberries
Ornamentals and shrubs
Raspberries
Forage
Christmas trees
Tree plantation
Nursery
Pasture
Fibre/pulp/veneer trees
Cedar hedging
Cole crops
Crop transition
Turf
Crop area (ha)
In ALR
Outside ALR
Figure 18 shows that forage (managed) is the most extensive crop type with 2,408 hectares or 27% of all cultivated land. Pasture (unmanaged) is second with 1,582 hectares or 18% of all cultivated land.
Table 11 shows the 20 individual crops that account for 97% of the cultivated land in Township of Langley.
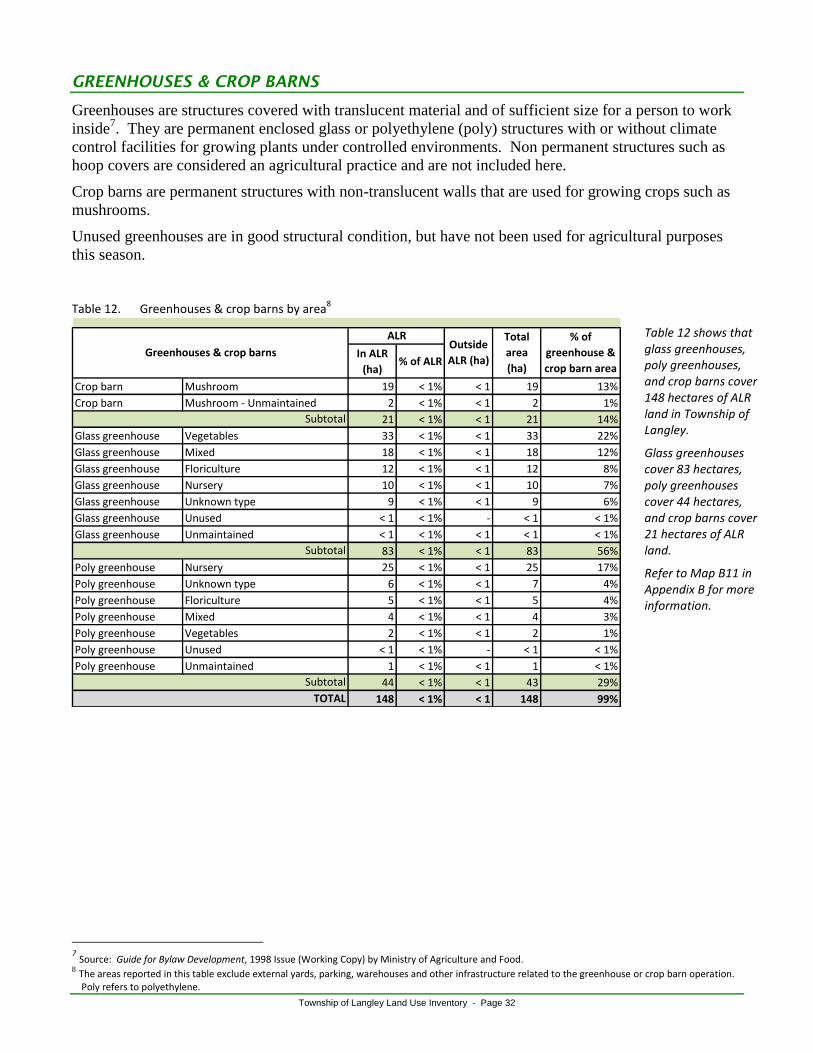
Township of Langley Land Use Inventory - Page 32
GREENHOUSES & CROP BARNS
Greenhouses are structures covered with translucent material and of sufficient size for a person to work
inside7. They are permanent enclosed glass or polyethylene (poly) structures with or without climate
control facilities for growing plants under controlled environments. Non permanent structures such as
hoop covers are considered an agricultural practice and are not included here.
Crop barns are permanent structures with non-translucent walls that are used for growing crops such as
mushrooms.
Unused greenhouses are in good structural condition, but have not been used for agricultural purposes
this season.
Table 12. Greenhouses & crop barns by area
8
In ALR
(ha)% of ALR
Crop barn Mushroom 19 < 1% < 1 19 13%
Crop barn Mushroom - Unmaintained 2 < 1% < 1 2 1%
21 < 1% < 1 21 14%
Glass greenhouse Vegetables 33 < 1% < 1 33 22%
Glass greenhouse Mixed 18 < 1% < 1 18 12%
Glass greenhouse Floriculture 12 < 1% < 1 12 8%
Glass greenhouse Nursery 10 < 1% < 1 10 7%
Glass greenhouse Unknown type 9 < 1% < 1 9 6%
Glass greenhouse Unused < 1 < 1% - < 1 < 1%
Glass greenhouse Unmaintained < 1 < 1% < 1 < 1 < 1%
83 < 1% < 1 83 56%
Poly greenhouse Nursery 25 < 1% < 1 25 17%
Poly greenhouse Unknown type 6 < 1% < 1 7 4%
Poly greenhouse Floriculture 5 < 1% < 1 5 4%
Poly greenhouse Mixed 4 < 1% < 1 4 3%
Poly greenhouse Vegetables 2 < 1% < 1 2 1%
Poly greenhouse Unused < 1 < 1% - < 1 < 1%
Poly greenhouse Unmaintained 1 < 1% < 1 1 < 1%
44 < 1% < 1 43 29%
148 < 1% < 1 148 99%TOTAL
ALROutside
ALR (ha)
Total
area
(ha)
% of
greenhouse &
crop barn area
Greenhouses & crop barns
Subtotal
Subtotal
Subtotal
7 Source: Guide for Bylaw Development, 1998 Issue (Working Copy) by Ministry of Agriculture and Food.
8 The areas reported in this table exclude external yards, parking, warehouses and other infrastructure related to the greenhouse or crop barn operation. Poly refers to polyethylene.
Table 12 shows that glass greenhouses, poly greenhouses, and crop barns cover 148 hectares of ALR land in Township of Langley.
Glass greenhouses cover 83 hectares, poly greenhouses cover 44 hectares, and crop barns cover 21 hectares of ALR land.
Refer to Map B11 in Appendix B for more information.

Township of Langley Land Use Inventory - Page 33
Figure 19. Distribution of greenhouses and crop barns by building type
0
10
20
30
40
50
60
< 1
1 -
2
2 -
4
4 -
8
8 -
16
16
-3
2
32
-6
4
64
-1
28
>1
28
Num
ber o
f gr
eenh
ouse
s /
crop
bar
ns
Greenhouse / crop barn size (ha)
Glass greenhouse
Poly greenhouse
Crop barn
Figure 20. Distribution of greenhouse and crop barn total area by building type
0
5
10
15
20
25
30
35
< 1
1 -
2
2 -
4
4 -
8
8 -
16
16
-3
2
32
-6
4
64
-1
28
>1
28
Tota
l are
a (h
a)
Greenhouse / crop barn size (ha)
Glass greenhouse
Poly greenhouse
Crop barn
Figure 21. Distribution of greenhouses and crop barns by crop type
0
5
10
15
20
25
30
35
< 1
1 -
2
2 -
4
4 -
8
8 -
16
16
-3
2
32
-64
64
-1
28
>1
28
Num
ber
of g
reen
hous
es /
crob
bar
ns
Greenhouse / crop barn size (ha)
Vegetables
Nursery
Floriculture
Mixed
Mushroom
Although though there are fewer glass than poly greenhouses in Township of Langley, Figure 20 shows glass greenhouses comprise a larger total area.
Refer to Table A6 in Appendix A for more information.
Figure 20 shows that there are significantly more poly than glass greenhouses in Township of Langley.
The majority of poly greenhouses are less than 1 hectare in size.
Refer to Table A5 in Appendix A for more information.
Figure 20 shows that there are two greenhouses larger than 8 hectares in Township of Langley. One contains vegetables and the other contains mixed crops.
Nursery comprises the most common greenhouse crop type. Refer to Table A6 in Appendix A for more information.

Township of Langley Land Use Inventory - Page 34
IRRIGATION
Irrigation is the artificial application of water to the land or soil and may be used to assist in the growing
of agricultural crops, maintenance of managed vegetation, and control of soil erosion or dust. The
potential to irrigate is often limited by the quality and quantity of available irrigation water. High
salinity or microbial contamination renders water unsuitable for irrigation. Insufficient water sources or
water delivery infrastructure limits the potential to increase agricultural production through irrigation.
Irrigation is captured at the field or land cover level by system type (sub-surface, sprinkler, giant gun,
trickle) and then summarized by crop type to the total land area under irrigation. Irrigated land includes
all irrigated field crops and may also include irrigated fallow farmland, land set temporarily set aside for
wildlife or other purposes, and land under preparation for planting. Also included are crops grown in
greenhouses and crop barns. In addition, the top 20 cultivated field crops are evaluated for percent of
crop area under irrigation.
Table 13. Main crop types and irrigation `
Sprinkler Giant gun Trickle
Vines & berries 368 75 826 1,269 92%
Nursery & tree plantations 164 21 13 198 42%
Forage & pasture 140 53 - 194 3%
Vegetables 58 32 - 90 67%
Turf 39 - - 39 100%
Tree fruits 7 - - 7 30%
Other* 2 - - 2 3%
Floriculture < 1 - < 1 < 1 77%
TOTAL FIELD CROP AREA IRRIGATED 778 180 839 1,798 20%
Crop Barns Trickle irrigation 19 100%
Greenhouses Mix of flood and trickle irrigation 125 100%
% of crop
area
irrigated
Total area
irrigated
(ha)
Cultivated field crop
Irrigation system in use (ha)
* Other. Includes bare cultivated land, fallow land (cultivated land that has not been seeded or planted for one or more growing season), and
land in crop transition.
Table 13 illustrates that nearly all vine and berry crops and all turf crop are irrigated. Trickle systems are reported primarily on vine and berry crops while sprinkler systems are found on all main irrigated crop types in Township of Langley.
Refer to Map B12 in Appendix B for more information.

Township of Langley Land Use Inventory - Page 35
Figure 22. Irrigation systems by percentage of cultivated land
Trickle, 9%
Sprinkler, 9%
Giant gun, 2%
Not irrigated, 79%
Table 14. Top 20 field crop types and irrigation
Sprinkler Trickle Giant gun
Forage (managed) 102 - 33 135 6%
Pasture (unmanaged) 4 - - 4 < 1%
Blueberries 73 715 7 795 94%
Forage (unmanaged) 3 - - 3 < 1%
Forage & pasture (managed) 4 - 20 24 3%
Pasture (managed) 19 - < 1 20 3%
Unused forage/pasture 6 - - 6 2%
Cranberries 255 - - 255 100%
Ornamentals and shrubs 112 11 - 123 73%
Raspberries 16 74 34 124 88%
Forage^ 1 - - 1 2%
Christmas trees 3 - 20 23 27%
Tree plantation 3 2 - 5 8%
Nursery 33 - < 1 34 58%
Pasture^ - - - - -
Fibre/pulp/veneer trees - - - - -
Cedar hedging 12 - - 12 28%
Cole crops 16 - - 16 37%
Crop transition 2 - - 2 4%
Turf 39 - - 39 100%
TOTAL 705 802 115 1,622
Cultivated field crop
Total area
irrigated
(ha)
% crop area
irrigated
^ Forage or pasture where the level of management could not be determined.
* Fallow land is cultivated land that has not been seeded or planted for one or more growing seasons.
Irrigation system in use (ha)
Figure 22 shows that 79% of cultivated land in Township of Langley (TOL) is not irrigated. Trickle and sprinkler irrigation are the most widely used systems in TOL with each occurring on 9% of the cultivated land.
Table 14 outlines the type of irrigation systems used on the top 20 field crops in Township of Langley. Trickle irrigation systems are used primarily on blueberries while sprinkler systems are used on nearly all of the top 20 field crop types.
Township of Langley Land Use Inventory - Page 36
LIVESTOCK
Livestock activities are very difficult to measure using a windshield survey method. Livestock are often
confined to structures making it difficult for the surveyor to see the animals. Local knowledge and other
indicators such as animal confinement type (barn type), feeder system type, manure handling system
type, and other visible elements may be used to infer the type of livestock and scale of activity that exist
on a parcel. In addition, livestock are mobile and may utilize more than one land parcel. Livestock
visible on a certain parcel one day may be visible on a different parcel the next day. This inventory does
not attempt to identify animal movement between parcels that make up a farm unit but reports livestock
at the parcel where the animals or related structures were observed.
"Main Type" and "Secondary Type" of livestock are determined by comparing the scale of different
livestock activities on the parcel. The “Main Type” of livestock does not represent the primary
agricultural activity, but only the main type of livestock activity.
"Intensive" livestock activities utilize specialized structures such as barns, feedlots and stockyards
designed for confined feeding at higher stocking densities. "Non Intensive" livestock activities allow
animals to graze on a pasture and often utilize non intensive barns and corrals/paddocks.
“Unknown livestock” refers to activities where non specialized livestock related structures were present
but the livestock were not visible and therefore the specific type of livestock could not be determined.
The scale system used to describe livestock operations relies on animal unit equivalents which is a
standard measure used to compare different livestock types. One animal unit equivalent is
approximately equal to one adult cow or horse. The scale system includes 4 levels:
“Very Small” Approximately 1 cow or horse or bison, 3 hogs, 5 goats or deer, 10 sheep, 50 turkeys, 100 chickens
(1 animal unit equivalent)
“Small” LESS THAN 25 cows or horses or bison, 75 hogs, 125 goats or deer, 250 sheep, 1,250 turkeys, 2,500
chickens (2 - 25 animal unit equivalents)
“Medium” LESS THAN 100 cows or horses or bison, 300 hogs, 500 goats or deer, 1000 sheep, 5,000 turkeys,
10,000 chickens (25 - 100 animal unit equivalents)
“Large” MORE THAN 100 cows or horses or bison, 300 hogs, 500 goats or deer, 1,000 sheep, 5,000 turkeys,
10,000 chickens (over 100 animal unit equivalents).

Township of Langley Land Use Inventory - Page 37
Table 15. Livestock activities
Main
type
Secondary
typeIntensive
Non
Intensive
Beef 177 20 197 2 195
Beef (Llama) 1 - 1 - 1
Beef (Dairy) - 1 1 - 1
Beef total 178 21 199 2 197
Dairy Dairy total 34 2 36 12 24
Poultry - unknown type 2 1 3 - 3
Chicken 136 24 160 77 83
Chicken (Turkey) 7 2 9 5 4
Chicken (Duck) - 1 1 - 1
Chicken (Goose) - 3 3 - 3
Chicken (Sheep / lamb) - 1 1 - 1
Duck 6 3 9 1 8
Duck (Goose) - 1 1 - 1
Goose 3 1 4 2 2
Goose (Turkey) - 1 1 - 1
Turkey 7 1 8 5 3
Poultry total 161 39 200 90 110
Swine Swine total 3 - 3 - 3
Sheep / lamb 37 11 48 - 48
Sheep / lamb (Goat) 6 4 10 - 10
Sheep / lamb (Llama) 3 - 3 - 3
Goat 23 10 33 - 33
Goat (Llama) 3 - 3 - 3
Goat (Swine) - 1 1 - 1
Sheep / lamb / goat total 72 26 98 - 98
Llama 23 4 27 - 27
Llama (Alpaca) 8 1 9 - 9
Llama (Sheep / lamb) 3 - 3 - 3
Llama (Goat) 2 - 2 - 2
Llama / alpaca total 36 5 41 - 41
Fur bearing 6 1 7 5 2
Game bird 1 1 2 - 2
Ratite 1 3 4 - 4
Specialty livestock total 8 5 13 5 8
Unknown livestock Unknown livestock total 34 - 34 - 34
Inactive Inactive operation 5 - 5 3 2
Horse 779 20 799 - 799
Equine - other^ 7 7 14 - 14
Equine- unknown type 105 - 105 - 105
Mixed equine 30 2 32 - 32
Equine total 921 29 950 - 950
1,452 127 1,579 112 1,467
* When livestock type appears in parenthese () it indicates the livestock activity is a mixed herd or flock.
** Specialty livestock includes game birds (partridge, pheasant, pigeon, quail), ratites (emu, ostrich, rhea, peacock), and fur bearing animals (rabbits).
^ Equine - other. Includes ponies, miniature horses, donkeys, and mules
Beef
Sheep / lamb / goat
Llama / alpaca
Livestock group
By parcelTotal
activities
By activity type
Livestock detail *
Poultry
Specialty livestock**
TOTAL
Equine
Table 15 shows that equine is the most common type of livestock activity in Township of Langley, accounting for 950 of 1579, or 60% of all livestock activities. Poultry is the second most common with 200 activities or 13% and beef is third with 199 activities or 13%. Nearly half of all poultry activities are intensive while only 2 beef activities are intensive.
Three former poultry operations and 2 former dairy operations were recorded as inactive activities.
Refer to Maps B13, B14, B15, B16, and B17 in Appendix B for more information.

Township of Langley Land Use Inventory - Page 38
Figure 23. Livestock activities (excluding equine) by scale and type
0
25
50
75
100
125
150
175
Very small scale Small scale Medium scale Large scale
Num
ber
of a
ctiv
itie
s
Scale of activity
Beef Dairy
Poultry Swine
Sheep / lamb / goat Llama / alpaca
Specialty livestock Unknown livestock
Figure 24. Livestock and equine activities by scale
20
4
70
0
45
1
19
5
29
9
72
63
0
200
400
600
800
Very small scale Small scale Medium scale Large scale
Num
ber
of a
ctiv
itie
s
Scale of activity
Equine
Livestock
Figure 25. Livestock activities (excluding equine) by parcel size and scale
0
20
40
60
80
100
120
< 1 1 - 2 2 - 4 4 - 8 8 - 16 16 - 32 32 - 64 64 - 128 >= 128
Num
ber
of a
ctiv
itie
s
Parcel size (ha)
Very small scale
Small scale
Medium scale
Large scale
Scale of activity
Figure 23 illustrates the scale of livestock activities (excluding equine) in Township of Langley.
Most of livestock activities are “small” or “very small” scale.
There are 55 “large” scale poultry and 8 “large” scale dairy activities in Township of Langley. Both poultry and dairy are supply managed industries.
Refer to Tables A8, A10, A12, and A14 in Appendix A for more information.
Figure 25 illustrates the distribution of livestock activities (excluding equine) by scale across parcel size categories. “Large” scale operations occur on multiple parcel sizes, including small parcels. All “large” scale activities taking place on parcels less than 8 hectares are poultry.
There are also “small” and “very small” scale livestock activities occurring on larger parcels.
Refer to Tables A8, A10, A12, A14 and Figures A1, A3, A5, A7 in Appendix A for more information.
Figure 24 compares the scale of livestock activities with equine activities.
Even though 950 of the 1579 livestock activities are equines, most are “very small” or “small” scale. There is only one “large” scale equine activity in Township of Langley compared to 63 “large” scale livestock activities.
Refer to Tables A8, A10, A12, A14 and A16 in Appendix A for more information.

Township of Langley Land Use Inventory - Page 39
Figure 26. Livestock activities (excluding equines) by parcel size and type
0
10
20
30
40
50
60
70
80
< 1 1 - 2 2 - 4 4 - 8 8 - 16 16 - 32 32 - 64 64 - 128 >= 128
Num
ber
of a
ctiv
itie
s
Parcel size (ha)
Beef Dairy
Poultry Swine
Sheep / lamb / goat Llama / alpaca
Specialty livestock Unknown livestock
Figure 27. Livestock and equine activities by parcel size
12
2
28
2 29
6
12
4
85
31
8 2
42
14
5
19
3
92 1
06
35
15
1
0
50
100
150
200
250
300
< 1
1 -
2
2 -
4
4 -
8
8 -
16
16 -
32
32 -
64
64
-1
28
>= 1
28
Nu
mb
er
of
acti
viti
es
Parcel size (ha)
Equine
Livestock
Figure 27 compares the distribution of equine and livestock across parcel size categories.
Equine activities occur more frequently than livestock activities on parcels less than 8 hectares.
Both livestock and equine activities occur across all parcel sizes except for parcels >=128 hectares.
Refer to Table A7 in Appendix A for more information.
Figure 26 compares the distribution of different livestock types across parcel size categories. Beef and poultry occur across all parcel sizes less than 64 hectares. One “medium” scale beef activity is the only livestock activity occurring on parcels larger than 64 hectares.
Refer to Table A7 in Appendix A for more information.

Township of Langley Land Use Inventory - Page 40
Figure 28. Average area in forage, pasture and farm infrastructure on parcels with livestock activities (excluding very small scale)
4.6
15.0
4.8 3.9 3.6 3.6 6.93.1 2.6
5
16
64 4 4
9
4 3
0
2
4
6
8
10
12
14
16
18
Be
ef
Dai
ry
Poul
try
Swin
e
Sh
ee
p /
lam
b /
go
at
Lla
ma
/
alpa
ca
Spec
ialt
y li
vest
ock
Unk
now
n li
vest
ock
Equi
ne
Ave
rage
are
a (h
a)
Main livestock type
Farm infrastructure
Forage, pasture
Figure 29. Total area in forage, pasture, and farm infrastructure on parcels with
livestock activities (excluding very small scale)
887
545335
9209
82 43 89
2,249
0
500
1000
1500
2000
2500
Be
ef
Dai
ry
Poul
try
Swin
e
Sh
ee
p /
lam
b /
goat
Lla
ma
/
alpa
ca
Spec
ialt
y li
vest
ock
Unk
now
n li
vest
ock
Equi
ne
Tota
l are
a (h
a)
Farm infrastructure
Forage, pasture
Figure 28 shows that on average, a dairy activity is associated with 15 hectares of forage and pasture land, more than any other type of livestock activity.
Specialty livestock activities are associated with an average area of 2 hectares of farm infrastructure. This is more than any other type of livestock activity.
Figure 29 shows that although each dairy activity on average uses more forage and pasture land than each equine activity (see Figure 28 above), equine activities use a greater total area.
The actual forage area for dairy is underestimated since not all dairy forage fields will be located on the same parcel as the livestock.
Refer to Figures A2, A4, A6, A8, and A10 in Appendix A for more information.

Township of Langley Land Use Inventory - Page 41
Figure 30. Percent of parcel area utilized for forage, pasture, and farm infrastructure on parcels with livestock activities (excluding very small scale)
0% 20% 40% 60% 80% 100%
Beef
Dairy
Poultry
Swine
Sheep / lamb / goat
Llama / alpaca
Specialty livestock
Unknown livestock
Equine
Parcel area utilization
Forage, pasture
Farm infrastructure
Figure 31. Land cover on parcels with livestock activities (excluding very small scale)
* Other includes vegetated lands seeded or planted for landscaping, dust, or soil control but not cultivated for harvest or pasture, lands covered
by built objects but not farm infrastructure, and bare areas such as piles, pits, fill dumps.
0
200
400
600
800
1000
1200
1400
1600
1800
2000
Forage & pasture
Farminfrastructure
Other cultivated land
Natural & Semi-natural
Other*
Tota
l are
a (h
a)
Beef Dairy
Poultry Swine
Sheep / lamb / goat Llama / alpaca
Specialty livestock Unknown livestock
Equine
Figure 30 shows that on average, a dairy activity in Township of Langley utilizes 84% of its parcel area for forage, pasture, and farm infrastructure while a swine activity utilizes only 21%.
Figure 31 shows that the majority of the land cover associated with beef, dairy, and equine activities is forage and pasture. These operations are growing some of their own feed. Equine activities are associated with a greater variety of land cover types, which indicate more mixed use parcels.
Refer to Figures A2, A4, A6, A8, and A10 in Appendix A for more information.

Township of Langley Land Use Inventory - Page 42
ON-FARM VALUE-ADDED
Activities which add value to raw commodities produced on the farm are reported in this section. At
least 50% of the commodity utilized must be produced on farm9 or the activity is considered non-
agricultural. In many cases, local knowledge in combination with the field survey is used to determine
if an activity meets the criteria to be considered on-farm value-added. The three main categories of
value-added are: processing, direct sales, and agri-tourism.
Processing is an activity that maintains or raises the quality or alters the physical or chemical
characteristics of a raw farm commodity, or adds value to it in any way. Processing includes grain mill
or oilseed crushing, meat processing, wine or cider, kitchen / bakery, and canning. This category does
not include crop washing and packaging.
Direct sales to the public occur through permanent stores, temporary stores such as fruit stands, U-pick,
or restaurant / take out service located on the farm. Direct farm marketing sites are considered
ambassadors of agriculture. Direct farm marketing engages the public’s interest in food production and
increases awareness of the benefits of local agriculture.
Agri-tourism promotes visits to the operation for the purpose of recreation, education or active
involvement in the operation - a tourism experience. Agri-tourism must be in a farm setting and
secondary to primary agricultural operation to be considered value-added. Included are corn mazes,
petting zoos, bed & breakfasts, campsites, winery or orchard tours, guest ranches offering equestrian
related activities, horse or donkey rental for trail riding / outfitting, and seasonal events such as farm
festivals or pumpkin patches.
The scale system used to describe value-added activities reflects the human effort need to support the
activity. The scale system includes 3 levels:
“Small” scale represents a predominantly single household endeavour with management requiring less than one full
time worker. Examples of small scale include a temporary roadside fruit stand, a small field u-pick, or egg sales
from backyard flock.
“Medium” scale is sufficient to add value to on-farm products for sale to small local markets or serve a moderate
number of people. Usually includes designated parking for customers and requires at least one full-time worker to
manage. An example is 3-10 tourist accommodation spots.
“Large” scale is intended to add value to large amounts of on-farm generated products or serve large numbers of
people. Requires multiple workers to operate value-added component of farm operation. An example is more than
10 tourist accommodation spots.
9 On-farm refers to the farm unit which includes all the property belonging to the farm and may incorporate more than one parcel.

Township of Langley Land Use Inventory - Page 43
Figure 32. Percentage of parcels “Used for farming” and with value-added activities
Without Value-Added, 96% Agri-tourism,
<1%
Direct sales, 3%
Processing, <1%
4%
Figure 33. Number of parcels with farming and value-added activities
3 4
19
31 8 3 2 4
2
12
15
3
1 24
6
3
31
46
11
4
13
5
0
5
10
15
20
25
30
35
40
45
50
Nu
mb
er
of
acti
viti
es
Value added activities
Agritourism
Direct sales
Processing
Not "used for farming"
Figure 32. Only 80 or 4% of all parcels “Used for farming” are also being used for value-added activities. Given the close proximity to a relatively large urban population, there is opportunity to increase activities such as agri-tourism and direct sales.
There are 117 value-added activities located on 94 parcels in Township of Langley. Thirty-nine of these activities on 34 parcels either do not meet the “Used for farming” criteria (refer to the Definitions section), or are part of a farm unit where the farming activity takes place on another parcel.
Figure 33 shows that the majority of value added activities are seasonal stands and permanent retail stores.
Refer to Tables A18 through A22 in Appendix A for more information.
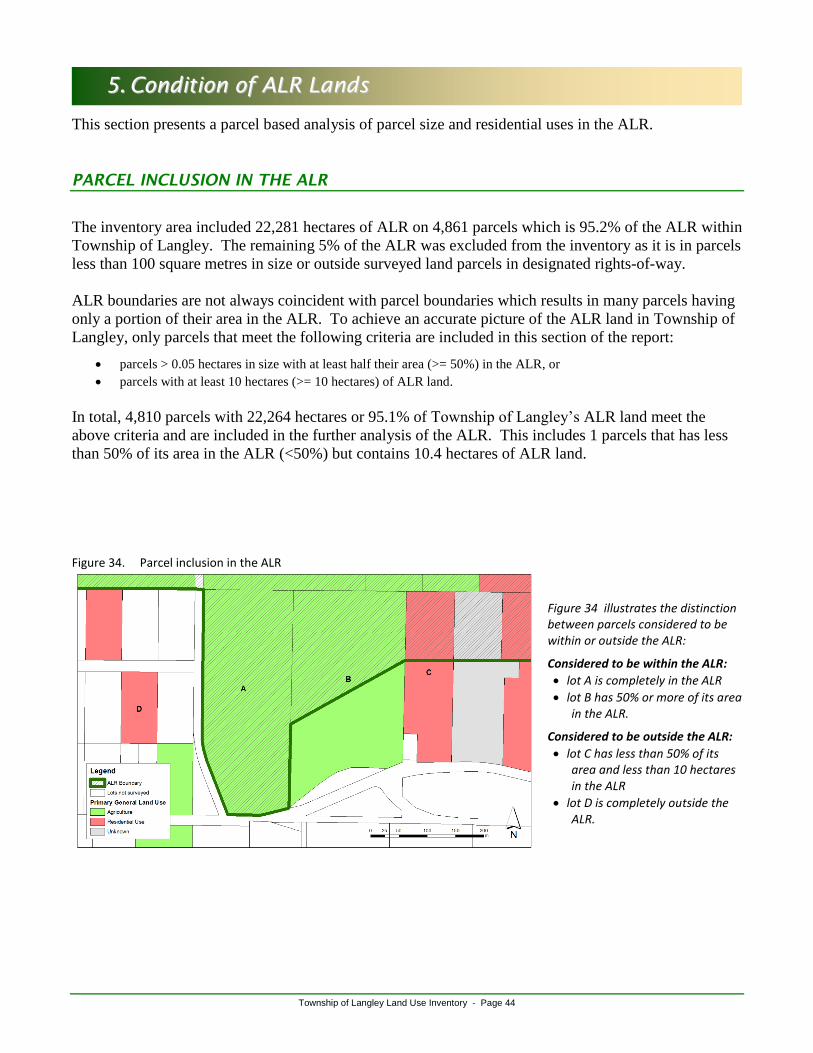
Township of Langley Land Use Inventory - Page 44
55.. CCoonnddiittiioonn ooff AALLRR LLaannddss
This section presents a parcel based analysis of parcel size and residential uses in the ALR.
PARCEL INCLUSION IN THE ALR
The inventory area included 22,281 hectares of ALR on 4,861 parcels which is 95.2% of the ALR within
Township of Langley. The remaining 5% of the ALR was excluded from the inventory as it is in parcels
less than 100 square metres in size or outside surveyed land parcels in designated rights-of-way.
ALR boundaries are not always coincident with parcel boundaries which results in many parcels having
only a portion of their area in the ALR. To achieve an accurate picture of the ALR land in Township of
Langley, only parcels that meet the following criteria are included in this section of the report:
parcels > 0.05 hectares in size with at least half their area (>= 50%) in the ALR, or
parcels with at least 10 hectares (>= 10 hectares) of ALR land.
In total, 4,810 parcels with 22,264 hectares or 95.1% of Township of Langley’s ALR land meet the
above criteria and are included in the further analysis of the ALR. This includes 1 parcels that has less
than 50% of its area in the ALR (<50%) but contains 10.4 hectares of ALR land.
Figure 34. Parcel inclusion in the ALR
Figure 34 illustrates the distinction between parcels considered to be within or outside the ALR:
Considered to be within the ALR:
lot A is completely in the ALR
lot B has 50% or more of its area in the ALR.
Considered to be outside the ALR:
lot C has less than 50% of its area and less than 10 hectares in the ALR
lot D is completely outside the ALR.

Township of Langley Land Use Inventory - Page 45
PARCEL SIZE & FARMING IN THE ALR
Parcel size must be considered when determining the agricultural potential of a land parcel. Larger
parcels usually allow farmers greater flexibility to expand or change their type of operation as the
economy and markets change. Although some types of agriculture can be successful on small parcels,
such as intensive organic market gardens, greenhouse operations and nurseries, generally the smaller the
parcel is, the fewer viable options there are for farming.
A farming operation may utilize more than one parcel as a farm unit10
, however it is generally more
efficient to run a farm on fewer larger parcels than many smaller parcels. Larger parcels accommodate
equipment more efficiently and reduce the need to move farm equipment on public roads. Smaller
parcels are more impacted by bylaws designed to reduce potential land use conflicts, such as setbacks
from lot lines and road allowances, and may encourage alternative land uses such as residential. Figure 35. Number of parcels in the ALR by parcel size
732
1274
1424
684
445
186
568 1
0
250
500
750
1000
1250
1500
< 1
1 -
2
2 -
4
4 -
8
8 -
16
16
-3
2
32
-6
4
64
-1
28
>=
12
8
Tota
l nu
mb
er
of
par
cels
Parcel size (ha)
Number of parcels in the ALR
Figure 36. Total area in the ALR by parcel size
400
2,221
3,717 3,865
5,063
3,840
2,174
623362
0
1,000
2,000
3,000
4,000
5,000
6,000
< 1
1 -
2
2 -
4
4 -
8
8 -
16
16
-3
2
32
-6
4
64
-1
28
>=
12
8
Tota
l are
a (h
a)
Parcel size (ha)
Area in the ALR
10Farm Unit – An area of land used for a farm operation consisting of one or more contiguous or non-contiguous parcels, that may be owned, rented or
leased, which form and are managed as a single farm.
Even though Township of Langley is a metropolitan area and has a significant number of small parcels, over half of its ALR area is in parcels larger than 8 ha.
Figure 36 illustrates that of the 22,264 hectares on parcels in the ALR:
2% (400 hectares) is on parcels less than 1 hectare.
28% (6,338 hectares) is on parcels less than 4 hectares.
17% (3,865 hectares) is on parcels between 4 and 8 hectares.
22% (5063 hectares) is on parcels between 8 and 16 hectares.
31% (6,998 hectares) is on parcels greater than 16 hectares.
Of Township of Langley’s ALR parcels, 15% are less than one hectare. The average ALR parcel size is 3.6 hectares.
Figure 36 illustrates that of the 4810 parcels in the ALR:
15% (732 hectares) is on parcels less than 1 hectare.
71% (3,430 hectares) is on parcels less than 4 hectares.
14% (684 hectares) is on parcels between 4 and 8 hectares.
9% (445 hectares) is on parcels between 8 and 16 hectares.
5% (251 hectares) is on parcels greater than 16 hectares.

Township of Langley Land Use Inventory - Page 46
Table 16. Number of farmed and not farmed parcels in the ALR
Used for farming 1,853 39 %
Not used for farming 2,957 61 %
TOTAL 4,810 100 %
Parcel status with respect to
farming
Number
of
parcels
% of
parcels in
the ALR
Figure 37. Number of farmed and not farmed parcels in the ALR by parcel size
75
421
588
327286
120
315
657
853 836
357
159
6625 3 1
0
100
200
300
400
500
600
700
800
900
< 1
1 -
2
2 -
4
4 -
8
8 -
16
16
-3
2
32
-6
4
64
-1
28
>=
12
8
Nu
mb
er
of
par
cels
in
th
e A
LR
Parcel Size (ha)
Used for farming
Not used for farming
Figure 38. Number of farmed and not farmed parcels in the ALR by parcel size
(line chart)
0
200
400
600
800
1000
< 1
1 -
2
2 -
4
4 -
8
8 -
16
16
-3
2
32
-6
4
64
-1
28
>=
12
8
Num
ber
of p
arce
ls
Parcel size (ha)
Used for farming
Not used for farming
Figure 37 shows that of the 61% of parcels in the ALR that are “Not used for farming”:
657 parcels, or 20%, are less than one hectare.
2,346 parcels, or 79%, are less than 4 hectares.
Table 16 demonstrates that of the 4,810 parcels in the ALR, only 1,853 or 39% are “Used for farming”.
Figure 38 illustrates that although parcels of all sizes are “Used for farming”, small parcels are less likely to be farmed than larger parcels.

Township of Langley Land Use Inventory - Page 47
Figure 39. Proportion of parcels farmed and not farmed by parcel size in the ALR
0% 20% 40% 60% 80% 100%
< 1
1 - 2
2 - 4
4 - 8
8 - 16
16 - 32
32 - 64
64 - 128
>= 128
Parcels in the ALR
Pa
rce
l siz
e (
ha
)
Used for farming Not used for farming
Figure 40. Proportion of land cover by parcel size in the ALR
0% 20% 40% 60% 80% 100%
< 1
1 - 2
2 - 4
4 - 8
8 - 16
16 - 32
32 - 64
64 - 128
>= 128
% land cover
Pa
rce
l siz
e (
ha
)
Farmed Anthropogenic (not farmed) Natural or Semi-natural
Figure 39 shows that in Township of Langley, the proportion of parcels being “Used for farming” increases as the parcel size increases.
Only 10% of parcels that are less than 1 hectare are “Used for farming”.
There is one parcel >=128 hectares that is “Not used for farming”. It is owned by the Department of National Defense.
Similar to Figure 39 above, Figure 40 shows that in Township of Langley, the proportion of farmed land cover generally increases as the parcel size increases.
Only 13% of the land cover is farmed on parcels that are less than 1 hectare.

Township of Langley Land Use Inventory - Page 48
RESIDENTIAL USE IN THE ALR
The ALR is a provincial zone in which agriculture is the priority use and some “Residential” use is
considered a necessary accessory to the agricultural use of a property. However “Residential” use which
is not an accessory to agriculture can effectively limit the ability of agriculture to grow, intensify and
respond to market demands. When the primary motivation for ownership of ALR land is residential use,
the residence is often placed to maximize privacy and views, with little consideration for agricultural
opportunities on the parcel. Houses that are not adjacent to the frontage road alienate portions of land
from future agriculture. If the occupants are non-farmers, they are more likely to be affected by noise or
odour from neighbouring farm operations.
The size of the residence may be another factor to
consider. Properties with larger residences have
higher property values making it unrealistic for a
farmer to acquire and convert this land to
farmland in the future.
In the following analysis cabins/cottages, mobile
homes, single-family houses, duplexes, townhouses, apartments, motels, hotels, dormitories, and
institutional living buildings are included. Single-family houses are further described by estimated size
of the building:
Small single-family house <1,500 sq. ft.
Medium single-family house 1,500 – 3,500 sq. ft.
Large single-family house 3,500 – 5,000 sq. ft.
Estate (very large) single-family house > 5,000 sq. ft.
Residential footprint includes the main residence plus its associated yard, driveway, parking and any
auxiliary buildings or structures. When two residences are on a property, areas associated to both (such
as shared driveways, parking or yard), are assigned to the closest residence.
Properties “Not used for farming but available” are properties with either no apparent use or an existing
non-farm use that is compatible with agriculture, such as Residential.
Properties “Not used for farming and unavailable” have an established non-farm use that is incompatible
with agriculture.
Average land improvement values of Township of Langley properties with residences in the ALR were as follows:
estate single family house $1,074,700
large single family house $517,500
medium single family house $252,030
small single family house $158,480
single mobile home $126,706
(Calculated using 2011 BC Assessment database - Last improvement value)

Township of Langley Land Use Inventory - Page 49
Table 17. Farming and residences in the ALR
Used for farming 1,654 34% 199 4% 1853
Not used for farming but available 2,163 45% 319 7% 2482
Not used for farming and unavailable 302 6% 173 4% 475
TOTAL 4,119 86% 691 14% 4,810
Total
number of
parcels
Parcel status
With residence Without residence
Number
of parcels
% of
parcels
Number
of parcels
% of
parcels
Table 18. Farming and residence type in the ALR
Used for farming 176 ( 26) 505 ( 353) 1130 ( 1036) 224 ( 218) 19 ( 19) 2 ( 2) 2056 1654
Not used for farming but available 236 ( 38) 595 ( 432) 1413 ( 1331) 365 ( 339) 21 ( 21) 2 ( 2) 2632 2163
Not used for farming and unavailable 13 ( 9) 103 ( 75) 178 ( 173) 42 ( 42) - 5 ( 3) 341 302
TOTAL RESIDENCES 425 1,203 2,721 631 40 9 5,029
TOTAL PARCELS 73 860 2,540 599 40 7 4,119
** Other includes duplexes, townhouses, mobile home parks, and motel style residences
Tota
l
resi
de
nce
s
Estate
house
Oth
er*
*Single
mobile
home
Small houseMedium
house
* xx ( yy) - xx indicates the number of residences and ( yy) indicates the number of parcels where the residence type is the largest on that parcel.
Total
number
of
parcels
Parcel status Large
house
Residences *
Figure 41. Total area in residential footprint by parcel size
1,256,110
2,335,497
2,553,924
1,293,655
850,345
517,850
159,746
53,605
20,049
0 1,000,000 2,000,000 3,000,000
< 1
1 - 2
2 - 4
4 - 8
8 - 16
16 - 32
32 - 64
64 - 128
>= 128
Total residential footprint (m²)
Par
cel s
ize
(h
a)
Figure 41 illustrates that there are over 900 hectares (9,040,781 m²) of ALR land in residential footprints distributed across all parcel sizes.
Table 17 shows that 4119 parcels or 86% of ALR parcels have residences but 2,465 of these parcels are “Not used for farming”.
Table 18 demonstrates that there are 4119 parcels in the ALR with 5029 residences (some parcels have more than one residence). Most residences are medium houses (1,500 – 3,500 sq. ft). Of all the large (3,500-5,000 sq. ft.) and estate (>5000 sq. ft) houses in the ALR, 64% are on parcels “Not used for farming”.

Township of Langley Land Use Inventory - Page 50
Figure 42. Proportion of parcels with residences by parcel size
80%
91% 89%83%
79%74%
63%
50%
100%
0%
20%
40%
60%
80%
100%
120%
< 1
1 -
2
2 -
4
4 -
8
8 -
16
16
-3
2
32
-6
4
64
-1
28
>=
12
8
% o
f par
cels
wit
h r
esi
de
nce
Parcel size (ha)
Figure 43. Average percent of parcel area in residential footprint by parcel size
50%
12%
8%
4%
2%
2%
1%
1%
<1%
0% 10% 20% 30% 40% 50% 60%
< 1
1 - 2
2 - 4
4 - 8
8 - 16
16 - 32
32 - 64
64 - 128
>= 128
% Parcel area
Pa
rce
l siz
e (
ha
)
Average percent of parcel area in residential footprint
Figure 44. Average total area in residential footprint by parcel size
2,039
1,707
1,680
1,784
1,764
2,538
2,159
2,553
1,055
0 500 1,000 1,500 2,000 2,500 3,000
< 1
1 - 2
2 - 4
4 - 8
8 - 16
16 - 32
32 - 64
64 - 128
>= 128
Average residential footprint (m²)
Pa
rce
l siz
e (
ha
)
Figure 42 shows that the majority of all parcels in all parcel size categories have a residence.
The one parcel >=128 hectares is owned by the Department of National Defense and contains small military residences.
Figure 44 illustrates that even though residential footprints on small parcels use a greater proportion of the parcel area, the average size of the footprint is similar compared to the footprint on larger parcels.
Figure 43 demonstrates that residential footprints on smaller parcels use a much greater proportion of the parcel area than those on larger parcels.

Township of Langley Land Use Inventory - Page 51
Figure 45. Total and potential area in residential footprint by parcel size
195,609
167,865
232,921
213,306
189,876
149,259
42,275
24,038
0 50,000 100,000 150,000 200,000 250,000
< 1
1 - 2
2 - 4
4 - 8
8 - 16
16 - 32
32 - 64
64 - 128
>= 128
Total potential residential footprint (m²)
Par
cel s
ize
(h
a)
Table 19. Main agriculture activity and largest residence on parcels "Used for farming"
in the ALR
Equine 5 121 421 74 11 1 633
Forage & pasture 10 101 260 47 3 1 422
Beef 3 30 88 17 1 - 139
Vines & berries 4 24 46 28 2 - 104
Poultry 1 12 59 9 1 - 82
Nursery & tree plantations 1 21 39 15 - - 76
Sheep / lamb / goat 1 9 30 4 - - 44
Dairy - 8 20 2 - - 30
Unknown livestock 1 3 15 5 - - 24
Llama / alpaca - 4 8 4 1 - 17
Glass greenhouse - 1 12 2 - - 15
Vegetables - 4 5 4 - - 13
Mushroom - 2 7 3 - - 12
Poly greenhouse - 3 7 1 - - 11
Tree fruits - 1 3 2 - - 6
Farm - 1 4 - - - 5
Other - 1 3 1 - - 5
Nut trees - 1 3 - - - 4
Specialty livestock - - 4 - - - 4
Inactive - 2 1 - - - 3
Turf - 2 1 - - - 3
Swine - 2 - - - - 2
TOTAL PARCELS 26 353 1,036 218 19 2 1,654
*Other residnetial buidlings include a townhouse and a dormitory
Main agricultural activity
Number
of
parcels
Single
mobile
home
Small
house
Medium
house
Large
house
Estate
house
Other
residential
building*
Largest residence on the parcel
There are 518 parcels in the ALR that are “Used for farming” or “Not used for farming but available” that do not yet have a residence (Refer to Table 17 above).
If all 518 parcels built a residence, using the average percent of parcel area in residential footprint presented above, Figure 45 shows that an additional 121 hectares (1,215,149 m²) of ALR land would be permanently removed from potential production.
There are 1,654 parcels with residences that are “Used for farming” (refer to Table 17 above).
Table 19 shows that large and estate houses occur most frequently on parcels with equines as the main agricultural activity.

Township of Langley Land Use Inventory - Page 52
Table 20. Main agriculture activity on "Used for farming” parcels with large or estate residences in the ALR
Equine 85 391 56 % 8
Forage & pasture 50 248 72 % 7
Vines & berries 30 232 77 % 10
Beef 18 124 68 % 10
Nursery & tree plantations 15 43 71 % 4
Poultry 10 56 36 % 12
Unknown livestock 5 15 59 % 4
Llama / alpaca 5 34 57 % 13
Vegetables 4 28 71 % 12
Sheep / lamb / goat 4 12 77 % 4
Mushroom 3 6 50 % 4
Glass greenhouse 2 8 52 % 7
Tree fruits 2 3 71 % 2
Dairy 2 40 66 % 28
Poly greenhouse 1 9 68 % 14
Other* 1 6 46 % 12
TOTAL 237 1,256
* Other. Includes bare cultivated land, fallow land (cultivated land that has not been seeded or planted for
one or more growing season), and land in crop transition.
Main agricultural activity Number of
parcels
Crop area
utilized (ha)
Average %
of parcel
area in crop
Average
parcel area
(ha)
Parcels with "Large" or "Estate" residences
There are 237 parcels with large or estate residences in the ALR that are “Used for farming” (see Table 19 above).
Table 20 illustrates that equine activities are the main agricultural activity on 85 or 35% of these parcels. Forage & pasture is the main agricultural activity on 50 or 21% of these parcels.
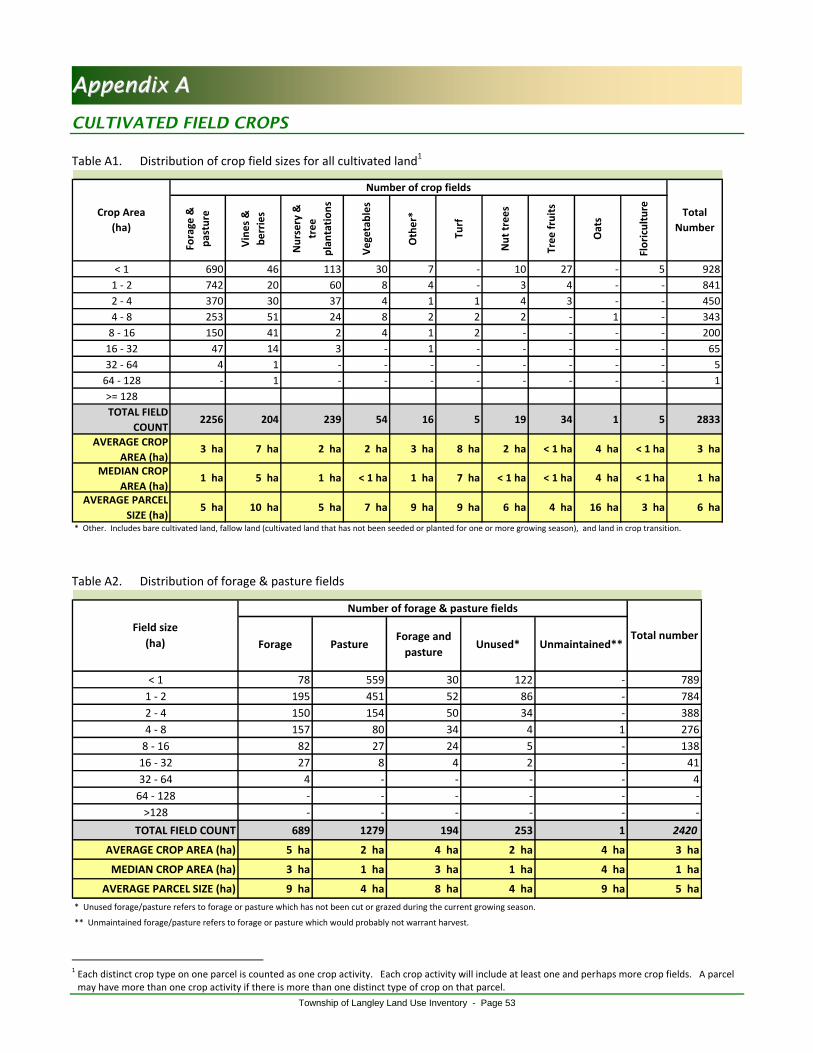
Township of Langley Land Use Inventory - Page 53
AAppppeennddiixx AA
CULTIVATED FIELD CROPS
Table A1. Distribution of crop field sizes for all cultivated land1
Fora
ge &
pas
ture
Vin
es
&
be
rrie
s
Nu
rser
y &
tree
pla
nta
tio
ns
Ve
geta
ble
s
Oth
er*
Turf
Nu
t tr
ees
Tre
e f
ruit
s
Oat
s
Flo
ricu
ltu
re
< 1 690 46 113 30 7 - 10 27 - 5 928
1 - 2 742 20 60 8 4 - 3 4 - - 841
2 - 4 370 30 37 4 1 1 4 3 - - 450
4 - 8 253 51 24 8 2 2 2 - 1 - 343
8 - 16 150 41 2 4 1 2 - - - - 200
16 - 32 47 14 3 - 1 - - - - - 65
32 - 64 4 1 - - - - - - - - 5
64 - 128 - 1 - - - - - - - - 1
>= 128
TOTAL FIELD
COUNT2256 204 239 54 16 5 19 34 1 5 2833
AVERAGE CROP
AREA (ha)3 ha 7 ha 2 ha 2 ha 3 ha 8 ha 2 ha < 1 ha 4 ha < 1 ha 3 ha
MEDIAN CROP
AREA (ha)1 ha 5 ha 1 ha < 1 ha 1 ha 7 ha < 1 ha < 1 ha 4 ha < 1 ha 1 ha
AVERAGE PARCEL
SIZE (ha)5 ha 10 ha 5 ha 7 ha 9 ha 9 ha 6 ha 4 ha 16 ha 3 ha 6 ha
Crop Area
(ha)
Number of crop fields
* Other. Includes bare cultivated land, fallow land (cultivated land that has not been seeded or planted for one or more growing season), and land in crop transition.
Total
Number
Table A2. Distribution of forage & pasture fields
Forage PastureForage and
pastureUnused* Unmaintained**
< 1 78 559 30 122 - 789
1 - 2 195 451 52 86 - 784
2 - 4 150 154 50 34 - 388
4 - 8 157 80 34 4 1 276
8 - 16 82 27 24 5 - 138
16 - 32 27 8 4 2 - 41
32 - 64 4 - - - - 4
64 - 128 - - - - - -
>128 - - - - - -
TOTAL FIELD COUNT 689 1279 194 253 1 2420
AVERAGE CROP AREA (ha) 5 ha 2 ha 4 ha 2 ha 4 ha 3 ha
MEDIAN CROP AREA (ha) 3 ha 1 ha 3 ha 1 ha 4 ha 1 ha
AVERAGE PARCEL SIZE (ha) 9 ha 4 ha 8 ha 4 ha 9 ha 5 ha
Field size
(ha)Total number
Number of forage & pasture fields
* Unused forage/pasture refers to forage or pasture which has not been cut or grazed during the current growing season.
** Unmaintained forage/pasture refers to forage or pasture which would probably not warrant harvest.
1 Each distinct crop type on one parcel is counted as one crop activity. Each crop activity will include at least one and perhaps more crop fields. A parcel may have more than one crop activity if there is more than one distinct type of crop on that parcel.

Township of Langley Land Use Inventory - Page 54
Table A3. Distribution of vine & berry fields2
Blu
eb
err
ies
Cra
nb
err
ies
Ras
pb
err
ies
Be
rrie
s -
un
kno
wn
typ
e
Stra
wb
err
ies
Gra
pe
s
Bla
ckb
err
ies
< 1 26 1 5 2 3 13 2 52
1 - 2 13 2 5 - - 5 - 25
2 - 4 23 2 4 1 - 1 - 31
4 - 8 41 5 8 6 1 1 - 62
8 - 16 27 5 7 - 2 - - 41
16 - 32 8 3 - - - 1 - 12
32 - 64 - - - - - - - -
64 - 128 - 1 - - - - - 1
>128 - - - - - - - -
TOTAL COUNT 138 19 29 9 6 21 2 224
AVERAGE CROP AREA (ha) 6 ha 13 ha 5 ha 4 ha 6 ha 2 ha < 1 ha 6 ha
MEDIAN CROP AREA (ha) 5 ha 7 ha 5 ha 5 ha 4 ha < 1 ha < 1 ha 4 ha
AVERAGE PARCEL SIZE (ha) 10 ha 16 ha 11 ha 15 ha 18 ha 4 ha 10 ha 10 ha
Field size
(ha)
Total
number
Number of vine & berry fields
Table A4. Distribution of nursery & tree plantations
Nursery
unknown
Ornamentals
and shrubs
Cedar
hedging
Nursery
total
Plantation
unknown
Christmas
trees
Fibre/
pulp/
veneer
trees
Plantation
total
< 1 17 42 24 83 11 21 3 35 118
1 - 2 10 22 7 39 5 13 2 20 59
2 - 4 2 19 2 23 5 6 4 15 38
4 - 8 3 11 2 16 3 2 2 7 23
8 - 16 1 - 1 2 1 1 - 2 4
16 - 32 - - - - - 1 1 2 2
32 - 64 - - - - - - - - -
64 - 128 - - - - - - - - -
>=128 - - - - - - - - -
TOTAL ACTIVITY COUNT 33 94 36 163 25 44 12 81 244
AVERAGE CROP AREA (ha) 2 ha 2 ha 1 ha 2 ha 3 ha 2 ha 4 ha 2 ha 2 ha
MEDIAN AREA (ha) < 1 ha 1 ha < 1 ha 1 ha 2 ha 1 ha 2 ha 1 ha 1 ha
AVERAGE PARCEL SIZE (ha) 6 ha 5 ha 4 ha 5 ha 8 ha 5 ha 7 ha 6 ha 5 ha
Field size
(ha)
Total
number
Number of nursery activities Number of tree plantation activities
2 Each distinct berry crop type on one parcel is counted as one crop activity. Each activity will include at least one and perhaps more crop fields. A parcel
may have more than one berry activity if there is more than one distinct type of berry crops on that parcel.

Township of Langley Land Use Inventory - Page 55
GREENHOUSES & CROP BARNS
Table A5. Distribution of greenhouses and crop barns by building type3
Glass
greenhouse
Poly
greenhouseCrop barn
< 1 20 57 11 88
1 - 2 8 8 10 26
2 - 4 2 2 1 5
4 - 8 6 1 - 7
8 - 16 - - - -
16 - 32 - - - -
32 - 64 - - - -
64 - 128 - - - -
>128 - - - -
TOTAL COUNT 36 68 22 126
AVERAGE AREA (ha) 2 ha < 1 ha < 1 ha < 1 ha
MEDIAN AREA (ha) < 1 ha < 1 ha 1 ha < 1 ha
AVERAGE PARCEL SIZE (ha) 7 ha 5 ha 5 ha 6 ha
Greenhouse size
(ha)Total number
Number of Greenhouses / crop barns
Table A6. Distribution of greenhouses and crop barns by crop type4
Vegetables Nursery Floriculture Mixed Unknown Mushroom
< 1 6 32 12 1 30 11 92
1 - 2 - 7 4 2 4 10 27
2 - 4 - 1 - 1 1 1 4
4 - 8 4 1 1 1 - - 7
8 - 16 1 - - 1 - - 2
16 - 32 - - - - - - -
32- 64 - - - - - - -
64 - 128 - - - - - - -
>128 - - - - - - -
TOTAL COUNT 11 41 17 6 35 22 132
AVERAGE AREA (ha) 3 ha < 1 ha < 1 ha 4 ha < 1 ha < 1 ha < 1 ha
MEDIAN AREA (ha) < 1 ha < 1 ha < 1 ha 2 ha < 1 ha 1 ha 1 ha
AVERAGE PARCEL SIZE (ha) 10 ha 6 ha 4 ha 12 ha 4 ha 5 ha 6 ha
Greenhouse size
(ha)
Total
number
Type of greenhouse / crop barn
3 The average area and median area reported in this table excludes external greenhouse/crop barn yards, parking, warehouses and other infrastructure
related to the greenhouse/crop barn operation. 4 Each distinct greenhouse or crop barn type on one parcel is counted as one activity. Each activity will include at least one and perhaps more greenhouse
or crop barn structures. A parcel may have more than one activity if there is more than one distinct type of greenhouse or crop barn on that parcel.

Township of Langley Land Use Inventory - Page 56
LIVESTOCK
Table A7. Distribution of livestock operations by type
Be
ef
Dai
ry
Po
ult
ry
Swin
e Sheep /
lamb /
goat
Llama /
alpaca
Specialty
livestock
Unknown
livestock*
Inac
tive
Equ
ine
< 1 2 - 25 - 7 3 3 2 - 122 164
1 - 2 35 1 51 - 33 15 3 6 1 282 427
2 - 4 73 2 59 1 29 13 1 14 1 296 489
4 - 8 32 4 30 1 14 3 2 5 1 124 216
8 - 16 41 14 29 - 8 6 2 5 1 85 191
16 - 32 11 9 5 - 5 - 2 2 1 31 66
32 - 64 4 6 1 1 2 1 - - - 8 23
64 - 128 1 - - - - - - - - 2 3
>= 128 - - - - - - - - - - -
TOTAL NUMBER OF ACTIVITIES 199 36 200 3 98 41 13 34 5 950 1579
MEDIAN PARCEL SIZE (ha) 4 ha 16 ha 2 ha 8 ha 2 ha 2 ha 2 ha 2 ha 6 ha 2 ha 2 ha
AVERAGE PARCEL SIZE (ha) 7 ha 18 ha 5 ha 14 ha 5 ha 4 ha 7 ha 5 ha 10 ha 4 ha 5 ha
* Unknown livestock is where livestock structures were present but the specific type of livestock could not be determined.
Parcel size (ha)
Total
number of
activities
Type of activity
Table A8. Beef activities
Main typeSecondary
typeIntensive Intensive
Very small scale (1 cow) 7 7 14 - 14
Small scale (2-25 cattle) 160 12 172 - 172
Medium scale (2-25 cattle) 11 2 13 2 11
TOTAL 178 21 199 2 197
"Main Type" and "Secondary Type" of livestock are determined by comparing the scale of different
livestock activities on the parcel and does not represent primary agricultural activity.
"Non Intensive" livestock activities allow animals to graze on a pasture and often utilize
non intensive barns and corrals/paddocks.
"Intensive" livestock activities utilize specialized structures such as barns, feedlots and stockyards
designed for confined feeding at high stocking densities.
Scale of beef activity
By parcelTotal
number of
activities
By activity type

Township of Langley Land Use Inventory - Page 57
Table A9. Distribution of beef activities by parcel size and scale
Very small
(1 cow)
Small
(2-25
cattle)
Medium
(25-100
cattle)
Large
(> 100
cattle)
< 1 1 1 - - 2
1 - 2 7 28 - - 35
2 - 4 5 68 - - 73
4 - 8 - 32 - - 32
8 - 16 - 34 7 - 41
16 - 32 - 9 2 - 11
32 - 64 1 - 3 - 4
64 - 128 - - 1 - 1
>= 128
TOTAL NUMBER OF ACTIVITIES 14 172 13 - 199
AVERAGE PARCEL SIZE (ha) 4 ha 6 ha 26 ha - 7 ha
Parcel size (ha)
Scale of beef activitiesTotal
number of
activities
Figure A1. Distribution of beef activities by parcel size and scale
0
10
20
30
40
50
60
70
< 1
1 -2
2 -4
4 -8
8 -1
6
16
-32
32
-64
64
-12
8
Num
ber
of a
ctiv
itie
s
Parcel size (ha)
Very small
(1 cow)
Small (2-25 cattle)
Medium
(25-100 cattle)
Scale of activity
Figure A2. Land cover on parcels with beef activities
* Other includes vegetated lands seeded or planted for landscaping, dust, or soil control but not cultivated for harvest or pasture, lands
covered by built objects but not farm infrastructure, and bare areas such as piles, pits, fill dumps.
863
67 23
383
89
0
100
200
300
400
500
600
700
800
900
Forage & pasture
Farm infrastructure
Other cultivated land
Natural & Semi-natural
Other*
Tota
l ar
ea
(ha)
Outside ALR
In ALR

Township of Langley Land Use Inventory - Page 58
Table A10. Dairy activities
Main typeSecondary
typeIntensive
Non
intensive
Very small scale (1 cow) 1 - 1 1 -
Small scale (2-25 cattle) 5 2 7 6 1
Small scale - Dry cow - (2 -25 cattle) 1 - 1 1 -
Medium scale (25 -100 cattle) 19 - 19 16 3
Large scale (> 100 cattle) 8 - 8 - 8
TOTAL 34 2 36 24 12
"Main Type" and "Secondary Type" of livestock are determined by comparing the scale of different
livestock activities on the parcel and does not represent primary agricultural activity.
"Intensive" livestock activities utilize specialized structures such as barns, feedlots and stockyards
designed for confined feeding at high stocking densities.
"Non Intensive" livestock activities allow animals to graze on a pasture and often utilize
non intensive barns and corrals/paddocks.
Scale of dairy activity
By parcel Total
number of
activities
By activity type
Table A11. Distribution of dairy activities by parcel size and scale
Very small
(1 cow)
Small (2-
25 cattle)
Medium
(25-100
cattle)
Large (>
100
cattle)
< 1 - - - - -
1 - 2 - - 1 - 1
2 - 4 - 1 - 1 2
4 - 8 - 1 3 - 4
8 - 16 1 4 4 5 14
16 - 32 - - 8 1 9
32 - 64 - 2 3 1 6
64 - 128 - - - - -
>= 128
TOTAL NUMBER OF ACTIVITIES 1 8 19 8 36
AVERAGE PARCEL SIZE (ha) 8 ha 16 ha 21 ha 16 ha 18 ha
Parcel Size (ha)
Scale of dairy activitiesTotal
number of
activities
Figure A3. Distribution of dairy activities by parcel size and scale
0
2
4
6
8
10
< 1
1 -2
2 -4
4 -8
8 -1
6
16
-32
32
-64
64
-12
8
>=
12
8
Num
ber
of a
ctiv
itie
s
Parcel size (ha)
Very small (1 cow)
Small (2-25 cattle)
Medium (25-100 cattle)
Large (> 100 cattle)
Scale of activity

Township of Langley Land Use Inventory - Page 59
Figure A4. Land cover on parcels with dairy activities
* Other includes vegetated lands seeded or planted for landscaping, dust, or soil control but not cultivated for harvest or pasture, lands
covered by built objects but not farm infrastructure, and bare areas such as piles, pits, fill dumps.
515
35 7
78
20
0
100
200
300
400
500
600
Forage & pasture
Farm infrastructure
Other cultivated land
Natural & Semi-natural
Other*
Tota
l ar
ea
(ha)
Outside ALR
In ALR
Table A12. Poultry activities
Main typeSecondary
typeIntensive
Non
intensive
Chicken Very small scale (< 100 birds) 17 15 32 - 32
Chicken (layer) Very small scale (< 100 birds) 40 13 53 - 53
Chicken Small scale (100 - 2,500 birds) 6 1 7 3 4
Chicken (layer) Small scale (100 - 2,500 birds) 4 - 4 1 3
Chicken Medium scale (2,500 - 10,000 birds) 8 - 8 8 -
Chicken (broiler) Medium scale (2,500 - 10,000 birds) 8 1 9 9 -
Chicken (layer) Medium scale (2,500 - 10,000 birds) 10 - 10 10 -
Chicken Large scale (> 10,000 birds) 8 - 8 8 -
Chicken (breeder) Large scale (> 10,000 birds) 1 - 1 1 -
Chicken (broiler) Large scale (> 10,000 birds) 31 1 32 32 -
Chicken (layer) Large scale (> 10,000 birds) 10 - 10 10 -
Duck Very small scale (< 50 birds) 5 4 9 - 9
Duck Medium scale (1,250 - 5,000 birds) 1 - 1 1 -
Goose Very small scale (< 50 birds) 1 1 2 - 2
Goose Small scale (50 - 1,250 birds) - 1 1 - 1
Goose Large scale (> 5,000 birds) 2 - 2 2 -
Poultry - unknown Very small scale (< 100 birds) 2 1 3 - 3
Turkey Very small scale (< 50 birds) 1 1 2 - 2
Turkey Small scale (50 - 1,250 birds) 2 - 2 1 1
Turkey Medium scale (1,250 - 5,000 birds) 2 - 2 2 -
Turkey Large scale (> 5,000 birds) 2 - 2 2 -
TOTAL TOTAL 161 39 200 90 110
"Intensive" livestock activities utilize specialized structures at high stocking densities.
"Main Type" and "Secondary Type" of livestock are determined by comparing the scale of different livestock activities on the
parcel and does not represent primary agricultural activity.
"Non Intensive" livestock activities allow animals to graze on a pasture and often utilize non intensive barns.
Scale
By parcel Total
number of
activities
By activity type
Poultry activity

Township of Langley Land Use Inventory - Page 60
Table A13. Distribution of poultry activities by parcel size and scale
Very small
(< 100
birds)
Small
(100 -
2,500
birds)
Medium
(2,500 -
10,000
birds)
Large
(> 10,000
birds)
< 1 20 - 2 3 25
1 - 2 31 3 3 14 51
2 - 4 37 4 7 11 59
4 - 8 10 3 8 9 30
8 - 16 3 3 8 15 29
16 - 32 - 1 2 2 5
32 - 64 - - - 1 1
64 - 128 - - - - -
>= 128 - - - - -
TOTAL NUMBER OF ACTIVITIES 101 14 30 55 200
AVERAGE PARCEL SIZE (ha) 2 ha 5 ha 8 ha 7 ha 5 ha
Parcel size (ha)
Scale of poultry activities
Total
number of
activities
Figure A5. Distribution of poultry activities by parcel size and scale
0
5
10
15
20
25
30
35
40
< 1
1 -2
2 -4
4 -8
8 -1
6
16
-32
32
-64
64
-12
8
>=
12
8
Num
ber
of a
ctiv
itie
s
Parcel size (ha)
Very small(< 100 birds)
Small
(100 - 2,500 birds)
Medium(2,500 - 10,000 birds)
Large(> 10,000 birds)
Scale of activity
Figure A6. Land cover on parcels with poultry activities
* Other includes vegetated lands seeded or planted for landscaping, dust, or soil control but not cultivated for harvest or pasture, lands
covered by built objects but not farm infrastructure, and bare areas such as piles, pits, fill dumps.
235
100
45
199
87
0
50
100
150
200
250
Forage & pasture
Farm infrastructure
Other cultivated land
Natural & Semi-natural
Other*
Tota
l ar
ea
(ha)
Outside ALR
In ALR

Township of Langley Land Use Inventory - Page 61
Table A14. Sheep / lamb / goat activities
Main typeSecondary
typeIntensive
Non
intensive
Goat Very small scale (< 5 goats) 13 7 20 - 20
Goat Small scale ( 5 - 125 goats) 13 4 17 - 17
Sheep / lamb Very small scale (< 10 sheep) 14 11 25 - 25
Sheep / lamb Small scale ( 10 - 250 sheep) 32 4 36 - 36
TOTAL TOTAL 72 26 98 - 98
"Intensive" livestock activities utilize specialized structures at high stocking densities.
"Non Intensive" livestock activities allow animals to graze on a pasture and often utilize non intensive barns.
Activity Scale
By parcel Total
number of
activities
By activity type
"Main Type" and "Secondary Type" of livestock are determined by comparing the scale of different livestock activities on the
parcel and does not represent primary agricultural activity.
Table A15. Distribution of sheep / lamb / goat activities by parcel size and scale
Very small
(5 goats
or 10
sheep)
Small
(5-125
goats or
10-250
sheep)
Medium
(125-500
goats or
250- 1000
sheep)
Large
(>500
goats or
>1000
sheep)
< 1 6 1 - - 7
1 - 2 20 13 - - 33
2 - 4 10 19 - - 29
4 - 8 5 9 - - 14
8 - 16 1 7 - - 8
16 - 32 2 3 - - 5
32 - 64 1 1 - - 2
64 - 128 - - - - -
>= 128 - - - - -
TOTAL NUMBER OF ACTIVITIES 45 53 - - 98
AVERAGE PARCEL SIZE (ha) 4 ha 6 ha - - 5 ha
Parcel size (ha)
Scale of activities
Total
number of
activities
Figure A7. Distribution of sheep / lamb / goat activities by parcel size and scale
0
5
10
15
20
25
< 1
1 -2
2 -4
4 -8
8 -1
6
16
-32
32
-64
64
-12
8
>=
12
8
Num
ber
of a
ctiv
itie
s
Parcel size (ha)
Very small(5 goats or 10 sheep)
Small (5-125 goats or 10-250 sheep)
Scale of activity

Township of Langley Land Use Inventory - Page 62
Figure A8. Land cover on parcels with sheep / lamb goat activities
* Other includes vegetated lands seeded or planted for landscaping, dust, or soil control but not cultivated for harvest or pasture, lands
covered by built objects but not farm infrastructure, and bare areas such as piles, pits, fill dumps.
187
22 16
86
22
0
20
40
60
80
100
120
140
160
180
200
Forage & pasture
Farm infrastructure
Other cultivated land
Natural & Semi-natural
Other*
Tota
l ar
ea
(ha)
Outside ALR
In ALR
Table A16. Equine activities
Main TypeSecondary
TypeIntensive
Non
intensive
Very small scale (1 horse) 189 15 204 - 204
Small scale (2-25 horses) 656 14 670 - 670
Boarding Small scale (2-25 horses) 25 - 25 - 25
Companion Small scale (2-25 horses) 1 - 1 - 1
Recreation Small scale (2-25 horses) 1 - 1 - 1
Sporting / racing Small scale (2-25 horses) 3 - 3 - 3
Medium scale (25- 100 horses) 26 - 26 - 26
Boarding Medium scale (25- 100 horses) 10 - 10 - 10
Recreation Boarding Medium scale (25- 100 horses) 1 - 1 - 1
Sporting / racing Boarding Medium scale (25- 100 horses) 8 - 8 - 8
Sporting / racing Boarding Large scale (> 100 horses) 1 - 1 - 1
TOTAL TOTAL 921 29 950 - 950
Type of activity
"Main Type" and "Secondary Type" of livestock are determined by comparing the scale of different livestock activities on the
parcel and does not represent primary agricultural activity.
"Intensive" livestock activities utilize specialized structures such as barns, feedlots and stockyards designed for confined feeding
at high stocking densities.
"Non Intensive" livestock activities allow animals to graze on a pasture and often utilize non intensive barns and corrals/paddocks.
Scale of equine activity
By parcel Total
number of
activities
By activity type

Township of Langley Land Use Inventory - Page 63
Table A17. Distribution of equine activities by parcel size and scale
Very small
(1 - 2
equine)
Small
(2 - 25
equine)
Medium
(25 - 100
equine)
Large
(> 100
equine)
< 1 58 64 - - 122
1 - 2 62 216 4 - 282
2 - 4 60 233 3 - 296
4 - 8 13 97 14 - 124
8 - 16 8 64 13 - 85
16 - 32 2 21 8 - 31
32 - 64 1 4 2 1 8
64 - 128 - 1 1 - 2
>= 128 - - - - -
TOTAL NUMBER OF ACTIVITIES 204 700 45 1 950
AVERAGE PARCEL SIZE (ha) 3 ha 4 ha 13 ha 33 ha 4 ha
Parcel size (ha)
Scale of equine activities
Total
number of
activities
Figure A9. Distribution of equine activities by parcel size and scale
0
50
100
150
200
250
< 1
1 -2
2 -4
4 -8
8 -1
6
16
-32
32
-64
64
-12
8
>=
12
8
Nu
mb
er
of
act
ivit
ies
Parcel size (ha)
Very small (1 - 2 equine)
Small (2-25 equine)
Medium (2-25 equine)
Large (> 100 equine)
Scale of activity
Figure A10. Land cover on parcels with equine activities
* Other includes vegetated lands seeded or planted for landscaping, dust, or soil control but not cultivated for harvest or pasture, lands
covered by built objects but not farm infrastructure, and bare areas such as piles, pits, fill dumps.
1835
414
56
929
337
0
200
400
600
800
1000
1200
1400
1600
1800
2000
Forage & pasture
Farm infrastructure
Other cultivated land
Natural & Semi-natural
Other*
Are
a (h
a)
Outside ALR
In ALR

Township of Langley Land Use Inventory - Page 64
VALUE ADDED
Table A18. Value added activities
Small
scale
Medium
scale
Large
scale
Agritourism Guest ranch - 1 - 1 14
Agritourism Petting zoo 2 - - 2 11
Agritourism Seasonal events - 2 2 4 18
Agritourism Tours 3 3 - 6 15
Direct sales Equine sales 3 - - 3 3
Direct sales Permanent retail store 12 9 10 31 5
Direct sales Seasonal store (stand) 30 14 2 46 7
Direct sales U-pick 7 4 - 11 13
Processing Crop processing - 2 2 4 16
Processing Honey / wax processing 1 - - 1 0
Processing Meat processing 1 1 1 3 4
Processing Wine / cider processing 1 3 1 5 7
60 39 18 117
Value added Description
Scale of activity Total
number of
activities
Average
parcel size
(ha)
TOTAL NUMBER OF ACTIVITIES
Table A19. Distribution of value added activities by parcel size
Gu
est
ran
ch
Pe
ttin
g zo
o
Seas
on
al
eve
nts
Tou
rs
Equ
ine
sal
es
Pe
rman
en
t
reta
il st
ore
Seas
on
al
sto
re (
stan
d)
U-p
ick
Cro
p
pro
cess
ing
Ho
ne
y /
wax
pro
cess
ing
Me
at
pro
cess
ing
Win
e /
cid
er
pro
cess
ing
< 1 - - - - 1 1 2 - - 1 - - 5
1 - 2 - - 1 - 1 6 8 1 - - - 2 19
2 - 4 - - - - - 10 12 - 1 - 1 - 24
4 - 8 - 1 - 3 1 8 11 5 - - 2 2 33
8 - 16 1 - 1 - - 5 9 1 1 - - - 18
16 - 32 - 1 1 2 - 1 3 2 1 - - 1 12
32 - 64 - - 1 1 - - 1 2 1 - - - 6
64 - 128 - - - - - - - - - - - - -
>= 128 - - - - - - - - - - - - -
TOTAL NUMBER OF ACTIVITIES 1 2 4 6 3 31 46 11 4 1 3 5 117
AVERAGE PARCEL SIZE (ha) 14 ha 11 ha 18 ha 15 ha 3 ha 5 ha 7 ha 13 ha 16 ha 0 ha 4 ha 7 ha 8 ha
Parcel size (ha)
Total
number of
activities
Agri-tourism Direct Sales Processing

Township of Langley Land Use Inventory - Page 65
Table A20. Distribution of direct sales by parcel size and scale
Equine sales
Small scaleSmall
scale
Medium
scale
Large
scale
Small
scale
Medium
scale
Large
scale
Small
scale
Medium
scale
< 1 1 - - 1 2 - - - - 4
1 - 2 1 2 2 2 6 1 1 1 - 16
2 - 4 - 7 2 1 9 3 - - - 22
4 - 8 1 1 4 3 8 3 - 3 2 25
8 - 16 - 1 1 3 5 3 1 1 - 15
16 - 32 - 1 - - - 3 - 1 1 6
32 - 64 - - - - - 1 - 1 1 3
64 - 128 - - - - - - - - - -
>= 128 - - - - - - - - - -
TOTAL NUMBER OF ACTIVITIES 3 12 9 10 30 14 2 7 4 91
AVERAGE PARCEL SIZE (ha) 3 ha 5 ha 4 ha 6 ha 5 ha 11 ha 9 ha 12 ha 15 ha 7 ha
Parcel size (ha)
Total
number of
activities
Seasonal store (stand) U-pickPermanent retail store
Table A21. Distribution of agritourism events by parcel size and scale
Medium
ScaleSmall scale
Medium
Scale
Large
Scale
Small
Scale
Medium
Scale
< 1 - - 1 - - - 1
1 - 2 - - - - - - -
2 - 4 - - - - - - -
4 - 8 - 1 - - 2 1 4
8 - 16 1 - - 1 - - 2
16 - 32 - 1 1 - - 2 4
32 - 64 - - - 1 1 - 2
64 - 128 - - - - - - -
>= 128 - - - - - - -
TOTAL NUMBER OF ACTIVITIES 1 2 2 2 3 3 13
AVERAGE PARCEL SIZE (ha) 14 ha 11 ha 12 ha 24 ha 15 ha 16 ha 16 ha
Total
number of
activities
Parcel size (ha)
ToursGuest Ranch Petting zoo Seasonal events

Township of Langley Land Use Inventory - Page 66
Table A22. Distribution of processing by parcel size and scale
Honey /
wax
processing
Medium
scale
Large
scaleSmall scale
Small
scale
Medium
scale
Large
scale
Small
scale
Medium
scale
Large
scale
< 1 - - 1 - - - - - - 1
1 - 2 - - - - - - 1 1 - 2
2 - 4 1 - - - - 1 - - - 2
4 - 8 - - - 1 1 - - 1 1 4
8 - 16 - 1 - - - - - - - 1
16 - 32 1 - - - - - - 1 - 2
32 - 64 - 1 - - - - - - - 1
64 - 128 - - - - - - - - - -
>= 128 - - - - - - - - - -
TOTAL NUMBER OF
ACTIVITIES2 2 1 1 1 1 1 3 1 13
AVERAGE PARCEL
SIZE (ha)9 ha 24 ha 0 ha 5 ha 5 ha 3 ha 2 ha 9 ha 7 ha 9 ha
Parcel size (ha)
Total
number of
activities
Crop processing Wine / cider processing Meat processing