Embed Size (px)
Citation preview

REPORTIMK Report 141e, September 2018
On the effects of statutory minimum wagehttps://bit.ly/2zweQJD
Podcast
by Alexander Herzog-Stein
THE POSITIVE ECONOMIC IMPACT OF GERMANY’S STATUTORY MINIMUM WAGE – AN ECONOMETRIC ANALYSIS*
Alexander Herzog-Stein, Camille Logeay**, Patrick Nüß, Ulrike Stein and Rudolf Zwiener
AT A GLANCE
– A macro-econometric model is used to determine the short-run and the expected medium to long-run growth, price and employment effects of the introduction of the statutory minimum wage in Germany.
– The introduction of the minimum wage has tended to stimulate economic growth. This was mainly due to the higher wages of the minimum wage beneficiaries and a spill-over effect on ad-jacent wage groups. This benefited in particular those whose low savings rate led to a particlar-ly strong increase in real private consumption.
– There was also a marked structural shift away from “mini-jobs” towards additional employment subject to social security contributions, although the total number of hours work hardly changed.
– A short-term VAR analysis identifies a significant positive wage effect for 2015, positive (but not significant) overall economic price effects as ex-pected as well as a positive but not significant ef-fect on employment.
– The introduction of the statutory minimum wage has helped Germany to move towards a more sta-ble growth path based not only on export success but also on stable growth in domestic demand due to a better wage development.
* Revised summary of the empirical part of a study conduct-ed on behalf of the German Minimum Wage Commission (Mindestlohnkommission), “Macroeconomic consequenc-es of the statutory minimum wage from a Keynesian perspective” by Hansjörg Herr, Alexander Herzog-Stein, Jürgen Kromphardt, Camille Logeay, Patrick Nüß, Toralf Pusch, Thorsten Schulten, Andrew Watt and Rudolf Zwiener.
** Camille Logeay: Hochschule für Wirtschaft und Technik (HTW), Berlin.

IMK Report No. 141e, September 2018 Page 2
1 At a glance
2 Introduction
2 Minimum wage, wage structures and spill-over effects
5 Employment, prices and consumption
5 Employment and the minimum wage
7 Price increase and the minimum wage
8 Development in consumption and the minimum wage
9 Development of productivity and the minimum wage
9 Simulations using the IMK macro-econometric model
9 The minimum wage scenario (scenario 1)
12 Infobox 1: Sensitivity tests for the assumptions made
13 Infobox 2: Simulations with a VAR model
15 Minimum wage simulation assuming a deficit-neutral fiscal policy (scenario 2)
15 Simulation of a macroeconomically oriented wage policy (scenario 3)
16 Conclusions
INTRODUCTION
A federal statutory minimum wage was introduced in Germany on 1st January 2015, the first time in the country’s history that a unique standard minimum rate of pay set by law applied across the whole country. This was, unquestionably, one of the most important labour market reforms that will have a lasting impact on the German labour market.This report will begin with a descriptive analysis of the economic conditions prevailing when the minimum wage was introduced, moving on to the preliminary work required for a model-based em-pirical simulation analysis of the introduction of a statutory minimum wage in Germany. This analysis uses existing evidence of national and international research on key aspects, including changes in em-ployment structure and the impact they have had on volume of work and employment as well as the significance and extent of potential spill-over and productivity effects resulting from the introduction of the minimum wage.
The economic impact of introducing a minimum wage in Germany is then considered empirically, presenting two macro-econometric analyses. The first – a detailed quantitative study – considers its short-, medium- and long-term effects of the min-imum wage by means of model simulations us-ing the IMK’s Keynesian-type macro-econometric model. The second considers only the short-term macroeconomic effects using a small-scale vector autoregressive model. Finally, the report draws con-clusions from these studies.
MINIMUM WAGE, WAGE STRUCTURES AND SPILL-OVER EFFECTSGermany introduced its statutory minimum wage at a time when the German economy was in a good economic situation: in the year before its introduc-tion, in 2014, real GDP had grown by 1.9%, markedly more dynamically than in the two preceding years. Labour market trends remained positive: according to the National Accounts (NA) of the Federal Statis-tical Office, there was a marked increase of 0.8% in the number of persons in employment, driven by the increase in employment subject to social security contributions. Meanwhile the average hours worked also increased. Accordingly, unemployment contin-ued to decrease and the annual average unemploy-ment rate was 6.7%.
The overall economic development following the introduction of the minimum wage in 2015 contin-ued the favourable pattern of the previous year (Fig-ure 1) and continued uninterrupted since then. With GDP growing by 1.7%, 1.9% and 2.2%, economic performance developed even more dynamically in the years 2015 to 2017 than in previous years. The la-bour market also gained further momentum. The av-erage annual employment figure rose by 0.9%, 1.3% and 1.5% over the same three years, underpinned by more rapid growth in employment subject to social security contributions (Figure 1c), while the number of those employed solely in “mini-jobs” 1 (low-paid and mostly part-time jobs representing the biggest category of marginal employment), which had been largely static in the previous years, has been falling since the introduction of the minimum wage (Fig-ure 1d). Overall, from January 2015 onwards, the in-crease in employment subject to social security con-tributions considerably outweighed the fall in the number of “mini-jobs”. In 2017, the unemployment rate reached a record low of 5.7%, a fall of one per-
1 “Mini-jobs” in Germany refer to jobs that are exclusively low-paid and part-time and that are not subject to social security contributions.
CONTENTS

IMK Report No. 141e, September 2018 Page 3
centage point compared to 2014. Wages and sala-ries per hour worked by employees rose year on year by 2.6%, 3.2% and 2.8% in the three years following the introduction of the minimum wage, and there-fore faster than in 2014 when it increased by 2.2% in 2014 (Figure 2b). Current forecasts for 2018 and 2019 indicate a further positive overall economic outlook for Germany (Herzog-Stein et al. 2018).
The Macroeconomic Policy Institute (IMK) mac-ro-econometric model uses a number of empir-ically supported assumptions to gauge the overall economic impact of introducing the statutory min-
imum wage in Germany 2. The key model assump-tion relates to the magnitude of the wage impulse resulting from the introduction of the minimum wage of €8.50. The number of employees directly affected ranged from 3.97 million (2014 Structure of Earnings Survey (SES)) to 4.08 million (Socio-Eco-nomic Panel (SOEP) v32 3). According to Federal Sta-tistical Office calculations based on the SES 2014, over 4 million people paid at or below the minimum
2 For details of the model, see Herr et al. (2018), loc. cit.
3 Data for the period from 1984 to 2015 are from SOEP ver-sion 32, 2016, doi:10.5684/soep.v32.
Figure 1
Macroeconomic trends before (2012-2014) and after (2015-2017) the introduction of the minimum wage
a) Real GDP1 b) Wages and salaries per hour worked by employees2, nominal
c) Employees subject to social security contributions (ESC)3 d) Mini-jobs3,4
Note: all figures in boxes are annual: a) and b) rate of change from previous year (in %) c) above: annual average ESC; below: change in ESC (in 1000s of individuals) d) above: annual average “mini-jobs”; below: change in “mini-jobs” (in 1000s of individuals)
1: Rate of change from previous quarter, price-, seasonally- and calendar-adjusted.2: Rate of change from previous quarter, seasonally adjusted with Census X-12-ARIMA.3: Change from previous quarter, calculated on the basis of seasonally- and calendar-adjusted monthly figures.4: Exclusively low-paid and part-time employees (change).
Sources: Federal Statistical Office; Deutsche Bundesbank; IMK calculations.
76,571 mm = 3-spaltig - 4 Grafiken & 3-spaltig
a) Real GDP1 b) Wages and salaries per hour worked by employees2, nominal
c) Employees subject to social security contributions (ESC)3 d) Mini-jobs3,4
Sources: Federal Statistical Office; Deutsche Bundesbank; IMK calculations
Macroeconomic trends before and after the introduction of the minimum wage
Note: all figures in boxes are annual averages.a) and b): rate of change from previous yearc) above: annual average ESC; below: change in ESC (in 1000s of individuals)d) above: annual average mini-jobs; below: change in mini-jobs (in 1000s of individuals)
1: Rate of change from previous quarter, price-, seasonally- and calendar-adjusted.2: Rate of change from previous quarter, seasonally adjusted in line with Census X-12-ARIMA.3: Change from previous quarter, calculated on the basis of seasonally- and calendar-adjusted monthly figures.4: Exclusively low-paid employees (change).
-2,5
-1,5
-0,5
0,5
1,5
2,5
3,5in %
2012 2013 2014 2015 201720160,5 0,5 1,9 1,7 2,21,9 -2,5
-1,5
-0,5
0,5
1,5
2,5
3,5in %
2012 2013 2014 2015 201720163,9 2,8 2,2 2,6 2,83,2
28000
29000
30000
31000
32000
33000
-250-200-150-100-50
050
100150200250
29363 29728 30220 30855 3225631536642 364 492 635 720681
in 1000
2012 2013 2014 2015 20172016 2000
3000
4000
5000
6000
7000
-250-200-150-100-50
050
100150200250
-34 39 11 -181 -63-464979 5018 5029 4848 47394802
in 1000
2012 2013 2014 2015 20172016

IMK Report No. 141e, September 2018 Page 4
wage received an average wage increase of 18% in 2015 (Federal Statistical Office 2016), equivalent to an overall 0.43% increase in wages and salaries (Mindestlohnkommission 2016, footnote 50, p. 116). 4
A wage impulse on this scale feeds into the mod-el as an exogenous increase in wage adjustment. In the model simulation, further wage adjustments then occur endogenously over the years because the minimum wage will also be increased – in the model – in line with estimated normal effective wage adjustments in the whole economy. 5 Moreo-ver, the price and productivity increases generated by introduction of the minimum wage trigger small additional wage increases in subsequent wage rounds in all the sectors affected. Induced changes in the level of unemployment also have an impact on effective wage developments.
The minimum wage has two effects on the wage structure of an economy. First, it establishes a gen-eral pay floor that limits downward wage spread and produces a compression effect from the bottom of the wage structure, resulting in a more egalitari-an wage distribution. Second, however, it may also have an opposite effect if its introduction or increase results in wages above the minimum wage level being raised too. This “spill-over effect” counter-acts the compression effect and reduces the wage spread in the lower half of the distribution.
Both effects may be significant for the macroe-conomic impact of a minimum wage, though the extent of that impact depends on many factors, par-ticularly the level at which the minimum wage is set and the rate at which it is adjusted but also institu-tional factors, such as the structure and functioning of the national wage determination system – par-ticularly the importance and coverage of collective agreements.
The SES 2014 and the 2015 Earnings Survey (ES) (Frentzen and Günther 2017) are a good basis for assessing the impact of introducing an €8.50 hourly minimum wage from 1st January 2015 (Figure 3 in Herr et al. 2018; see also Mindestlohnkommission 2016, pp. 49-59). They indicate that the proportion of all employees earning less than €8.50 per hour was greatly reduced, resulting in a marked compression
4 Technical model simulations were conducted for the peri-od from 2001 to 2015. To reflect the lag built into the mod-el, they actually began in 1999, carrying over the impulses to produce the same (relative) order of magnitude as in 2015. Given the relatively small impulse, the IMK model behaves in a largely linear way. The coefficients of the model are estimated over a period of time from 1980 to 2015 (the state sector uses a shorter period, from 1991 to 2015). It is, therefore, methodologically justifiable to carry out the simulation analyses with a time delay and to carry the interpretation of the findings over to the period after 2015.
5 Under the minimum wage legislation, the Minimum Wage Commission bases its two-yearly changes to the level inter alia of the average development of wages determined by collective bargaining. The model can depict only trends in effective wages.
effect. Furthermore, it can be shown that there was a substantial increase not only in the group earn-ing exactly €8.50 per hour but also among those earning up to €10.00 per hour, suggesting a marked spill-over effect. Above €10.00 per hour, by contrast, there was virtually no change in the wage structure except in Eastern Germany, where both the com-pression effect and the spill-over effect were rather more pronounced (Mindestlohnkommission 2016, p. 57).
On the basis of these observations, it seems appropriate to quantify a spill-over effect on gross hourly wages of up to €10.00. Calculations based on the data from SES 2014 and the ES 2015 – ad-justed both for the overall increase in employment and average wage growth compared to the previ-ous year – show that this can be estimated at a not insignificant total of around 5.4 billion € across the economy or of over 0.4% of wages and salaries in 2014 (see Appendix A3 in Herr et al. 2018). The ex-tent of this indirect impact more or less mirrors the direct impact of the minimum wage on wages and salaries, justifying the inclusion of spill-over effects when considering the macro-econometric impact across the economy of a minimum wage.
Therefore, for the model simulations of the im-pact of introducing the minimum wage, this report assumes an exogenous impulse on wages and sala-ries of a total of 0.86%, split equally between direct effect and an induced spill-over effect (see Appendix A3 of Herr et al. 2018 for details of the calculation). 6 It also assumes that the minimum wage legislation has been correctly implemented (full compliance) and therefore an income effect of 0.43% of wages and salaries calculated by the Federal Statistical Of-fice is used. The evaluation of the empirical compo-sition of individual wage groups on the basis of the SES 2014 and the ES 2015 and the determination of the spill-over effects provide empirical evidence for the assumptions used overall – i.e. minimum wage effect plus spill-over effect.
6 In reality, the impulse from the minimum wage did not occur in full as a one-off effect in early 2015; there were partial minimum wage effects that began before 2015 and effects that became evident only during the course of 2015. This time structure cannot be illustrated using a model simulation. For this reason, in reality, the total spread of the impulse over several quarters is assumed to be a one-off effect. However, this means that the effect of the minimum wage in the initial quarters of the model simulation (which follow directly from the exogenous mo-mentum) are somewhat exaggerated. This, though, has no impact on the key short-, medium- and long-term effects described here.
IMK Report No. 141e, September 2018 Page 5
EMPLOYMENT, PRICES AND CONSUMPTION
Employment and the minimum wage
Employment structureThe minimum wage debate has focused most close-ly on the link between the minimum wage and em-ployment, as is also illustrated by the literature sur-vey in the German Minimum Wage Commission’s first report (Mindestlohnkommission 2016, pp. 22-25). There is more disagreement over the evaluation of empirical evidence in this area than in almost any other. However, the findings of several meta-stud-ies show overall that the minimum wage has had few, if any, significant effects on employment (OECD 2015, Table 1.3, p. 47); the existing findings from the evaluation of sectoral minimum wages in Germany point in the same direction (see summary overview in Mindestlohnkommission 2016, p. 24); and the findings of two new macro-econometric studies also bear this out. In a recent analysis for the Euro-pean Commission’s 2016 annual report Labour Mar-ket and Wage Developments in Europe, Arpaia et al. (2017) examine the employment effects of statutory minimum wages across 18 EU Member States in a macroeconomic panel analysis. They find no statis-tically significant effects on employment as a whole but some negative effects on young employees and, to a certain extent, also on those with low skills lev-els (Arpaia et al. 2017, p. 19). A further new macroe-conomic panel analysis for 19 OECD countries finds little empirical evidence for a substantial negative effect on employment for low skilled or young work-ers (Sturn 2018). Overall, the existing econometric evidence allows the conclusion that the introduction of a statutory minimum wage has little, if any, im-pact on employment.
The development of employment and individual working hours in the year in which the minimum wage was introduced in Germany is documented in detail in the Minimum Wage Commission’s first report (Mindestlohnkommission 2016, p. 75ff. and 105ff.). In 2015, employment development was pos-itive due to the increase in employment subject to social security contributions, which was almost four times as high as the decline in the number of employees in “mini-jobs”. One reason for this marked shift in the employment structure is the in-troduction of the minimum wage. Taking account of tax exemptions, flat-rate payments from em-ployers, and the administrative simplicity of sub-sidised “mini-jobs” at the expense of employment subject to social security contributions, the statu-tory minimum wage and the resulting greater trans parency with regard to payment and employee rights appear to have made it more attractive for employers to offer contracts subject to social secu-
rity contributions. At the same time, the minimum wage combined with the fixed monthly wage limit of €450 per month for “mini-jobs” has reintroduced a ceiling on hours of work (between 12 and 13 hours).
The first empirical findings on the employment ef-fects of the minimum wage are also now available. vom Berge and Weber (2017) find clear evidence of the shift in the employment structure identified above. Garloff (2017) also points to a significant posi-tive correlation between regional and sector-specific impact and the increase in jobs subject to social se-curity contributions but no significant link between the number of “mini-jobs” and jobs subject to social security contributions. Evaluations on the basis of data from the IAB Establishment Panel also show that companies impacted by the minimum wage have recruited fewer new employees than com-panies not affected (Bossler and Gerner 2016) and have taken a wide range of measures to adapt to the new rules on minimum pay (Bellmann et al. 2016), most commonly by reducing new recruitment.
Working timeThese changes within the employment structure induced by the introduction of the minimum wage mean that a minimum wage simulation using the IMK macro-econometric model require a number of empirically supported assumptions: the model can-not endogenously depict the effects of these struc-tural shifts on volume of work and employment.
This also requires more detailed information on the development in working hours. The existing em-pirical German and international literature on the influence of a minimum wage on working time pro-vide however no such information. 7 Initial findings for Germany suggest that companies are adjusting the working time of their employees: Bellmann et al. (2016) indicate that 18.0% of companies affect-ed by the introduction of the minimum wage have cut hours of work or intensified work, with a high-er figure in Eastern Germany (20.0% of companies affected).
Existing findings on trends in working time vary by data source. Wanger and Weber (2016) use working time data from the microcensus to show that the hours worked by those in “mini-jobs” fell by more than 5% across the country following the in-troduction of the minimum wage, although in West-ern Germany alone, the fall was only half that. With a minimum wage of €8.50, this effect is most visible at the point at which workers are likely to switch to jobs subject to social security contributions (those working between 12 and 13 hours per week).
On the basis of the quarterly ES, the Minimum Wage Commission concludes that full-time employ-ees in the sectors most impacted by the minimum
7 See Mindestlohnkommission (2016, p. 105) for a short overview of the literature on changes in working hours induced by the minimum wage.

IMK Report No. 141e, September 2018 Page 6
wage saw no significant changes in their hours of work, but that cuts in hours among part-time work-ers were evident in these sectors during the first three quarters of 2015; these were more marked in Eastern Germany (Mindestlohnkommission 2016, p. 105ff.). On the basis of the SES 2014 and the ES 2015, a comparison of the average weekly working hours of persons earning less than €8.50 per hour in 2014 with average weekly working hours of those earn-ing between €8.45 and €8.54 in 2015 shows a fall in hours of work among full-timers and those in
“mini-jobs” by 3.8 and 0.8 hours respectively and a slight rise, of 0.4 hours a week, among part-timers (Frentzen and Günther 2017, Table 10).
Own calculations and model assumptionsThe changes in the employment structure induced by the introduction of a minimum wage between
“mini-jobs” and full-time and part-time employment subject to social insurance contributions have an impact on the total hours worked in the economy. Own calculations show a possible effect of between 0.04% and +0.02% of the total hours worked in 2014 (Table 1). This suggests that the direct effect of these changes in the employment structure on total hours worked is likely to have been extremely small.
In terms of employment, our calculations indicate that the minimum wage produced a negative net ef-fect across the economy of 74 400 persons working in “mini-jobs” by the end of 2015 and a further 43 400 by the end of 2016 (see Appendix A2 in Herr et al. 2018). However, this reflects only the decline in “mini-jobs”. Overall, employment in Germany in-
creased to differing extents in 2015 and 2016 and, according to the NA, the total number of employees at the end of 2016 was 1.2 million higher than at the end of 2014.
What is striking about reactions to the intro-duction of the minimum wage in 2015 is the rapid and marked decline in the number of those in “mi-ni-jobs”. IAB studies found that immediately follow-ing the introduction of the minimum wage, the fall in “mini-jobs” was compensated for by a greater in-crease in part- and full-time employment in sectors particularly impacted by the minimum wage (vom Berge and Weber 2017). Based on these findings, we calculate that the volume of work may well have remained unchanged. With an unchanged number of hours worked, the total employment effect as the result of the shift in the employment structure was -0.3% by the end of 2016 (see Appendices A1 and A2 in Herr et al. 2018).
For the simulations, this observed shift in the em-ployment structure was included exogenously in the model. 8 This means that the numbers in paid em-ployment fell by 0.25% in year 2. There is likely to be a further slow decline, taking employment losses to up to 0.4% after five years. It is assumed that the impact of the decline in the numbers in “mini-jobs” on the volume of work will continue to be largely offset by an increase in part- and full-time employ-ees. With this structural shift between “mini-jobs”
8 The employment and wage equations of the macro-econo-metric model are estimated on a per capita basis.
Table 1
Effect of volume of work
Note: figures on departures and switches from “mini-jobs” are taken from Table 2 in vom Berge and Weber (2017). Figures on weekly hours of work relate to infor-mation from Table 10 in Frentzen and Günther (2017). In the case of end-of-year departures (unknown destination), it is assumed that on the basis of the informa-tion from Table 10 in Frentzen und Günther (2017) that previous weekly working hours were 9.0.
In variant 1, the assumption is that weekly working hours do not change on switching from marginal to part-time employment. Weekly hours therefore continue to reflect the hours of those in “mini-jobs”, who in 2014, earned below €8.50 per hour gross.
In variant 2, the assumption is that the weekly hours of those switching to part-time work reflect the weekly hours in 2014 of all part-time workers earning below €8.50 per hour.
Sources: vom Berge and Weber (2017, Table 2); Frentzen and Günther (2017, Table 10); Federal Statistical Office, Fachserie 18 Reihe 1,2; IMK calculations.
Tabelle 1
Table 1 Effect of volume of work
Difference in differenus
2014 vs 2013
2015 vs 2014
Weekly working
time(in hours)
Effect on annual work volume
Weekly working
time(in hours)
Effect on annual work volume
(in hours)
"Mini-Jobs"End-of-year departures; destination unknown +12 000 +80 400 +68 400 0 -32 099 143 0 -32 099 142
End-of-year switchesof which: to full-time +600 +5 200 +4 600 36.3 +6 548 100 36.3 +6 548 100of which: to part-time +5 800 +51 200 +45 400 9.0 +0 23.8 +35 035 828
Total impact on work volumein hours: -25 551 042 +9 484 785in % of 2014 work volume: -0.044 0.016
Sources: vom Berge and Weber (2017, Table 2); Frentzen and Günther (2017, Table 10); Federal Statistical Office, Fachserie 18 Reihe 1,2; IMK calculations.Statistisches Bundesamt Fachserie 18 Reihe 1,2; Eigene Berechnungen.
Change from previous year (persons) Variant 1 Variant 2
Note: figures on departures and switches from marginal employment are taken from Table 2 in vom Berge and Weber (2017). Figures on weekly hours of work relate to information from Table 10 in Frentzen and Günther (2017). In the case of end-of-year departures (unknown destination), it is assumed that on the basis of the information from Table 10 in Frentzen und Günther (2017) that previous weekly working hours were 9.0.In variant 1, the assumption is that weekly working hours do not change on switching from marginal to part-time employment. Weekly hours therefore continue to reflect the hours of those in “mini-jobs”, who in 2014, earned below 8.50 € per hour gross.In variant 2, the assumption is that the weekly hours of those switching to part-time work reflect the weekly hours in 2014 of all part-time workers earning below 8.50 € per hour.
IMK Report No. 141e, September 2018 Page 7
and part- and full-time employment, wages and sal-aries – calculated by multiplying per capita wages by persons employed – rose by 0.43%, according to Federal Statistical Office calculations, reflecting the simultaneous rise in the product of hourly wages and the unchanged volume of work.
Price increase and the minimum wage
As the theoretical considerations show (see Herr et al. 2018, section 2), the introduction of the minimum wage is likely to have had price effects, although the extent of this impact depends on the actual imper-fections in the specific goods markets and parts of the labour market affected by the minimum wage. In reality, it can be assumed that introducing the minimum wage entailed some noticeable sectoral price increases, which are likely to have carried over into small-scale macroeconomic price effects. These in turn depend on the economic importance of the sectors affected by the minimum wage.
There is relatively little empirical research into the effect of the minimum wage on prices. For Germany, the first report of the Minimum Wage Commission (2016, p. 118) indicates that, for a range of reasons, no robust analysis of the price effects could be car-ried out as part of the assessment of sectoral mini-mum wages. Internationally, there are a number of relevant studies, particularly from the USA and the UK. In a literature survey, Lemos (2008) concludes that it is difficult to identify price effects across an economy and that across all existing studies, the overall price effect of a 10% rise in the minimum wage is around 0.2% (Lemos 2008, p 196).
Arpaia et al. (2017, pp. 25-26) analyse the min-imum wage effect on consumer prices in 20 EU countries. They conclude that an increase of around 10% in the minimum wage drives up prices by be-tween 0.4% and 0.6% overall, with the effect of a higher minimum wage varying greatly depending on the product category. Overall, they conclude that an increase in the minimum wage is only partly passed on into prices. Households in the lower income dis-tribution are somewhat less affected by price in-creases than higher-income households (Arpaia et al. 2017, p. 27). Findings from the 2015 IAB Estab-lishment Panel show that in Germany, higher retail prices were one of the favoured responses to the minimum wage (Bellmann et al. 2016).
German inflation was very modest in 2015, with an average increase in the consumer price index of just 0.3%, down from 0.9% the previous year. The same pattern was in evidence in the first quarter of 2015; in particular in January the index actually fell by 0.3%. However, only the (unobservable and counterfactual) 2015 rate of inflation rate excluding the effect of the minimum wage could accurately demonstrate the impact on prices. Consideration of the economic environment at the time shows that in early 2015, slower growth in oil prices also had
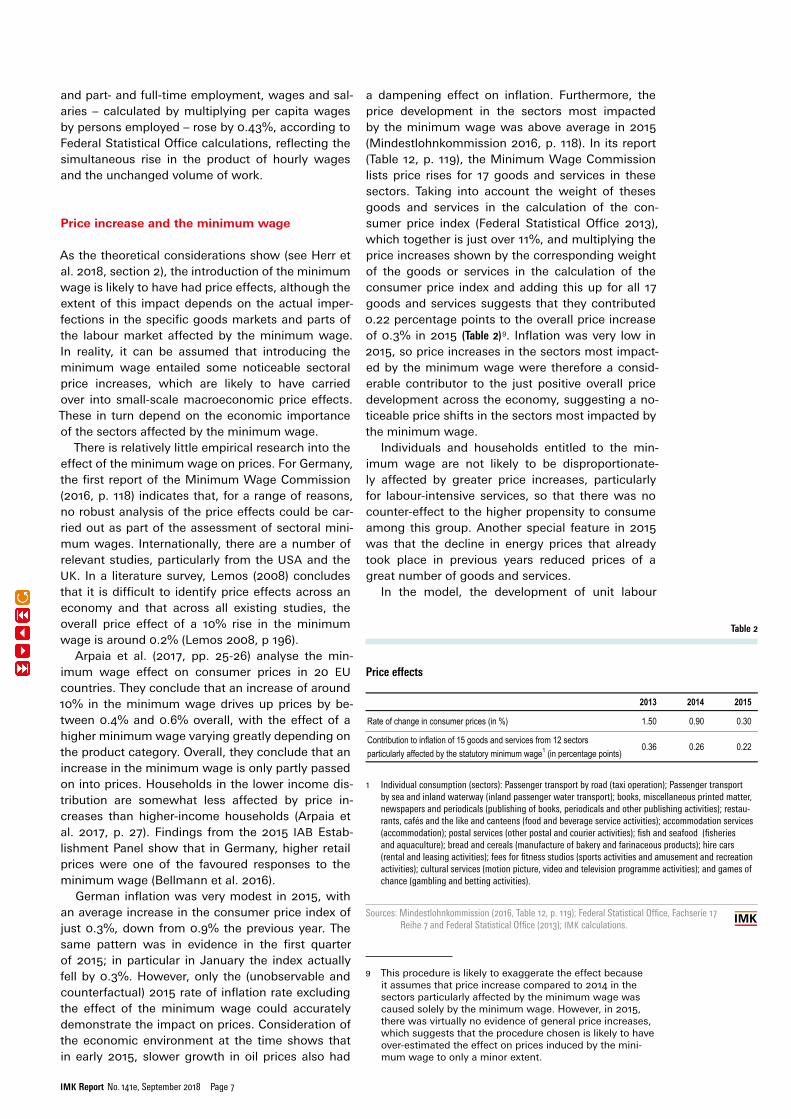
a dampening effect on inflation. Furthermore, the price development in the sectors most impacted by the minimum wage was above average in 2015 (Mindestlohnkommission 2016, p. 118). In its report (Table 12, p. 119), the Minimum Wage Commission lists price rises for 17 goods and services in these sectors. Taking into account the weight of theses goods and services in the calculation of the con-sumer price index (Federal Statistical Office 2013), which together is just over 11%, and multiplying the price increases shown by the corresponding weight of the goods or services in the calculation of the consumer price index and adding this up for all 17 goods and services suggests that they contributed 0.22 percentage points to the overall price increase of 0.3% in 2015 (Table 2) 9. Inflation was very low in 2015, so price increases in the sectors most impact-ed by the minimum wage were therefore a consid-erable contributor to the just positive overall price development across the economy, suggesting a no-ticeable price shifts in the sectors most impacted by the minimum wage.
Individuals and households entitled to the min-imum wage are not likely to be disproportionate-ly affected by greater price increases, particularly for labour-intensive services, so that there was no counter-effect to the higher propensity to consume among this group. Another special feature in 2015 was that the decline in energy prices that already took place in previous years reduced prices of a great number of goods and services.
In the model, the development of unit labour
9 This procedure is likely to exaggerate the effect because it assumes that price increase compared to 2014 in the sectors particularly affected by the minimum wage was caused solely by the minimum wage. However, in 2015, there was virtually no evidence of general price increases, which suggests that the procedure chosen is likely to have over-estimated the effect on prices induced by the mini-mum wage to only a minor extent.
Table 2
Price effects
1 Individual consumption (sectors): Passenger transport by road (taxi operation); Passenger transport by sea and inland waterway (inland passenger water transport); books, miscellaneous printed matter, newspapers and periodicals (publishing of books, periodicals and other publishing activities); restau-rants, cafés and the like and canteens (food and beverage service activities); accommodation services (accommodation); postal services (other postal and courier activities); fish and seafood (fisheries and aquaculture); bread and cereals (manufacture of bakery and farinaceous products); hire cars (rental and leasing activities); fees for fitness studios (sports activities and amusement and recreation activities); cultural services (motion picture, video and television programme activities); and games of chance (gambling and betting activities).
Sources: Mindestlohnkommission (2016, Table 12, p. 119); Federal Statistical Office, Fachserie 17 Reihe 7 and Federal Statistical Office (2013); IMK calculations.
Table 2 Price effects
2013 2014 2015
Rate of change in consumer prices (in %) 1.50 0.90 0.30
Contribution to inflation of 15 goods and services from 12 sectors particularly affected by the statutory minimum wage1 (in percentage points)
0.36 0.26 0.22
1 Individual consumption (sectors): Passenger transport by road (taxi operation); Passenger transport by sea and inland waterway (inland passenger water transport); books, miscellaneous printed matter, newspapers and periodicals (publishing of books, periodicals and other publishing activities); restaurants, cafés and the like and canteens (food and beverage service activities); accommodation services (accommodation); postal services (other postal and courier activities); fish and seafood (fisheries and aquaculture); bread and cereals (manufacture of bakery and farinaceous products); hire cars (rental and leasing activities); fees for fitness studios (sports activities and amusement and recreation activities); cultural services (motion picture, video and television programme activities); and games of chance (gambling and betting activities).
Sources: Mindestlohnkommission (2016, Table 12, p. 119); Federal Statistical Office, Fachserie 17 Reihe 7 and Federal Statistical Office (2013); IMK calculations.

IMK Report No. 141e, September 2018 Page 8
costs is important in the price equations but is rela-tivised through companies’ pricing-to-market strat-egies (Horn et al. 2017). These strategies are, how-ever, likely to have played only a small part in the case of domestic services, which are all subject to the same minimum wage and face little competition from imports. To that extent, a greater and more rap-id transfer into prices can be expected than is nor-mally observed following general wage rises across the economy. In the model, the – estimated – pro-cess of passing on higher unit labour costs lags to some extent. After the introduction of the minimum wage, however, prices rose immediately in most of the sectors affected (Mindestlohnkommission 2016, p. 119). Without an exogenous intervention in the model, the simulation shows a short-term price increase induced by the minimum wage of “only” 0.1%. Therefore, for the simulation of the introduc-tion of the minimum wage, right at the beginning of the simulations a permanent premium of 0.1% was set on the simulated price level of private con-sumption. Thus the price effect in the model, with the exogenous additional impulse, is still somewhat lower than the estimated induced price effect from the literature and own calculations presented above.
Development in consumption and the minimum wage
In empirical studies on the effects of introducing the minimum wage, there is little discussion of the ex-tent to which the comparatively high propensity to consume of individuals and households benefiting from the minimum wage or spill-over effects has further boosted demand. This absence may be at-tributable to the fact that partial equilibrium models cannot answer this question. An economic model like the IMK model does, however, enable this issue to be addressed.
Arpaia et al. (2017, p. 28ff.) investigate the influ-ence of the minimum wage on average consumer spending by consumption quintiles for 18 EU mem-ber states. Econometric estimates show a signifi-cant positive effect of a minimum wage increase on overall economic consumption, with a stronger ef-fect at the lower end of the distribution, suggesting that a 1% increase in the minimum wage produces a 0.7% increase in consumption in the bottom quintile, a 0.6% increase in the second quintile and an in-crease of between 0.3% and 0.4% in the third quin-tile. These values are seen as the upper limits of the consumption effect of the minimum wage (see Ar-paia et al. 2017, pp. 29-30 and particularly Table 11) 10 and are very high, given that only some households in the three lowest quintiles benefit directly from any
10 Figures in Table 11 in Arpaia et al. (2017) suggest that the effect for the third quintile is between 0.5% and 0.3% (av-erage: 0.4%).
increase in the minimum wage. As far as the trans-ferability of these values to Germany is concerned, it should be noted that these orders of magnitude reflect average values for all 18 countries included in the study and that the minimum wage may well have a quite different impact on income quintiles in these countries than in Germany. Moreover, there is no empirical evidence for the impact of a minimum wage on household incomes in Germany, so it is not possible to gauge the transferability of the findings.
Despite these limitations on transferability, it can be assumed that the introduction of the mini-mum wage in Germany has produced a significant additional consumption effect. A study based on the 2011 Socio-Economic Panel (SOEP) provided information on the distribution of (then potential) recipients of an €8.50 minimum wage across var-ious equivalence-weighted net household incomes (Müller and Steiner 2013, Table 4). Our own calcu-lations on the basis of this information shows that more than two thirds of the individuals affected by the introduction of an €8.50 minimum wage were in the lower half of the income distribution, with more than three quarters in the lowest three quin-tiles. 11 Because the propensity to consume of these households is above average (Stein 2009, Figure 8; Klär and Slacalek 2006, Figure 3, Brenke 2018), it can be assumed that the introduction of the mini-mum wage had a particularly positive effect on con-sumption, especially since there was no negative employment effect across the economy to depress spending. In any case, the consumption effect is likely to be significantly higher than with a general wage increase: households with an above-average propensity to consume are likely to have benefited more from the minimum wage than from a conven-tional general wage increase, whereas for house-holds with a below-average propensity to consume, exactly the opposite is likely to have been the case, suggesting that across the economy, the minimum wage has a greater impact on spending than a gen-eral wage increase.
Since those receiving a minimum wage live pre-dominantly in households with incomes in the low-er income distribution, the marginal propensity to consume is likely to be high. Without an exogenous intervention in the consumption equation, real pri-vate consumption would also rise in line with the estimated equation, but by less than expected due to the higher propensity to consume. Furthermore the model is likely to overestimate slightly the neg-ative effects from taxes because it uses average rates. The model estimates also a certain time-lag for the full effect of income changes to consumption changes. In the case of a high number of persons with low incomes and very low, or even, negative
11 Similar distribution findings are available for Austria on the basis of information from Ederer et al. (2017), but on the basis of a monthly minimum wage of €1500.

IMK Report No. 141e, September 2018 Page 9
savings rates, however, the adjustment process may be more rapid.
For 1995 to 2007, for example, an estimate based on SOEP data produces downward divergences of between 4 and 8 percentage points between the savings rates of first quantile households and aver-age savings rates of all households; this divergence increased noticeably over time (Stein 2009). In its annual report for 2016/2017, the German Council of Economic Experts reports calculations by the Federal Statistical Office for the years 1998 to 2013 showing that the savings rate over these 15 years fell markedly – by just under 2 percentage points on average but by 5 percentage points for many households (German Council of Economic Experts 2016, p. 329). Average savings rates were positive only for households with a net monthly income above €2000, whereas 15 years earlier, a net house-hold income of €1300 had sufficed for a positive savings rate. The increase in price level in those 15 years can only explain half of this change. The cur-rent average savings rate of around 10% requires a net monthly income of between €3600 and €5000. A recent study by Brenke (2018, p. 188ff) for 2013 shows that a total of 30% of all households are in debt. Considering the 20% poorest households, about half of them have negative savings. In the top income decile, by contrast, only around 10% of households have a negative savings rate. Assuming that the vast majority of employees receiving the minimum wage are members of households with below-average incomes and very low savings rates or very high consumption rates, this produces a ma-jor additional consumption effect over and above the effect calculated by the model using average values.
To avoid this underestimation by the model in case of minimum wage simulations, an additional impulse of 0.1% of consumption was assumed. As will be demonstrated in the simulations, this increas-es real private consumption across the economy in the long term by 0.2%. Assuming a long-term 1.3% increase in the real wage bill, a 0.8% increase in real transfers and a 0.2% decline in real profits (all in relation to the status quo scenario), imply that real private consumption increases additionally just un-der 0.7% and the savings rate of private households declines by 0.09 percentage points. Without this as-sumption, the savings rate would have increased by 0.02 percentage points (see Table 4, Infobox 1).
Development of productivity and the minimum wage
Some surveys indicate that, alongside price adjust-ments and reductions in working time, attempts to increase productivity might have been important for quite a few companies after the introduction of the minimum wage (Herr et al. 2018). This was certainly possible to a limited extent. However, the limits of
such a strategy become evident in view both of the observed virtually more or less complete substituti-on (in volume of work terms) of part- and full-time employment for “mini-jobs” and the passing of ad-ditional cost by the minimum wage on prices. This was also taking place when the economic situation was favourable and jobs were being created, which suggests that the short-run hourly productivity im-provements induced by the minimum wage are like-ly to have been only small. In the medium- and long-run, efforts to achieve higher productivity effects (on an hourly basis) may be more successful but will probably remain limited unless there is additional investment. To take this into account, additional in-duced productivity effects need to be assumed in minimum wage simulations. This should compen-sate for the additional effects from a reduction in working time and work intensification that are not already included in the productivity estimate of the model. Here, they are assumed to be around 0.1% of total employment across the economy.
This productivity impulse is set so that the employ-ment effect triggered by the minimum wage can be assessed as accurately as possible. It remains un-certain whether this effect will in fact occur, though even if it does, it will be difficult to gauge accurate-ly, even in a few years’ time, because productivity effects are subject to strong economic fluctuations and the genuine minimum wage effects will be more and more mixed with other important determinants. What is uncontested is that the clear structural shift away from “mini-jobs” to employment subject to so-cial security contributions is likely to have given rise to a clear increase in per capita labour productivity.
SIMULATIONS USING THE IMK MACRO-ECONOMETRIC MODEL
The minimum wage scenario (scenario 1)
First, the exogenous impulses described and dis-cussed here are fed into the macro-econometric model and a minimum wage scenario is simulated. The results are then compared with the ‘status quo scenario’ (that is, assuming no minimum wage i.e. no impulse had been introduced). One advantage of this approach is that the comparison is not distorted by inaccuracies in adapting the model to reality. It compares only the results of two simulated condi-tions that can be traced back to clearly defined and diverse exogenous assumptions. The differences be-tween the two scenarios can, therefore, be clearly attributed to the minimum wage. Below, we consid-er only relative divergences between the minimum wage scenario and the baseline scenario. Results for the second, fifth and tenth year of the simulation are

IMK Report No. 141e, September 2018 Page 10
presented in Table 3 and Table 6 for a range of varia-bles and in each case for comparison of the level of the variables. The dynamic change in a number of selected variables is presented in Figure 2. Table 4 Infobox 1 considers the influence of each of the exog-enous assumptions on the total effect as part of a sensitivity analysis.
In the minimum wage scenario (scenario 1), it is clear that the initial rise in wages and salaries trig-gered by introducing the minimum wage – rein-forced by the spill-over effects on adjacent areas of the wage distribution – is around 1% of wages and salaries across the economy after two years (Table 3). This effect almost doubles after 10 years (Figure 2), to a nominal level of around four times the original impulse created by introducing the minimum wage. Price effects triggered by the introduction of the minimum wage increase wages via collective bar-gaining in all sectors of the economy. By assump-tions, minimum wages increase in the model at the same rate as actual wages across the economy over the 10-year period covered by the simulation. Com-pared with the status quo, the consumer prices in-dex grows initially by 0.2%, rising to 0.5% after 10 years 12, an order of magnitude that is in line with international studies (Lemos 2008).
Under the model simulation, there is a small posi-tive impact on real GDP from the introduction of the minimum wage (around 0.25% above its status quo level). For 2016, for example, this corresponds to an increase of around 7 billion €. This development is driven primarily by comparatively higher real private consumption of around 0.5% above the status quo, rising to as much as 0.7% above the status quo. State consumption, too, rises. In line with the esti-mated policy responses within the model, it adapts to economic developments. Real imports increase slightly, particularly in response to higher private consumption, and export growth is slightly damp-ened due to the stronger development of unit labour costs. As low-income households with a high pro-pensity to consume benefit to a greater extent from the introduction of a minimum wage, the savings rate of private households decreases slightly.
At first glance, induced employment development is disappointing as the overall employment level in heads fall by around 0.25% compared with the sta-tus quo. However, it is important to recall the sub-stantial drop in the number of “mini-jobs” in favour of part-time and, in some cases, full-time employ-ment subject to social security contributions. Total hours worked is unlikely to have declined. Ultimate-ly, this corrects somehow a development from pre-
12 This includes employers’ social security contributions, which also rose following the introduction of the minimum wage, triggering further pressure on prices. It is also im-portant to note that the introduction of the minimum wage not only made private consumption more expensive but also affected other components of the GDP, such as the export of services as part of the tourist traffic sector.
vious years in which subsidised “mini-jobs” partly replaced employment subject to social security con-tributions. In the pace of the introduction of the min-imum wage the number of “mini-jobs” has fallen markedly, which in mathematical terms is reflected in a decrease in the number of employees. However, employment without this structural shift is actually higher and rising since the introduction of the min-imum wage (Figure 2). The reason lies in a marked increase in employment subject to social security contributions with on average higher weekly work-ing hours that overcompensate the lost “mini-jobs”.
Triggered by the rise in unit labour costs, prices and hence also nominal GDP, rise steadily over the simulation period. Although higher prices in them-selves reduce the purchasing power of employees and transfer income recipients, wages and transfers to private households also rise – and more rapidly than prices. This preserves the purchasing power of all employees and recipients of transfers. The larg-est group of transfer income recipients is pension-ers, whose income benefits particularly from wage increases, albeit with a slight time lag. Major growth in real wages is, however, limited to persons directly affected by the introduction of the minimum wage or indirectly because their hourly wage was slight-
Table 3
Simulations of the introduction of the minimum wage using the IMK model
1 The structural shift illustrates the estimated net effect on employment of shifting from marginal em-ployment to employment involving mandatory social security contributions.
2 Positive values: public deficits decrease or surpluses increase.
Source: IMK calculations using the IMK macro-econometric model.
Scenario 1 Scenario 2Year 2 Year 5 Year 10 Year 2 Year 5 Year 10
Real GDP 0.27 0.25 0.27 0.59 0.69 0.66Real private consumption 0.46 0.48 0.69 0.62 0.86 1.09Real investments 0.06 0.03 0.11 0.27 0.21 0.26Real public consumption 0.12 0.2 0.18 1.33 1.5 1.36Real exports -0.02 -0.15 -0.31 -0.02 -0.13 -0.33Real imports 0.07 0.05 0.14 0.21 0.2 0.33Nominal GDP 0.55 0.78 1.07 0.86 1.25 1.61Nominal wages per capita 1.27 1.79 2.07 1.31 1.94 2.29Nominal wages and salaries 1.06 1.51 1.81 1.23 2.02 2.44Nominal gross profits -0.36 -0.26 0.28 0.64 0.57 1.27Consumer price index 0.21 0.38 0.49 0.19 0.37 0.55Nominal transfers to private households 0.27 0.82 1.34 0.28 0.88 1.41Memorandum item: employees(without structural shift)1 0.05 0.13 0.12 0.16 0.48 0.52
Employees (including structural shift) -0.2 -0.27 -0.26 -0.09 0.08 0.14Productivity per person in employment 0.23 0.15 0.23 0.45 0.3 0.28Unit labour costs 0.79 1.26 1.54 0.63 1.32 1.76Nominal public expenditures 0.22 0.7 1.07 0.72 1.33 1.82Nominal public revenues 0.58 1.08 1.34 0.78 1.52 1.9Memorandum item:Public deficit rate (% points)2 0.17 0.17 0.12 0.03 0.08 0.03Wage share (unadjusted, % points) 0.29 0.38 0.32 0.12 0.31 0.24Savings rate private households (% points) -0.11 -0.1 -0.09 -0.01 -0.09 -0.09Unemployment (1000s) -21 -25 -14 -33 -51 -331 The structural shift illustrates the estimated net effect on employment of shifting from marginal employment to employment involving mandatory social security contributions.
2 Positive values: public deficits decrease or surpluses increase.
Source: IMK calculations using the IMK macro-model
Table 3: Simulations of introduction of the minimum wage using the IMK model
Minimum wage scenario Deficit-neutral minimum wage scenario
Divergence from status quo scenario in %
Absolute divergence from status quo scenario

IMK Report No. 141e, September 2018 Page 11
ly above the €8.50 threshold and therefore benefit from the spill-over effects. As long as there is no conflict with the ECB over fulfilment with the infla-tion target rate of just under 2%, restrictive meas-ures from monetary policy are unlikely.
As real and nominal demand rises across the economy, the initially negative effect on profits of -0.36% become positive over time and equal to +0.28% after 10 years. The initial negative effect on profits indicates that the price pass-through of the higher wage cost is only partially successful. The im-provement in profits over time is achieved although the wage share increased compared to the status quo without minimum wage introduction. Ultimate-ly, wages rise more rapidly than profits. The state,
too, wins from the introduction of the minimum wage: although government expenditures also rise in the long-run by more than 1%, driven particularly by higher pension payments, its revenues increase even more, by 1.34%, its deficit ratio falls.
For a better understanding of the minimum wage scenario, in the following, the empirically justified exogenous impulses are removed one by one from the simulation, with the exception of the basic as-sumption of a wage impulse of 0.43% and the em-pirically founded assumptions relating to the net effect on “mini-jobs” following substitution. The results are presented in Table 4 in Infobox 1. This pro-cedure makes it possible to identify the individual impact of these assumptions on the overall results.
Figure 2
Macroeconomic impact of the introduction of the minimum wageDivergence in % from status quo scenario
Real GDP Employees (without structural shift)1
Nominal wages and salaries per capita Total nominal wages and salaries
Real private consumption Real public consumption
– Minimum wage scenario (scenario 1)– Deficit-neutral minimum wage
1 The structural shift illustrates the estimated net impact on employment of switching from “mini-jobs” to employment subject to social security contributions.
Source: IMK calculations.
76,571 mm = 3-spaltig - 6 Grafiken& 3-spaltig
Real GDP Employees (without structural effect)1
Wages and salaries per hour worked by employee Total wages and salaries
Real private consumption Real public consumption
Source: IMK calculations.
Figure 2) Macroeconomic impact of the introduction of the minimum wageDivergence in % from status quo scenario
in %
Minimum wage scenario (scenario 1) Deficit-neutral minimum wage1 The structural effect illustrates the estimated net impact on employment of switching from marginal employment to employment subject to social security contributions
0.00.40.81.2
1. Ye
ar
2. Ye
ar
3. Ye
ar
4. Ye
ar
5. Ye
ar
6. Ye
ar
7. Ye
ar
8. Ye
ar
9. Ye
ar
10. Y
ear 0.0
0.40.81.2
1. Ye
ar
2. Ye
ar
3. Ye
ar
4. Ye
ar
5. Ye
ar
6. Ye
ar
7. Ye
ar
8. Ye
ar
9. Ye
ar
10. Y
ear
0.0
0.4
0.8
1.2
1.6
2.0
2.4
2.8
1. Ye
ar
2. Ye
ar
3. Ye
ar
4. Ye
ar
5. Ye
ar
6. Ye
ar
7. Ye
ar
8. Ye
ar
9. Ye
ar
10. Y
ear
0.0
0.4
0.8
1.2
1.6
1. Ye
ar
2. Ye
ar
3. Ye
ar
4. Ye
ar
5. Ye
ar
6. Ye
ar
7. Ye
ar
8. Ye
ar
9. Ye
ar
10. Y
ear
0.0
0.4
0.8
1.2
1.6
2.0
2.4
2.8
1. Ye
ar
2. Ye
ar
3. Ye
ar
4. Ye
ar
5. Ye
ar
6. Ye
ar
7. Ye
ar
8. Ye
ar
9. Ye
ar
10. Y
ear
0.0
0.4
0.8
1.2
1.6
1. Ye
ar
2. Ye
ar
3. Ye
ar
4. Ye
ar
5. Ye
ar
6. Ye
ar
7. Ye
ar
8. Ye
ar
9. Ye
ar
10. Y
ear

IMK Report No. 141e, September 2018 Page 12
Using an estimated VAR in VEC form (hereafter VECM: Vector autoregressive cointegrated model) enables us to explore the extent to which the short-term forecasts of the macro-econometric model are actually borne out (Infobox 2 and Herr et al. 2018). The
VECM model forecasts like the macro-econometric model strong positive effects on wage and small positive effects on prices. The effects on employ-ment are overall positive.
Infobox 1
Sensitivity tests for the assumptions made
To ensure that Table 4 is readable, only the long-term effects for year 10 are presented. Variables feeding into additional assumptions or being removed are highlighted, both for scenario 1 and for the individu-al alternative scenarios. As expected, the impact of the spill-over effect and of the assumption of a high propensity to consume among households affect-ed by the minimum wage are relatively strong. By contrast, the impact of the assumption of a higher transfer to prices or additional induced productivity is noticeably smaller.
As is evident from Table 4, the spill-over effect mainly affects private consumption, a direct re-sult from the higher wage bill, and hence on GDP. This expansive effect is somehow weakened by the price development. The assumption of a high rate of consumption among beneficiaries of the minimum wage also produces a comparatively strong effect. Without this assumption, growth and employment are significantly weaker. The additional price im-pulse reduces real consumption, but its impact on growth remains limited. The assumption of slight-ly higher productivity growth being induced by the minimum wage also has only a small influence on growth but a clear influence on employment devel-opment. There is also an influence on the develop-ment of prices and wages. However, in their impact on real consumption, these effects weaken each other, producing virtually no impact on growth.
Table 4
Sensitivity analysis of the impact of different assumptions under scenario 1
1 The structural shift illustrates the estimated net effect on employment of a shift from “mini-jobs” to jobs subject to social security contributions.
2 Positive values: public deficits decrease or surpluses increase.
Source: IMK calculations using the IMK macro-econometric model.
Scenario 1 without exogenous
spillover effects
without exogenous
higher private consumption
without exogenous higher price
effect
without exogenous
higher productivity
Year 10 Year 10 Year 10 Year 10 Year 10
Real GDP 0.27 0.17 0.14 0.33 0.27Real private consumption 0.69 0.41 0.48 0.78 0.71Real investments 0.11 0.07 0.05 0.13 0.11Real public consumption 0.18 0.12 0.09 0.22 0.19Nominal GDP 1.07 0.61 0.89 1.05 1.14Nominal wages per capita 2.07 1.28 2,00 2.01 2,10Nominal wages and salaries 1.81 0.95 1,60 1.81 1.95Nominal gross profits 0.28 0.34 -0.01 0.21 0.25Consumer price index 0.49 0,30 0.48 0.38 0.53Nominal transfers to private households 1.34 0.67 1,20 1.21 1.27Memorandum item: employees(without structural shift)1 0.12 0.05 -0.01 0.18 0.23
Employees (including structural shift) -0.26 -0.33 -0.39 -0,20 -0.15Unit labour costs 1.54 0.77 1.46 1.48 1.67Nominal public expenditures 1.07 0.57 0.98 1.07 1.12Nominal public revenues 1.34 0.75 1.13 1.32 1.42Memorandum item:Public deficit rate (% points)2 0.12 0.08 0.06 0.11 0.13Wage share (unadjusted, % points) 0.32 0.13 0.33 0.33 0.35Savings rate private households (% points) -0.09 -0.1 0.02 -0.09 -0.09Unemployment (1000s) -14 -9 -8 -16 -14
Source: IMK calculations using the IMK macro-model
1 The structural shift illustrates the estimated net effect on employment of a shift from mini-jobs to jobs subject to social security contributions.
2 Positive values: public deficits decrease or surpluses increase.
Table 4: Sensitivity analysis of the impact of different assumptions under scenario 1
Minimum wage scenario
Absolute divergence from status quo scenario
Divergence from status quo scenario in %

IMK Report No. 141e, September 2018 Page 13
Infobox 2
Simulations with a VAR model
VAR (vector autoregressive model) models offer two major advantages in terms of providing empirical answers to economic questions. The first is that these models enable data to ‘speak for themselves’, so that the results are by far less influenced from ex ante theoretical conditions. The second is that their multivariate specification enables interdepend-encies between variables to be reflected, which is an important aspect of any macroeconomic analy-sis. The disadvantages of these models have also been researched. The choice of the specification has a great influence on the results and forecasts that underpin the analysis presented below. As with all common forecasting methods, the quality of the forecast also deteriorates as the time horizon ex-tends. Both disadvantages reflect the nature of mac-roeconomic series: they possess stochastic trends – that is, they are non-stationary (White and Granger 2011).
Specifically, in answering the question as to the macroeconomic effects of the minimum wage, the following VAR analysis follows three stages as in Logeay and Schreiber (2006). The first stage is to es-timate a VAR that was actually specified as a VECM (vector autoregressive cointegrated model) for the period before the minimum wage was introduced. Second, this estimated VECM is used to calculate, for the period after the introduction of the minimum wage in Germany up to the current period, a fore-cast for changes in the time series used in the mod-el (out-of-sample forecast). This forecast reflects extrapolation into the future of the trends in the variables as well as the interdependencies between the variables used in the model. The third and final stage compares this forecast with the actual chang-es in the variables used following introduction of the minimum wage. The departures of the out-of-sam-
ple forecast from actual data are then interpreted as possible impact from the minimum wage, as in Table 5 and Figure 3. Overall, the model accurately fore-casts economic trends in the year in which the min-imum wage was introduced, so that the minimum wage did not significantly overlay the impact of oth-er factors influencing the economy. For 2015, with a difference of 0.2% between forecast and actual values, the forecast for real GDP was only slightly higher than actual development. In 2016, the posi-tive economic development is interpreted as having been induced by the minimum wage. However, as a result of a more favourable global economic envi-ronment – something that the VECM cannot record because the estimation period came to an end in late 2014 – the impact from additional positive ef-fects was greater. Hence the focus will be on 2015, a year during which the impact of the minimum wage on growth and exogenous economic impulses were not outweighed and it can, therefore, be assumed that divergences between the actual and the fore-cast values can largely be interpreted as resulting from the minimum wage.
The simulated positive wage effect of the mini-mum wage, of between 0.6% and 0.7%, is robust and statistically significant: the blue line in the sec-ond chart in Figure 3 on the left, which reflects actu-al wage trend, ranges between the 68% and 95% confidence interval, with the divergence between the forecast and actual trends differing significant-ly from zero at the 33% significance level. The con-sumer prices, as expected, are positively affected, although not significantly. The divergences between the various employment values – working hours, number of employees and volume of work – point to an extraordinarily positive employment develop-ment. Reliable statements on the scale of employ-
Table 5
Comparison of out-of-sample forecasts under the VECM1 with actual changes
Note: positive values signify that actual trends outperformed the forecasts.
1 VECM with lag length p=2 and r=2 cointegration relationships.
Sources: Federal Statistical Office, National Accounts (data as of q2-2017); IMK calculations.
Real GDP Consumption deflator
Gross wages Employees (1000s)
Volume of work Unemployment rate(ILO concept)
in percentage points2015 -0.2% 0.2% 0.7% 147 0.2% 0.0
2016 0.5% 0.1% 1.6% 426 0.8% 0.0
Note: positive values signify that actual trends outperformed the forecasts.
Sources: Federal Statistical Office, NA (data as of q2-2017); authors’ own calculations.
AusgangstabelleBIP Konsumdeflator Bruttolohn abhängig
Beschäftigte Arbeitsvolumen ELQ (pp)
2015 -0.001635663 0.002066166 0.006700112 146.8912637 0.001560177 -0.012770142
2016 0.005445998 0.000966205 0.016088117 426.3318174 0.007856386 -0.004307398
1. HJ. 2017 -0.008268919 -0.004281267 -0.017941657 -742.9116164 -0.020107994 0.040646209
Anmerkung: Positive Werte bedeuten, dass die tatsächliche Entwicklung über den Prognosen liegt.1 VEC-Modell mit Lag-Länge p=2 und r=2 Kointegrationsbeziehungen.
Quellen: Statistisches Bundesamt, Volkswirtschaftliche Gesamtrechnungen (Datenstand: 2. Quartal 2017); Berechnungen des IMK.
Table 5: Comparison of out-of-sample forecasts under the VECM1 with actual changes
1 VECM with lag length p=2 and r=2 cointegration relationships.

IMK Report No. 141e, September 2018 Page 14
Infobox 2
ment effects are not possible, however, because the results are not robust enough or statistically insig-nificant. In the short term, the results of the VECM model offer no basis for identifying negative effects
at macro-level of introducing the minimum wage; rather, they outline positive effects on labour market developments.
Figure 3
Out-of-sample forecasts of the VECM1 and actual developments
Log real GDP Log deflator of private consumption
Log wages and salaries per hour worked by employees (nominal) Log employees (domestic concept)
Log working hours per employee Unemployment rate (ILO concept, in %)
– Forecast (VECM) – Actual change KB-68% KB-95%
1 Forecasts under the VECM with lag length p=2 and r=2 cointegration relationships.
Sources: Federal Statistical Office, National Accounts (data as of q2-2017); IMK calculations.
76,571 mm = 3-spaltig - 6 Grafiken& 3-spaltig
Log real GDP Log deflator of private consumtion
Log wages and salaries per hour worked by employees (nominal) Log employees (domestic concept)
Log working hours per employee Unemployment rate (ILO concept, in %)
1 Forecasts under the VEC model with lag length p=2 and r=2 cointegration relationships.Sources: Federal Statistical Office, National Accounts (as at Q2 2017); IMK calculations.Quartal 2017).
Out-of-Sample Prognosen des VEC-Modells1 und tatsächliche Entwicklungen
Forecast (VECM) Actual change KB-68% KB-95%
4.62
4.64
4.66
4.68
4.70
4.72
4.74
4.76
4.78
I II III IV I II III IV I II III IV I II III IV I II III IV I II III IV2012 2013 2014 2015 2016 2017
4.62
4.64
4.66
4.68
4.70
4.72
I II III IV I II III IV I II III IV I II III IV I II III IV I II III IV2012 2013 2014 2015 2016 2017
3.10
3.15
3.20
3.25
3.30
I II III IV I II III IV I II III IV I II III IV I II III IV I II III IV2012 2013 2014 2015 2016 2017
10.52
10.54
10.56
10.58
10.60
10.62
I II III IV I II III IV I II III IV I II III IV I II III IV I II III IV2012 2013 2014 2015 2016 2017
9.38
9.40
9.42
9.44
9.46
9.48
9.50
I II III IV I II III IV I II III IV I II III IV I II III IV I II III IV2012 2013 2014 2015 2016 2017
1
2
3
4
5
6
I II III IV I II III IV I II III IV I II III IV I II III IV I II III IV2012 2013 2014 2015 2016 2017

IMK Report No. 141e, September 2018 Page 15
Minimum wage simulation assuming a deficit-neutral fiscal policy (scenario 2)
The minimum wage simulation (scenario 1) demon-strates that the state can slightly improve its net lending/net borrowing as a result of the positive macroeconomic income and price effects and the associated additional tax and social security reve-nues. Its revenues rise more rapidly than its expendi-tures. To reflect a fiscal policy that is approximately deficit-neutral in reaction to the macroeconomic im-pact of the minimum wage, in scenario 2 public ex-penditures are increased so that net lending/net bor-rowing remains more or less balanced. For purposes of simplicity, real public consumption is raised by 1% compared with the status quo. 13 This scenario 2 is more likely to reflect reality in 2015 and 2016 ac-curately than scenario 1, which implicitly assumes a more restrictive fiscal policy. The results are pre-sented in Table 3 as scenario 2.
Comparing the results of scenarios 1 and 2 reveals more than twice the growth impact: GDP grows in 2016 by an additional 15 billion €. This also improves the labour market effects markedly. Employment, in-cluding structural effects, is now above the status quo in the medium to long term; excluding structur-al shifts, it is around 0.5% higher in the long term. In scenario 2, wages rise only slightly more than in scenario 1. Following the increase of nominal GDP, companies across the economy can increase their profits immediately. The negative effects on exports are similar to those under scenario 1 but – thanks to more positive economic development – imports rise more than twice as rapidly as in scenario 1.
In the case of the public budget, it is evident that the – assumed – higher public expenditures also cause a medium- to long-term increase in reve-nues. Part of the additional public expenditures are financed by the multiplier effects themselves. In the simulation, too, there is a slight improvement in the public deficit rate.
Simulation of a macroeconomically oriented wage policy (scenario 3)
Macroeconomic analysis of the introduction of a universal statutory minimum wage in Germany, which goes further than a partial analysis and also considers the long-run, must also take account of the practical significance of the minimum wage for wage bargaining in the country. In an economic environment in which the proportion of employees covered by collective agreement has fallen substan-tially, there is a risk that medium- and long-term wage development no longer meets the needs of a
13 Alternatively, public investment or state transfers could have been selected as spending impetus with compara-tively higher or lower multipliers.
macroeconomically oriented wage policy and will tend to generate deflationary impulses. In this sit-uation, the minimum wage is a necessary supple-ment to the collective wage determination system through centralised wage bargaining agreements and has an important part to play in stabilising the collective wage bargaining system. It limits the downward drift in wage distribution and, if designed properly, ensures that wages in the lower wage dis-tribution ranges reflect an adequate share in grow-ing social prosperity. It thus improves the likelihood of the wage development across the economy as part of a macroeconomically oriented wage policy.
The following analysis is designed to illustrate the complementary general economic effects of a mac-roeconomically oriented wage policy resulting from a collective wage bargaining system complement-ed and stabilised by a universal minimum wage as part of a Keynesian consideration. The starting point for this alternative wage development (scenario 3) is 2001, shortly after the formation of the European Monetary Union (Table 6). The yardstick for alternative wage-setting is the concept of a macroeconomically oriented wage policy under which wage increases across the economy generally exhaust the scope for
Table 6
Macroeconomically oriented wage policy
1 Positive values: public deficits reduce or surpluses increase.
Source: IMK calculations using the IMK macro-econometric model.
Scenario 3Year 2 Year 5 Year 10
Real GDP 0.4 1.4 1.9Real private consumption 0.7 2.6 4.8Real investments 0 0 0.4Real public consumption 0.2 0.8 1.3Real exports -0.1 -0.5 -2.2Real imports 0 0.2 0.7Nominal GDP 0.9 3.6 8.1Nominal wages per capita 2.4 8.5 15Nominal wages and salaries 2.6 9.2 16.8Nominal gross profits -2.4 -5.8 -5.2Consumer price index 0.3 1.2 3.3Nominal transfers to private households 0.8 3.3 9.6Employees 0.2 0.7 1.6Productivity per person in employment 0.3 0.8 0.9Unit labour costs 2.2 7.7 14.7Nominal public expenditures 0.6 2.6 8.3Nominal public revenues 1.2 4.8 10.5Memorandum item: Absolute divergence from status quo scenario
Public deficit rate (% points)1 0.3 0.9 0.9Wage share (unadjusted, % points) 1 3.1 4.2Savings rate private households (% points) 0.2 0.3 0.1Unemployment (1000s) -25 -125 -133
1 Positive values: public deficits reduce or surpluses increase.
Source: IMK calculations using the IMK macro-model.
Table 6: Macroeconomically oriented wage policy
Divergence from status quo scenario in %

IMK Report No. 141e, September 2018 Page 16
distribution resulting from productivity rates and the ECB’s target inflation rate (Horn and Logeay 2004; Herr and Horn 2012).
The simulation assumes a medium-term overall in-crease in productivity across the economy of 0.7% per year and per employee (the actual average increase per year over the past 15 years). With the ECB’s target inflation rate at just under 2%, wage growth across the economy is then likely to be around 2.65% a year.
The induced price increases – 3.3% over 10 years – would offset part of the nominal wage increases. However, real wages would still have risen by almost 12% after 10 years, giving real private consumption an additional 4.8% boost. Economic growth and em-ployment would rise modestly (Table 6 scenario 3). Be-cause of the limited impact of higher wages on pric-es, real wages rise significantly and nominal profits are expected to be lower by 5%; in other words, the wage share is expected to rise.
The model’s results show that after 10 years, unit labour costs would be almost 15% higher than in the status quo. Nevertheless, real exports would con-tinue to rise significantly over the simulation period (Horn et al. 2017).
Actual changes resulting from a macroeconom-ically oriented wage policy are most evident in the domestic economy and, in particular, in the distribu-tion between earned and capital income. With wage increases across the economy of 2.65% a year, the (unadjusted) wage share would not have fallen signif-icantly over the last decade – as it actually did – but would have risen significantly over the period cov-ered by the study.
In terms of employment and economic growth, Germany benefits from the macroeconomic-oriented wage policy. While there is little less growth in ex-ports, the economy arguably follows a considerably much more balanced growth path, with stronger do-mestic growth more than compensating the some-what weaker growth in exports.
The implications of improved wage development for public finances are interesting: when wages go up, so too do income tax, indirect taxation and the revenues from social security contributions. Only part of the additional induced revenues – institutionally specified – is then spent in scenario 3. Thus, wages and salaries of public employees rise and pension ex-penditures follow the wage increases with a time-lag. The public deficit rate – its net lending/net borrowing in relation to nominal GDP – would improve by almost one percentage point after 10 years (Table 6, scenario 3).
Leeway for fiscal policy arises by the fact that the state is the ‘winner’ from higher wage growth: the improved financial situation can be used for targeted fiscal stimuli (as described in scenario 2). And sim-ply using the financial policy leeway, which makes a different wage policy possible, would significantly increase growth and employment as a result of high-er wages and an expansive fiscal policy (Horn et al. 2017).
CONCLUSIONS
Through its empirical analysis of the overall econo-mic impact of the introducing a statutory minimum wage in Germany, the IMK has tried to determine the actual short-term and expected medium- and long-term effects on growth, prices and employment. This is a complex task, given that the available data relates to only the three years since the minimum wage was introduced and that it is not straightfor-ward to separate out economic effects from those induced by the minimum wage.
A detailed descriptive analysis of the sectors par-ticularly affected by the minimum wage was under-taken, showing significantly above-average wage developments in these sectors but also a very good development in profit and capital income without any notable impact on employment. However, the analysis does not answer the question of what would have happened if the minimum wage had not been introduced.
Some of the key inputs for the IMK’s Keynesi-an-type macro-econometric model had to be ob-tained from empirical studies, in particular the ex-tent to which the social partners attempted to offset the minimum wage’s compression effect through a spill-over effect – above-average wage increases in wage bands above the minimum wage of €8,50. Such spill-over effects do not necessarily occur, but there is broad consensus within international re-search into minimum wages that they have an im-pact on the wage development in bands above the minimum wage level. This spill-over effect enhances the positive impact of the minimum wage on wages and salaries. The social partners in Germany did, in-deed, react to: according to our calculations, there was twice the direct effect on the wage bill across the economy.
Specific pre- and post-minimum wage trends in the labour market were also noted: there was a significant structural shift away from “mini-jobs” to-wards additional employment subject to social se-curity contributions, although the volume of work in terms of hours changed little, if at all. Ultimate-ly, this partial correction of an earlier distortion, in which in some sectors conventional jobs had been split and converted into “mini-jobs”, represents a ‘loss’ of “mini-jobs” and, hence, also of employment per capita.
To gauge the impact of the minimum wage empir-ically, a number of simulations were carried out us-ing the IMK model, producing diverse and detailed results. In qualitative terms, the most significant findings are as follows:
– Economic growth tended generally to be stimu-lated by the introduction of the minimum wage, mainly through higher wages for those entitled to the minimum wage and a spill-over effect. Individuals who were unlikely to save and who therefore saw a particularly marked rise in real

IMK Report No. 141e, September 2018 Page 17
private consumption benefited particularly.– While prices did rise, these rises were negligi-
ble in terms of a macroeconomic scale. Higher (min-imum) wages and only minimal price in-creases trigger a process that, over time, also produces small rises in the wages of all em-ployees in the normal wage rounds. As a result, those in employment are not disadvantaged overall. The price effects of introducing a mini-mum wage in 2015 helps significantly to counter deflationary tendencies, preventing even greater divergence from the ECB’s target inflation rate.
– Alongside those benefiting directly from the min-imum wage, the state also benefits: its rev-enues rise more rapidly than its expenditures. If the state spends this additional revenues in a deficitneutral way, economic growth is stimu-lated to a greater extent and employment rises. The findings of the model show that, if there is an appropriate fiscal policy response, additional revenues are not used to reduce the deficit (what would be a policy of austerity) and employ-ment rises. The actual development in 2015 and 2016 suggests that this actually took place in Germany.
– With regard to wage developments across the economy that meet the important requirements of a macroeconomically oriented wage policy,
the minimum wage is a necessary supplement to the German collective wage bargaining system through centralised wage bargaining agreement. Without the minimum wage, individuals in com-panies outside collective agreements would work for very low wages and continue to be cut off from the benefits of growing social prosperity. The minimum wage gives them a stake in eco-nomic growth.An atheoretical VECM also assesses the extent
to which the quantitative results are driven by the specifications of the theoretical perspective. The VECM analysis, which covers only the short-term, identifies a significant positive impact on wages for 2015 and the expected positive (but not significant) price impact across the economy, with a markedly positive (but not significant) effect on employment. These findings support the short-term impact found using the macro-econometric model.
Taken as a whole, the findings presented here demonstrate that the macroeconomic impact of in-troducing a minimum wage in Germany has been positive and has helped to put the country on a more stable growth path based not only on success-ful exports but also on reliable growth in domestic demand as a result of a better wage development.

IMK Report No. 141e, September 2018 Page 18
All publications of IMK are available online at:
http://www.boeckler.de/imk_2733.htm
Arpaia, A. / Cardoso, P. / Kiss, A. / Van Herck, K. / Vandeplas, A. (2017): Statutory Min-imum Wages in the EU: Institutional Settings and Macroeconomic Implica-tions. IZA Policy Paper no. 124.
Bellmann, L. / Bossler, M. / Dütsch, M. / Gerner, H. D. / Ohlert, C. (2016): Folgen des Mindestlohns in Deutschland: Betriebe regieren nur selten mit Ent-lassungen. IAB-Kurzbericht no. 18.
Brenke, K. / Pfannkuche, J. (2018): Konsum und Sparquote der privaten Haushalte hängen stark vom Erwerbsstatus, Ein-kommen und Alter ab, DIW Wochen-bericht no. 10, pp. 181-191.
Bossler, M. / Gerner, H. D. (2016): Employ-ment Effects of the New German Minimum Wage. Evidence from Establishment-Level Micro Data. IAB Discussion Paper no. 10.
Ederer, S. / Baumgartner, J. / Fink, M. / Ka-niovski, S. / Mayrhuber, Ch. / Rocha-Akis, S. (2017): Effekte der Einführung eines flächendeckenden Mindestlohnes in Österreich. Österreichisches Institut für Wirtschaftsforschung Wien on behalf of AK Wien.
European Commission (2016): Labour Market and Wage Developments in Europe. Annual Review 2016. Publication of the European Union, Luxembourg.
Federal Statistical Office (Statistisches Bun-desamt) (2013): Preise – Verbraucherpre-isindex für Deutschland. Wägungss-chema für das Jahr 2010, Wiesbaden (Erschienen am 20.02.2013). https://www.destatis.de/DE/ZahlenFakten/GesamtwirtschaftUmwelt/Preise/Ver-braucherpreisindizes/WarenkorbWae-gungsschema/Waegungsschema.pdf (last accessed on 24.10.2017).
Federal Statistical Office (Statistisches Bun-desamt) (2016): 4 Millionen Jobs vom Mindestlohn betroffen. Press release, 06.04.2016.
Frentzen, K. / Günther, R. (2017): VE [Earn-ings Survey, ES] 2015 - Abschlussber-icht einer Erhebung über die Wirkung des gesetzlichen Mindestlohns auf die Verdienste und Arbeitszeiten der abhängig Beschäftigten. Statistisches Bundesamt, Wiesbaden. https://www.destatis.de/DE/Publikationen/Thematisch/VerdiensteArbeitskosten/Mindestloehne/Verdiensterhebung-Mindestlohn5611112159004.pdf (last accessed on 18.09.2017).
Garloff, A. (2017): Der Mindestlohn ist kein Jobkiller. In: IAB-Forum, 30.06.2017, https://www.iab-forum.de/der-mindestlohn-ist-kein-jobkiller.
German Council of Economic Experts (2016): Jahresgutachten 2016/17. „Zeit für Re-formen” https://www.sachverstaen-digenrat-wirtschaft.de/jahresgutacht-en-2016-2017.html (English transla-tion available: Time for Reforms.)
Herr, H. / Herzog-Stein, A. / Kromphardt, J. / Logeay, C. / Nüß, P. / Pusch, T. / Schulten, T. / Watt, A. / Zwiener, R. (2018): Makroökon-omische Folgen des gesetzlichen Mindestlohns aus keynesianisch geprägter Perspektive, Studie im Auf-trag der Mindestlohnkommission.
Herr, H. / Horn, G. A. (2012): Lohnpolitik heute. IMK Policy Brief.
Herzog-Stein, A. / Hohlfeld, P. / Rietzler, K. / Stephan, S. / Theobald, T. / Tober, S. / Watzka, S. (2018): Politische Risiken gefährden globalen Aufschwung – Prognose der wirtschaftlichen Entwicklung 2018/2019. IMK Report no. 136.
Horn, G. A. / Lindner, F. / Stephan, S. / Zwie-ner, R. (2017): Zur Rolle der Nominallöh-ne für die Handels- und Leistungsbi-lanzüberschüsse – eine ökonomet-rische Analyse für Deutschland. IMK Report no. 125.
Horn, G. A. / Logeay, C. (2004): Kritik am lohnpolitischen Konzept des SVR. In: Wirtschaftsdienst, vol. 84, issue 4, pp. 236-242.
Klär, E. / Slacalek, J. (2006): Entwicklung der Sparquote in Deutschland: Hin-dernis für die Erholung der Konsum-nachfrage. In: DIW Wochenbericht, vol. 73, issue 40, pp. 537-543.
Lemos, S. (2008): A Survey of the Effects of the Minimum Wage on Prices. In: Journal of Economic Surveys, vol. 22, issue 1, pp. 187-212.
Logeay, C. / Schreiber, p. (2006): Testing the Effectiveness of the French Work-Sharing Reform: a Forecasting Approach. In: Applied Economics, vol. 38, issue. 17, pp. 2053-2068.
Mindestlohnkommission (2016): Erster Bericht zu den Auswirkungen des gesetzlichen Mindestlohns. Bericht der Mindestlohnkommission an die Bundesregierung nach § 9 Abs. 4 Mindestlohngesetz, Berlin.
Müller, K. U. / Steiner, V. (2013): Distribu-tional Effects of a Minimum Wage in a Welfare State: The case of Germany. SOEP Papers no. 617.
OECD (2015): OECD Employment Out-look 2015. OECD Publishing, Paris.
Stein, U. (2009): Zur Entwicklung der Sparquoten der privaten Haushalte - Auswertung von Haushaltsdaten des SOEP. IMK Working Paper no. 10.
Sturn, S. (2018): Do Minimum Wages Lead to Job Losses? Evidence from OECD Countries on Low-Skilled and Youth Employment. In: Industrial and Labor Relations Review, vol. 71, issue 3, p. 647-675.
vom Berge, P. / Weber, E. (2017): Beschäf-tigungsanpassung nach Mindest-lohneinführung: “Mini-jobs” wurden teilweise umgewandelt, aber auch zulasten anderer Stellen. IAB-Kurzbericht no. 11.
Wanger, S. / Weber, E. (2016): Effekte des gesetzlichen Mindestlohns auf die Arbeitszeit von Minijobbern. IAB Akt-uelle Berichte no. 23.
White, H. / Granger, C. W. (2011): Consid-eration of Trends in Time Series. In: Journal of Time Series Econometrics, vol. 3, issue 1, pp. 1-40.
REFERENCES

Published byMacroeconomic Policy Institute (IMK) of the Hans Böckler Foundation
Hans-Böckler-Straße 39, 40476 Düsseldorf Tel. (+49) 2 11 77 78-31 2
[email protected] http://www.imk-boeckler.deManaging editor: Rudolf ZwienerPress officer: Rainer Jung, (+49) 2 11 77 78-15 0
ISSN 1861-3683 This work may only be reproduced or otherwise disseminated in whole or in part if the appropriate citation is given.
AuthorsAlexander Herzog-Stein, PhD, [email protected] Prof. Dr. Camille Logeay Patrick Nüß Ulrike Stein, PhD, [email protected] Dr. Rudolf Zwiener, [email protected]
Completed on 29 March 2018
IMPRINT